Attached files
| file | filename |
|---|---|
| EXCEL - IDEA: XBRL DOCUMENT - NORDSON CORP | Financial_Report.xls |
| EX-10.E.3 - EX-10-E-3 - NORDSON CORP | d787677dex10e3.htm |
| EX-10.H.1 - EX-10-H-1 - NORDSON CORP | d787677dex10h1.htm |
| EX-23 - EX-23 - NORDSON CORP | d787677dex23.htm |
| EX-10.B.2 - EX-10-B-2 - NORDSON CORP | d787677dex10b2.htm |
| EX-31.1 - EX-31.1 - NORDSON CORP | d787677dex311.htm |
| EX-21 - EX-21 - NORDSON CORP | d787677dex21.htm |
| EX-10.D.3 - EX-10-D-3 - NORDSON CORP | d787677dex10d3.htm |
| EX-99.A - EX-99-A - NORDSON CORP | d787677dex99a.htm |
| EX-32.1 - EX-32.1 - NORDSON CORP | d787677dex321.htm |
| EX-10.G.3 - EX-10-G-3 - NORDSON CORP | d787677dex10g3.htm |
| EX-32.2 - EX-32.2 - NORDSON CORP | d787677dex322.htm |
| EX-31.2 - EX-31.2 - NORDSON CORP | d787677dex312.htm |
| EX-10.G.4 - EX-10-G-4 - NORDSON CORP | d787677dex10g4.htm |
Table of Contents
UNITED STATES SECURITIES AND EXCHANGE COMMISSION
Washington, D.C. 20549
FORM 10-K
ANNUAL REPORT PURSUANT TO SECTIONS 13 OR 15(d) OF
THE SECURITIES EXCHANGE ACT OF 1934
(Mark One)
| x | ANNUAL REPORT PURSUANT TO SECTION 13 OR 15(d) OF THE SECURITIES EXCHANGE ACT OF 1934 |
For the fiscal year ended October 31, 2014
OR
| ¨ | TRANSITION REPORT PURSUANT TO SECTION 13 OR 15(d) OF THE SECURITIES EXCHANGE ACT OF 1934 |
For the transition period from to
Commission file number 0-7977
NORDSON CORPORATION
(Exact name of Registrant as specified in its charter)
| Ohio | 34-0590250 | |
| (State of incorporation) | (I.R.S. Employer Identification No.) | |
| 28601 Clemens Road Westlake, Ohio |
44145 | |
| (Address of principal executive offices) | (Zip Code) | |
| (440) 892-1580 | ||
| (Registrant’s Telephone Number, including area code) | ||
Securities registered pursuant to Section 12(b) of the Act:
Common Shares, without par value
Securities registered pursuant to Section 12(g) of the Act:
None
Indicate by check mark if the registrant is a well-known seasoned issuer, as defined in Rule 405 of the Securities Act. Yes x No ¨
Indicate by check mark if the registrant is not required to file reports pursuant to Section 13 or Section 15(d) of the Act. Yes ¨ No x
Indicate by check mark whether the Registrant (1) has filed all reports required to be filed by Section 13 or 15 (d) of the Securities Exchange Act of 1934 during the preceding 12 months, and (2) has been subject to such filing requirements for the past 90 days. Yes x No ¨
Indicate by check mark whether the registrant has submitted electronically and posted on its corporate Web site, if any, every Interactive Data File required to be submitted and posted pursuant to Rule 405 of Regulation S-T (§232.405 of this chapter) during the preceding 12 months (or for such shorter period that the Registrant was required to submit and post such files). Yes x No ¨
Indicate by check mark if disclosure of delinquent filers pursuant to Item 405 of Regulation S-K is not contained herein, and will not be contained, to the best of registrant’s knowledge, in definitive proxy or information statements incorporated by reference in Part III of this Form 10-K or any amendment to this Form 10-K. x
Indicate by check mark whether the Registrant is a large accelerated filer, an accelerated filer, a non-accelerated filer or a smaller reporting company. See definition of “large accelerated filer,” “accelerated filer” and “smaller reporting company” in Rule 12b-2 of the Exchange Act. (Check one):
| Large accelerated filer x | Accelerated filer ¨ | Non-accelerated filer ¨ | Smaller reporting company ¨ | |||||
| (Do not check if smaller reporting company) | ||||||||
Indicate by check mark whether the Registrant is a shell company (as defined in Rule 12b-2 of the Exchange Act). Yes ¨ No x
The aggregate market value of Common Shares, no par value per share, held by nonaffiliates (based on the closing sale price on the Nasdaq Stock Market) as of April 30, 2014 was approximately $4,713,344,000.
There were 62,211,946 Common Shares outstanding as of November 28, 2014.
Documents incorporated by reference:
Portions of the Proxy Statement for the 2015 Annual Meeting — Part III
Table of Contents
Table of Contents
Table of Contents
| Item 9. | Changes in and Disagreements with Accountants on Accounting and Financial Disclosure | 75 | ||||||
| Item 9A. | Controls and Procedures | 75 | ||||||
| Item 9B. | Other Information | 75 | ||||||
| 75 | ||||||||
| Item 10. | Directors, Executive Officers and Corporate Governance | 75 | ||||||
| Item 11. | Executive Compensation | 76 | ||||||
| Item 12. | Security Ownership of Certain Beneficial Owners and Management and Related Stockholder Matters | 76 | ||||||
| Equity Compensation Table | 76 | |||||||
| Item 13. | Certain Relationships and Related Transactions, and Director Independence | 76 | ||||||
| Item 14. | Principal Accountant Fees and Services | 76 | ||||||
| 77 | ||||||||
| Item 15. | Exhibits and Financial Statement Schedule | 77 | ||||||
| (a) 1. Financial Statements | 77 | |||||||
| (a) 2. Financial Statement Schedule | 77 | |||||||
| (a) 3. Exhibits | 77 | |||||||
| Signatures | 78 | |||||||
| Schedule II — Valuation and Qualifying Accounts and Reserves | 80 | |||||||
| Index to Exhibits | 81 | |||||||
| Subsidiaries of the Registrant | 85 | |||||||
| Consent of Independent Registered Public Accounting Firm | 88 | |||||||
| Certifications | 89 | |||||||
Table of Contents
NOTE REGARDING AMOUNTS AND FISCAL YEAR REFERENCES
In this annual report, all amounts related to United States dollars and foreign currency and to the number of Nordson Corporation’s common shares, except for per share earnings and dividend amounts, are expressed in thousands. Unless the context otherwise indicates, all references to “we” or the “Company” mean Nordson Corporation.
Unless otherwise noted, all references to years relate to our fiscal year ending October 31.
| Item 1. | Business |
General Description of Business
Nordson engineers, manufactures and markets differentiated products and systems used to dispense, apply and control adhesives, coatings, polymers, sealants, biomaterials, and other fluids, to test and inspect for quality, and to treat and cure surfaces. These products are supported with extensive application expertise and direct global sales and service. We serve a wide variety of consumer non-durable, consumer durable and technology end markets including packaging, nonwovens, electronics, medical, appliances, energy, transportation, building and construction, and general product assembly and finishing.
Our strategy for long-term growth is based on solving customers’ needs globally. We are headquartered in Westlake, Ohio, and our products are marketed through a network of direct operations in more than 30 countries. Consistent with this global strategy, approximately 70 percent of our revenues were generated outside the United States in 2014.
We have 5,966 employees worldwide. Principal manufacturing facilities are located in the United States, Belgium, the People’s Republic of China, Germany, India, the Netherlands, Thailand and the United Kingdom.
We strive to be a vital, self-renewing, worldwide organization that, within the framework of ethical behavior and enlightened citizenship, grows and produces wealth for our customers, employees, shareholders and communities.
We operate for the purpose of creating balanced, long-term benefits for all of our constituencies.
Although every quarter may not produce increased sales, net income and earnings per share, or exceed the comparative prior year’s quarter, we do expect to produce long-term gains. When short-term swings occur, we do not intend to alter our basic objectives in efforts to mitigate the impact of these natural occurrences.
We drive organic growth by continually introducing new products and technology, providing high levels of customer service and support, capturing rapidly expanding opportunities in emerging geographies, and by leveraging existing technology into new applications. Additional growth comes through the acquisition of companies that serve international growth markets, share our business model characteristics and can leverage our global infrastructure.
We create benefits for our customers through a Package of Values®, which includes carefully engineered, durable products; strong service support; the backing of a well-established, worldwide company with financial and technical strengths; and a corporate commitment to deliver what was promised.
We strive to provide genuine customer satisfaction; it is the foundation upon which we continue to build our business.
Complementing our business strategy is the objective to provide opportunities for employee self-fulfillment, growth, security, recognition and equitable compensation. This goal is met through the Human Resources department’s facilitation of employee training and leadership training and the creation of on-the-job growth opportunities. The result is a highly qualified and professional global team capable of meeting corporate objectives.
We recognize the value of employee participation in the planning process. Strategic and operating plans are developed by all business units, resulting in a sense of ownership and commitment on the part of employees in accomplishing our objectives. In addition, employees participate in Lean and Six Sigma initiatives to continuously improve our processes.
1
Table of Contents
We are an equal opportunity employer.
We are committed to contributing approximately five percent of domestic pretax earnings to human welfare services, education and other charitable activities, particularly in communities where we have significant operations.
Financial Information About Operating Segments, Foreign and Domestic Operations and Export Sales
In accordance with generally accepted accounting standards, we have reported information about our three operating segments, including information about our foreign and domestic operations. This information is contained in Note 15 of Notes to Consolidated Financial Statements, which can be found in Part II, Item 8 of this Annual Report.
We engineer, manufacture and market differentiated products and systems used to dispense, apply and control adhesives, coatings, polymers, sealants, biomaterials, and other fluids, to test and inspect for quality, and to treat and cure surfaces. Our technology-based systems can be found in manufacturing facilities around the world producing a wide range of goods for consumer durable, consumer non-durable and technology end markets. Equipment ranges from single-use components to manual, stand-alone units for low-volume operations to microprocessor-based automated systems for high-speed, high-volume production lines.
We market our products globally, primarily through a direct sales force, and also through qualified distributors and sales representatives. We have built a worldwide reputation for creativity and expertise in the design and engineering of high-technology application equipment that meets the specific needs of our customers. We create value for our customers by developing solutions that increase uptime, enable faster line speeds and reduce consumption of materials.
The following is a summary of the products and markets served by our operating segments:
| 1. | Adhesive Dispensing Systems |
This segment delivers our proprietary precision dispensing and processing technology to diverse markets for applications that commonly reduce material consumption, increase line efficiency and enhance product strength, durability, brand and appearance.
| • | Nonwovens — Dispensing, coating and laminating systems for applying adhesives, lotions, liquids and fibers to disposable products and continuous roll goods. Key strategic markets include adult incontinence products, baby diapers and child-training pants, feminine hygiene products and surgical drapes, gowns, shoe covers and face masks. |
| • | Packaging — Automated adhesive dispensing systems used in the rigid packaged goods industries. Key strategic markets include food and beverage packaging, pharmaceutical packaging, and other consumer goods packaging. |
| • | Polymer Processing — Components and systems used in the thermoplastic melt stream in plastic extrusion, injection molding, compounding, polymerization and recycling processes. Key strategic markets include flexible packaging, electronics, medical, building and construction, transportation and aerospace, and general consumer goods. |
| • | Product Assembly — Dispensing, coating and laminating systems for the assembly of plastic, metal and wood products, for paper and paperboard converting applications and for the manufacturing of continuous roll goods. Key strategic markets include appliances, automotive components, building and construction materials, electronics, furniture, solar energy, and the manufacturing of bags, sacks, books, envelopes and folding cartons. |
2
Table of Contents
| 2. | Advanced Technology Systems |
This segment integrates our proprietary product technologies found in progressive stages of a customer’s production process, such as surface treatment, precisely controlled automated, semi-automated or manual dispensing of material, and post-dispense bond testing and X-ray inspection to ensure quality. Related single-use plastic molded syringes, cartridges, tips, tubing and fluid connection components are used to dispense or control fluids in production processes or within customers’ end products. This segment primarily serves the specific needs of electronics, medical and related high-tech industries.
| • | Electronic Systems — Automated dispensing systems for high-speed, accurate application of a broad range of attachment, protection and coating fluids, and related gas plasma treatment systems for cleaning and conditioning surfaces prior to dispense. Key strategic markets include mobile phones, tablets, personal computers, wearable technology, liquid crystal displays, micro hard drives, microprocessors, printed circuit boards, micro-electronic mechanical systems (MEMS), and semiconductor packaging. |
| • | Fluid Management — Precision manual and semi-automated dispensers, highly engineered single-use plastic molded syringes, cartridges and tips, and fluid connection components, tubing and catheters. Products are used for applying and controlling the flow of adhesives, sealants, lubricants, and biomaterials in critical industrial production processes and within medical equipment and related surgical procedures. Key strategic markets include consumer goods, electronics, industrial assembly, solar, and medical. |
| • | Test and Inspection — Bond testing and automated optical and x-ray inspection systems used in the semiconductor and printed circuit board industries. Key strategic markets include mobile phones, tablets, personal computers, wearable technology, liquid crystal displays, micro hard drives, microprocessors, printed circuit boards, MEMS, and semiconductor packaging. |
| 3. | Industrial Coating Systems |
This segment provides both standard and highly-customized equipment used primarily for applying coatings, paint, finishes, sealants and other materials, and for curing and drying of dispensed material. This segment primarily serves the consumer durables market.
| • | Cold Materials — Automated and manual dispensing products and systems used to apply multiple component adhesive and sealant materials in the general industrial and transportation manufacturing industries. Key strategic markets include aerospace, alternative energy, appliances, automotive, building and construction, composites, electronics and medical. |
| • | Container Coating — Automated and manual dispensing and curing systems used to coat and cure containers. Key strategic markets include beverage containers and food cans. |
| • | Curing and Drying Systems — Ultraviolet equipment used primarily in curing and drying operations for specialty coatings, semiconductor materials and paints. Key strategic markets include electronics, containers, and durable goods products. |
| • | Liquid Finishing — Automated and manual dispensing systems used to apply liquid paints and coatings to consumer and industrial products. Key strategic markets include automotive components, agriculture, construction, metal shelving and drums. |
| • | Powder Coating — Automated and manual dispensing systems used to apply powder paints and coatings to a variety of metal, plastic and wood products. Key strategic markets include agriculture and construction equipment, appliances, automotive components, home and office furniture, lawn and garden equipment, pipe coating, and wood and metal shelving. |
3
Table of Contents
Manufacturing and Raw Materials
Our production operations include machining, molding and assembly. We manufacture specially designed parts and assemble components into finished equipment. Many components are made in standard modules that can be used in more than one product or in combination with other components for a variety of models. We have principal manufacturing operations and sources of supply in the United States in Ohio, Georgia, California, Colorado, Michigan, Minnesota, New Jersey, North Carolina, Pennsylvania, Rhode Island, Virginia and Wisconsin; as well as in Belgium, the People’s Republic of China, Germany, India, Mexico, the Netherlands, Thailand and the United Kingdom.
Principal materials used to make our products are metals and plastics, typically in sheets, bar stock, castings, forgings, tubing and pellets. We also purchase many electrical and electronic components, fabricated metal parts, high-pressure fluid hoses, packings, seals and other items integral to our products. Suppliers are competitively selected based on cost, quality and service. All significant raw materials that we use are available through multiple sources.
Senior operating executives supervise an extensive quality control program for our equipment, machinery and systems.
Natural gas and other fuels are our primary energy sources. However, standby capacity for alternative sources is available if needed.
We maintain procedures to protect our intellectual property (including patents, trademarks and copyrights) both domestically and internationally. Risk factors associated with our intellectual property are discussed in Item 1A. Risk Factors.
Our intellectual property portfolios include valuable patents, trade secrets, know-how, domain names, trademarks and trade names. As of October 31, 2014, we held 534 United States patents and 1,181 foreign patents and had 241 United States patent applications pending and 990 foreign patent applications pending, but there is no assurance that any patent application will be issued. We continue to apply for and obtain patent protection for new products on an ongoing basis.
Patents covering individual products extend for varying periods according to the date of filing or grant and legal term of patents in various countries where a patent is obtained. Our current patent portfolio has expiration dates ranging from November 2014 to July 2039. The actual protection a patent provides, which can vary from country to country, depends upon the type of patent, the scope of its coverage, and the availability of legal remedies in each country. We believe, however, that the duration of our patents generally exceeds the life cycles of the technologies disclosed and claimed in the patents.
We believe our trademarks are important assets and we aggressively manage our brands. We also own a number of trademarks in the United States and foreign countries, including registered trademarks for Nordson, Asymtek, Dage, EFD, Micromedics, Value Plastics, and Xaloy and various common law trademarks which are important to our business, inasmuch as they identify Nordson and our products to our customers. As of October 31, 2014, we had a total of 1,633 trademark registrations in the United States and in various foreign countries.
We rely upon a combination of nondisclosure and other contractual arrangements and trade secret laws to protect our proprietary rights and also enter into confidentiality and intellectual property agreements with our employees that require them to disclose any inventions created during employment, convey all rights to inventions to us, and restrict the distribution of proprietary information.
We protect and promote our intellectual property portfolio and take those actions we deem appropriate to enforce our intellectual property rights and to defend our right to sell our products. Although in aggregate our intellectual property is important to our operations, we do not believe that the loss of any one patent, trademark, or group of related patents or trademarks would have a material adverse effect on our results of operations or financial position of our overall business.
4
Table of Contents
Seasonal Variation in Business
Generally, the highest volume of sales occurs in our fourth quarter due in large part to the timing of customers’ capital spending programs. Accordingly, first quarter sales volume is typically the lowest of the year due to timing of customers’ capital spending programs and customer holiday shutdowns.
No special or unusual practices affect our working capital. We generally require advance payments as deposits on customized equipment and systems and, in certain cases, require progress payments during the manufacturing of these products. We continue to initiate new processes focused on reduction of manufacturing lead times, resulting in lower investment in inventory while maintaining the capability to respond promptly to customer needs.
We serve a broad customer base, both in terms of industries and geographic regions. In 2014, no single customer accounted for ten percent or more of sales.
Our backlog of open orders increased to approximately $223,000 at October 31, 2014 from approximately $211,000 at October 31, 2013. The amounts for both years were calculated based upon exchange rates in effect at October 31, 2014. The increase is primarily due to orders within the Advanced Technology segment, as well as from 2014 acquisitions. All orders in the 2014 year-end backlog are expected to be shipped to customers in 2015.
Our business neither includes nor depends upon a significant amount of governmental contracts or subcontracts. Therefore, no material part of our business is subject to renegotiation or termination at the option of the government.
Our equipment is sold in competition with a wide variety of alternative bonding, sealing, finishing, coating, processing, testing, inspecting, and fluid control techniques. Potential uses for our equipment include any production processes that require preparation, modification or curing of surfaces; dispensing, application, processing or control of fluids and materials; or testing and inspecting for quality.
Many factors influence our competitive position, including pricing, product quality and service. We maintain a leadership position in our business segments by delivering high-quality, innovative products and technologies, as well as service and technical support. Working with customers to understand their processes and developing the application solutions that help them meet their production requirements also contributes to our leadership position. Our worldwide network of direct sales and technical resources also is a competitive advantage.
Investments in research and development are important to our long-term growth, enabling us to keep pace with changing customer and marketplace needs through the development of new products and new applications for existing products. We place strong emphasis on technology developments and improvements through internal engineering and research teams. Research and development expenses were approximately $47,536 in 2014, compared with approximately $47,973 in 2013 and $36,535 in 2012. As a percentage of sales, research and development expenses were approximately 2.8, 3.1 and 2.6 percent in 2014, 2013 and 2012, respectively.
We are subject to extensive federal, state, local and foreign environmental, safety and health laws and regulations concerning, among other things, emissions to the air, discharges to land and water and the generation, handling, treatment and disposal of hazardous waste and other materials. Under certain of these laws, we can be held strictly liable for hazardous substance contamination of any real property we have ever owned, operated or used as a disposal site or for natural resource damages associated with such contamination. We are also required to maintain various related permits and licenses, many of which require periodic modification and renewal. The operation of manufacturing plants unavoidably entails environmental, safety and health risks, and we could incur material unanticipated costs or liabilities in the future if any of these risks were realized in ways or to an extent that we did not anticipate.
5
Table of Contents
We believe that we operate in compliance, in all material respects, with applicable environmental laws and regulations. Compliance with environmental laws and regulations requires continuing management effort and expenditures. We have incurred, and will continue to incur, costs and capital expenditures to comply with these laws and regulations and to obtain and maintain the necessary permits and licenses. We believe that the cost of complying with environmental laws and regulations will not have a material effect on our earnings, liquidity or competitive position but cannot assure that material compliance-related costs and expenses may not arise in the future. For example, future adoption of new or amended environmental laws, regulations or requirements or newly discovered contamination or other circumstances that could require us to incur costs and expenses that may have a material effect, but cannot be presently anticipated.
We believe that policies, practices and procedures have been properly designed to prevent unreasonable risk of material environmental damage arising from our operations. We accrue for estimated environmental liabilities with charges to expense and believe our environmental accrual is adequate to provide for our portion of the costs of all such known environmental liabilities. Compliance with federal, state and local environmental protection laws during 2014 had no material effect on our capital expenditures, earnings or competitive position. Based upon consideration of currently available information, we believe liabilities for environmental matters will not have a material adverse affect on our financial position, operating results or liquidity, but we cannot assure that material environmental liabilities may not arise in the future.
As of October 31, 2014, we had 5,966 full-time and part-time employees, including 146 at our Amherst, Ohio, facility who are represented by a collective bargaining agreement that expires on October 30, 2016 and 64 at our New Castle, Pennsylvania facility who are represented by collective bargaining agreements that expire on August 31, 2017 and September 30, 2017. No work stoppages have been experienced at any of our facilities during any of the periods covered by this report.
Our proxy statement, annual report to the Securities and Exchange Commission (Form 10-K), quarterly reports (Form 10-Q) and current reports (Form 8-K) and amendments to those reports filed or furnished pursuant to Section 13(a) or 15(d) of the Securities Exchange Act of 1934 are available free of charge at http://www.nordson.com/investors as soon as reasonably practical after such material is electronically filed with, or furnished to, the SEC. Copies of these reports may also be obtained free of charge by sending written requests to Corporate Communications, Nordson Corporation, 28601 Clemens Road, Westlake, Ohio 44145.
6
Table of Contents
| Item 1A. | Risk Factors |
In an enterprise as diverse as ours, a wide range of factors could affect future performance. We discuss in this section some of the risk factors that, if they actually occurred, could materially and adversely affect our business, financial condition, value and results of operations. You should consider these risk factors in connection with evaluating the forward-looking statements contained in this Annual Report on Form 10-K because these factors could cause our actual results and financial condition to differ materially from those projected in forward-looking statements.
The significant risk factors affecting our operations include the following:
Changes in United States or international economic conditions could adversely affect the profitability of any of our operations.
In 2014, approximately 30 percent of our revenue was derived from domestic customers, while approximately 70 percent was derived from international customers. Our largest markets include appliance, automotive, construction, container, electronics assembly, food and beverage, furniture, life sciences and medical, metal finishing, nonwovens, packaging, paper and paperboard converting, plastics processing and semiconductor. A slowdown in any of these specific end markets could directly affect our revenue stream and profitability.
A portion of our product sales is attributable to industries and markets, such as the semiconductor, mobile electronics and metal finishing industries, which historically have been cyclical and sensitive to relative changes in supply and demand and general economic conditions. The demand for our products depends, in part, on the general economic conditions of the industries or national economies of our customers. Downward economic cycles in our customers’ industries or countries may reduce sales of some of our products. It is not possible to predict accurately the factors that will affect demand for our products in the future.
Any significant downturn in the health of the general economy, globally, regionally or in the markets in which we sell products, could have an adverse effect on our revenues and financial performance, resulting in impairment of assets.
Our growth strategy includes acquisitions, and we may not be able to execute on our acquisition strategy or integrate acquisitions successfully.
Our recent historical growth has depended, and our future growth is likely to continue to depend, in part on our acquisition strategy and the successful integration of acquired businesses into our existing operations. We intend to continue to seek additional acquisition opportunities both to expand into new markets and to enhance our position in existing markets throughout the world. We cannot assure, however, that we will be able to successfully identify suitable acquisition opportunities, prevail against competing potential acquirers, negotiate appropriate acquisition terms, obtain financing that may be needed to consummate such acquisitions, complete proposed acquisitions, successfully integrate acquired businesses into our existing operations or expand into new markets. In addition, we cannot assure that any acquisition, once successfully integrated, will perform as planned, be accretive to earnings, or prove to be beneficial to our operations and cash flow.
The success of our acquisition strategy is subject to other risks and uncertainties, including:
| • | our ability to realize operating efficiencies, synergies or other benefits expected from an acquisition, and possible delays in realizing the benefits of the acquired company or products; |
| • | diversion of management’s time and attention from other business concerns; |
| • | difficulties in retaining key employees, customers or suppliers of the acquired business; |
| • | difficulties in maintaining uniform standards, controls, procedures and policies throughout acquired companies; |
| • | adverse effects on existing business relationships with suppliers or customers; |
| • | the risks associated with the assumption of contingent or undisclosed liabilities of acquisition targets; and |
| • | the ability to generate future cash flows or the availability of financing. |
7
Table of Contents
In addition, an acquisition could adversely impact our operating performance as a result of the incurrence of acquisition-related debt, pre-acquisition potential tax liabilities, acquisition expenses, the amortization of acquisition-acquired assets, or possible future impairments of goodwill or intangible assets associated with the acquisition.
We may also face liability with respect to acquired businesses for violations of environmental laws occurring prior to the date of our acquisition, and some or all of these liabilities may not be covered by environmental insurance secured to mitigate the risk or by indemnification from the sellers from which we acquired these businesses. We could also incur significant costs, including, but not limited to, remediation costs, natural resources damages, civil or criminal fines and sanctions and third-party claims, as a result of past or future violations of, or liabilities associated with environmental laws.
If we fail to develop new products, or our customers do not accept the new products we develop, our revenue and profitability could be adversely impacted.
Innovation is critical to our success. We believe that we must continue to enhance our existing products and to develop and manufacture new products with improved capabilities in order to continue to be a leading provider of precision technology solutions for the industrial equipment market. We also believe that we must continue to make improvements in our productivity in order to maintain our competitive position. Difficulties or delays in research, development or production of new products or failure to gain market acceptance of new products and technologies may reduce future sales and adversely affect our competitive position. We continue to invest in the development and marketing of new products. There can be no assurance that we will have sufficient resources to make such investments, that we will be able to make the technological advances necessary to maintain competitive advantages or that we can recover major research and development expenses. If we fail to make innovations, launch products with quality problems or the market does not accept our new products, our financial condition, results of operations, cash flows and liquidity could be adversely affected. In addition, as new or enhanced products are introduced, we must successfully manage the transition from older products to minimize disruption in customers’ ordering patterns, avoid excessive levels of older product inventories and ensure that we can deliver sufficient supplies of new products to meet customers’ demands.
Increased IT security threats and more sophisticated and targeted computer crime could pose a risk to our systems, networks, products, solutions and services.
Increased global IT security threats and more sophisticated and targeted computer crime pose a risk to the security of our systems and networks and the confidentiality, availability and integrity of our data. While we attempt to mitigate these risks by employing a number of measures, including employee training, comprehensive monitoring of our networks and systems, and maintenance of backup and protective systems, our systems, networks, products, solutions and services remain potentially vulnerable to advanced persistent threats. Depending on their nature and scope, such threats could potentially lead to the compromising of confidential information, improper use of our systems and networks, manipulation and destruction of data, defective products, production downtimes and operational disruptions, which in turn could adversely affect our reputation, competitiveness and results of operations.
If our intellectual property protection is inadequate, others may be able to use our technologies and tradenames and thereby reduce our ability to compete, which could have a material adverse effect on us, our financial condition and results of operations.
We regard much of the technology underlying our products and the trademarks under which we market our products as proprietary. The steps we take to protect our proprietary technology may be inadequate to prevent misappropriation of our technology, or third parties may independently develop similar technology. We rely on a combination of patents, trademark, copyright and trade secret laws, employee and third-party non-disclosure agreements and other contracts to establish and protect our technology and other intellectual property rights. The agreements may be breached or terminated, and we may not have adequate remedies for any breach, and existing trade secrets, patent and copyright law afford us limited protection. Policing unauthorized use of our intellectual property is difficult. A third party could copy or otherwise obtain and use our products or technology without authorization. Litigation may be necessary for us to defend against claims of infringement or to protect our intellectual property rights and could result in substantial cost to us and diversion of our efforts. Further, we might not prevail in such litigation, which could harm our business.
8
Table of Contents
Our products could infringe on the intellectual property of others, which may cause us to engage in costly litigation and, if we are not successful, could cause us to pay substantial damages and prohibit us from selling our products.
Third parties may assert infringement or other intellectual property claims against us based on their patents or other intellectual property claims, and we may have to pay substantial damages, possibly including treble damages, if it is ultimately determined that our products infringe. We may have to obtain a license to sell our products if it is determined that our products infringe upon another party’s intellectual property. We might be prohibited from selling our products before we obtain a license, which, if available at all, may require us to pay substantial royalties. Even if infringement claims against us are without merit, defending these types of lawsuits takes significant time, may be expensive and may divert management attention from other business concerns.
Any impairment in the value of our intangible assets, including goodwill, would negatively affect our operating results and total capitalization.
Our total assets reflect substantial intangible assets, primarily goodwill. The goodwill results from our acquisitions and represents the excess of cost over the fair value of the identifiable net assets we acquired. We assess at least annually whether there has been any impairment in the value of our intangible assets. If future operating performance at one or more of our business units were to fall significantly below current levels, if competing or alternative technologies emerge, if market conditions for acquired businesses decline, if significant and prolonged negative industry or economic trends exist, if our stock price and market capitalization declines, or if future cash flow estimates decline, we could incur under current applicable accounting rules, a non-cash charge to operating earnings for goodwill impairment. Any determination requiring the write-off of a significant portion of unamortized intangible assets would negatively affect our results of operations and equity book value, the effect of which could be material.
Significant movements in foreign currency exchange rates or change in monetary policy may harm our financial results.
We are exposed to fluctuations in foreign currency exchange rates, particularly with respect to the euro, the yen, the pound sterling and the Chinese yuan. Any significant change in the value of the currencies of the countries in which we do business against the United States dollar could affect our ability to sell products competitively and control our cost structure, which could have a material adverse effect on our business, financial condition and results of operations. For additional detail related to this risk, see Item 7A, Quantitative and Qualitative Disclosure About Market Risk.
The majority of our consolidated revenues in 2014 were generated in currencies other than the United States dollar, which is our reporting currency. We recognize foreign currency transaction gains and losses arising from our operations in the period incurred. As a result, currency fluctuations between the United States dollar and the currencies in which we do business have caused and will continue to cause foreign currency transaction and translation gains and losses, which historically have been material and could continue to be material. We cannot predict the effects of exchange rate fluctuations upon our future operating results because of the number of currencies involved, the variability of currency exposures and the potential volatility of currency exchange rates. We take actions to manage our foreign currency exposure, such as entering into hedging transactions, where available, but we cannot assure that our strategies will adequately protect our consolidated operating results from the effects of exchange rate fluctuations.
We also face risks arising from the imposition of exchange controls and currency devaluations. Exchange controls may limit our ability to convert foreign currencies into United States dollars or to remit dividends and other payments by our foreign subsidiaries or customers located in or conducting business in a country imposing controls. Currency devaluations diminish the United States dollar value of the currency of the country instituting the devaluation and, if they occur or continue for significant periods, could adversely affect our earnings or cash flow.
9
Table of Contents
We may be exposed to liabilities under the Foreign Corrupt Practices Act (FCPA), which could have a material adverse effect on our business.
We are subject to compliance with various laws and regulations, including the FCPA and similar worldwide anti-bribery laws, which generally prohibit companies and their intermediaries from engaging in bribery or making other improper payments to foreign officials for the purpose of obtaining or retaining business or gaining an unfair business advantage. The FCPA also requires proper record keeping and characterization of such payments in our reports filed with the SEC. Our employees are trained and required to comply with these laws, and we are committed to legal compliance and corporate ethics. Violations of these laws could result in severe criminal or civil sanctions and financial penalties and other consequences that may have a material adverse effect on our business, reputation, financial condition or results of operations.
Inability to access capital could impede growth or the repayment or refinancing of existing indebtedness.
The limits imposed on us by the restrictive covenants contained in our credit facilities could prevent us from making acquisitions or cause us to lose access to these facilities.
Our existing credit facilities contain restrictive covenants that limit our ability to, among other things:
| • | borrow money or guarantee the debts of others; |
| • | use assets as security in other transactions; |
| • | make restricted payments or distributions; and |
| • | sell or acquire assets or merge with or into other companies. |
In addition, our credit facilities require us to meet financial ratios, including a “Leverage Ratio” and an “Interest Coverage Ratio”, both as defined in the credit facilities.
These restrictions could limit our ability to plan for or react to market conditions or meet extraordinary capital needs and could otherwise restrict our financing activities.
Our ability to comply with the covenants and other terms of our credit facilities will depend on our future operating performance. If we fail to comply with such covenants and terms, we may be in default and the maturity of the related debt could be accelerated and become immediately due and payable. We may be required to obtain waivers from our lenders in order to maintain compliance under our credit facilities, including waivers with respect to our compliance with certain financial covenants. If we are unable to obtain necessary waivers and the debt under our credit facilities is accelerated, we would be required to obtain replacement financing at prevailing market rates.
We may need new or additional financing in the future to expand our business or refinance existing indebtedness. If we are unable to access capital on satisfactory terms and conditions, we may not be able to expand our business or meet our payment requirements under our existing credit facilities. Our ability to obtain new or additional financing will depend on a variety of factors, many of which are beyond our control. We may not be able to obtain new or additional financing because we have substantial debt or because we may not have sufficient cash flow to service or repay our existing or future debt. In addition, depending on market conditions and our financial performance, neither debt nor equity financing may be available on satisfactory terms or at all. Finally, as a consequence of worsening financial market conditions, our credit facility providers may not provide the agreed credit if they become undercapitalized.
Changes in interest rates could adversely affect us.
Any period of interest rate increases may also adversely affect our profitability. At October 31, 2014, we had $799,800 of total debt and notes payable outstanding, of which 68 percent was priced at interest rates that float with the market. A one percent increase in the interest rate on the floating rate debt in 2014 would have resulted in approximately $4,201 of additional interest expense. A higher level of floating rate debt would increase the exposure to changes in interest rates. For additional detail related to this risk, see Item 7A, Quantitative and Qualitative Disclosure About Market Risk.
10
Table of Contents
Failure to retain our existing senior management team or the inability to attract and retain qualified personnel could hurt our business and inhibit our ability to operate and grow successfully.
Our success will continue to depend to a significant extent on the continued service of our executive management team and the ability to recruit, hire and retain other key management personnel to support our growth and operational initiatives and replace executives who retire or resign. Failure to retain our leadership team and attract and retain other important management and technical personnel could place a constraint on our global growth and operational initiatives, possibly resulting in inefficient and ineffective management and operations, which would likely harm our revenues, operations and product development efforts and eventually result in a decrease in profitability.
The level of returns on pension plan assets and changes in the actuarial assumptions used could adversely affect us.
Our operating results may be positively or negatively impacted by the amount of expense we record for our defined benefit pension plans. U.S. GAAP requires that we calculate pension expense using actuarial valuations, which are dependent upon our various assumptions including estimates of expected long-term rate of return on plan assets, discount rates for future payment obligations, and the expected rate of increase in future compensation levels. Our pension expense and funding requirements may also be affected by our actual return on plan assets and by legislation and other government regulatory actions. Changes in assumptions, laws or regulations could lead to variability in operating results and could have a material adverse impact on liquidity.
New regulations related to conflict-free minerals may result in additional expenses that could affect our financial condition and business operations.
Pursuant to the Dodd-Frank Wall Street Reform and Consumer Protection Act, the SEC promulgated final rules regarding disclosure of the use of certain minerals, known as conflict minerals, which are mined from the Democratic Republic of the Congo and adjoining countries, as well as procedures regarding a manufacturer’s efforts to prevent the sourcing of such minerals and metals produced from those minerals. These new disclosure obligations will require continuing due diligence efforts to support our future disclosure requirements. We incurred and will continue to incur costs associated with complying with such disclosure requirements, including costs associated with canvassing our supply chain to determine the source country of any conflict minerals incorporated in our products, in addition to the cost of remediation and other changes to products, processes, or sources of supply as a consequence of such verification activities. In addition, the implementation of these rules could adversely affect the sourcing, supply, and pricing of materials used in our products.
Political conditions in foreign countries in which we operate could adversely affect us.
We conduct our manufacturing, sales and distribution operations on a worldwide basis and are subject to risks associated with doing business outside the United States. In 2014, approximately 70 percent of our total sales were to customers outside the United States. We expect that international operations and United States export sales will continue to be important to our business for the foreseeable future. Both sales from international operations and export sales are subject in varying degrees to risks inherent in doing business outside the United States. Such risks include, but are not limited to, the following:
| • | risks of economic instability; |
| • | unanticipated or unfavorable circumstances arising from host country laws or regulations; |
| • | threats of war, terrorism or governmental instability; |
| • | significant foreign and U.S. taxes on repatriated cash; |
| • | restrictions on the transfer of funds into or out of a country; |
| • | currency exchange rate fluctuations; |
| • | potential negative consequences from changes to taxation policies; |
| • | the disruption of operations from labor and political disturbances; |
| • | the imposition of tariffs, import or export licensing requirements; and |
| • | exchange controls or other trade restrictions including transfer pricing restrictions when products produced in one country are sold to an affiliated entity in another country. |
11
Table of Contents
Any of these events could reduce the demand for our products, limit the prices at which we can sell our products, or otherwise have an adverse effect on our operating performance.
Our international operations also depend upon favorable trade relations between the U.S. and those foreign countries in which our customers, subcontractors and materials suppliers have operations. A protectionist trade environment in either the U.S. or those foreign countries in which we do business, such as a change in the current tariff structures, export compliance or other trade policies, may materially and adversely affect our ability to sell our products in foreign markets.
Our business and operating results may be adversely affected by natural disasters or other catastrophic events beyond our control.
While we have taken precautions to prevent production and service interruptions at our global facilities, severe weather conditions such as hurricanes or tornadoes, as well major earthquakes and other natural disasters, in areas in which we have manufacturing facilities or from which we obtain products may cause physical damage to our properties, closure of one or more of our manufacturing or distribution facilities, lack of an adequate work force in a market, temporary disruption in the supply of inventory, disruption in the transport of products and utilities, and delays in the delivery of products to our customers. Any of these factors may disrupt our operations and adversely affect our financial condition and results of operations.
The insurance that we maintain may not fully cover all potential exposures.
We maintain property, business interruption and casualty insurance but such insurance may not cover all risks associated with the hazards of our business and is subject to limitations, including deductibles and maximum liabilities covered. We are potentially at risk if one or more of our insurance carriers fail. Additionally, severe disruptions in the domestic and global financial markets could adversely impact the ratings and survival of some insurers. In the future, we may not be able to obtain coverage at current levels, and our premiums may increase significantly on coverage that we maintain.
| Item 1B. | Unresolved Staff Comments |
None.
12
Table of Contents
| Item 2. | Properties |
The following table summarizes our principal properties as of October 31, 2014:
| Location |
Description of Property |
Approximate Square Feet |
||||
| Amherst, Ohio 2, 3 |
A manufacturing, laboratory and office complex | 521,000 | ||||
| Duluth, Georgia 1 |
A manufacturing, laboratory and office building | 176,000 | ||||
| Swainsboro, Georgia1 |
A manufacturing building (leased) | 136,000 | ||||
| East Providence, Rhode Island 2 |
A manufacturing, warehouse and office building | 116,000 | ||||
| Pulaski, Virginia 1 |
A manufacturing, warehouse and office building | 101,000 | ||||
| Carlsbad, California 2 |
Two manufacturing and office buildings (leased) | 88,000 | ||||
| Robbinsville, New Jersey 2 |
A manufacturing, warehouse and office building (leased) | 88,000 | ||||
| Chippewa Falls, Wisconsin 1 |
A manufacturing, warehouse and office building (leased) | 86,000 | ||||
| New Castle, Pennsylvania 1 |
A manufacturing, warehouse and office building | 76,000 | ||||
| Youngstown, Ohio 1 |
A manufacturing, warehouse and office building (leased) | 58,000 | ||||
| Chippewa Falls, Wisconsin 1 |
A manufacturing, warehouse and office building (leased) | 45,000 | ||||
| Ft. Collins, Colorado 2 |
A manufacturing, warehouse and office building (leased) | 42,000 | ||||
| Vista, California 2 |
A manufacturing building (leased) | 41,000 | ||||
| Hickory, North Carolina 1 |
A manufacturing, warehouse and office building (leased) | 41,000 | ||||
| Eagan, Minnesota 2 |
A manufacturing, warehouse and office building (leased) | 35,000 | ||||
| Plymouth, Michigan 3 |
Two manufacturing, warehouse and office buildings (leased) | 35,000 | ||||
| Westlake, Ohio |
Corporate headquarters | 28,000 | ||||
| Chippewa Falls, Wisconsin 1 |
An engineering and laboratory building (leased) | 20,000 | ||||
| Shanghai, China 1, 3 |
A manufacturing, warehouse and office building (leased) | 134,000 | ||||
| Lüneburg, Germany 1 |
A manufacturing and laboratory building | 129,000 | ||||
| Shanghai, China 1, 2, 3 |
An office and laboratory building | 86,000 | ||||
| Bangalore, India 1, 2, 3 |
A manufacturing, warehouse and office building | 56,000 | ||||
| Maastricht, Netherlands 1, 2, 3 |
A manufacturing, warehouse and office building | 54,000 | ||||
| Shanghai, China 1 |
A manufacturing, warehouse and office building (leased) | 53,000 | ||||
| Chonburi, Thailand1 |
A manufacturing, warehouse and office building | 52,000 | ||||
| Münster, Germany1 |
A manufacturing, warehouse and office building (leased) | 51,000 | ||||
| Erkrath, Germany 1, 2, 3 |
An office, laboratory and warehouse building (leased) | 48,000 | ||||
| Deurne, Netherlands 2 |
A manufacturing, warehouse and office building (leased) | 46,000 | ||||
| Temse, Belgium 1 |
A manufacturing, warehouse and office building (leased) | 43,000 | ||||
| Münster, Germany1 |
A manufacturing, warehouse and office building (leased) | 43,000 | ||||
| Suzhou, China 2 |
A manufacturing, warehouse and office building (leased) | 42,000 | ||||
| Tokyo, Japan 1, 2, 3 |
An office, laboratory and warehouse building (leased) | 42,000 | ||||
| Aylesbury, U.K. 1, 2 |
A manufacturing, warehouse and office building (leased) | 36,000 | ||||
| Shanghai, China 1 |
An engineering and laboratory building | 24,000 | ||||
| El Marques, Mexico 1, 2, 3 |
A warehouse and office building (leased) | 22,000 | ||||
| Singapore 1, 2, 3 |
A warehouse and office building (leased) | 16,000 | ||||
| Lagny Sur Marne, France 1, 3 |
An office building (leased) | 6,000 | ||||
| Segrate, Italy 1, 3 |
An office, laboratory and warehouse building (leased) | 5,000 | ||||
Business Segment — Property Identification Legend
1 — Adhesive Dispensing Systems
2 — Advanced Technology Systems
3 — Industrial Coating Systems
13
Table of Contents
The facilities listed have adequate, suitable and sufficient capacity (production and nonproduction) to meet present and foreseeable demand for our products.
Other properties at international subsidiary locations and at branch locations within the United States are leased. Lease terms do not exceed 25 years and generally contain a provision for cancellation with some penalty at an earlier date. Information about leases is reported in Note 10 of Notes to Consolidated Financial Statements that can be found in Part II, Item 8 of this document.
| Item 3. | Legal Proceedings |
We are involved in pending or potential litigation regarding environmental, product liability, patent, contract, employee and other matters arising from the normal course of business. Including the environmental matter discussed below, it is our opinion, after consultation with legal counsel, that resolutions of these matters are not expected to result in a material effect on our financial condition, quarterly or annual operating results or cash flows.
Environmental — We have voluntarily agreed with the City of New Richmond, Wisconsin and other Potentially Responsible Parties to share costs associated with the remediation of the City of New Richmond municipal landfill (the “Site”) and constructing a potable water delivery system serving the impacted area down gradient of the Site. At October 31, 2014 and 2013, our accrual for the ongoing operation, maintenance and monitoring obligation at the Site was $615 and $668, respectively.
The liability for environmental remediation represents management’s best estimate of the probable and reasonably estimable undiscounted costs related to known remediation obligations. The accuracy of our estimate of environmental liability is affected by several uncertainties such as additional requirements that may be identified in connection with remedial activities, the complexity and evolution of environmental laws and regulations, and the identification of presently unknown remediation requirements. Consequently, our liability could be different than our current estimate. However, we do not expect that the costs associated with remediation will have a material adverse effect on our financial condition or results of operations.
| Item 4. | Mine Safety Disclosures |
None.
14
Table of Contents
Executive Officers of the Company
Our executive officers as of October 31, 2014, were as follows:
| Name |
Age | Officer Since | Position or Office with The Company and Business Experience During the Past Five (5) Year Period | |||||||
| Michael F. Hilton |
60 | 2010 | President and Chief Executive Officer, 2010 Senior Vice President and General Manager-Electronics and Performance Materials Segment of Air Products and Chemicals, Inc., 2007 | |||||||
| John J. Keane |
53 | 2003 | Senior Vice President, 2005 | |||||||
| Gregory P. Merk |
43 | 2006 | Senior Vice President, 2013 Vice President, 2006 | |||||||
| Gregory A. Thaxton |
53 | 2007 | Senior Vice President, Chief Financial Officer, 2012 | |||||||
| Vice President, Chief Financial Officer, 2008 | ||||||||||
| Douglas C. Bloomfield |
55 | 2005 | Vice President, 2005 | |||||||
| James E. DeVries |
55 | 2012 | Vice President, 2012 Vice President, Global Continuous Improvement, 2011 Vice President, North America and China, Engineering (Adhesive Dispensing Systems), 2010 | |||||||
| Vice President, Adhesive Dispensing Systems, North America, 2009 | ||||||||||
| Shelly M. Peet |
49 | 2007 | Vice President, 2009 | |||||||
| Robert E. Veillette |
62 | 2007 | Vice President, General Counsel and Secretary, 2007 | |||||||
15
Table of Contents
| Item 5. | Market for the Company’s Common Equity, Related Stockholder Matters and Issuer Purchases of Equity Securities |
Market Information and Dividends
(a) Our common shares are listed on the Nasdaq Global Select Market under the symbol NDSN. As of November 28, 2014, there were 1,577 registered shareholders. The table below is a summary of dividends paid per common share and the range of closing market prices during each quarter of 2014 and 2013.
| Dividend Paid |
Common Share Price |
|||||||||||
| Quarters |
High | Low | ||||||||||
| 2014: |
||||||||||||
| First |
$ | .18 | $ | 75.02 | $ | 69.14 | ||||||
| Second |
.18 | 74.54 | 67.98 | |||||||||
| Third |
.18 | 84.30 | 74.08 | |||||||||
| Fourth |
.22 | 81.50 | 67.75 | |||||||||
| 2013: |
||||||||||||
| First |
$ | .15 | $ | 67.62 | $ | 58.89 | ||||||
| Second |
.15 | 70.60 | 61.33 | |||||||||
| Third |
.15 | 75.00 | 67.26 | |||||||||
| Fourth |
.18 | 74.90 | 66.65 | |||||||||
Source: NASDAQ OMX
While we have historically paid dividends to shareholders of our common stock on a quarterly basis, the declaration and payment of future dividends will depend on many factors, including but not limited to, our earnings, financial condition, business development needs and regulatory considerations, and are at the discretion of our board of directors.
16
Table of Contents
The following is a graph that compares the five-year cumulative return, calculated on a dividend-reinvested basis, from investing $100 on November 1, 2009 in Nordson common shares, the S&P 500 Index, the S&P MidCap 400 Index, the S&P 500 Industrial Machinery Index, the S&P MidCap 400 Industrial Machinery Index and our Proxy Peer Group. Our Proxy Peer Group includes: AIN, AME, ATU, B, CLC, DCI, ENTG, ESL, FLIR, GGG, GTI, GTLS, IEX, LECO, ROP, VECO, WTS, and WWD.
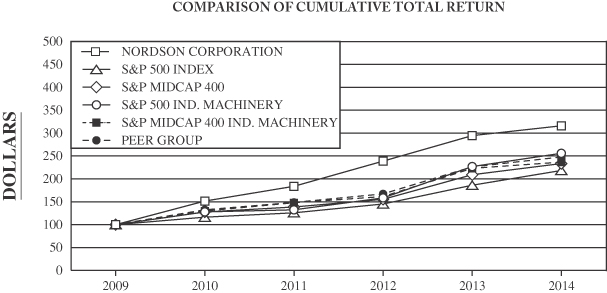
| Company/Market/Peer Group | 2009 | 2010 | 2011 | 2012 | 2013 | 2014 | ||||||||||||||||||
|
Nordson Corporation |
$ | 100.00 | $ | 151.62 | $ | 183.67 | $ | 238.70 | $ | 294.28 | $ | 315.68 | ||||||||||||
|
S&P 500 Index |
$ | 100.00 | $ | 116.52 | $ | 125.94 | $ | 145.09 | $ | 186.11 | $ | 218.25 | ||||||||||||
|
S&P MidCap 400 |
$ | 100.00 | $ | 127.64 | $ | 138.55 | $ | 155.32 | $ | 209.02 | $ | 233.38 | ||||||||||||
|
S&P 500 Ind. Machinery |
$ | 100.00 | $ | 127.95 | $ | 132.38 | $ | 158.43 | $ | 226.75 | $ | 255.70 | ||||||||||||
|
S&P MidCap 400 Ind. Machinery |
$ | 100.00 | $ | 129.98 | $ | 147.82 | $ | 161.44 | $ | 223.07 | $ | 236.39 | ||||||||||||
|
Peer Group |
$ | 100.00 | $ | 132.42 | $ | 148.68 | $ | 167.11 | $ | 226.13 | $ | 247.78 | ||||||||||||
Source: Zack’s Investment Research
17
Table of Contents
| (b) | Use of Proceeds. Not applicable. |
| (c) | Issuer Purchases of Equity Securities |
| Total Number of Shares Repurchased(1) |
Average Price Paid per Share |
Total Number of Shares Repurchased as Part of Publicly Announced Plans or Programs(2) |
Maximum Value of Shares That May Yet Be Purchased Under the Plans or Programs(2) |
|||||||||||||
| August 1, 2014 to August 31, 2014 |
238 | $ | 76.87 | 238 | $ | 86,147 | ||||||||||
| September 1, 2014 to September 30, 2014 |
143 | $ | 78.38 | 142 | $ | 75,008 | ||||||||||
| October 1, 2014 to October 31, 2014 |
595 | $ | 71.49 | 595 | $ | 32,446 | ||||||||||
|
|
|
|
|
|||||||||||||
| Total |
976 | 975 | ||||||||||||||
|
|
|
|
|
|||||||||||||
| (1) | Includes shares purchased as part of a publicly announced program, as well as shares tendered for taxes related to stock option exercises and vesting of restricted shares. |
| (2) | In August 2013, the board of directors approved a repurchase program of up to $200,000. Uses for repurchased shares include the funding of benefit programs, including stock options, restricted stock and 401(k) matching. Shares purchased are treated as treasury shares until used for such purposes. The repurchase program is being funded using cash from operations and proceeds from borrowings under our credit facilities. |
Subsequent to October 31, 2014, the board of directors authorized a new $300,000 share repurchase program, effective December 16, 2014. This new program replaced the $200,000 program approved by the board in August 2013.
18
Table of Contents
| Item 6. | Selected Financial Data |
Five-Year Summary
| 2014 | 2013 | 2012 | 2011 | 2010 | ||||||||||||||||
| (In thousands except for per-share amounts) |
||||||||||||||||||||
| Operating Data(a) |
||||||||||||||||||||
| Sales |
$ | 1,704,021 | $ | 1,542,921 | $ | 1,409,578 | $ | 1,233,159 | $ | 1,041,551 | ||||||||||
| Cost of sales |
758,923 | 676,777 | 586,289 | 484,727 | 419,937 | |||||||||||||||
| % of sales |
45 | 44 | 42 | 39 | 40 | |||||||||||||||
| Selling and administrative expenses |
577,993 | 542,295 | 487,809 | 431,078 | 386,781 | |||||||||||||||
| % of sales |
34 | 35 | 35 | 35 | 37 | |||||||||||||||
| Long-lived asset impairments |
— | — | — | 1,811 | — | |||||||||||||||
| Operating profit |
367,105 | 323,849 | 335,480 | 315,543 | 234,833 | |||||||||||||||
| % of sales |
22 | 21 | 24 | 26 | 23 | |||||||||||||||
| Net income |
246,773 | 221,817 | 224,829 | 222,364 | 168,048 | |||||||||||||||
| % of sales |
14 | 14 | 16 | 18 | 16 | |||||||||||||||
| Financial Data(a) |
||||||||||||||||||||
| Working capital |
$ | 301,815 | $ | 365,269 | $ | 242,939 | $ | 294,796 | $ | 259,117 | ||||||||||
| Net property, plant and equipment and other non-current assets |
1,607,447 | 1,451,113 | 1,242,892 | 827,493 | 535,323 | |||||||||||||||
| Total capital(b) |
1,662,283 | 1,498,082 | 1,261,962 | 853,071 | 567,323 | |||||||||||||||
| Total assets |
2,280,130 | 2,053,179 | 1,829,515 | 1,304,450 | 986,354 | |||||||||||||||
| Long-term liabilities |
1,004,465 | 928,519 | 816,061 | 550,966 | 289,368 | |||||||||||||||
| Shareholders’ equity |
904,797 | 887,863 | 669,770 | 571,323 | 505,072 | |||||||||||||||
| Return on average total capital — %(c) |
17 | 18 | 23 | 35 | 32 | |||||||||||||||
| Return on average shareholders’ equity — %(d) |
27 | 29 | 38 | 39 | 40 | |||||||||||||||
| Per-Share Data (a)(e) |
||||||||||||||||||||
| Average number of common shares |
63,656 | 64,214 | 64,407 | 67,616 | 67,610 | |||||||||||||||
| Average number of common shares and common share equivalents |
64,281 | 64,908 | 65,103 | 68,425 | 68,442 | |||||||||||||||
| Basic earnings per share |
$ | 3.88 | $ | 3.45 | $ | 3.49 | $ | 3.29 | $ | 2.49 | ||||||||||
| Diluted earnings per share |
3.84 | 3.42 | 3.45 | 3.25 | 2.46 | |||||||||||||||
| Dividends per common share |
0.76 | 0.63 | 0.525 | 0.44 | 0.39 | |||||||||||||||
| Book value per common share |
14.49 | 13.83 | 10.42 | 8.71 | 7.44 | |||||||||||||||
| (a) | See accompanying Notes to Consolidated Financial Statements. |
| (b) | Notes payable, plus current portion of long-term debt, plus long-term debt, minus cash and marketable securities, plus shareholders’ equity. |
| (c) | Net income plus after-tax interest expense on borrowings as a percentage of the average of quarterly borrowings (net of cash) plus shareholders’ equity over five accounting periods. |
| (d) | Net income as a percentage of average quarterly shareholders’ equity over five accounting periods. |
| (e) | Amounts adjusted for 2-for-1 stock split effective April 12, 2011. |
19
Table of Contents
| Item 7. | Management’s Discussion and Analysis of Financial Condition and Results of Operations |
NOTE REGARDING AMOUNTS AND FISCAL YEAR REFERENCES
In this annual report, all amounts related to United States dollars and foreign currency and to the number of Nordson Corporation’s common shares, except for per share earnings and dividend amounts, are expressed in thousands. Unless the context otherwise indicates, all references to “we” or the “Company” mean Nordson Corporation.
Unless otherwise noted, all references to years relate to our fiscal year ending October 31.
Critical Accounting Policies and Estimates
Our consolidated financial statements and accompanying notes have been prepared in accordance with accounting principles generally accepted in the United States. The preparation of these financial statements requires management to make estimates, judgments and assumptions that affect reported amounts of assets, liabilities, revenues and expenses. On an ongoing basis, we evaluate the accounting policies and estimates that are used to prepare financial statements. We base our estimates on historical experience and assumptions believed to be reasonable under current facts and circumstances. Actual amounts and results could differ from these estimates used by management.
Certain accounting policies that require significant management estimates and are deemed critical to our results of operations or financial position are discussed below. On a regular basis, critical accounting policies are reviewed with the Audit Committee of the board of directors.
Revenue Recognition — Most of our revenues are recognized upon shipment, provided that persuasive evidence of an arrangement exists, the sales price is fixed or determinable, collectibility is reasonably assured, and title and risk of loss have passed to the customer. The FASB has issued guidance on multiple deliverable arrangements that establishes a relative selling price hierarchy for determining the selling price of a deliverable based on vendor specific objective evidence (VSOE) if available, third-party evidence (TPE) if vendor-specific objective evidence is not available, or best estimated selling price (BESP) if neither vendor-specific objective evidence nor third-party evidence is available. Our multiple deliverable arrangements include installation, installation supervision, training, and spare parts, which tend to be completed in a short period of time, at an insignificant cost, and utilizing skills not unique to us, and, therefore, are typically regarded as inconsequential or perfunctory. Revenue for undelivered items is deferred and included within accrued liabilities in the accompanying balance sheet. Revenues deferred in 2014, 2013 and 2012 were not material.
Translation of Foreign Currency Financial Statements and Foreign Currency Transactions — Our reporting currency is the U.S. dollar. However, the functional currency for each of our foreign subsidiaries is its principal operating currency. We translate the amounts included in our Consolidated Statements of Income from our foreign subsidiaries into U.S. dollars at weighted-average exchange rates, which we believe are representative of the actual exchange rates on the dates of the transactions. Our foreign subsidiaries’ assets and liabilities are translated into U.S. dollars from local currency at the actual exchange rates as of the end of each reporting date, and we record the resulting foreign exchange translation adjustments in our Consolidated Balance Sheets as a component of accumulated other comprehensive income (loss). If the U.S. dollar strengthens, we reflect the resulting losses as a component of accumulated other comprehensive income (loss). Conversely, if the U.S. dollar weakens, foreign exchange translation gains result, which favorably impact accumulated other comprehensive income (loss). Translation adjustments may be included in net earnings in the event of a sale or liquidation of certain of our underlying foreign investments. If we determine that the functional currency of any of our foreign subsidiaries should be the U.S. dollar, our financial statements will be affected. Should this occur, we will adjust our reporting to appropriately account for any such changes.
As appropriate, we use permanently invested intercompany loans as a source of capital to reduce exposure to foreign currency fluctuations at our foreign subsidiaries. These loans, on a consolidated basis, are treated as being analogous to equity for accounting purposes. Therefore, foreign exchange gains or losses on these intercompany loans are recorded in accumulated other comprehensive income (loss).
20
Table of Contents
Goodwill — Goodwill is the excess of purchase price over the fair value of tangible and identifiable intangible net assets acquired in various business combinations. Goodwill is not amortized but is tested for impairment annually at the reporting unit level, or more often if indications of impairment exist. Our reporting units are the Adhesive Dispensing Systems segment, the Industrial Coating Systems segment and one level below the Advanced Technology Systems segment.
We test goodwill in accordance with Accounting Standards Codification (ASC) 350. The goodwill impairment test is a two-step process. In the first step, performed in the fourth quarter of each year, we estimate a reporting unit’s fair value using a combination of the discounted cash flow method of the Income Approach and the guideline public company method of the Market Approach and compare the result against the reporting unit’s carrying value of net assets. If the carrying value of a reporting unit exceeds its fair value, then a second step is performed to determine if goodwill is impaired. We use an independent valuation specialist to assist with refining our assumptions and methods used to determine fair values using these methods. In step one, the discounted cash flow method uses assumptions for revenue growth, operating margin, and working capital turnover that are based on general management’s strategic plans tempered by performance trends and reasonable expectations about those trends. Terminal value calculations employ a published formula known as the Gordon Growth Model Method that essentially captures the present value of perpetual cash flows beyond the last projected period assuming a constant Weighted Average Cost of Capital (WACC) methodology and growth rate. For each reporting unit, a sensitivity analysis is performed to vary the discount and terminal growth rates in order to provide a range of reasonableness for detecting impairment.
Discount rates are developed using a WACC methodology. The WACC represents the blended average required rate of return for equity and debt capital based on observed market return data and company specific risk factors. For 2014, the discount rates used ranged from 10 percent to 17 percent depending upon the reporting unit’s size, end market volatility, and projection risk. The calculated internal rate of return for the discounted cash flow method was 11 percent, the same as the calculated WACC for total Nordson. In the application of the guideline public company method, fair value is determined using transactional evidence for similar publicly traded equity. The comparable company guideline group is determined based on relative similarities to each reporting unit since exact correlations are not available. An indication of fair value for each reporting unit is based on the placement of each reporting unit within a range of multiples determined for its comparable guideline company group. Valuation multiples are derived by dividing latest twelve month performance for revenues and EBITDA into total invested capital, which is the sum of traded equity plus interest bearing debt less cash. These multiples are applied against the revenue and EBITDA of each reporting unit. While the implied indications of fair value using the guideline public company method yield meaningful results, the discounted cash flow method of the income approach includes management’s thoughtful projections and insights as to what the reporting units will accomplish in the near future. Accordingly, the reasonable, implied fair value of each reporting unit is a blend based on the relative strength of the approaches employed.
To test the reasonableness of the aggregate fair value, we performed the control premium test, which compares the sum of the implied fair values calculated for our reporting units (net of debt) to the market value of equity. The control premium was 7 percent as of the test date of August 1, 2014 and 5 percent as of October 31, 2014. The control premium indicated that the discounted cash flow valuation was reasonable.
In 2014 and 2013, the results of our step one testing indicated no impairment; therefore, the second step of impairment testing was not necessary.
21
Table of Contents
The excess of fair value (FV) over carrying value (CV) was compared to the carrying value for each reporting unit. Based on the results shown in the table below and based on our measurement date of August 1, 2014, our conclusion is that no indicators of impairment exist in 2014. Potential events or circumstances, such as a sustained downturn in global economies, could have a negative effect on estimated fair values.
| WACC | Excess of FV over CV |
Goodwill | ||||||||||
| Adhesive Dispensing Systems Segment |
10 | % | 365 | % | $ | 405,328 | ||||||
| Industrial Coating Systems Segment |
16 | % | 136 | % | $ | 24,058 | ||||||
| Advanced Technology Systems Segment — Electronics Systems |
13 | % | 562 | % | $ | 15,138 | ||||||
| Advanced Technology Systems Segment — Fluid Management |
12 | % | 113 | % | $ | 478,218 | ||||||
| Advanced Technology Systems Segment — Test & Inspection |
17 | % | 157 | % | $ | 14,397 | ||||||
The table above does not include two acquisitions that occurred after the August 1 measurement date but before our fiscal year-end. We acquired Avalon Laboratories Holding Corp. (“Avalon”) on August 8, 2014 and Dima Group B.V. (“Dima”) on August 29, 2014. Determination of the preliminary goodwill associated with these acquisitions was completed with the assistance of an independent valuation specialist in October 2014. Since the dates of the valuations, no events or changes in circumstances have occurred that would more likely than not reduce the fair value of these acquisitions below their carrying values. For future valuation purposes, Avalon will be included in the Advanced Technology Systems — Fluid Management reporting unit, and Dima will be included in the Advanced Technology Systems — Electronics Systems reporting unit.
Other Long-Lived Assets — We test other depreciable and amortizable long-lived assets for recoverability in accordance with ASC 360 using undiscounted cash flows. The total carrying value of long-lived assets for each reporting unit has been compared to the forecasted cash flows of each reporting unit’s long-lived assets being tested. Cash flows have been defined as earnings before interest, taxes, depreciation, and amortization, less annual maintenance capital spending.
Estimates of future cash flows used to test the recoverability of a long-lived asset (asset group) are based on the remaining useful life of the asset. We believe that the relative value of long-lived assets within each reporting unit is a reasonable proxy for the relative importance of the assets in the production of cash flow. To get to a reasonable forecast period, the aggregate net book value of long-lived assets was divided by the current depreciation and amortization value to arrive at a blended remaining useful life. Our calculations for 2014 showed the undiscounted aggregate value of cash flows over the remaining useful life for each reporting unit was greater than the respective carrying value of the long-lived assets within each reporting unit, so no impairment charges were recognized.
Inventories — Inventories are valued at the lower of cost or market. Cost was determined using the last-in, first-out (LIFO) method for 21 percent of consolidated inventories at October 31, 2014 and October 31, 2013, with the first-in, first-out (FIFO) method used for the remaining inventory. On an ongoing basis, inventory is tested for technical obsolescence, as well as for future demand and changes in market conditions. We have historically maintained inventory reserves to reflect those conditions when the cost of inventory is not expected to be recovered. Reserves are also maintained for inventory used for demonstration purposes. The inventory reserve balance was $26,744, $26,579 and $20,505 at October 31, 2014, 2013 and 2012, respectively.
Pension Plans and Postretirement Medical Plans — The measurement of liabilities related to our pension plans and postretirement medical plans is based on management’s assumptions related to future factors, including interest rates, return on pension plan assets, compensation increases, mortality and turnover assumptions, and health care cost trend rates.
The weighted-average discount rate used to determine the present value of our domestic pension plan obligations was 4.29 percent at October 31, 2014 and 4.75 percent at October 31, 2013. The weighted-average discount rate used to determine the present value of our various international pension plan obligations was 2.94 percent at October 31, 2014, compared to 3.72 percent at October 31, 2013. The discount rates used for all plans were determined by using quality fixed income investments with a duration period approximately equal to the period over which pension obligations are expected to be settled.
22
Table of Contents
In determining the expected return on plan assets, we consider both historical performance and an estimate of future long-term rates of return on assets similar to those in our plans. We consult with and consider the opinions of financial and actuarial experts in developing appropriate return assumptions. The expected rate of return (long-term investment rate) on domestic pension assets used to determine net benefit costs was 7.24 percent in 2014 and 2013. The average expected rate of return on international pension assets used to determine net benefit costs was 4.60 percent in 2014 and 4.43 percent in 2013.
The assumed rate of compensation increases used to determine the present value of our domestic pension plan obligations was 3.49 percent at October 31, 2014, compared to 3.30 percent at October 31, 2013. The assumed rate of compensation increases used to determine the present value of our international pension plan obligations was 3.19 percent at October 31, 2014, compared to 3.18 percent at October 31, 2013.
The measurement of domestic pension and other post employment benefit (OPEB) plans’ projected benefit obligations included the effects of adopting the Society of Actuaries’ release of final RP2014 / MP2014 mortality tables. The adoption of these new tables resulted in an increase to our domestic pension and OPEB plans’ projected benefit obligations of $28,554 and $4,878, respectively.
Annual expense amounts are determined based on the discount rate used at the end of the prior year. Differences between actual and assumed investment returns on pension plan assets result in actuarial gains or losses that are amortized into expense over a period of years.
With respect to the domestic postretirement medical plan, the discount rate used to value the benefit plan was 4.40 percent at October 31, 2014 and 4.80 percent at October 31, 2013. The annual rate of increase in the per capita cost of covered benefits (the health care cost trend rate) is assumed to be 3.93 percent in 2015, decreasing gradually to 3.41 percent in 2024.
For the international postretirement plan, the discount rate used to value the benefit obligation was 4.25 percent at October 31, 2014 and 4.95 percent at October 31, 2013. The annual rate of increase in the per capita cost of covered benefits (the health care cost trend rate) is assumed to be 6.48 percent in 2015, decreasing gradually to 3.50 percent in 2031.
Employees hired after January 1, 2002, are not eligible to participate in the domestic postretirement medical plan.
Pension and postretirement expenses in 2015 are expected to be approximately $4,000 higher than 2014, primarily due to changes in discount rates and the new mortality tables used for domestic plans.
Income Taxes — Income taxes are estimated based on income for financial reporting purposes. Deferred income taxes reflect the net tax effect of temporary differences between the carrying amounts of assets and liabilities for financial reporting purposes and the amounts used for income tax purposes and certain changes in valuation allowances. We provide valuation allowances against deferred tax assets if, based on available evidence, it is more likely than not that some portion or all of the deferred tax assets will not be realized.
Management believes the valuation allowances are adequate after considering future taxable income, allowable carryforward periods and ongoing prudent and feasible tax planning strategies. In the event we were to determine that we would be able to realize the deferred tax assets in the future in excess of the net recorded amount (including the valuation allowance), an adjustment to the valuation allowance would increase income in the period such determination was made. Conversely, should we determine that we would not be able to realize all or part of the net deferred tax asset in the future, an adjustment to the valuation allowance would be expensed in the period such determination was made.
Further, at each interim reporting period, we estimate an effective income tax rate that is expected to be applicable for the full year. Significant judgment is involved regarding the application of global income tax laws and regulations and when projecting the jurisdictional mix of income. Additionally, interpretation of tax laws, court decisions or other guidance provided by taxing authorities influences our estimate of the effective income tax rates. As a result, our actual effective income tax rates and related income tax liabilities may differ materially from our estimated effective tax rates and related income tax liabilities. Any resulting differences are recorded in the period they become known.
23
Table of Contents
Financial Instruments — Assets, liabilities and commitments that are to be settled in cash and are denominated in foreign currencies are sensitive to changes in currency exchange rates. We enter into foreign currency forward contracts, which are derivative financial instruments, to reduce the risk of foreign currency exposures resulting from the collection of receivables, payables and loans denominated in foreign currencies. The maturities of these contracts are usually less than 90 days. Forward contracts are not designated as hedging instruments and therefore are marked to market each accounting period, and the resulting gains or losses are included in “other–net” within other income (expense) in the Consolidated Statement of Income.
Warranties — We provide customers with a product warranty that requires us to repair or replace defective products within a specified period of time (generally one year) from the date of delivery or first use. An accrual is recorded for expected warranty costs for products shipped through the end of each accounting period. In determining the amount of the accrual, we rely primarily on historical warranty claims. Amounts charged to the warranty reserve were $10,813, $7,891 and $5,430 in 2014, 2013 and 2012, respectively. The reserve balance was $9,918, $9,409 and $8,929 at October 31, 2014, 2013 and 2012, respectively.
Performance Share Incentive Awards — Executive officers and selected other key employees are eligible to receive share awards with payouts based on corporate performance over three-year periods. Award payouts vary based on the degree to which corporate performance equals or exceeds predetermined threshold, target and maximum performance levels at the end of a performance period. No award payout will occur unless certain threshold performance levels are equaled or exceeded. The amount of compensation expense is based upon current performance projections for each three-year performance period and the percentage of the requisite service that has been rendered. The calculations are also based upon the grant date fair value determined using the closing market price of Nordson Common Stock at the grant date, reduced by the implied value of dividends not to be paid. Awards are recorded as capital in excess of stated value in shareholders’ equity. The cumulative amount recorded at October 31, 2014 for the plans originating in 2012, 2013 and 2014 was $7,570. Compensation expense attributable to all performance share incentive award periods for executive officers and selected other key employees for 2014, 2013 and 2012 was $4,304, $3,588 and $4,235, respectively.
2014 compared to 2013
Sales — Worldwide sales for 2014 were $1,704,021, an increase of 10.4 percent from 2013 sales of $1,542,921. Sales volume increased 10.9 percent, and unfavorable currency effects caused by the stronger U.S. dollar primarily against the Japanese Yen reduced sales by 0.5 percent. The volume increase consisted of 6.2 percent from organic growth and 4.7 percent from acquisitions. Two acquisitions were made during 2014: Avalon Laboratories and Dima Group B.V., both of which are included within the Advanced Technology Systems segment. Three acquisitions were made during 2013: the Kreyenborg Group and certain assets of Kodama Chemical Industry Co., Ltd., both of which were included within the Adhesives Dispensing Systems segment and certain assets of Nellcor Puritan Bennett Mexico, S.A. de C.V., a subsidiary of Covidien LP (“Nellcor”), which was included within the Advanced Technology Systems segment.
As used throughout this Form 10-K, geographic regions include the Americas (Canada, Mexico and Central and South America), Asia Pacific (excluding Japan), Europe, Japan, and the United States.
Sales of the Adhesive Dispensing Systems segment were $899,696 in 2014, an increase of $106,208, or 13.4 percent, from 2013 sales of $793,488. The increase was the result of a sales volume increase of 14.3 percent offset by unfavorable currency effects that reduced sales by 0.9 percent. The sales volume increase consisted of 8.1 percent from acquisitions and 6.2 percent from organic volume. Sales volume, inclusive of acquisitions, increased in all geographic regions and was particularly strong in the Europe and Asia Pacific regions. Organic growth in all product lines was driven by our disposable hygiene, rigid packaging, polymer processing and general product assembly end markets.
Sales of the Advanced Technology Systems segment were $561,784 in 2014, an increase of $45,518, or 8.8 percent, from 2013 sales of $516,266. The increase was the result of a sales volume increase of 8.4 percent and favorable currency effects that increased sales by 0.4 percent. The sales volume increase consisted of 6.8% from organic volume and 1.6% from the first-year effect of acquisitions. Within the segment, sales volume, inclusive of acquisitions, increased in all geographic regions, except the Americas, and were most pronounced in
24
Table of Contents
Japan and Asia Pacific. Strong organic growth in all product lines was led by demand for our automated dispensing equipment related to electronic mobile device assembly end markets, along with higher demand for our electronic test and inspection equipment, semi-automated dispensing systems and single-use fluid management components related to medical and industrial end markets.
Sales of the Industrial Coating Systems segment were $242,541 in 2014, an increase of $9,374, or 4.0 percent, from 2013 sales of $233,167. The increase was the result of a sales volume increase of 4.7 percent offset by unfavorable currency effects that reduced sales by 0.7 percent. The sales volume increase was entirely due to organic growth. Sales volume increased in the United States and Europe regions. Growth was driven by demand for our cold material dispensing equipment in automotive and industrial end markets, coating equipment for food and beverage end markets and select consumer durable goods end markets, partially offset by softness in UV curing equipment for electronic applications.
Sales outside the United States accounted for 70.4 percent of our sales in 2014, as compared to 69.8 percent in 2013. On a geographic basis, sales in the United States were $503,776, an increase of 8.2 percent from 2013. The increase consisted of 6.1 percent organic volume and 2.1 percent from acquisitions. In the Americas region, sales were $120,993, down 2.2 percent from the prior year, with volume increasing 0.8 percent offset by unfavorable currency effects of 3.0 percent. The increase in sales volume consisted of 0.5 percent from organic volume and 0.3 percent from acquisitions. Sales in Europe were $494,538 in 2014, up 18.7 percent from 2013, with volume increasing 16.8 and favorable currency effects of 1.9 percent. The increase in sales volume consisted of 5.3 percent from organic growth and 11.5 percent from acquisitions. Sales in Japan for 2014 were $127,057, a decrease of 0.7 percent from the prior year. The decrease consisted of volume growth of 7.4 percent offset by unfavorable currency effects of 8.1 percent. The increase in sales volume consisted of 5.5 percent organic volume and 1.9 percent from acquisitions. Sales in the Asia Pacific region were $457,657, up 11.9 percent from the prior year, with volume increasing 12.1 percent, offset by unfavorable currency effects of 0.2 percent. The increase in sales volume consisted of 9.0 percent from organic growth and 3.1 percent from acquisitions.
It is estimated that the effect of pricing on total revenue was neutral relative to 2013.
Operating profit — Cost of sales were $758,923 in 2014, up 12.1 percent from 2013. The increase compared to 2013 is primarily due to increased sales volume. Gross profit, expressed as a percentage of sales, decreased to 55.5 percent in 2014 from 56.1 percent in 2013. The reduction in gross margin was primarily a result of product line mix, as well as a higher mix of systems revenue in our legacy business and currency effects.
Selling and administrative expenses, including severance and restructuring costs, were $577,993 in 2014, an increase of $35,698, or 6.6 percent, from 2013. The increase was primarily due to the addition of acquired businesses and higher compensation expenses related to increased employment levels, partially offset by currency effects that reduced expenses.
Selling and administrative expenses as a percentage of sales decreased to 33.9 percent in 2014 from 35.1 percent in 2013, due primarily to the higher level of sales and the favorable effects of continuous improvement activities.
Severance and restructuring costs of $2,551 were recorded during 2014. Within the Adhesives Dispensing Systems segment, certain restructuring programs within our U.S. and European operations resulted in costs of $1,731. Within the Advanced Technology Systems segment, restructuring initiatives in the U.S. resulted in severance costs of $579. Within the Industrial Coatings Systems segment, restructuring activities in China resulted in severance costs of $241.
Operating profit as a percentage of sales was 21.5 percent in 2014 compared to 21.0 percent in 2013. The increase was primarily due to higher sales volume supported by a more efficient cost structure.
Operating capacity for each of our segments can support fluctuations in order activity without significant changes in operating costs. Also, currency translation affects reported operating margins. Operating margins for each segment were unfavorably impacted by a stronger dollar during 2014 as compared to 2013.
Operating profit as a percentage of sales for the Adhesive Dispensing Systems segment decreased to 25.5 percent in 2014 from 25.7 percent in 2013. The slight decline in 2014 was due to the dilution effect of acquired product lines in 2013.
25
Table of Contents
Operating profit as a percentage of sales for the Advanced Technology Systems segment increased to 25.0 percent in 2014 from 23.9 percent in 2013. The increase was due primarily to higher sales volume supported by a more efficient cost structure.
Operating profit as a percentage of sales for the Industrial Coating Systems segment increased to 15.7 percent in 2014 from 14.5 percent in 2013. The increase was due primarily to higher sales volume supported by a more efficient cost structure.
Interest and other income (expense) — Interest expense in 2014 was $15,035, an increase of $194, or 1.3 percent, from 2013. The increase was due to higher borrowing levels resulting primarily from acquisitions in the second half of 2013 and 2014.
Other expense in 2014 was $138 compared to other income in 2013 of $1,694. Included in 2014 were a gain on property insurance settlement of $1,005 and foreign currency losses of $478. Included in 2013 were a gain on sale of real estate in China of $2,106 and foreign currency losses of $2,214.
Income taxes — Income tax expense in 2014 was $105,740, or 30.0 percent of pre-tax income, as compared to $89,306, or 28.7 percent of pre-tax income in 2013.
The 2013 rate was impacted by a favorable adjustment to unrecognized tax benefits of $900 primarily related to expiration of certain foreign statutes of limitations. On January 2, 2013, the American Taxpayer Relief Act of 2012 was enacted which retroactively reinstated and extended the Federal Research and Development Tax Credit (Federal R&D Tax Credit) from January 1, 2012 to December 31, 2013 and extended certain other tax provisions. As a result, the Company’s income tax expense for 2013 includes a discrete tax benefit of $1,700 related to 2012.
Net income — Net income was $246,773, or $3.84 per diluted share, in 2014, compared to net income of $221,817, or $3.42 per diluted share in 2013. This represents an 11.3 percent increase in net income and a 12.3 percent increase in diluted earnings per share.
Recently issued accounting standards — In July 2013, the Financial Accounting Standards Board (FASB) issued an Accounting Standards Update (ASU) which requires the netting of unrecognized tax benefits against a deferred tax asset for a loss or other carry forward that would apply in settlement of uncertain tax positions. Under the new standard, unrecognized tax benefits will be netted against all available same-jurisdiction loss or other tax carry forwards that would be utilized, rather than only against carry forwards that are created by the unrecognized tax benefits. The new guidance is effective prospectively to all existing unrecognized tax benefits, but entities can choose to apply it retrospectively. The guidance will be effective for us in our first quarter of 2015, with early adoption permitted. We do not believe the adoption of this ASU will have a material effect on our consolidated financial statements.
In May 2014, the FASB issued a new standard regarding revenue recognition. Under this standard, a company recognizes revenue when it transfers promised goods or services to customers in an amount that reflects the consideration to which the company expects to be entitled in exchange for those goods or services. The standard implements a five-step process for customer contract revenue recognition that focuses on transfer of control. It will be effective for us beginning in 2018, with early adoption not permitted. Entities can transition to the standard either retrospectively or as a cumulative-effect adjustment as of the date of adoption. We are currently assessing the impact this standard will have on our consolidated financial statements as well as the method by which we will adopt the new standard.
2013 compared to 2012
Sales — Worldwide sales for 2013 were $1,542,921, an increase of 9.5 percent from 2012 sales of $1,409,578. Sales volume increased 10.6 percent, and unfavorable currency effects caused by the stronger U.S. dollar primarily against the Japanese Yen reduced sales by 1.1 percent. The volume increase consisted of 10.2 percent from acquisitions and 0.4 percent from organic growth. Three acquisitions were made during 2013: the Kreyenborg Group and certain assets of Kodama Chemical Industry Co., Ltd., which were both included within the Adhesive Dispensing Systems segment, and certain assets of Nellcor Puritan Bennett Mexico, S.A. de C.V., a subsidiary of Covidien LP (Nellcor) which was included within the Advanced Technology Systems segment. Three
26
Table of Contents
acquisitions were made during 2012: EDI Holdings, Inc. (EDI) and Xaloy Superior Holdings, Inc. (Xaloy), which were included within the Adhesive Dispensing Systems segment, and Sealant Equipment & Engineering, Inc. (SEE), which was included within the Industrial Coating Systems segment.
As used throughout this Form 10-K, geographic regions include the Americas (Canada, Mexico and Central and South America), Asia Pacific (excluding Japan), Europe, Japan, and the United States.
Sales of the Adhesive Dispensing Systems segment were $793,488 in 2013, an increase of $109,392, or 16.0 percent, from 2012 sales of $684,096. The increase was the result of a sales volume increase of 17.6 percent offset by unfavorable currency effects that reduced sales by 1.6 percent. The sales volume increase consisted of 18.8 percent from acquisitions offset by a 1.2 percent reduction in organic volume. Sales volume, inclusive of acquisitions, increased in all geographic regions and was particularly strong in the United States and Asia Pacific regions. Growth in our solar applications, paper board packaging and certain durable goods markets was partially offset by softness in our plastics processing markets and disposable hygiene product markets.
Sales of the Advanced Technology Systems segment were $516,266 in 2013, an increase of $274, or 0.1 percent, from 2012 sales of $515,992. The increase was the result of a sales volume increase of 0.3 percent offset by unfavorable currency effects that reduced sales by 0.2 percent. The sales volume increase was solely due to organic growth. Within the segment, volume increases occurred in all geographic regions, except Asia Pacific, and were most pronounced in Japan. Growth in our automotive electronics, display assembly, printed circuit board assembly and medical equipment markets was offset by softness in our semiconductor packaging and industrial assembly end markets.
Sales of the Industrial Coating Systems segment were $233,167 in 2013, an increase of $23,677, or 11.3 percent, from 2012 sales of $209,490. The increase was the result of a sales volume increase of 12.7 percent offset by unfavorable currency effects that reduced sales by 1.4 percent. The sales volume increase consisted of 5.6 percent organic growth and 7.1 percent from an acquisition. Sales volume, inclusive of acquisitions, increased in the United States, Americas, and Japan regions. Growth in some of our consumer and industrial durable goods markets was offset by softness in our large dollar systems supporting automotive OEMs and container coating markets.
Sales outside the United States accounted for 69.8 percent of our sales in 2013, versus 72.4 percent in 2012. On a geographic basis, sales in the United States were $465,789, an increase of 19.8 percent from 2012. The increase consisted of 1.5 percent organic volume and 18.3 percent from acquisitions. In the Americas region, sales were $123,654, up 13.4 percent from the prior year, with volume increasing 14.8 percent offset by unfavorable currency effects of 1.4 percent. The increase in sales volume consisted of 5.8 percent organic volume and 9.0 percent from acquisitions. Sales in Europe were $416,725 in 2013, up 9.4 percent from 2012, with volume increasing 8.1 and favorable currency effects of 1.3 percent. The increase in sales volume consisted primarily of 8.0 percent from acquisitions. Sales in Japan for 2013 were $127,945, an increase of 0.3 percent from the prior year. The increase consisted of volume of 16.1 percent offset by unfavorable currency effects of 15.8 percent. The increase in sales volume consisted of 8.5 percent organic volume and 7.6 percent from acquisitions. Sales in the Asia Pacific region were $408,808, up 1.4 percent from the prior year, with volume increasing 0.9 percent, and favorable currency effects of 0.5 percent. The increase in sales volume consisted of 5.4 percent from acquisitions offset by a decline in organic volume of 4.5 percent.
It is estimated that the effect of pricing on total revenue was neutral relative to 2012.
Operating profit — Cost of sales, including those costs classified as restructuring, were $676,777 in 2013, up 15.4 percent from 2012. The increase compared to 2012 is primarily due to increased sales volume. Gross profit, expressed as a percentage of sales, decreased to 56.1 percent in 2013 from 58.4 percent in 2012. The reduction in gross margin was primarily a result of lower product line margins relating to 2013 and 2012 acquisitions, as well as a higher mix of systems revenue in our legacy business and currency effects.
Selling and administrative expenses, including severance and restructuring costs, were $542,295 in 2013, an increase of $54,486, or 11.2 percent, from 2012. The increase was primarily due to the addition of acquired businesses, acquisition transaction costs and higher compensation expenses related to increased employment levels, partially offset by currency effects that reduced expenses.
27
Table of Contents
Selling and administrative expenses as a percentage of sales increased to 35.1 percent in 2013 from 34.6 percent in 2012, due primarily to the acquired businesses and modest organic sales volume growth.
Severance and restructuring costs of $1,126 were recorded during 2013. Within the Adhesives Dispensing Systems segment, a restructuring program to optimize certain European operations resulted in costs of $315. Within the Advanced Technology Systems segment, restructuring initiatives that involved plant and facility consolidations and other programs resulted in severance costs of $811 in 2013.
Operating profit as a percentage of sales was 21.0 percent in 2013 compared to 23.8 percent in 2012. The decrease was primarily due to the dilutive effect of 2013 and 2012 acquisitions, as well as modest organic sales growth and higher selling and administrative expenses.
Operating capacity for each of our segments can support fluctuations in order activity without significant changes in operating costs. Also, currency translation affects reported operating margins. Operating margins for each segment were unfavorably impacted by a stronger dollar during 2013 as compared to 2012.
Operating profit as a percentage of sales for the Adhesive Dispensing Systems segment decreased to 25.7 percent in 2013 from 30.9 percent in 2012. The decrease was primarily due to the dilutive effect of 2013 and 2012 acquisitions.
Operating profit as a percentage of sales for the Advanced Technology Systems segment decreased to 23.9 percent in 2013 from 26.0 percent in 2012. The decline was partially due to a higher mix of engineered systems serving mobile electronic device customers and incremental spending on initiatives that are intended to drive growth in future periods.
Operating profit as a percentage of sales for the Industrial Coating Systems segment increased to 14.5 percent in 2013 from 12.4 percent in 2012. The increase was primarily due to better absorption of fixed expenses, as well as the accretive effect of a 2012 acquisition.
Interest and other income (expense) — Interest expense in 2013 was $14,841, an increase of $3,688, or 33.1 percent, from 2012. The increase was due to higher borrowing levels resulting primarily from acquisitions in the second half of 2012 and 2013.
Other income in 2013 was $1,694 compared to $1,463 in 2012. Included in 2013 were the gain on sale of real estate in China of $2,106 and foreign currency losses of $2,214. The 2012 amount included a net gain of $713 on the sale of three facilities within the Adhesive Dispensing Systems segment and foreign currency losses of $1,016.
Income taxes — Income tax expense in 2013 was $89,306, or 28.7 percent of pre-tax income, as compared to $101,424, or 31.1 percent of pre-tax income in 2012.
The 2013 rate was impacted by a favorable adjustment to unrecognized tax benefits of $900 primarily related to expiration of certain foreign statutes of limitations. On January 2, 2013, the American Taxpayer Relief Act of 2012 was enacted which retroactively reinstated and extended the Federal Research and Development Tax Credit (Federal R&D Tax Credit) from January 1, 2012 to December 31, 2013 and extended certain other tax provisions. As a result, the Company’s income tax expense for 2013 includes a discrete tax benefit of $1,700 related to 2012.
The 2012 tax rate was impacted by a favorable adjustment related to our 2011 tax provision that reduced income taxes by $400, a favorable adjustment to deferred taxes related to a tax rate reduction in the United Kingdom that reduced income taxes by $175, and additional tax expense of $325 related to an adjustment of deferred taxes resulting from a tax rate reduction in Japan.
Net income — Net income was $221,817, or $3.42 per diluted share, in 2013, compared to net income of $224,829, or $3.45 per diluted share in 2012. This represented a 1.3 percent decrease in net income and a 0.9 percent decrease in diluted earnings per share.
Liquidity and Capital Resources
Cash and cash equivalents decreased $61 in 2014. Cash provided by operating activities was $288,155 in 2014, compared to $268,376 in 2013. The primary sources were net income adjusted for non-cash income and expenses
28
Table of Contents
and the tax benefit from the exercise of stock options, the sum of which was $322,529 in 2014, compared to $287,378 in 2013. Operating assets and liabilities used $34,374 of cash in 2014, compared to $19,002 in 2013. The primary reasons for this increase were higher receivables due to higher year-end shipments, higher inventory investments to meet anticipated demand, partially offset by higher accrued liabilities.
Cash used by investing activities was $230,525 in 2014, compared to $220,545 in 2013. The 2014 acquisitions of Avalon Laboratories and Dima Group B.V. used $186,420 of cash. The 2013 acquisitions of the Kreyenborg Group, certain assets from Kodama Chemical Industry Co., Ltd and certain assets from Nellcor Puritan Bennett Mexico, S.A. de C.V., a subsidiary of Covidien LP used $176,333 of cash. Capital expenditures were $43,574 in 2014, down from $47,219 in the prior year. Current year capital expenditures were focused on production machinery, continued investments in our information systems platform and on a new facility in Colorado supporting our fluid management product lines. Cash proceeds of $3,847 in 2013 related primarily to sale of real estate in China.
Cash of $53,458 was used by financing activities in 2014, compared to $52,426 in 2013. Included in 2014 were net short and long-term borrowings of $153,823, compared to $15,747 in the prior year. The change was primarily due to increased borrowing for acquisitions and purchase of treasury shares in 2014. Issuance of common shares related to employee benefit plans generated $7,013 of cash in 2014, up from $6,018 in 2013, and the tax benefit from stock option exercises was $6,385 in the current year, up from $5,531 in the prior year. These increases were the result of higher stock option exercises. In 2014, cash of $166,434 was used for the purchase of treasury shares, up from $33,402 in 2013. Dividend payments were $48,391 in 2014, up from $40,478 in 2013 due to an increase in the annual dividend to $0.76 per share from $0.63 per share.
The following is a summary of significant changes by balance sheet caption from October 31, 2013 to October 31, 2014. Receivables increased $57,137 primarily due to higher sales in the fourth quarter of 2014 compared to the fourth quarter of 2013. The increase of $12,470 in inventories was primarily due to inventory held by Avalon Laboratories and Dima Group B.V, which were both acquired in 2014. Net property, plant and equipment increased $23,460 primarily due to capital expenditures and acquisitions, partially offset by depreciation expense. Goodwill increased $113,326, due to acquisitions completed in 2014 that added $124,391 of goodwill, offset by $11,065 from the effects of currency translation. The increase in net other intangibles of $22,237 was due to $53,281 of intangibles added as a result of the 2014 acquisitions, partially offset by $25,308 of amortization and $5,736 from the effects of currency translation.
The increase in notes payable of $102,577 was related to the borrowing of a $100,000 short-term credit facility with PNC Bank. Accounts payable increased $6,377, primarily due to the higher level of business activity in the fourth quarter of 2014 compared to the fourth quarter of 2013. The increase in income taxes payable of $2,064 was due to the timing of required tax payments. The increase of $26,473 in accrued liabilities was due to higher compensation-related accruals and higher value of foreign exchange contracts. The long-term debt increase of $44,710 primarily reflects $121,242 of net borrowings under our revolving credit agreement offset by repayments of $65,815 under our €100,000 agreement with The Bank of Tokyo-Mitsubishi UFJ, Ltd, and repayments of $10,556 under our New York Life credit facility. The $20,328 increase in long-term pension obligations was primarily the result of a decrease in discount rates and new mortality tables used for domestic plans. Postretirement obligations increased $8,506 primarily due to a decrease in discount rates and new mortality tables used for domestic plans. The increase of $3,945 in other long-term liabilities is due primarily to the Avalon and Dima Group acquisitions and Corporate deferred compensation liabilities.
In August 2013 the board of directors approved a repurchase program of up to $200,000. Uses for repurchased shares include the funding of benefit programs including stock options, restricted stock and 401(k) matching. Shares purchased are treated as treasury shares until used for such purposes. The repurchase program is being funded using cash from operations and proceeds from borrowings under our credit facilities. During 2014, we repurchased 2,224 shares within these programs for a total of $163,584, excluding shares repurchased for taxes associated with stock-based compensation.
As of October 31, 2014, approximately 87 percent of our consolidated cash and cash equivalents were held at various foreign subsidiaries. Deferred income taxes are not provided on undistributed earnings of international
29
Table of Contents
subsidiaries that are intended to be permanently invested in those operations. These undistributed earnings aggregated approximately $622,914 and $510,842 at October 31, 2014 and 2013, respectively. Should these earnings be distributed, applicable foreign tax credits would substantially offset United States taxes due upon the distribution.
Subsequent to October 31, 2014, the board of directors authorized a new $300,000 share repurchase program, effective December 16, 2014. This new program replaced the $200,000 program approved by the board in August 2013.
Contractual Obligations
The following table summarizes contractual obligations as of October 31, 2014:
| Obligations |
Payments Due by Period | |||||||||||||||||||
| Total | Less than 1 Year |
1-3 Years | 4-5 Years | After 5 Years |
||||||||||||||||
| Long-term debt(1) |
$ | 693,619 | $ | 10,751 | $ | 487,384 | $ | 48,178 | $ | 147,306 | ||||||||||
| Interest payments on long-term debt(1) |
43,297 | 7,464 | 13,220 | 10,462 | 12,151 | |||||||||||||||
| Capital lease obligations(2) |
22,267 | 6,866 | 7,297 | 1,628 | 6,476 | |||||||||||||||
| Operating leases(2) |
43,551 | 12,189 | 13,000 | 7,952 | 10,410 | |||||||||||||||
| Notes payable(3) |
106,181 | 106,181 | — | — | — | |||||||||||||||
| Contributions related to pension and postretirement benefits(4) |
28,100 | 28,100 | — | — | — | |||||||||||||||
| Purchase obligations(5) |
52,616 | 52,314 | 302 | — | — | |||||||||||||||
|
|
|
|
|
|
|
|
|
|
|
|||||||||||
| Total obligations |
$ | 989,631 | $ | 223,865 | $ | 521,203 | $ | 68,220 | $ | 176,343 | ||||||||||
|
|
|
|
|
|
|
|
|
|
|
|||||||||||
(1) We have a $500,000 unsecured, multicurrency credit facility with a group of banks that expires in December 2016 and may be increased to $750,000 under certain conditions. At October 31, 2014, $375,242 was outstanding under this facility, compared to $254,000 outstanding at October 31, 2013. The weighted average interest rate for borrowings under this agreement was 1.08 percent at October 31, 2014. There are two primary financial covenants that must be met under this facility. The first covenant limits the amount of total indebtedness that can be incurred to 3.50 times consolidated trailing four-quarter EBITDA (both indebtedness and EBITDA as defined in the credit agreement). The second covenant requires consolidated trailing four-quarter EBITDA to be at least 2.75 times consolidated trailing four-quarter interest expense (both as defined in the credit agreement). At October 31, 2014, we were in compliance with all debt covenants, and the amount we could borrow under the credit facility would not have been limited by any debt covenants.
In 2011, we entered into a $150,000 three-year Private Shelf Note agreement with New York Life Investment Management LLC. Effective in 2013, the amount of the facility was increased from $150,000 to $175,000. Borrowings under the agreement may be up to 12 years, with an average life of up to 10 years and are unsecured. The interest rate on each borrowing can be fixed or floating and is based upon the market rate at the borrowing date. This agreement contains customary events of default and covenants related to limitations on indebtedness and the maintenance of certain financial ratios. At October 31, 2014, there was $53,333 outstanding under this facility, compared to $63,889 at October 31, 2013. The fixed rate was 2.21 percent at October 31, 2014. We were in compliance with all covenants at October 31, 2014, and the amount we could borrow would not have been limited by any debt covenants.
In 2012, we entered into a Note Purchase Agreement with a group of insurance companies under which we sold $200,000 of Senior Notes. The notes mature between July 2017 and July 2025 and bear interest at fixed rates between 2.27 percent and 3.13 percent. We were in compliance with all covenants at October 31, 2014.
In 2013, we entered into a €100,000 agreement with The Bank of Tokyo-Mitsubishi UFJ, Ltd. The term of the agreement is three years and can be extended by one year at the end of the third and fourth anniversaries. The
30
Table of Contents
interest rate is variable based upon the EUR LIBOR rate and was 0.95 percent at October 31, 2014. At October 31, 2014, there was €50,500 $(63,244) outstanding under this agreement, compared to €95,000 $(129,058) at October 31, 2013. We were in compliance with all covenants at October 31, 2014.
See Note 9 for additional information.
(2) See Note 10 for additional information.
(3) In 2014, we entered into a 364-day $100,000 unsecured credit facility with PNC Bank. We borrowed $100,000 under this facility to partially fund the Avalon acquisition. No additional borrowings can be made under this agreement, and any future repayments will reduce the maximum amount by the amount of the repayment. The interest rate for borrowings under this facility was 0.95 percent at October 31, 2014. We were in compliance with all covenants at October 31, 2014.
See Note 8 for additional information.
(4) Pension and postretirement plan funding amounts after 2015 will be determined based on the future funded status of the plans and therefore cannot be estimated at this time. See Note 6 for additional information.
(5) Purchase obligations primarily represent commitments for materials used in our manufacturing processes that are not recorded in our Consolidated Balance Sheet.
We believe that the combination of present capital resources, internally generated funds and unused financing sources are more than adequate to meet cash requirements for 2015. There are no significant restrictions limiting the transfer of funds from international subsidiaries to the parent company.
Outlook
Our operating performance, balance sheet position, and financial ratios for 2014 remained strong relative to 2013 and recent years, although uncertainties persisted in global financial markets and the general economic environment. Going forward, we are well-positioned to manage our liquidity needs that arise from working capital requirements, capital expenditures, contributions related to pension and postretirement obligations, and principal and interest payments on indebtedness. Primary sources of capital to meet these needs as well as other opportunistic investments are cash provided by operations and borrowings under our loan agreements. In 2014, cash from operations was 17 percent of revenue. With respect to borrowing under existing loan agreements, as of October 31, 2014, we had $124,758 available capacity under our five-year term, $500,000 unsecured, multicurrency credit facility. In addition, we had $121,666 borrowing capacity remaining on our $175,000 three-year Private Shelf agreement with New York Life Investment Management LLC. While these facilities provide the contractual terms for any borrowing, we cannot be assured that these facilities would be available in the event that these financial institutions failed to remain sufficiently capitalized.
Other loan agreements exist with no remaining borrowing capacity, but factor into debt covenant calculations that affect future borrowing capacity. On July 26, 2012, we entered into a note purchase agreement with a group of insurance companies under which we sold $200,000 of senior notes. The notes mature between July 2017 and July 2025 and bear interest at fixed rates between 2.27 percent and 3.13 percent. As of October 31, 2014, we owe €50,500 on a €100,000 three-year term loan facility entered into on August 30, 2013, with the Bank of Tokyo Mitsubishi UFJ, Ltd. This loan facility bears interest at variable margin rates of 0.75 percent to 1.625 percent above EUR LIBOR. As of August 6, 2014, we entered into a $100,000 364-day term loan facility with PNC Bank, National Association. Rate on this loan is 75 basis points over LIBOR.
Respective to all of these loans are two primary covenants, the leverage ratio that restricts indebtedness (net of cash) to a maximum 3.50 times consolidated four-quarter trailing EBITDA and the interest coverage ratio that requires four-quarter trailing EBITDA to be at minimum 2.75 times consolidated trailing four-quarter interest expense. (Debt, EBITDA, and interest expense are as defined in respective credit agreements.) With respect to these two primary covenants as of October 31, 2014, we were approximately 47 percent of the most restrictive leverage ratio and approximately nine times the most restrictive interest coverage ratio. Unused borrowing capacity under existing loan agreements would amount to an additional 15 percent of the most restrictive leverage ratio.
31
Table of Contents
Regarding expectations for 2015, we are optimistic about the growth opportunities in the diverse consumer durable, non-durable, medical, electronics and industrial end markets we serve. However, we move forward with caution given slower growth in emerging markets, economists’ expectations for global GDP indicating a low-growth macroeconomic environment and marketplace effects of political instability in certain areas of the world. Though the pace of improvement in the global economy remains somewhat unclear, our growth potential has been demonstrated over time from our capacity to build and enhance our core by entering emerging markets and pursuing market adjacencies. We drive value for our customers through our application expertise, differentiated technology, and direct sales and service support. Our priorities also focus on operational improvements by employing continuous improvement methodologies to our business processes. We expect these efforts will continue to provide more than sufficient cash from operations for meeting our liquidity needs and paying dividends to common shareholders, as well as enabling us to invest in the development of new applications and markets for our technologies and pursue strategic acquisition opportunities. For 2009 — 2014, excluding voluntary contributions to US defined benefit plans in 2010, cash from operations have been 17 to 21 percent of revenues, resulting in more than sufficient cash for our ordinary business requirements. Our available borrowing capacity will enable us to make opportunistic investments in our own common shares and strategic business combinations.
With respect to contractual spending, the table above presents our financial obligations as $989,631 of which $223,865 is payable in 2015. Effective December 16, 2014, we have in place a share repurchase program approved by the board of directors, authorizing management at its discretion to repurchase shares up to $300,000.
This new authorization continues a succession of share repurchase programs authorized since 2011. The repurchase program is funded using cash from operations and proceeds from borrowings under our credit facilities. Timing and actual number of shares subject to repurchase are contingent on a number of factors including levels of cash generation from operations, cash requirements for acquisitions, repayment of debt and our share price. Capital expenditures for 2015 will be focused on continued investments in our information systems, completing a new facility in Colorado supporting our fluid management product lines and projects that improve both capacity and efficiency of manufacturing and distribution operations.
Effects of Foreign Currency
The impact of changes in foreign currency exchange rates on sales and operating results cannot be precisely measured due to fluctuating selling prices, sales volume, product mix and cost structures in each country where we operate. As a general rule, a weakening of the United States dollar relative to foreign currencies has a favorable effect on sales and net income, while a strengthening of the dollar has a detrimental effect.
In 2014, as compared with 2013, the United States dollar was generally stronger against foreign currencies. If 2013 exchange rates had been in effect during 2014, sales would have been approximately $7,002 higher and third-party costs would have been approximately $1,845 higher. In 2013, as compared with 2012, the United States dollar was generally stronger against foreign currencies. If 2012 exchange rates had been in effect during 2013, sales would have been approximately $15,052 higher and third-party costs would have been approximately $7,035 higher. These effects on reported sales do not include the impact of local price adjustments made in response to changes in currency exchange rates.
Inflation
Inflation affects profit margins as the ability to pass cost increases on to customers is restricted by the need for competitive pricing. Although inflation has been modest in recent years and has had no material effect on the years covered by these financial statements, we continue to seek ways to minimize the impact of inflation through focused efforts to increase productivity.
Trends
The Five-Year Summary in Item 6 documents our historical financial trends. Over this period, the world’s economic conditions fluctuated significantly. Our solid performance is attributed to our participation in diverse geographic and industrial markets and our long-term commitment to develop and provide quality products and worldwide service to meet our customers’ changing needs.
32
Table of Contents
Safe Harbor Statements Under the Private Securities Litigation Reform Act of 1995
This Form 10-K, particularly “Management’s Discussion and Analysis,” contains forward-looking statements within the meaning of the Securities Act of 1933, as amended, the Securities Exchange Act of 1934, as amended, and the Private Securities Litigation Reform Act of 1995. Such statements relate to, among other things, income, earnings, cash flows, changes in operations, operating improvements, businesses in which we operate and the United States and global economies. Statements in this 10-K that are not historical are hereby identified as “forward-looking statements” and may be indicated by words or phrases such as “anticipates,” “supports,” “plans,” “projects,” “expects,” “believes,” “should,” “would,” “could,” “hope,” “forecast,” “management is of the opinion,” use of the future tense and similar words or phrases.
In light of these risks and uncertainties, actual events and results may vary significantly from those included in or contemplated or implied by such statements. Readers are cautioned not to place undue reliance on such forward-looking statements. These forward-looking statements speak only as of the date made. We undertake no obligation to publicly update or revise any forward-looking statements, whether as a result of new information, future events or otherwise, except as required by law. Factors that could cause our actual results to differ materially from the expected results are discussed in Item 1A, Risk Factors.
| Item 7A. | Quantitative and Qualitative Disclosures About Market Risk |
We operate internationally and enter into intercompany transactions denominated in foreign currencies. Consequently, we are subject to market risk arising from exchange rate movements between the dates foreign currencies are recorded and the dates they are settled. We regularly use foreign exchange contracts to reduce our risks related to most of these transactions. These contracts, primarily associated with the euro, yen and pound sterling, typically have maturities of 90 days or less, and generally require the exchange of foreign currencies for United States dollars at rates stated in the contracts. Gains and losses from changes in the market value of these contracts offset foreign exchange losses and gains, respectively, on the underlying transactions. Other transactions denominated in foreign currencies are designated as hedges of our net investments in foreign subsidiaries or are intercompany transactions of a long-term investment nature. As a result of the use of foreign exchange contracts on a routine basis to reduce the risks related to most of our transactions denominated in foreign currencies, as of October 31, 2014, we did not have material foreign currency exposure.
Note 12 to the financial statements contains additional information about our foreign currency transactions and the methods and assumptions used to record these transactions.
A portion of our operations is financed with short-term and long-term borrowings and is subject to market risk arising from changes in interest rates.
33
Table of Contents
The tables that follow present principal repayments and weighted-average interest rates on outstanding borrowings of fixed-rate debt.
At October 31, 2014
| 2015 | 2016 | 2017 | 2018 | 2019 | Thereafter | Total Value |
Fair Value |
|||||||||||||||||||||||||
| Annual repayments of long-term debt |
$ | 10,751 | $ | 10,798 | $ | 38,101 | $ | 26,586 | $ | 21,591 | $ | 147,306 | $ | 255,133 | $ | 257,654 | ||||||||||||||||
| Average interest rate on total borrowings outstanding during the year |
2.8 | % | 2.8 | % | 2.8 | % | 2.9 | % | 3.0 | % | 3.0 | % | 2.8 | % | ||||||||||||||||||
At October 31, 2013
| 2014 | 2015 | 2016 | 2017 | 2018 | Thereafter | Total Value |
Fair Value |
|||||||||||||||||||||||||
| Annual repayments of long-term debt |
$ | 10,832 | $ | 10,757 | $ | 10,763 | $ | 38,095 | $ | 26,587 | $ | 168,897 | $ | 265,931 | $ | 253,845 | ||||||||||||||||
| Average interest rate on total borrowings outstanding during the year |
2.8 | % | 2.8 | % | 2.8 | % | 2.8 | % | 2.9 | % | 3.0 | % | 2.8 | % | ||||||||||||||||||
We also have variable-rate notes payable and long-term debt. The weighted average interest rate of this debt was 1.1 percent at October 31, 2014 and 1.0 percent at October 31, 2013. A one percent increase in interest rates would have resulted in additional interest expense of approximately $4,201 on the variable rate notes payable and long-term debt in 2014.
34
Table of Contents
| Item 8. | Financial Statements and Supplementary Data |
Consolidated Statements of Income
| Years ended October 31, 2014, 2013 and 2012 | 2014 | 2013 | 2012 | |||||||||
| (In thousands except for per-share amounts) |
||||||||||||
| Sales |
$ | 1,704,021 | $ | 1,542,921 | $ | 1,409,578 | ||||||
| Operating costs and expenses: |
||||||||||||
| Cost of sales |
758,923 | 676,777 | 586,289 | |||||||||
| Selling and administrative expenses |
577,993 | 542,295 | 487,809 | |||||||||
|
|
|
|
|
|
|
|||||||
| 1,336,916 | 1,219,072 | 1,074,098 | ||||||||||
|
|
|
|
|
|
|
|||||||
| Operating profit |
367,105 | 323,849 | 335,480 | |||||||||
| Other income (expense): |
||||||||||||
| Interest expense |
(15,035 | ) | (14,841 | ) | (11,153 | ) | ||||||
| Interest and investment income |
581 | 421 | 463 | |||||||||
| Other — net |
(138 | ) | 1,694 | 1,463 | ||||||||
|
|
|
|
|
|
|
|||||||
| (14,592 | ) | (12,726 | ) | (9,227 | ) | |||||||
|
|
|
|
|
|
|
|||||||
| Income before income taxes |
352,513 | 311,123 | 326,253 | |||||||||
| Income tax provision: |
||||||||||||
| Current |
102,251 | 84,184 | 91,596 | |||||||||
| Deferred |
3,489 | 5,122 | 9,828 | |||||||||
|
|
|
|
|
|
|
|||||||
| 105,740 | 89,306 | 101,424 | ||||||||||
|
|
|
|
|
|
|
|||||||
| Net income |
$ | 246,773 | $ | 221,817 | $ | 224,829 | ||||||
|
|
|
|
|
|
|
|||||||
| Average common shares |
63,656 | 64,214 | 64,407 | |||||||||
| Incremental common shares attributable to outstanding stock options, restricted stock and deferred stock-based compensation |
625 | 694 | 696 | |||||||||
|
|
|
|
|
|
|
|||||||
| Average common shares and common share equivalents |
64,281 | 64,908 | 65,103 | |||||||||
|
|
|
|
|
|
|
|||||||
| Basic earnings per share |
$ | 3.88 | $ | 3.45 | $ | 3.49 | ||||||
| Diluted earnings per share |
$ | 3.84 | $ | 3.42 | $ | 3.45 | ||||||
| Dividends declared per common share |
$ | 0.76 | $ | 0.63 | $ | 0.525 | ||||||
The accompanying notes are an integral part of the consolidated financial statements.
35
Table of Contents
Consolidated Statements of Comprehensive Income
| Years ended October 31, 2014, 2013 and 2012 | 2014 | 2013 | 2012 | |||||||||
| (In thousands) | ||||||||||||
| Net income |
$ | 246,773 | $ | 221,817 | $ | 224,829 | ||||||
| Components of other comprehensive income (loss), net of tax: |
||||||||||||
| Translation adjustments |
(23,972 | ) | 465 | (10,806 | ) | |||||||
| Pension and postretirement benefit plans: |
||||||||||||
| Prior service (cost) credit arising during the year |
175 | (1,050 | ) | 2,142 | ||||||||
| Net actuarial gain (loss) arising during the year |
(29,158 | ) | 38,149 | (23,829 | ) | |||||||
| Amortization of prior service cost |
(251 | ) | (375 | ) | (183 | ) | ||||||
| Amortization of actuarial loss |
6,989 | 9,657 | 7,899 | |||||||||
| Settlement loss recognized |
398 | — | 563 | |||||||||
|
|
|
|
|
|
|
|||||||
| Total pension and postretirement benefit plans |
(21,847 | ) | 46,381 | (13,408 | ) | |||||||
|
|
|
|
|
|
|
|||||||
| Total other comprehensive income (loss) |
(45,819 | ) | 46,846 | (24,214 | ) | |||||||
|
|
|
|
|
|
|
|||||||
| Total comprehensive income |
$ | 200,954 | $ | 268,663 | $ | 200,615 | ||||||
|
|
|
|
|
|
|
|||||||
The accompanying notes are an integral part of the consolidated financial statements.
36
Table of Contents
| October 31, 2014 and 2013 | 2014 | 2013 | ||||||
| (In thousands) | ||||||||
| Assets |
||||||||
| Current assets: |
||||||||
| Cash and cash equivalents |
$ | 42,314 | $ | 42,375 | ||||
| Receivables — net |
365,844 | 308,707 | ||||||
| Inventories — net |
210,871 | 198,401 | ||||||
| Deferred income taxes |
29,926 | 30,850 | ||||||
| Prepaid expenses |
23,728 | 21,733 | ||||||
|
|
|
|
|
|||||
| Total current assets |
672,683 | 602,066 | ||||||
| Property, plant and equipment — net |
224,439 | 200,979 | ||||||
| Goodwill |
1,052,537 | 939,211 | ||||||
| Intangible assets — net |
291,310 | 269,073 | ||||||
| Deferred income taxes |
6,559 | 9,394 | ||||||
| Other assets |
32,602 | 32,456 | ||||||
|
|
|
|
|
|||||
| $ | 2,280,130 | $ | 2,053,179 | |||||
|
|
|
|
|
|||||
| Liabilities and shareholders’ equity |
||||||||
| Current liabilities: |
||||||||
| Notes payable |
$ | 106,181 | $ | 3,604 | ||||
| Accounts payable |
68,500 | 62,123 | ||||||
| Income taxes payable |
16,586 | 14,522 | ||||||
| Accrued liabilities |
137,001 | 110,528 | ||||||
| Customer advance payments |
25,578 | 28,341 | ||||||
| Current maturities of long-term debt |
10,751 | 10,832 | ||||||
| Deferred income taxes |
1,163 | 1,326 | ||||||
| Current obligations under capital leases |
5,108 | 5,521 | ||||||
|
|
|
|
|
|||||
| Total current liabilities |
370,868 | 236,797 | ||||||
| Long-term debt |
682,868 | 638,158 | ||||||
| Obligations under capital leases |
11,018 | 10,112 | ||||||
| Pension obligations |
124,082 | 103,754 | ||||||
| Postretirement obligations |
68,300 | 59,794 | ||||||
| Deferred income taxes |
87,092 | 89,541 | ||||||
| Other liabilities |
31,105 | 27,160 | ||||||
| Shareholders’ equity: |
||||||||
| Preferred shares, no par value; 10,000 shares authorized; none issued |
— | — | ||||||
| Common shares, no par value; 160,000 shares authorized; 98,023 shares issued at October 31, 2014 and 2013 |
12,253 | 12,253 | ||||||
| Capital in excess of stated value |
328,605 | 304,549 | ||||||
| Retained earnings |
1,560,966 | 1,362,584 | ||||||
| Accumulated other comprehensive loss |
(103,199 | ) | (57,380 | ) | ||||
| Common shares in treasury, at cost |
(893,828 | ) | (734,143 | ) | ||||
|
|
|
|
|
|||||
| Total shareholders’ equity |
904,797 | 887,863 | ||||||
|
|
|
|
|
|||||
| $ | 2,280,130 | $ | 2,053,179 | |||||
|
|
|
|
|
|||||
The accompanying notes are an integral part of the consolidated financial statements.
37
Table of Contents
Consolidated Statements of Shareholders’ Equity
| Years ended October 31, 2014, 2013 and 2012 | 2014 | 2013 | 2012 | |||||||||
| (In thousands) | ||||||||||||
| Number of common shares in treasury |
||||||||||||
| Balance at beginning of year |
33,805 | 33,766 | 32,422 | |||||||||
| Shares issued under company stock and employee benefit plans |
(480 | ) | (468 | ) | (571 | ) | ||||||
| Purchase of treasury shares |
2,263 | 507 | 1,915 | |||||||||
|
|
|
|
|
|
|
|||||||
| Balance at end of year |
35,588 | 33,805 | 33,766 | |||||||||
|
|
|
|
|
|
|
|||||||
| Common shares |
||||||||||||
| Balance at beginning and ending of year |
$ | 12,253 | $ | 12,253 | $ | 12,253 | ||||||
|
|
|
|
|
|
|
|||||||
| Capital in excess of stated value |
||||||||||||
| Balance at beginning of year |
$ | 304,549 | $ | 287,581 | $ | 272,928 | ||||||
| Shares issued under company stock and employee benefit plans |
264 | (325 | ) | (504 | ) | |||||||
| Tax benefit from stock option and restricted stock transactions |
6,385 | 5,531 | 4,792 | |||||||||
| Stock-based compensation |
17,407 | 11,762 | 10,365 | |||||||||
|
|
|
|
|
|
|
|||||||
| Balance at end of year |
$ | 328,605 | $ | 304,549 | $ | 287,581 | ||||||
|
|
|
|
|
|
|
|||||||
| Retained earnings |
||||||||||||
| Balance at beginning of year |
$ | 1,362,584 | $ | 1,181,245 | $ | 990,221 | ||||||
| Net income |
246,773 | 221,817 | 224,829 | |||||||||
| Dividends paid ($.76 per share in 2014, $.63 per share in 2013, and $.525 per share in 2012) |
(48,391 | ) | (40,478 | ) | (33,805 | ) | ||||||
|
|
|
|
|
|
|
|||||||
| Balance at end of year |
$ | 1,560,966 | $ | 1,362,584 | $ | 1,181,245 | ||||||
|
|
|
|
|
|
|
|||||||
| Accumulated other comprehensive income (loss) |
||||||||||||
| Balance at beginning of year |
$ | (57,380 | ) | $ | (104,226 | ) | $ | (80,012 | ) | |||
| Translation adjustments |
(23,972 | ) | 465 | (10,806 | ) | |||||||
| Settlement loss recognized, net of tax of $(234) in 2014 and $(331) in 2012 |
398 | — | 563 | |||||||||
| Net prior service cost arising during the year, net of tax of $125 in 2014, $840 in 2013 and $(1,078) in 2012 |
(76 | ) | (1,425 | ) | 1,959 | |||||||
| Net actuarial gain (loss) arising during the year, net of tax of $11,457 in 2014, $(28,644) in 2013 and $7,791 in 2012 |
(22,169 | ) | 47,806 | (15,930 | ) | |||||||
|
|
|
|
|
|
|
|||||||
| Balance at end of year |
$ | (103,199 | ) | $ | (57,380 | ) | $ | (104,226 | ) | |||
|
|
|
|
|
|
|
|||||||
| Common shares in treasury, at cost |
||||||||||||
| Balance at beginning of year |
$ | (734,143 | ) | $ | (707,083 | ) | $ | (624,067 | ) | |||
| Shares issued under company stock and employee benefit plans |
6,749 | 6,490 | 7,762 | |||||||||
| Purchase of treasury shares |
(166,434 | ) | (33,550 | ) | (90,778 | ) | ||||||
|
|
|
|
|
|
|
|||||||
| Balance at end of year |
$ | (893,828 | ) | $ | (734,143 | ) | $ | (707,083 | ) | |||
|
|
|
|
|
|
|
|||||||
| Total shareholders’ equity |
$ | 904,797 | $ | 887,863 | $ | 669,770 | ||||||
|
|
|
|
|
|
|
|||||||
The accompanying notes are an integral part of the consolidated financial statements.
38
Table of Contents
Consolidated Statements of Cash Flows
| Years ended October 31, 2014, 2013 and 2012 | 2014 | 2013 | 2012 | |||||||||
| (In thousands) | ||||||||||||
| Cash flows from operating activities: |
||||||||||||
| Net income |
$ | 246,773 | $ | 221,817 | $ | 224,829 | ||||||
| Adjustments to reconcile net income to net cash provided by operating activities: |
||||||||||||
| Depreciation |
34,446 | 31,766 | 24,469 | |||||||||
| Amortization |
25,308 | 22,672 | 14,521 | |||||||||
| Provision for losses on receivables |
867 | 889 | 710 | |||||||||
| Deferred income taxes |
3,489 | 5,122 | 9,828 | |||||||||
| Tax benefit from the exercise of stock options |
(6,385 | ) | (5,531 | ) | (4,792 | ) | ||||||
| Non-cash stock compensation |
17,407 | 11,762 | 10,365 | |||||||||
| (Gain)/loss on sale of property, plant and equipment |
218 | (1,879 | ) | (638 | ) | |||||||
| Other non-cash |
406 | 760 | (401 | ) | ||||||||
| Changes in operating assets and liabilities: |
||||||||||||
| Receivables |
(65,692 | ) | 19,971 | (49,595 | ) | |||||||
| Inventories |
(8,699 | ) | (10,741 | ) | 171 | |||||||
| Prepaid expenses |
(1,852 | ) | (75 | ) | (1,201 | ) | ||||||
| Other noncurrent assets |
(232 | ) | (5,898 | ) | (1,290 | ) | ||||||
| Accounts payable |
6,906 | (2,549 | ) | 4,882 | ||||||||
| Income taxes payable |
9,524 | (8,552 | ) | 18,855 | ||||||||
| Accrued liabilities |
27,932 | (19,130 | ) | 12,923 | ||||||||
| Customer advance payments |
(2,103 | ) | (839 | ) | 2,124 | |||||||
| Other noncurrent liabilities |
59 | 7,195 | 12,156 | |||||||||
| Other |
(217 | ) | 1,616 | (3,518 | ) | |||||||
|
|
|
|
|
|
|
|||||||
| Net cash provided by operating activities |
288,155 | 268,376 | 274,398 | |||||||||
| Cash flows from investing activities: |
||||||||||||
| Additions to property, plant and equipment |
(43,574 | ) | (47,219 | ) | (30,959 | ) | ||||||
| Proceeds from sale of property, plant and equipment |
323 | 3,847 | 6,120 | |||||||||
| Proceeds from sale of product lines |
— | — | 2,213 | |||||||||
| Acquisition of businesses, net of cash acquired |
(186,420 | ) | (176,333 | ) | (443,864 | ) | ||||||
| Investment in equity affiliate |
(854 | ) | (1,116 | ) | — | |||||||
| Proceeds from sale of (purchases of) marketable securities |
— | 276 | (279 | ) | ||||||||
|
|
|
|
|
|
|
|||||||
| Net cash used in investing activities |
(230,525 | ) | (220,545 | ) | (466,769 | ) | ||||||
| Cash flows from financing activities: |
||||||||||||
| Proceeds from short-term borrowings |
108,679 | 5,036 | 250,001 | |||||||||
| Repayment of short-term borrowings |
(6,093 | ) | (51,505 | ) | (200,033 | ) | ||||||
| Proceeds from long-term debt |
158,828 | 270,283 | 401,175 | |||||||||
| Repayment of long-term debt |
(107,591 | ) | (208,067 | ) | (136,589 | ) | ||||||
| Repayment of capital lease obligations |
(5,854 | ) | (5,842 | ) | (5,203 | ) | ||||||
| Issuance of common shares |
7,013 | 6,018 | 4,934 | |||||||||
| Purchase of treasury shares |
(166,434 | ) | (33,402 | ) | (88,455 | ) | ||||||
| Tax benefit from the exercise of stock options |
6,385 | 5,531 | 4,792 | |||||||||
| Dividends paid |
(48,391 | ) | (40,478 | ) | (33,805 | ) | ||||||
|
|
|
|
|
|
|
|||||||
| Net cash provided by (used in) financing activities |
(53,458 | ) | (52,426 | ) | 196,817 | |||||||
| Effect of exchange rate changes on cash |
(4,233 | ) | 5,731 | (615 | ) | |||||||
|
|
|
|
|
|
|
|||||||
| Increase (decrease) in cash and cash equivalents |
(61 | ) | 1,136 | 3,831 | ||||||||
| Cash and cash equivalents at beginning of year |
42,375 | 41,239 | 37,408 | |||||||||
|
|
|
|
|
|
|
|||||||
| Cash and cash equivalents at end of year |
$ | 42,314 | $ | 42,375 | $ | 41,239 | ||||||
|
|
|
|
|
|
|
|||||||
The accompanying notes are an integral part of the consolidated financial statements.
39
Table of Contents
Notes to Consolidated Financial Statements
NOTE REGARDING AMOUNTS AND FISCAL YEAR REFERENCES
In this annual report, all amounts related to United States dollars and foreign currency and to the number of Nordson Corporation’s common shares, except for per share earnings and dividend amounts, are expressed in thousands. Unless the context otherwise indicates, all references to “we” or the “Company” mean Nordson Corporation.
Unless otherwise noted, all references to years relate to our fiscal year.
Note 1 — Significant accounting policies
Consolidation — The consolidated financial statements include the accounts of Nordson Corporation and its majority-owned and controlled subsidiaries. Investments in affiliates and joint ventures in which our ownership is 50 percent or less or in which we do not have control but have the ability to exercise significant influence, are accounted for under the equity method. All significant intercompany accounts and transactions have been eliminated in consolidation.
Use of estimates — The preparation of financial statements in conformity with generally accepted accounting principles in the United States requires management to make estimates and assumptions that affect the amounts reported in the consolidated financial statements and notes. Actual amounts could differ from these estimates.
Presentation — Certain amounts for 2013 were reclassified to correct immaterial misclassifications of deferred tax assets and deferred tax liabilities. Specifically, non-current deferred tax liabilities increased $9,564, current deferred tax liabilities increased $1,326, non-current deferred tax assets increased $9,394 and current deferred tax assets increased $1,496.
Fiscal year — Our fiscal year is November 1 through October 31.
Revenue recognition — Most of our revenues are recognized upon shipment, provided that persuasive evidence of an arrangement exists, the sales price is fixed or determinable, collectibility is reasonably assured, and title and risk of loss have passed to the customer.
A relative selling price hierarchy exists for determining the selling price of deliverables in multiple deliverable arrangements. Vendor specific objective evidence (VSOE) is used, if available. Third-party evidence (TPE) is used if VSOE is not available, and best estimated selling price (BESP) is used if neither VSOE nor TPE is available. Our multiple deliverable arrangements include installation, installation supervision, training, and spare parts, which tend to be completed in a short period of time, at an insignificant cost, and utilizing skills not unique to us, therefore, are typically regarded as inconsequential or perfunctory. Revenue for undelivered items is deferred and included within accrued liabilities in the accompanying balance sheet. Revenues deferred in 2014, 2013 and 2012 were not material.
Shipping and handling costs — Amounts billed to customers for shipping and handling are recorded as revenue. Shipping and handling expenses are included in cost of sales.
Advertising costs — Advertising costs are expensed as incurred and were $10,823, $12,480 and $10,935 in 2014, 2013 and 2012, respectively.
Research and development — Research and development costs are expensed as incurred and were $47,536, $47,973 and $36,535 in 2014, 2013 and 2012, respectively.
Earnings per share — Basic earnings per share are computed based on the weighted-average number of common shares outstanding during each year, while diluted earnings per share are based on the weighted-average number of common shares and common share equivalents outstanding. Common share equivalents consist of shares issuable upon exercise of stock options computed using the treasury stock method, as well as restricted stock and deferred stock-based compensation. Options whose exercise price is higher than the average market price are excluded from the calculation of diluted earnings per share because the effect would be anti-dilutive. Options for 69 common shares were excluded from the diluted earnings per share calculation in 2014 because their effect would have been anti-dilutive. No options for common shares were excluded from the 2013 diluted earnings per
40
Table of Contents
Notes to Consolidated Financial Statements — (Continued)
share calculation, and options for 75 common shares were excluded from the diluted earnings per share calculation in 2012. Under the 2012 Stock Incentive and Award Plan, executive officers and selected other key employees receive common share awards based on corporate performance measures over three-year performance periods. Awards for which performance measures have not been met were excluded from the calculation of diluted earnings per share.
Cash and cash equivalents — Highly liquid instruments with maturities of 90 days or less at date of purchase are considered to be cash equivalents. Cash and cash equivalents are carried at cost, which approximates fair value.
Allowance for doubtful accounts — An allowance for doubtful accounts is maintained for estimated losses resulting from the inability of customers to make required payments. The amount of the allowance is determined principally on the basis of past collection experience and known factors regarding specific customers. Accounts are written off against the allowance when it becomes evident that collection will not occur.
Inventories — Inventories are valued at the lower of cost or market. Cost was determined using the last-in, first-out (LIFO) method for 21 percent of consolidated inventories at October 31, 2014, and October 31, 2013. The first-in, first-out (FIFO) method is used for all other inventories. Consolidated inventories would have been $7,496 and $6,797 higher than reported at October 31, 2014 and October 31, 2013, respectively, had the FIFO method, which approximates current cost, been used for valuation of all inventories.
Property, plant and equipment and depreciation — Property, plant and equipment are carried at cost. Additions and improvements that extend the lives of assets are capitalized, while expenditures for repairs and maintenance are expensed as incurred. Plant and equipment are depreciated for financial reporting purposes using the straight-line method over the estimated useful lives of the assets or, in the case of property under capital leases, over the terms of the leases. Leasehold improvements are depreciated over the shorter of the lease term or their useful lives. Useful lives are as follows:
| Land improvements |
15-25 years | |||
| Buildings |
20-40 years | |||
| Machinery and equipment |
3-18 years | |||
| Enterprise management systems |
5-13 years |
Depreciation expense is included in cost of sales and selling and administrative expenses.
Internal use software costs are expensed or capitalized depending on whether they are incurred in the preliminary project stage, application development stage or the post-implementation stage. Amounts capitalized are amortized over the estimated useful lives of the software beginning with the project’s completion. All reengineering costs are expensed as incurred. Interest costs on significant capital projects are capitalized. No interest was capitalized in 2014, 2013 or 2012.
Goodwill and intangible assets — Goodwill is the excess of cost of an acquired entity over the amounts assigned to assets acquired and liabilities assumed in a business combination. Goodwill relates to and is assigned directly to specific reporting units. Goodwill is not amortized but is subject to annual impairment testing. Our annual impairment testing is performed as of August 1. Testing is done more frequently if an event occurs or circumstances change that would indicate the fair value of a reporting unit is less than the carrying amount of those assets.
Other amortizable intangible assets, which consist primarily of patent/technology costs, customer relationships, noncompete agreements, and trade names, are amortized over their useful lives on a straight-line basis. At October 31, 2014, the weighted-average useful lives for each major category of amortizable intangible assets were:
| Patent/technology costs |
14 years | |||
| Customer relationships |
14 years | |||
| Noncompete agreements |
3 years | |||
| Trade names |
16 years |
41
Table of Contents
Notes to Consolidated Financial Statements — (Continued)
Foreign currency translation — The financial statements of subsidiaries outside the United States are generally measured using the local currency as the functional currency. Assets and liabilities of these subsidiaries are translated at the rates of exchange at the balance sheet dates. Income and expense items are translated at average monthly rates of exchange. The resulting translation adjustments are included in accumulated other comprehensive income (loss), a separate component of shareholders’ equity. Generally, gains and losses from foreign currency transactions, including forward contracts, of these subsidiaries and the United States parent are included in net income. Gains and losses from intercompany foreign currency transactions of a long-term investment nature are included in accumulated other comprehensive income (loss).
Accumulated other comprehensive loss — Accumulated other comprehensive loss at October 31, 2014 and 2013 consisted of:
| Cumulative | Pension and | Accumulated | ||||||||||
| translation | postretirement benefit | other comprehensive | ||||||||||
| adjustments | plan adjustments | loss | ||||||||||
| Balance at October 31, 2013 |
$ | 26,699 | $ | (84,079 | ) | $ | (57,380 | ) | ||||
| Pension and postretirement plan changes, net of tax of $(11,348) |
— | (21,847 | ) | (21,847 | ) | |||||||
| Current period charge |
(23,972 | ) | — | (23,972 | ) | |||||||
|
|
|
|
|
|
|
|||||||
| Balance at October 31, 2014 |
$ | 2,727 | $ | (105,926 | ) | $ | (103,199 | ) | ||||
|
|
|
|
|
|
|
|||||||
Warranties — We offer warranties to our customers depending on the specific product and terms of the customer purchase agreement. A typical warranty program requires that we repair or replace defective products within a specified time period (generally one year) measured from the date of delivery or first use. We record an estimate for future warranty-related costs based on actual historical return rates. Based on analysis of return rates and other factors, the adequacy of our warranty provisions are adjusted as necessary. The liability for warranty costs is included in accrued liabilities in the Consolidated Balance Sheet.
Following is a reconciliation of the product warranty liability for 2014 and 2013:
| 2014 | 2013 | |||||||
| Balance at beginning of year |
$ | 9,409 | $ | 8,929 | ||||
| Accruals for warranties |
10,813 | 7,891 | ||||||
| Warranty assumed from acquisitions |
— | 947 | ||||||
| Warranty payments |
(10,012 | ) | (8,356 | ) | ||||
| Currency adjustments |
(292 | ) | (2 | ) | ||||
|
|
|
|
|
|||||
| Balance at end of year |
$ | 9,918 | $ | 9,409 | ||||
|
|
|
|
|
|||||
Note 2 — Recently issued accounting standards
In July 2013, the Financial Accounting Standards Board (FASB) issued an Accounting Standards Update (ASU) which requires the netting of unrecognized tax benefits against a deferred tax asset for a loss or other carry forward that would apply in settlement of uncertain tax positions. Under the new standard, unrecognized tax benefits will be netted against all available same-jurisdiction loss or other tax carry forwards that would be utilized, rather than only against carry forwards that are created by the unrecognized tax benefits. The new guidance is effective prospectively to all existing unrecognized tax benefits, but entities can choose to apply it retrospectively. The guidance will be effective for us in our first quarter of 2015, with early adoption permitted. We do not believe the adoption of this ASU will have a material effect on our consolidated financial statements.
In May 2014, the FASB issued a new standard regarding revenue recognition. Under this standard, a company recognizes revenue when it transfers promised goods or services to customers in an amount that reflects the
42
Table of Contents
Notes to Consolidated Financial Statements — (Continued)
consideration to which the company expects to be entitled in exchange for those goods or services. The standard implements a five-step process for customer contract revenue recognition that focuses on transfer of control. It will be effective for us beginning in 2018, with early adoption not permitted. Entities can transition to the standard either retrospectively or as a cumulative-effect adjustment as of the date of adoption. We are currently assessing the impact this standard will have on our consolidated financial statements as well as the method by which we will adopt the new standard.
Note 3 — Acquisitions
Business acquisitions have been accounted for as purchases, with the acquired assets and liabilities recorded at estimated fair value on the dates of acquisition. The cost in excess of the net assets of the business acquired is included in goodwill. Operating results since the respective dates of acquisitions are included in the Consolidated Statement of Income.
2014 acquisitions
On August 8, 2014, we purchased 100 percent of the outstanding shares of Avalon Laboratories Holding Corp. (Avalon). Avalon, a leading designer and manufacturer of highly specialized catheters and medical tubing products for cardiology, pulmonology and related applications, complements our existing lines of highly engineered, single-use plastic components for fluid management in medical applications. We acquired Avalon for an aggregate purchase price of $179,966, net of cash acquired of $1,324. Based on the fair value of the assets acquired and the liabilities assumed, goodwill of $122,011 and identifiable intangible assets of $52,000 were recorded. The identifiable intangible assets consist primarily of $32,200 of customer relationships (amortized over 10 years), $9,800 of technology (amortized over 10 years) and $10,000 of tradenames (amortized over 15 years). Goodwill associated with this acquisition is not tax deductible; however there is $15,800 from a previous acquisition that is tax deductible.
On August 29, 2014, we purchased 100 percent of the outstanding shares of Dima Group B.V. (Dima), a Netherlands based manufacturer of conformal coating, dispensing and surface mount technology equipment for the global electronics assembly market. We acquired Dima for an aggregate purchase price of $6,454, net of cash acquired of $149. Based on the fair value of the assets acquired and the liabilities assumed, goodwill of $2,380 and identifiable intangible assets of $1,281 were recorded. The identifiable intangible assets consist primarily of $1,017 of customer relationships (amortized over 7 years), and $264 of tradenames (amortized over 15 years). Goodwill associated with this acquisition is not tax deductible.
Both of these acquisitions are being reported in our Advanced Technology Systems segment.
As of October 31, 2014, the purchase price allocations remain preliminary as we complete our assessments of deferred taxes and certain reserves.
2013 acquisitions
On November 8, 2012, we purchased certain assets of Kodama Chemical Industry Co., Ltd., a Japanese licensed distributor of EDI Holdings, Inc, (EDI), that we had previously acquired in 2012. This operation provides die sales to extrusion processors, web converters, and OEMs in Japan and Taiwan and carries out final manufacturing steps on new equipment to enhance die performance and accommodate local requirements. The acquisition date fair value was $1,335, which consisted of cash transferred of $1,231 and a holdback liability of $104. Based on the fair value of the assets acquired and the liabilities assumed, identifiable intangible assets of $912 were recorded. The identifiable intangible assets consist primarily of $847 of customer relationships that are being amortized over nine years and $65 of technology being amortized over nine years. This operation is being reported in our Adhesive Dispensing Systems segment.
On August 30, 2013, we purchased 100 percent of the outstanding shares of Münster, Germany based Kreyenborg Group’s Kreyenborg GmbH and BKG Bruckmann & Kreyenborg Granuliertechnik GmbH (the Kreyenborg Group). The Kreyenborg Group broadens our existing offering of screen changers, pumps and valves,
43
Table of Contents
Notes to Consolidated Financial Statements — (Continued)
critical components in the polymer processing melt stream for extrusion processes, and expands the product portfolio to include pelletizers, the key component in polymer compounding, recycling and related processes. The acquired companies employ approximately 270 people, have additional operations in Shanghai, China, Kuala Lumpur and Malaysia, and are reported in our Adhesive Dispensing Systems segment. We acquired the Kreyenborg Group for an aggregate purchase price of $169,994, net of cash acquired of $22,913 and debt assumed of $391. Based on the fair value of the assets acquired and the liabilities assumed, goodwill of $115,103 and identifiable intangible assets of $60,021 were recorded. The identifiable intangible assets consist primarily of $42,306 of customer relationships (amortized over 15 years), $15,336 of technology (amortized over 15 years) and $1,851 of tradenames related to BKG (amortized over 10 years). Goodwill associated with this acquisition is not tax deductible.
On September 27, 2013 we purchased certain assets of Nellcor Puritan Bennett Mexico, S.A. de C.V., a subsidiary of Covidien LP (Nellcor) to be used by our Value Plastics operation. The fair value on the date of acquisition was $5,500, consisting solely of cash. Based on the fair value of the assets acquired and the liabilities assumed, goodwill of $2,301, property, plant and equipment of $1,149, technology of $740 (amortized over 10 years) and customer relationships of $1,310 (amortized over 25 years) were recorded. Goodwill associated with this acquisition is not tax deductible. Value Plastics is reported in our Advanced Technology Systems segment.
2012 acquisitions
On June 14, 2012, we acquired 100 percent of the outstanding shares of EDI Holdings, Inc. (EDI), a provider of slot coating and flat polymer extrusion dies for plastic processors and web converters headquartered in Chippewa Falls, Wisconsin. EDI is being reported in our Adhesive Dispensing Systems segment.
On June 21, 2012, we acquired 100 percent of the outstanding shares of Xaloy Superior Holdings, Inc. (Xaloy), a manufacturer of melt delivery components for injection and extrusion machinery in the global plastic processing industry headquartered in New Castle, Pennsylvania. Xaloy is being reported in our Adhesive Dispensing Systems segment.
On August 1, 2012 we acquired 100 percent of the outstanding shares of Sealant Equipment & Engineering, Inc. (SEE), a manufacturer of precision dispense systems and fluid dispense valves headquartered in Plymouth, Michigan. SEE is being reported in our Industrial Coating Systems segment.
These acquisitions were not individually material, but in the aggregate they must be disclosed pursuant to the business combinations guidance. The total purchase price of these acquisitions was allocated to the underlying assets acquired and liabilities assumed based upon management’s estimated fair values at the dates of acquisition. To the extent the purchase price exceeded the estimated fair value of the net identifiable tangible and intangible assets acquired, such excess was allocated to goodwill.
Based on the fair value of the assets acquired and the liabilities assumed, goodwill of $271,501 and identifiable intangible assets of $122,216 were recorded. The intangible assets acquired consist of customer lists of $48,350, which are being amortized over a weighted average life of nine years; technology assets of $25,740 which are being amortized over a weighted average life of 15 years; trade names of $43,710 which are being amortized over a weighted average life of 15 years; and non-compete agreements of $4,416, which are being amortized over a weighted average life of two years. Goodwill of $24,058 associated with the SEE acquisition is tax deductible, and none of the goodwill associated with the EDI and Xaloy acquisitions is tax deductible. However, there is $11,000 of goodwill related to their previous acquisitions that is tax deductible.
44
Table of Contents
Notes to Consolidated Financial Statements — (Continued)
The following unaudited pro forma financial information for 2012 assumes the acquisitions above occurred as of the beginning of 2011, after giving effect to certain adjustments, including amortization of intangible assets, interest expense on acquisition debt and income tax effects. The pro forma results have been prepared for comparative purposes only and are not necessarily indicative of the results of operations which may occur in the future or that would have occurred had the acquisitions been affected on the date indicated, nor are they necessarily indicative of our future results of operations.
| Sales |
$ | 1,537,251 | ||
| Net income |
$ | 234,092 | ||
| Basic earnings per share |
$ | 3.63 | ||
| Diluted earnings per share |
$ | 3.60 |
Proforma results were adjusted to exclude $2,109 of acquisition-related expenses and $4,589 of nonrecurring expense related to the fair value adjustment to acquisition-date inventory. Proforma results included $11,713 of pretax amortization expense related to intangible assets.
45
Table of Contents
Notes to Consolidated Financial Statements — (Continued)
Note 4 — Details of balance sheet
| 2014 | 2013 | |||||||
| Receivables: |
||||||||
| Accounts |
$ | 347,259 | $ | 292,469 | ||||
| Notes |
6,339 | 9,467 | ||||||
| Other |
16,733 | 11,036 | ||||||
|
|
|
|
|
|||||
| 370,331 | 312,972 | |||||||
| Allowance for doubtful accounts |
(4,487 | ) | (4,265 | ) | ||||
|
|
|
|
|
|||||
| $ | 365,844 | $ | 308,707 | |||||
|
|
|
|
|
|||||
| Inventories: |
||||||||
| Raw materials and component parts |
$ | 86,573 | $ | 81,943 | ||||
| Work-in-process |
27,994 | 34,756 | ||||||
| Finished goods |
130,544 | 115,078 | ||||||
|
|
|
|
|
|||||
| 245,111 | 231,777 | |||||||
| Obsolescence and other reserves |
(26,744 | ) | (26,579 | ) | ||||
| LIFO reserve |
(7,496 | ) | (6,797 | ) | ||||
|
|
|
|
|
|||||
| $ | 210,871 | $ | 198,401 | |||||
|
|
|
|
|
|||||
| Property, plant and equipment: |
||||||||
| Land |
$ | 10,216 | $ | 10,383 | ||||
| Land improvements |
3,827 | 3,849 | ||||||
| Buildings |
141,880 | 127,178 | ||||||
| Machinery and equipment |
319,110 | 294,374 | ||||||
| Enterprise management system |
44,682 | 43,983 | ||||||
| Construction-in-progress |
27,419 | 21,251 | ||||||
| Leased property under capitalized leases |
27,715 | 26,838 | ||||||
|
|
|
|
|
|||||
| 574,849 | 527,856 | |||||||
| Accumulated depreciation and amortization |
(350,410 | ) | (326,877 | ) | ||||
|
|
|
|
|
|||||
| $ | 224,439 | $ | 200,979 | |||||
|
|
|
|
|
|||||
| Accrued liabilities: |
||||||||
| Salaries and other compensation |
$ | 57,722 | $ | 44,561 | ||||
| Pension and retirement |
1,738 | 720 | ||||||
| Taxes other than income taxes |
6,367 | 5,570 | ||||||
| Other |
71,174 | 59,677 | ||||||
|
|
|
|
|
|||||
| $ | 137,001 | $ | 110,528 | |||||
|
|
|
|
|
|||||
46
Table of Contents
Notes to Consolidated Financial Statements — (Continued)
Note 5 — Goodwill and intangible assets
We account for goodwill and other intangible assets in accordance with the provisions of ASC 350 and account for business combinations using the acquisition method of accounting and accordingly, the assets and liabilities of the entities acquired are recorded at their estimated fair values at the acquisition date. Goodwill is the excess of purchase price over the fair value of tangible and identifiable intangible net assets acquired in various business combinations. Goodwill is not amortized but is tested for impairment annually at the reporting unit level, or more often if indications of impairment exist. We assess the fair value of reporting units on a non-recurring basis using a combination of two valuation methods, a market approach and an income approach, to estimate the fair value of our reporting units. The implied fair value of our reporting units is determined based on significant unobservable inputs; accordingly, these inputs fall within Level 3 of the fair value hierarchy.
Our reporting units are the Adhesive Dispensing Systems segment, the Industrial Coating Systems segment and one level below the Advanced Technology Systems segment.
The goodwill impairment test is a two-step process. In the first step, performed in the fourth quarter of each year, we estimate a reporting unit’s fair value using a combination of the discounted cash flow method of the Income Approach and the guideline public company method of the Market Approach and compare the result against the reporting unit’s carrying value of net assets. If the carrying value of a reporting unit exceeds its fair value, then a second step is performed to determine if goodwill is impaired. In the second step, a hypothetical purchase price allocation of the reporting unit’s assets and liabilities is performed using the fair value calculated in step one. The difference between the fair value of the reporting unit and the hypothetical fair value of assets and liabilities is the implied goodwill amount. Impairment is recorded if the carrying value of the reporting unit’s goodwill is higher than its implied goodwill. Based upon results of step one in 2014, 2013 and 2012, the second step of the goodwill impairment test was not necessary.
We acquired Avalon on August 8, 2014 and Dima on August 29, 2014. Determination of the preliminary goodwill associated with these acquisitions was completed with the assistance of an independent valuation specialist in October 2014. Since the dates of the valuations, no events or changes in circumstances have occurred that would more likely than not reduce the fair value of these acquisitions below their carrying values.
Changes in the carrying amount of goodwill during 2014 by operating segment follow:
| Adhesive Dispensing Systems |
Advanced Technology Systems |
Industrial Coating Systems |
Total | |||||||||||||
| Balance at October 31, 2013 |
$ | 407,269 | $ | 507,884 | $ | 24,058 | $ | 939,211 | ||||||||
| Acquisitions |
— | 124,391 | — | 124,391 | ||||||||||||
| Currency effect |
(10,223 | ) | (842 | ) | — | (11,065 | ) | |||||||||
|
|
|
|
|
|
|
|
|
|||||||||
| Balance at October 31, 2014 |
$ | 397,046 | $ | 631,433 | $ | 24,058 | $ | 1,052,537 | ||||||||
|
|
|
|
|
|
|
|
|
|||||||||
Accumulated impairment losses, which were recorded in 2009, were $232,789 at October 31, 2014 and October 31, 2013. Of these losses, $229,173 related to the Advanced Technology Systems segment and $3,616 related to the Industrial Coating Systems segment.
47
Table of Contents
Notes to Consolidated Financial Statements — (Continued)
Information regarding intangible assets subject to amortization follows:
| October 31, 2014 | ||||||||||||
| Carrying Amount |
Accumulated Amortization |
Net Book Value | ||||||||||
| Customer relationships |
$ | 200,028 | $ | 41,910 | $ | 158,118 | ||||||
| Patent/technology costs |
93,799 | 27,030 | 66,769 | |||||||||
| Trade name |
77,846 | 12,173 | 65,673 | |||||||||
| Noncompete agreements |
8,220 | 7,600 | 620 | |||||||||
| Other |
1,369 | 1,239 | 130 | |||||||||
|
|
|
|
|
|
|
|||||||
| Total |
$ | 381,262 | $ | 89,952 | $ | 291,310 | ||||||
|
|
|
|
|
|
|
|||||||
| October 31, 2013 | ||||||||||||
| Carrying Amount |
Accumulated Amortization |
Net Book Value | ||||||||||
| Customer relationships |
$ | 171,489 | $ | 28,872 | $ | 142,617 | ||||||
| Patent/technology costs |
85,414 | 21,145 | 64,269 | |||||||||
| Trade name |
67,865 | 7,856 | 60,009 | |||||||||
| Noncompete agreements |
9,965 | 8,091 | 1,874 | |||||||||
| Other |
1,400 | 1,096 | 304 | |||||||||
|
|
|
|
|
|
|
|||||||
| Total |
$ | 336,133 | $ | 67,060 | $ | 269,073 | ||||||
|
|
|
|
|
|
|
|||||||
Amortization expense for 2014 and 2013 was $25,308 and $22,672, respectively.
Estimated amortization expense for each of the five succeeding years follows:
| Year |
Amounts | |||
| 2015 |
$ | 27,754 | ||
| 2016 |
$ | 27,075 | ||
| 2017 |
$ | 26,653 | ||
| 2018 |
$ | 26,366 | ||
| 2019 |
$ | 26,359 | ||
Note 6 — Retirement, pension and other postretirement plans
Retirement plans — We have funded contributory retirement plans covering certain employees. Our contributions are primarily determined by the terms of the plans, subject to the limitation that they shall not exceed the amounts deductible for income tax purposes. We also sponsor unfunded contributory supplemental retirement plans for certain employees. Generally, benefits under these plans vest gradually over a period of approximately three years from date of employment, and are based on the employee’s contribution. The expense applicable to retirement plans for 2014, 2013 and 2012 was approximately $14,423, $12,955 and $10,827, respectively.
Pension plans — We have various pension plans covering a portion of our United States and international employees. Pension plan benefits are generally based on years of employment and, for salaried employees, the level of compensation. Actuarially determined amounts are contributed to United States plans to provide sufficient assets to meet future benefit payment requirements. We also sponsor an unfunded supplemental pension plan for certain employees. International subsidiaries fund their pension plans according to local requirements.
48
Table of Contents
Notes to Consolidated Financial Statements — (Continued)
A reconciliation of the benefit obligations, plan assets, accrued benefit cost and the amount recognized in financial statements for pension plans is as follows:
| United States | International | |||||||||||||||
| 2014 | 2013 | 2014 | 2013 | |||||||||||||
| Change in benefit obligation: |
||||||||||||||||
| Benefit obligation at beginning of year |
$ | 299,716 | $ | 326,792 | $ | 85,543 | $ | 83,433 | ||||||||
| Service cost |
8,071 | 8,896 | 2,597 | 2,098 | ||||||||||||
| Interest cost |
13,921 | 12,314 | 3,185 | 2,872 | ||||||||||||
| Participant contributions |
— | — | 137 | 132 | ||||||||||||
| Plan amendments |
186 | 1,667 | (419 | ) | — | |||||||||||
| Foreign currency exchange rate change |
— | — | (5,343 | ) | (279 | ) | ||||||||||
| Actuarial (gain) loss |
34,610 | (40,996 | ) | 13,293 | (54 | ) | ||||||||||
| Benefits paid |
(11,025 | ) | (8,957 | ) | (2,162 | ) | (2,659 | ) | ||||||||
|
|
|
|
|
|
|
|
|
|||||||||
| Benefit obligation at end of year |
$ | 345,479 | $ | 299,716 | $ | 96,831 | $ | 85,543 | ||||||||
|
|
|
|
|
|
|
|
|
|||||||||
| Change in plan assets: |
||||||||||||||||
| Beginning fair value of plan assets |
$ | 243,506 | $ | 214,128 | $ | 37,078 | $ | 34,217 | ||||||||
| Actual return on plan assets |
25,535 | 20,951 | 1,627 | 2,102 | ||||||||||||
| Company contributions |
19,896 | 17,384 | 4,009 | 3,501 | ||||||||||||
| Participant contributions |
— | — | 137 | 132 | ||||||||||||
| Foreign currency exchange rate change |
— | — | (1,071 | ) | (215 | ) | ||||||||||
| Benefits paid |
(11,025 | ) | (8,957 | ) | (2,162 | ) | (2,659 | ) | ||||||||
|
|
|
|
|
|
|
|
|
|||||||||
| Ending fair value of plan assets |
$ | 277,912 | $ | 243,506 | $ | 39,618 | $ | 37,078 | ||||||||
|
|
|
|
|
|
|
|
|
|||||||||
| Funded status at end of year |
$ | (67,567 | ) | $ | (56,210 | ) | $ | (57,213 | ) | $ | (48,465 | ) | ||||
|
|
|
|
|
|
|
|
|
|||||||||
| Amounts recognized in financial statements: |
||||||||||||||||
| Noncurrent asset |
$ | — | $ | — | $ | 17 | $ | 22 | ||||||||
| Accrued benefit liability |
(709 | ) | (938 | ) | (6 | ) | (5 | ) | ||||||||
| Long-term pension and retirement obligations |
(66,858 | ) | (55,272 | ) | (57,224 | ) | (48,482 | ) | ||||||||
|
|
|
|
|
|
|
|
|
|||||||||
| Total amount recognized in financial statements |
$ | (67,567 | ) | $ | (56,210 | ) | $ | (57,213 | ) | $ | (48,465 | ) | ||||
|
|
|
|
|
|
|
|
|
|||||||||
49
Table of Contents
Notes to Consolidated Financial Statements — (Continued)
| United States | International | |||||||||||||||
| 2014 | 2013 | 2014 | 2013 | |||||||||||||
| Amounts recognized in accumulated other comprehensive (gain) loss: |
||||||||||||||||
| Net actuarial loss |
$ | 111,337 | $ | 93,537 | $ | 34,683 | $ | 24,392 | ||||||||
| Prior service cost (credit) |
(47 | ) | 4 | (995 | ) | (798 | ) | |||||||||
|
|
|
|
|
|
|
|
|
|||||||||
| Accumulated other comprehensive loss |
$ | 111,290 | $ | 93,541 | $ | 33,688 | $ | 23,594 | ||||||||
|
|
|
|
|
|
|
|
|
|||||||||
| Amounts expected to be recognized during next fiscal year: |
||||||||||||||||
| Amortization of net actuarial loss |
$ | 8,694 | $ | 8,260 | $ | 2,459 | $ | 1,531 | ||||||||
| Amortization of prior service cost (credit) |
121 | 237 | (97 | ) | (82 | ) | ||||||||||
|
|
|
|
|
|
|
|
|
|||||||||
| Total |
$ | 8,815 | $ | 8,497 | $ | 2,362 | $ | 1,449 | ||||||||
|
|
|
|
|
|
|
|
|
|||||||||
The following table summarizes the changes in accumulated other comprehensive (gain) loss:
| United States | International | |||||||||||||||
| 2014 | 2013 | 2014 | 2013 | |||||||||||||
| Balance at beginning of year |
$ | 93,541 | $ | 152,732 | $ | 23,594 | $ | 25,230 | ||||||||
| Net (gain) loss arising during the year |
26,372 | (46,707 | ) | 13,438 | (642 | ) | ||||||||||
| Prior service cost (credit) arising during the year |
186 | 1,668 | (419 | ) | — | |||||||||||
| Net gain (loss) recognized during the year |
(7,940 | ) | (13,995 | ) | (1,233 | ) | (1,406 | ) | ||||||||
| Prior service (cost) credit recognized during the year |
(237 | ) | (157 | ) | 101 | 81 | ||||||||||
| Settlement loss |
(632 | ) | — | — | — | |||||||||||
| Exchange rate effect during the year |
— | — | (1,793 | ) | 331 | |||||||||||
|
|
|
|
|
|
|
|
|
|||||||||
| Balance at end of year |
$ | 111,290 | $ | 93,541 | $ | 33,688 | $ | 23,594 | ||||||||
|
|
|
|
|
|
|
|
|
|||||||||
Information regarding the accumulated benefit obligation is as follows:
| United States | International | |||||||||||||||
| 2014 | 2013 | 2014 | 2013 | |||||||||||||
| For all plans: |
||||||||||||||||
| Accumulated benefit obligation |
$ | 336,464 | $ | 291,310 | $ | 75,305 | $ | 67,647 | ||||||||
| For plans with benefit obligations in excess of plan assets: |
||||||||||||||||
| Projected benefit obligation |
345,479 | 299,716 | 87,128 | 71,788 | ||||||||||||
| Accumulated benefit obligation |
336,464 | 291,310 | 73,135 | 59,589 | ||||||||||||
| Fair value of plan assets |
277,912 | 243,506 | 37,415 | 29,000 | ||||||||||||
50
Table of Contents
Notes to Consolidated Financial Statements — (Continued)
Net pension benefit costs include the following components:
| United States | International | |||||||||||||||||||||||
| 2014 | 2013 | 2012 | 2014 | 2013 | 2012 | |||||||||||||||||||
| Service cost |
$ | 8,071 | $ | 8,896 | $ | 7,488 | $ | 2,597 | $ | 2,098 | $ | 1,504 | ||||||||||||
| Interest cost |
13,921 | 12,314 | 12,137 | 3,185 | 2,872 | 3,002 | ||||||||||||||||||
| Expected return on plan assets |
(17,297 | ) | (15,241 | ) | (14,901 | ) | (1,772 | ) | (1,512 | ) | (1,547 | ) | ||||||||||||
| Amortization of prior service cost (credit) |
237 | 157 | 342 | (101 | ) | (81 | ) | (97 | ) | |||||||||||||||
| Amortization of net actuarial (gain) loss |
7,940 | 13,995 | 11,672 | 1,233 | 1,406 | 564 | ||||||||||||||||||
| Settlement loss |
632 | — | 682 | — | — | — | ||||||||||||||||||
|
|
|
|
|
|
|
|
|
|
|
|
|
|||||||||||||
| Total benefit cost |
$ | 13,504 | $ | 20,121 | $ | 17,420 | $ | 5,142 | $ | 4,783 | $ | 3,426 | ||||||||||||
|
|
|
|
|
|
|
|
|
|
|
|
|
|||||||||||||
Net periodic pension cost for 2014 included a settlement loss of $632 due to a lump sum retirement payment. Net periodic pension cost for 2012 included a settlement loss of $682, due to a plan termination.
The weighted average assumptions used in the valuation of pension benefits were as follows:
| United States | International | |||||||||||||||||||||||
| 2014 | 2013 | 2012 | 2014 | 2013 | 2012 | |||||||||||||||||||
| Assumptions used to determine benefit obligations at October 31: |
||||||||||||||||||||||||
| Discount rate |
4.29 | % | 4.75 | % | 3.85 | % | 2.94 | % | 3.72 | % | 3.52 | % | ||||||||||||
| Rate of compensation increase |
3.49 | 3.30 | 3.30 | 3.19 | 3.18 | 3.13 | ||||||||||||||||||
| Assumptions used to determine net benefit costs for the years ended October 31: |
||||||||||||||||||||||||
| Discount rate |
4.75 | 3.85 | 4.46 | 3.72 | 3.52 | 4.43 | ||||||||||||||||||
| Expected return on plan assets |
7.24 | 7.24 | 7.75 | 4.60 | 4.43 | 4.85 | ||||||||||||||||||
| Rate of compensation increase |
3.30 | 3.30 | 3.20 | 3.18 | 3.13 | 3.16 | ||||||||||||||||||
The amortization of prior service cost is determined using a straight-line amortization of the cost over the average remaining service period of employees expected to receive benefits under the plans.
The discount rate reflects the current rate at which pension liabilities could be effectively settled at the end of the year. The discount rate used considers a yield derived from matching projected pension payments with maturities of a portfolio of available bonds that receive the highest rating given from a recognized investments ratings agency. The decrease in the discount rate in 2014 and increase in 2013 are due to changes in yields for these types of investments as a result of the economic environment.
In determining the expected return on plan assets, we consider both historical performance and an estimate of future long-term rates of return on assets similar to those in our plans. We consult with and consider the opinions of financial and other professionals in developing appropriate return assumptions. The rate of compensation increase is based on managements’ estimates using historical experience and expected increases in rates.
The measurement of domestic pension plans’ projected benefit obligations included the effects of adopting the Society of Actuaries’ release of final RP2014 / MP2014 mortality tables. The adoption of these new tables resulted in an increase of $28,554 to our domestic pension plans’ projected benefit obligations.
51
Table of Contents
Notes to Consolidated Financial Statements — (Continued)
Economic assumptions have a significant effect on the amounts reported. The effect of a one percent change in the discount rate, expected return on assets and compensation increase is shown in the table below. Bracketed numbers represent decreases in expense and obligation amounts.
| United States | International | |||||||||||||||
| 1% Point Increase |
1% Point Decrease |
1% Point Increase |
1% Point Decrease |
|||||||||||||
| Discount rate: |
||||||||||||||||
| Effect on total service and interest cost components |
$ | (4,527 | ) | $ | 5,514 | $ | (1,235 | ) | $ | 1,561 | ||||||
| Effect on pension obligation as of October 31, 2014 |
$ | (44,353 | ) | $ | 55,900 | $ | (15,756 | ) | $ | 19,996 | ||||||
| Expected return on assets: |
||||||||||||||||
| Effect on total service and interest cost components |
$ | (2,582 | ) | $ | 2,582 | $ | (375 | ) | $ | 375 | ||||||
| Compensation increase: |
||||||||||||||||
| Effect on total service and interest cost components |
$ | 4,257 | $ | (2,490 | ) | $ | 934 | $ | (1,088 | ) | ||||||
| Effect on pension obligation as of October 31, 2014 |
$ | 21,915 | $ | (12,788 | ) | $ | 7,729 | $ | (6,999 | ) | ||||||
The allocation of pension plan assets as of October 31, 2014 and 2013 is as follows:
| United States | International | |||||||||||||||
| 2014 | 2013 | 2014 | 2013 | |||||||||||||
| Asset Category |
||||||||||||||||
| Equity securities |
23 % | 27 % | — % | — % | ||||||||||||
| Debt securities |
29 | 29 | — | — | ||||||||||||
| Insurance contracts |
— | — | 58 | 60 | ||||||||||||
| Pooled investment funds |
47 | 43 | 42 | 39 | ||||||||||||
| Other |
1 | 1 | — | 1 | ||||||||||||
|
|
|
|
|
|
|
|
|
|||||||||
| Total |
100 % | 100 % | 100 % | 100 % | ||||||||||||
|
|
|
|
|
|
|
|
|
|||||||||
Our investment objective for defined benefit plan assets is to meet the plans’ benefit obligations, while minimizing the potential for future required plan contributions.
Our United States plans comprise 88 percent of the worldwide pension assets. In general, the investment strategies focus on asset class diversification, liquidity to meet benefit payments and an appropriate balance of long-term investment return and risk. Target ranges for asset allocations are determined by dynamically matching the actuarial projections of the plans’ future liabilities and benefit payments with expected long-term rates of return on the assets, taking into account investment return volatility and correlations across asset classes. The current target in “return-seeking assets” is 45 percent and 55 percent in fixed income. Plan assets are diversified across several investment managers and are invested in liquid funds that are selected to track broad market indices. Investment risk is carefully controlled with plan assets rebalanced to target allocations on a periodic basis and continual monitoring of investment managers’ performance relative to the investment guidelines established with each investment manager.
Our international plans comprise 12 percent of the worldwide pension assets. Asset allocations are developed on a country-specific basis. Our investment strategy is to cover pension obligations with insurance contracts or to employ independent managers to invest the assets.
52
Table of Contents
Notes to Consolidated Financial Statements — (Continued)
The fair values of our pension plan assets at October 31, 2014 by asset category are in the table below:
| United States | International | |||||||||||||||||||||||||||||||
| Total | Level 1 | Level 2 | Level 3 | Total | Level 1 | Level 2 | Level 3 | |||||||||||||||||||||||||
| Cash |
$ | 1,617 | $ | 1,617 | $ | — | $ | — | $ | 8 | $ | 8 | $ | — | $ | — | ||||||||||||||||
| Money market funds |
2,820 | 2,820 | — | — | — | — | — | — | ||||||||||||||||||||||||
| Equity securities: |
||||||||||||||||||||||||||||||||
| Basic materials |
3,224 | 3,224 | — | — | — | — | — | — | ||||||||||||||||||||||||
| Consumer goods |
5,114 | 5,114 | — | — | — | — | — | — | ||||||||||||||||||||||||
| Financial |
8,036 | 8,036 | — | — | — | — | — | — | ||||||||||||||||||||||||
| Healthcare |
4,372 | 4,372 | — | — | — | — | — | — | ||||||||||||||||||||||||
| Industrial goods |
3,527 | 3,527 | — | — | — | — | — | — | ||||||||||||||||||||||||
| Technology |
4,226 | 4,226 | — | — | — | — | — | — | ||||||||||||||||||||||||
| Utilities |
1,084 | 1,084 | — | — | — | — | — | — | ||||||||||||||||||||||||
| Mutual funds |
31,255 | 31,255 | — | — | — | — | — | — | ||||||||||||||||||||||||
| Fixed income securities: |
||||||||||||||||||||||||||||||||
| U.S. Government |
26,447 | 7,877 | 18,570 | — | — | — | — | — | ||||||||||||||||||||||||
| Corporate |
50,720 | — | 50,720 | — | — | — | — | — | ||||||||||||||||||||||||
| Other |
2,486 | — | 2,486 | — | — | — | — | — | ||||||||||||||||||||||||
| Other types of investments: |
||||||||||||||||||||||||||||||||
| Insurance contracts |
— | — | — | — | 23,174 | — | — | 23,174 | ||||||||||||||||||||||||
| Real estate collective funds |
16,495 | — | — | 16,495 | — | — | — | — | ||||||||||||||||||||||||
| Pooled investment funds |
115,877 | — | 115,877 | — | 16,436 | — | 16,436 | — | ||||||||||||||||||||||||
| Other |
612 | 612 | — | — | — | — | — | — | ||||||||||||||||||||||||
|
|
|
|
|
|
|
|
|
|
|
|
|
|
|
|
|
|||||||||||||||||
| $ | 277,912 | $ | 73,764 | $ | 187,653 | $ | 16,495 | $ | 39,618 | $ | 8 | $ | 16,436 | $ | 23,174 | |||||||||||||||||
|
|
|
|
|
|
|
|
|
|
|
|
|
|
|
|
|
|||||||||||||||||
53
Table of Contents
Notes to Consolidated Financial Statements — (Continued)
The fair values of our pension plan assets at October 31, 2013 by asset category are in the table below:
| United States | International | |||||||||||||||||||||||||||||||
| Total | Level 1 | Level 2 | Level 3 | Total | Level 1 | Level 2 | Level 3 | |||||||||||||||||||||||||
| Cash |
$ | 2,811 | $ | 2,811 | $ | — | $ | — | $ | 321 | $ | 321 | $ | — | $ | — | ||||||||||||||||
| Money market funds |
2,783 | 2,783 | — | — | — | — | — | — | ||||||||||||||||||||||||
| Equity securities: |
||||||||||||||||||||||||||||||||
| Basic materials |
3,834 | 3,834 | — | — | — | — | — | — | ||||||||||||||||||||||||
| Consumer goods |
4,958 | 4,958 | — | — | — | — | — | — | ||||||||||||||||||||||||
| Financial |
7,825 | 7,825 | — | — | — | — | — | — | ||||||||||||||||||||||||
| Healthcare |
4,109 | 4,109 | — | — | — | — | — | — | ||||||||||||||||||||||||
| Industrial goods |
3,255 | 3,255 | — | — | — | — | — | — | ||||||||||||||||||||||||
| Technology |
4,159 | 4,159 | — | — | — | — | — | — | ||||||||||||||||||||||||
| Utilities |
988 | 988 | — | — | — | — | — | — | ||||||||||||||||||||||||
| Mutual funds |
32,617 | 32,617 | — | — | — | — | — | — | ||||||||||||||||||||||||
| Fixed income securities: |
||||||||||||||||||||||||||||||||
| U.S. Government |
26,892 | 10,715 | 16,177 | — | — | — | — | — | ||||||||||||||||||||||||
| Corporate |
43,367 | — | 43,367 | — | — | — | — | — | ||||||||||||||||||||||||
| Other |
1,356 | — | 1,356 | — | — | — | — | — | ||||||||||||||||||||||||
| Other types of investments: |
||||||||||||||||||||||||||||||||
| Insurance contracts |
— | — | — | — | 22,093 | — | — | 22,093 | ||||||||||||||||||||||||
| Real estate collective funds |
14,958 | — | — | 14,958 | — | — | — | — | ||||||||||||||||||||||||
| Pooled investment funds |
88,973 | — | 88,973 | — | 14,664 | — | 14,664 | — | ||||||||||||||||||||||||
| Other |
621 | 621 | — | — | — | — | — | — | ||||||||||||||||||||||||
|
|
|
|
|
|
|
|
|
|
|
|
|
|
|
|
|
|||||||||||||||||
| $ | 243,506 | $ | 78,675 | $ | 149,873 | $ | 14,958 | $ | 37,078 | $ | 321 | $ | 14,664 | $ | 22,093 | |||||||||||||||||
|
|
|
|
|
|
|
|
|
|
|
|
|
|
|
|
|
|||||||||||||||||
These investment funds did not own a significant number of shares of Nordson Corporation common stock for any year presented.
The inputs and methodology used to measure fair value of plan assets are consistent with those described in Note 12. Following are the valuation methodologies used to measure these assets:
| • | Money market funds — Money market funds are public investment vehicles that are valued with a net asset value of one dollar. This is a quoted price in an active market and is classified as Level 1. |
| • | Equity securities — Common stocks are valued at the closing price reported on the active market on which the individual securities are traded and are classified as Level 1. Mutual funds are valued at the net asset values of the shares at year-end, as determined by the closing price reported on the active market on which the individual securities are traded and are classified as Level 1. |
| • | Fixed income securities — U.S. Treasury bills reflect the closing price on the active market in which the securities are traded and are classified as Level 1. Securities of U.S. agencies are valued using bid evaluations and a classified as Level 2. Corporate fixed income securities are valued using evaluated prices, such as dealer quotes, bids and offers and are therefore classified as Level 2. |
| • | Insurance contracts — Insurance contracts are investments with various insurance companies. The contract value represents the best estimate of fair value. These contracts do not hold any specific assets. These investments are classified as Level 3. |
54
Table of Contents
Notes to Consolidated Financial Statements — (Continued)
| • | Real estate collective funds — These funds are valued at the estimated fair value of the underlying properties. Estimated fair value is calculated using a combination of key inputs, such as revenue and expense growth rates, terminal capitalization rates and discount rates. These investments are classified as Level 3. |
| • | Pooled investment funds — These are public investment vehicles valued using the net asset value. The net asset value is based on the value of the assets owned by the plan, less liabilities. These investments are not quoted on an active exchange and are classified as Level 2. |
The following tables present an analysis of changes during the years ended October 31, 2014 and 2013 in Level 3 plan assets, by plan asset class, for U.S. and International pension plans using significant unobservable inputs to measure fair value:
| Fair Value Measurements Using Significant Unobservable Inputs (Level 3) |
||||||||||||
| Real estate collective funds |
Insurance contracts |
Total | ||||||||||
| Beginning balance at October 31, 2013 |
$ | 14,958 | $ | 22,093 | $ | 37,051 | ||||||
| Actual return on plan assets: |
||||||||||||
| Assets held, end of year |
1,667 | 771 | 2,438 | |||||||||
| Assets sold during the period |
25 | — | 25 | |||||||||
| Purchases |
— | 2,816 | 2,816 | |||||||||
| Sales |
(155 | ) | (1,529 | ) | (1,684 | ) | ||||||
| Foreign currency translation |
— | (977 | ) | (977 | ) | |||||||
|
|
|
|
|
|
|
|||||||
| Ending balance at October 31, 2014 |
$ | 16,495 | $ | 23,174 | $ | 39,669 | ||||||
|
|
|
|
|
|
|
|||||||
| Fair Value Measurements Using Significant Unobservable Inputs (Level 3) |
||||||||||||
| Real estate collective funds |
Insurance contracts |
Total | ||||||||||
| Beginning balance at October 31, 2012 |
$ | 13,110 | $ | 19,046 | $ | 32,156 | ||||||
| Actual return on plan assets: |
||||||||||||
| Assets held, end of year |
1,970 | 1,025 | 2,995 | |||||||||
| Assets sold during the period |
13 | — | 13 | |||||||||
| Purchases |
— | 4,242 | 4,242 | |||||||||
| Sales |
(135 | ) | (2,093 | ) | (2,228 | ) | ||||||
| Foreign currency translation |
— | (127 | ) | (127 | ) | |||||||
|
|
|
|
|
|
|
|||||||
| Ending balance at October 31, 2013 |
$ | 14,958 | $ | 22,093 | $ | 37,051 | ||||||
|
|
|
|
|
|
|
|||||||
Contributions to pension plans in 2015 are estimated to be approximately $26,000.
Retiree pension benefit payments, which reflect expected future service, are anticipated to be paid as follows:
| Year |
United States | International | ||||||
| 2015 |
$ | 10,922 | $ | 4,833 | ||||
| 2016 |
11,637 | 2,300 | ||||||
| 2017 |
12,721 | 2,166 | ||||||
| 2018 |
13,661 | 2,984 | ||||||
| 2019 |
14,853 | 5,014 | ||||||
| 2020-2024 |
92,418 | 17,392 | ||||||
55
Table of Contents
Notes to Consolidated Financial Statements — (Continued)
Other postretirement plans — We have an unfunded postretirement benefit plan covering certain of our United States employees. Employees hired after January 1, 2002, are not eligible to participate in this plan. The plan provides medical and life insurance benefits. The plan is contributory, with retiree contributions in the form of premiums that are adjusted annually, and contains other cost-sharing features, such as deductibles and coinsurance. We also sponsor an unfunded, non-contributory postretirement benefit plan that provides medical and life insurance benefits for certain international employees.
A reconciliation of the benefit obligations, accrued benefit cost and the amount recognized in financial statements for other postretirement plans is as follows:
| United States | International | |||||||||||||||
| 2014 | 2013 | 2014 | 2013 | |||||||||||||
| Change in benefit obligation: |
||||||||||||||||
| Benefit obligation at beginning of year |
$ | 61,004 | $ | 71,228 | $ | 768 | $ | 851 | ||||||||
| Service cost |
1,037 | 1,145 | 28 | 35 | ||||||||||||
| Interest cost |
3,062 | 2,598 | 38 | 38 | ||||||||||||
| Participant contributions |
431 | 600 | — | — | ||||||||||||
| Foreign currency exchange rate change |
— | — | (63 | ) | (34 | ) | ||||||||||
| Actuarial (gain) loss |
6,015 | (11,619 | ) | 130 | (118 | ) | ||||||||||
| Benefits paid |
(2,070 | ) | (2,948 | ) | (4 | ) | (4 | ) | ||||||||
|
|
|
|
|
|
|
|
|
|||||||||
| Benefit obligation at end of year |
$ | 69,479 | $ | 61,004 | $ | 897 | $ | 768 | ||||||||
|
|
|
|
|
|
|
|
|
|||||||||
| Change in plan assets: |
||||||||||||||||
| Beginning fair value of plan assets |
$ | — | $ | — | $ | — | $ | — | ||||||||
| Company contributions |
1,639 | 2,348 | 4 | 4 | ||||||||||||
| Participant contributions |
431 | 600 | — | — | ||||||||||||
| Benefits paid |
(2,070 | ) | (2,948 | ) | (4 | ) | (4 | ) | ||||||||
|
|
|
|
|
|
|
|
|
|||||||||
| Ending fair value of plan assets |
$ | — | $ | — | $ | — | $ | — | ||||||||
|
|
|
|
|
|
|
|
|
|||||||||
| Funded status at end of year |
$ | (69,479 | ) | $ | (61,004 | ) | $ | (897 | ) | $ | (768 | ) | ||||
|
|
|
|
|
|
|
|
|
|||||||||
| Amounts recognized in financial statements: |
||||||||||||||||
| Accrued benefit liability |
$ | (2,069 | ) | $ | (1,974 | ) | $ | (7 | ) | $ | (4 | ) | ||||
| Long-term postretirement obligations |
(67,410 | ) | (59,030 | ) | (890 | ) | (764 | ) | ||||||||
|
|
|
|
|
|
|
|
|
|||||||||
| Total amount recognized in financial statements |
$ | (69,479 | ) | $ | (61,004 | ) | $ | (897 | ) | $ | (768 | ) | ||||
|
|
|
|
|
|
|
|
|
|||||||||
| United States | International | |||||||||||||||
| 2014 | 2013 | 2014 | 2013 | |||||||||||||
| Amounts recognized in accumulated other comprehensive (gain) loss: |
||||||||||||||||
| Net actuarial (gain) loss |
$ | 22,434 | $ | 17,854 | $ | (86 | ) | $ | (243 | ) | ||||||
| Prior service cost (credit) |
(1,012 | ) | (1,461 | ) | — | — | ||||||||||
|
|
|
|
|
|
|
|
|
|||||||||
| Accumulated other comprehensive (gain) loss |
$ | 21,422 | $ | 16,393 | $ | (86 | ) | $ | (243 | ) | ||||||
|
|
|
|
|
|
|
|
|
|||||||||
| Amounts expected to be recognized during next fiscal year: |
||||||||||||||||
| Amortization of net actuarial (gain) loss |
$ | 1,187 | $ | 1,139 | $ | — | $ | (14 | ) | |||||||
| Amortization of prior service cost (credit) |
(438 | ) | (449 | ) | — | — | ||||||||||
|
|
|
|
|
|
|
|
|
|||||||||
| Total |
$ | 749 | $ | 690 | $ | — | $ | (14 | ) | |||||||
|
|
|
|
|
|
|
|
|
|||||||||
56
Table of Contents
Notes to Consolidated Financial Statements — (Continued)
The following table summarizes the changes in accumulated other comprehensive (gain) loss:
| United States | International | |||||||||||||||
| 2014 | 2013 | 2014 | 2013 | |||||||||||||
| Balance at beginning of year |
$ | 16,393 | $ | 29,651 | $ | (243 | ) | $ | (138 | ) | ||||||
| Net (gain) loss arising during the year |
6,015 | (11,619 | ) | 130 | (117 | ) | ||||||||||
| Net gain (loss) recognized during the year |
(1,435 | ) | (2,112 | ) | 13 | 4 | ||||||||||
| Prior service credit (cost) recognized during the year |
449 | 473 | — | — | ||||||||||||
| Exchange rate effect during the year |
— | — | 14 | 8 | ||||||||||||
|
|
|
|
|
|
|
|
|
|||||||||
| Balance at end of year |
$ | 21,422 | $ | 16,393 | $ | (86 | ) | $ | (243 | ) | ||||||
|
|
|
|
|
|
|
|
|
|||||||||
Net postretirement benefit costs include the following components:
| United States | International | |||||||||||||||||||||||
| 2014 | 2013 | 2012 | 2014 | 2013 | 2012 | |||||||||||||||||||
| Service cost |
$ | 1,037 | $ | 1,145 | $ | 1,183 | $ | 28 | $ | 35 | $ | 28 | ||||||||||||
| Interest cost |
3,062 | 2,598 | 2,759 | 38 | 38 | 41 | ||||||||||||||||||
| Amortization of prior service cost (credit) |
(449 | ) | (473 | ) | (584 | ) | — | — | — | |||||||||||||||
| Amortization of net actuarial (gain) loss |
1,435 | 2,112 | 1,789 | (13 | ) | (4 | ) | (14 | ) | |||||||||||||||
|
|
|
|
|
|
|
|
|
|
|
|
|
|||||||||||||
| Total benefit cost |
$ | 5,085 | $ | 5,382 | $ | 5,147 | $ | 53 | $ | 69 | $ | 55 | ||||||||||||
|
|
|
|
|
|
|
|
|
|
|
|
|
|||||||||||||
The weighted average assumptions used in the valuation of postretirement benefits were as follows:
| United States | International | |||||||||||||||||||||||
| 2014 | 2013 | 2012 | 2014 | 2013 | 2012 | |||||||||||||||||||
| Assumptions used to determine benefit obligations at October 31: |
||||||||||||||||||||||||
| Discount rate |
4.40 | % | 4.80 | % | 3.85 | % | 4.25 | % | 4.95 | % | 4.40 | % | ||||||||||||
| Health care cost trend rate |
3.93 | 4.12 | 4.90 | 6.48 | 6.65 | 6.83 | ||||||||||||||||||
| Rate to which health care cost trend rate is assumed to decline (ultimate trend rate) |
3.41 | 3.47 | 3.60 | 3.50 | 3.50 | 3.50 | ||||||||||||||||||
| Year the rate reaches the ultimate trend rate |
2024 | 2021 | 2017 | 2031 | 2031 | 2031 | ||||||||||||||||||
| Assumption used to determine net benefit costs for the years ended October 31: |
||||||||||||||||||||||||
| Discount rate |
4.80 | % | 3.85 | % | 4.50 | % | 4.95 | % | 4.40 | % | 5.85 | % | ||||||||||||
The decrease in the weighted-average United States health care cost trend rate beginning in 2013 relates to a change in the plan design of the retiree medical plan effective January 1, 2013 moving to a Health Reimbursement Arrangement for post-65 coverage.
The measurement of domestic other post employment benefit (OPEB) plan’s projected benefit obligation included the effect of adopting the Society of Actuaries’ release of final RP2014 / MP2014 mortality tables. The adoption of these new tables resulted in an increase of $4,878 to our domestic OPEB plan’s projected benefit obligation.
57
Table of Contents
Notes to Consolidated Financial Statements — (Continued)
The discount rate and the health care cost trend rate assumptions have a significant effect on the amounts reported. For example, a one-percentage point change in the discount rate and the assumed health care cost trend rate would have the following effects. Bracketed numbers represent decreases in expense and obligation amounts.
| United States | International | |||||||||||||||
| 1% Point Increase |
1% Point Decrease |
1% Point Increase |
1% Point Decrease |
|||||||||||||
| Discount rate: |
||||||||||||||||
| Effect on total service and interest cost components in 2014 |
$ | (770 | ) | $ | 938 | $ | (7 | ) | $ | 6 | ||||||
| Effect on postretirement obligation as of October 31, 2014 |
$ | (9,992 | ) | $ | 12,790 | $ | (173 | ) | $ | 229 | ||||||
| Health care trend rate: |
||||||||||||||||
| Effect on total service and interest cost components in 2014 |
$ | 589 | $ | (479 | ) | $ | 14 | $ | (14 | ) | ||||||
| Effect on postretirement obligation as of October 31, 2014 |
$ | 11,302 | $ | (9,001 | ) | $ | 174 | $ | (208 | ) | ||||||
Contributions to postretirement plans in 2015 are estimated to be approximately $2,100.
Retiree postretirement benefit payments are anticipated to be paid as follows:
| Year |
United States | International | ||||||
| 2015 |
$ | 2,069 | $ | 7 | ||||
| 2016 |
2,242 | 8 | ||||||
| 2017 |
2,420 | 9 | ||||||
| 2018 |
2,614 | 12 | ||||||
| 2019 |
2,743 | 13 | ||||||
| 2020-2024 |
16,609 | 107 | ||||||
Note 7 — Income taxes
Income tax expense includes the following:
| 2014 | 2013 | 2012 | ||||||||||
| Current: |
||||||||||||
| U.S. federal |
$ | 52,985 | $ | 45,004 | $ | 51,458 | ||||||
| State and local |
1,900 | 2,351 | 1,378 | |||||||||
| Foreign |
47,366 | 36,829 | 38,760 | |||||||||
|
|
|
|
|
|
|
|||||||
| Total current |
102,251 | 84,184 | 91,596 | |||||||||
| Deferred: |
||||||||||||
| U.S. federal |
8,695 | 8,361 | 7,204 | |||||||||
| State and local |
(1,635 | ) | (991 | ) | 782 | |||||||
| Foreign |
(3,571 | ) | (2,248 | ) | 1,842 | |||||||
|
|
|
|
|
|
|
|||||||
| Total deferred |
3,489 | 5,122 | 9,828 | |||||||||
|
|
|
|
|
|
|
|||||||
| $ | 105,740 | $ | 89,306 | $ | 101,424 | |||||||
|
|
|
|
|
|
|
|||||||
Earnings before income taxes of domestic operations, which are calculated after intercompany profit eliminations, were $184,894, $164,702 and $177,035 in 2014, 2013 and 2012, respectively.
Income tax expense in 2013 included a benefit of $900 for the reduction of unrecognized tax benefits primarily related to expiration of certain foreign statutes of limitations. On January 2, 2013, the American Taxpayer Relief Act of 2012 was enacted which retroactively reinstated and extended the Federal Research and Development Tax
58
Table of Contents
Notes to Consolidated Financial Statements — (Continued)
Credit (Federal R&D Tax Credit) from January 1, 2012 to December 31, 2013 and extended certain other tax provisions. As a result, our income tax provision for 2013 included a discrete tax benefit of $1,700 related to 2012.
Income tax expense in 2012 included a benefit of $2,717 related to the utilization of loss carryforwards and to the release of the valuation allowance related to loss carryforwards which are expected to be utilized in future years.
A reconciliation of the U.S. statutory federal rate to the worldwide consolidated effective tax rate follows:
| 2014 | 2013 | 2012 | ||||||||||
| Statutory federal income tax rate |
35.00 | % | 35.00 | % | 35.00 | % | ||||||
| Domestic Production Deduction |
(1.74 | ) | (1.71 | ) | (1.82 | ) | ||||||
| Foreign tax rate variances, net of foreign tax credits |
(3.42 | ) | (3.39 | ) | (2.31 | ) | ||||||
| State and local taxes, net of federal income tax benefit |
0.05 | 0.28 | 0.43 | |||||||||
| Amounts related to prior years |
(0.24 | ) | (1.00 | ) | (0.31 | ) | ||||||
| Other — net |
0.35 | (0.48 | ) | 0.10 | ||||||||
|
|
|
|
|
|
|
|||||||
| Effective tax rate |
30.00 | % | 28.70 | % | 31.09 | % | ||||||
|
|
|
|
|
|
|
|||||||
The Domestic Production Deduction, enacted by the American Jobs Creation Act of 2004, allows a deduction with respect to income from certain United States manufacturing activities.
Earnings before income taxes of international operations, which are calculated before intercompany profit elimination entries, were $167,619, $146,421 and $149,218 in 2014, 2013 and 2012, respectively. Deferred income taxes are not provided on undistributed earnings of international subsidiaries that are intended to be permanently invested in their operations. These undistributed earnings aggregated approximately $622,914 and $510,842 at October 31, 2014 and 2013, respectively. Should these earnings be distributed, applicable foreign tax credits would substantially offset taxes due upon the distribution. It is not practical to estimate the amount of additional taxes that might be payable on such undistributed earnings.
At October 31, 2014 and 2013, total unrecognized tax benefits were $5,812 and $5,717, respectively. The amounts that, if recognized, would impact the effective tax rate were $5,175 and $5,178 at October 31, 2014 and 2013, respectively. The increase in unrecognized tax benefits in 2013 as compared to prior year relates primarily to foreign positions and, if recognized, a substantial portion of the gross unrecognized tax benefits would be offset against assets currently recorded in the Consolidated Balance Sheet. A reconciliation of the beginning and ending amount of unrecognized tax benefits for 2014, 2013 and 2012 is as follows:
| 2014 | 2013 | 2012 | ||||||||||
| Balance at beginning of year |
$ | 5,717 | $ | 3,140 | $ | 2,576 | ||||||
| Additions based on tax positions related to the current year |
196 | 703 | 148 | |||||||||
| Additions for tax positions of prior years |
319 | 3,261 | 896 | |||||||||
| Reductions for tax positions of prior years |
— | (317 | ) | — | ||||||||
| Settlements |
(110 | ) | — | — | ||||||||
| Lapse of statute of limitations |
(310 | ) | (1,070 | ) | (480 | ) | ||||||
|
|
|
|
|
|
|
|||||||
| Balance at end of year |
$ | 5,812 | $ | 5,717 | $ | 3,140 | ||||||
|
|
|
|
|
|
|
|||||||
At October 31, 2014 and 2013, we had accrued interest and penalty expense related to unrecognized tax benefits of $2,025 and $1,085, respectively. We include interest accrued related to unrecognized tax benefits in interest expense. Penalties, if incurred, would be recognized as other income (expense).
We are subject to United States Federal income tax as well as income taxes in numerous state and foreign jurisdictions. We are subject to examination in the U.S. by the Internal Revenue Service (IRS) for the 2012, 2013 and 2014 tax years; tax years prior to the 2012 year are closed to further examination by the IRS. Generally, major state and foreign jurisdiction tax years remain open to examination for tax years after 2008. Within the
59
Table of Contents
Notes to Consolidated Financial Statements — (Continued)
next twelve months, it is reasonably possible that certain statute of limitations periods would expire, which could result in a minimal decrease in our unrecognized tax benefits.
Significant components of deferred tax assets and liabilities are as follows:
| 2014 | 2013 | |||||||
| Deferred tax assets: |
||||||||
| Employee benefits |
$ | 79,669 | $ | 66,148 | ||||
| Other accruals not currently deductible for taxes |
17,379 | 16,984 | ||||||
| Tax credit and loss carryforwards |
16,531 | 13,077 | ||||||
| Inventory adjustments |
5,276 | 4,998 | ||||||
| Translation of foreign currency accounts |
154 | 384 | ||||||
|
|
|
|
|
|||||
| Total deferred tax assets |
119,009 | 101,591 | ||||||
| Valuation allowance |
(7,672 | ) | (5,663 | ) | ||||
|
|
|
|
|
|||||
| Total deferred tax assets |
111,337 | 95,928 | ||||||
| Deferred tax liabilities: |
||||||||
| Depreciation and amortization |
163,107 | 146,500 | ||||||
| Other — net |
— | 51 | ||||||
|
|
|
|
|
|||||
| Total deferred tax liabilities |
163,107 | 146,551 | ||||||
|
|
|
|
|
|||||
| Net deferred tax liabilities |
$ | (51,770 | ) | $ | (50,623 | ) | ||
|
|
|
|
|
|||||
At October 31, 2014, we had $4,161 of tax credit carryforwards of which $161 will expire in 2015 through 2017, and $4,000 of which has an indefinite carryforward period. We also had $19,535 Federal, $50,343 state and $13,213 foreign operating loss carryforwards, of which $70,084 will expire in 2015 through 2033, and $13,007 of which has an indefinite carryforward period. The net change in the valuation allowance was an increase of $2,009 in 2014 and an increase of $617 in 2013. The valuation allowance of $7,672 at October 31, 2014, related primarily to tax credits and loss carryforwards that may expire before being realized. We continue to assess the need for valuation allowances against deferred tax assets based on determinations of whether it is more likely than not that deferred tax benefits will be realized.
Note 8 — Notes payable
Bank lines of credit and notes payable are summarized as follows:
| 2014 | 2013 | |||||||
| Maximum borrowings under bank lines of credit: |
||||||||
| Domestic banks |
$ | 100,000 | $ | — | ||||
| Foreign banks |
48,619 | 83,191 | ||||||
|
|
|
|
|
|||||
| Total |
$ | 148,619 | $ | 83,191 | ||||
|
|
|
|
|
|||||
| Outstanding notes payable: |
||||||||
| Domestic bank debt |
$ | 100,000 | $ | — | ||||
| Foreign bank debt |
6,181 | 3,604 | ||||||
|
|
|
|
|
|||||
| Total |
$ | 106,181 | $ | 3,604 | ||||
|
|
|
|
|
|||||
| Weighted-average interest rate on notes payable |
1.0 | % | 2.0 | % | ||||
| Unused bank lines of credit |
$ | 42,438 | $ | 79,587 | ||||
|
|
|
|
|
|||||
In 2014, we entered into a 364-day, $100,000 unsecured credit facility with PNC Bank. We borrowed $100,000 under this facility to partially fund the Avalon acquisition.
60
Table of Contents
Notes to Consolidated Financial Statements — (Continued)
Note 9 — Long-term debt
A summary of long-term debt is as follows:
| 2014 | 2013 | |||||||
| Revolving credit agreement, due 2017 |
$ | 375,242 | $ | 254,000 | ||||
| Senior notes, due 2017-2025 |
200,000 | 200,000 | ||||||
| Euro loan, due 2016 |
63,244 | 129,058 | ||||||
| Private shelf facility, due 2012-2020 |
53,333 | 63,889 | ||||||
| Development loans, due 2011-2026 |
1,586 | 1,702 | ||||||
| Other |
214 | 341 | ||||||
|
|
|
|
|
|||||
| 693,619 | 648,990 | |||||||
| Less current maturities |
10,751 | 10,832 | ||||||
|
|
|
|
|
|||||
| Long-term maturities |
$ | 682,868 | $ | 638,158 | ||||
|
|
|
|
|
|||||
Revolving credit agreement — This $500,000 unsecured multi-currency revolving credit agreement is with a group of banks and expires in December 2016. Payment of quarterly commitment fees is required. The weighted average interest rate for borrowings under this agreement was 1.08 percent at October 31, 2014.
Senior notes, due 2017-2025 —These fixed-rate notes entered into in 2012 with a group of insurance companies had an original weighted-average life of 8.78 years at the time of issuance. The weighted-average interest rate at October 31, 2014 was 2.93 percent.
Euro loan, due 2016 — This loan was entered into in 2013 with The Bank of Tokyo-Mitsubishi UFJ, Ltd. It can be extended by one year at the end of the third and fourth anniversaries. The interest rate is variable based upon the EUR LIBOR rate. The weighted average interest rate at October 31, 2014 was 0.95 percent.
Private shelf facility — In 2011, we entered into a $150,000 three-year Private Shelf Note agreement with New York Life Investment Management LLC (NYLIM). The amount of the facility was increased to $175,000 in 2013. Borrowings under the agreement may be up to 12 years, with an average life of up to 10 years, and are unsecured. The interest rate on each borrowing can be fixed or floating and is based upon the market rate at the borrowing date. At October 31, 2014, the amount outstanding under this facility was at a fixed rate of 2.21 percent.
Development loans, due 2011-2026 — These fixed-rate loans with the State of Ohio and Cuyahoga County, Ohio were issued in 2011 in connection with the construction of our corporate headquarters building and are payable in monthly installments over 15 years beginning in 2011. The interest rate on the State of Ohio loan is 3.00 percent, and the interest rate on the Cuyahoga County loan is 3.50 percent.
Annual maturities — The annual maturities of long-term debt for the five years subsequent to October 31, 2014, are as follows: $10,751 in 2015; $74,041 in 2016; and $413,343 in 2017; $26,587 in 2018 and $21,591 in 2019.
61
Table of Contents
Notes to Consolidated Financial Statements — (Continued)
Note 10 — Leases
We have lease commitments expiring at various dates, principally for manufacturing, warehouse and office space, automobiles and office equipment. Many leases contain renewal options and some contain purchase options and residual guarantees.
Rent expense for all operating leases was approximately $15,135, $14,835 and $13,822 in 2014, 2013 and 2012, respectively.
Amortization of assets recorded under capital leases is recorded in depreciation expense.
Assets held under capitalized leases and included in property, plant and equipment are as follows:
| 2014 | 2013 | |||||||
| Transportation equipment |
$ | 15,524 | $ | 16,261 | ||||
| Other |
12,191 | 10,577 | ||||||
|
|
|
|
|
|||||
| Total capitalized leases |
27,715 | 26,838 | ||||||
| Accumulated amortization |
(11,139 | ) | (10,805 | ) | ||||
|
|
|
|
|
|||||
| Net capitalized leases |
$ | 16,576 | $ | 16,033 | ||||
|
|
|
|
|
|||||
At October 31, 2014, future minimum lease payments under non-cancelable capitalized and operating leases are as follows:
| Capitalized Leases |
Operating Leases |
|||||||
| Year: |
||||||||
| 2015 |
$ | 6,866 | $ | 12,189 | ||||
| 2016 |
4,957 | 7,192 | ||||||
| 2017 |
2,340 | 5,808 | ||||||
| 2018 |
993 | 4,179 | ||||||
| 2019 |
635 | 3,773 | ||||||
| Later years |
6,476 | 10,410 | ||||||
|
|
|
|
|
|||||
| Total minimum lease payments |
22,267 | $ | 43,551 | |||||
|
|
|
|||||||
| Less amount representing executory costs |
1,993 | |||||||
|
|
|
|||||||
| Net minimum lease payments |
20,274 | |||||||
| Less amount representing interest |
4,148 | |||||||
|
|
|
|||||||
| Present value of net minimum lease payments |
16,126 | |||||||
| Less current portion |
5,108 | |||||||
|
|
|
|||||||
| Long-term obligations at October 31, 2014 |
$ | 11,018 | ||||||
|
|
|
|||||||
62
Table of Contents
Notes to Consolidated Financial Statements — (Continued)
Note 11 — Fair value measurements
The inputs to the valuation techniques used to measure fair value are classified into the following categories:
Level 1: Quoted market prices in active markets for identical assets or liabilities.
Level 2: Observable market based inputs or unobservable inputs that are corroborated by market data.
Level 3: Unobservable inputs that are not corroborated by market data.
The following table presents the classification of our assets and liabilities measured at fair value on a recurring basis at October 31, 2014:
| Total | Level 1 | Level 2 | Level 3 | |||||||||||||
| Assets: |
||||||||||||||||
| Foreign currency forward contracts(a) |
$ | 9,934 | $ | — | $ | 9,934 | $ | — | ||||||||
|
|
|
|
|
|
|
|
|
|||||||||
| Total assets at fair value |
$ | 9,934 | $ | — | $ | 9,934 | $ | — | ||||||||
|
|
|
|
|
|
|
|
|
|||||||||
| Liabilities: |
||||||||||||||||
| Deferred compensation plans(b) |
$ | 8,884 | $ | 8,884 | $ | — | $ | — | ||||||||
| Foreign currency forward contracts(a) |
8,424 | — | 8,424 | — | ||||||||||||
|
|
|
|
|
|
|
|
|
|||||||||
| Total liabilities at fair value |
$ | 17,308 | $ | 8,884 | $ | 8,424 | $ | — | ||||||||
|
|
|
|
|
|
|
|
|
|||||||||
| (a) | We enter into foreign currency forward contracts to reduce the risk of foreign currency exposures resulting from receivables, payables, intercompany receivables, intercompany payables and loans denominated in foreign currencies. Foreign exchange contracts are valued using market exchange rates. These foreign exchange contracts are not designated as hedges. |
| (b) | Executive officers and other highly compensated employees may defer up to 100 percent of their salary and annual cash incentive compensation and for executive officers, up to 90 percent of their long-term incentive compensation, into various non-qualified deferred compensation plans. Deferrals can be allocated to various market performance measurement funds. Changes in the value of compensation deferred under these plans are recognized each period based on the fair value of the underlying measurement funds. |
Fair value disclosures related to goodwill and indefinite-lived intangible assets are disclosed in Note 5.
Note 12 — Financial instruments
We operate internationally and enter into intercompany transactions denominated in foreign currencies. Consequently, we are subject to market risk arising from exchange rate movements between the dates foreign currency transactions occur and the dates they are settled. We regularly use foreign currency forward contracts to reduce our risks related to most of these transactions. These contracts usually have maturities of 90 days or less and generally require us to exchange foreign currencies for U.S. dollars at maturity, at rates stated in the contracts. These contracts are not designated as hedging instruments under U.S. GAAP. Accordingly, the changes in the fair value of the foreign currency forward contracts are recognized in each accounting period in “other – net” on the Consolidated Statement of Income together with the transaction gain or loss from the related balance sheet position. In 2014, we recognized net losses of $826 on foreign currency forward contracts and net gains of $348 from the change in fair value of balance sheet positions. In 2013, we recognized net gains of $1,437 on foreign currency forward contracts and net losses of $3,651 from the change in fair value of balance sheet positions. In 2012, we recognized net gains of $294 on foreign currency forward contracts and net losses of $1,310 from the change in fair value of balance sheet positions.
63
Table of Contents
Notes to Consolidated Financial Statements — (Continued)
The following table summarizes, by currency, the contracts outstanding at October 31, 2014 and 2013:
| Sell | Buy | |||||||||||||||
| Notional Amounts |
Fair Market Value |
Notional Amounts |
Fair Market Value |
|||||||||||||
| October 31, 2014 contract amounts: |
||||||||||||||||
| Euro |
$ | 424,624 | $ | 407,422 | $ | 344,461 | $ | 330,957 | ||||||||
| Pound sterling |
86,654 | 85,632 | 141,638 | 140,065 | ||||||||||||
| Japanese yen |
21,057 | 19,780 | 17,477 | 16,498 | ||||||||||||
| Australian dollar |
216 | 220 | 9,012 | 8,618 | ||||||||||||
| Hong Kong dollar |
52,278 | 52,247 | 117,040 | 116,978 | ||||||||||||
| Singapore dollar |
— | — | 10,984 | 10,693 | ||||||||||||
| Others |
2,627 | 2,573 | 28,409 | 27,236 | ||||||||||||
|
|
|
|
|
|
|
|
|
|||||||||
| Total |
$ | 587,456 | $ | 567,874 | $ | 669,021 | $ | 651,045 | ||||||||
|
|
|
|
|
|
|
|
|
|||||||||
| October 31, 2013 contract amounts: |
||||||||||||||||
| Euro |
$ | 194,531 | $ | 194,187 | $ | 131,198 | $ | 131,825 | ||||||||
| Pound sterling |
17,854 | 17,856 | 29,441 | 29,950 | ||||||||||||
| Japanese yen |
11,426 | 11,404 | 8,686 | 8,672 | ||||||||||||
| Australian dollar |
894 | 899 | 8,653 | 8,986 | ||||||||||||
| Hong Kong dollar |
1,935 | 1,935 | 42,140 | 42,132 | ||||||||||||
| Singapore dollar |
201 | 201 | 9,815 | 10,065 | ||||||||||||
| Others |
5,768 | 5,745 | 24,227 | 24,503 | ||||||||||||
|
|
|
|
|
|
|
|
|
|||||||||
| Total |
$ | 232,609 | $ | 232,227 | $ | 254,160 | $ | 256,133 | ||||||||
|
|
|
|
|
|
|
|
|
|||||||||
We also use intercompany foreign currency transactions of a long-term investment nature to hedge the value of investment in wholly-owned subsidiaries. For hedges of the net investment in foreign operations, realized and unrealized gains and losses are shown in the cumulative translation adjustment account included in total comprehensive income. For 2014 and 2013, net gains of $318 and $699, respectively, were included in the cumulative translation adjustment account related to foreign denominated fixed-rate debt designated as a hedge of net investment in foreign operations.
We are exposed to credit-related losses in the event of nonperformance by counterparties to financial instruments. These financial instruments include cash deposits and foreign currency forward contracts. We periodically monitor the credit ratings of these counterparties in order to minimize our exposure. Our customers represent a wide variety of industries and geographic regions. As of October 31, 2014, there were no significant concentrations of credit risk.
The carrying amounts and fair values of financial instruments, other than receivables and accounts payable, are shown in the table below. The carrying values of receivables and accounts payable approximate fair value due to the short-term nature of these instruments.
| 2014 | 2013 | |||||||||||||||
| Carrying Amount |
Fair Value |
Carrying Amount |
Fair Value |
|||||||||||||
| Cash and cash equivalents |
$ | 42,314 | $ | 42,314 | $ | 42,375 | $ | 42,375 | ||||||||
| Notes payable |
106,181 | 106,181 | 3,604 | 3,604 | ||||||||||||
| Long-term debt (including current portion) |
693,619 | 696,140 | 648,990 | 636,904 | ||||||||||||
| Foreign currency forward contracts (net) |
1,510 | 1,510 | 2,313 | 2,313 | ||||||||||||
64
Table of Contents
Notes to Consolidated Financial Statements — (Continued)
We used the following methods and assumptions in estimating the fair value of financial instruments:
| • | Cash, cash equivalents and notes payable are valued at their carrying amounts due to the relatively short period to maturity of the instruments. |
| • | Long-term debt is valued by discounting future cash flows at currently available rates for borrowing arrangements with similar terms and conditions, which are considered to be Level 2 inputs under the fair value hierarchy. |
| • | Foreign currency forward contracts are estimated using quoted exchange rates, which are considered to be Level 2 inputs under the fair value hierarchy. |
Note 13 — Capital shares
Preferred — We have authorized 10,000 Series A convertible preferred shares without par value. No preferred shares were outstanding in 2014, 2013 or 2012.
Common — We have 160,000 authorized common shares without par value. At October 31, 2014 and 2013, there were 98,023 common shares issued. At October 31, 2014 and 2013, the number of outstanding common shares, net of treasury shares, was 62,435 and 64,218, respectively.
Common shares repurchased as part of publicly announced programs during 2014, 2013 and 2012 were as follows:
| Year |
Number of Shares |
Total Amount |
Average per Share |
|||||||||
| 2014 |
2,224 | $ | 163,584 | $ | 73.55 | |||||||
| 2013 |
459 | $ | 30,443 | $ | 66.29 | |||||||
| 2012 |
1,831 | $ | 86,022 | $ | 46.98 | |||||||
Note 14 — Stock-based compensation
During the 2013 Annual Meeting of Shareholders, our shareholders approved the 2012 Stock Incentive and Award Plan (the “2012 Plan”). The 2012 Plan provides for the granting of stock options, stock appreciation rights, restricted stock, performance shares, stock purchase rights, stock equivalent units, cash awards and other stock or performance-based incentives. A maximum of 2,900 common shares is available for grant under the Plan.
Stock options — Nonqualified or incentive stock options may be granted to our employees and directors. Generally, options granted to employees may be exercised beginning one year from the date of grant at a rate not exceeding 25 percent per year and expire 10 years from the date of grant. Vesting accelerates upon the occurrence of events that involve or may result in a change of control. For grants made prior to November 2012, vesting ceases upon retirement, death and disability, and unvested shares are forfeited. For grants made in or after November 2012, in the event of termination of employment due to early retirement or normal retirement at age 65, options granted within 12 months prior to termination are forfeited, and vesting continues post retirement for all other unvested options granted. In the event of disability or death, all unvested stock options fully vest. Termination for any other reason results in forfeiture of unvested options and vested options in certain circumstances. The amortized cost of options is accelerated if the retirement eligibility date occurs before the normal vesting date. Option exercises are satisfied through the issuance of treasury shares on a first-in, first-out basis. We recognized compensation expense related to stock options of $10,251, $4,906 and $3,789 for 2014, 2013 and 2012, respectively. The increase in the 2014 expense was primarily related to accelerated amortization of the cost of options.
65
Table of Contents
Notes to Consolidated Financial Statements — (Continued)
The following table summarizes activity related to stock options during 2014:
| Number of Options |
Weighted-Average Exercise Price Per Share |
Aggregate Intrinsic Value |
Weighted- Average Remaining Term |
|||||||||||||
| Outstanding at October 31, 2013 |
1,749 | $ | 34.63 | |||||||||||||
| Granted |
277 | $ | 71.75 | |||||||||||||
| Exercised |
(314 | ) | $ | 22.35 | ||||||||||||
| Forfeited or expired |
(26 | ) | $ | 51.57 | ||||||||||||
|
|
|
|||||||||||||||
| Outstanding at October 31, 2014 |
1,686 | $ | 42.77 | $ | 56,957 | 6.0 years | ||||||||||
|
|
|
|||||||||||||||
| Vested at October 31, 2014 or expected to vest |
1,673 | $ | 42.58 | $ | 56,841 | 6.0 years | ||||||||||
| Exercisable at October 31, 2014 |
955 | $ | 30.86 | $ | 43,626 | 4.6 years | ||||||||||
Summarized information on currently outstanding options follows:
| Range of Exercise Price | ||||||||||||
| $14 — $28 | $29 — $44 | $45 — $73 | ||||||||||
| Number outstanding |
610 | 543 | 533 | |||||||||
| Weighted-average remaining contractual life, in years |
3.5 | 6.4 | 8.6 | |||||||||
| Weighted-average exercise price |
$ | 22.54 | $ | 41.90 | $ | 66.78 | ||||||
| Number exercisable |
578 | 318 | 59 | |||||||||
| Weighted-average exercise price |
$ | 22.28 | $ | 40.71 | $ | 61.62 | ||||||
As of October 31, 2014, there was $6,741 of total unrecognized compensation cost related to nonvested stock options. That cost is expected to be amortized over a weighted average period of approximately 1.4 years.
The Black-Scholes option valuation model was developed for use in estimating the fair value of traded options that have no vesting restrictions and are fully transferable. Option valuation models require the input of highly subjective assumptions, including the expected stock price volatility. The fair value of each option grant was estimated at the date of grant using the Black-Scholes option-pricing model with the following assumptions:
| 2014 | 2013 | 2012 | ||||
| Expected volatility |
40.1%-44.7% | 45.3%-46.9% | 45.4%-46.9% | |||
| Expected dividend yield |
0.98%-1.03% | 0.97%-1.01% | 1.20% | |||
| Risk-free interest rate |
1.51%-1.79% | 0.75%-0.90% | 1.03%-1.23% | |||
| Expected life of the option (in years) |
5.4-6.1 | 5.4-6.1 | 5.4-6.1 |
The weighted-average expected volatility used to value options granted in 2014, 2013 and 2012 was 44.5 percent, 46.3 percent and 46.2 percent, respectively.
66
Table of Contents
Notes to Consolidated Financial Statements — (Continued)
Historical information was the primary basis for the selection of the expected volatility, expected dividend yield and the expected lives of the options. The risk-free interest rate was selected based upon yields of United States Treasury issues with terms equal to the expected life of the option being valued.
The weighted average grant date fair value of stock options granted during 2014, 2013 and 2012 was $27.92, $24.12 and $17.03, respectively.
The total intrinsic value of options exercised during 2014, 2013 and 2012 was $17,223, $12,892 and $13,329, respectively.
Cash received from the exercise of stock options for 2014, 2013 and 2012 was $7,013, $6,018 and $4,934, respectively. The tax benefit realized from tax deductions from exercises for 2014, 2013 and 2012 was $6,385, $5,531 and $4,792, respectively.
Restricted shares and restricted share units — We may grant restricted shares and/or restricted share units to our employees and directors. These shares or units may not be transferred for a designated period of time (generally one to three years) defined at the date of grant.
For employee recipients, in the event of termination of employment due to early retirement, restricted shares granted within 12 months prior to termination are forfeited, and other restricted shares vest on a pro-rata basis. In the event of termination of employment due to retirement at normal retirement age, restricted shares granted within 12 months prior to termination are forfeited, and, for other restricted shares, the restriction period will terminate and the shares will vest and be transferable. Restrictions lapse in the event of a recipient’s disability or death. Termination for any other reason prior to the lapse of any restrictions results in forfeiture of the shares.
For non-employee directors, all restrictions lapse in the event of disability or death of the non-employee director. Termination of service as a director for any other reason within one year of date of grant results in a pro-rata vesting of shares or units.
As shares or units are issued, deferred stock-based compensation equivalent to the fair market value on the date of grant is expensed over the vesting period. Tax benefits arising from the lapse of restrictions are recognized when realized and credited to capital in excess of stated value.
The following table summarizes activity related to restricted shares during 2014:
| Number of Shares |
Weighted-Average Grant Date Fair Value Per Share |
|||||||
| Restricted at October 31, 2013 |
82 | $ | 52.67 | |||||
| Granted |
28 | $ | 73.56 | |||||
| Vested |
(39 | ) | $ | 48.13 | ||||
|
|
|
|||||||
| Restricted at October 31, 2014 |
71 | $ | 63.53 | |||||
|
|
|
|||||||
As of October 31, 2014, there was $2,074 of unrecognized compensation cost related to restricted shares. The cost is expected to be amortized over a weighted average period of 1.7 years. The amount charged to expense related to restricted shares was $1,784, $2,464 and $1,724 in 2014, 2013 and 2012, respectively. These amounts included common share dividends $52, 57, and $53 in 2014, 2013 and 2012, respectively.
The following table summarizes activity related to restricted share units in 2014:
| Number of Units |
Weighted-Average Grant Date Fair Value |
|||||||
| Restricted share units at October 31, 2013 |
12 | $ | 51.79 | |||||
| Granted |
12 | $ | 71.82 | |||||
| Vested |
(19 | ) | $ | 62.07 | ||||
|
|
|
|||||||
| Restricted share units at October 31, 2014 |
5 | $ | 61.59 | |||||
|
|
|
|||||||
67
Table of Contents
Notes to Consolidated Financial Statements — (Continued)
As of October 31, 2014, there was no remaining expense to be recognized related to outstanding restricted share units. The amount charged to expense related to restricted share units during 2014, 2013 and 2012 was $890, $598 and $370, respectively.
Deferred directors’ compensation — Non-employee directors may defer all or part of their cash and equity-based compensation until retirement. Cash compensation may be deferred as cash or as share equivalent units. Deferred cash amounts are recorded as liabilities, and share equivalent units are recorded as equity. Additional share equivalent units are earned when common share dividends are declared.
The following table summarizes activity related to director deferred compensation share equivalent units during 2014:
| Number of Shares |
Weighted-Average Grant Date Fair Value Per Share |
|||||||
| Outstanding at October 31, 2013 |
148 | $ | 23.22 | |||||
| Restricted stock units vested |
13 | $ | 57.43 | |||||
| Dividend equivalents |
1 | $ | 76.49 | |||||
| Distributions |
(52 | ) | $ | 19.20 | ||||
|
|
|
|||||||
| Outstanding at October 31, 2014 |
110 | $ | 29.74 | |||||
|
|
|
|||||||
The amount charged to expense related to director deferred compensation was $101, $183 and $265 in 2014, 2013 and 2012, respectively.
Performance share incentive awards — Executive officers and selected other key employees are eligible to receive common share-based incentive awards. Payouts, in the form of unrestricted common shares, vary based on the degree to which corporate financial performance exceeds predetermined threshold, target and maximum performance levels over three-year performance periods. No payout will occur unless certain threshold performance measures are exceeded.
The amount of compensation expense is based upon current performance projections for each three-year period and the percentage of the requisite service that has been rendered. The calculations are also based upon the grant date fair value determined using the closing market price of our common shares at the grant date, reduced by the implied value of dividends not to be paid. This value was $69.25 per share for 2014, $59.59 per share for 2013 and $42.12 per share for 2012. The amounts charged to expense for executive officers and selected other key employees in 2014, 2013 and 2012 were $4,304, $3,588 and $4,235, respectively. The cumulative amount recorded in shareholders’ equity at October 31, 2014, and 2013 was $7,570 and $8,083, respectively.
Deferred compensation — Our executive officers and other highly compensated employees may elect to defer up to 100 percent of their base pay and cash incentive compensation and, for executive officers, up to 90 percent of their performance share-based incentive payout each year. Additional share units are credited for quarterly dividends paid on our common shares. Expense related to dividends paid under this plan was $129, $79 and $35 for 2014, 2013 and 2012, respectively.
Shares reserved for future issuance — At October 31, 2014, there were 2,430 of common shares reserved for future issuance through the exercise of outstanding options or rights.
68
Table of Contents
Notes to Consolidated Financial Statements — (Continued)
Note 15 — Operating segments and geographic area data
We conduct business in three primary operating segments: Adhesive Dispensing Systems, Advanced Technology Systems, and Industrial Coating Systems. The composition of segments and measure of segment profitability is consistent with that used by our chief operating decision maker. The primary measure used by the chief operating decision maker for purposes of making decisions about allocating resources to the segments and assessing performance is operating profit, which equals sales less cost of sales and certain operating expenses. Items below the operating profit line of the Consolidated Statement of Income (interest and investment income, interest expense and other income/expense) are excluded from the measure of segment profitability reviewed by our chief operating decision maker and are not presented by operating segment. The accounting policies of the segments are generally the same as those described in Note 1, Significant Accounting Policies.
No single customer accounted for 10 percent or more of sales in 2014, 2013 or 2012.
The following table presents information about our reportable segments:
| Adhesive Dispensing Systems |
Advanced Technology Systems |
Industrial Coating Systems |
Corporate | Total | ||||||||||||||||
| Year ended October 31, 2014 |
||||||||||||||||||||
| Net external sales |
$ | 899,696 | $ | 561,784 | $ | 242,541 | $ | — | $ | 1,704,021 | ||||||||||
| Depreciation |
15,467 | 10,433 | 3,368 | 5,178 | 34,446 | |||||||||||||||
| Operating profit (loss) |
229,556 | (a) | 140,240 | (b) | 38,117 | (e) | (40,808 | ) | 367,105 | |||||||||||
| Identifiable assets(c) |
747,063 | 919,052 | 130,624 | 495,676 | (d) | 2,292,415 | ||||||||||||||
| Expenditures for long-lived assets |
15,886 | 15,163 | 4,057 | 8,468 | 43,574 | |||||||||||||||
| Year ended October 31, 2013 |
||||||||||||||||||||
| Net external sales |
$ | 793,488 | $ | 516,266 | $ | 233,167 | $ | — | $ | 1,542,921 | ||||||||||
| Depreciation |
15,326 | 9,180 | 3,084 | 4,176 | 31,766 | |||||||||||||||
| Operating profit (loss) |
203,757 | (a) | 123,403 | (b) | 33,786 | (37,097 | ) | 323,849 | ||||||||||||
| Identifiable assets(c) |
750,616 | 721,524 | 113,835 | 467,809 | (d) | 2,053,784 | ||||||||||||||
| Expenditures for long-lived assets |
20,498 | 10,080 | 6,239 | 10,402 | 47,219 | |||||||||||||||
| Year ended October 31, 2012 |
||||||||||||||||||||
| Net external sales |
$ | 684,096 | $ | 515,992 | $ | 209,490 | $ | — | $ | 1,409,578 | ||||||||||
| Depreciation |
9,540 | 8,711 | 2,704 | 3,514 | 24,469 | |||||||||||||||
| Operating profit (loss) |
211,072 | (a) | 134,074 | 25,933 | (e) | (35,599 | ) | 335,480 | ||||||||||||
| Identifiable assets(c) |
611,357 | 718,354 | 110,982 | 395,331 | (d) | 1,836,024 | ||||||||||||||
| Expenditures for long-lived assets |
14,612 | 6,871 | 4,602 | 4,874 | 30,959 | |||||||||||||||
| (a) | Includes $1,731 and $315 of severance and restructuring costs in 2014 and 2013, respectively. Includes $3,862 of cost of goods sold — restructuring and severance and restructuring costs in 2012. |
| (b) | Includes $579 and $811 of severance and restructuring costs 2014 and 2013, respectively. |
| (c) | Operating segment identifiable assets include notes and accounts receivable net of customer advance payments and allowance for doubtful accounts, inventories net of reserves, property, plant and equipment net of accumulated depreciation and goodwill. |
| (d) | Corporate assets are principally cash and cash equivalents, deferred income taxes, capital leases, headquarter facilities, the major portion of our enterprise management system, and intangible assets. |
| (e) | Includes $241 and $690 of severance and restructuring costs in 2014 and 2012, respectively. |
69
Table of Contents
Notes to Consolidated Financial Statements — (Continued)
We have significant sales and long-lived assets in the following geographic areas:
| 2014 | 2013 | 2012 | ||||||||||
| Net external sales |
||||||||||||
| United States |
$ | 503,776 | $ | 465,789 | $ | 388,904 | ||||||
| Americas |
120,993 | 123,654 | 109,074 | |||||||||
| Europe |
494,538 | 416,725 | 381,005 | |||||||||
| Japan |
127,057 | 127,945 | 127,509 | |||||||||
| Asia Pacific |
457,657 | 408,808 | 403,086 | |||||||||
|
|
|
|
|
|
|
|||||||
| Total net external sales |
$ | 1,704,021 | $ | 1,542,921 | $ | 1,409,578 | ||||||
|
|
|
|
|
|
|
|||||||
| Long-lived assets |
||||||||||||
| United States |
$ | 159,946 | $ | 136,551 | $ | 127,486 | ||||||
| Americas |
2,451 | 4,154 | 3,180 | |||||||||
| Europe |
21,039 | 22,576 | 14,896 | |||||||||
| Japan |
5,967 | 4,384 | 3,431 | |||||||||
| Asia Pacific |
35,036 | 33,314 | 25,938 | |||||||||
|
|
|
|
|
|
|
|||||||
| Total long-lived assets |
$ | 224,439 | $ | 200,979 | $ | 174,931 | ||||||
|
|
|
|
|
|
|
|||||||
A reconciliation of total segment operating income to total consolidated income before income taxes is as follows:
| 2014 | 2013 | 2012 | ||||||||||
| Total profit for reportable segments |
$ | 367,105 | $ | 323,849 | $ | 335,480 | ||||||
| Interest expense |
(15,035 | ) | (14,841 | ) | (11,153 | ) | ||||||
| Interest and investment income |
581 | 421 | 463 | |||||||||
| Other-net |
(138 | ) | 1,694 | 1,463 | ||||||||
|
|
|
|
|
|
|
|||||||
| Income before income taxes |
$ | 352,513 | $ | 311,123 | $ | 326,253 | ||||||
|
|
|
|
|
|
|
|||||||
A reconciliation of total assets for reportable segments to total consolidated assets is as follows:
| 2014 | 2013 | 2012 | ||||||||||
| Total assets for reportable segments |
$ | 2,292,415 | $ | 2,053,784 | $ | 1,836,024 | ||||||
| Customer advance payments |
25,578 | 28,341 | 20,894 | |||||||||
| Eliminations |
(37,863 | ) | (28,946 | ) | (27,403 | ) | ||||||
|
|
|
|
|
|
|
|||||||
| Total consolidated assets |
$ | 2,280,130 | $ | 2,053,179 | $ | 1,829,515 | ||||||
|
|
|
|
|
|
|
|||||||
Note 16 — Supplemental information for the statement of cash flows
| 2014 | 2013 | 2012 | ||||||||||
| Cash operating activities: |
||||||||||||
| Interest paid |
$ | 14,115 | $ | 16,037 | $ | 9,285 | ||||||
| Income taxes paid |
87,797 | 93,074 | 70,935 | |||||||||
| Non-cash investing and financing activities: |
||||||||||||
| Capitalized lease obligations incurred |
$ | 8,584 | $ | 6,441 | $ | 12,981 | ||||||
| Capitalized lease obligations terminated |
864 | 468 | 894 | |||||||||
| Shares acquired and issued through exercise of stock options |
— | 148 | 2,323 | |||||||||
70
Table of Contents
Notes to Consolidated Financial Statements — (Continued)
Note 17 — Quarterly financial data (unaudited)
| First | Second | Third | Fourth | |||||||||||||
| 2014: |
||||||||||||||||
| Sales |
$ | 359,420 | $ | 417,461 | $ | 458,550 | $ | 468,590 | ||||||||
| Gross margin |
194,782 | 235,552 | 257,511 | 257,253 | ||||||||||||
| Net income |
34,880 | 61,934 | 77,879 | 72,080 | ||||||||||||
| Earnings per share: |
||||||||||||||||
| Basic |
0.54 | 0.97 | 1.23 | 1.14 | ||||||||||||
| Diluted |
0.54 | 0.96 | 1.21 | 1.13 | ||||||||||||
| 2013: |
||||||||||||||||
| Sales |
$ | 347,043 | $ | 382,100 | $ | 402,960 | $ | 410,818 | ||||||||
| Gross margin |
197,229 | 216,938 | 225,083 | 226,894 | ||||||||||||
| Net income |
42,011 | 54,605 | 65,424 | 59,777 | ||||||||||||
| Earnings per share: |
||||||||||||||||
| Basic |
0.65 | 0.85 | 1.02 | 0.93 | ||||||||||||
| Diluted |
0.65 | 0.84 | 1.01 | 0.92 | ||||||||||||
The sum of the per-share amounts for the four quarters may not always equal the annual per-share amounts due to differences in the average number of shares outstanding during the respective periods.
During the fourth quarter of 2014, we recorded pre-tax severance costs of $1,273. Additionally, we recorded a pre-tax gain of $1,005 related to a property insurance settlement.
During the second quarter of 2014, we recorded pre-tax severance costs of $1,278.
During the third quarter of 2013, we recorded a pre-tax gain of $2,116 on the sale of real estate in China.
During the first quarter of 2013, we recorded a favorable adjustment to unrecognized tax benefits of $900 primarily related to expiration of certain foreign statutes of limitations. On January 2, 2013, the American Taxpayer Relief Act of 2012 was enacted which retroactively reinstated and extended the Federal Research and Development Tax Credit (Federal R&D Tax Credit) from January 1, 2012 to December 31, 2013 and extended certain other tax provisions. As a result, our income tax provision for the first quarter of 2013 included a discrete tax benefit of $1,700 related to 2012.
Note 18 — Contingencies
We are involved in pending or potential litigation regarding environmental, product liability, patent, contract, employee and other matters arising from the normal course of business. Including the environmental matter discussed below, it is our opinion, after consultation with legal counsel, that resolutions of these matters are not expected to result in a material effect on our financial condition, quarterly or annual operating results or cash flows.
Environmental — We have voluntarily agreed with the City of New Richmond, Wisconsin and other Potentially Responsible Parties to share costs associated with the remediation of the City of New Richmond municipal landfill (the “Site”) and constructing a potable water delivery system serving the impacted area down gradient of the Site. At October 31, 2014, and 2013 our accrual for the ongoing operation, maintenance and monitoring obligation at the Site was $615 and $668, respectively. The liability for environmental remediation represents management’s best estimate of the probable and reasonably estimable undiscounted costs related to known remediation obligations. The accuracy of our estimate of environmental liability is affected by several uncertainties such as additional requirements that may be identified in connection with remedial activities, the complexity and evolution of environmental laws and regulations, and the identification of presently unknown remediation requirements. Consequently, our liability could be different than our current estimate. However, we do not expect that the costs associated with remediation will have a material adverse effect on our financial condition or results of operations.
71
Table of Contents
Management’s Report on Internal Control Over Financial Reporting
The management of Nordson Corporation is responsible for establishing and maintaining adequate internal control over financial reporting.
Using criteria set forth by the Committee of Sponsoring Organizations of the Treadway Commission (COSO) in Internal Control-Integrated Framework (1992 framework), Nordson’s management assessed the effectiveness of our internal control over financial reporting as of October 31, 2014.
We acquired Avalon Laboratories (Avalon) and Dima Group B.V. (Dima) on August 8, 2014 and August 29, 2014, respectively. They represented 9 percent of our total assets as of October 31, 2014. As the acquisitions occurred during the last 12 months, the scope of our assessment of the effectiveness of internal control over financial reporting does not include Avalon and Dima. This exclusion is in accordance with the SEC’s general guidance that assessments of recently acquired businesses may be omitted from our scope in the year of acquisition.
Based on our assessment, management concluded that our internal control over financial reporting was effective as of October 31, 2014.
The independent registered public accounting firm, Ernst & Young LLP, has also audited the effectiveness of our internal control over financial reporting as of October 31, 2014. Their report is included herein.
| /s/ MICHAEL F. HILTON |
/s/ GREGORY A. THAXTON | |||
| President and Chief Executive Officer | Senior Vice President, Chief Financial Officer | |||
| December 15, 2014 | December 15, 2014 |
72
Table of Contents
Report of Independent Registered Public Accounting Firm
The Board of Directors and Shareholders of Nordson Corporation
We have audited Nordson Corporation’s internal control over financial reporting as of October 31, 2014, based on criteria established in Internal Control — Integrated Framework issued by the Committee of Sponsoring Organizations of the Treadway Commission (1992 framework) (the COSO criteria). Nordson Corporation’s management is responsible for maintaining effective internal control over financial reporting, and for its assessment of the effectiveness of internal control over financial reporting included in the accompanying “Management’s Report on Internal Control Over Financial Reporting”. Our responsibility is to express an opinion on the company’s internal control over financial reporting based on our audit.
We conducted our audit in accordance with the standards of the Public Company Accounting Oversight Board (United States). Those standards require that we plan and perform the audit to obtain reasonable assurance about whether effective internal control over financial reporting was maintained in all material respects. Our audit included obtaining an understanding of internal control over financial reporting, assessing the risk that a material weakness exists, testing and evaluating the design and operating effectiveness of internal control based on the assessed risk, and performing such other procedures as we considered necessary in the circumstances. We believe that our audit provides a reasonable basis for our opinion.
A company’s internal control over financial reporting is a process designed to provide reasonable assurance regarding the reliability of financial reporting and the preparation of financial statements for external purposes in accordance with generally accepted accounting principles. A company’s internal control over financial reporting includes those policies and procedures that (1) pertain to the maintenance of records that, in reasonable detail, accurately and fairly reflect the transactions and dispositions of the assets of the company; (2) provide reasonable assurance that transactions are recorded as necessary to permit preparation of financial statements in accordance with generally accepted accounting principles, and that receipts and expenditures of the company are being made only in accordance with authorizations of management and directors of the company; and (3) provide reasonable assurance regarding prevention or timely detection of unauthorized acquisition, use, or disposition of the company’s assets that could have a material effect on the financial statements.
Because of its inherent limitations, internal control over financial reporting may not prevent or detect misstatements. Also, projections of any evaluation of effectiveness to future periods are subject to the risk that controls may become inadequate because of changes in conditions, or that the degree of compliance with the policies or procedures may deteriorate.
As indicated in the accompanying Management’s Report on Internal Control Over Financial Reporting, management’s assessment of and conclusion on the effectiveness of internal control over financial reporting did not include the internal controls of Avalon Laboratories and Dima Group B.V., which are included in the 2014 consolidated financial statements of Nordson Corporation and constituted 9 percent of total assets as of October 31, 2014. Our audit of internal control over financial reporting of Nordson Corporation also did not include an evaluation of the internal control over financial reporting of the Avalon Laboratories and Dima Group B.V.
In our opinion, Nordson Corporation maintained, in all material respects, effective internal control over financial reporting as of October 31, 2014, based on the COSO criteria.
We also have audited, in accordance with the standards of the Public Company Accounting Oversight Board (United States), the consolidated balance sheets of Nordson Corporation as of October 31, 2014 and 2013, and the related consolidated statements of income, comprehensive income, shareholders’ equity, and cash flows for each of the three years in the period ended October 31, 2014 of Nordson Corporation and our report dated December 15, 2014 expressed an unqualified opinion thereon.

Cleveland, Ohio
December 15, 2014
73
Table of Contents
Report of Independent Registered Public Accounting Firm
The Board of Directors and Shareholders of Nordson Corporation
We have audited the accompanying consolidated balance sheets of Nordson Corporation as of October 31, 2014 and 2013 and the related consolidated statements of income, comprehensive income, shareholders’ equity, and cash flows for each of the three years in the period ended October 31, 2014. Our audits also included the financial statement schedule listed in the Index at Item 15(a). These financial statements and schedule are the responsibility of the Company’s management. Our responsibility is to express an opinion on these financial statements and schedule based on our audits.
We conducted our audits in accordance with the standards of the Public Company Accounting Oversight Board (United States). Those standards require that we plan and perform the audit to obtain reasonable assurance about whether the financial statements are free of material misstatement. An audit includes examining, on a test basis, evidence supporting the amounts and disclosures in the financial statements. An audit also includes assessing the accounting principles used and significant estimates made by management, as well as evaluating the overall financial statement presentation. We believe that our audits provide a reasonable basis for our opinion.
In our opinion, the financial statements referred to above present fairly, in all material respects, the consolidated financial position of Nordson Corporation at October 31, 2014 and 2013, and the consolidated results of its operations and its cash flows for each of the three years in the period ended October 31, 2014, in conformity with US generally accepted accounting principles. Also, in our opinion, the related financial statement schedule, when considered in relation to the basic financial statements taken as a whole, presents fairly in all material respects the information set forth therein.
We also have audited, in accordance with the standards of the Public Company Accounting Oversight Board (United States), Nordson Corporation’s internal control over financial reporting as of October 31, 2014, based on criteria established in Internal Control-Integrated Framework issued by the Committee of Sponsoring Organizations of the Treadway Commission (1992 framework) and our report dated December 15, 2014 expressed an unqualified opinion thereon.
Cleveland, Ohio
December 15, 2014
74
Table of Contents
| Item 9. | Changes in and Disagreements with Accountants on Accounting and Financial Disclosure |
None.
| Item 9A. | Controls and Procedures |
(a) Evaluation of disclosure controls and procedures. Our management, with the participation of the principal executive officer (president and chief executive officer) and the principal financial officer (senior vice president and chief financial officer), has reviewed and evaluated our disclosure controls and procedures (as defined in the Securities Exchange Act Rule 13a-15e) as of October 31, 2014. Based on that evaluation, our management, including the principal executive and financial officers, has concluded that our disclosure controls and procedures were effective as of October 31, 2014 in ensuring that information required to be disclosed in the reports that we file or submit under the Securities Exchange Act of 1934 is recorded, processed, summarized and reported within the time periods specified in the SEC’s rules and forms and is accumulated and communicated to our management, including the principal executive officer and the principal financial officer, as appropriate to allow timely decisions regarding required disclosure.
(b) Management’s report on internal control over financial reporting. The Report of Management on Internal Control over Financial Reporting and the Report of Independent Registered Public Accounting Firm thereon are set forth in Part II, Item 8 of this Annual Report on Form 10-K.
(c) Changes in internal control over reporting. There were no changes in our internal controls over financial reporting that occurred during the fourth quarter of 2014 that have materially affected, or are reasonably likely to materially affect, our internal control over financial reporting.
| Item 9B. | Other Information |
None.
| Item 10. | Directors, Executive Officers and Corporate Governance |
The information required by this Item is incorporated by reference to the captions “Election of Directors” and “Section 16(a) Beneficial Ownership Reporting Compliance” of our definitive Proxy Statement for the 2015 Annual Meeting of Shareholders. Information regarding Audit Committee financial experts is incorporated by reference to the caption “Election of Directors” of our definitive Proxy Statement for the 2015 Annual Meeting of Shareholders.
Our executive officers serve for a term of one year from date of election to the next organizational meeting of the board of directors and until their respective successors are elected and qualified, except in the case of death, resignation or removal. Information concerning executive officers is contained in Part I of this report under the caption “Executive Officers of the Company.”
We have adopted a code of ethics for all employees and directors, including the principal executive officer, other executive officers, principal finance officer and other finance personnel. A copy of the code of ethics is available free of charge on our Web site at http://www.nordson.com/governance. We intend to satisfy our disclosure requirement under Item 5.05 of Form 8-K regarding any amendment to or waiver of a provision of our code of ethics that applies to our principal executive officer, principal financial officer, principal accounting officer or controller or persons performing similar functions and that relates to any element of the code of ethics definition enumerated in Item 406(b) of Regulation S-K by posting such information on our Web site.
75
Table of Contents
| Item 11. | Executive Compensation |
The information required by this Item is incorporated by reference to the captions “Directors Compensation for Fiscal Year 2014,” “Summary Compensation for Fiscal Year 2014,” “Grants of Plan-Based Awards for Fiscal Year 2014,” “Option Exercises and Stock Vested for Fiscal Year 2014,” “Pension Benefits for Fiscal Year 2014,” “Nonqualified Deferred Compensation for Fiscal Year 2014” and “Potential Payments Upon Termination or Change of Control” in our definitive Proxy Statement for the 2015 Annual Meeting of Shareholders.
| Item 12. | Security Ownership of Certain Beneficial Owners and Management and Related Stockholder Matters |
The information required by this Item is incorporated by reference to the caption “Ownership of Nordson Common Shares” in our definitive Proxy Statement for the 2015 Annual Meeting of Shareholders.
The following table sets forth information regarding equity compensation plans in effect as of October 31, 2014:
| Plan category |
Number of securities to be issued upon exercise of outstanding options, warrants and rights |
Weighted-average exercise price of outstanding options, warrants and rights |
Number of securities remaining available for future issuance under equity compensation plans (excluding securities reflected in first reporting column) |
|||||||||
| Equity compensation plans approved by security holders |
1,686 | $ | 42.77 | 2,900 | ||||||||
| Equity compensation plans not approved by security holders |
— | — | — | |||||||||
|
|
|
|
|
|
|
|||||||
| Total |
1,686 | $ | 42.77 | 2,900 | ||||||||
|
|
|
|
|
|
|
|||||||
| Item 13. | Certain Relationships and Related Transactions, and Director Independence |
The information required by this Item is incorporated by reference to the caption “Review of Transactions with Related Persons” in our definitive Proxy Statement for the 2015 Annual Meeting of Shareholders.
| Item 14. | Principal Accountant Fees and Services |
The information required by this Item is incorporated by reference to the caption “Fees Paid to Ernst and Young LLP” in our definitive Proxy Statement for the 2015 Annual Meeting of Shareholders.
76
Table of Contents
| Item 15. | Exhibits and Financial Statement Schedule |
The following are filed as part of this report:
The following financial statements are included in Part II, Item 8:
Consolidated Statements of Income for each of the three years in the period ending October 31, 2014
Consolidated Statements of Comprehensive Income for each of the three years in the period ending October 31, 2014
Consolidated Balance Sheets as of October 31, 2014 and October 31, 2013
Consolidated Statements of Shareholders’ Equity for each of the three years in the period ending October 31, 2014
Consolidated Statements of Cash Flows for each of the three years in the period ending October 31, 2014
Notes to Consolidated Financial Statements
Reports of Independent Registered Public Accounting Firm
(a) 2. Financial Statement Schedule
Schedule II Valuation and Qualifying Accounts and Reserves for each of the three years in the period ending October 31, 2014.
No other consolidated financial statement schedules are presented because the schedules are not required, because the required information is not present or not present in amounts sufficient to require submission of the schedule, or because the information required is included in the financial statements, including the notes thereto.
The exhibits listed on the accompanying index to exhibits are filed as part of this Annual Report on Form 10-K.
77
Table of Contents
Pursuant to the requirements of Section 13 or 15(d) of the Securities Exchange Act of 1934, the Registrant has duly caused this report to be signed on its behalf by the undersigned, thereunto duly authorized.
NORDSON CORPORATION
Date: December 15, 2014
| By: /s/ GREGORY A. THAXTON |
| Gregory A. Thaxton |
| Senior Vice President, Chief Financial Officer |
Pursuant to the requirements of the Securities Exchange Act of 1934, this report has been signed below by the following persons on behalf of the Registrant and in the capacities and on the dates indicated.
| /s/ MICHAEL F. HILTON |
December 15, 2014 | |||
| Michael F. Hilton |
||||
| Director, President and |
||||
| Chief Executive Officer |
||||
| (Principal Executive Officer) |
||||
| /s/ GREGORY A. THAXTON |
December 15, 2014 | |||
| Gregory A. Thaxton |
||||
| Senior Vice President, Chief Financial Officer |
||||
| (Principal Financial Officer) |
||||
| (Principal Accounting Officer) |
||||
| /s/ JOSEPH P. KEITHLEY |
December 15, 2014 | |||
| Joseph P. Keithley |
||||
| Chairman of the Board |
||||
| /s/ LEE C. BANKS |
December 15, 2014 | |||
| Lee C. Banks |
||||
| Director |
||||
| /s/ RANDOLPH W. CARSON |
December 15, 2014 | |||
| Randolph W. Carson |
||||
| Director |
||||
78
Table of Contents
Signatures — (Continued)
| /s/ ARTHUR L. GEORGE, JR. |
December 15, 2014 | |||
| Arthur L. George, Jr. |
||||
| Director |
||||
| /s/ FRANK M. JAEHNERT |
December 15, 2014 | |||
| Frank M. Jaehnert |
||||
| Director |
||||
| /s/ MICHAEL J. MERRIMAN, JR. |
December 15, 2014 | |||
| Michael J. Merriman, Jr. |
||||
| Director |
||||
| /s/ MARY G. PUMA |
December 15, 2014 | |||
| Mary G. Puma |
||||
| Director |
||||
| /s/ VICTOR L. RICHEY, JR. |
December 15, 2014 | |||
| Victor L. Richey, Jr. |
||||
| Director |
79
Table of Contents
Schedule II – Valuation and Qualifying Accounts and Reserves
| Balance at Beginning of Year |
Assumed from Acquisitions |
Charged to Expense |
Deductions | Currency Effects |
Balance at End of Year |
|||||||||||||||||||
| Allowance for Doubtful Accounts |
||||||||||||||||||||||||
| 2012 |
$ | 3,311 | 648 | 710 | 801 | (92 | ) | $ | 3,776 | |||||||||||||||
| 2013 |
$ | 3,776 | 256 | 889 | 698 | 42 | $ | 4,265 | ||||||||||||||||
| 2014 |
$ | 4,265 | 121 | 867 | 551 | (215 | ) | $ | 4,487 | |||||||||||||||
| Inventory Obsolescence and Other Reserves |
||||||||||||||||||||||||
| 2012 |
$ | 16,050 | 2,071 | 6,033 | 3,237 | (412 | ) | $ | 20,505 | |||||||||||||||
| 2013 |
$ | 20,505 | 3,969 | 5,075 | 2,961 | (9 | ) | $ | 26,579 | |||||||||||||||
| 2014 |
$ | 26,579 | 1,045 | 6,706 | 6,361 | (1,225 | ) | $ | 26,744 | |||||||||||||||
80
Table of Contents
NORDSON CORPORATION
(Item 15(a) (3))
| Exhibit |
Description | |
| (3) | Articles of Incorporation and By-Laws | |
| 3-a | 1989 Amended Articles of Incorporation (incorporated herein by reference to Exhibit 3-a to Registrant’s Annual Report on Form 10-K for the year ended October 31, 2011) | |
| 3-a-1 | Certificate of Amendment to 1989 Amended Articles of Incorporation (incorporated herein by reference to Exhibit 3-a-1 to Registrant’s Annual Report on Form 10-K for the year ended October 31, 2011) | |
| 3-b | 1998 Amended Regulations (incorporated herein by reference to Exhibit 3-b to Registrant’s Annual Report on Form 10-K for the year ended October 31, 2010) | |
| (4) | Instruments Defining the Rights of Security Holders, including indentures | |
| 4-b | Note Purchase and Private Shelf Agreement for $150 million between Nordson Corporation and New York Life Investment Management LLC dated as of June 30, 2011 (incorporated herein by reference to Exhibit 4.1 to Registrant’s Quarterly Report on Form 10-Q for the quarter ended July 31, 2011) | |
| 4-c | $500 million Credit Agreement dated December 9, 2011 between Nordson Corporation and various financial institutions (incorporated herein by reference to Exhibit 4.1 to Registrant’s Form 8-K dated December 12, 2011) | |
| 4-e | Master Note Purchase Agreement dated July 26, 2012 between Nordson Corporation and the purchasers listed therein (incorporated herein by reference to Exhibit 4.2 to Registrant’s Quarterly Report on Form 10-Q for the quarter ended July 31, 2012) | |
| 4-f | Second Amendment to the Note Purchase and Private Shelf Agreement dated as of February 12, 2013 between Nordson Corporation and New York Life Investment Management LLC (incorporated herein by reference to Exhibit 4.1 to Registrant’s Quarterly Report on Form 10-Q for the quarter ended January 31, 2013) | |
| 4-g | Credit Agreement dated August 6, 2014 by and among Nordson Corporation, PNC Bank National Association and PNC Capital Markets LLC (incorporated herein by reference to Exhibit 10.3 to Registrant’s Quarterly Report on Form 10-Q for the quarter ended July 31, 2014) | |
| (10) | Material Contracts | |
| 10-a | Amended and Restated Nordson Corporation 2004 Management Incentive Compensation Plan (incorporated herein by reference to Exhibit 10-a to Registrant’s Annual Report on Form 10-K for the year ended October 31, 2013)* | |
| 10-b-1 | Nordson Corporation 2005 Deferred Compensation Plan (incorporated herein by reference to Exhibit 10-b-1 to Registrant’s Annual Report on Form 10-K for the year ended October 31, 2010)* | |
| 10-b-2 | Nordson Corporation 2005 Deferred Compensation Plan (as Amended and Restated Effective January 1, 2009) * | |
| 10-c | Resolution of Board of Directors Authorizing Execution of Indemnification Agreements (incorporated herein by reference to Exhibit 10-c to Registrant’s Annual Report on Form 10-K for the year ended October 31, 2013)* | |
| 10-d | Restated Nordson Corporation Excess Defined Contribution Retirement Plan Agreement (incorporated herein by reference to Exhibit 10-d to Registrant’s Annual Report on Form 10-K for the year ended October 31, 2009) * | |
| 10-d-1 | First Amendment to Nordson Corporation Excess Defined Contribution Retirement Plan (incorporated herein by reference to Exhibit 10-d-1 to Registrant’s Annual Report on Form 10-K for the year ended October 31, 2012)* |
81
Table of Contents
Index to Exhibits — Continued
| Exhibit |
Description | |
| 10-d-2 | Nordson Corporation 2005 Excess Defined Contribution Benefit Plan (incorporated herein by reference to Exhibit 10-d-2 to Registrant’s Annual Report on Form 10-K for the year ended October 31, 2011)* | |
| 10-d-3 | Nordson Corporation 2005 Excess Defined Contribution Retirement Plan (as Amended and Restated Effective January 1, 2009)* | |
| 10-e | Nordson Corporation Excess Defined Benefit Pension Plan (incorporated herein by reference to Exhibit 10-d to Registrant’s Annual Report on Form 10-K for the year ended October 31, 2009)* | |
| 10-e-1 | Second Amendment to Nordson Corporation Excess Defined Benefit Pension Plan (incorporated herein by reference to Exhibit 10-e-1 to Registrant’s Annual Report on Form 10-K for the year ended October 31, 2012)* | |
| 10-e-2 | Nordson Corporation 2005 Excess Defined Benefit Pension Plan (incorporated herein by reference to Exhibit 10-e-2 to Registrant’s Annual Report on Form 10-K for the year ended October 31, 2010)* | |
| 10-e-3 | Nordson Corporation 2005 Excess Defined Benefit Pension Plan (as Amended and Restated Effective January 1, 2009)* | |
| 10-g-1 | Amended and Restated Nordson Corporation 2004 Long-Term Performance Plan (incorporated herein by reference to Exhibit 10-g-1 to Registrant’s Annual Report on Form 10-K for the year ended October 31, 2013)* | |
| 10-g-2 | Nordson Corporation 2012 Stock Incentive and Award Plan (incorporated by reference to Exhibit 10.1 to Registrant’s Form 8-K dated March 4, 2013)* | |
| 10-g-3 | Nordson Corporation 2012 Stock Incentive and Award Plan, Form of Notice of Award (as amended November 24, 2014)* | |
| 10-g-4 | Nordson Corporation 2012 Stock Incentive and Award Plan, Form of Notice of Award (as amended November 24, 2014)* | |
| 10-g-5 | Nordson Corporation 2012 Stock Incentive and Award Plan, Directors’ Deferred Compensation Sub-Plan (incorporated herein by reference to Exhibit 10-g -5 to Registrant’s Annual Report on Form 10-K for the year ended October 31, 2013)* | |
| 10-g-6 | Nordson Corporation 2012 Stock Incentive and Award Plan, Directors’ Deferred Compensation Sub-Plan, Form of Notice of Award (incorporated herein by reference to Exhibit 10-g-6 to Registrant’s Annual Report on Form 10-K for the year ended October 31, 2013)* | |
| 10-h | Assurance Trust Agreement between Nordson Corporation and Key Trust Company of Ohio, N.A. amended and restated as of January 22, 2014 (incorporated herein by reference to Exhibit 10.1 to Registrant’s Quarterly Report on Form 10-Q for the quarter ended January 31, 2014) | |
| 10-h-1 | Form of Change in Control Retention Agreement between the Registrant and Executive Officers* | |
| 10-i | Compensation Committee Rules of the Nordson Corporation 2004 Long Term Performance Plan governing directors’ deferred compensation (incorporated herein by reference to Exhibit 10-i to Registrant’s Annual Report on Form 10-K for the year ended October 31, 2010)* | |
| 10-j | Compensation Committee Rules of the Nordson Corporation Amended and Restated Nordson Corporation 2004 Long Term Performance Plan governing directors’ deferred compensation (incorporated herein by reference to Exhibit 10-j to Registrant’s Annual Report on Form 10-K for the year ended October 31, 2010)* | |
| 10-m | Employment Agreement between Registrant and Michael F. Hilton (incorporated herein by reference to Exhibit 99.3 to Registrant’s Form 8-K dated December 21, 2009)* |
82
Table of Contents
Index to Exhibits — Continued
| Exhibit |
Description | |
| 10-n | Employment Agreement (Change in Control Retention Agreement) between Registrant and Michael F. Hilton (incorporated herein by reference to Exhibit 99.4 to Registrant’s Form 8-K dated December 21, 2009)* | |
| 10-o | Supplemental Retirement Agreement between the Registrant and Michael F. Hilton (incorporated herein by reference to Exhibit 10-o to Registrant’s Annual Report on Form 10-K for the year ended October 31, 2010)* | |
| 10-p | Stock Purchase Agreement by and among VP Acquisition Holdings, Inc., the Stockholders of VP Acquisition Holdings, Inc., the Optionholders of VP Acquisition Holdings, Inc., American Capital, Ltd., as Securityholder Representative, and Nordson Corporation dated as of July 15, 2011 (incorporated herein by reference to Exhibit 4.1 to Registrant’s Quarterly Report on Form 10-Q for the quarter ended July 31, 2011) | |
| 10-q | Stock Purchase Agreement Dated May 18, 2012 by and among Nordson Corporation and Bertram Growth Capital I, Bertram Growth Capital II, Bertram Growth Capital II-A, and EDI Holdings, Inc. (incorporated herein by reference to Exhibit 10.1 to Registrant’s Quarterly Report on Form 10-Q for the quarter ended July 31, 2012) | |
| 10-r | Agreement and Plan of Merger by and among Xaloy Superior Holdings, Inc., Nordson Corporation, Buckeye Merger Corp. and Sellers’ Representative dated as of June 2, 2012 (incorporated herein by reference to Exhibit 10.2 to Registrant’s Quarterly Report on Form 10-Q for the quarter ended July 31, 2012) | |
| 10-s | Sale and Purchase Agreement dated July 16, 2013 relating to Kreyenborg and BKG between Mr. Jan-Udo Kreyenborg, Kreyenborg Verwaltungen und Beteiligungen GmbH & Co. KG, Kreyenborg Verwaltungs-GmbH and Nordson Corporation (incorporated herein by reference to Exhibit 10.1 to Registrant’s Quarterly Report on Form 10-Q for the quarter ended July 31, 2013) | |
| 10-t | Agreement and Primary Release of Claims dated June 24, 2014 between Registrant and Peter G. Lambert (incorporated herein by reference to Exhibit 10.1 to Registrant’s Quarterly Report on Form 10-Q for the quarter ended July 31, 2014) | |
| 10-u | Agreement and Plan of Merger by and among Avalon Laboratories Holding Corp., Nordson Medical Corporation, Arriba Merger Corp., American Capital Equity III, LP, as Securityholders’ Representative and for the limited purposes set forth herein, Nordson Corporation, dated as of August 1, 2014 (incorporated herein by reference to Exhibit 10.2 to Registrant’s Quarterly Report on Form 10-Q for the quarter ended July 31, 2014) | |
| (21) | Subsidiaries of the Registrant | |
| (23) | Consent of Independent Registered Public Accounting Firm | |
| 31.1 | Certification pursuant to Rule 13a-14(a)/15d-14(a) of the Securities Exchange Act of 1934 by the Chief Executive Officer, as adopted pursuant to Section 302 of the Sarbanes-Oxley Act of 2002 | |
| 31.2 | Certification pursuant to Rule 13a-14(a)/15d-14(a) of the Securities Exchange Act of 1934 by the Chief Financial Officer, as adopted pursuant to Section 302 of the Sarbanes-Oxley Act of 2002 | |
| 32.1 | Certification of CEO pursuant to 18 U.S.C. Section 1350, as adopted pursuant to Section 906 of the Sarbanes-Oxley Act of 2002 | |
| 32.2 | Certification of CFO pursuant to 18 U.S.C. Section 1350, as adopted pursuant to Section 906 of the Sarbanes-Oxley Act of 2002 | |
| 99-a | Form S-8 Undertakings (Nos. 33-18309 and 33-33481) |
83
Table of Contents
Index to Exhibits — Continued
| Exhibit |
Description | |
| 101 | The following financial information from Nordson Corporation’s Annual Report on Form 10-K for the year ended October 31, 2014, formatted in Extensible Business Reporting Language (XBRL): (i) the Consolidated Statements of Income for the years ended October 31, 2014, 2013 and 2012, (ii) the Consolidated Statements of Comprehensive Income for the years ended October 31, 2014, 2013 and 2012 (iii) the Consolidated Balance Sheets at October 31, 2014 and 2013, (iv) the Consolidated Statements of Changes in Shareholders’ Equity for the years ended October 31, 2014, 2013 and 2012, (v) the Consolidated Statements of Cash Flows for the years ended October 31, 2014, 2013 and 2012, and (vi) Notes to Consolidated Financial Statements. |
*Indicates management contract or compensatory plan, contract or arrangement in which one or more directors and/or executive officers of Nordson Corporation may be participants.
84