Attached files
| file | filename |
|---|---|
| EXCEL - IDEA: XBRL DOCUMENT - Corium International, Inc. | Financial_Report.xls |
| EX-23.1 - EX-23.1 - Corium International, Inc. | a2222351zex-23_1.htm |
| EX-32.2 - EX-32.2 - Corium International, Inc. | a2222351zex-32_2.htm |
| EX-31.2 - EX-31.2 - Corium International, Inc. | a2222351zex-31_2.htm |
| EX-31.1 - EX-31.1 - Corium International, Inc. | a2222351zex-31_1.htm |
| EX-32.1 - EX-32.1 - Corium International, Inc. | a2222351zex-32_1.htm |
| EX-10.27 - EX-10.27 - Corium International, Inc. | a2222351zex-10_27.htm |
Use these links to rapidly review the document
TABLE OF CONTENTS
UNITED STATES
SECURITIES AND EXCHANGE COMMISSION
Washington, D.C. 20549
FORM 10-K
ý |
Annual Report pursuant to Section 13 or 15(d) of the Securities Exchange Act of 1934 |
|
For the fiscal year ended September 30, 2014 |
||
OR |
||
o |
Transition report pursuant to Section 13 or 15(d) of the Securities Exchange Act of 1934 |
|
For the transition period from to . |
||
Commission File Number: 001-36375
![]()
Corium International, Inc.
(Exact name of registrant as specified in its charter)
| Delaware (State or other jurisdiction of incorporation or organization) |
38-3230774 (I.R.S. Employer Identification Number) |
Corium International, Inc.
235 Constitution Drive
Menlo Park, California 94025
(Address of principal executive offices and zip code)
(650) 298-8255
(Registrant's telephone number, including area code)
Securities registered pursuant to Section 12(b) of the Act:
| Title of each class | Name of each exchange on which registered | |
|---|---|---|
| Common stock, par value $0.001 per share | The NASDAQ Global Market |
Securities registered pursuant to section 12(g) of the Act: None
Indicate by check mark if the Registrant is a well-known seasoned issuer, as defined in Rule 405 of the Securities Act. Yes o No ý
Indicate by check mark if the Registrant is not required to file reports pursuant to Section 13 or Section 15(d) of Act. Yes o No ý
Indicate by check mark whether the Registrant (1) has filed all reports required to be filed by Section 13 or 15(d) of the Securities Exchange Act of 1934 during the preceding 12 months (or for such shorter period that the Registrant was required to file such reports), and (2) has been subject to such filing requirements for the past 90 days. Yes ý No o
Indicate by check mark whether the Registrant has submitted electronically and posted on its corporate Website, if any, every Interactive Data File required to be submitted and posted pursuant to Rule 405 of Regulation S-T (§232.405 of this chapter) during the preceding 12 months (or for such shorter period that the Registrant was required to submit and post such files). Yes ý No o
Indicate by check mark if disclosure of delinquent filers pursuant to Item 405 of Regulation S-K (§229.405 of this chapter) is not contained herein, and will not be contained, to the best of Registrant's knowledge, in definitive proxy or information statements incorporated by reference in Part III of this Form 10-K or any amendment to this Form 10-K. o
Indicate by check mark whether the Registrant is a large accelerated filer, an accelerated filer, a non-accelerated filer or a smaller reporting company. See the definitions of "large accelerated filer," "accelerated filer" and "smaller reporting company" in Rule 12b-2 of the Exchange Act. (Check one):
| Large accelerated filer o | Accelerated filer o | Non-accelerated filer ý (Do not check if a smaller reporting company) |
Smaller reporting company o |
Indicate by check mark whether the Registrant is a shell company (as defined in Rule 12b-2 of the Act). Yes o No ý
The aggregate market value of the voting stock held by non-affiliates of the Registrant on April 3, 2014, based upon the closing price of $8.00 of the Registrant's common stock as reported on the NASDAQ Global Market, was approximately $69.3 million. The Registrant has elected to use April 3, 2014 as the calculation date, which was the initial trading date of the Registrant's common stock on the NASDAQ Global Market because the Registrant was a privately-held company on March 31, 2014 (the last business day of the Registrant's second fiscal quarter).
As of December 11, 2014, there were approximately 18,070,838 shares of the Registrant's common stock outstanding.
DOCUMENTS INCORPORATED BY REFERENCE
Portions of the Registrant's definitive proxy statement for its 2015 Annual Meeting of Stockholders (the "Proxy Statement"), to be filed within 120 days of the Registrant's fiscal year ended September 30, 2014, are incorporated by reference in Part II and Part III of this Report on Form 10-K. Except with respect to information specifically incorporated by reference in this Form 10-K, the Proxy Statement is not deemed to be filed as part of this Form 10-K.
i
NOTE ABOUT FORWARD-LOOKING STATEMENTS
This report contains forward-looking statements within the meaning of the Private Securities Litigation Reform Act of 1995. All statements contained in this report other than statements of historical fact, including statements regarding our future results of operations and financial position, our business strategy and plans and our objectives for future operations, are forward-looking statements. The words "believe," "may," "will," "potentially," "estimate," "continue," "anticipate," "intend," "could," "would," "project," "plan," "expect," "seek" and similar expressions are intended to identify forward-looking statements. We have based these forward-looking statements largely on our current expectations and projections about future events and trends that we believe may affect our financial condition, results of operations, business strategy, short-term and long-term business operations and objectives and financial needs. These forward-looking statements are subject to a number of risks, uncertainties and assumptions, including those described in the "Risk Factors" section and elsewhere in this report. Moreover, we operate in a very competitive and rapidly changing environment, and new risks emerge from time to time. It is not possible for our management to predict all risks, nor can we assess the impact of all factors on our business or the extent to which any factor, or combination of factors, may cause actual results to differ materially from those contained in any forward-looking statements we may make. In light of these risks, uncertainties and assumptions, the forward-looking events and circumstances discussed in this report may not occur and actual results could differ materially and adversely from those anticipated or implied in the forward-looking statements.
You should not rely upon forward-looking statements as predictions of future events. Although we believe that the expectations reflected in the forward-looking statements are reasonable, we cannot guarantee that the future results, levels of activity, performance or events and circumstances reflected in the forward-looking statements will be achieved or occur. We undertake no obligation to update publicly any forward-looking statements for any reason after the date of this report to conform these statements to actual results or to changes in our expectations, except as required by law.
As used in this report, the terms "Corium," "we," "us," and "our" mean Corium International, Inc. unless the context indicates otherwise.
ii
Overview
We are a commercial stage biopharmaceutical company focused on the development, manufacture and commercialization of specialty pharmaceutical products that leverage our broad experience in transdermal and transmucosal delivery systems. Together with our partners, we have successfully developed six marketed products in the prescription drug and consumer markets, and we are the sole commercial supplier of each of those products for our marketing partners. These marketed products are Clonidine Transdermal Delivery System, or TDS, Fentanyl TDS and four Crest Advanced Seal Whitestrips products. We use our novel transdermal and transmucosal approaches to bring new products to markets that present significant opportunities. Our development platforms enable transdermal delivery of large molecules, or biologics, including vaccines, peptides and proteins, as well as small molecules that are otherwise difficult to deliver in a transdermal dosage form. Our pipeline includes two partnered products that are the subject of pending drug marketing applications to the U.S. Food and Drug Administration, or FDA. In addition, we have 12 partner- or self-funded programs at earlier stages.
We have built significant know-how and experience in the development, scale-up and manufacture of complex specialty products and have formed relationships with our partners that include both the development of new product formulations and our manufacture of the resulting products. Our partners include The Procter & Gamble Company, or P&G, Par Pharmaceutical, Inc., Teva Pharmaceuticals USA, Inc. and Agile Therapeutics, Inc., as well as several other multinational pharmaceutical companies. We have the capability to develop and manufacture our own product candidates and are one of only a few independent companies that develops and manufactures transdermal products for other parties.
Transdermal drug delivery is the transport of drugs through the skin for absorption into the body. We have developed two proprietary technology platforms, Corplex™ and MicroCor®, that we believe offer significant competitive advantages over existing transdermal approaches. Corplex and MicroCor are designed to be adapted broadly for use in multiple drug categories and indications. We use our Corplex technology to create advanced transdermal and transmucosal systems for small molecules that utilize less of the active ingredient while achieving the same or better therapeutic effect, that can adhere well to either wet or dry surfaces, and that can hold additional ingredients required to aid the diffusion of low-solubility molecules through the skin without losing adhesion. Our MicroCor technology is a biodegradable microstructure system currently in development that enables the painless and convenient delivery of biologics that otherwise must be delivered via injection. Biodegradable microstructures integrate drug molecules and a biocompatible polymer. With slight external pressure, the microstructures penetrate the outer layers of the skin and dissolve to release the drug for local or systemic absorption. MicroCor is designed to expand the market for transdermal delivery of biologics, which cannot currently be delivered by other FDA-approved transdermal technologies.
In addition to commercialized products, we have a number of products in late stages of development. The most advanced clinical stage product in our pipeline is AG200-15, which is in Phase 3 development by our partner Agile. AG200-15 is a combination hormonal contraceptive patch designed to deliver two hormones, ethinyl estradiol and levonorgestrel, at levels comparable to low-dose oral contraceptives, through the skin in an easy-to-use format over seven days. Agile has filed a New Drug Application, or NDA, for approval of this product by the FDA, which is required before marketing a new drug in the United States. The FDA has indicated that Agile's NDA was not sufficient for approval as originally submitted. Agile is conducting a confirmatory Phase 3 clinical trial based on this guidance, and intends to submit the results of the additional Phase 3 clinical trial to the FDA.
3
We are developing several additional products utilizing our proprietary technologies that we plan to advance into Phase 1 and 2 trials in fiscal 2015. MicroCor hPTH(1-34) utilizes our MicroCor technology to deliver parathyroid hormone, a peptide for treating osteoporosis that is currently available only in a refrigerated injectable form. Our programs in Alzheimer's and Parkinson's diseases have advanced into in vivo pharmacokinetic testing. We are actively pursuing two product candidates in parallel for the transdermal treatment of Alzheimer's disease, incorporating two of the drugs already approved by the FDA, donepezil and memantine. Pending successful preclinical results, our current plan is to take both candidates into human clinical trials. Additionally, we are pursuing a program for the transdermal treatment of Parkinson's disease, also incorporating drugs already approved by the FDA, ropinirole and pramipexole. We are planning to take at least one of these candidates into human clinical trials. Tamsulosin TDS is a patch that we have been developing to deliver tamsulosin to patients with benign prostatic hyperplasia, or enlarged prostate. It is designed to deliver a controlled dose over several days and to reduce side effects compared to currently marketed products. We have decided to reallocate capital from our Tamsulosin TDS development program to our Alzheimer's and Parkinson's disease programs, with any further investment in Tamsulosin to be dependent on potential partnering activities and external funding.
The following table identifies the products we have developed that are marketed by our partners, products in our proprietary pipeline and products currently awaiting FDA approval.
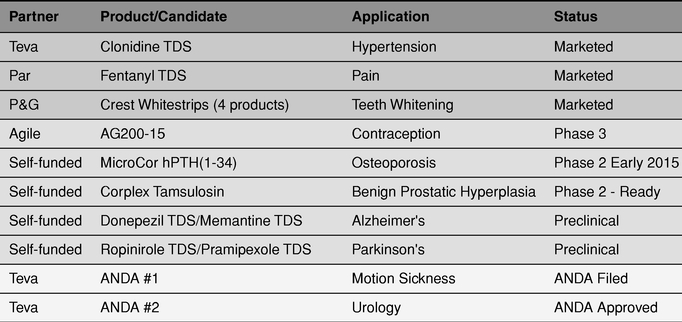
Transdermal Drug Delivery Industry
Patients have benefited from the use of transdermal delivery systems since the first commercially approved transdermal product, ALZA Corporation's Transderm Scop for the prevention of motion sickness was approved in 1979. To date, we are aware of approximately 20 drugs that have been successfully formulated and approved by the FDA for delivery in transdermal patches, though the market is growing. According to Datamonitor, the global value of the market for systemic transdermal products, including patches, was approximately $20 billion in 2010 and is expected to grow to approximately $30 billion by 2015. We believe this growth is driven by the increasing availability of transdermal systems for important therapeutic applications and changing disease demographics.
Transdermal delivery and transmucosal delivery, or delivery through mucous membranes, offer patients more convenient, non-invasive and comfortable methods of drug delivery. The benefits of transdermal and transmucosal delivery systems over other dosage forms generally include enhancing the
4
efficacy and reducing the side effects of a drug by controlling the rate of delivery and absorption, avoiding the undesirable breakdown of drugs in the liver associated with gastrointestinal absorption, and improving the level of patient compliance and long-term adherence to therapy.
Despite the benefits of current transdermal delivery products, many key challenges prevent broader use and applicability:
- •
- Skin Irritation and Adhesion: A number of patches cause
skin irritation and sensitization, often brought on by the inclusion of skin-permeating ingredients necessary to overcome the limitations of traditional patch technologies. Some patches also
experience adhesion failure resulting from excess moisture or heat while worn by the patient, for example when swimming, bathing or during other normal daily activities.
- •
- Safety and Drug Loading: In order to enable effective
diffusion of sufficient amounts of drug through the skin, many transdermal delivery systems must incorporate large amounts of drug in the patch. After use, a large residual amount of the drug remains
and must be disposed of carefully, especially if the drug is potent or toxic. In some cases, only a small amount of the total drug loaded in a patch is actually delivered into the bloodstream.
- •
- Delivery Limitation: The pharmaceutical industry has been unable to formulate certain drugs, especially biologics, for transdermal drug delivery, given the size and complexity of the molecules. These drugs generally are delivered by injection, which causes pain and often requires administration by a medical professional. In addition, these drugs generally must be refrigerated, require biohazard disposal and present the risk of accidental needle sticks. Many small molecules are also difficult to deliver transdermally, especially those that are not soluble in water or are unstable in the presence of air or water.
One of the greatest opportunities in transdermal drug delivery is the ability to deliver biologics, including vaccines, peptides and proteins without the use of an injection. A number of companies have attempted to develop technologies to address this challenge, but many have experienced commercial and development failures due to the formulation, scale-up and manufacturing complexities. Some of these systems have relied upon large, complex and costly devices, usually with external power sources, which adversely impact their usability and reproducibility.
We are developing and commercializing advanced transdermal drug delivery products that are intended to expand the number and types of drugs that can be delivered transdermally. We believe our technologies can be applied to improve the therapeutic value of many drugs by controlling the levels of drug delivered over a longer period of time. They are also designed to eliminate the need for injections of certain drugs and to improve adhesion and skin irritation profiles. Our technologies also allow us to create cost-effective products, especially by eliminating the need for complex devices and refrigeration throughout the supply chain. Our two proprietary platforms, Corplex and MicroCor, separately address some of the primary shortcomings of traditional transdermal drug delivery. We believe our track record within the industry demonstrates our ability to develop commercially successful products.
Corplex Technology
Corplex is a novel technology incorporating combinations of materials that utilize the properties of both traditional pressure-sensitive adhesives, or PSAs, as well as bioadhesives, to enable the transdermal delivery of small molecules. Corplex encompasses combinations and blends of polymers to provide a range of properties that improve adhesion and delivery of active ingredients that may otherwise be difficult to formulate for transdermal delivery. We use our Corplex technology in the Crest Whitestrips products and in several of our therapeutic products in development. Our Corplex
5
transdermal delivery systems provide advanced custom solutions for small molecules and feature the following benefits:
- •
- Flexibility: Corplex is adaptable and provides the
ability to formulate adhesives to complement a drug's unique properties, enabling new drug dosage forms and delivery options. As a result, Corplex systems can be formulated in several dosage forms
ranging from liquids (sprays, film-forming liquids), to semi-solids (gels, creams and ointments) to solids (powders, particles, dry and wet films, and patches).
- •
- Ease-of-Use: Our Corplex systems are designed to improve
patient compliance by being easy to use, self-administered and discreet. In addition, Corplex products are suitable for long-term skin contact and are designed to be easily removed with minimal damage
to skin and without leaving a residue. Corplex incorporates unique compositions and blends of polymers to provide a range of hydrophilic to hydrophobic properties, enabling excellent adhesion to both
dry and wet surfaces with a variety of wear times, ranging from seconds to up to seven days.
- •
- Compatibility: Corplex can incorporate liquid-based
components that improve stability and diffusion of the drug without compromising adhesion. As a result, Corplex is compatible with many chemically diverse drugs, including compounds that are highly
soluble or highly insoluble in water, as well as a wide range of solubilizing agents and enhancers that enable the delivery of these molecules, thereby expanding the universe of drugs that can be
delivered transdermally.
- •
- Efficient and Controlled Drug Delivery: Because Corplex
enables drugs to diffuse more easily through the skin, we can design Corplex products to require less drug to achieve the desired therapeutic result. In some cases, patch sizes can also be smaller
than conventional patches, reducing costs and improving the user experience. Additionally, Corplex allows for development of products with drug delivery profiles ranging from immediate release to
sustained release or a combination of fast-acting and long-lasting types of release.
- •
- Improved Therapeutic Profile: By achieving a steady dosage level, Corplex systems are designed to minimize side effects that otherwise result from peak concentrations of the drug when delivered with oral or other dosage forms. Corplex allows us to minimize the use of ingredients that can cause skin irritation and sensitization, two of the most common side effects of transdermal drug delivery. In our Corplex systems, we use materials that are well established for use in medical products by the FDA.
We believe the combination of these benefits make Corplex well-suited for the development of a variety of healthcare products that require adhesive properties, including prescription transdermal drug products, personal care, oral care, wound care, medical device and diagnostics products.
MicroCor Technology
MicroCor is a biodegradable microstructure patch technology that we are developing to enable transdermal delivery of biologics, in a disruptive platform that reduces the need for needles and syringes and enables global distribution of biologics without requiring refrigeration. Because biologics cannot diffuse through the skin due to their size, some mechanism is required to introduce these molecules beyond the outer layer of the skin, or stratum corneum, where they can be absorbed into the body. The further a delivery system penetrates beyond the stratum corneum, the more likely it is to cause pain, bleeding and bruising. By integrating active ingredients directly into arrays of biodegradable microstructures, our MicroCor technology is designed to penetrate only the stratum corneum to release the drug for local or systemic absorption, while eliminating the pain, bleeding and bruising that can be caused by needles and other active delivery devices.
6
We believe MicroCor will offer the following advantages over other delivery technologies in development for biologics:
- •
- Minimal Discomfort: Our MicroCor systems feature an array
of microstructures that penetrate the stratum corneum to only a few hundred microns in depth, deep enough for effective delivery without causing pain, bruising or bleeding.
- •
- Dose Sparing: MicroCor needles are biodegradable and
dissolve in the skin once the system is applied. In our clinical studies to date, we determined that over 90% of the drug contained in a single use of a MicroCor system was delivered into the skin
each time the system was administered. We expect our MicroCor systems to reduce drug waste and the costs associated with the excess drug that may be required in less efficient delivery technologies.
- •
- Thermally Stable: Our MicroCor systems do not contain
moisture, and therefore are designed to be room temperature stable, enabling both stockpiling and worldwide delivery without refrigeration, thereby minimizing drug or product spoilage.
- •
- No Biohazard Disposal: Because MicroCor needles
completely dissolve in the skin, no sharps remain after use. We believe this feature will allow disposal of the system in a traditional trash receptacle without risk of accidental needle sticks or
abuse associated with residual drug left in the delivery system.
- •
- Ease-of-Use: MicroCor products are designed to be
self-administered, fully-integrated, single-use systems that are worn for only a few minutes. Unlike other delivery systems, MicroCor requires no additional parts, electrical power or complex external
enabling devices to effectively deliver the drug or product.
- •
- Cost-Effective: In addition to the cost savings associated with dose sparing and thermal stability, MicroCor's fundamental design and our proprietary molding process also minimize costs associated with manufacturing MicroCor systems. Our process allows us to reduce waste of active ingredients used in manufacturing, as compared to needle coating processes used by other delivery technologies for large molecules.
Material Relationships
Our partners are critical to our success. We currently have material relationships with the following companies, as well as earlier-stage relationships with a number of other companies. This diversified mix of partnerships provides multiple potential sources of revenue growth in the future. In each of fiscal 2014 and 2013, we derived nearly all of our revenues from our partners P&G, Teva, and Par. In fiscal 2014, we received $11.7 million of our revenues from P&G, $13.6 million from Teva, and $13.0 million from Par, or 28%, 32%, and 31%, respectively. In fiscal 2013, we received $11.8 million of our revenues from P&G, $16.7 million from Teva, and $16.6 million from Par, or 23%, 33%, and 33%, respectively.
The Procter & Gamble Company
In June 2005, we entered into a multi-faceted strategic arrangement with P&G, one of the largest consumer products companies in the world. Our relationship includes a worldwide license to P&G for the use of our Corplex technology in products in the general field of consumer products. This field does not include rights in the prescription drug, foot care and wound care fields. P&G paid us fees for the license, and agreed to pay additional future milestone payments for products that we develop for P&G. In addition, we entered into a long term joint development agreement under which we perform numerous research and development activities for P&G based upon agreed-upon statements of work and budgets. We also have a commercial supply agreement in place, under which we are responsible for the production and supply to P&G of four oral care products. Our supply agreement with P&G currently extends through January 2017. The supply agreement can be expanded to include any
7
additional products that move into commercial supply. We believe that we have unique capabilities and know-how related to the manufacture of Corplex-based Crest Whitestrips, which would be difficult for another party to duplicate.
We have developed and commercialized four oral care products for P&G sold under the brand name Crest Whitestrips. The four products are Advanced Vivid, Professional Effects, One Hour Express and Flex-Fit. We have developed all of these products under the joint development agreement and are currently supplying each product in an intermediate, not final packaging, stage to P&G. In addition, we have other products in development for the oral care business at P&G as well as certain products in development for other businesses at P&G.
In addition to contract research and development and product revenues, from the inception of our collaborations with P&G, we have received a total of $3.2 million in license fees and $2.0 million in milestone payments from P&G. None of our arrangements with P&G require a royalty to be paid to us.
Teva Pharmaceuticals, USA Inc.
In 2004, we entered into a development, manufacturing and commercialization agreement with Barr Laboratories, Inc. for four generic transdermal drug products. We entered into three separate agreements with Barr, one in 2006 and two in 2007, to develop and commercialize additional ANDA transdermal patch products. In 2008, Teva Pharmaceuticals, Inc. acquired Barr. Following this acquisition and its review of resource allocations and potential conflicts, Teva continued three of these development programs. These programs have resulted in an approved product marketed as Clonidine TDS, a urology patch approved in March 2014 and a motion sickness patch that is the subject of a pending ANDA.
Under our agreements with Teva, we are the exclusive suppliers of the products that are the subject of each development program. We receive compensation for developing the product, plus a manufacturing margin, expressed as a margin above costs, and a profit share based on Teva's net profits on the products. Teva has an exclusive license to use certain of our intellectual property to the extent necessary to commercialize, make, use or sell the ANDA product.
The Teva product contracts extend for ten years beyond the respective product launch dates, with provisions for automatic annual renewal thereafter. The contracts may be terminated, with three months' notice before the end of a renewal period, or for uncured material breach, bankruptcy, or certain conditions preceding ANDA filing. If Teva were to terminate the agreement, it would be required to obtain FDA approval for an alternate manufacturing site before it could obtain additional supply of the product, a process that generally takes two years or more.
Clonidine TDS was the first product under our partnership with Teva to be approved by the FDA. Teva launched the product in 2010, and currently has the largest share of the clonidine patch market. We also have a motion sickness patch that is the subject of a pending ANDA.
In addition to contract research and development revenues and product revenues, from the inception of our collaborations with Teva and its predecessor, we have received no license fees and $0.2 million in milestone payments. Under our current agreements, we are not eligible for additional milestone payments. We also receive a profit share equal to a low tens percentage of Teva's net sales of Clonidine TDS, after deducting certain selling-related expenses.
Par Pharmaceutical, Inc.
In 2002, we entered into a product development, collaboration and license agreement and in 2003 we entered into a manufacturing and supply agreement with Abrika LLLP for a generic equivalent of Duragesic, a fentanyl transdermal product marketed by Johnson & Johnson. In 2007, Abrika was
8
acquired by Actavis, Inc. In 2007, the FDA approved and Actavis launched our Fentanyl TDS product. In 2012, Par Pharmaceuticals, or Par, acquired the fentanyl business from Actavis, and Par currently markets Fentanyl TDS as our partner. Under the manufacturing and supply agreement, we are the exclusive supplier of Fentanyl TDS to Par.
Abrika and Actavis paid us for the development of Fentanyl TDS and we also receive a manufacturing margin and a royalty on net sales of the products by Par. The 2002 agreement may be terminated for uncured material breach, bankruptcy, or certain conditions preceding ANDA filing. If Par were to terminate the agreement, it would be required to obtain FDA approval for an alternate manufacturing site before it could obtain additional supply of the product, a process that generally takes two years or more.
In addition to contract research and development revenues and product revenues, from the inception of our collaborations with Par and its predecessors, we have received no license fees and $0.5 million in milestone payments from Par. Under our current agreements, we are not eligible for additional milestone payments. We receive a royalty equal to a mid single digit percentage of Par's net sales of Fentanyl TDS.
Agile Therapeutics, Inc.
In 2006, we entered into a development, license and commercialization agreement with Agile Therapeutics, Inc., a privately-owned company that focuses on development of women's healthcare products. As part of our relationship, we are the exclusive supplier of the AG200-15 combined hormonal contraceptive patch, which was designed by Agile using its formulation technology and is proprietary to Agile. Under our agreement with Agile, we have performed substantial work, funded by Agile, on the process development and scale-up of the manufacturing process for AG200-15, and we have manufactured the product for each of Agile's clinical trials. Our agreement also includes an additional Agile product, AG890, which is a progestin-only contraceptive patch in Phase 2 of clinical development.
In anticipation of the approval and commercial launch of the AG200-15 product, we have worked in partnership with Agile to prepare facilities and equipment at our Grand Rapids manufacturing site for commercial production of the product. The primary production equipment specifically designed for manufacture of this product has been purchased and is owned by Agile and we are responsible for operating and maintaining that equipment.
Our exclusive right to manufacture AG200-15 and AG890 extends until we have commercially produced an agreed-upon quantity of patches, currently projected to occur no earlier than five years following commercial launch of AG200-15. The contract may be terminated for uncured material breach. Following the end of the exclusivity period, if Agile were to seek a second source of supply, Agile would be required to obtain FDA approval for an additional manufacturing site, a process that generally takes two years or more, and make substantial investments in new facilities and equipment.
In addition to contract research and development revenues, from the inception of our collaborations with Agile, we have received no license fees and $3.5 million in milestone payments from Agile. We are not currently eligible for any future milestone payments, and the terms of our supply agreement do not entitle us to receive a royalty.
Products and Pipeline
We have six commercial products and two products awaiting FDA approval, and we are developing additional undisclosed prescription drug products with partners. We have ongoing feasibility agreements with several major pharmaceutical companies involving our MicroCor technology, and are currently in active discussions with other companies for additional feasibility projects.
9
Marketed Products:
In fiscal 2014, we received a total of $32.2 million in product revenues from our three marketed products: $10.8 million from Clonidine TDS, $11.7 million from Fentanyl TDS, and $9.7 million from Crest Whitestrips, representing 34%, 36% and 30% of total product revenues, respectively.
Clonidine TDS is a treatment for hypertension that we developed under an ANDA as a generic version of the branded drug known as Catapres TTS. Clonidine TDS was launched in 2010 and is marketed by Teva and manufactured by us exclusively for Teva.
Fentanyl TDS is a treatment for management of chronic pain, including cancer-related pain, under specified conditions. We developed this product for approval under an ANDA as a generic version of the branded product known as Duragesic. Our Fentanyl TDS was approved in 2007 and is currently marketed by Par and manufactured by us exclusively for Par.
Crest Whitestrips are a series of four products for oral care that we co-developed with P&G as part of a broad relationship relating to consumer products. These products utilize our Corplex polymer technology and are sold under the brands Advanced Vivid, Professional Effects, One Hour Express and Flex-Fit. We are the sole supplier of the oral care system marketed as Crest Whitestrips for P&G.
Pipeline Products:
AG200-15 is a combination hormonal contraceptive patch that contains the active ingredients ethinyl estradiol (an estrogen) and levonorgestrel (a progestin), both of which have an established history of efficacy and safety in currently marketed combination contraceptives. AG200-15 is designed to deliver both hormones at levels comparable to low-dose oral contraceptives. By delivering these active ingredients over seven days, this product is designed to promote enhanced compliance by patients with a convenient, easy-to-use format. The patch is applied once weekly for three weeks, followed by a week without a patch. The product, which was designed by Agile and for which we have done process development and manufacturing, will, if approved, be packaged with three patches per carton to provide a cycle (month) of therapy.
In February 2013, Agile received a Complete Response Letter from the FDA, indicating that the results from the completed Phase 3 studies would not be sufficient for approval, and proposing that Agile conduct an additional Phase 3 study. In September of 2014, Agile initiated the additional study as requested by FDA, which it anticipates completing by early 2016. This study has been designed to address key issues that arose in the previous studies, including enhanced patient enrollment criteria and processes, and close monitoring of compliance with the study protocol. There can be no assurance that this additional study will be successful in demonstrating efficacy and safety of the product. However, assuming successful completion of this additional study, Agile would plan to submit the results of the confirmatory study to the FDA in early 2016. Assuming a six-month review by the FDA, approval would occur late in 2016
We are the exclusive supplier of the AG200-15 product to Agile. In fiscal 2014, we received a total of $1.0 million in contract research and development revenues from Agile, representing 11% of our total contract research and development revenues.
MicroCor hPTH(1-34) is a transdermal system designed to use our MicroCor technology to provide simplified delivery of parathyroid hormone, the active ingredient of Forteo, an injectable product marketed by Eli Lilly and Company for the treatment of severe osteoporosis. hPTH(1-34) is a shortened version of the naturally occurring parathyroid hormone that promotes bone growth. With a simple one-step application process, short wear time and a favorable pharmacokinetic profile, MicroCor hPTH(1-34) represents, if approved, an opportunity to effectively deliver an improved anabolic therapy and increase patient compliance in the osteoporosis market.
10
We have completed a Phase 1 safety and pharmacokinetic study of MicroCor hPTH(1-34) in healthy women. In this study, MicroCor hPTH(1-34) was shown to be safe and well tolerated with comparable drug exposure to that achieved with the commercially available subcutaneous injections. The product achieved rapid systemic delivery of hPTH with a short wear time of five minutes. On the basis of these results, we are planning further clinical development of MicroCor hPTH(1-34) under a 505(b)(2) regulatory pathway that leverages existing hPTH safety and efficacy data from the approved dosage form of parathyroid hormone. The clinical plan will consist of a Phase 2a pharmacokinetic study, which we plan to complete in the first half of 2015. This will be followed by a six-month Phase 2b efficacy/safety and dose finding study in osteoporosis patients and a one-year Phase 3 trial, each measuring change in bone mineral density as a primary endpoint.
MicroCor hPTH(1-34) has demonstrated a favorable safety profile in multiple nonclinical biocompatibility and microbial studies. The product has also demonstrated favorable room temperature stability. Following the completion of our clinical trials, we anticipate partnering with a company active in bone health, women's health or endocrinology to distribute and sell the product, if approved.
We have in place pilot facilities for manufacture of MicroCor products for early clinical testing. We also have extensive experience with process development and commercial scale-up for transdermal products. In preparation for Phase 3 clinical trials of MicroCor hPTH(1-34), we have developed an aseptic manufacturing plan for large scale manufacturing and we have designed the manufacturing process for MicroCor systems to be streamlined, robust and cost effective.
Corplex Tamsulosin is a transdermal patch designed to use our Corplex technology to provide controlled delivery of tamsulosin, the active ingredient in the leading once-daily capsule product for treatment of benign prostatic hyperplasia, or BPH, marketed under the brand name Flomax. Tamsulosin is a drug that relaxes smooth muscle cells in the prostate and bladder neck, thereby decreasing the blockage of urine flow that occurs with an enlarged prostate. By providing a controlled and relatively steady level of drug over an extended time, Corplex Tamsulosin is intended to alleviate the side effects associated with peak blood concentrations of the drug in its current oral formulation and to provide a consistent level of efficacy.
We have completed a Phase 1 safety and pharmacokinetic study of Corplex Tamsulosin in healthy men. In this study, Corplex Tamsulosin demonstrated a favorable safety profile, was well-tolerated and the drug exposure of the once-weekly patch was comparable to daily oral Flomax capsules. The clinical plan would consist of a one month Phase 2 efficacy/safety and dose finding study in 90 patients and a three month (with open label extension of six to nine months) Phase 3 trial in patients, using an American Urology Association symptom score or International Prostrate Symptom Score as the primary end point. We have decided to reallocate capital from this development program to our Alzheimer's and Parkinson's disease programs, with any further investment in this product to be dependent on potential partnering activities and external funding.
Additional ANDA Products:
Motion Sickness Patch. We have developed a generic transdermal product for the prevention of nausea and vomiting associated with motion sickness. We developed a three-day patch for Teva that is currently the subject of a pending ANDA. We have completed all of the development, scale-up and clinical activities and expect this product to launch in 2015, if approved.
In fiscal 2014, we received a total of $1.6 million in contract research and development revenues from Teva for this product, representing 18% of our total contract research and development revenues.
11
Urology Patch. We have developed a generic transdermal product for treatment of a urologic condition. We developed a three-to-four-day patch for Teva under an ANDA, and Teva received approval in March 2014. Teva is currently reviewing the strategy and potential timing for launch of this product. We did not receive contract research and development revenues for this product in fiscal 2014.
Development Pipeline Products:
Alzheimer's Disease (Donepezil and Memantine)
Alzheimer's disease, the leading cause of dementia, is characterized by the progressive loss of memory, thinking and ability to perform activities of daily living, such as bathing, feeding and self-care, as well as significant behavioral disturbances such as agitation, aggression, delusions and hallucinations. According to industry sources, Alzheimer's disease currently affects approximately 5.3 million people in the United States, including as many as 13% of people aged 65 and older and approximately 50% of those 85 and older. We have initiated preclinical development work on advanced transdermal patches for the treatment of Alzheimer's disease incorporating proven and approved molecules, one of which is the active ingredient in Aricept. We anticipate developing these patches under a 505(b)(2) regulatory pathway, which we believe will allow for reduced nonclinical and clinical study cost and time. The product candidates are designed to decrease the side effects of the current therapies, including nausea and vomiting, and to improve patient adherence and compliance.
Parkinson's Disease (Ropinirole and Pramipexole)
Parkinson's disease is the second most common neurodegenerative disorder after Alzheimer's disease. Approximately one million people in the United States and from four to six million people worldwide suffer from this disease, which is commonly treated with dopamine replacement therapies such as levodopa and dopamine agonists, which are molecules that mimic the action of dopamine. We have initiated preclinical development work on advanced transdermal therapies incorporating proven and approved molecules for treating Parkinson's disease under a 505(b)(2) regulatory pathway, which we believe will allow for reduced nonclinical and clinical study cost and time. Because Parkinson's patients have trouble swallowing pills, we believe a transdermal or film product would address an unmet need recognized by patients and physicians alike.
MicroCor Feasibility Programs include partner-funded feasibility programs that we have completed or are currently in progress. Additional programs are in the planning process. In the programs performed to date, we have collaborated with leading biopharmaceutical companies to formulate their proprietary active molecules in our MicroCor technology and demonstrate delivery of the drug in animal models. The active molecules in these studies have been primarily large biologic molecules, including vaccines, peptides, proteins and monoclonal antibodies. After completing a number of these programs successfully, we are now advancing certain programs into later stages of development, including new vaccine and therapeutic applications.
Future Pipeline Programs include additional undisclosed ANDAs that have been partnered with various pharmaceutical companies. These products are in development and we expect the ANDAs to be filed in late 2015 and thereafter. We also are developing skin care and cosmetics products utilizing our Corplex and MicroCor technologies for our partners.
In fiscal 2014, we received an aggregate total of $4.4 million in contract research and development revenues from our collaboration partners for these programs, representing 48% of our total contract research and development revenues.
Research and Development
Our research and development operations are located in a 25,000 square foot laboratory and office facility in Menlo Park, California that is configured for transdermal and transmucosal systems
12
development. We conduct proprietary drug delivery research utilizing our extensive experience in polymer blending, formulations and system engineering to produce innovative products with high drug delivery efficiency. Our research and development team has full early product development capabilities, including:
- •
- Formulation, system design and engineering;
- •
- Analytical method development and validations;
- •
- Prototyping and pilot manufacturing;
- •
- Early stage quality assurance and quality control;
- •
- Nonclinical and early stage clinical development; and
- •
- Regulatory affairs.
In addition, our Menlo Park site operates a pilot facility capable of making products in accordance with cGMP requirements for Phase 1 and Phase 2 clinical studies.
Our Menlo Park research and development team includes 35 scientists and engineers, some of whom were original inventors of transdermal patches. We perform the formulation system design, analytical method development and prototyping for all of our transdermal products. Our research and development team works in collaboration with the process scale-up team in our manufacturing operations early in the product development cycle. This early coordination helps assure streamlined technology transfer success in the final scale-up and commercial manufacture of each product, leading to more robust development programs and greater manufacturing efficiencies.
Manufacturing
Our commercial manufacturing facilities are located in Grand Rapids, Michigan in three buildings comprising approximately 200,000 square feet. We have a full range of development and manufacturing capabilities, from complete process development and scale-up services to commercial manufacture. We have made significant investments in our manufacturing technology that allow us to automate many of our processes and maximize the productivity of our labor force. We employ multiple manufacturing techniques, including solvent cast and extrusion manufacturing processes that minimize the thickness of our patches and reduce the costs of our products. Solvent casting is well-suited for manufacturing films containing heat-sensitive molecules because the temperatures required to remove the solvents are relatively low compared to those needed for a hot-melt extrusion process. Hot-melt extrusion is not suitable for ingredients that could be thermally degraded in the process, but is environmentally friendly, cost effective and more flexible than solvent cast-only processes.
Our manufacturing platform includes:
- •
- Process development through commercial product manufacture, including final finishing and cartoning;
- •
- Multiple-use equipment providing flexibility for small volume manufacture and dedicated equipment for large volume production;
- •
- High accuracy coating for pressure sensitive adhesives, acrylics and polyisobutylene, or PIB;
- •
- Automated solvent casting and extrusion capabilities;
- •
- Automated high-speed, high-accuracy die cutting, and integrated die cutting and pouching;
- •
- Physical testing and analytical method capabilities;
- •
- The licensing required to handle scheduled drugs and compounds requiring special handling;
13
- •
- The ability to manufacture drug and device combination products with high accuracy assembly for multiple and complex components; and
- •
- Manufacturing capabilities for proprietary MicroCor biodegradable microstructures, including specialty coating, curing, drying and assembly processes.
Our facilities are FDA and DEA registered, and ISO9001 and ISO13485 certified. Our manufacturing facilities in Grand Rapids are licensed to manufacture OTC products, consumer products, prescription transdermal, dermal and mucosal products, as well as wound care products. Our Grand Rapids facilities also have the capacity to produce well over 100 million patches annually and can be expanded as our needs grow. A number of our equipment lines have been fully funded by our partners to support the development of partnered products. In these cases, the partners retain title to those equipment lines, while we retain responsibility for maintaining and operating them. Our operations include on-site quality control laboratories and testing procedures, quality assurance systems, and internal audit procedures for our processes and equipment.
Intellectual Property
Our success depends on our ability to obtain patents and protect our trade secrets and know-how. We must be able to operate without infringing on any other company's intellectual property and we must prevent others from infringing our intellectual property. Our strategy is to protect our intellectual property by filing both U.S. and international patents related to our proprietary technologies, products, inventions and improvements that are important to our business. As of September 30, 2014, we held 42 U.S. issued patents and 160 foreign issued patents (which include granted European patents rights that have been validated in various EU member states) and 30 U.S. pending patents and 56 foreign pending patents relating to our Corplex and MicroCor technologies and products. Of the issued U.S. patents, 32 relate to composition of matter and 10 relate to use or process. Of the pending U.S. patents, 25 relate to composition of matter and 5 relate to use or process. Our foreign patents generally include both composition of matter and use or process claims. Our issued U.S. patents and patent applications will expire between 2019 and 2035. Some of the issued patents and pending patent applications, if issued, may also be eligible for patent term adjustment and patent term restoration, thereby extending their patent terms.
Proprietary rights for our products in development and our potential products will be protected from use by third parties only to the extent that they are covered by valid and enforceable patents or are effectively maintained as trade secrets. Patents owned by us (or licensed by us) may not protect us from competition in the future and our pending patent applications may not result in patent rights being issued. In addition, the laws of certain foreign countries may not protect our intellectual property rights to the same extent as they do under U.S. law.
The patent positions of pharmaceutical, drug delivery and biotechnology companies are complex and enforcement cannot be predicted with certainty. Our patents or patent applications, if issued, may be challenged or invalidated and the rights granted may not provide proprietary protection or competitive advantages over our competitors with similar technologies. Our competitors may also develop similar technologies to ours, or in fact duplicate our technologies. Because the regulatory timeline is quite long and expensive to develop the types of products that we develop, it is possible that before any of our products are commercialized, any related patent may expire or exist for only a short period of time following commercialization. This could negatively impact our ability to protect our future products and consequently our operating results and financial position.
Our products in development may be covered by third party patents or other intellectual property rights, in which case we would need to obtain a license to continue to develop and/or market these products. Such licenses may not be available on acceptable terms and such licenses may not be attainable, which could delay product launches if we are required to design around a patent. Litigation
14
may be necessary to defend against or assert claims of infringement to enforce patents, protect trade secrets or know-how or to determine validity in order to freely sell a product in the marketplace. In addition, interference, derivation, post-grant oppositions or other proceedings may be necessary to determine rights to inventions in our patents. Litigation could entail substantial financial costs and may have a material adverse effect on our business, financial condition or results of operations.
In certain circumstances, we rely on trade secrets to protect our technology. Trade secrets are difficult to protect. Generally we protect our proprietary processes and manufacturing as trade secrets and we secure confidentiality agreements from all of our employees, contractors, consultants and advisors. We cannot assure that the agreements will not be breached, or that we will be able to remedy such a breach, or that our trade secrets will not become known in the public domain and be discovered by our competitors. Disputes may also arise with respect to know-how and inventions created by our employees, contractors and consultants. See the section entitled "Risk Factors—Risks Related to Our Intellectual Property."
Regulatory
Food and Drug Administration. The FDA and comparable regulatory agencies in state and local jurisdictions and in foreign countries impose substantial requirements upon the clinical development, manufacture and marketing of pharmaceutical and consumer cosmetic products. These agencies and other federal, state and local entities regulate research and development activities and the testing, manufacture, quality control, safety, effectiveness, labeling, storage, distribution, record keeping, approval, advertising and promotion of our products. Many of our products are combination drug-device products that are regulated as drugs by the FDA, with consultations from the device center in the FDA. Others, such as consumer teeth whitening products, are regulated by the FDA as cosmetics. Failure to comply with applicable FDA or other requirements may subject a company to a variety of administrative or judicial sanctions, such as the FDA's refusal to approve pending applications, a clinical hold, warning letters, recall or seizure of products, partial or total suspension of production, withdrawal of the product from the market, injunctions, fines, civil penalties or criminal prosecution.
FDA Regulation of Drugs. The process required by the FDA under the new drug provisions of the Federal Food, Drug, and Cosmetic Act, or the FFDC Act, before our investigational drugs may be marketed in the U.S. generally involves the following:
- •
- Completion of extensive preclinical laboratory tests and preclinical animal studies, all performed in accordance with the FDA's Good
Laboratory Practice, or GLP, regulations;
- •
- Submission of an Investigational New Drug application, or IND, which must become effective before clinical trials may begin;
- •
- Performance of adequate and well-controlled human clinical trials to establish the safety and efficacy of the investigational drug for
each proposed indication in accordance with the FDA's current good clinical practice, or GCP, requirements;
- •
- Submission to the FDA of a New Drug Application, or NDA, after completion of all pivotal clinical trials;
- •
- Satisfactory completion of an FDA pre-approval inspection of the manufacturing facilities at which the drug will be produced, to
assess compliance with current good manufacturing practice, or cGMP, regulations, or, for our medical device components, the Quality System Regulation, or QSR; and
- •
- FDA review and approval of an NDA prior to any commercial marketing or sale of the drug in the United States.
15
Preclinical tests include laboratory evaluation of the investigational drug, its chemistry, formulation and stability, as well as animal studies to assess its potential safety and efficacy. For human clinical trials to be conducted in the United States, we must generally submit the results of the preclinical tests, together with manufacturing information and analytical data, to the FDA as part of an IND, which must become effective before we may begin human clinical trials. An IND automatically becomes effective 30 days after receipt by the FDA, unless the FDA, within the 30-day time period, raises concerns or questions about the conduct of the trials as outlined in the IND and imposes a clinical hold. In such a case, the IND sponsor and the FDA must resolve any outstanding concerns before clinical trials can begin. Our submission of an IND may not result in FDA authorization to commence clinical trials. Further, an independent Institutional Review Board, or IRB, at each medical center proposing to conduct the clinical trials must review and approve any clinical study as well as the related informed consent forms and authorization forms that permit us to use individually identifiable health information of study participants.
Clinical trials involve the administration of the investigational drug to human subjects under the supervision of qualified investigators in accordance with GCP requirements, which include the requirement that all research subjects provide their informed consent for their participation in any clinical trial. Clinical trials are conducted under protocols detailing, among other things, the objective of the study, the parameters to be used in monitoring safety, and the efficacy criteria to be evaluated. A protocol for each clinical trial and any subsequent protocol amendments must be submitted to the FDA as part of the IND. The IRB must monitor the study until completed. There are also requirements governing the reporting of ongoing clinical trial results to public registries.
The foregoing discussion of clinical trials applies to clinical trials conducted under an IND. In some instances, we may conduct clinical trials outside of the United States, which may require different or additional regulatory submissions depending on the country in which the trial is conducted.
Human clinical trials are typically conducted in three sequential phases which may overlap or be combined:
- •
- Phase 1: Includes the initial introduction of an investigational drug into humans. Phase 1 studies are typically closely
monitored and may be conducted in patients or normal volunteer subjects. Phase 1 studies are designed to determine the metabolism and pharmacologic actions of the drug in humans, the side
effects associated with increasing doses, and, if possible, to gain early evidence of effectiveness. During these studies, sufficient information about the drug's pharmacokinetics and pharmacological
effects should be obtained to permit the design of well-controlled, scientifically valid, Phase 2 studies. These studies may include studies of drug metabolism, structure-activity
relationships, and mechanism of action in humans, as well as studies in which investigational drugs are used as research tools to explore biological phenomena or disease processes.
- •
- Phase 2: Includes controlled clinical studies conducted to evaluate the effectiveness of the drug for a particular indication
or indications in patients with the disease or condition under study, and to determine the common short-term side effects and risks associated with the drug.
- •
- Phase 3: When Phase 2 clinical trials suggest effectiveness of a drug, Phase 3 clinical trials are undertaken to gather the additional information about effectiveness and safety that is needed to evaluate the overall benefit-risk relationship of the drug and to provide an adequate basis for physician labeling.
We cannot be certain that we will successfully complete Phase 1, Phase 2 or Phase 3 clinical trials of our investigational drugs within any specific time period, if at all. Furthermore, the FDA or the IRB or the sponsor may suspend or terminate clinical trials at any time on various grounds, including a finding that the subjects or patients are being exposed to an unacceptable health risk. Sponsors of clinical trials may also suspend or terminate a clinical trial based on evolving business objectives and/or
16
competitive climate. During the clinical development of products, sponsors may meet and consult with the FDA in an effort to ensure that the design of their studies will likely provide data both sufficient and relevant for later regulatory approval; however, no assurance of approvability can be given by the FDA.
The results of product development, preclinical studies and clinical studies are submitted to the FDA as part of an NDA for approval of the marketing and commercial shipment of the product. Submission of an NDA requires the payment of a substantial user fee to the FDA, and although the agency has defined user fee goals that govern the length of an NDA's review time, we cannot assure that the FDA will make a review decision in any particular timeframe. After the FDA evaluates the NDA and conducts inspections of manufacturing facilities where the drug product and/or its active pharmaceutical ingredient, or API, will be produced, it may issue an approval letter or a Complete Response Letter. An approval letter authorizes commercial marketing of the drug with specific prescribing information for specific indications. A Complete Response Letter indicates that the review cycle of the application is complete but the application is not ready for approval. A Complete Response Letter may require additional clinical data and/or one or more additional clinical trials, as FDA has required of our partner Agile, and/or other requirements related to clinical trials, preclinical studies or manufacturing, any of which may be expensive and require considerable time to complete. Even if such data are submitted, the FDA may ultimately decide that the NDA does not satisfy the criteria for approval.
After approving a drug, the FDA may withdraw product approval if compliance with regulatory standards is not maintained or if safety problems occur after the product reaches the market. Requirements for additional Phase 4 studies (post-approval marketing studies) to confirm safety and effectiveness in a broader commercial use population may be imposed as a condition of marketing approval. In addition, the FDA requires surveillance programs to monitor approved products that have been commercialized, and the agency has the power to require changes in labeling or to prevent further marketing of a product based on the results of these post-marketing programs.
Satisfaction of FDA requirements or similar requirements of state, local and foreign regulatory agencies typically takes several years, and the actual time required may vary substantially based upon the type, complexity and novelty of the pharmaceutical product. Government regulation may delay or prevent marketing of potential products for a considerable period of time and impose costly procedures upon our activities. We cannot be certain that the FDA or any other regulatory agency will grant approval for any of our pharmaceutical systems under development on a timely basis, if at all. Success in preclinical or early stage clinical trials does not assure success in later stage clinical trials. Data obtained from preclinical and clinical activities is not always conclusive and may be susceptible to varying interpretations which could delay, limit or prevent regulatory approval. Evolving safety concerns can result in the imposition of new requirements for expensive and time consuming tests. Even if a product receives regulatory approval, the approval may be significantly limited to specific indications. Further, even after regulatory approval is obtained, later discovery of previously unknown problems with a product may result in restrictions on the product or even complete withdrawal of the product from the market. Any pharmaceutical systems that we may develop and obtain approval for would also be subject to adverse findings of the active drug ingredients being marketed in different dosage forms and formulations. Delays in obtaining, or failures to obtain regulatory approvals would have a material adverse effect on our business. Marketing our pharmaceutical systems abroad will require similar regulatory approvals and is subject to similar risks. In addition, we cannot predict what adverse governmental regulations may arise from future U.S. or foreign governmental action. Currently, our partners are the NDA and ANDA holders of products that we develop, and therefore our partners communicate with FDA with respect to the applications.
17
Any drug products manufactured or distributed by us pursuant to FDA approvals are subject to pervasive and continuing regulation by the FDA, including cGMP requirements, and reporting of adverse experiences with the drug. Drug manufacturers and their subcontractors are required to register their establishments with the FDA and state agencies, and are subject to periodic announced and unannounced inspections by the FDA and state agencies for compliance with cGMP regulations, which impose procedural and documentation requirements upon us and our third party manufacturers. In addition, changes to the manufacturing process are strictly regulated, and, depending on the significance of the change, may require prior FDA approval before being implemented. FDA regulations also require investigation and correction of any deviations from cGMP and impose reporting and documentation requirements upon us and any third-party manufacturers that we may decide to use. Accordingly, manufacturers must continue to expend time, money and effort in the area of production and quality control to maintain compliance with cGMP and other aspects of regulatory compliance. We cannot be certain that we or our present or future suppliers will be able to comply with the cGMP regulations and other FDA regulatory requirements.
Future FDA and state inspections may identify compliance issues at our facilities or at the facilities of our suppliers of raw materials that may disrupt production or distribution, or require substantial resources to correct. In addition, discovery of previously unknown problems with a product or the failure to comply with applicable requirements may result in restrictions on a product, manufacturer or holder of an approved NDA, including withdrawal or recall of the product from the market or other voluntary, FDA-initiated or judicial action that could delay or prohibit further marketing. For example, in 2008 and 2010 we conducted recalls of our fentanyl products and were inspected by the FDA. These inspections led to the issuance of FDA Forms 483 identifying inspectional observations. The most recent FDA inspection of our facility was a Pre-Approval Inspection for a product that is the subject of pending ANDA. The FDA issued a Form 483 with one observation, which we addressed as part of our ongoing obligations under the FDA's quality system regulation.
The FDA regulates drug labeling and promotion activities. The FDA has actively enforced regulations prohibiting the marketing of products for unapproved uses, and federal and state authorities are also actively litigating against sponsors who promote their drugs for unapproved uses under various fraud and abuse and false claims act statutes. We and our pharmaceutical systems are also subject to a variety of state laws and regulations in those states or localities where our pharmaceutical systems are or will be marketed. Any applicable state or local regulations may constrain our ability to market our pharmaceutical systems in those states or localities. We are also subject to numerous federal, state and local laws relating to such matters as safe working conditions, manufacturing practices, environmental protection, fire hazard control, and disposal of hazardous or potentially hazardous substances. We may incur significant costs to comply with such laws and regulations now or in the future.
The FDA's policies may change and additional government regulations may be enacted which could prevent or delay regulatory approval of our drug product candidates. Moreover, increased attention to the containment of health care costs in the U.S. and in foreign markets could result in new government regulations that could have a material adverse effect on our business. We cannot predict the likelihood, nature or extent of adverse governmental regulation that might arise from future legislative or administrative action, either in the U.S. or abroad.
The FDA also has the authority to require a risk evaluation and mitigation strategy (REMS) to ensure the safe use of the drug. The FDA has authority to require a REMS under the Food and Drug Administration Amendments Act of 2007, or FDAAA, when necessary to ensure that the benefits of a drug outweigh the risks. In determining whether a REMS is necessary, the FDA must consider the size of the population likely to use the drug, the seriousness of the disease or condition to be treated, the expected benefit of the drug, the duration of treatment, the seriousness of known or potential adverse events, and whether the drug is a new molecular entity. If the FDA determines a REMS is necessary, the drug sponsor must agree to the REMS plan at the time of approval. A REMS may be required to
18
include various elements, such as a medication guide or patient package insert, a communication plan to educate health care providers of the drug's risks, limitations on who may prescribe or dispense the drug, or other measures that the FDA deems necessary to assure the safe use of the drug. In addition, the REMS must include a timetable to assess the strategy at 18 months, three years, and seven years after the strategy's approval. The FDA may also impose a REMS requirement on a drug already on the market if the FDA determines, based on new safety information, that a REMS is necessary to ensure that the drug's benefits outweigh its risks.
On July 9, 2012, the FDA approved a REMS for extended-release and long-acting opioid medications. Several of our currently marketed drug products and investigational drugs, including fentanyl, are subject to the REMS. There may be increased cost, administrative burden and potential liability associated with the marketing and sale of drugs subject to the REMS requirement, which could negatively impact the commercial benefits to us and our partners from the sale of these drug products and, if approved, drug product candidates. Our partners, as the holders of the marketing applications for the affected drugs, are responsible for compliance with the opioid REMS requirements.
Hatch-Waxman Act. Section 505 of the FFDC Act describes three types of NDAs that may be submitted to the FDA to request marketing authorization for a new drug. A Section 505(b)(1) NDA is an application that contains full reports of investigations of safety and effectiveness. The Drug Price Competition and Patent Term Restoration Act of 1984, also known as the Hatch-Waxman Act, created two additional marketing pathways under Sections 505(b)(2) and 505(j) of the FFDC Act. A 505(b)(2) NDA is an application that contains full reports of investigations of safety and effectiveness but where at least some of the information required for approval comes from studies not conducted by or for the applicant and for which the applicant has not obtained a right of reference. This regulatory pathway enables the applicant to rely, in part, on the FDA's findings of safety and efficacy for an existing product, or published literature, in support of its application. Section 505(j) establishes an abbreviated approval process for a generic version of approved drug products through the submission of an Abbreviated New Drug Application, or ANDA. An ANDA provides for marketing of a generic drug product that has the same active ingredients, dosage form, strength, route of administration, labeling, performance characteristics and intended use, among other things, to a previously approved product. ANDAs are termed "abbreviated" because they are generally not required to include preclinical (animal) and clinical (human) data to establish safety and effectiveness. Instead, generic applicants must scientifically demonstrate that their product is bioequivalent to (i.e., performs in the same manner as) the innovator drug. The generic version generally must deliver approximately the same amount of active ingredients into a patient's bloodstream in the same amount of time as the innovator drug.
Upon submission of an ANDA or a 505(b)(2) NDA, an applicant must certify to the FDA that (1) no patent information on the drug product that is the subject of the application has been submitted to the FDA; (2) such patent has expired; (3) the date on which such patent expires; or (4) such patent is invalid or will not be infringed upon by the manufacture, use or sale of the drug product for which the application is submitted. This last certification is known as a paragraph IV certification. If the paragraph IV certification is challenged by an NDA holder or the patent owner(s) asserts a patent challenge to the paragraph IV certification, the FDA may not approve that application until the earlier of 30 months from the receipt of the notice of the paragraph IV certification, the expiration of the patent, when the infringement case concerning each such patent was favorably decided in the applicant's favor or such shorter or longer period as may be ordered by a court. This prohibition is generally referred to as the 30-month stay. In instances where an ANDA or 505(b)(2) NDA applicant files a paragraph IV certification, the NDA holder or patent owner(s) regularly take action to trigger the 30 month stay, recognizing that the related patent litigation may take many months or years to resolve. Thus, approval of an ANDA or 505(b)(2) NDA could be delayed for a significant period of time depending on the patent certification the applicant makes and the reference drug sponsor's decision to initiate patent litigation.
19
The Hatch-Waxman Act establishes periods of regulatory exclusivity for certain approved drug products, during which the FDA cannot approve (or in some cases accept) an ANDA or 505(b)(2) application that relies on the branded reference drug. For example, the holder of an NDA may obtain five years of exclusivity upon approval of a new drug containing a new chemical entity, or NCE, that has not been previously approved by the FDA. The Hatch-Waxman Act also provides three years of marketing exclusivity to the holder of an NDA (including a 505(b)(2) NDA) for a particular condition of approval, or change to a marketed product, such as a new formulation for a previously approved product, if one or more new clinical studies (other than bioavailability or bioequivalence studies) was essential to the approval of the application and was conducted/sponsored by the applicant. This three-year exclusivity period protects against FDA approval of ANDAs and 505(b)(2) NDA for drugs that include the innovation that required the new clinical data.
We expect that some of our drug candidates will utilize the section 505(b)(2) regulatory pathway. Even though several of our drug products utilize active drug ingredients that are commercially marketed in the United States in other dosage forms, we need to establish safety and effectiveness of those active ingredients in the formulation and dosage forms that we are developing. We also have several partnered products that are approved pursuant to ANDAs or will be filed under the ANDA pathway. All approved products, both innovator and generic, are listed in FDA's Approved Drug Products with Therapeutic Equivalence Evaluations (Orange Book).
The Drug Enforcement Administration. Certain of our products, including our fentanyl patch, are regulated as a "controlled substance" as defined in the Controlled Substances Act of 1970, or CSA, which establishes registration, security, recordkeeping, reporting, storage, distribution and other requirements administered by the Drug Enforcement Administration, or DEA. The DEA is concerned with the control and handling of controlled substances, and with the equipment and raw materials used in their manufacture and packaging, in order to prevent loss and diversion into illicit channels of commerce.
The DEA regulates controlled substances as Schedule I, II, III, IV or V substances, with Schedule II substances considered to present the highest risk of substance abuse and Schedule V substances the lowest risk. Certain active ingredients are listed by the DEA as Schedule II and Schedule III under the CSA. Consequently, their manufacture, research, shipment, storage, sale and use are subject to a high degree of oversight and regulation. For example, all Schedule II drug prescriptions must be signed by a physician, generally physically presented to a pharmacist and may not be refilled without a new prescription. Furthermore, the amount of Schedule II substances we can obtain for clinical trials and commercial distribution is limited by the DEA in accordance with a quota system and our quota may not be sufficient to complete clinical trials or meet commercial demand. The DEA establishes annually an aggregate quota for how much fentanyl may be produced in total in the United States based on the DEA's estimate of the quantity needed to meet legitimate scientific and medicinal needs. This limited aggregate amount of fentanyl that the DEA allows to be produced in the United States each year is allocated among individual companies, who must submit applications annually to the DEA for individual production and procurement quotas. We must receive an annual quota from the DEA in order to produce or procure any Schedule II substance, including fentanyl for use in manufacturing our fentanyl products. The DEA may adjust aggregate production quotas and individual production and procurement quotas from time to time during the year, although the DEA has substantial discretion in whether or not to make such adjustments.
Annual registration is required for any facility that manufactures, distributes, dispenses, imports or exports any controlled substance. The registration is specific to the particular location, activity and controlled substance schedule. For example, separate registrations are needed for import and manufacturing, and each registration will specify which schedules of controlled substances are authorized.
20
The DEA typically inspects a facility to review its security measures prior to issuing a registration. Security requirements vary by controlled substance schedule, with the most stringent requirements applying to Schedule I and Schedule II substances. Required security measures include background checks on employees and physical control of inventory through measures such as cages, surveillance cameras and inventory reconciliations. Records must be maintained for the handling of all controlled substances, and periodic reports made to the DEA, for example distribution reports for Schedule I and II controlled substances, Schedule III substances that are narcotics, and other designated substances. Reports must also be made for thefts or losses of any controlled substance, and to obtain authorization to destroy any controlled substance. In addition, special authorization and notification requirements apply to imports and exports.
Failure to maintain compliance with applicable requirements, particularly as manifested in loss or diversion, can result in enforcement action that could have a material adverse effect on our business, results of operations and financial condition. The DEA may seek civil penalties, refuse to renew necessary registrations, or initiate proceedings to revoke those registrations. In certain circumstances, violations could result in criminal proceedings. Individual states also regulate controlled substances, and we and our partners will be subject to state regulation on distribution of these products.
There is a risk that DEA regulations may interfere with the supply of the drugs used in our clinical trials and sold commercially, and, thus on our ability to produce and distribute our products in the volume needed to meet clinical and commercial demand.
FDA Regulation of Consumer Cosmetic Products. Consumer teeth whitening products are regulated by the FDA as cosmetics. The processing, formulation, safety, manufacturing, packaging, labeling, advertising and distribution of these products are subject to regulation by one or more federal agencies, including the FDA and the Federal Trade Commission, or FTC, and by various agencies of the states and localities in which these products are sold. Cosmetic products and their ingredients do not require premarket approval prior to sale, but are subject to specific labeling regulations. While the FDA has not promulgated specific cGMPs for the manufacture of cosmetics, the FDA has provided guidelines for cosmetic manufacturers to follow to ensure that their products are neither misbranded or adulterated.
The FTC exercises jurisdiction over the advertising of cosmetics. In recent years, the FTC has instituted numerous enforcement actions against companies for failure to have adequate substantiation for claims made in advertising or for the use of false or misleading advertising claims. We are also subject to regulation under various state, local, and international laws that include provisions governing, among other things, the formulation, manufacturing, packaging, labeling, advertising, and distribution of cosmetics.
Other Healthcare Laws. Although we do not directly market or promote any of our products, we and our partners are subject to additional healthcare regulation and enforcement by the federal government and by authorities in the states and foreign jurisdictions in which we conduct our business. Such laws may include, without limitation: (a) federal and state laws relating to the Medicare and Medicaid programs and any other federal healthcare program; (b) federal and state laws relating to healthcare fraud and abuse, including, without limitation, the federal Anti-Kickback Statute (42 U.S.C. § 1320a-7b(b)), the federal False Claims Act (31 U.S.C. §§ 3729 et seq.), the False Statements Statute, (42 U.S.C. § 1320a-7b(a)), the Exclusion Laws (42 U.S.C. § 1320a-7), the federal Physician Payment Sunshine Act (42 U.S.C. § 1320a-7h), the Anti-Inducement Statute (42 U.S.C. § 1320a-7a(a)(5)), the Civil Monetary Penalties Law (42 U.S.C. § 1320a-7a) and criminal laws relating to healthcare fraud and abuse, including but not limited to 18 U.S.C. Section 286 and 287, and the Health Insurance Portability and Accountability Act of 1996, or HIPAA (Pub.L. 104-191); (c) state laws relating to Medicaid or any other state healthcare or health insurance programs; (d) federal or state laws relating to billing or claims for reimbursement submitted to any third party
21
payor, employer or similar entity, or patient; (e) any other federal or state laws relating to fraudulent, abusive or unlawful practices connected in any way with the provision or marketing of healthcare items or services, including laws relating to the billing or submitting of claims for reimbursement for any items or services reimbursable under any state, federal or other governmental healthcare or health insurance program or any private payor; and (f) federal and state laws relating to health information privacy and security, including HIPAA, and any rules or regulations promulgated thereunder, the Health Information Technology for Economic and Clinical Health Act, or HITECH, enacted as part of the American Recovery and Reinvestment Act of 2009 and any regulations promulgated thereunder. If our operations or our partners' operations and practices are found to be in violation of any of such laws or any other governmental regulations that apply to us or our partners, we may be subject to penalties, including civil and criminal penalties, damages, fines, the curtailment or restructuring of our operations, the exclusion from participation in federal and state healthcare programs and imprisonment, any of which could adversely affect our ability to operate our business and our financial results.
Coverage and Reimbursement. Sales of our products marketed by our partners will depend, in part, on the extent to which our products will be covered by third-party payors, such as government health care programs, commercial insurance and managed healthcare organizations. These third-party payors are increasingly reducing reimbursements for certain medical products and services. In addition, the U.S. government, state legislatures and foreign governments have continued implementing cost containment programs, including price controls, restrictions on reimbursement and requirements for substitution of generic products. Adoption of price controls and cost-containment measures, and adoption of more restrictive policies in jurisdictions with existing controls and measures, could further limit our net revenue and results. Decreases in third-party reimbursement for our products or a decision by a third-party payor to not cover our products could reduce or eliminate utilization of our products and have a material adverse effect on our sales, results of operations and financial condition. In addition, state and federal healthcare reform measures have been and will be adopted in the future, any of which could limit the amounts that federal and state governments will pay for healthcare products and services, which could result in reduced demand for our products or additional pricing pressures.
Marketing and Sales
Due to the nature of our partnerships and our current business relationships, we currently do not have or require an in-house commercial sales force or marketing function. We have a business development program that generates new business opportunities with pharmaceutical and biopharma companies, including delivering their proprietary drugs in transdermal systems to improve their therapeutic profile, extending the brand life of drugs by offering new dosage forms, and co-developing products that we have initiated. Historically, we have partnered with pharmaceutical companies to market and sell each of the products that we develop and manufacture. In most cases, we work together with our partners to decide which products to develop. However, in some instances we selectively develop products on our own prior to partnering with another company. In the future, we may build our own commercial sales and marketing capability in certain niche markets in order to capture more of the economic value of the products that we may develop. We may also enter into co-promotion agreements for certain of our products with our partners. We will continue to pursue strategic alliances with partners who have significant marketing and distribution presence and expertise.
Competition
Our industry is characterized by rapidly advancing technologies, intense competition and a strong emphasis on proprietary products. We face competition from other companies in numerous industries, including pharmaceuticals and drug delivery. We believe the key competitive factors that will affect the
22
commercial success of our products and the development of our product candidates include onset of action, bioavailability, efficacy, patent protection, compliance, cost, convenience of dosing, safety and tolerability profile.
Companies focused on delivering small molecules transdermally include 3M, Johnson & Johnson, Lohmann Therapy Systems, or LTS, Mylan, Hisamitsu, or Noven, and Actavis. Companies operating in the microneedle transdermal field include 3M, Zosano, Theraject and Fujifilm. Several academic institutions are also conducting research in the microneedle field. In addition to microneedle technologies, there are other methods of transdermal delivery under development for biologics, including heat ablation, laser, ultrasound and radio frequency. Companies developing and manufacturing transdermal systems for biologics include Becton Dickinson, Vyteris, and Zogenix. Some of these companies may be addressing the same therapeutic areas or indications as we are.
Our current products compete, and products in development will compete, in highly competitive markets against both transdermal products and products addressing similar patient and customer needs through other delivery forms. Clonidine TDS, Fentanyl TDS and our future ANDA products will have competition from other generic pharmaceutical companies, including Mylan and Actavis, both of which have their own transdermal manufacturing capability. Other manufacturers of fentanyl patches use a different technology than ours, and although fentanyl patches made with either technology have experienced manufacturing challenges, competitors may claim their technology is superior. The Crest Whitestrips products compete with teeth whitening products marketed by various private labels such as those at Walgreens and CVS.
Many of our existing and potential competitors have substantially greater financial, research and development, and human resources than we do, may succeed in obtaining patent protection before us, and have greater experience than we do commercializing products and developing product candidates, including obtaining FDA and other regulatory approvals for product candidates. Consequently, our competitors are applying significant resources and experience to the problems of drug delivery and transdermal drug delivery in particular. We cannot assure you that our transdermal delivery systems will compete effectively against existing and future transdermal or other delivery systems.
Employees
As of September 30, 2014 we had 244 employees, including 35 in research and development, 191 in operations and 18 in general and administrative roles. From time to time, we also employ independent contractors to support our research and development and our administrative organizations. We also hire temporary employees when needed in our manufacturing and quality groups. None of our employees are represented by a collective bargaining unit, and we have never experienced a work stoppage. We consider our relations with our employees to be good.
Available Information
The mailing address of our headquarters is 235 Constitution Drive, Menlo Park, California 94025 and our telephone number at that location is (650) 298-8255. Our website is www.coriumgroup.com. Through a link on the Investors section of our website, we make available the following filings as soon as reasonably practicable after they are electronically filed with or furnished to the Securities and Exchange Commission, or the SEC: our Annual Report on Form 10-K, Quarterly Reports on Form 10-Q, Current Reports on Form 8-K, and any amendments to those reports filed or furnished pursuant to Section 13(a) or 15(d) of the Securities Exchange Act of 1934, as amended, or the Exchange Act. All such filings are available to the public free of charge. The information posted to our website is not incorporated into this Annual Report on Form 10-K. The public may read and copy any materials that we file with the SEC at the SEC's Public Reference Room at 100 F Street, NE, Washington, DC 20549. The public may obtain information on the operation of the Public Reference
23
Room by calling the SEC at 1-800-SEC-0330. The SEC also maintains an internet site that contains reports, proxy and information statements, and other information regarding issuers that file electronically with the SEC at www.sec.gov. Further, our references to the URLs for these websites are intended to be inactive textual references only.
24
Investing in our common stock involves a high degree of risk. You should carefully consider the following risk factors, as well as the other information in this Annual Report on Form 10-K, including our consolidated financial statements and related notes. The occurrence of any of the events or developments described in the following risk factors could have a material adverse effect on our business, financial condition, results of operations and prospects. In such an event, the trading price of our common stock could decline, and you may lose all or part of your investment.
Risks Related to Our Business and Industry
We have limited operating revenues and a history of operational losses and may not achieve or sustain profitability.
We have incurred significant operating and net losses since our inception. For fiscal 2014, we recorded net revenues of $42.4 million and net loss of $9.9 million. For fiscal 2013, we recorded net revenues of $50.3 million and net loss of $13.9 million. As of September 30, 2014, we had stockholders' equity of $11.8 million. We expect to continue to incur net operating losses for at least the next several years as we seek to advance our products through clinical development and regulatory approval, prepare for and, if approved, proceed to further commercialization, and expand our operations. Our ability to generate sufficient revenues from our existing products or from any of our product candidates in development, and to transition to profitability and generate consistent positive cash flow is uncertain, and we may continue to incur losses and negative cash flow and may never transition to profitability or positive cash flow. In particular, we expect our operating expenses to continue to increase in the near-term as we expand our operations as a public company, and may not be able to generate sufficient revenues to offset this anticipated increase in expenses.
We are dependent on the commercial success of our Clonidine TDS, Fentanyl TDS and Crest Advanced Seal Whitestrips, and although we are generating revenues from sales of our products, we expect a decline in revenues generated by our Clonidine TDS and Fentanyl TDS products.
We anticipate that, in the near term, our ability to become profitable will depend upon the commercial success of the products marketed by our partners. To date, we have generated limited revenues from sales of these products, and in addition, we have incurred liability in association with product recalls of Fentanyl TDS. Our Fentanyl TDS product revenues in fiscal 2014 were $11.7 million. Our product revenues declined in fiscal 2014 as additional competitors entered the market. Based on preliminary forecasted demand from our marketing partner, Par, we expect our product revenues from Fentanyl TDS in 2015 to be comparable to fiscal 2014, excluding the $1.8 million non-cash revenue we recognized in fiscal 2014 related to this product. In addition, Fentanyl TDS relies on a reservoir patch design instead of a matrix patch design. Although both reservoir and matrix patches have been subject to safety concerns and recalls in the past, our current competitors, most of whom use a matrix patch, may raise questions about the design and safety of a reservoir patch and the FDA may decide that the current reservoir patch design is a less safe design and may require the use of matrix patch technology instead. This would result in a more substantial decrease in our revenues and harm our operating results. Our product revenues from Clonidine TDS in fiscal 2014 were $10.8 million, representing a return to levels similar to fiscal 2012, as a competitor who had been unable to supply its product in fiscal 2013 resumed supply to the market throughout 2014. We expect our product revenues from Clonidine TDS during fiscal 2015 to be lower than they were during fiscal 2014, as an additional competitor entered the market in the second half of fiscal 2014.
25
In addition to the risks discussed elsewhere in this section, our ability to continue to generate revenues from our commercialized products will depend on a number of factors, including, but not limited to:
- •
- achievement of broad market acceptance and coverage by third-party payors for our products;
- •
- the effectiveness of our partners' efforts in marketing and selling our products;
- •
- the effects of competition and cost-containment initiatives on product pricing by our partners;
- •
- our ability to successfully manufacture commercial quantities of our products at acceptable cost levels and in compliance with
regulatory requirements;
- •
- our ability to maintain a cost-efficient organization and, to the extent we seek to do so, to partner successfully with additional
third parties;
- •
- our ability to expand and maintain intellectual property protection for our products successfully;
- •
- the efficacy and safety of our products; and
- •
- our ability to comply with regulatory requirements, which are subject to change.
Because of the numerous risks and uncertainties associated with our commercialization efforts, including our reliance on our partners for the marketing and distribution of our products, and other factors, we are unable to predict the extent to which we will continue to generate revenues from our products, or the timing for when or the extent to which we will become profitable. Even if we do achieve profitability, we may not be able to sustain or increase profitability on an ongoing basis.
We depend on a few partners for a significant amount of our revenues, and if we lose any of our significant partners, our business could be harmed.
The majority of our revenues come from only a few partners. For fiscal 2014, three partners, P&G, Teva and Par, individually comprised approximately 28%, 32%, and 31%, respectively, of our total revenues. We expect that revenues from a limited number of partners will continue to account for a large portion of our revenues in the future. The loss by us of any of these partners or a material reduction in their purchases could harm our business, results of operations, financial condition and prospects. In addition, if any of these partners were to fail to pay us in a timely manner, it could harm our cash flow.
We or our partners may choose not to continue developing or commercialize a product or product candidate at any time during development or after approval, which would reduce or eliminate our potential return on investment for that product or product candidate.
We currently have six products on the market, two of which are drugs approved under Abbreviated New Drug Applications, or ANDAs, and four consumer products. In addition, two drug product candidates that we have developed in partnership with other companies are the subject of pending applications for approval by the FDA and we have several self-funded drug product candidates in early stages of research and development.
At any time, we or our partners may decide to discontinue the development of a marketed product or drug product candidate or not to continue commercializing a marketed product or a drug product candidate for a variety of reasons, including the appearance of new technologies that make our product obsolete, the position of our partner in the market, competition from a competing product, or changes in or failure to comply with applicable regulatory requirements. If we terminate a program in which we have invested significant resources, we will not receive any return on our investment and we will have missed the opportunity to have allocated those resources to potentially more productive uses. If one of our partners terminates a development program or ceases to market an approved or commercial
26
product, we will not receive any future milestone payments or royalties relating to that program or product under our partnership agreement with that party.
Our near-term product revenue growth heavily relies on the success of the AG200-15 contraceptive patch.
The near-term growth of our product revenues heavily relies on the Agile AG200-15 transdermal contraceptive patch reaching the market in late 2016 or early 2017. Our collaboration partner Agile, who is responsible for funding and conducting all clinical trials for AG200-15, has conducted Phase 3 clinical studies and filed an NDA with the FDA for AG200-15 in April 2012. The FDA issued a "Complete Response Letter" in February 2013, identifying certain issues, including a request for additional clinical data, which must be addressed before approval can be granted. Accordingly, Agile is conducting an additional Phase 3 clinical trial, which it expects will not be completed before early 2016. We cannot assure you that Agile will be able to complete this additional Phase 3 trial or complete it in a timely manner, if at all, or ultimately obtain regulatory approval for the AG200-15 product. If Agile fails to achieve any of these critical activities, or experiences significant delays in doing so, our near-term growth prospects would be limited, and would create uncertainty around the value and usefulness of our AG200-15 manufacturing facility and equipment.
Since 2003, we have devoted substantial resources to the development of the AG200-15 contraceptive patch in collaboration with Agile. The success of the AG200-15 product is a key component of our business growth over the next few years and we have projected we will receive revenues from manufacture of this product beginning in late 2016 or early 2017. The AG200-15 product requires a process step that we have not yet incorporated into commercial production, which involves the laser-etching of label information on each patch. In addition to requiring an additional Phase 3 clinical study, the FDA has requested information relating to this laser-etching process to demonstrate that it does not adversely affect the performance of the patch. If this product is not approved and launched by late 2016 or early 2017, or at all, or is launched in smaller quantities, we will not realize our anticipated revenue growth in that time period. In addition, one of our three buildings in our manufacturing facility in Grand Rapids, Michigan has been built out for the anticipated commercial production of AG200-15. Although some of the equipment used in that building may be repurposed for other uses with Agile's permission, it would be expensive and time consuming to do so. If AG200-15 is not approved, our business and financial prospects will be significantly harmed.
We are dependent on numerous third parties in our supply chain for the commercial supply of our products, and if we fail to maintain our supply relationships with these third parties, develop new relationships with other third parties or suffer disruptions in supply, we may be unable to continue to commercialize our products or to develop our product candidates.
We rely on a number of third parties for the supply of active ingredients and other raw materials for our products and the clinical supply of our product candidates. Our ability to commercially supply our products and to develop our product candidates depends, in part, on our ability to obtain successfully the APIs used in the products, in accordance with regulatory requirements and in sufficient quantities for commercialization and clinical testing. If we fail to develop and maintain supply relationships with these third parties, we may be unable to continue to commercialize our products, or develop any other product candidates or our MicroCor systems.
We also rely on certain third parties as the current sole source of the materials they supply. Although many of these materials are produced in more than one location or are available from another supplier, if any of these materials becomes unavailable to us for any reason, we likely would incur added costs and delays in identifying or qualifying replacement materials and there can be no assurance that replacements would be available to us on acceptable terms, or at all. In certain cases we may be required to get regulatory approval to use alternative suppliers, and this process of approval could delay production of our products or development of product candidates indefinitely.
27
If our third-party suppliers fail to deliver the required commercial quantities of sub-components and starting materials, on a timely basis and at commercially reasonable prices, and we are unable to find one or more replacement suppliers capable of production at a substantially equivalent cost in substantially equivalent volumes and quality, and on a timely basis, the continued commercialization of our products and the development of our product candidates would be impeded, delayed, limited or prevented, which could harm our business, results of operations, financial condition and prospects.
We face intense competition, in both our delivery systems and products, including from generic drug products, and if our competitors market or develop alternative treatments that are approved more quickly or marketed more effectively than our product candidates or are demonstrated to be safer or more effective than our products, our commercial opportunities will be reduced or eliminated.
The pharmaceutical industry is characterized by rapidly advancing technologies, intense competition and a strong emphasis on developing proprietary therapeutics. We face competition from a number of sources, such as pharmaceutical companies, generic drug companies, biotechnology companies, drug delivery companies and academic and research institutions, many of which have greater financial resources, marketing capabilities, salesforces, manufacturing capabilities, research and development capabilities, experience in obtaining regulatory approvals for drug product candidates and other resources than us.
Many pharmaceutical companies are developing transdermal drug delivery systems, including 3M, Johnson & Johnson, LTS, Mylan, Hisamitsu, and Actavis. In the field of microneedle transdermal systems, other participants include 3M, Zosano, Theraject, Fujifilm and several academic institutions.
We also face competition from third parties in obtaining allotments of fentanyl and other controlled substances under applicable annual quotas of the U.S. Drug Enforcement Administration, or DEA, recruiting and retaining qualified personnel, establishing clinical trial sites and enrolling patients in clinical trials, and in identifying and acquiring or in-licensing new products and product candidates.
Our competitors may develop products that are more effective, better tolerated, subject to fewer or less severe side effects, more useful, more widely prescribed or accepted, or less costly than ours. For each product we commercialize, sales and marketing efficiency are likely to be significant competitive factors. We do not have internal sales or marketing departments, and there can be no assurance that we can develop or contract out these capabilities in a manner that will be cost-efficient and competitive with the sales and marketing efforts of our competitors, especially since some or all of those competitors could expend greater economic resources than we do and/or employ third-party sales and marketing channels. Such competition can lead to reduced market share for our products and contribute to downward pressure in our pricing, which could harm our business, results of operations, financial condition and prospects.
We face product liability exposure, and if successful claims are brought against us, we may incur substantial liability if our insurance coverage for those claims is inadequate.
The commercial use of our products and clinical use of our product candidates expose us to the risk of product liability claims. This risk exists even if a product is approved for commercial sale by the FDA and manufactured in facilities licensed and regulated by the FDA, such as the case with Fentanyl TDS and Clonidine TDS, or an applicable foreign regulatory authority. Our products and product candidates are designed to affect important bodily functions and processes. Any side effects, manufacturing defects, misuse or abuse associated with our products or our product candidates could result in injury to a patient or even death. We have had 19 past legal proceedings related to Fentanyl TDS. Eighteen of the cases have been settled and dismissed with prejudice, and one case is pending. The complaint for the one pending product liability suit did not state a specified amount of compensatory or exemplary damages. We have insurance coverage up to $10 million dollars with a
28
maximum liability of $50,000 of out-of-pocket expense for this claim. We cannot offer any assurance that we will not face other product liability suits in the future, nor can we assure you that our insurance coverage will be sufficient to cover our liability under any such cases.
Fentanyl TDS is an opioid pain reliever that contains fentanyl, which is a regulated "controlled substance" under the Controlled Substances Act of 1970, or CSA, and could result in harm to patients relating to the potent effects of the opioid drug and its potential for abuse. In addition, a liability claim may be brought against us even if our products or product candidates merely appear to have caused an injury. Product liability claims may be brought against us by consumers, health care providers, pharmaceutical companies or others selling or otherwise coming into contact with our products or product candidates, among others. If we cannot successfully defend ourselves against product liability claims we will incur substantial liabilities and reputational harm. In addition, regardless of merit or eventual outcome, product liability claims may result in:
- •
- the inability to commercialize our products or, if approved, our product candidates;
- •
- decreased demand for our products or, if approved, product candidates;
- •
- impairment of our business reputation;
- •
- product recall or withdrawal from the market;
- •
- withdrawal of clinical trial participants;
- •
- costs of related litigation;
- •
- distraction of management's attention from our primary business;
- •
- substantial monetary awards to patients or other claimants; or
- •
- loss of revenues.
We have obtained product liability insurance coverage separately for (1) fentanyl and (2) our other commercial products and clinical trials combined, each with a $10 million per occurrence and a $10 million annual aggregate coverage limit. Our insurance coverage may not be sufficient to cover all of our product liability related expenses or losses and may not cover us for any expenses or losses we may suffer. Moreover, insurance coverage is becoming increasingly expensive, and, in the future, we may not be able to maintain insurance coverage at a reasonable cost, in sufficient amounts or upon adequate terms to protect us against losses due to product liability. If we determine that it is prudent to increase our product liability coverage based on sales of our products, approval of other product candidates, or otherwise, we may be unable to obtain this increased product liability insurance on commercially reasonable terms or at all. Large judgments have been awarded in class action or individual lawsuits based on drugs that had unanticipated side effects, including side effects that are less severe than those of our products and our product candidates. A successful product liability claim or series of claims brought against us could cause our stock price to decline and, if judgments exceed our insurance coverage, could decrease our cash and could harm our business, results of operations, financial condition and prospects.
We have been subject to product recalls in the past, and may be subject to additional product recalls in the future that could harm our reputation and could negatively affect our business.
We may be subject to product recalls, withdrawals or seizures if any of the products we formulate, manufacture or sell fail to meet their specifications or are believed to cause injury or illness or if we are alleged to have violated governmental regulations in the manufacture, labeling, promotion, sale, or distribution of any of our products. In 2008 and 2010, Actavis voluntarily recalled certain lots of Fentanyl TDS, due to imperfections in our manufacturing processes, including an issue that resulted in some patches that may have released the active ingredient at a faster rate than the rate provided in the
29
product specifications. Any similar recall, withdrawal or seizure in the future, particularly if they involve our own proprietary product candidates, could materially and adversely affect consumer confidence in our brands and lead to decreased demand for our products. In addition, a recall, withdrawal or seizure of any of our products would require significant management attention, would likely result in substantial and unexpected expenditures, and would harm our business, financial condition, and results of operations.
If we or our partners are unable to achieve and maintain adequate levels of coverage and reimbursement for our products, or any future products we may seek to commercialize, their commercial success may be severely hindered.
For our products that are available only by prescription, successful sales by our partners depend on the availability of adequate coverage and reimbursement from third-party payors. Patients who are prescribed medicine for the treatment of their conditions generally rely on third-party payors to reimburse all or part of the costs associated with their prescription drugs. Adequate coverage and reimbursement from governmental healthcare programs, such as Medicare and Medicaid, and private third-party payors is critical to new product acceptance. Coverage decisions may depend upon clinical and economic standards that disfavor new drug products when more established or lower cost therapeutic alternatives are already available or subsequently become available. If our products do not demonstrate superior efficacy profiles, they may not qualify for coverage and reimbursement. Even if we obtain coverage for a given product, the resulting reimbursement payment rates might not be adequate or may require co-payments that patients find unacceptably high. Patients are unlikely to use our products unless coverage is provided and reimbursement is adequate to cover a significant portion of the cost of our products.
In addition, the market for our products will depend significantly on access to third-party payors' drug formularies, or lists of medications for which third-party payors provide coverage and reimbursement. The industry competition to be included in such formularies often leads to downward pricing pressures on pharmaceutical companies. Also, third-party payors may refuse to include a particular branded drug in their formularies or otherwise restrict patient access to a branded drug when a less costly generic equivalent or other alternative is available.
Third-party payors, whether foreign or domestic, or governmental or commercial, are developing increasingly sophisticated methods of controlling healthcare costs. In addition, in the United States, no uniform policy of coverage and reimbursement for drug products exists among third-party payors. Therefore, coverage and reimbursement for drug products can differ significantly from payor to payor. As a result, the coverage determination process is often a time-consuming and costly process that will require us to provide scientific and clinical support for the use of our products to each payor separately, with no assurance that coverage and adequate reimbursement will be obtained.
Further, we believe that future coverage and reimbursement will likely be subject to increased restrictions both in the United States and in international markets. Third-party coverage and reimbursement for our products or any of our product candidates for which we may receive regulatory approval may not be available or adequate in either the United States or international markets, which could harm our business, results of operations, financial condition and prospects.
Our partners depend on wholesale pharmaceutical distributors for retail distribution of our products and, if our partners lose any of their significant wholesale pharmaceutical distributors, our business could be harmed.
The majority of our partners' sales are to wholesale pharmaceutical distributors who, in turn, sell the products to pharmacies, hospitals and other customers. The loss of any of these wholesale pharmaceutical distributors' accounts or a material reduction in their purchases could have a material adverse effect on our business, results of operations, financial condition and prospects. In addition,
30
these wholesale customers comprise a significant part of the distribution network for pharmaceutical products in the United States. This distribution network has undergone, and may continue to undergo, significant consolidation marked by mergers and acquisitions. As a result, a small number of large wholesale distributors control a significant share of the market. Consolidation of drug wholesalers has increased, and may continue to increase, competitive and pricing pressures on pharmaceutical products. We cannot assure you that we or our partners can manage these pricing pressures or that wholesaler purchases will not fluctuate unexpectedly from period to period.
Our results of operations may be adversely affected by demand fluctuations outside our ability to control or influence.
In general, our marketing partners are required to provide us with 12-month rolling forecasts of their demand on a quarterly basis, and are also required to place firm purchase orders with us based on the near-term portion of those forecasts. If wholesaler or market demand for these products is lower than forecasted, our marketing partners or their wholesaler customers may accumulate excess inventory. Additionally, our marketing partners may price our products at levels that result in lost contract sales to their wholesaler customers. If such conditions persist, our marketing partners may sharply reduce subsequent purchase orders for a sustained period of time until such excess inventory is consumed, if ever. Significant and unplanned reductions in our manufacturing orders have occurred in the past and our results of operations were harmed. If such reductions occur again in the future, our revenues will be negatively impacted, we will lose our economies of scale, and our revenues may be insufficient to fully absorb our overhead costs, which could result in larger net losses. Conversely, if our marketing partners promote significantly increased demand, we may not be able to manufacture such unplanned increases in a timely manner, especially following prolonged periods of reduced demand. As we have no control over these factors, including our marketing partners' decisions on pricing, our purchase orders could fluctuate significantly from quarter to quarter, and the results of our operations could fluctuate accordingly.
Our MicroCor technology has not been incorporated into a therapeutic commercial product and is still at a relatively early stage of development.
Our MicroCor technology, utilizing proprietary microneedle arrays, has not been incorporated into a therapeutic commercial product and is still at a relatively early stage of development. We use this technology in several of our therapeutic candidates. Although we have conducted Phase 1 clinical trials for our product candidate MicroCor hPTH(1-34), additional studies are required for this product candidate and there is no guarantee that future clinical trials will prove the technology is effective or does not have harmful side effects. Any failures or setbacks in utilizing our MicroCor technology, including adverse effects resulting from the use of this technology in humans, could have a detrimental impact on our internal product candidate pipeline and our ability to enter into new corporate collaborations regarding this technology, which would harm our business and financial position. As of yet, no pharmaceutical product incorporating microneedle technology has been approved by the FDA for commercial sale.
In addition, our MicroCor product candidates have been manufactured in small quantities for preclinical studies and early stage clinical trials. As we prepare for later stage clinical trials and potential commercialization, we are taking steps to increase the scale of production of our MicroCor product candidates. In order to conduct larger or late-stage scale clinical trials for a MicroCor product candidate and supply sufficient commercial quantities of the resulting drug product and its components, if that product candidate is approved for sale, we will need to manufacture it in larger quantities. We may not be able to increase successfully the manufacturing capacity for any of such product candidates in a timely or cost-effective manner or at all. Significant scale-up of manufacturing may require additional processes, technologies and validation studies, which are costly, may not be successful and
31
which the FDA must review and approve. In addition, quality issues may arise during those scale-up activities because of the inherent properties of a product candidate itself or of a product candidate in combination with other components added during the manufacturing and packaging process, or during shipping and storage of the finished product or active pharmaceutical ingredients. If we are unable to successfully scale-up the manufacture of any of our MicroCor product candidates in sufficient quality and quantity, the development of that product candidate and regulatory approval or commercial launch for any resulting drug products may be delayed, or there may be a shortage in supply, either of which could significantly harm our business.
If we are not able to establish collaborations, we may have to alter our development and commercialization plans.
The development and potential commercialization of our product candidates will require substantial additional cash to fund expenses. For some of our product candidates, we may decide to collaborate with pharmaceutical and biotechnology companies for the development and potential commercialization of those product candidates. For example, although we have initiated Phase 1 clinical trials and plan to begin Phase 2 clinical trials through self-funding, we currently plan to find a partner or partners for the commercialization of MicroCor hPTH(1-34).
We face significant competition in seeking appropriate collaborators. Whether we reach a definitive agreement for a collaboration will depend, among other things, upon our assessment of the collaborator's resources and experience, the terms and conditions of the proposed collaboration and the proposed collaborator's evaluation of a number of factors. Those factors may include the design or results of clinical trials, the likelihood of approval by the FDA or other regulatory authorities, the potential market for the subject product candidate, the costs and complexities of manufacturing and delivering such product candidate to patients, the potential of competing products, the existence of uncertainty with respect to our ownership of technology, which can exist if there is a challenge to such ownership without regard to the merits of the challenge, and industry and market conditions generally. The collaborator may also consider alternative product candidates or technologies for similar indications that may be available for collaboration and whether such a collaboration could be more attractive than the one with us for our product candidate. We may also be restricted under future license agreements from entering into agreements on certain terms with potential collaborators. Collaborations are complex and time- consuming to negotiate and document. In addition, there have been a significant number of recent business combinations among large pharmaceutical companies that have resulted in a reduced number of potential future collaborators.
We may not be able to negotiate collaborations on a timely basis, on acceptable terms or at all. If we are unable to do so, we may have to curtail the development of a product candidate, reduce or delay its development program or one or more of our other development programs, delay its potential commercialization, or increase our expenditures and undertake development or commercialization activities at our own expense. If we elect to increase our expenditures to fund development or commercialization activities on our own, we may need to obtain additional capital, which may not be available to us on acceptable terms or at all. If we do not have sufficient funds, we may not be able to further develop our product candidates or bring them to market and generate product revenues.
32
We will need to further increase the size and complexity of our organization in the future, and we may experience difficulties in executing our growth strategy and managing any growth.
Our management, personnel, systems and facilities currently in place may not be adequate to support our business plan and future growth. We will need to further expand our scientific, sales and marketing, managerial, operational, financial and other resources to support our planned research, development and commercialization activities.
Our need to manage our operations, growth and various projects effectively requires that we:
- •
- continue to improve our operational, financial, management and regulatory compliance controls and reporting systems and procedures,
including the implementation of new enterprise resource management software;
- •
- attract and retain sufficient numbers of talented employees;
- •
- manage our commercialization activities for our products and product candidates effectively and in a cost-effective manner;
- •
- manage our relationship with our partners related to the commercialization of our products and product candidates;
- •
- manage our clinical trials effectively;
- •
- manage our internal manufacturing operations effectively and in a cost-effective manner while increasing production capabilities for
our current product candidates to commercial levels;
- •
- manage our development efforts effectively while carrying out our contractual obligations to partners and other third parties.
In addition, historically, we have utilized and continue to utilize the services of part-time outside consultants to perform a number of tasks for us, including tasks related to preclinical and clinical testing. Our growth strategy may also entail expanding our use of consultants to implement these and other tasks going forward. Because we rely on consultants for certain functions of our business, we will need to be able to effectively manage these consultants to ensure that they successfully carry out their contractual obligations and meet expected deadlines. There can be no assurance that we will be able to manage our existing consultants or find other competent outside consultants, as needed, on economically reasonable terms, or at all. If we are not able to effectively expand our organization by hiring new employees and expanding our use of consultants, we might be unable to implement successfully the tasks necessary to execute effectively on our planned research, development and commercialization activities and, accordingly, might not achieve our research, development and commercialization goals.
If we fail to attract and retain management and other key personnel, we may be unable to continue to successfully commercialize our products, develop our product candidates or otherwise implement our business plan.
Our ability to compete in the highly competitive pharmaceuticals industry depends upon our ability to attract and retain highly qualified managerial, scientific, medical and other personnel. We are highly dependent on our management and scientific personnel, including our President and Chief Executive Officer, Peter Staple, our Chief Financial Officer, Robert Breuil, and our Chief Technology Officer and Vice President, Research and Development, Parminder Singh. The loss of the services of any of these individuals could impede, delay or prevent the continuing commercialization of our products and the development of our product candidates and could negatively impact our ability to successfully implement our business plan. If we lose the services of any of these individuals, we might not be able to find suitable replacements on a timely basis or at all, and our business could be harmed as a result.
33
We do not maintain "key man" insurance policies on the lives of these individuals or the lives of any of our other employees. We employ all of our executive officers and key personnel on an at-will basis and their employment can be terminated by us or them at any time, for any reason and without notice. In order to retain valuable employees at our company, in addition to salary and cash incentives, we provide stock options that vest over time. The value to employees of stock options that vest over time will be significantly affected by movements in our stock price that are beyond our control, and may at any time be insufficient to counteract offers from other companies.
We might not be able to attract or retain qualified management and other key personnel in the future due to the intense competition for qualified personnel among biotechnology, pharmaceutical and other businesses, particularly in the San Francisco Bay area where we are headquartered. We could have difficulty attracting experienced personnel to our company and may be required to expend significant financial resources in our employee recruitment and retention efforts. We do not currently have a chief medical officer, and we cannot assure you that, if we require such a position to be filled, we will be able to hire a qualified candidate for this position. Many of the other pharmaceutical companies with whom we compete for qualified personnel have greater financial and other resources, different risk profiles and longer histories in the industry than we do. They also may provide more diverse opportunities and better chances for career advancement. If we are not able to attract and retain the necessary personnel to accomplish our business objectives, we may experience constraints that will harm our ability to implement our business strategy and achieve our business objectives.
In addition, we have scientific and clinical advisors who assist us in formulating our development and clinical strategies. These advisors are not our employees and may have commitments to, or consulting or advisory contracts with, other entities that may limit their availability to us. In addition, our advisors may have arrangements with other companies to assist those companies in developing products or technologies that may compete with ours.
We may engage in strategic transactions that could impact our liquidity, increase our expenses and present significant distractions to our management.
From time to time we may consider strategic transactions, such as acquisitions of companies, asset purchases and out-licensing or in-licensing of products, product candidates or technologies. Additional potential transactions that we may consider include a variety of different business arrangements, including spin-offs, strategic partnerships, joint ventures, restructurings, divestitures, business combinations and investments. Any such transaction may require us to incur non-recurring or other charges, may increase our near and long-term expenditures and may pose significant integration challenges or disrupt our management or business, which could adversely affect our operations and financial results. For example, these transactions entail numerous potential operational and financial risks, including:
- •
- exposure to unknown liabilities;
- •
- disruption of our business and diversion of our management's time and attention in order to develop acquired products, product
candidates or technologies;
- •
- incurrence of substantial debt or dilutive issuances of equity securities to pay for acquisitions;
- •
- higher-than-expected acquisition and integration costs;
- •
- write-downs of assets or impairment charges;
- •
- increased amortization expenses;
- •
- difficulty and cost in combining the operations and personnel of any acquired businesses with our operations and personnel;
34
- •
- impairment of relationships with key suppliers, partners or customers of any acquired businesses due to changes in management and
ownership; and
- •
- inability to retain key employees of any acquired businesses.
Accordingly, there can be no assurance that we will undertake or successfully complete any transactions of the nature described above, and any transaction that we do complete could harm our business, results of operations, financial condition and prospects. We have no current plan, commitment or obligation to enter into any transaction described above.
Our business involves the use of hazardous materials and we and our third-party suppliers must comply with environmental laws and regulations, which can be expensive and restrict how we do business.
Our research and development activities and our manufacturing activities involve the controlled storage, use and disposal of hazardous materials owned by us, including the components of our products and product candidates and other hazardous compounds. We are subject to laws and regulations governing the use, manufacture, storage, handling and disposal of these hazardous materials. In some cases, these hazardous materials and various wastes resulting from their use are stored at our facilities pending use and disposal and we dispose of certain materials directly through incineration. We cannot completely eliminate the risk of contamination, which could cause an interruption of our commercialization efforts, research and development efforts and business operations, injury to our employees and others, environmental damage resulting in costly clean-up and liabilities under applicable laws and regulations governing the use, storage, handling and disposal of these materials and specified waste products. Although we believe that the safety procedures we utilize for handling and disposing of these materials generally comply with the standards prescribed by these laws and regulations, we cannot guarantee that this is the case or eliminate the risk of accidental contamination or injury from these materials. In such an event, we may be held liable for any resulting damages and such liability could exceed our resources. We do not currently carry biological or hazardous waste insurance coverage and our property and casualty and general liability insurance policies specifically exclude coverage for damages and fines arising from biological or hazardous waste exposure or contamination.
Our employees, partners, independent contractors, principal investigators, consultants, vendors and contract research organizations may engage in misconduct or other improper activities, including noncompliance with regulatory standards and requirements.
We are exposed to the risk that our employees, partners, independent contractors, principal investigators, consultants, vendors and contract research organizations, or CROs, may engage in fraudulent or other illegal activity. Misconduct by these employees could include intentional, reckless and/or negligent conduct or unauthorized activity that violates: (1) FDA regulations, including those laws requiring the reporting of true, complete and accurate information to the FDA; (2) manufacturing standards; (3) federal and state healthcare fraud and abuse laws and regulations; or (4) laws that require the true, complete and accurate reporting of financial information or data. Activities subject to these laws also involve the improper use of information obtained in the course of clinical trials, or illegal misappropriation of drug product, which could result in regulatory sanctions and serious harm to our reputation. We have dismissed employees in the past for improper handling and theft of our product components, and although we reported their actions to all relevant authorities, any similar incidents or any other conduct that leads to an employee receiving an FDA debarment could result in a loss of business from our partners and severe reputational harm. We have adopted a code of business conduct and ethics, but it is not always possible to identify and deter employee misconduct, and the precautions we take to detect and prevent this activity may not be effective in controlling unknown or unmanaged risks or losses or in protecting us from governmental investigations or other actions or lawsuits stemming from a failure to be in compliance with such laws or regulations. If any such actions
35
are instituted against us, and we are not successful in defending ourselves or asserting our rights, those actions could have a significant impact on our business, including the imposition of civil, criminal and administrative penalties, damages, monetary fines, possible exclusion from participation in Medicare, Medicaid and other federal healthcare programs, contractual damages, reputational harm, diminished profits and future earnings, and curtailment of our operations, any of which could adversely affect our ability to operate our business and our results of operations.
We may be adversely affected by natural disasters or other events that disrupt our business operations, and our business continuity and disaster recovery plans may not adequately protect us from a serious disaster.
Our corporate headquarters are located in Menlo Park, California, near major earthquake and fire zones. Our manufacturing facilities are in Grand Rapids, Michigan, where other natural disasters or similar events, like blizzards, tornadoes, fires or explosions or large-scale accidents or power outages, could severely disrupt our operations, and have a material adverse effect on our business, results of operations, financial condition and prospects. If a disaster, power outage or other event occurred that prevented us from using all or a significant portion of our headquarters or our Grand Rapids facility, that damaged critical infrastructure, such as enterprise financial systems or manufacturing resource planning and enterprise quality systems, or that otherwise disrupted operations at either location, it may be difficult or, in certain cases, impossible for us to continue our business for a substantial period of time.
Our business and operations would suffer in the event of failures in our internal computer systems.
Despite the implementation of security measures, our internal computer systems and those of our current and any future partners, contractors and consultants are vulnerable to damage from computer viruses, unauthorized access, natural disasters, terrorism, war and telecommunication and electrical failures. While we have not experienced any such material system failure, accident or security breach to date, if such an event were to occur and cause interruptions in our operations, it could result in a material disruption of our manufacturing activities, development programs and our business operations. For example, the loss of manufacturing records or clinical trial data from completed or future clinical trials could result in delays in our regulatory approval efforts and significantly increase our costs to recover or reproduce the data. To the extent that any disruption or security breach were to result in a loss of, or damage to, our data or applications, or inappropriate disclosure of confidential or proprietary information, we could incur liability and the further commercialization and development of our products and product candidates could be delayed.
In connection with the reporting of our financial condition and results of operations, we are required to make estimates and judgments which involve uncertainties, and any significant differences between our estimates and actual results could have an adverse impact on our financial position, results of operations and cash flows.
Our discussion and analysis of our financial condition and results of operations are based on our financial statements, which have been prepared in accordance with generally accepted accounting principles in the United States, or GAAP. The preparation of these financial statements requires us to make estimates and judgments that affect the reported amounts of assets, liabilities, revenues and expenses and related disclosure of contingent assets and liabilities. For example, we estimate annual market revenues based on patient prescriptions using an analysis of third-party information and third-party market research data. If this third-party data underestimates or overestimates actual revenues for a given period, adjustments to revenues may be necessary in future periods. Any significant differences between our actual results and our estimates and assumptions could negatively impact our financial position, results of operations and cash flows.
36
Changes in accounting standards and their interpretations could adversely affect our operating results.
GAAP are subject to interpretation by the Financial Accounting Standards Board, or FASB, the American Institute of Certified Public Accountants, or AICPA, the SEC, and various other bodies that promulgate and interpret appropriate accounting principles. These principles and related implementation guidelines and interpretations can be highly complex and involve subjective judgments. A change in these principles or interpretations could have a significant effect on our reported financial results, and could affect the reporting of transactions completed before the announcement of a change.
Risks Related to Our Financial Position and Capital Requirements
We have had significant and increasing operating expenses and may require additional funding.
We believe that the net proceeds from our initial public offering in April 2014 and the additional funds we raised through debt financing in December 2014, combined with cash flow from our ongoing operations and our existing cash and cash equivalents, together with interest thereon, will be sufficient to fund our operations through at least the next 12 months. We have based these estimates, however, on assumptions that may prove to be wrong, and we could spend our available financial resources much faster than we currently expect. Further, we may need to raise additional capital to fund our operations and continue to support our planned research and development and commercialization activities.
The amount and timing of our future funding requirements will depend on many factors, including, but not limited to:
- •
- the timing and amount of revenues from sales of our approved products and any subsequently approved product candidates that are
commercialized;
- •
- the size and cost of our commercial infrastructure;
- •
- the timing of FDA approval of our product candidates, if at all;
- •
- the timing, rate of progress and cost of any future clinical trials and other product development activities for our product
candidates that we may develop, in-license or acquire;
- •
- costs associated with marketing, manufacturing and distributing any subsequently approved product candidates;
- •
- costs and timing of completion of any additional outsourced commercial manufacturing supply arrangements that we may establish;
- •
- costs of filing, prosecuting, defending and enforcing any patent claims and other intellectual property rights associated with our
products and our product candidates;
- •
- costs associated with prosecuting or defending any litigation that we are or may become involved in and any damages payable by us that
result from such litigation;
- •
- costs associated with any product recall that could occur;
- •
- costs of operating as a public company;
- •
- the effect of competing technological and market developments;
- •
- our ability to acquire or in-license products and product candidates, technologies or businesses;
- •
- personnel, facilities and equipment requirements; and
- •
- the terms and timing of any additional collaborative, licensing, co-promotion or other arrangements that we may establish.
37
We cannot be certain that additional funding will be available on acceptable terms, or at all. To the extent that we raise additional capital by issuing equity securities or convertible debt, your ownership will be diluted. Any future debt financing into which we enter may impose upon us covenants that restrict our operations, including limitations on our ability to incur liens or additional debt, pay dividends, redeem our stock, make certain investments and engage in certain merger, consolidation or asset sale transactions.
If we are unable to raise additional capital when required or on acceptable terms, we may be required to significantly delay, scale back or discontinue one or more of our product development programs or commercialization efforts, or other aspects of our business plan. We also may be required to relinquish, license or otherwise dispose of rights to products or product candidates that we would otherwise seek to commercialize or develop ourselves on terms that are less favorable than might otherwise be available. In addition, our ability to achieve profitability or to respond to competitive pressures would be significantly limited.
Our level of indebtedness could adversely affect our ability to raise additional capital to fund our operations, limit our ability to react to changes in the economy or our industry and prevent us from meeting our obligations.
As of September 30, 2014, the amount of our total indebtedness was approximately $38.3 million, all of which is pursuant to our term loan agreement with Capital Royalty. In November 2014, we modified our term loan agreement with Capital Royalty, to increase the outstanding loan principal amount to $48.3 million, extend the maturity date to June 30, 2019, and extend the quarterly interest-only payments through June 30, 2018, with principal and interest payments due in four quarterly installments beginning September 30, 2018.
Our outstanding debt and related debt service obligations could have important adverse consequences to us, including:
- •
- heightening our vulnerability to downturns in our business or our industry or the general economy and restricting us from making
improvements or acquisitions, or exploring business opportunities;
- •
- requiring a significant portion of our available cash to be dedicated to the payment of principal and interest on our indebtedness,
therefore reducing our ability to use our available cash to fund our operations, capital expenditures and future business opportunities;
- •
- limiting our ability to adjust to changing market conditions and placing us at a competitive disadvantage compared to our competitors
who have greater capital resources; and
- •
- subjecting us to financial and other restrictive covenants in our debt instruments, the failure with which to comply could result in an event of default under the applicable debt instrument that allows the lender to demand immediate repayment of the related debt.
If our cash flows and capital resources are insufficient to fund our debt service obligations, we may be forced to reduce or delay product development, sales and marketing, capital and other expenditures, sell assets, seek additional capital or restructure or refinance our indebtedness. These alternative measures may not be successful and may not permit us to meet our scheduled debt service obligations.
The terms of our term loan agreement place restrictions on our operating and financial flexibility.
During any such times when we have outstanding borrowings under the term loan agreement with Capital Royalty, we will be required to maintain certain deposits and minimum balances as well as be prohibited from engaging in significant business transactions without the prior consent of Capital Royalty, including a change of control or the acquisition by us of another company, or engaging in new
38
business activities which are substantially different from our current business activities. These restrictions could significantly limit our ability to respond to changes in our business or competitive activities or take advantage of business opportunities that may create value for our stockholders. In addition, in the event of a default under either of these arrangements, our repayment obligations may be accelerated in full. In the event that we do not have sufficient capital to repay the amounts then owed, we may be required to renegotiate such arrangements on terms less favorable to us, pursue strategic alternatives, including sale of our company or our significant assets, or to cease operations. Furthermore, if we raise any additional debt financing, the terms of such additional debt could further restrict our operating and financial flexibility.
Our ability to utilize our net operating loss carryforwards, or NOLs, and research and development income tax credit carryforwards may be limited.
As of September 30, 2014, we had NOLs for federal and state income tax purposes of $77.3 million and $12.8 million, respectively. If not utilized, these NOLs will expire beginning in 2026 and 2017 for federal and state income purposes, respectively. Under Section 382 of the Internal Revenue Code of 1986, as amended, if a corporation undergoes an "ownership change," generally defined as a greater than 50% change (by value) in its equity ownership over a three year period, the corporation's ability to use its pre-change net operating loss carry forwards, or NOLs, and other pre-change tax attributes (such as research tax credits) to offset its post-change income may be limited. We believe that, with our initial public offering in April 2014 and other transactions that have occurred over the past three years, we may have triggered an "ownership change" limitation. We may also experience ownership changes in the future as a result of subsequent shifts in our stock ownership. As a result, if we earn net taxable income, our ability to use our pre-change NOLs to offset U.S. federal taxable income may be subject to limitations, which could potentially result in increased future tax liability to us. In addition, at the state level, there may be periods during which the use of NOLs is suspended or otherwise limited, which could accelerate or permanently increase state taxes owed.
Our operating results may fluctuate significantly, which makes our future operating results difficult to predict and could cause our operating results to fall below expectations or our guidance.
Our quarterly and annual operating results may fluctuate significantly in the future, which makes it difficult for us to predict our future operating results. From time to time, we enter into collaboration agreements with other companies that include development funding and significant upfront and milestone payments, and we expect that amounts earned from our collaboration agreements will continue to be an important source of our revenues. Accordingly, our revenues will depend on development funding and the achievement of development and clinical milestones under our existing collaboration arrangements, as well as any potential future collaboration and license agreements and sales of our products, if approved. These upfront and milestone payments may vary significantly from period to period and any such variance could cause a significant fluctuation in our operating results from one period to the next. For example, our product revenues from Clonidine TDS in fiscal 2013 were higher than historic levels, primarily as a result of Teva's increased market share resulting from a major competitor's diminished ability to supply its product for seven months during the year. Revenues returned to historic levels in fiscal 2014. We expect our product revenues from Clonidine TDS during fiscal 2015 to be lower than they were during fiscal 2014, as one additional competitor has entered the market in the second half of fiscal 2014. In addition, we measure compensation cost for stock-based awards made to employees at the grant date of the award, based on the fair value of the award as determined by our board of directors, and recognize the cost as an expense over the employee's requisite service period. As the variables that we use as a basis for valuing these awards change over time, including our underlying stock price and stock price volatility, the magnitude of the expense that we must recognize may vary significantly. Furthermore, our operating results may fluctuate due to a
39
variety of other factors, many of which are outside of our control and may be difficult to predict, including the following:
- •
- the timing and cost of, and level of investment in, research and development activities relating to our product candidates, which may
change from time to time;
- •
- the cost of manufacturing our product candidates, which may vary depending on FDA guidelines and requirements, and the quantity of
production;
- •
- expenditures that we will or may incur to acquire or develop additional product candidates and technologies;
- •
- the level of demand for our product candidates, should they receive approval, which may vary significantly;
- •
- future accounting pronouncements or changes in our accounting policies;
- •
- the timing and success or failure of clinical studies for our product candidates or competing product candidates, or any other change in the competitive landscape of our industry, including consolidation among our competitors or partners.
Our results of operations and liquidity needs could be materially negatively affected by market fluctuations and economic downturn.
Our results of operations and liquidity could be materially negatively affected by economic conditions generally, both in the United States and elsewhere around the world. Domestic and international equity and debt markets have experienced and may continue to experience heightened volatility and turmoil based on domestic and international economic conditions and concerns. In the event these economic conditions and concerns continue or worsen and the markets continue to remain volatile, our results of operations and liquidity could be adversely affected by those factors in many ways, including making it more difficult for us to raise funds if necessary, and our stock price may decline. Additionally, although we market our products primarily in the United States, our partners have extensive global operations, indirectly exposing us to risk.
Risks Related to Regulation of our Products and Product Candidates
Our currently marketed products, and any of our product candidates that we or our partners commercialize, will be subject to ongoing and continued regulatory review, which may result in significant expense and limit our or our partners' ability to commercialize such products.
Even after we achieve U.S. regulatory approval for a product, or after we or our partners commercialize an FDA-regulated product that does not require premarket approval (such as our consumer teeth whitening products), we will be subject to continued regulatory review and compliance obligations. For example, with respect to our drug products, the FDA may impose significant restrictions on the approved indicated uses for which the product may be marketed or on the conditions of approval. A drug product's approval may contain requirements for potentially costly post-approval studies and surveillance, including Phase 4 clinical trials, to monitor the safety and efficacy of the product. We will also be subject to ongoing FDA obligations and continued regulatory review with respect to the manufacturing, processing, labeling, packaging, distribution, adverse event reporting, storage, advertising, promotion and recordkeeping for our products. These requirements include submissions of safety and other post-marketing information and reports, registration, as well as continued compliance with current Good Manufacturing Practice, or cGMP, requirements and with Good Clinical Practice, or GCP, and good laboratory practice, or GLP, requirements, which are regulations and guidelines enforced by the FDA for all of our products in clinical and pre-clinical development, and for any clinical trials that we conduct post-approval. To the extent that a product is
40
approved for sale in other countries, we may be subject to similar restrictions and requirements imposed by laws and government regulators in those countries.
In the case of Fentanyl TDS and any of our product candidates containing controlled substances, we will also be subject to ongoing DEA regulatory obligations, including, among other things, annual registration renewal, security, recordkeeping, theft and loss reporting, periodic inspection and annual quota allotments for the raw material for commercial production of our products. In addition, manufacturers of drug products and their facilities are subject to continual review and periodic inspections by the FDA and other regulatory authorities for compliance with cGMP regulations, including the Quality System Regulation, or QSR, requirements for medical device components of our products or similar requirements, if applicable. If we or a regulatory agency discovers previously unknown problems with a product, such as adverse events of unanticipated severity or frequency, or problems with the facility where, or processes by which, the product is manufactured, a regulatory agency may impose restrictions on that product or us, including requesting that we initiate a product recall, or requiring notice to physicians, withdrawal of the product from the market or suspension of manufacturing.
In response to a fentanyl product recall in October 2010 by our partner Actavis, the FDA inspected our facility and issued a Form 483 with three observations. The FDA again inspected our production facility in November 2011. Following the inspection, the FDA issued a Form 483 with nine observations. We submitted a reply to these observations and the FDA subsequently closed out the inspection and issued us an EIR. The FDA has subsequently inspected our facilities three times, in January and February 2013 and most recently in November 2014, and issued a Form 483 identifying three observations in 2013 and one observation in 2014. These inspections have been closed out with the issuance of an EIR in each case.
If we, our products or product candidates or the manufacturing facilities for our products or product candidates fail to comply with applicable regulatory requirements, a regulatory agency may:
- •
- impose restrictions on the marketing or manufacturing of the product, suspend or withdraw product approvals or revoke necessary
licenses;
- •
- issue warning letters, show cause notices or untitled letters describing alleged violations, which may be publicly available;
- •
- commence criminal investigations and prosecutions;
- •
- impose injunctions, suspensions or revocations of necessary approvals or other licenses;
- •
- impose fines or other civil or criminal penalties;
- •
- suspend any ongoing clinical trials;
- •
- deny or reduce quota allotments for the raw material for commercial production of our controlled substance products;
- •
- delay or refuse to approve pending applications or supplements to approved applications filed by us;
- •
- refuse to permit drugs or precursor chemicals to be imported or exported to or from the United States;
- •
- suspend or impose restrictions on operations, including costly new manufacturing requirements; or
- •
- seize or detain products or require us to initiate a product recall.
41
In addition, our or our partners' product labeling, advertising and promotion are subject to regulatory requirements and continuing regulatory review. The FDA strictly regulates the promotional claims that may be made about prescription drug products. In particular, a drug product may not be promoted for uses that are not approved by the FDA as reflected in the product's approved labeling, although the FDA does not regulate the prescribing practices of physicians. The FDA and other agencies actively enforce the laws and regulations prohibiting the promotion of off-label uses, and a company that is found to have improperly promoted off-label uses may be subject to significant liability, including substantial monetary penalties and criminal prosecution.
The FDA's regulations, policies or guidance may change and new or additional statutes or government regulations may be enacted that could prevent or delay regulatory approval of our product candidates or further restrict or regulate post-approval activities. We cannot predict the likelihood, nature or extent of adverse government regulation that may arise from future legislation or administrative action, either in the United States or abroad. If we are not able to achieve and maintain regulatory compliance, we may not be permitted to market our products, which would adversely affect our ability to generate revenues and achieve or maintain profitability.
Some of our products or product candidates contain controlled substances, the making, use, sale, importation and distribution of which are subject to regulation by state, federal and foreign law enforcement and other regulatory agencies.
Fentanyl TDS and certain of our other drug product candidates contain active ingredients which are classified as controlled substances, which are subject to state, federal and foreign laws and regulations regarding their manufacture, use, sale, importation, exportation and distribution. Controlled substances are regulated under the Controlled Substances Act of 1970, or CSA, and the regulations of the Drug Enforcement Administration, or DEA. The DEA regulates controlled substances as Schedule I, II, III, IV or V substances. Schedule I substances by definition have no established medicinal use and may not be marketed or sold in the United States. A pharmaceutical product may be listed as Schedule II, III, IV or V, with Schedule II substances considered to present the highest risk of abuse and Schedule V substances the lowest relative risk of abuse among such substances. Fentanyl TDS is regulated by the DEA as a Schedule II controlled substance.
Various states also independently regulate controlled substances. Though state controlled substances laws often mirror federal law, because the states are separate jurisdictions, they may separately schedule drugs as well. While some states automatically schedule a drug when the DEA does so, in other states there must be rulemaking or a legislative action. Adverse scheduling could impair the commercial attractiveness of such product. We or our collaborators must also obtain separate state registrations in order to be able to obtain, handle and distribute controlled substances for clinical trials or commercial sale, and failure to meet applicable regulatory requirements could lead to enforcement and sanctions from the states in addition to those from the DEA or otherwise arising under federal law.
For our products or product candidates containing controlled substances, we and our partners, suppliers, contractors and distributors are required to obtain and maintain applicable registrations from state, federal and foreign law enforcement and regulatory agencies and comply with state, federal and foreign laws and regulations regarding the manufacture, use, sale, importation, exportation and distribution of controlled substances. These regulations are extensive and include regulations governing manufacturing, labeling, packaging, testing, dispensing, production and procurement quotas, record keeping, reporting, handling, shipment and disposal. These regulations increase the personnel needs and the expense associated with development and commercialization of drug candidates including controlled substances. Failure to obtain and maintain required registrations or comply with any applicable regulations could delay or preclude us from developing and commercializing our products containing controlled substances and subject us to enforcement action. In addition, because of their
42
restrictive nature, these regulations could limit our commercialization of our pharmaceutical systems containing controlled substances. In particular, among other things, there is a risk that these regulations may interfere with the supply of the drugs used in our clinical trials, and in the future, our ability to produce and distribute our products in the volume needed to meet commercial demand. The DEA may seek civil penalties, refuse to renew necessary registrations or initiate proceedings to revoke those registrations. In some circumstances, violations could lead to criminal proceeding. Because of their restrictive nature, these regulations could limit commercialization of any of our product candidates that are classified as controlled substances.
In addition to the level of commercial success of our approved products, our future growth is also dependent on our ability to successfully develop a pipeline of product candidates, and we cannot give any assurance that any of our product candidates will receive regulatory approval or that any approved products will be successfully commercialized.
Our long-term growth will be limited unless we successfully develop a pipeline of additional product candidates. We do not have internal new drug discovery capabilities, and our primary focus is on developing improved transdermal drug delivery systems by reformulating FDA approved drugs using our proprietary technologies.
Our near-term growth is dependent on the ability of our partner Agile to gain FDA approval of the AG200-15 transdermal contraceptive patch and to bring this product to market. Our collaboration partner Agile has conducted Phase 3 clinical studies and filed an NDA with the FDA forAG200-15 in April 2012. The FDA issued a Complete Response Letter in February 2013 identifying certain issues, including a request for additional clinical data, which must be addressed before approval can be granted. In addition, in light of Mylan's introduction of a generic version of the Ortho Evra contraceptive patch in April 2014, the AG200-15 product may face additional competition, assuming it is approved and commercialized. We cannot assure you that Agile will be able to obtain regulatory approval for the AG200-15 product, or successfully commercialize the product, which would limit our near-term growth prospects, and would create uncertainty around the value and usefulness of our AG200-15 manufacturing facility and equipment.
We have one partnered product candidate that is the subject of a pending ANDA submitted by our partner to the FDA, and several product candidates in clinical development. The research, testing, manufacturing, labeling, approval, sale, marketing and distribution of drug products are subject to extensive regulation by the FDA and other regulatory authorities in the United States and in foreign countries. Obtaining approval of an NDA or ANDA is a lengthy, expensive and uncertain process. The FDA also has substantial discretion in the drug approval process, including the ability to delay, limit or deny approval of a product candidate for many reasons.
For example our product candidates could fail to receive regulatory approval for many reasons, including the following:
- •
- the FDA may disagree with the design or implementation of clinical trials;
- •
- the FDA may not deem a product candidate safe and effective for its proposed indication, or may deem a product's safety risks to
outweigh its clinical or other benefits;
- •
- the FDA may not find the data from pre-clinical studies and clinical trials sufficient to support approval, or the results of clinical
trials may not meet the level of statistical significance required by the FDA for approval;
- •
- the FDA may disagree with our or our partners' interpretation of data from pre-clinical studies or clinical trials;
- •
- the data collected from clinical trials may not be sufficient to support the submission of an NDA or ANDA;
43
- •
- the FDA may require additional pre-clinical studies or clinical trials;
- •
- the FDA may not approve of our manufacturing processes and facilities; or
- •
- the FDA may change its approval policies or adopt new regulations.
Any of our product candidates may fail to achieve their specified endpoints in clinical trials. Furthermore, product candidates may not be approved even if they achieve their specified endpoints in clinical trials. The FDA may disagree with the design of clinical trials and our interpretation of data from clinical trials, or may change the requirements for approval even after it has reviewed and commented on the design for clinical trials. The FDA may also approve a product candidate for fewer or more limited indications than we or our partners request, or may grant approval contingent on the performance of costly post-approval clinical trials. In addition, the FDA may not approve the labeling claims that we or our partners believe are necessary or desirable for the successful commercialization of our product candidates.
If we are unable to expand our pipeline and obtain regulatory approval for our product candidates on the timelines we anticipate, we will not be able to execute our business strategy effectively and our ability to substantially grow our revenues will be limited, which would harm our long-term business, results of operations, financial condition and prospects.
We manufacture our products internally and may encounter manufacturing failures that could impede or delay commercial production of our current products or our product candidates, if approved, or the preclinical and clinical development or regulatory approval of our product candidates.
Any failure in our internal manufacturing operations could cause us to be unable to meet the demand for our products and lose potential revenues, delay the preclinical and clinical development or regulatory approval of our product candidates, and harm our reputation. Our internal manufacturing operations may encounter difficulties involving, among other things, production yields, regulatory compliance, quality control and quality assurance, obtaining DEA quotas which allow us to produce in the quantities needed to execute on our business plan, and shortages of qualified personnel. Our ability to commercially supply our products, and regulatory approval of our product candidates, could be impeded, delayed, limited or denied if the FDA does not maintain the approval of our manufacturing processes and facilities. In addition, we have no experience producing our MicroCor system in commercial quantities. We have experienced product recalls in the past and we may encounter difficulties when we attempt to manufacture commercial quantities of our product candidates in the quantities needed for our preclinical studies or clinical trials. Such difficulties could result in commercial supply shortfalls of our products, delay in the commercial launch of any of our product candidates, if approved, delays in our preclinical studies, clinical trials and regulatory submissions, or the recall or withdrawal of our products from the market.
We must comply with cGMP requirements enforced by the FDA through its facilities inspection program and review of submitted technical information. In addition, we must obtain and maintain necessary DEA and state registrations, and must establish and maintain processes to assure compliance with DEA and state requirements governing, among other things, the storage, handling, security, recordkeeping and reporting for controlled substances. We must also apply for and receive a quota for fentanyl for our Fentanyl TDS product. Any failure to comply with these requirements may result in penalties, including fines and civil penalties, suspension of production, suspension or delay in product approvals, product seizure or recall, operating restrictions, criminal prosecutions, withdrawal of product approvals or severe reputational harm, any of which could adversely affect our business. If the safety of any product or product candidate or component is compromised due to a failure to adhere to applicable laws or for other reasons, we may not be able to successfully commercialize or obtain regulatory approval for the affected product or product candidate, and we may be held liable for injuries sustained as a result. Any of these factors could cause a delay or termination of
44
commercialization, preclinical studies and clinical trials, regulatory submissions or approvals of our products or product candidates, entail higher costs or result in our being unable to effectively commercialize our approved products.
Clinical drug development for our product candidates is expensive, time consuming, uncertain and susceptible to change, delay or termination.
Clinical drug development for our product candidates is very expensive, time-consuming and difficult to design and implement. Our product candidates are in varying stages of development ranging from pre-clinical feasibility studies to registration. We estimate that clinical trials for these product candidates, if and when initiated, will continue for several years and may take significantly longer than expected to complete. In addition, we, our partners, the FDA, an Institutional Review Board, or IRB, or other regulatory authorities, including state and local agencies, may suspend, delay or terminate our clinical trials at any time, for various reasons, including:
- •
- obtaining IRB approval of each site;
- •
- recruiting suitable patients to participate in a trial;
- •
- lack of effectiveness of any product candidate during clinical trials;
- •
- discovery of serious or unexpected toxicities or side effects experienced by study participants or other safety issues;
- •
- slower than expected rates of subject recruitment and enrollment rates in clinical trials;
- •
- difficulty in retaining subjects who have initiated a clinical trial but may withdraw at any time due to adverse side effects from the
therapy, insufficient efficacy, fatigue with the clinical trial process or for any other reason;
- •
- delays in or inability to manufacture or obtain sufficient quantities of materials for use in clinical trials;
- •
- inadequacy of or changes in our manufacturing process or the product formulation;
- •
- delays in obtaining regulatory authorization to commence a study, or "clinical holds" or delays requiring suspension or termination of
a study by a regulatory agency, such as the FDA, before or after a study is commenced;
- •
- changes in applicable regulatory policies and regulations;
- •
- delays or failure in reaching agreement on acceptable terms in clinical trial contracts or protocols with prospective contract
research organizations, or CROs, and clinical trial sites;
- •
- uncertainty regarding proper dosing;
- •
- unfavorable results from ongoing clinical trials and preclinical studies;
- •
- failure of our CROs or other third-party contractors to comply with contractual and regulatory requirements or to perform their
services in a timely or acceptable manner;
- •
- failure by us, our employees, our collaboration partners or their employees, or our CROs or their employees to comply with applicable
FDA or other regulatory requirements relating to the conduct of clinical trials or the handling, storage, security and recordkeeping for controlled substances;
- •
- scheduling conflicts with participating clinicians and clinical institutions;
- •
- failure to design appropriate clinical trial protocols;
45
- •
- insufficient data to support regulatory approval;
- •
- inability or unwillingness of medical investigators to follow our clinical protocols; or
- •
- difficulty in maintaining contact with subjects during or after treatment, which may result in incomplete data.
Generally, there is a high rate of failure for drug candidates proceeding through clinical trials. We or our partners may suffer significant setbacks in our clinical trials similar to the experience of a number of other companies in the pharmaceutical and biotechnology industries, even after receiving promising results in earlier trials. Further, even if we view the results of a clinical trial to be positive, the FDA or other regulatory authorities may disagree with our interpretation of the data. Even after the completion of Phase 3 clinical studies, we may have to address additional issues raised by the FDA in response to the NDA or ANDA filed by us or our partners, such as the issues with the Agile contraceptive patch. In the event that we or our partners abandon or are delayed in the clinical development efforts related to our product candidates, we may not be able to execute on our business plan effectively, we may not be able to become profitable, our reputation in the industry and in the investment community could be significantly damaged and our stock price could decrease significantly.
We have in the past relied and expect to continue to rely on third parties to conduct and oversee our clinical trials. If these third parties do not meet our deadlines or otherwise conduct the trials as required we may not be able to obtain regulatory approval for or commercialize our product candidates when expected or at all.
We have in the past relied and expect to continue to rely on third-party CROs to conduct and oversee our clinical trials. For example, we contracted with a CRO in Australia to conduct the Phase 1 clinical trials for both our MicroCor hPTH(1-34) and the Corplex Tamsulosin products.
We also rely upon various medical institutions, clinical investigators and contract laboratories to conduct our trials in accordance with our clinical protocols and all applicable regulatory requirements, including the FDA's good clinical practice regulations and state regulations governing the handling, storage, security and recordkeeping for controlled substances. These CROs and third parties play a significant role in the conduct of these trials and the subsequent collection and analysis of data from the clinical trials. We rely heavily on these parties for the execution of our clinical and preclinical studies, and control only certain aspects of their activities. We and our CROs and other third party contractors are required to comply with GCP requirements, which are regulations and guidelines enforced by the FDA and comparable foreign regulatory authorities for products in clinical development. Regulatory authorities enforce these GCP requirements through periodic inspections of trial sponsors, principal investigators and trial sites. If we or any of our CROs fail to comply with applicable GCP requirements, the clinical data generated in our clinical trials may be deemed unreliable and the FDA or other regulatory authority may require us to perform additional clinical trials before approving our or our partners' marketing applications. We cannot assure you that upon inspection by a given regulatory authority, such regulatory authority will determine that any of our clinical trials complies with GCP requirements. In addition, our clinical trials must generally be conducted with product produced under cGMP regulations. Our failure to comply with these regulations may require us to repeat clinical trials, which would delay the regulatory approval process.
If any of our CROs or clinical trial sites terminate their involvement in one of our clinical trials for any reason, we may not be able to enter into arrangements with alternative CROs or clinical trial sites, or do so on commercially reasonable terms. In addition, if our relationship with clinical trial sites is terminated, we may experience the loss of follow-up information on patients enrolled in our ongoing clinical trials unless we are able to transfer the care of those patients to another qualified clinical trial site. In addition, principal investigators for our clinical trials may serve as scientific advisors or consultants to us from time to time and receive cash or equity compensation in connection with such services. If these relationships and any related compensation result in perceived or actual conflicts of
46
interest, the integrity of the data generated at the applicable clinical trial site may be questioned by the FDA.
We have conducted and may in the future conduct clinical trials for our products or product candidates outside the United States and the FDA may not accept data from such trials.
We have conducted and may in the future choose to conduct one or more of our clinical trials outside the United States. For example, our CRO conducted the Phase 1 clinical trials for both our MicroCor hPTH(1-34) and the Corplex Tamsulosin products in Australia. Although the FDA may accept data from clinical trials conducted outside the United States, acceptance of such study data by the FDA is subject to certain conditions. For example, the study must be conducted in accordance with GCP requirements and the FDA must be able to validate the data from the study through an onsite inspection if it deems such inspection necessary. Where data from foreign clinical trials are intended to serve as the sole basis for marketing approval in the United States, the FDA will not approve the application on the basis of foreign data alone unless those data are applicable to the U.S. population and U.S. medical practice; the studies were performed by clinical investigators of recognized competence; and the data is considered valid without the need for an on-site inspection by FDA or, if FDA considers such an inspection to be necessary, FDA is able to validate the data through an on-site inspection or other appropriate means. In addition, such studies would be subject to the applicable local laws of the foreign jurisdictions where the studies are conducted. There can be no assurance the FDA will accept data from trials conducted outside of the United States. If the FDA does not accept any such data, it would likely result in the need for additional trials, which would be costly and time-consuming and delay aspects of our business plan.
If the FDA does not conclude that certain of our product candidates satisfy the requirements under Section 505(b)(2)of the Federal Food Drug and Cosmetics Act, or Section 505(b)(2), or if the requirements for such product candidates under Section 505(b)(2) are not as we expect, the approval pathway for those product candidates will likely take significantly longer, cost significantly more and entail significantly greater complications and risks than anticipated, and in either case may not be successful.
We and our collaboration partners are developing several proprietary product candidates, for which we and our partners intend to seek FDA approval through the Section 505(b)(2) regulatory pathway. The Drug Price Competition and Patent Term Restoration Act of 1984, also known as the Hatch-Waxman Act, added Section 505(b)(2) to the Federal Food, Drug and Cosmetic Act, or FDCA. Section 505(b)(2) permits the filing of an NDA where at least some of the information required for approval comes from studies that were not conducted by or for the applicant, and for which the applicant has not received a right of reference, which could expedite the development program for our product candidates by potentially decreasing the amount of clinical data that we or our partners would need to generate in order to obtain FDA approval. If the FDA does not allow us or our partners to pursue the Section 505(b)(2) regulatory pathway as anticipated, we or our partners may need to conduct additional clinical trials, provide additional data and information, and meet additional standards for regulatory approval. If this were to occur, the time and financial resources required to obtain FDA approval for these product candidates, and complications and risks associated with these product candidates, would likely substantially increase. Moreover, inability to pursue the Section 505(b)(2) regulatory pathway could result in new competitive products reaching the market more quickly than our product candidates, which would likely harm our competitive position and prospects. Even if we or our partners are allowed to pursue the Section 505(b)(2) regulatory pathway, we cannot assure you that our product candidates will receive the requisite approvals for commercialization.
In addition, notwithstanding the approval of a number of products by the FDA under Section 505(b)(2) over the last few years, certain competitors and others have objected to the FDA's
47
interpretation of Section 505(b)(2). If the FDA's interpretation of Section 505(b)(2) is successfully challenged, the FDA may be required to change its505(b)(2) policies and practices, which could delay or even prevent the FDA from approving any NDA that we or our partners submit under Section 505(b)(2). In addition, the pharmaceutical industry is highly competitive, and Section 505(b)(2) NDAs are subject to special requirements designed to protect the patent rights of sponsors of previously approved drugs that are referenced in a Section 505(b)(2) NDA. These requirements may give rise to patent litigation and mandatory delays in approval of our NDAs or our partners' NDAs for up to 30 months depending on the outcome of any litigation. It is not uncommon for a manufacturer of an approved product to file a citizen petition with the FDA seeking to delay approval of, or impose additional approval requirements for, pending competing products. If successful, such petitions can significantly delay, or even prevent, the approval of the new product. However, even if the FDA ultimately denies such a petition, the FDA may substantially delay approval while it considers and responds to the petition. In addition, even if we or our partners are able to utilize the Section 505(b)(2) regulatory pathway, there is no guarantee this would ultimately lead to faster product development or earlier approval.
Moreover, even if our product candidates are approved under Section 505(b)(2), the approval may be subject to limitations on the indicated uses for which the products may be marketed or to other conditions of approval, or may contain requirements for costly post-marketing testing and surveillance to monitor the safety or efficacy of the products.
The products that we make and develop may cause undesirable side effects or have other unexpected properties that could delay or prevent their regulatory approval, limit the commercial profile of an approved label, or result in post-approval regulatory action.
Undesirable side effects caused by product candidates could cause us, or partners, or regulatory authorities to interrupt, delay or halt clinical trials and could result in a more restrictive label or the delay or denial of regulatory approval by the FDA or comparable foreign authorities. Results of clinical trials could reveal a high and unacceptable severity and prevalence of side effects. In such an event, trials could be suspended or terminated and the FDA or comparable foreign regulatory authorities could order us, or our partners, to cease further development of or deny approval of product candidates for any or all targeted indications. The drug-related side effects could affect patient recruitment or the ability of enrolled patients to complete the trial or result in product liability claims. Any of these occurrences may harm our business, financial condition and prospects significantly.
The labeling for our Fentanyl TDS product, which is common to all fentanyl transdermal products, includes warnings of serious adverse events relating to abuse potential, respiratory depression and death, and risks relating to accidental exposure, drug interactions and exposure to heat.
Agile has conducted two Phase 3 clinical studies of the AG200-15 product. The safety population in these studies included patients who received at least one dose of either AG200-15 or a combination oral contraceptive, or COC. In the combined safety population of Agile's Phase 3 trials, there were a total of 22 serious treatment emergent adverse effects, or SAEs, of which 16 were from the AG200-15 group, three (0.2%) of which were considered to be possibly related to the study drug, consisting of drug overdose with Benadryl, uncontrollable nausea and vomiting, and left subclavian deep vein thrombosis. Agile believes that AG200-15 will have a label consistent with all marketed hormonal contraceptive products, which include class labeling that warns of risks of certain serious conditions, including venous and arterial blood clot events, such as heart attacks, thromboembolism and stroke, as well as liver tumors, gallbladder disease, and hypertension. Regulatory authorities may require the inclusion of additional statements in the AG200-15 label, which may include a "black box" warning or contraindication.
48
Additionally, if we or others identify undesirable side effects, or other previously unknown problems, caused by our products, other products with the same or related active ingredients, or our or our partners' product candidates, after obtaining U.S. regulatory approval, a number of potentially significant negative consequences could result, including:
- •
- regulatory authorities may withdraw their approval of the product;
- •
- regulatory authorities may require a recall of the product or we or our partners may voluntarily recall a product;
- •
- regulatory authorities may require the addition of warnings in the product label or narrowing of the indication in the product label;
- •
- we may be required to create a Medication Guide outlining the risks of such side effects for distribution to patients;
- •
- we may be required to change the way the product is administered or modify the product in some other way;
- •
- the FDA may require additional clinical trials or costly post-marketing testing and surveillance to monitor the safety or efficacy of
the product;
- •
- we could be sued and held liable for harm caused to patients; and
- •
- our reputation may suffer.
Any of the above events resulting from undesirable side effects or other previously unknown problems could prevent us from achieving or maintaining market acceptance of the affected product and could substantially increase the costs of commercializing our products.
Healthcare reform measures could hinder or prevent the commercial success of our products and product candidates.
In the United States, there have been, and we expect there will continue to be, a number of legislative and regulatory changes to the healthcare system that could affect our future revenues and profitability and the future revenues and profitability of our partners. Federal and state lawmakers regularly propose and, at times, enact legislation that results in significant changes to the healthcare system, some of which are intended to contain or reduce the costs of medical products and services. For example, in March 2010, President Obama signed one of the most significant healthcare reform measures in decades, the Patient Protection and Affordable Care Act, as amended by the Health Care and Education Reconciliation Act, or collectively, the Affordable Care Act. It contains a number of provisions, including those governing enrollment in federal healthcare programs, reimbursement changes and fraud and abuse measures, all of which will impact existing government healthcare programs and will result in the development of new programs. The Affordable Care Act, among other things, (i) increased the minimum Medicaid rebates owed by manufacturers under the Medicaid Drug Rebate Program and extended the rebate program to certain individuals enrolled in Medicaid managed care organizations, (ii) established annual fees on manufacturers of certain branded prescription drugs and (iii) enacted a new Medicare Part D coverage gap discount program, in which manufacturers must agree to offer 50% point-of-sale discounts off negotiated prices of applicable brand drugs to eligible beneficiaries during their coverage gap period, as a condition for the manufacturer's outpatient drugs to be covered under Medicare Part D.
In addition, other legislative changes have been proposed and adopted in the United States since the Affordable Care Act was enacted. On August 2, 2011, the Budget Control Act of 2011 among other things, created measures for spending reductions by Congress. A Joint Select Committee on Deficit Reduction, tasked with recommending a targeted deficit reduction of at least $1.2 trillion for the years
49
2013 through 2021, was unable to reach required goals, thereby triggering the legislation's automatic reduction to several government programs. This includes aggregate reductions of Medicare payments to providers up to 2% per fiscal year, which went into effect on April 1, 2013. On January 2, 2013, President Obama signed into law the American Taxpayer Relief Act of 2012, which, among other things, further reduced Medicare payments to several providers, including hospitals and imaging centers. We expect that additional state and federal healthcare reform measures will be adopted in the future, any of which could limit the amounts that federal and state governments will pay for healthcare products and services, which could result in reduced demand for our products once approved or additional pricing pressures.
We may also be subject to healthcare laws, regulation and enforcement and our failure to comply with those laws could adversely affect our business, operations and financial condition.
Even though we do not and will not control referrals of healthcare services or bill directly to Medicare, Medicaid or other third-party payors, certain federal and state healthcare laws and regulations pertaining to fraud and abuse and patients' rights are and will be applicable to our business. We could be subject to healthcare fraud and abuse and patient privacy regulation by both the federal government and the states in which we or our partners conduct our business. The laws and regulations that may affect our ability to operate include, without limitation:
- •
- the federal Anti-Kickback Statute, which prohibits, among other things, any person from knowingly and willfully offering, soliciting,
receiving or providing remuneration, directly or indirectly, to induce either the referral of an individual, for an item or service or the purchasing or ordering of a good or service, for which
payment may be made under federal healthcare programs such as the Medicare and Medicaid programs;
- •
- the federal False Claims Act, which prohibits, among other things, individuals or entities from knowingly presenting, or causing to be
presented, false claims, or knowingly using false statements, to obtain payment from the federal government, and which may apply to entities that provide coding and billing advice to customers;
- •
- federal criminal laws that prohibit executing a scheme to defraud any healthcare benefit program or making false statements relating
to healthcare matters;
- •
- the federal physician sunshine requirements under the Affordable Care Act, which requires manufacturers of drugs, devices, biologics,
and medical supplies to report annually to the Centers for Medicare & Medicaid Services information related to payments and other transfers of value made by certain manufacturers to physicians,
other healthcare providers, and teaching hospitals, and ownership and investment interests held by physicians and other healthcare providers and their immediate family members;
- •
- the federal Health Insurance Portability and Accountability Act of 1996, as amended by the Health Information Technology for Economic
and Clinical Health Act, and their implementing regulations, all of which govern the conduct of certain electronic healthcare transactions and protect the security and privacy of protected health
information; and
- •
- state law equivalents of each of the above federal laws, such as anti-kickback and false claims laws which may apply to items or services reimbursed by any third-party payor, including commercial insurers; state laws that require pharmaceutical companies to comply with the pharmaceutical industry's voluntary compliance guidelines and the applicable compliance guidance promulgated by the federal government, or otherwise restrict payments that may be made to healthcare providers and other potential referral sources; state laws that require drug manufacturers to report information related to payments and other transfers of value to physicians and other healthcare providers or marketing expenditures; and state laws governing
50
the privacy and security of health information in certain circumstances, many of which differ from each other in significant ways and may not have the same effect, thus complicating compliance efforts.
Because of the breadth of these laws and the narrowness of the statutory exceptions and safe harbors available, it is possible that some of our business activities could be subject to challenge under one or more of such laws. In addition, recent health care reform legislation has strengthened these laws. For example, the Affordable Care Act, among other things, amends the intent requirement of the Federal Anti-Kickback Statute and criminal healthcare fraud statutes. A person or entity no longer needs to have actual knowledge of the statute or specific intent to violate it. In addition, the Affordable Care Act provides that the government may assert that a claim including items or services resulting from a violation of the Federal Anti-Kickback Statute constitutes a false or fraudulent claim for purposes of the False Claims Act.
Achieving and sustaining compliance with these laws may prove costly. In addition, any action against us for violation of these laws, even if we successfully defend against it, could cause us to incur significant legal expenses and divert our management's attention from the operation of our business. If our operations are found to be in violation of any of the laws described above or any other governmental laws or regulations that apply to us, we may be subject to penalties, including civil and criminal penalties, damages, fines, the exclusion from participation in federal and state healthcare programs, imprisonment, or the curtailment or restructuring of our operations, any of which could adversely affect our ability to operate our business and our financial results.
Risks Related to Our Intellectual Property
We may not be able to obtain and enforce patent rights or other intellectual property rights that cover our drug delivery systems and technologies that are of sufficient breadth to prevent third parties from competing against us.
Our success with respect to our drug delivery systems and technologies will depend in part on our ability to obtain and maintain patent protection in both the United States and other countries, to preserve our trade secrets, and to prevent third parties from infringing upon our proprietary rights. Our ability to protect any of our approved products, product candidates or drug delivery systems from unauthorized or infringing use by third parties depends in substantial part on our ability to obtain and maintain valid and enforceable patents. Some of the drugs we use in our products have been approved for many years and therefore our ability to obtain any patent protection relating to the drug ingredients in our products may be limited.
Our patent portfolio related to our transdermal drug delivery systems and technologies includes patents and patent applications in the United States and foreign jurisdictions where we believe there is a market opportunity for our products. The covered technology and the scope of coverage vary from country to country. For those countries where we do not have granted patents, we may not have any ability to prevent the unauthorized use of our technologies. Any patents that we may obtain may be narrow in scope and thus easily circumvented by competitors. Further, in countries where we do not have granted patents, third parties may be able to make, use, or sell products identical to, or substantially similar to our products or product candidates.
Due to legal standards relating to patentability, validity, enforceability and claim scope of patents covering pharmaceutical inventions, our ability to obtain, maintain and enforce patents is uncertain and involves complex legal and factual questions. Accordingly, rights under any existing patents or any patents we might obtain or license may not provide us with sufficient protection for our products and product candidates to afford a commercial advantage against competitive products or processes, including those from branded and generic pharmaceutical companies. In addition, we cannot guarantee that any patents will issue from any pending or future patent applications owned by or licensed to us.
51
Even if patents have issued or will issue, we cannot guarantee that the claims of these patents are or will be held valid or enforceable by the courts or will provide us with any significant protection against competitive products or otherwise be commercially valuable to us.
Our MicroCor technology is new, although patents relating to microneedle technology were first filed in the 1990s. Although we believe that this technology includes certain inventions that are unique and not duplicative of any prior art, we do not have outstanding issued patents covering our more recent developments in this technology and we are unsure of the patent protection that we will be successful in obtaining, if any.
The laws of some foreign jurisdictions do not provide intellectual property rights to the same extent as in the United States and many companies have encountered significant difficulties in protecting and defending such rights in foreign jurisdictions. If we encounter such difficulties in protecting or are otherwise precluded from effectively protecting our intellectual property in foreign jurisdictions, our business prospects could be substantially harmed. The patent positions of pharmaceutical and biotechnology companies can be highly uncertain and involve complex legal and factual questions for which important legal principles remain unresolved. Changes in either the patent laws or in the interpretations of patent laws in the United States and other countries may diminish the value of our intellectual property. Accordingly, we cannot predict the breadth of claims that may be allowed or enforced in our patents or in third-party patents.
The degree of future protection of our proprietary rights is uncertain. Patent protection may be unavailable or severely limited in some cases and may not adequately protect our rights or permit us to gain or keep our competitive advantage. For example:
- •
- we might not have been the first to invent or the first to file the inventions covered by each of our pending patent applications and
issued patents;
- •
- others may independently develop similar or alternative technologies or duplicate any of our technologies;
- •
- the patents of others may have an adverse effect on our business;
- •
- any patents we obtain or our licensors' issued patents may not encompass commercially viable products, may not provide us with any
competitive advantages, or may be challenged by third parties;
- •
- any patents we obtain or our in-licensed issued patents may not be valid or enforceable; or
- •
- we may not develop additional proprietary technologies that are patentable.
If we or our licensors fail to prosecute, maintain and enforce patent protection for our drug delivery technologies, products or product candidates, our ability to develop and commercialize our technologies, products or product candidates could be adversely affected and we might not be able to prevent competitors from making, using and selling competing technologies or products. This failure to properly protect the intellectual property rights relating to our technologies, products or product candidates could have a material adverse effect on our business, financial condition and results of operations. Moreover, our competitors may independently develop equivalent knowledge, methods and know-how. Furthermore, in connection with our license agreement with P&G, we granted to P&G a broad exclusive license for certain fields of use, excluding prescription drug products and foot care and wound care products, to our Corplex technology and related know-how. P&G may sublicense its rights under that license, including to another manufacturer, at any time, and we do not have any assurance that they will continue to use us as their development partner and manufacturer in the future.
52
Proprietary trade secrets and unpatented know-how are also very important to our business. Although we have taken steps to protect our trade secrets and unpatented know-how by entering into confidentiality agreements with third parties, and proprietary information and invention agreements with certain employees, consultants and advisors, third parties may still obtain this information or we may be unable to protect our rights. We also have limited control over the protection of trade secrets used by our licensees, partners and suppliers. There can be no assurance that binding agreements will not be breached, that we would have adequate remedies for any breach, or that our trade secrets and unpatented know-how will not otherwise become known or be independently discovered by our competitors. If trade secrets are independently discovered, we would not be able to prevent their use. Enforcing a claim that a third party illegally obtained and is using our trade secrets or unpatented know-how is expensive and time consuming, and the outcome is unpredictable. In addition, courts outside the United States may be less willing to protect trade secret information.
If we or our partners are sued for infringing intellectual property rights of third parties, it will be costly and time consuming, and an unfavorable outcome in that litigation could have a material adverse effect on our business.
Our commercial success depends upon our ability and the ability of our partners to develop, manufacture, market and sell our products and product candidates and use our proprietary technologies without infringing the proprietary rights of third parties. Numerous U.S. and foreign issued patents and pending patent applications owned by third parties exist in the fields relating to our products and product candidates. As the biotechnology and pharmaceutical industries expand and more patents are issued, the risk increases that others may assert that our drug delivery systems, technologies, products or product candidates infringe their patent rights. Moreover, it is not always clear to industry participants, including us, which patents cover various types of drugs, drug delivery systems or their methods of use. Thus, because of the large number of patents issued and patent applications filed in our fields, there may be a risk that third parties may allege they have patent rights encompassing our products, product candidates, technologies or methods.
In addition, there may be issued patents of third parties of which we are currently unaware, that are infringed or are alleged to be infringed by our products, product candidates or proprietary technologies. Because some patent applications in the United States may be maintained in secrecy until the patents are issued, because patent applications in the United States and many foreign jurisdictions are typically not published until eighteen months after filing, and because publications in the scientific literature often lag behind actual discoveries, we cannot be certain that others have not filed patent applications for technology covered by our own and in-licensed issued patents or our pending applications. Our competitors may have filed, and may in the future file, patent applications covering our products, product candidates or technology similar to ours. Any such patent application may have priority over our own and in-licensed patent applications or patents, which could further require us to obtain rights to issued patents covering such technologies. If another party has filed an U.S. patent application on inventions similar to those owned or in-licensed to us, we or, in the case of in-licensed technology, the licensor may have to participate, in the United States, in an interference proceeding to determine priority of invention.
A substantial portion of our partners' products and product candidates are generic versions of pre-existing brand name drugs and we may be exposed to, or threatened with, future litigation by third parties having patent or other intellectual property rights alleging that our partners' products and/or product candidates and/or proprietary technologies infringe their intellectual property rights, including litigation resulting from filing under Paragraph IV of the Hatch-Waxman Act. These lawsuits could claim that there are existing patent rights for such drug and this type of litigation can be costly and could adversely affect our results of operations and divert the attention of managerial and technical personnel. There is a risk that a court would decide that we or our commercialization partners are
53
infringing the third party's patents and would order us or our partners to stop the activities covered by the patents. In addition, there is a risk that a court will order us or our partners to pay the other party damages for having violated the other party's patents. In addition to facing litigation risks directly, we have agreed to indemnify several of our partners against claims of infringement caused by our proprietary technologies, and we have entered or may enter into cost-sharing agreements with some of our partners that could require us to pay some of the costs of patent litigation brought against those partners whether or not the alleged infringement is caused by our proprietary technologies. In certain instances, these cost-sharing agreements could also require us to assume greater responsibility for infringement damages than would be assumed just on the basis of our technology.
There is a substantial amount of litigation involving patent and other intellectual property rights in the biotechnology and pharmaceutical industries generally. To date, no litigation asserting infringement claims has ever been brought against us. If a third party claims that we or our partners infringe its intellectual property rights, we may face a number of issues, including, but not limited to:
- •
- infringement and other intellectual property claims which, regardless of merit, may be expensive and time-consuming to litigate and
may divert our management's attention from our core business;
- •
- substantial damages for infringement, which we may have to pay if a court decides that the product or technology at issue infringes or
violates the third party's rights, and if the court finds that the infringement was willful, we could be ordered to pay treble damages and the patent owner's attorneys' fees;
- •
- a court prohibiting us from selling or licensing the product or using the technology unless the third party licenses its intellectual
property rights to us, which it is not required to do;
- •
- if a license is available from a third party, we may have to pay substantial royalties, upfront fees and/or grant cross-licenses to
intellectual property rights for our products or technologies; and
- •
- redesigning our products or processes so they do not infringe, which may not be possible or may require substantial monetary expenditures and time.
Some of our competitors may be able to sustain the costs of complex patent litigation more effectively than we or our partners can because they have substantially greater resources. In addition, any uncertainties resulting from the initiation and continuation of any litigation could harm our ability to raise additional funds or otherwise adversely affect our business, results of operations, financial condition and prospects.
We may be subject to claims that our employees, consultants or independent contractors have wrongfully used or disclosed to us alleged trade secrets of their other clients or former employers.
As is common in the biotechnology and pharmaceutical industry, certain of our employees were formerly employed by other biotechnology or pharmaceutical companies, including our competitors or potential competitors. Moreover, we engage the services of consultants to assist us in the development of our products and product candidates, many of whom were previously employed at or may have previously been or are currently providing consulting services to, other biotechnology or pharmaceutical companies, including our competitors or potential competitors. We may be subject to claims that these employees and consultants or we have inadvertently or otherwise used or disclosed trade secrets or other proprietary information of their former employers or their former or current customers. Although we have no knowledge of any such claims being alleged to date, if such claims were to arise, litigation may be necessary to defend against any such claims. Even if we are successful in defending against any such claims, any such litigation could be protracted, expensive, a distraction to our management team, not viewed favorably by investors and other third parties, and may potentially result in an unfavorable outcome.
54
Risks Relating to Ownership of our Common Stock
Our principal stockholder has the ability to control our business, which may be disadvantageous to other stockholders.
Essex Woodlands Health Venture Fund VII, L.P., together with certain of its affiliates, which together we refer to as Essex Woodlands, collectively beneficially owns or controls approximately 52% of the voting power of our outstanding common stock. In addition, Ron Eastman, a Managing Director of Essex Woodlands, is a member of our board of directors. As a result of its ability to control a majority of the voting power of our outstanding common stock, Essex Woodlands has the ability to control all matters requiring approval by our stockholders, including the election and removal of directors, amendments to our certificate of incorporation and bylaws, any proposed merger, consolidation or sale of all or substantially all of our assets and other corporate transactions. Essex Woodlands may have interests that are different from those of other stockholders. Moreover, this concentration of share ownership makes it impossible for other stockholders to replace directors and management without the consent of Essex Woodlands. In addition, this significant concentration of share ownership may adversely affect the price at which prospective buyers are willing to pay for our common stock because investors may perceive disadvantages in owning stock in companies with controlling stockholders.
We are a "controlled company" within the meaning of the NASDAQ rules and, as a result, qualify for exemptions from certain corporate governance requirements. If we rely on these exemptions in the future, you will not have the same protections afforded to stockholders of companies that are subject to such requirements.
Because Essex Woodlands holds a majority of the voting power of our outstanding common stock, we may be considered a "controlled company" within the meaning of the NASDAQ corporate governance requirements. Under these rules, a company of which more than 50% of the voting power is held by an individual, group or another company is a "controlled company" and may elect not to comply with certain corporate governance requirements, including the requirements:
- •
- that a majority of the board of directors consists of independent directors;
- •
- that we have a nominating and corporate governance committee that is composed entirely of independent directors; and
- •
- that we have a compensation committee that is composed entirely of independent directors.
We are not currently utilizing these exemptions. However, we may use these exemptions in the future, and as a result, we could choose not to have a majority of independent directors on our board of directors, or any of our board committees. If that were the case, you would not have the same protections afforded to stockholders of companies that are subject to all of the NASDAQ corporate governance requirements.
Our common stock may be affected by limited trading volume and we expect that the price of our common stock will fluctuate substantially.
There has been a limited public market for our common stock and there can be no assurance that an active trading market for our common stock will develop. This could adversely affect your ability to sell our common stock in short time periods or possibly at all. The trading prices of the securities of pharmaceutical companies have been highly volatile. The market price of our common stock may fluctuate significantly in response to numerous factors, many of which are beyond our control, including:
- •
- the success of, and fluctuations in, the commercial sales of Clonidine TDS, Fentanyl TDS and Crest Whitestrips products or any other products approved for commercialization;
55
- •
- the development status of our product candidates, including whether any of our product candidates receive regulatory approval;
- •
- the execution of our partnering, manufacturing and other aspects of our business plan;
- •
- variations in the level of expenses related to our commercialization activities;
- •
- the performance of third parties on whom we rely for clinical trials, marketing, sales and distribution, including their ability to
comply with regulatory requirements;
- •
- the results of our or our partners' preclinical studies and clinical trials;
- •
- variations in the level of expenses related to our product candidates or preclinical and clinical development programs, including
relating to the timing of invoices from, and other billing practices of, our CROs and clinical trial sites;
- •
- price and volume fluctuations in the overall stock market;
- •
- changes in operating performance and stock market valuations of other pharmaceutical companies;
- •
- market conditions or trends in our industry or the economy as a whole;
- •
- our execution of collaboration, co-promotion, licensing or other arrangements, and the timing of payments we may make or receive under
these arrangements;
- •
- the public's response to press releases or other public announcements by us or third parties, including our filings with the SEC and
announcements relating to litigation or other disputes, strategic transactions, intellectual property or fentanyl or other controlled substances impacting us or our business;
- •
- the financial projections we may provide to the public, any changes in these projections or our failure to meet these projections;
- •
- changes in financial estimates by any securities analysts who follow our common stock, our failure to meet these estimates or failure
of those analysts to initiate or maintain coverage of our common stock;
- •
- ratings downgrades by any securities analysts who follow our common stock;
- •
- the development and sustainability of an active trading market for our common stock;
- •
- future sales of our common stock by our officers, directors and significant stockholders;
- •
- other events or factors, including those resulting from war, incidents of terrorism, natural disasters or responses to these events;
and
- •
- changes in accounting principles.
In addition, the stock markets, and in particular the NASDAQ Global Market, have experienced extreme price and volume fluctuations that have affected and continue to affect the market prices of equity securities of many pharmaceutical companies. Stock prices of many pharmaceutical companies have fluctuated in a manner unrelated or disproportionate to the operating performance of those companies. In the past, stockholders have instituted securities class action litigation following periods of market volatility. If we were involved in securities litigation, we could incur substantial costs and our resources and the attention of management could be diverted from our business.
56
If we fail to maintain an effective system of internal control over financial reporting, we may not be able to accurately report our financial results or prevent fraud. As a result, stockholders could lose confidence in our financial and other public reporting, which would harm our business and the trading price of our common stock.
Effective internal controls over financial reporting are necessary for us to provide reliable financial reports and, together with adequate disclosure controls and procedures, are designed to prevent fraud. Any failure to implement required new or improved controls, or difficulties encountered in their implementation could cause us to fail to meet our reporting obligations. Ineffective internal controls could also cause investors to lose confidence in our reported financial information, which could have a negative effect on the trading price of our common stock. In addition, any future testing by us conducted in connection with Section 404 of the Sarbanes-Oxley Act, or the subsequent testing by our independent registered public accounting firm, may reveal deficiencies in our internal controls over financial reporting that are deemed to be material weaknesses or that may require prospective or retroactive changes to our financial statements or identify other areas for further attention or improvement.
We will be required, pursuant to Section 404 of the Sarbanes-Oxley Act, to furnish a report by management on, among other things, the effectiveness of our internal control over financial reporting as early as the fiscal year ending September 30, 2015. However, for as long as we are an "emerging growth company" under the JOBS Act, our independent registered public accounting firm will not be required to attest to the effectiveness of our internal controls over financial reporting pursuant to Section 404. We could be an emerging growth company for up to five years. An independent assessment of the effectiveness of our internal controls could detect problems that our management's assessment might not. Undetected material weaknesses in our internal controls could lead to financial statement restatements and require us to incur the expense of remediation.
We have begun a process of transferring from our previous financial tracking system to an updated enterprise resource planning system, but have not determined the timing for such a transition. Our current system has been in place since our founding and the transition will be costly and require new training and extensive changes to our system of our internal financial reporting. There is no guarantee that we will be able to transition smoothly and maintain effective internal controls over the reporting process during this transition.
If securities or industry analysts stop publishing research or publish inaccurate or unfavorable research about our business, our stock price and trading volume could decline.
The trading market for our common stock will depend in part on the research and reports that securities or industry analysts publish about us or our business. If one or more of the analysts who covers us downgrades our stock or publishes inaccurate or unfavorable research about our business, our stock price would likely decline. If one or more of these analysts ceases coverage of us or fails to publish reports on us regularly, demand for our stock could decrease, which could cause our stock price and trading volume to decline.
Future sales of our common stock or securities convertible into our common stock may depress our stock price.
Sales of a substantial number of shares of our common stock or securities convertible into our common stock in the public market, or the perception that these sales might occur may reduce the prevailing market price of our common stock and make it more difficult for you to sell your common stock at a time and price that you deem appropriate. In addition, certain holders of our common stock are entitled to rights with respect to the registration of their shares under the Securities Act. Registration of these shares under the Securities Act would result in the shares becoming freely
57
tradable without restriction under the Securities Act, except for shares held by affiliates as defined in Rule 144 under the Securities Act. Any sales of securities by existing stockholders could have a material adverse effect on the market price of our common stock.
Anti-takeover provisions in our charter documents and Delaware law might deter acquisition bids for us that you might consider favorable.
Our restated certificate of incorporation and restated bylaws contain provisions that may make the acquisition of our company more difficult without the approval of our board of directors. These provisions:
- •
- establish a classified board of directors so that not all members of our board are elected at one time;
- •
- authorize the issuance of undesignated preferred stock, the terms of which may be established and shares of which may be issued
without stockholder approval, and which may include rights superior to the rights of the holders of common stock;
- •
- prohibit stockholder action by written consent, which requires all stockholder actions to be taken at a meeting of our stockholders;
- •
- provide that the board of directors is expressly authorized to make, alter, or repeal our bylaws; and
- •
- establish advance notice requirements for nominations for elections to our board or for proposing matters that can be acted upon by stockholders at stockholder meetings.
In addition, because we are incorporated in Delaware, we are governed by the provisions of Section 203 of the Delaware General Corporation Law which, subject to certain exceptions, prohibits stockholders owning in excess of 15% of our outstanding voting stock from merging or combining with us. These anti-takeover provisions and other provisions under Delaware law could discourage, delay or prevent a transaction involving a change in control of our company, even if doing so would benefit our stockholders. These provisions could also discourage proxy contests and make it more difficult for you and other stockholders to elect directors of your choosing so as to cause us to take certain corporate actions you desire.
We qualify as an "emerging growth company" as defined in the JOBS Act and will be able to avail ourselves of reduced disclosure requirements applicable to emerging growth companies, which could make our common stock less attractive to investors.
We qualify as an "emerging growth company" as defined in the JOBS Act, and we intend to take advantage of certain exemptions from various reporting requirements that are applicable to other public companies that are not "emerging growth companies" including certain reduced financial statement reporting obligations, reduced disclosure obligations about our executive compensation arrangements, exemptions from the requirement that we solicit non-binding advisory votes on executive compensation or golden parachute arrangements, and exemption from the auditor's attestation requirements of Section 404(b) of the Sarbanes-Oxley Act. We cannot predict if investors will find our common stock less attractive because we may rely on these exemptions. If some investors find our common stock less attractive as a result, there may be a less active trading market for our common stock and our stock price may be more volatile. We may take advantage of these reporting exemptions until we are no longer an "emerging growth company." We will remain an "emerging growth company" until the earliest of (i) the last day of the fiscal year in which we have total annual gross revenues of $1 billion or more, (ii) the last day of our fiscal year following the fifth anniversary of the date of the completion of our April 2014 initial public offering, (iii) the date on which we have issued more than
58
$1 billion in nonconvertible debt during the previous three years, or (iv) the date on which we are deemed to be a large accelerated filer under the rules of the SEC.
We have never paid dividends on our capital stock, and we do not anticipate paying any cash dividends in the foreseeable future.
The continued operation and expansion of our business will require substantial funding. Accordingly, we do not anticipate that we will pay any cash dividends on shares of our common stock for the foreseeable future. We are also restricted from paying dividends under the term loan agreement with Capital Royalty. Any determination to pay dividends in the future will be at the discretion of our board of directors and will depend upon results of operations, financial condition, contractual restrictions, restrictions imposed by applicable law and other factors our board of directors deems relevant. Accordingly, realization of any gain on your investment in our common stock will depend entirely on the appreciation of the price of our common stock, which may never occur. Investors seeking cash dividends in the foreseeable future should not purchase our common stock.
59
ITEM 1B. UNRESOLVED STAFF COMMENTS
None.
Our principal executive offices and research and development operations are located in Menlo Park, California, in a 25,000 square foot building which houses full product research and development capabilities, including proprietary drug delivery research in novel polymer blending and formulations; system design and engineering; prototyping and pilot manufacturing; analytical, quality assurance and quality control; nonclinical and early clinical development; and regulatory capabilities for clinical development and pilot scale manufacture. We have been in our current Menlo Park location for eight years and the term of our current Menlo Park lease has been extended to December 2015. We are also evaluating opportunities for facility expansion.
Our manufacturing facilities are located in Grand Rapids, Michigan in three buildings comprising approximately 200,000 square feet. We manufacture all of our current commercial products at these facilities. We also perform process development, prototyping, pilot and commercial manufacturing and quality control in our labs in Grand Rapids. We are qualified for prescription transdermal, dermal, mucosal and wound care products as well as OTC products. The facility is FDA and DEA registered and ISO9001 and ISO13485 certified.
We lease two of our three existing buildings in Grand Rapids on a long term basis. One building is dedicated to shipping and receiving, inventory and warehousing, but the space has been improved for multipurpose use. Our warehouse lease will expire in 2015. The other two buildings house all commercial manufacturing as well as administrative offices. We also own a four acre lot across the street from the commercial manufacturing operations for planned future expansion.
From time to time, we are involved in various legal proceedings arising from the normal course of business activities. We are not presently a party to any litigation the outcome of which, we believe, if determined adversely against us, would individually or in the aggregate have a material adverse effect on our business, operating results, cash flows or financial condition.
On August 3, 2012, a wrongful death lawsuit was filed in the U.S. District Court for the Northern District of Texas, Boudreaux vs. Corium International, Inc., et al, naming Actavis Inc. and Actavis South Atlantic LLC ("Actavis") and Corium as co-defendants. Plaintiffs have alleged a family member died in connection with the use of Fentanyl TDS manufactured by Corium and distributed and sold by Actavis. The amount of the damages has not been specified. For this pending suit, we have insurance coverage up to $10 million with a maximum liability of $50,000 of out-of-pocket expense. We do not believe that the case has merit and plan to defend against this claim.
ITEM 4. MINE SAFETY DISCLOSURES
None.
60
ITEM 5. MARKET FOR REGISTRANT'S COMMON EQUITY, RELATED STOCKHOLDER MATTERS AND ISSUER PURCHASES OF EQUITY SECURITIES
Market Information for Common Stock
Our common stock is listed on the Nasdaq Global Market under the symbol "CORI."
The following table sets forth for the indicated periods the high and low sales prices of our common stock as reported on the Nasdaq Global Market.
| |
High | Low | |||||
|---|---|---|---|---|---|---|---|
Year ended September 30, 2014 |
|||||||
Third Fiscal Quarter(1) |
$ | 8.49 | $ | 6.10 | |||
Fourth Fiscal Quarter |
$ | 7.99 | $ | 5.61 | |||
- (1)
- The period reported for the third fiscal quarter is from April 3, 2014 through June 30, 2014.
Stockholders
As of September 30, 2014, there were 65 registered stockholders of record (not including beneficial holders of stock held in street names) of our common stock.
Dividend Policy
We have never declared or paid cash dividends on our common stock. We currently intend to retain any future earnings for use in the operation of our business and do not intend to declare or pay any cash dividends in the foreseeable future. Any further determination to pay dividends on our common stock will be at the discretion of our board of directors, subject to applicable laws, and will depend on our financial condition, results of operations, capital requirements, general business conditions and other factors that our board of directors considers relevant. In addition, our term loan agreement with Capital Royalty restricts our ability to pay dividends.
Securities Authorized for Issuance under Equity Compensation Plans
The information required by this item will be included in an amendment to this Annual Report on Form 10-K or incorporated by reference from our definitive proxy statement to be filed pursuant to Regulation 14A.
Stock Performance Graph
The following shall not be deemed incorporated by reference into any of our other filings under the Exchange Act or the Securities Act, except to the extent we specifically incorporate it by reference into such filing.
The graph below compares the cumulative total stockholder return on our common stock with the cumulative total return on the Nasdaq Composite Index and the Nasdaq Biotechnology Index for the period beginning on April 3, 2014 (the date our common stock began trading on the Nasdaq Global Market) through September 30, 2014, assuming an initial investment of $100.
The comparisons in the graph below are based upon historical data and are not indicative of, nor intended to forecast, future performance of our common stock.
61
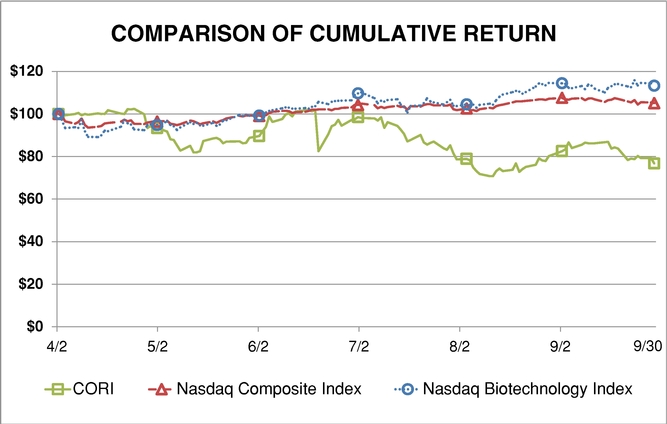
Purchases of Equity Securities by the Issuer and Affiliated Purchasers
None.
Recent Sale of Unregistered Securities and Use of Proceeds
Recent Sale of Unregistered Securities
Other than the issuances of unregistered securities disclosed in our Quarterly Reports for our quarters ended March 31, 2014 and June 30, 2014, since October 1, 2013:
- •
- We have issued an aggregate total of 3,192 shares of our common stock to employees and former employees at an exercise price of $2.222
per share pursuant to exercises of options granted under our 2012 Equity Incentive Plan.
- •
- We have issued an aggregate total of 971,440 shares of common stock to five accredited investors in connection with the exercise of outstanding warrants in connection with the closing of our IPO.
The sales of the these securities were deemed to be exempt from registration under the Securities Act in reliance upon Section 4(2) of the Securities Act (or Regulation D promulgated thereunder), or Rule 701 promulgated under Section 3(b) of the Securities Act as transactions by an issuer not involving any public offering or pursuant to benefit plans and contracts relating to compensation as provided under Rule 701. The recipients of the securities in each of these transactions represented their intentions to acquire the securities for investment only and not with a view to or for sale in connection with any distribution thereof, and appropriate legends were placed upon the stock certificates issued in these transactions.
62
Use of Proceeds
The registration statements on Form S-1 (File No. 333-194279 and File No. 333-195002) relating to our IPO were declared effective by the SEC on April 2, 2014, and the offering commenced the following day. The offering did not terminate before all of the securities registered in the registration statements were sold. Jefferies LLC and Leerink Partners LLC acted as joint book-running managers for the offering, and Needham & Company, LLC and FBR Capital Markets & Co. acted as co-managers of the offering.
We registered a total of 6,500,000 shares of common stock for sale in our IPO, and we closed our IPO on April 8, 2014. On May 8, 2014 we closed the underwriters' option to purchase additional shares, which was exercised in part, and we sold 374,997 shares of our common stock. All sales were at our IPO price of $8.00 per share, for an aggregate gross offering price of $55.0 million. Net proceeds from the offering were approximately $48.5 million, after deducting underwriting discounts and commissions of approximately $3.9 million and other offering-related expenses of approximately $2.7 million.
The principal purpose of our offering was to create a public market for our common stock. We intend to use the net proceeds from our IPO primarily for the advancement of our enabling technologies, the development of our proprietary product candidates, and the scale-up of production capability for these product candidates. We completed our recapitalization immediately following our IPO on April 2, 2014, which involved the repurchase of shares from our founders. We also invested an additional $1.5 million of our IPO proceeds to advance formulation work on several of our central nervous system product candidates and to place orders for our specialized manufacturing equipment for our hPTH(1-34) program.
63
ITEM 6. SELECTED CONSOLIDATED FINANCIAL DATA
The following selected statement of operations data for fiscal 2014, 2013 and 2012 and the balance sheet data as of September 30, 2014, 2013 and 2012 are derived from our audited financial statements and related notes included elsewhere in this prospectus. Our historical results are not necessarily indicative of the results that may be expected in the future. You should read the following selected financial data below in conjunction with the section titled "Management's Discussion and Analysis of Financial Condition and Results of Operations" and our financial statements and related notes included elsewhere in this prospectus.
| |
Year Ended September 30, | |||||||||
|---|---|---|---|---|---|---|---|---|---|---|
| |
2014 | 2013 | 2012 | |||||||
| |
(In thousands, except share and per share data) |
|||||||||
Statement of Operations Data: |
||||||||||
Revenues: |
||||||||||
Product revenues |
$ | 32,202 | $ | 38,704 | $ | 35,716 | ||||
Contract research and development revenues |
9,026 | 10,750 | 6,838 | |||||||
Other revenues |
1,212 | 816 | 306 | |||||||
| | | | | | | | | | | |
Total revenues |
42,440 | 50,270 | 42,860 | |||||||
Costs and operating expenses: |
||||||||||
Cost of product revenues |
20,204 | 24,828 | 24,360 | |||||||
Cost of contract research and development revenues |
15,391 | 11,856 | 10,244 | |||||||
Research and development expenses |
7,365 | 5,496 | 3,966 | |||||||
General and administrative expenses |
9,095 | 6,525 | 4,645 | |||||||
Amortization of intangible assets |
547 | 541 | 512 | |||||||
Gain on disposal and sale and leaseback of equipment |
(112 | ) | (177 | ) | (57 | ) | ||||
| | | | | | | | | | | |
Total costs and operating expenses |
52,490 | 49,069 | 43,670 | |||||||
| | | | | | | | | | | |
Income (loss) from operations |
(10,050 | ) | 1,201 | (810 | ) | |||||
Interest income |
7 | 9 | 4 | |||||||
Interest expense |
(6,961 | ) | (7,705 | ) | (5,247 | ) | ||||
Change in fair value of preferred stock warrant liability |
(274 | ) | (14 | ) | 21 | |||||
Change in fair value of subordinated note embedded derivative liability |
7,367 | (7,367 | ) | — | ||||||
Other income |
— | — | 582 | |||||||
| | | | | | | | | | | |
Loss before income taxes |
(9,911 | ) | (13,876 | ) | (5,450 | ) | ||||
Income tax benefit (expense) |
(1 | ) | (1 | ) | 7 | |||||
| | | | | | | | | | | |
Net loss |
$ | (9,912 | ) | $ | (13,877 | ) | $ | (5,443 | ) | |
| | | | | | | | | | | |
| | | | | | | | | | | |
| | | | | | | | | | | |
Net loss attributable to common stockholders, basic and diluted(1) |
$ | (9,912 | ) | $ | (13,877 | ) | $ | (5,443 | ) | |
| | | | | | | | | | | |
| | | | | | | | | | | |
| | | | | | | | | | | |
Net loss per share attributable to common stockholders, basic and diluted(1) |
$ | (0.99 | ) | $ | (6.24 | ) | $ | (2.47 | ) | |
| | | | | | | | | | | |
| | | | | | | | | | | |
| | | | | | | | | | | |
Weighted-average shares used in computing net loss per share attributable to common stockholders, basic and diluted(1) |
10,043,640 | 2,222,981 | 2,200,727 | |||||||
- (1)
- See Note 16 to our annual audited financial statements for an explanation of the method used to calculate basic and diluted net loss per share attributable to common stockholders and the weighted average number of shares used in the computation of the per share amounts.
64
| |
As of September 30, | |||||||||
|---|---|---|---|---|---|---|---|---|---|---|
| |
2014 | 2013 | 2012 | |||||||
| |
(In thousands) |
|||||||||
Balance Sheet Data: |
||||||||||
Cash and cash equivalents |
$ | 36,395 | $ | 13,581 | $ | 12,245 | ||||
Working capital |
37,370 | 8,594 | 11,102 | |||||||
Total assets |
65,744 | 44,022 | 37,202 | |||||||
Preferred stock warrant liability |
— | 560 | 546 | |||||||
Subordinated note embedded derivative liability |
— | 7,367 | — | |||||||
Deferred contract revenues, current and long-term portions |
3,801 | 5,800 | 5,479 | |||||||
Debt, current and long-term portions |
38,262 | 63,685 | 54,330 | |||||||
Recall liability, current and long-term portions |
3,710 | 4,832 | 5,000 | |||||||
Convertible preferred stock |
— | 57,261 | 57,261 | |||||||
Redeemable common stock |
— | 3,224 | 3,224 | |||||||
Total stockholders' equity (deficit) |
11,800 | (119,100 | ) | (106,346 | ) | |||||
65
ITEM 7. MANAGEMENT'S DISCUSSION AND ANALYSIS OF FINANCIAL CONDITION AND RESULTS OF OPERATIONS
The following discussion and analysis of our financial condition and results of operations should be read in conjunction with (1) the section titled "Selected Consolidated Financial Data" and (2) the audited financial statements and notes thereto and management's discussion and analysis of financial condition and results of operations for the fiscal year ended September 30, 2014 included elsewhere in this Annual Report on Form 10-K. This Annual Report on Form 10-K contains "forward-looking statements" with respect to our plans and strategy for our business. Such forward-looking statements are subject to risks, uncertainties and other factors that could cause actual results and the timing of certain events to differ materially from future results expressed or implied by the forward-looking statements. Factors that could cause or contribute to such differences include, but are not limited to, those identified herein, and those discussed in the section titled "Risk Factors", set forth in Part I, Item 1A of this Form 10-K and in our other SEC filings. We disclaim any obligation to update any forward-looking statements to reflect events or circumstances after the date of such statements. Our fiscal year ends September 30. Throughout this discussion and analysis, references to "fiscal", "fiscal year" or "fiscal years" refer to years ended September 30.
Company Overview
We are a commercial stage biopharmaceutical company focused on the development, manufacture and commercialization of specialty pharmaceutical products that leverage our broad experience in transdermal and transmucosal delivery systems. Together with our partners, we have successfully developed six marketed products in the prescription drug and consumer markets, and we are the sole commercial supplier of each of those products for our marketing partners. These marketed products are Clonidine Transdermal Delivery System, or TDS, Fentanyl TDS and four Crest Advanced Seal Whitestrips products. We use our novel transdermal and transmucosal approaches to bring new products to markets that present significant opportunities. Our development platforms enable transdermal delivery of large molecules, or biologics, including vaccines, peptides and proteins, as well as small molecules that are otherwise difficult to deliver in a transdermal dosage form. Our pipeline includes two partnered products that are the subject of pending drug marketing applications to the U.S. Food and Drug Administration, or FDA. In addition, we have 12 partner- or self-funded programs at earlier stages.
We have built significant know-how and experience in the development, scale-up and manufacture of complex specialty products, and have formed relationships with our partners that include both the development of new product formulations and our manufacture of the resulting products. All of our current products are distributed, promoted and marketed by our partners. Our partners include The Procter & Gamble Company, or P&G, Par Pharmaceutical, Inc., Teva Pharmaceuticals USA, Inc. and Agile Therapeutics, Inc., as well as several other multinational pharmaceutical companies. Most of these entities have substantially greater financial and operating resources than we do, including global operations. We have never had, nor do we currently have, our own sales force or marketing capabilities. We do not control the market prices that our marketing partners set for our products and, consequently, we do not control the market shares or rates of adoption for our current products.
Our partnership with P&G began in 2005 with the development of Crest Whitestrips, which P&G commercially launched in 2009. We currently manufacture four types of Crest Whitestrips, which P&G currently sells throughout North America. Our total revenues from P&G were $11.7 million, $11.8 million and $7.9 million in fiscal 2014, 2013 and 2012.
Our partnership with Teva began in 2004, with Teva's predecessor, Barr Laboratories. Together with Barr, we developed Clonidine TDS, which Teva commercially launched in 2010. Teva currently sells Clonidine TDS throughout North America. Our total revenues from Teva were $13.6 million, $16.7 million and $11.4 million in fiscal 2014, 2013 and 2012.
66
Our partnership with Par is the result of an FTC-mandated divestiture of the product from Actavis, Inc. in connection with the merger of Actavis with Watson Pharmaceuticals. We began the development of Fentanyl TDS with Abrika LLLP in May 2002, and Abrika was subsequently acquired by Actavis in 2007. Actavis commercially launched Fentanyl TDS in 2007. Par currently sells Fentanyl TDS throughout the United States. Our total revenues from Par were $13.0 million, $16.6 million and $18.1 million in fiscal 2014, 2013 and 2012, respectively.
In addition to commercialized products, we have a number of products in late stages of development. The most advanced clinical stage product in our pipeline is AG200-15, which is in Phase 3 development by our partner Agile. AG200-15 is a combined hormonal contraceptive patch designed to deliver two hormones, ethinyl estradiol and levonorgestrel, at levels comparable to low-dose oral contraceptives, through the skin in an easy-to-use format over seven days. Agile has filed a New Drug Application, or NDA, for approval of this product by the FDA, which is required before marketing a new drug in the United States. The FDA has indicated that Agile's NDA was not sufficient for approval as originally submitted. Agile is currently conducting a confirmatory Phase 3 clinical trial based on discussions with the FDA and intends to respond to the FDA with the results of this trial.
We are developing several additional products utilizing our proprietary technologies that we plan to advance into Phase 1 and 2 trials in fiscal 2015. MicroCor hPTH(1-34) utilizes our MicroCor technology to deliver parathyroid hormone, a peptide for treating osteoporosis that is currently available only in a refrigerated injectable form. Our programs in Alzheimer's and Parkinson's diseases have advanced into "in vivo" pharmacokinetic testing. We are actively pursuing two parallel programs for the transdermal treatment of Alzheimer's disease, incorporating two drugs already approved by the FDA for the treatment of Alzheimer's disease, donepezil and memantine. We currently plan to take both programs into human clinical trials. Additionally, we have two programs for the transdermal treatment of Parkinson's disease, also incorporating drugs already approved by the FDA for the treatment of Parkinson's disease, ropinirole and pramipexole. We currently plan to take at least one of these programs into human clinical trials. We have also been developing Tamsulosin TDS, a patch that delivers tamsulosin to patients with benign prostatic hyperplasia, or enlarged prostate. We have decided to reallocate capital from the Tamsulosin TDS development program to our Alzheimer's and Parkinson's disease programs, and further investment in Tamsulosin TDS product will be dependent on potential partnering activities and external funding.
Initial Public Offering
On April 2, 2014, our registration statements on Form S-1 (File No. 333-194279 and File No. 333-195002) relating to our IPO, were declared effective by the SEC. Our IPO closed on April 8, 2014 at which time we sold 6,500,000 shares of our common stock at a price of $8.00 per share. Corium also granted the underwriters a 30-day option to purchase up to 975,000 additional shares of common stock at our IPO price. On May 2, 2014, the underwriters elected to exercise their option to purchase 374,997 additional shares. In total, we received net cash proceeds of $48.5 million from our IPO, after deducting underwriting discounts and commissions and offering-related expenses paid by us.
67
Components of Statements of Operations
| |
Years ended September 30, | |||||||||
|---|---|---|---|---|---|---|---|---|---|---|
| |
2014 | 2013 | 2012 | |||||||
Product Revenues: |
||||||||||
P&G |
$ | 9,714 | $ | 9,831 | $ | 7,045 | ||||
Teva |
10,767 | 13,158 | 10,483 | |||||||
Actavis/Par |
11,721 | 15,640 | 16,668 | |||||||
Other |
— | 75 | 1,520 | |||||||
| | | | | | | | | | | |
Total Product Revenues |
32,202 | 38,704 | 35,716 | |||||||
Contract Research and Development Revenues: |
||||||||||
P&G |
2,005 | 1,951 | 834 | |||||||
Teva |
2,783 | 3,526 | 966 | |||||||
Actavis/Par |
1,014 | 674 | 1,233 | |||||||
Agile |
1,016 | 4,344 | 3,014 | |||||||
Co-development products |
1,475 | 62 | — | |||||||
Other |
733 | 193 | 791 | |||||||
| | | | | | | | | | | |
Total Contract Research and Development Revenues |
9,026 | 10,750 | 6,838 | |||||||
| | | | | | | | | | | |
Other Revenues |
1,212 | 816 | 306 | |||||||
| | | | | | | | | | | |
Total Revenues |
$ | 42,440 | $ | 50,270 | $ | 42,860 | ||||
| | | | | | | | | | | |
Dollar Change—Total Revenues |
$ | (7,830 | ) | $ | 7,410 | |||||
Percentage Change—Total Revenues |
(15.6 | )% | 17.3 | % | ||||||
Percentage of Revenues: |
||||||||||
Product Revenues |
75.9 | % | 77.0 | % | 83.3 | % | ||||
Contract research and development revenues |
21.3 | % | 21.4 | % | 16.0 | % | ||||
Other Revenues |
2.8 | % | 1.6 | % | 0.7 | % | ||||
| | | | | | | | | | | |
Total Revenues |
100.0 | % | 100.0 | % | 100.0 | % | ||||
| | | | | | | | | | | |
| | | | | | | | | | | |
| | | | | | | | | | | |
Revenues
During fiscal 2014, 2013 and 2012, we recognized revenues in three categories: product revenues, contract research and development revenues, and other revenues.
Product Revenues—Product revenues consist of product sales, royalties and profit sharing from products that have been commercialized and are sold by our partners. Clonidine TDS, Fentanyl TDS and Crest Whitestrips make up the majority of our product revenues.
Our product revenues from Clonidine TDS in fiscal 2013 were higher than historic levels, primarily as a result of Teva's increased market share resulting from a major competitor's diminished ability to supply its product during the year. In fiscal 2014, sales of Clonidine TDS returned to levels comparable to fiscal 2012, as this competitor resumed supply to the market. We expect our product revenues from Clonidine TDS during fiscal 2015 to be lower than they were during fiscal 2014, as an additional competitor entered the market during the second half of fiscal 2014.
Our product revenues from our Fentanyl TDS marketing partner, Par, declined in fiscal 2014 from previous years as additional competitors entered the market, and, as a result, we decreased our production levels in fiscal 2014. We do not expect our product revenues from Fentanyl TDS during fiscal 2015 to exceed fiscal 2014 levels. In September 2014, we recognized $1.8 million in non-cash product revenues related to Fentanyl TDS, which had previously been deferred since 2007. The
68
recognition of this revenue related to the expiration of a contractual liability and will not have an impact on future revenue.
Product revenues from Crest Whitestrips in fiscal 2014 were comparable to fiscal 2013. We expect product sales of this product family to increase in fiscal 2015, as we expect new products will be launched.
Contract Research and Development Revenues—We also generate revenues from agreements with our partners for the research, development and pre-commercialization activities of new products. The terms of such agreements may include nonrefundable upfront payments, partial or complete reimbursement of research and development costs, and milestone payments. Contract research and development revenues in fiscal 2014, 2013, and 2012 were primarily derived from our development activities related to AG200-15, Crest Whitestrips, a co-development arrangement for two new generic drug products, and a generic drug product currently in the late stages of development. We believe contract research and development revenues will grow as we continue to advance our existing partner- and co-funded programs into later and more complex stages of development, and as we add new product programs with new and existing partners. Contract research and development revenues for each program will generally decline as such products near or are awaiting regulatory approval.
Other Revenues—Other revenues in fiscal 2014, 2013 and 2012 consisted primarily of income derived from certain aspects of our arrangements with our partners, whereby a portion of the revenues received under these agreements is treated for accounting purposes as rental income from embedded leases associated with these relationships. Other revenues have not been, and are not expected to be, a significant portion of our revenues.
Cost of Product Revenues
The primary components of our cost of product revenues are materials, personnel costs, depreciation, facilities costs, other overhead costs, and infrastructure expenses associated with the manufacturing of our products. Our manufacturing overhead costs are significant, and are currently allocated among our products at rates consistent with current unit production volumes. As the number of units we manufacture increases, our overhead costs should increase less rapidly due to economies of scale, resulting in lower per unit costs associated with these higher product volumes. Conversely, if total unit volumes decrease, as was the case in fiscal 2014 and is expected to be the case in fiscal 2015, the cost of product revenues, measured as a percentage of product revenues, may increase as we lose economies of scale, unless offset by other savings.
Cost of Contract Research and Development Revenues
We incur expenses related to our contract research and development revenues from our partner- and co-funded product development agreements. These expenses consist primarily of personnel costs, materials, supplies, and overhead costs. We expense all contract research and development costs, including costs to be subsequently reimbursed under development contracts, in the periods in which they are incurred. Our costs of contract research and development will fluctuate depending on the timing and stage of our various partner arrangements. In certain cases, contract research and development costs exceed contract research and development revenues, either due to timing differences between expenses and revenues, or due to the nature of the underlying contracts. We enter into certain research and development arrangements that we do not expect to be profitable because we expect the long-term benefits of those arrangements to outweigh the short-term costs. Furthermore, we have entered, and expect to continue to enter, into other research and development arrangements in which we will be sharing the costs of development (co-development) with our partner, resulting in our costs significantly exceeding our revenues on such projects.
69
Research and Development Expenses
Research and development expenses include costs incurred to develop our proprietary products using our transdermal drug delivery technologies. These costs consist of personnel costs, materials and supplies, overhead and facility costs, pre-clinical and non-clinical development costs, clinical trial and related clinical manufacturing costs, contract services, and other outside costs. We expense all research and development costs in the periods in which they are incurred. We expect our research and development expenses to increase in future periods as we continue to invest in research and development activities related to clinical development of our proprietary pipeline, including our products targeting the treatment of osteoporosis, Alzheimer's and Parkinson's diseases, as well as other future development programs.
General and Administrative Expenses
General and administrative expenses consist primarily of personnel costs, including stock-based compensation, for employees in our administration, finance, business development, human resources and information technology functions. Other expenses include professional fees for accounting and legal services, and costs of consultants and other outside services. We expect that our general and administrative expenses will increase with the growth in our revenues and the continued development of our product pipeline.
Interest Income
Interest income consists primarily of interest earned on our cash and cash equivalents balances.
Interest Expense
Interest expense primarily consists of the interest charges associated with our convertible notes and subordinated note, our term loan agreement and our capital lease obligations. The interest expense on our convertible notes and subordinated note accrued without cash payment until the notes converted into common stock in connection with our IPO in fiscal 2014. Our other interest expense is paid periodically in cash, except when converted into PIK notes. For further discussion see "—Liquidity and Capital Resources—Description of Certain Indebtedness."
Change in Fair Value of Preferred Stock Warrant Liability
Certain convertible preferred stock warrants were classified as liabilities on our balance sheets at fair value as we determined them to be derivative instruments because they contained antidilution provisions that protected the holders from certain future equity issuances at prices below the original issue price of the underlying security. We remeasured the convertible preferred stock warrants to fair value at each balance sheet date with the corresponding gain or loss from the adjustment recorded in the statements of operations and comprehensive loss. We reclassified this liability to equity in connection with our IPO in fiscal 2014.
Change in Fair Value of Subordinated Note Embedded Derivative Liability
Our subordinated note contained a provision that provided for the payment of an additional 100% principal payment to the holder upon a sale of our company or substantially all of our assets. This provision was considered an embedded derivative, which was remeasured to fair value at each balance sheet date with the corresponding gain or loss from the adjustment recorded in the statements of operations and comprehensive loss. In connection with our IPO in fiscal 2014, this embedded derivative was determined to no longer have any value and was eliminated through a credit to earnings.
70
Results of Operations
The following table sets forth each of our costs and operating expenses as a percentage of our total revenues:
| |
Year Ended September 30, |
|||||||||
|---|---|---|---|---|---|---|---|---|---|---|
| |
2014 | 2013 | 2012 | |||||||
Percentage of Revenues |
||||||||||
Total revenues |
100 | % | 100 | % | 100 | % | ||||
Costs and operating expenses: |
||||||||||
Cost of product revenues |
48 | 49 | 57 | |||||||
Cost of contract research and development revenues |
36 | 24 | 24 | |||||||
Research and development expenses |
17 | 11 | 9 | |||||||
General and administrative expenses |
21 | 13 | 11 | |||||||
Amortization of intangible assets |
1 | 1 | 1 | |||||||
Gain on disposal and sale and leaseback of equipment |
* | * | * | |||||||
| | | | | | | | | | | |
Total costs and operating expenses |
123 | % | 98 | % | 102 | % | ||||
| | | | | | | | | | | |
| | | | | | | | | | | |
| | | | | | | | | | | |
- *
- Less than 0.5% of revenues
Comparison of Fiscal 2014 and 2013
Revenues
| |
Year Ended September 30, |
2013 to 2014 | |||||||||||
|---|---|---|---|---|---|---|---|---|---|---|---|---|---|
| |
2014 | 2013 | $ Change | % Change | |||||||||
Revenues: |
|||||||||||||
Product revenues |
$ | 32,202 | $ | 38,704 | $ | (6,502 | ) | (17 | )% | ||||
Contract research and development revenues |
9,026 | 10,750 | (1,724 | ) | (16 | ) | |||||||
Other revenues |
1,212 | 816 | 396 | 49 | |||||||||
| | | | | | | | | | | | | | |
Total revenues |
$ | 42,440 | $ | 50,270 | $ | (7,830 | ) | (16 | )% | ||||
| | | | | | | | | | | | | | |
| | | | | | | | | | | | | | |
| | | | | | | | | | | | | | |
Product revenues decreased $6.5 million, or 17%, in fiscal 2014 compared to fiscal 2013 primarily as a result of a $5.7 million decrease in product revenues of Fentanyl TDS, as additional competitors entered the market in fiscal 2013, resulting in lower production volumes in fiscal 2014. This decrease was partially offset by $1.8 million in non-cash product revenues for Fentanyl TDS, which had previously been deferred since 2007. The recognition of this revenue is related to the expiration of a contractual liability, and will not have an impact on future revenues. Additionally, product revenues from Clonidine TDS decreased by $2.4 million, primarily as a result of a decline in profit sharing received from Teva, as market share declined in fiscal 2014 to levels similar to fiscal 2012. Overall, the decrease in product revenues reflects a decline in the volume of units produced and shipped rather than a reduction in our pricing.
Contract research and development revenues decreased $1.7 million, or 16%, in fiscal 2014 compared to fiscal 2013, primarily as a result of decreased reimbursements for pass-through costs, such as materials and supplies, from third-party vendors. The decrease was primarily the result of a $1.2 million decrease in revenues related to our motion sickness patch and a $3.3 million decrease in revenues related to AG200-15, due to the stage of development of these programs. These decreases were partially offset by a $1.4 million increase in revenues associated with two co-development
71
programs and a $1.2 million increase related to a new product being developed for an existing partner during fiscal 2014.
Cost of Product Revenues
| |
Year Ended September 30, |
2013 to 2014 | |||||||||||
|---|---|---|---|---|---|---|---|---|---|---|---|---|---|
| |
2014 | 2013 | $ Change | % Change | |||||||||
Cost of product revenues |
$ | 20,204 | $ | 24,828 | $ | (4,624 | ) | (19 | )% | ||||
Cost of product revenues decreased $4.6 million, or 19%, in fiscal 2014 compared to fiscal 2013, primarily as a result of a $2.2 million decrease in materials costs, a $1.1 million decrease in direct labor and a $1.3 million decrease in overhead costs. While product revenues decreased 17% from fiscal 2013 to fiscal 2014, cost of product revenues decreased 19%, reflecting the fact that fiscal 2014 product revenues included the recognition of deferred revenue from prior periods.
Cost of Contract Research and Development Revenues
| |
Year Ended September 30, |
2013 to 2014 | |||||||||||
|---|---|---|---|---|---|---|---|---|---|---|---|---|---|
| |
2014 | 2013 | $ Change | % Change | |||||||||
Cost of contract research and development revenues |
$ | 15,391 | $ | 11,856 | $ | 3,535 | 30 | % | |||||
Cost of contract research and development revenues increased $3.5 million, or 30%, in fiscal 2014 compared to fiscal 2013, primarily due to a $3.4 million increase in personnel costs and a $1.7 million increase in third-party development costs, partially offset by a $1.5 million decrease in materials, supplies and ancillary equipment costs. While contract research and development revenues decreased 16% from fiscal 2013 to fiscal 2014, cost of contract research and development revenues increased 30% over this same period. This increase is primarily associated with our two co-development programs, for which fiscal 2014 was the first full year of development, as well as the addition of several new programs in fiscal 2014, including several partner-funded feasibility programs.
Research and Development Expenses
| |
Year Ended September 30, |
2013 to 2014 | |||||||||||
|---|---|---|---|---|---|---|---|---|---|---|---|---|---|
| |
2013 | 2012 | $ Change | % Change | |||||||||
Research and development expenses |
$ | 7,365 | $ | 5,496 | $ | 1,869 | 34 | % | |||||
Research and development expenses increased $1.9 million, or 34%, in fiscal 2014 compared to fiscal 2013 primarily due to the continued increase in research and development activities related to our MicroCor technology of $1.0 million, along with $1.4 million of expenses associated with the new Alzheimer's and Parkinson's programs that we initiated in fiscal 2014. These increases were partially offset by a $0.4 million decrease in other development costs associated with new product feasibility programs in fiscal 2014 compared to fiscal 2013. These increases consisted of a $1.6 million increase in third-party development costs and a $0.3 million increase in personnel and overhead costs.
72
General and Administrative Expenses
| |
Year Ended September 30, |
2013 to 2014 | |||||||||||
|---|---|---|---|---|---|---|---|---|---|---|---|---|---|
| |
2014 | 2013 | $ Change | % Change | |||||||||
General and administrative expenses |
$ | 9,095 | $ | 6,525 | $ | 2,570 | 39 | % | |||||
General and administrative expenses increased $2.6 million, or 39%, in fiscal 2014 compared to fiscal 2013, primarily due to a $0.9 million increase in legal, professional, consulting and other outside costs, mostly associated with operating as a public company, a $0.6 million increase in stock-based compensation expense associated with performance-based stock option grants tied to completion of our IPO, a $0.3 million increase in incentive compensation expense, and a $0.5 million increase in salaries and benefits, as we began hiring additional personnel in preparation for becoming a public company.
Interest Expense
| |
Year Ended September 30, |
2013 to 2014 | |||||||||||
|---|---|---|---|---|---|---|---|---|---|---|---|---|---|
| |
2014 | 2013 | $ Change | % Change | |||||||||
Interest expense |
$ | 6,961 | $ | 7,705 | $ | (744 | ) | (10 | )% | ||||
Interest expense decreased $0.7 million, or 10%, in fiscal 2014 compared to fiscal 2013, primarily due to the conversion of the convertible notes and the subordinated note into common stock in connection with our IPO in April 2014, at which time interest no longer continued to accrue on these notes.
Change in Fair Value of Subordinated Note Embedded Derivative Liability
| |
Year Ended September 30, |
2013 to 2014 | |||||||||||
|---|---|---|---|---|---|---|---|---|---|---|---|---|---|
| |
2014 | 2013 | $ Change | % Change | |||||||||
Change in fair value of subordinated note embedded derivative liability |
$ | 7,367 | $ | (7,367 | ) | $ | 14,734 | nm | |||||
We recorded a change in fair value of subordinated note embedded derivative liability of $7.4 million in fiscal 2013 due to the increased probability of a qualifying transaction that would trigger payment of an additional amount equal to the outstanding principal under the subordinated note. In fiscal 2014, the subordinated note embedded derivative liability was determined to no longer have any value, as a result of the underlying notes converting into common stock in connection with our IPO. This resulted in a credit to change in fair value of subordinated note embedded derivative liability of $7.4 million in fiscal 2014.
Comparison of Fiscal 2013 and 2012
Revenues
| |
Year Ended September 30, |
2012 to 2013 | |||||||||||
|---|---|---|---|---|---|---|---|---|---|---|---|---|---|
| |
2013 | 2012 | $ Change | % Change | |||||||||
Revenues: |
|||||||||||||
Product revenues |
$ | 38,704 | $ | 35,716 | $ | 2,988 | 8 | % | |||||
Contract research and development revenues |
10,750 | 6,838 | 3,912 | 57 | |||||||||
Other revenues |
816 | 306 | 510 | 167 | |||||||||
| | | | | | | | | | | | | | |
Total revenues |
$ | 50,270 | $ | 42,860 | $ | 7,410 | 17 | % | |||||
| | | | | | | | | | | | | | |
| | | | | | | | | | | | | | |
| | | | | | | | | | | | | | |
73
Product revenues increased $3.0 million, or 8%, in fiscal 2013 compared to fiscal 2012, primarily as a result of a $2.8 million increase in product revenues of Crest Whitestrips as P&G continued to expand the customer base for this product, and a $2.7 million increase in product revenues of Clonidine TDS, primarily as a result of Teva's increased market share resulting from a major competitor's diminished ability to supply its product for seven months during fiscal 2013. These increases were partially offset by a $1.3 million decrease in product revenues from sales to one of our partners of a consumer product, with whom we terminated our relationship during fiscal 2013, and a $1.3 million decrease in product revenues from sales of Fentanyl TDS during fiscal 2013, primarily in the fourth fiscal quarter, as we began experiencing a weakening in demand.
Contract research and development revenues increased $3.9 million, or 57%, in fiscal 2013 compared to fiscal 2012, generally as a result of the increased number of products in development and increased reimbursement of pass-through costs from third-party vendors, such as materials and supplies. The increase was primarily the result of a $2.5 million increase in revenues related to our motion sickness patch, a $1.3 million increase in revenues related to AG200-15, and a $1.1 million increase in revenues related to Crest Whitestrips and other products under development. These increases were partially offset by a $0.5 million decrease in revenues from a partner-funded development program which was temporarily placed on hold during fiscal 2013. Our partner restarted the development of this product in the fourth quarter of fiscal 2013.
Cost of Product Revenues
| |
Year Ended September 30, |
2012 to 2013 | |||||||||||
|---|---|---|---|---|---|---|---|---|---|---|---|---|---|
| |
2013 | 2012 | $ Change | % Change | |||||||||
Cost of product revenues |
$ | 24,828 | $ | 24,360 | $ | 468 | 2 | % | |||||
Cost of product revenues increased $0.5 million, or 2%, in fiscal 2013 compared to fiscal 2012, primarily as a result of a $0.2 million increase in direct and indirect overhead costs, and a $0.2 million increase in materials costs associated with the increase in product revenues. While product revenues increased 8% from fiscal 2012 to fiscal 2013, cost of product revenues increased only 2%. This difference was primarily due to the increase in fiscal 2013 of product revenues from products with lower production costs, as well as those with a profit-sharing component, thereby resulting in a lower comparative increase in costs for the same period. In addition, as our unit volumes increased in fiscal 2013, we were able to better leverage our fixed production costs.
Cost of Contract Research and Development Revenues
| |
Year Ended September 30, |
2012 to 2013 | |||||||||||
|---|---|---|---|---|---|---|---|---|---|---|---|---|---|
| |
2013 | 2012 | $ Change | % Change | |||||||||
Cost of contract research and development revenues |
$ | 11,856 | $ | 10,244 | $ | 1,612 | 16 | % | |||||
Cost of contract research and development revenues increased $1.6 million, or 16%, in fiscal 2013 compared to fiscal 2012, primarily due to a $1.7 million increase in materials, supplies and ancillary equipment costs that were subsequently reimbursed by our partners. While contract research and development revenues increased 57% from fiscal 2012 to fiscal 2013, cost of contract research and development revenues increased only 16%.
Several of our MicroCor contract feasibility projects were completed in fiscal 2012 and early fiscal 2013, which resulted in a decrease of $1.6 million in the costs of these projects in fiscal 2013 compared
74
to fiscal 2012. In addition, the costs of our Teva motion sickness and P&G Whitestrips projects increased $1.9 million and $0.7 million, respectively, in fiscal 2013 compared to fiscal 2012.
Research and Development Expenses
| |
Year Ended September 30, |
2012 to 2013 | |||||||||||
|---|---|---|---|---|---|---|---|---|---|---|---|---|---|
| |
2013 | 2012 | $ Change | % Change | |||||||||
Research and development expenses |
$ | 5,496 | $ | 3,966 | $ | 1,530 | 39 | % | |||||
Research and development expenses increased $1.5 million, or 39%, in fiscal 2013 compared to fiscal 2012, primarily due to the continued expansion of research and development activities related to our MicroCor technology, which were $2.4 million and $5.3 million in fiscal 2012 and fiscal 2013, respectively. This increase was primarily due to a $1.1 million increase in personnel costs and a $0.8 million increase in overhead costs. These increases were partially offset by a $0.4 million decrease in third-party costs associated with specific projects.
General and Administrative Expenses
| |
Year Ended September 30, |
2012 to 2013 | |||||||||||
|---|---|---|---|---|---|---|---|---|---|---|---|---|---|
| |
2013 | 2012 | $ Change | % Change | |||||||||
General and administrative expenses |
$ | 6,525 | $ | 4,645 | $ | 1,880 | 40 | % | |||||
General and administrative expenses increased $1.9 million, or 40%, in fiscal 2013 compared to fiscal 2012, primarily due to a $1.9 million increase in salaries, benefits and bonuses as we began implementing an employee bonus plan and hiring additional personnel in preparation for being a public company, along with a $0.5 million increase in directors' fees, travel costs, and outside consulting and other services costs. These increases were offset by a decrease of $0.5 million in a product liability reserve associated with Fentanyl TDS.
Interest Expense
| |
Year Ended September 30, |
2012 to 2013 | |||||||||||
|---|---|---|---|---|---|---|---|---|---|---|---|---|---|
| |
2013 | 2012 | $ Change | % Change | |||||||||
Interest expense |
$ | 7,705 | $ | 5,247 | $ | 2,458 | 47 | % | |||||
Interest expense increased $2.5 million, or 47%, in fiscal 2013 compared to fiscal 2012, primarily due to increased borrowing under our term loan agreement with Capital Royalty. We drew down $29.0 million and $6.0 million under this agreement in August 2012 and December 2012, respectively.
Change in Fair Value of Subordinated Note Embedded Derivative Liability
| |
Year Ended September 30, |
2012 to 2013 | |||||||||||
|---|---|---|---|---|---|---|---|---|---|---|---|---|---|
| |
2013 | 2012 | $ Change | % Change | |||||||||
Change in fair value of subordinated note embedded derivative liability |
$ | (7,367 | ) | $ | — | $ | (7,367 | ) | nm | ||||
We recorded a change in fair value of subordinated note embedded derivative liability of $7.4 million in fiscal 2013 due to the increased probability of a qualifying transaction that would trigger payment of an additional amount equal to the outstanding principal under the subordinated note.
75
Liquidity and Capital Resources
With the exception of fiscal 2013, we have incurred losses from operations since fiscal 2006. For fiscal 2014, we incurred a net loss of $9.9 million and used $11.4 million of cash in operating activities. As of September 30, 2014, we had working capital of $37.4 million and stockholders' equity of $11.8 million. Our principal sources of liquidity as of September 30, 2014 were cash and cash equivalents totaling $36.4 million. We hold our cash and cash equivalents in a variety of interest-earning instruments, including investments backed by U.S. government agencies and money market accounts.
Historically, we have financed our operations primarily through the proceeds from the sale of common stock in our IPO, the private placements of convertible preferred stock, and various debt and capital lease financings. We have received from October 1, 2011 through September 30, 2014, net cash proceeds of (i) $48.5 million from our IPO in fiscal 2014, (ii) $42.0 million from the issuance of long term debt and (iii) $2.4 million from various capital lease obligations.
We believe that the net proceeds from our IPO and our existing cash and cash equivalents will be sufficient to fund our operations through at least the next 12 months. We have based these estimates, however, on assumptions that may prove to be wrong, and we could spend our available financial resources much faster than we currently expect. In the event that additional financing is required from outside sources, we may not be able to raise such financing on terms acceptable to us or at all. If we are unable to raise additional capital when required or on acceptable terms, we may be required to significantly delay, scale back or discontinue one or more of our product development programs or commercialization efforts or other aspects of our business plans, and our business, operating results and financial condition would be adversely affected.
Description of Certain Indebtedness
Our $35 million term loan agreement with Capital Royalty required interest to be paid quarterly at a simple annual rate of 15%, and all outstanding principal to be repaid in four equal quarterly payments beginning September 30, 2016 and ending on June 30, 2017. The agreement permitted us to defer cash payment of 3.5% on the outstanding principal from the first 11 quarterly interest payments by converting that portion of the interest otherwise due into additional notes (payment-in-kind, or PIK, notes). As of September 30, 2014, the principal amount outstanding under the term loan agreement, including all PIK notes, was $37.7 million. The amounts outstanding under the term loan agreement were collateralized by all of our assets and the agreement provided for a prepayment penalty if we chose to repay principal prior to maturity, or upon other specified events, including a change of control. The agreement provided for financial covenants for annual minimum revenues, beginning September 30, 2014 and quarterly minimum liquidity of $2.0 million, with which we were in compliance as of September 30, 2014 and September 30, 2013. We refer to the term loan agreement with Capital Royalty as our senior debt.
As more fully described in our Form 8-K filed on November 20, 2014, we amended the term loan agreement with Capital Royalty in November 2014, whereby, among other things, the principal amount of the term loan, not including the outstanding PIK notes, was increased to $45.0 million and the maturity was extended, resulting in the interest-only period continuing until June 30, 2018, at which time we must begin repaying outstanding principal in four equal quarterly installments.
Our bank line of credit expired on August 31, 2014 and was not renewed.
We also have several other credit facilities under which we have borrowed funds, including capital leases for equipment purchases, and notes payable with lessors for tenant improvements made to leased facilities. See Note 8 to our annual audited financial statements.
76
In connection with certain of our partner arrangements, our partners purchase equipment that we use in the production of their products. This reduces our need for financing and lowers the manufacturing cost of these products for these partners, but generally limits our ability to use this equipment for our own or other partners' products.
Cash Flows
The following table summarizes our cash flows for the periods indicated:
| |
Year Ended September 30, | |||||||||
|---|---|---|---|---|---|---|---|---|---|---|
| |
2014 | 2013 | 2012 | |||||||
Cash provided (used) by operating activities |
$ | (11,351 | ) | $ | (982 | ) | $ | 40 | ||
Cash used in investing activities |
(3,693 | ) | (7,939 | ) | (2,360 | ) | ||||
Cash provided (used) by financing activities |
37,858 | 10,257 | 13,992 | |||||||
Cash Flows from Operating Activities
Cash used by operating activities for fiscal 2014 was $11.4 million and was primarily driven by our net loss of $9.9 million adjusted for certain non-cash items, including $2.2 million for property and equipment depreciation, $0.5 million in amortization of intangible assets, $0.5 million in amortization of discount and issuance costs of long-term debt and capital leases, $1.6 million of stock-based compensation, $0.3 million in the change of fair value of the warranty liability, $0.8 million in non-cash interest expense related to debt converted to common stock, and $7.4 million due to the elimination of the subordinated debt embedded derivative liability upon conversion of the subordinated debt to common stock, partially offset by adjustments in our working capital accounts. The increase in cash associated with our net operating assets of $0.4 million was primarily due the overall decrease in the level of revenues in 2014, and the related impact on working capital, which resulted from a decrease in inventories of $1.9 million, an increase of $0.7 million in accounts payable and a $2.1 million increase in accrued expenses and other liabilities. Other changes in net operating assets included a $1.0 million decrease in accounts receivable, a $1.1 million decrease in the recall liability, and a $2.0 million decrease in deferred contract revenues, primarily related to the $1.8 million non-cash revenue recognized on expiration of a contractual liability, as more fully described above.
Cash used by operating activities for fiscal 2013 was $1.0 million and was primarily driven by our net loss adjusted for certain non-cash items, including $7.4 million related to the change in fair value of the subordinated debt embedded derivative, $1.9 million of property and equipment depreciation, $0.5 million in amortization of intangible assets, $0.5 million in amortization of the debt discount and issuance costs, and $0.3 million of stock-based compensation, partially offset by adjustments in our working capital accounts. The increase in cash associated with our net operating assets of $2.3 million was primarily due to a $1.7 million increase in non-cash interest associated with our convertible and subordinated notes, and a $1.3 million increase in accrued expenses and other liabilities that partially related to additional bonus expense accrued in 2013. These increases were partially offset by a $0.9 million decrease in accounts payable.
Cash provided by operating activities for fiscal 2012 was $40,000 and was primarily driven by our net loss of $5.4 million adjusted for certain non-cash items, including $2.0 million for property and equipment depreciation, $0.5 million in amortization of intangible assets, $1.0 million in amortization of the debt discount and issuance costs, and $3.0 million in non-cash consideration associated with the settlement of our liability to Actavis related to a product recall, partially offset by adjustments in our working capital accounts. The increase in cash associated with our net operating assets of $5.6 million was primarily due to a $0.9 million decrease in accounts receivable, a $3.2 million increase in accrued interest payable, and a $3.5 million increase in deferred contract revenues resulting from payments received from partners under development agreements, including $2.8 million from Agile in connection
77
with the build-out of the commercial manufacturing facility. These increases were partially offset by a $1.3 million decrease in accounts payable.
Cash Flows from Investing Activities
Cash used in investing activities for fiscal 2014 was $3.7 million, consisting primarily of capital expenditures of $3.2 million for equipment to support operations and expenditures of $0.6 million relating to acquisition of patents and licensing rights, offset by $0.1 million in cash received upon repayment of a related-party note receivable.
Cash used in investing activities for fiscal 2013 was $7.9 million, consisting primarily of capital expenditures of $7.2 million and expenditures of $0.7 million relating to acquisition of patents and licensing rights.
Cash used in investing activities for fiscal 2012 was $2.4 million, consisting primarily of capital expenditures of $1.9 million and expenditures of $0.5 million relating to acquisition of patents and licensing rights.
For fiscal 2015, we expect to invest approximately $2.8 million in capital equipment and leasehold improvements.
Cash Flows from Financing Activities
Cash provided by financing activities for fiscal 2014 was $37.9 million, consisting primarily of $48.5 million in net proceeds from the issuance of common stock in our IPO and $1.3 million of drawdowns from our bank line of credit. These increases were partially offset by $5.2 million used for the repurchase of redeemable common stock from our founders, repayment of $5.2 million on our bank line of credit, $1.1 million of principal payments on our capital lease obligations, and payments of $0.5 million on our long-term debt.
Cash provided by financing activities for fiscal 2013 was $10.3 million, consisting of $7.2 million in proceeds from borrowings, including $6.0 million drawn under our term loan agreement, a $2.3 million increase from proceeds under capital leases, and $5.8 million of drawdowns under our bank line of credit. These increases were partially offset by our repayment of $3.5 million under our bank line of credit, and payment of $1.4 million of principal under our long-term debt and capital lease obligations.
Cash provided by financing activities for fiscal 2012 was $14.0 million, consisting primarily of $36.5 million in net proceeds from long-term debt financings, including $29.0 million drawn under our term loan agreement, and $24.7 million of drawdowns from our bank line of credit. These increases were partially offset by our repayment of $26.3 million under our bank line of credit, repayment of $10.0 million of principal on our convertible notes and $9.3 million of principal on our long-term debt and capital lease obligations, as well as payment of $1.7 million for transaction costs related to our long-term debt.
78
Contractual Obligations and Other Commitments
The following table summarizes our contractual obligations as of September 30, 2014:
| |
Payments Due by Period | |||||||||||||||
|---|---|---|---|---|---|---|---|---|---|---|---|---|---|---|---|---|
Contractual Obligations:
|
Less Than 1 Year |
1 to 3 Years | 3 to 5 Years | More Than 5 Years |
Total | |||||||||||
Total debt obligations |
$ | 107 | $ | 37,735 | $ | 95 | $ | 325 | $ | 38,262 | ||||||
Interest on total debt obligations |
5,851 | 10,872 | 74 | 43 | 16,840 | |||||||||||
Operating lease obligations |
1,284 | 1,338 | 1,234 | 3,653 | 7,509 | |||||||||||
Capital lease obligations |
760 | 891 | — | — | 1,651 | |||||||||||
| | | | | | | | | | | | | | | | | |
Total contractual obligations |
$ | 8,002 | $ | 50,836 | $ | 1,403 | $ | 4,021 | $ | 64,262 | ||||||
| | | | | | | | | | | | | | | | | |
| | | | | | | | | | | | | | | | | |
| | | | | | | | | | | | | | | | | |
The table above excludes a recall liability of $3.7 million as of September 30, 2014 relating to a settlement reached with Actavis for Fentanyl TDS. See Note 14 to our annual audited financial statements.
The table also above excludes payment-in-kind notes related to interest otherwise due under the term loan agreement. See Note 8 to our annual audited financial statements.
As of September 30, 2014, we had outstanding commitments to acquire $0.5 million of capital equipment.
Off-Balance Sheet Arrangements
We have not entered into any off-balance sheet arrangements and do not have any holdings in variable interest entities.
Segment Information
Our chief operating decision maker is our chief executive officer. The chief executive officer reviews our operating results on an aggregate basis for purposes of allocating resources and evaluating financial performance. We have one business activity and there are no segment managers who are held accountable for operations or operating results for levels or components. Accordingly, we have a single reporting segment and operating unit structure.
All of our revenues are derived from entities located in the United States and all long-lived assets are located in the United States.
Critical Accounting Polices and Estimates
Our financial statements are prepared in accordance with generally accepted accounting principles in the United States, or GAAP. The preparation of these financial statements requires us to make estimates and assumptions that affect the reported amounts of assets, liabilities, revenues, costs and expenses, and related disclosures. We base our estimates on historical experience and on various other assumptions that we believe to be reasonable. In many instances, we could have reasonably used different accounting estimates, and in other instances changes in the accounting estimates are reasonably likely to occur from period to period. Actual results could differ significantly from our estimates. To the extent that there are material differences between these estimates and actual results, our future financial statement presentation, financial condition, results of operations and cash flows will be affected. We believe that the accounting policies discussed below are critical to understanding our historical and future performance, as these policies relate to the more significant areas involving our judgments and estimates.
79
Revenue Recognition
We generate revenues from agreements for the development and commercialization of our products. The terms of these agreements may include nonrefundable upfront payments, partial or complete reimbursement of research and development costs, milestone payments, product sales, profit sharing, and royalties. Where applicable, multiple element arrangements are analyzed to determine whether the deliverables can be separated or whether they must be accounted for as a single unit of accounting. This determination is generally based on whether any deliverable has stand-alone value to the counterparty. This analysis also establishes a selling price hierarchy for determining how to allocate arrangement consideration to identified units of accounting. The selling price used for each unit of accounting will be based on vendor-specific objective evidence, if available, third-party evidence if vendor-specific objective evidence is not available, or estimated selling price if neither vendor-specific nor third-party evidence is available.
We recognize revenues when the following criteria are met: persuasive evidence of a sales or service arrangement exists; delivery has occurred; the price is fixed or determinable; and collectability is reasonably assured. During fiscal 2014, 2013 and 2012 we recognized revenues from the sale of products, related royalties and profit sharing on our partners' sales of our products as well as, from contract research and development activities, and from other revenues.
Product revenues made up a majority of our total revenues during fiscal 2014, 2013 and 2012, comprising 76%, 77% and 83% of total revenues. Product revenues consist of product sales, royalties and profit sharing we receive from our marketing partners.
We generally recognize revenues from product sales as products are shipped and title and risk of loss passes to the marketing partner. We have royalty and profit sharing agreements pursuant to which we earn revenues based on the amount of product sold by our marketing partners, as well as on the amount of profits earned by our marketing partners' sales of such products. We generally recognize royalty and profit sharing revenues at the time our marketing partners report their product sales to us.
Typically, we have not granted licenses to partners at the beginning of our development arrangements and, thus, there are no delivered items separate from the research and development services provided. As such, upfront payments are recorded as deferred revenues in the balance sheet and are recognized as contract research and development revenues over the estimated period of performance that is consistent with the terms of the research and development obligations contained in the respective agreements.
We generally recognize revenues related to research and development funding received as the related services or activities are performed in accordance with the contract terms. To the extent that agreements specify services are to be performed on a cost-plus basis, revenues are recognized as services are rendered. Such work is generally billed on a monthly basis for time incurred at specified rates in the agreements. To the extent that agreements specify services to be performed on a fixed-price basis, revenues are recognized consistent with the pattern of the work performed. Generally, all of our agreements provide for reimbursement to us of our third-party expenses, and we bill for such reimbursable expenses as revenues as they are incurred.
We use the milestone method for recognizing revenues in agreements with contingent payments. Under the milestone method, a payment that is contingent upon the achievement of a substantive milestone is recognized in its entirety in the period in which the milestone is achieved.
80
Impairment of Long-Lived Assets
We assess the impairment of long-lived assets, such as property and equipment and intangible assets, subject to depreciation and amortization, when events or changes in circumstances indicate that their carrying amount may not be recoverable. Among the factors and circumstances we considered in determining recoverability are: (i) a significant adverse change in the extent to which, or manner in which, a long-lived asset is being used or in its physical condition; (ii) a significant adverse change in legal factors or in the business climate that could affect the value of a long-lived asset, including an adverse action or assessment by a regulator; (iii) an accumulation of costs significantly in excess of the amount originally expected; and (iv) current-period operating or cash flow loss combined with a history of operating or cash flow losses, or a projection or forecast that demonstrates continuing losses associated with the use of a long-lived asset. Recoverability of assets to be held and used is measured by a comparison of the carrying amount of an asset to the estimated undiscounted future cash flows expected to be generated by the asset. If the carrying amount of an asset exceeds its estimated future cash flows, an impairment charge is recognized in the amount by which the carrying amount of the asset exceeds the fair value of the asset. We did not record any impairment losses during fiscal 2014, 2013 or 2012.
Convertible Preferred Stock Warrants
We accounted for certain warrants to purchase shares of our convertible preferred stock as liabilities at fair value as we determined that some of these warrants were derivative instruments because they contain antidilution provisions that protected the holders from certain equity issuances at a price below the original issue price of the underlying security. We remeasured these warrants to fair value at each balance sheet date, and recognized any change in the fair value as a change in the warrant liability in our statements of operations and comprehensive loss. We estimated the fair value of these warrants at the respective balance sheet dates using the Option Pricing Model, or OPM, in fiscal 2012, and the Probability-Weighted Expected Return Model, or PWERM, in fiscal 2013 and 2014. We used a number of assumptions to estimate the fair value including the likelihood of various scenarios, the expected volatility and the fair value of the underlying stock under each scenario. These assumptions are inherently subjective, and the fair value of these warrants may have differed significantly had we used different assumptions. This liability was reclassified to equity in fiscal 2014 in connection with our IPO.
Subordinated Note Embedded Derivative Liability
During fiscal 2009, we issued a subordinated note in the aggregate principal amount of $13.0 million. This subordinated note contained a provision that provided for the payment of an additional payment equal to 100% of the principal amount of the note to the holder upon a sale of our company or substantially all of our assets. This provision was determined to be an embedded derivative requiring bifurcation and separate accounting. The embedded derivative liability was remeasured to fair value at each balance sheet date with the corresponding gain or loss from the adjustment recorded in the statements of operations and comprehensive loss.
The fair value of the subordinated note was measured with the PWERM valuation methodology. Under this methodology, the fair value of the note is driven by the cash flows calculated under various scenarios using the estimated probability and timing of each scenario that could result in the anticipated sale of our company or its significant assets prior to the note's maturity, which would trigger the payment of the additional amount equal to the outstanding principal of the subordinated note. At each balance sheet date from the date of issuance through September 30, 2012, the likelihood of a sale of our company or our significant assets that would trigger such a payment prior to the note's maturity was evaluated to be extremely low. As a result, the fair value of the embedded derivative was immaterial and we did not record a value through fiscal 2012. In fiscal 2013, several factors resulted in
81
significantly increased uncertainty regarding our business, including a significant delay in the planned 2013 launch of the AG200-15 contraceptive patch product. Primarily due to the resulting delay and uncertainty of the timing of the launch of this product, we determined that we would experience a significant reduction in our projected cash flows as well as a reduction in the probability that we would have adequate cash flow to finance the planned expansion of our operations and repay or refinance our debt without additional financing. Accordingly, the probability of transactions that would trigger the embedded derivative increased greatly in fiscal 2013. This increased probability caused the estimated fair value of the embedded derivative to increase to $7.4 million. This change in the estimated fair value of $7.4 million was, therefore, recorded to change in fair value of subordinated note embedded derivative in fiscal 2013. The scenarios and the estimated probability and timing used in calculating the fair value of the notes, in fiscal 2013, were as follows: (i) 25% to a scenario assuming our liquidation, or a liquidation scenario, (ii) 35% to a scenario assuming an initial public offering, or an IPO scenario, and (iii) 40% to a scenario assuming a sale of our company, or an M&A scenario.
As part of the recapitalization described in Note 8 to the audited financial statements for the year ended September 30, 2014, in December 2013, the subordinated note was modified to provide that in the event of a qualifying initial public offering or equity financing, the note would automatically convert into 3.4 million shares of common stock or the equivalent amount of preferred stock. As this represented a substantial modification of the debt, it was accounted for as an extinguishment. Accordingly, the book value of the debt prior to the conversion was removed from the financial statements and the fair value of the debt after the modification, including the value of the conversion feature, of $16.5 million was recorded. Accordingly, the difference between the book value of the debt prior to the modification and the fair value of the debt after modification was recorded as a $3.5 million reduction in additional paid in capital.
In connection with our IPO in fiscal 2014, this note was converted into common stock, causing the embedded derivative to no longer have any value, and was eliminated through a credit to earnings.
Stock-Based Compensation
Stock-based compensation expense is measured based on the grant-date fair value of the stock-based awards. We estimated the fair value of each employee stock option on the date of grant using the Black-Scholes option-pricing model. We recognize compensation costs for all employee stock-based compensation awards that are expected to vest over the requisite service period of the awards, which is generally the awards' vesting period. These amounts are reduced by an estimated forfeiture rate.
The Black-Scholes option-pricing model requires the use of assumptions, some of which are highly subjective and complex. The assumptions include:
- •
- Expected term. The expected term represents the period
that our stock-based awards are expected to be outstanding before exercise or cancellation. As our historical share option exercise experience did not provide a reasonable basis upon which to estimate
an expected term because of a lack of sufficient data points, we estimated the expected term by using the simplified method;
- •
- Risk-free interest rate. The risk-free interest rate is
based on the implied constant maturity yield available on U.S. Treasury issues with a maturity consistent with the expected term;
- •
- Expected volatility. Because we have limited information
on the volatility of its common stock due to a lack of significant trading history and limited historical data regarding the volatility of its common stock, the expected volatility used is based on
volatility of a group of comparable publicly traded companies. In evaluating comparability, we considered factors such as industry, stage of life cycle and size. We will continue to analyze the
historical stock price volatility and term assumptions as more historical data for our common stock becomes available.; and
- •
- Expected dividend yield. We do not anticipate declaring dividends in the foreseeable future.
82
We recorded stock-based compensation expense of $1.6 million, $0.3 million and $66,000 for fiscal 2014, 2013, and 2012. We expect to continue to grant stock options and other equity-based awards in the future and, to the extent that we do, our stock-based compensation expense recognized in future periods will likely increase. Stock-based compensation expenses are classified in the statement of operations and comprehensive loss based on the functional area to which the related recipients belong.
We expect to recognize total compensation expense of approximately $4.1 million for grants made prior to September 30, 2014, which is expected to be recognized during fiscal years 2015, 2016, 2017 and 2018. In future periods, our stock-based compensation expense is expected to increase as a result of our existing unrecognized stock-based compensation and as we issue additional stock-based awards to continue to attract and retain employees.
Income Taxes
We are subject to income taxes in the United States and in the states of California, Michigan and New Jersey, and we use estimates in determining our provision for income taxes. We determine our provision for income taxes under the liability method. Deferred tax assets and liabilities are recognized based on temporary differences between the financial reporting and income tax basis of assets and liabilities using statutory rates. This process requires us to project our current tax liability and estimate our deferred tax assets and liabilities, including net operating losses and tax credit carryforwards. In assessing the need for a valuation allowance, we considered our recent operating results, future taxable income projections and feasible tax planning strategies. We have provided a full valuation allowance against our net deferred tax assets at September 30, 2014 and 2013.
We account for uncertain tax positions recognized in the financial statements by prescribing a more-likely-than-not threshold for financial statement recognition and measurement of a tax position taken or expected to be taken in a tax return. We did not have any recorded liabilities for uncertain tax positions as of September 30, 2014 or 2013.
Newly Adopted Accounting Pronouncements
Under the JOBS Act, emerging growth companies can delay adopting new or revised accounting standards until such time as those standards apply to private companies. We have irrevocably elected not to avail ourselves of this exemption from new or revised accounting standards and, therefore, we will be subject to the same new or revised accounting standards as other public companies that are not "emerging growth companies."
In February 2013, the FASB issued guidance which addresses the presentation of amounts reclassified from accumulated other comprehensive income. This guidance does not change current financial reporting requirements. Instead, an entity is required to cross-reference to other required disclosures that provide additional detail about amounts reclassified out of accumulated other comprehensive income. In addition, the guidance requires an entity to present significant amounts reclassified out of accumulated other comprehensive income by line item of net income if the amount reclassified is required to be reclassified to net income in its entirety in the same reporting period. Adoption of this standard is required for periods beginning after December 15, 2012. This new guidance impacts how we report comprehensive income only, and we expect that it will have no effect on our results of operations, financial position or liquidity upon its required adoption on October 1, 2013.
In May 2014, the Financial Accounting Standards Board issued ASU No. 2014-09, "Revenue from Contracts with Customers", Topic 606. This ASU affects any entity that either enters into contracts with customers to transfer goods or services or enters into contracts for the transfer of nonfinancial assets, unless those contracts are within the scope of other standards. The guidance in this ASU supersedes the revenue recognition requirements in Topic 605, Revenue Recognition and most industry-specific
83
guidance. The core principle of the guidance is that an entity should recognize revenue to illustrate the transfer of promised goods or services to customers in an amount that reflects the consideration to which the entity expects to be entitled in exchange for those goods or services. The new guidance also includes a cohesive set of disclosure requirements that will provide users of financial statements with comprehensive information about the nature, amount, timing, and uncertainty of revenue and cash flows arising from a reporting organization's contracts with customers. This ASU is effective retrospectively for fiscal years, and interim periods within those years beginning after December 15, 2016 for public companies. We are evaluating the effect, if any, on our financial position and results of operations.
84
ITEM 7A. QUALITATIVE AND QUANTITATIVE DISCLOSURES ABOUT MARKET RISK
Quantitative and Qualitative Disclosures about Market Risk
We are exposed to certain market risks in the ordinary course of our business. These risks primarily include interest rate sensitivities as follows:
Interest Rate Risk
We had cash and cash equivalents of $36.4 million as of September 30, 2014. Our cash and cash equivalents are held in a variety of interest-earning instruments, including investments backed by U.S. government agencies and money market accounts. Such interest-earning instruments carry a degree of interest rate risk. To date, fluctuations in interest income have not been significant. We also had total outstanding debt of $38.3 million as of September 30, 2014, of which $0.1 million was due within 12 months. A hypothetical 10% change in interest rates during any of the periods presented would not have had a material impact on our financial statements.
The primary objective of our investment activities is to preserve principal while maximizing income without significantly increasing risk. We do not enter into investments for trading or speculative purposes and have not used any derivative financial instruments to manage our interest rate risk exposure. Due to the short-term nature of our investments, we have not been exposed to, nor do we anticipate being exposed to, material risks due to changes in interest rates.
85
ITEM 8. CONSOLIDATED FINANCIAL STATEMENTS AND SUPPLEMENTARY DATA
CORIUM INTERNATIONAL, INC.
INDEX TO FINANCIAL STATEMENTS
| |
|
|
|---|---|---|
Report of Independent Registered Public Accounting Firm |
||
Balance Sheets |
||
Statements of Operations and Comprehensive Loss |
||
Statements of Convertible Preferred Stock, Redeemable Common Stock and Stockholders' Equity (Deficit) |
||
Statements of Cash Flows |
||
Notes to the Financial Statements |
86
REPORT OF INDEPENDENT REGISTERED PUBLIC ACCOUNTING FIRM
To
the Board of Directors and Stockholders of
Corium International, Inc.:
We have audited the accompanying balance sheets of Corium International, Inc. (the "Company") as of September 30, 2014 and 2013, and the related statements of operations and comprehensive loss, convertible preferred stock, redeemable common stock and stockholders' equity (deficit), and cash flows for each of the three years in the period ended September 30, 2014. These financial statements are the responsibility of the Company's management. Our responsibility is to express an opinion on these financial statements based on our audits.
We conducted our audits in accordance with the standards of the Public Company Accounting Oversight Board (United States). Those standards require that we plan and perform the audit to obtain reasonable assurance about whether the financial statements are free of material misstatement. The Company is not required to have, nor were we engaged to perform, an audit of its internal control over financial reporting. Our audits included consideration of internal control over financial reporting as a basis for designing audit procedures that are appropriate in the circumstances, but not for the purpose of expressing an opinion on the effectiveness of the Company's internal control over financial reporting. Accordingly, we express no such opinion. An audit also includes examining, on a test basis, evidence supporting the amounts and disclosures in the financial statements, assessing the accounting principles used and significant estimates made by management, as well as evaluating the overall financial statement presentation. We believe that our audits provide a reasonable basis for our opinion.
In our opinion, such financial statements present fairly, in all material respects, the financial position of Corium International, Inc. as of September 30, 2014 and 2013, and the results of its operations and its cash flows for each of the three years in the period ended September 30, 2014, in conformity with accounting principles generally accepted in the United States of America.
/s/
DELOITTE & TOUCHE LLP
Grand Rapids, Michigan
December 15, 2014
87
CORIUM INTERNATIONAL, INC.
BALANCE SHEETS
(In thousands, except share and per share data)
| |
As of September 30, | ||||||
|---|---|---|---|---|---|---|---|
| |
2014 | 2013 | |||||
ASSETS |
|||||||
Current assets: |
|||||||
Cash and cash equivalents |
$ | 36,395 | $ | 13,581 | |||
Accounts receivable |
4,168 | 3,129 | |||||
Unbilled accounts receivable |
1,385 | 1,495 | |||||
Inventories, net |
2,592 | 4,508 | |||||
Prepaid expenses and other current assets |
1,292 | 1,038 | |||||
| | | | | | | | |
Total current assets |
45,832 | 23,751 | |||||
Property and equipment, net |
12,658 | 12,622 | |||||
Debt financing costs, net |
571 | 902 | |||||
Intangible assets, net |
6,683 | 6,647 | |||||
Notes receivable—related parties |
— | 100 | |||||
| | | | | | | | |
TOTAL ASSETS |
$ | 65,744 | $ | 44,022 | |||
| | | | | | | | |
| | | | | | | | |
| | | | | | | | |
LIABILITIES, CONVERTIBLE PREFERRED STOCK, REDEEMABLE COMMON STOCK AND STOCKHOLDERS' EQUITY (DEFICIT) |
|||||||
Current liabilities: |
|||||||
Accounts payable |
$ | 2,512 | $ | 2,748 | |||
Accrued expenses and other current liabilities |
4,008 | 3,374 | |||||
Bank line of credit |
— | 3,873 | |||||
Long-term debt, current portion |
107 | 457 | |||||
Capital lease obligations, current portion |
760 | 1,029 | |||||
Preferred stock warrant liability |
— | 560 | |||||
Recall liability, current portion |
774 | 1,004 | |||||
Deferred contract revenues, current portion |
301 | 2,112 | |||||
| | | | | | | | |
Total current liabilities |
8,462 | 15,157 | |||||
Long-term interest payable |
— | 11,590 | |||||
Long-term debt, net of current portion |
38,155 | 36,956 | |||||
Convertible notes |
— | 9,399 | |||||
Subordinated note |
— | 13,000 | |||||
Subordinated note embedded derivative liability |
— | 7,367 | |||||
Capital lease obligations, net of current portion |
891 | 1,652 | |||||
Recall liability, net of current portion |
2,936 | 3,828 | |||||
Deferred contract revenues, net of current portion |
3,500 | 3,688 | |||||
| | | | | | | | |
Total liabilities |
53,944 | 102,637 | |||||
| | | | | | | | |
Convertible preferred stock, par value of $0.001 per share, 5,000,000 and 65,716,300 shares authorized; 0 and 36,034,900 shares issued and outstanding as of September 30, 2014 and 2013, respectively |
— | 57,261 | |||||
Redeemable common stock, par value of $0.001 per share, 0 and 347,945 shares issued and outstanding as of September 30, 2014 and 2013 |
— | 3,224 | |||||
Stockholders' equity (deficit): |
|||||||
Common stock, par value of $0.001 per share, 150,000,000 and 115,000,000 shares authorized; 18,003,883 and 1,881,177 shares issued and outstanding as of September 30, 2014 and 2013, respectively |
18 | 2 | |||||
Additional paid-in capital |
114,117 | (26,679 | ) | ||||
Accumulated deficit |
(102,335 | ) | (92,423 | ) | |||
| | | | | | | | |
Total stockholders' equity (deficit) |
11,800 | (119,100 | ) | ||||
| | | | | | | | |
TOTAL LIABILITIES, CONVERTIBLE PREFERRED STOCK, REDEEMABLE COMMON STOCK AND STOCKHOLDERS' EQUITY (DEFICIT) |
$ | 65,744 | $ | 44,022 | |||
| | | | | | | | |
| | | | | | | | |
| | | | | | | | |
The accompanying notes are an integral part of these financial statements.
88
CORIUM INTERNATIONAL, INC.
STATEMENTS OF OPERATIONS AND COMPREHENSIVE LOSS
(In thousands, except share and per share data)
| |
Year Ended September 30, | |||||||||
|---|---|---|---|---|---|---|---|---|---|---|
| |
2014 | 2013 | 2012 | |||||||
Revenues: |
||||||||||
Product revenues |
$ | 32,202 | $ | 38,704 | $ | 35,716 | ||||
Contract research and development revenues |
9,026 | 10,750 | 6,838 | |||||||
Other revenues |
1,212 | 816 | 306 | |||||||
| | | | | | | | | | | |
Total revenues |
42,440 | 50,270 | 42,860 | |||||||
Costs and operating expenses: |
||||||||||
Cost of product revenues |
20,204 | 24,828 | 24,360 | |||||||
Cost of contract research and development revenues |
15,391 | 11,856 | 10,244 | |||||||
Research and development expenses |
7,365 | 5,496 | 3,966 | |||||||
General and administrative expenses |
9,095 | 6,525 | 4,645 | |||||||
Amortization of intangible assets |
547 | 541 | 512 | |||||||
Gain on disposal and sale and leaseback of equipment |
(112 | ) | (177 | ) | (57 | ) | ||||
| | | | | | | | | | | |
Total costs and operating expenses |
52,490 | 49,069 | 43,670 | |||||||
| | | | | | | | | | | |
Income (Loss) from operations |
(10,050 | ) | 1,201 | (810 | ) | |||||
Interest income |
7 | 9 | 4 | |||||||
Interest expense |
(6,961 | ) | (7,705 | ) | (5,247 | ) | ||||
Change in fair value of preferred stock warrant liability |
(274 | ) | (14 | ) | 21 | |||||
Change in fair value of subordinated note embedded derivative liability |
7,367 | (7,367 | ) | — | ||||||
Other income |
— | — | 582 | |||||||
| | | | | | | | | | | |
Loss before income taxes |
(9,911 | ) | (13,876 | ) | (5,450 | ) | ||||
Income tax benefit (expense) |
(1 | ) | (1 | ) | 7 | |||||
| | | | | | | | | | | |
Net loss and comprehensive loss |
$ | (9,912 | ) | $ | (13,877 | ) | $ | (5,443 | ) | |
| | | | | | | | | | | |
| | | | | | | | | | | |
| | | | | | | | | | | |
Net loss attributable to common stockholders, basic and diluted |
(9,912 | ) | (13,877 | ) | (5,443 | ) | ||||
| | | | | | | | | | | |
| | | | | | | | | | | |
| | | | | | | | | | | |
Net loss per share attributable to common stockholders, basic and diluted |
$ | (0.99 | ) | $ | (6.24 | ) | $ | (2.47 | ) | |
| | | | | | | | | | | |
| | | | | | | | | | | |
| | | | | | | | | | | |
Weighted average shares used in computing net loss per share attributable to common stockholders, basic and diluted |
10,043,640 | 2,222,981 | 2,200,727 | |||||||
| | | | | | | | | | | |
| | | | | | | | | | | |
| | | | | | | | | | | |
The accompanying notes are an integral part of these financial statements.
89
CORIUM INTERNATIONAL, INC.
STATEMENTS OF CONVERTIBLE PREFERRED STOCK, REDEEMABLE COMMON STOCK AND STOCKHOLDERS' EQUITY (DEFICIT)
(in thousands,
except share and per share data)
| |
Convertible Preferred Stock |
|
Redeemable Common Stock |
|
|
|
|
|
|
|||||||||||||||||||||||
|---|---|---|---|---|---|---|---|---|---|---|---|---|---|---|---|---|---|---|---|---|---|---|---|---|---|---|---|---|---|---|---|---|
| |
|
|
Common Stock | |
|
Total Stockholders' Equity (Deficit) |
||||||||||||||||||||||||||
| |
|
|
Additional Paid-in Capital |
Accumulated Deficit |
||||||||||||||||||||||||||||
| |
Shares | Amount |
|
Shares | Amount |
|
Shares | Amount | ||||||||||||||||||||||||
| |
|
|
||||||||||||||||||||||||||||||
Balance—September 30, 2011 |
36,034,900 | $ | 57,261 | 363,383 | $ | 3,367 | 1,793,189 | $ | 2 | $ | (27,990 | ) | $ | (73,103 | ) | $ | (101,091 | ) | ||||||||||||||
Repayment of founder note with common stock |
— | — | (15,438 | ) | (143 | ) | — | — | — | — | — | |||||||||||||||||||||
Issuance of common stock warrants in connection with debt |
— | — | — | — | — | — | 110 | — | 110 | |||||||||||||||||||||||
Issuance of common stock upon exercise of stock options |
— | — | — | — | 61,799 | — | 12 | — | 12 | |||||||||||||||||||||||
Stock based compensation expense |
— | — | — | — | — | — | 66 | — | 66 | |||||||||||||||||||||||
Net loss and comprehensive loss |
— | — | — | — | — | — | — | (5.443 | ) | (5,443 | ) | |||||||||||||||||||||
| | | | | | | | | | | | | | | | | | | | | | | | | | | | | | | | | |
Balance—September 30, 2012 |
36,034,900 | 57,261 | 347,945 | 3,224 | 1,854,988 | 2 | (27,802 | ) | (78,546 | ) | (106,346 | ) | ||||||||||||||||||||
Issuance of common stock warrants in connection with debt and capital lease financing |
— | — | — | — | — | — | 38 | — | 38 | |||||||||||||||||||||||
Issuance of common stock upon exercise of stock options |
— | — | — | — | 26,189 | — | 13 | — | 13 | |||||||||||||||||||||||
Stock-based compensation expense |
— | — | — | — | — | — | 330 | — | 330 | |||||||||||||||||||||||
Modification of warrants issued in connection with debt |
— | — | — | — | — | — | 742 | — | 742 | |||||||||||||||||||||||
Net loss and comprehensive loss |
— | — | — | — | — | — | — | (13,877 | ) | (13,877 | ) | |||||||||||||||||||||
| | | | | | | | | | | | | | | | | | | | | | | | | | | | | | | | | |
Balance—September 30, 2013 |
36,034,900 | 57,261 | 347,945 | 3,224 | 1,881,177 | 2 | (26,679 | ) | (92,423 | ) | (119,100 | ) | ||||||||||||||||||||
Decrease in equity associated with modification of subordinated debt |
— | — | — | — | — | — | (3,485 | ) | — | (3,485 | ) | |||||||||||||||||||||
Issuance of common stock in connection with initial public offering, net of issuance costs of $2.70 million |
— | — | — | — | 6,874,997 | 7 | 48,452 | — | 48,459 | |||||||||||||||||||||||
Conversion of convertible preferred stock to common stock in connection with initial public offering |
(36,034,900 | ) | (57,261 | ) | — | — | 3,567,807 | 4 | 57,257 | — | 57,261 | |||||||||||||||||||||
Issuance of common stock in connection with conversion of convertible debt |
— | — | — | — | 2,036,555 | 2 | 19,367 | — | 19,369 | |||||||||||||||||||||||
Issuance of common stock upon conversion of subordinated debt in connection with the recapitalization transaction |
— | — | — | — | 3,387,146 | 3 | 19,234 | — | 19,237 | |||||||||||||||||||||||
Issuance of common stock upon net exercise of preferred stock warrants and related extinguishment of preferred stock warrant liability |
— | — | — | — | 1,191 | — | 310 | — | 310 | |||||||||||||||||||||||
Issuance of common stock upon net exercise of common stock warrants |
— | — | — | — | 970,249 | 1 | (1 | ) | — | 0 | ||||||||||||||||||||||
Repurchase of redeemable common stock and common stock from founders in connection with initial public offering |
— | — | (347,945 | ) | (3,224 | ) | (729,864 | ) | (1 | ) | (2,001 | ) | — | (2,002 | ) | |||||||||||||||||
Issuance of common stock upon exercise of stock options |
— | — | — | — | 14,650 | — | 34 | — | 34 | |||||||||||||||||||||||
Stock-based compensation expense |
— | — | — | — | — | — | 1,629 | — | 1,629 | |||||||||||||||||||||||
Aggregate fractional shares cancelled in connection with reverse stock split |
— | — | — | — | (25 | ) | — | — | — | — | ||||||||||||||||||||||
Net loss and comprehensive loss |
— | — | — | — | — | — | — | (9,912 | ) | (9,912 | ) | |||||||||||||||||||||
| | | | | | | | | | | | | | | | | | | | | | | | | | | | | | | | | |
Balance—September 30, 2014 |
— | $ | — | — | $ | — | 18,003,883 | $ | 18 | $ | 114,117 | $ | (102,335 | ) | $ | 11,800 | ||||||||||||||||
| | | | | | | | | | | | | | | | | | | | | | | | | | | | | | | | | |
| | | | | | | | | | | | | | | | | | | | | | | | | | | | | | | | | |
| | | | | | | | | | | | | | | | | | | | | | | | | | | | | | | | | |
The accompanying notes are an integral part of these financial statements.
90
CORIUM INTERNATIONAL, INC.
STATEMENTS OF CASH FLOWS
(in thousands)
| |
Year Ended September 30, | |||||||||
|---|---|---|---|---|---|---|---|---|---|---|
| |
2014 | 2013 | 2012 | |||||||
CASH FLOWS FROM OPERATING ACTIVITIES: |
||||||||||
Net loss and comprehensive loss |
$ | (9,912 | ) | $ | (13,877 | ) | $ | (5,443 | ) | |
Adjustments to reconcile net loss to net cash used in operating activities: |
||||||||||
Depreciation and amortization of property and equipment |
2,230 | 1,892 | 1,973 | |||||||
Gain on disposal and sale and leaseback of equipment |
(112 | ) | (177 | ) | (57 | ) | ||||
Gain on settlement of recall liability |
— | — | (582 | ) | ||||||
Change in fair value of preferred stock warrant liability |
274 | 14 | (21 | ) | ||||||
Change in fair value of subordinated debt embedded derivative liability |
(7,367 | ) | 7,367 | — | ||||||
Amortization of premium on modification of subordinated note |
(292 | ) | — | — | ||||||
Amortization of intangible assets |
547 | 541 | 512 | |||||||
Noncash amortized issue costs on long-term debt and capital leases |
331 | 329 | 706 | |||||||
Noncash amortized discount on long-term debt and capital leases |
128 | 196 | 246 | |||||||
Write off of patent costs |
— | 82 | 101 | |||||||
Stock compensation expense |
1,629 | 330 | 66 | |||||||
Noncash reductions in product recall settlement |
— | — | (3,041 | ) | ||||||
Interest expense on convertible and subordinated notes converted to common stock |
823 | — | — | |||||||
Changes in operating assets and liabilities: |
||||||||||
Accounts receivable |
(1,039 | ) | (329 | ) | 889 | |||||
Unbilled accounts receivable |
110 | 672 | (18 | ) | ||||||
Inventories, net |
1,916 | (139 | ) | 82 | ||||||
Prepaid expenses and other current assets |
(255 | ) | (137 | ) | (563 | ) | ||||
Accounts payable |
700 | (878 | ) | (1,289 | ) | |||||
Accrued expenses and other liabilities |
2,058 | 1,329 | (176 | ) | ||||||
Deferred contract revenues |
(1,998 | ) | 321 | 3,465 | ||||||
Recall liability |
(1,122 | ) | (168 | ) | — | |||||
Long-term interest payable |
— | 1,650 | 3,190 | |||||||
| | | | | | | | | | | |
Net cash provided (used) by operating activities |
(11,351 | ) | (982 | ) | 40 | |||||
| | | | | | | | | | | |
CASH FLOWS FROM INVESTING ACTIVITIES: |
||||||||||
Purchases of property and equipment |
(3,221 | ) | (7,163 | ) | (1,859 | ) | ||||
Proceeds from sale of equipment |
12 | 17 | 15 | |||||||
Issuance of notes receivable—related parties |
— | (100 | ) | (49 | ) | |||||
Proceeds from repayment of notes receivable—related parties |
100 | — | — | |||||||
Payments for patents and licensing rights |
(584 | ) | (693 | ) | (467 | ) | ||||
| | | | | | | | | | | |
Net cash used by investing activities |
(3,693 | ) | (7,939 | ) | (2,360 | ) | ||||
| | | | | | | | | | | |
CASH FLOWS FROM FINANCING ACTIVITIES: |
||||||||||
Proceeds from issuance of common stock, net of issuance costs |
48,459 | — | — | |||||||
Repurchase of redeemable common stock from founders |
(5,225 | ) | — | — | ||||||
Proceeds from issuance of long-term debt |
— | 7,230 | 36,477 | |||||||
Proceeds from issuance of capital leases |
— | 2,266 | 84 | |||||||
Payments on convertible notes |
— | — | (10,000 | ) | ||||||
Payment of transaction costs associated with issuance of long-term debt and capital leases |
— | (112 | ) | (1,671 | ) | |||||
Principal payments on long-term debt |
(484 | ) | (812 | ) | (8,792 | ) | ||||
Principal payments on capital lease obligations |
(1,054 | ) | (629 | ) | (548 | ) | ||||
Borrowings on bank line of credit |
1,298 | 5,827 | 24,706 | |||||||
Payments on bank line of credit |
(5,170 | ) | (3,526 | ) | (26,276 | ) | ||||
Proceeds from exercise of stock options |
34 | 13 | 12 | |||||||
| | | | | | | | | | | |
Net cash provided by financing activities |
37,858 | 10,257 | 13,992 | |||||||
| | | | | | | | | | | |
NET INCREASE IN CASH AND CASH EQUIVALENTS |
22,814 | 1,336 | 11,672 | |||||||
CASH AND CASH EQUIVALENTS—Beginning of period |
13,581 | 12,245 | 573 | |||||||
| | | | | | | | | | | |
CASH AND CASH EQUIVALENTS—End of period |
$ | 36,395 | $ | 13,581 | $ | 12,245 | ||||
| | | | | | | | | | | |
| | | | | | | | | | | |
| | | | | | | | | | | |
SUPPLEMENTAL DISCLOSURES OF CASH FLOW INFORMATION: |
||||||||||
Cash paid for interest |
$ | 4,669 | $ | 4,856 | $ | 766 | ||||
| | | | | | | | | | | |
| | | | | | | | | | | |
| | | | | | | | | | | |
Cash paid for income taxes |
$ | 2 | $ | — | $ | — | ||||
| | | | | | | | | | | |
| | | | | | | | | | | |
| | | | | | | | | | | |
SUPPLEMENTAL DISCLOSURES OF NON-CASH INVESTING AND FINANCING ACTIVITIES: |
||||||||||
Issuance of common stock warrants in connection with debt financing and equipment lease financing |
$ | — | $ | 38 | $ | 110 | ||||
| | | | | | | | | | | |
| | | | | | | | | | | |
| | | | | | | | | | | |
Property and equipment purchases included in accounts payable and accrued liabilities |
$ | 198 | $ | 1,134 | $ | 806 | ||||
| | | | | | | | | | | |
| | | | | | | | | | | |
| | | | | | | | | | | |
Issuance of payment-in-kind notes in lieu of cash interest payments associated with long-term debt |
$ | 1,305 | $ | 1,235 | $ | 161 | ||||
| | | | | | | | | | | |
| | | | | | | | | | | |
| | | | | | | | | | | |
Reduction in notes receivable through redemption of common stock |
$ | — | $ | — | $ | 143 | ||||
| | | | | | | | | | | |
| | | | | | | | | | | |
| | | | | | | | | | | |
Unpaid deferred offering costs |
$ | — | $ | 20 | $ | — | ||||
| | | | | | | | | | | |
| | | | | | | | | | | |
| | | | | | | | | | | |
Decrease in equity due to premium associated with modification of subordinated debt |
$ | 3,485 | $ | — | $ | — | ||||
| | | | | | | | | | | |
| | | | | | | | | | | |
| | | | | | | | | | | |
Conversion of convertible preferred stock to common stock |
$ | 57,261 | $ | — | $ | — | ||||
| | | | | | | | | | | |
| | | | | | | | | | | |
| | | | | | | | | | | |
Issuance of common stock upon conversion of subordinated debt |
$ | 19,237 | $ | — | $ | — | ||||
| | | | | | | | | | | |
| | | | | | | | | | | |
| | | | | | | | | | | |
Issuance of common stock upon conversion of convertible debt |
$ | 19,369 | $ | — | $ | — | ||||
| | | | | | | | | | | |
| | | | | | | | | | | |
| | | | | | | | | | | |
Issuance of common stock upon net exercise of preferred stock warrants |
$ | 834 | $ | — | $ | — | ||||
| | | | | | | | | | | |
| | | | | | | | | | | |
| | | | | | | | | | | |
The accompanying notes are an integral part of these financial statements.
91
CORIUM INTERNATIONAL, INC.
Notes to the Financial Statements
As of and for the years ended September 30, 2014 and 2013
1. Organization, Description of Business, and Summary of Significant Accounting Policies
Organization
Corium International, Inc., a Delaware corporation (the "Company"), is a commercial stage biopharmaceutical company focused on the development, manufacture and commercialization of specialty pharmaceutical products that leverage its broad experience in transdermal and transmucosal delivery systems.
In the normal course of business, the Company enters into collaboration agreements with partners to develop and manufacture products based on the Company's drug delivery technologies. Revenues consist of net sales of products manufactured, royalties and profit-sharing payments based on sales of such products by partners, and fees for research and development activities under collaboration agreements with our partners. The Company is also engaged in the research and development of its own proprietary transdermal drug delivery products.
The Company's fiscal year ends on September 30. References to "fiscal" refer to the years ended September 30.
Basis of Presentation
The Company's financial statements have been prepared in conformity with accounting principles generally accepted in the United States of America.
Reverse Stock Split
On March 20, 2014, the Company effected a 1-for-10.1 reverse stock split of the Company's outstanding common stock resulting in a reduction of the Company's total common stock issued and outstanding from 19,032,056 shares to 1,884,362 shares. The reverse stock split affected all stockholders of the Company's common stock uniformly, and did not materially affect any stockholder's percentage of ownership interest. The par value of the Company's common stock remained unchanged at $0.001 per share and the number of authorized shares of common stock remained the same after the reverse stock split.
In connection with this reverse stock split, the number of shares of common stock reserved for issuance under the Company's equity incentive, stock option and employee stock purchase plans, as well as the shares of common stock underlying outstanding stock options, restricted stock units and warrants, were also proportionately reduced while the exercise prices of such stock options and warrants were proportionately increased. All references to shares of common stock and per share data for all periods presented in the accompanying financial statements and notes thereto have been adjusted to reflect the reverse stock split on a retroactive basis.
Initial Public Offering
On April 2, 2014, the Company's registration statements on Form S-1 (File No. 333-194279 and File No. 333-195002) relating to the Initial Public Offering (the "IPO") of its common stock were declared effective by the SEC. The IPO closed on April 8, 2014 at which time the Company sold 6,500,000 shares of its common stock at a price of $8.00 per share. The Company also granted the underwriters a 30-day option to purchase up to 975,000 additional shares of common stock at the IPO
92
CORIUM INTERNATIONAL, INC.
Notes to the Financial Statements (Continued)
As of and for the years ended September 30, 2014 and 2013
1. Organization, Description of Business, and Summary of Significant Accounting Policies (Continued)
price. The underwriters exercised this option to purchase 374,997 shares on May 2, 2014. The Company received cash proceeds of $48.5 million from the IPO, including proceeds from the partial exercise of the underwriters' option, net of underwriting discounts, commissions and issuance costs paid by the Company, which totaled $2.7 million.
On April 8, 2014, immediately prior to the closing of the IPO, all outstanding shares of convertible preferred stock converted into 3,567,807 shares of common stock, and the related carrying value of $57.3 million was reclassified to common stock and additional paid-in capital. In addition, certain warrants to purchase convertible preferred stock and common stock were also converted and net exercised into 971,440 shares of common stock. Upon the closing of the IPO, Corium also repurchased 1,077,809 shares of common stock from its founders, for an aggregate purchase price of $5.2 million.
Following the filing of the Restated Certificate of Incorporation of the Company on April 8, 2014, the number of shares of capital stock the Company is authorized to issue is 155,000,000 shares, of which 150,000,000 shares may be common stock and 5,000,000 shares may be preferred stock. Both the common stock and preferred stock have a par value of $0.001 per share.
Use of Estimates
Estimates and assumptions are required to be used by management in the preparation of financial statements in conformity with accounting principles generally accepted in the United States of America that affect the reported amounts of assets, liabilities, and disclosures of contingent assets and liabilities at the date of the financial statements and the reported amounts of operating revenues and operating expenses during the reporting period. Those estimates and assumptions affect revenue recognition and deferred revenues, impairment of long-lived assets, determination of fair value of stock-based awards and other debt and equity related instruments, and accounting for income taxes. As future events and their effects cannot be determined with precision, actual results could differ from those estimates.
Concentration of Credit Risk
Financial instruments that potentially subject the Company to concentrations of credit risk consist of cash and cash equivalents and accounts receivable. The Company maintains its cash and cash equivalents with a single domestic financial institution that is well capitalized. The Company provides credit, in the normal course of business, to its partners and performs credit evaluations of such partners.
Four partners accounted for 95%, 99% and 94% of the Company's revenues for fiscal 2014, 2013 and 2012. These same partners accounted for 95% and 100% of accounts receivable as of September 30, 2014 and 2013.
Revenue Recognition
The Company generates revenues from agreements for the development and commercialization of its products. The terms of the agreements may include nonrefundable upfront payments, partial or complete reimbursement of research and development costs, milestone payments, product sales, and profit sharing and royalties on product sales made by the partners. The Company recognizes revenues
93
CORIUM INTERNATIONAL, INC.
Notes to the Financial Statements (Continued)
As of and for the years ended September 30, 2014 and 2013
1. Organization, Description of Business, and Summary of Significant Accounting Policies (Continued)
when the following criteria are met: persuasive evidence of a sales or service arrangement exists; delivery has occurred; the price is fixed or determinable; and collectability is reasonably assured.
Revenue related to multiple element arrangements are analyzed to determine whether the deliverables can be separated or whether they must be accounted for as a single unit of accounting. This determination is generally based on whether any deliverable has stand-alone value to the partner. This analysis also establishes a selling price hierarchy for determining how to allocate arrangement consideration to identified units of accounting. The selling price used for each unit of accounting is based on vendor-specific objective evidence, if available, third-party evidence if vendor-specific objective evidence is not available, or estimated selling price if neither vendor-specific nor third-party evidence is available. Typically, the Company has not granted licenses to partners at the beginning of its arrangements and, thus, there are no delivered items separate from the research and development services provided. As such, upfront payments are recorded as deferred revenues in the balance sheet and are recognized as contract research and development revenues over the estimated period of performance that is consistent with the terms of the research and development obligations contained in the agreement. The Company periodically reviews the estimated period of performance based on the progress made under each arrangement.
Amounts related to research and development funding are generally recognized as the related services or activities are performed in accordance with the contract terms. To the extent that agreements specify services are to be performed on a cost-plus basis, revenues are recognized as services are rendered. Such work is generally billed on a monthly basis for time incurred at specified rates in the agreements. To the extent that agreements specify services to be performed on a fixed-price basis, revenues are recognized consistent with the pattern of the work performed. Generally, all of the agreements provide for reimbursement of third-party expenses, and such reimbursable expenses are billed as revenues as incurred.
The arrangements may include contractual milestones, which relate to the achievement of pre-specified research, development, regulatory and commercialization events. The milestone events contained in the Company's arrangements coincide with the progression of the Company's product candidates from research and development, to regulatory approval and through to commercialization. The process of successfully developing a new product, having it approved from a regulatory perspective and ultimately sold for a profit is highly uncertain. As such, the milestone payments that the Company may earn from its partners involve a significant degree of risk to achieve. Research and development milestones in the Company's strategic alliances may include the following types of events: completion of pre-clinical research and development work, completion of certain development events and initiation of clinical trials. Regulatory milestones may include the following types of events: filing of regulatory applications with the Food and Drug Administration and approval of the regulatory applications by the Food and Drug Administration. Commercialization milestones may include product launch. The Company recognizes milestone payments in the period in which the performance obligation underlying the milestone is achieved.
Upon commercialization, revenues are generated from product sales, royalties and profit sharing. Product sales are generally recognized as products are shipped and title and risk of loss pass to the partner. Royalties and profit sharing are generally recognized when the Company's partners sell the product to their customers and are based on a percentage of the Company's partners' net sales or net
94
CORIUM INTERNATIONAL, INC.
Notes to the Financial Statements (Continued)
As of and for the years ended September 30, 2014 and 2013
1. Organization, Description of Business, and Summary of Significant Accounting Policies (Continued)
profits for products subject to our agreements. Product sales and royalty income are presented collectively as product revenues. Royalties and profit sharing totaled $6.7 million, $7.8 million and $6.4 million for fiscal 2014, 2013 and 2012.
Other revenues consists of income derived from the Company's arrangements with its partners, whereby a portion of the revenues received under these agreements relates to rental income from embedded leases associated with manufacturing equipment and facilities specific to these relationships, as well as revenues associated with licenses granted to a third party for intellectual property related to a discontinued product.
Research and Development
Research and development expenses primarily comprise salaries and benefits associated with research and development personnel, overhead and facility costs, pre-clinical and non-clinical development costs, clinical trial, and related clinical manufacturing costs, contract services, and other outside costs. Research and development costs, including costs to be subsequently reimbursed under development contracts, are charged to expense when incurred.
Advertising Costs
The Company's advertising expenses were immaterial for fiscal 2014, 2013 and 2012.
Stock-Based Compensation
The Company accounts for stock-based compensation for all share-based awards made to employees and directors, including employee stock options and employee stock purchases related to the employee stock purchase plan, by measuring the cost of awards of equity instruments based on the grant-date fair value of the award. The Company determines the fair value of such awards using the Black-Scholes option-pricing model (the "Black-Scholes model"), which incorporates certain assumptions as follows:
Expected Term—The expected term represents the period that the stock-based awards are expected to be outstanding before exercise or cancellation. As the Company's historical share exercise experience did not provide a reasonable basis upon which to estimate expected term because of a lack of sufficient data points, the Company estimated the expected term by using the simplified method.
Risk-Free Interest Rate—The risk-free interest rate is based on the implied constant maturity yield currently available on U.S. Treasury issues with a maturity consistent with the expected term.
Expected Volatility—Because the Company has limited information on the volatility of its common stock due to a lack of significant trading history and limited historical data regarding the volatility of its common stock, the expected volatility used is based on volatility of a group of comparable publicly traded companies. In evaluating comparability, the Company considered factors such as industry, stage of life cycle and size. The Company will continue to analyze the historical stock price volatility and term assumptions as more historical data for the Company's common stock becomes available.
95
CORIUM INTERNATIONAL, INC.
Notes to the Financial Statements (Continued)
As of and for the years ended September 30, 2014 and 2013
1. Organization, Description of Business, and Summary of Significant Accounting Policies (Continued)
Expected Dividend—The Company does not anticipate declaring dividends in the foreseeable future.
The Company recognizes compensation expense for the portion of share-based awards that are expected to vest. Therefore, the Company applied estimated forfeiture rates that were derived from historical employee termination behavior. If the actual number of forfeitures differs from those estimated by management, additional adjustments to compensation expense may be required in future periods.
Income Taxes
The Company accounts for income taxes based on the liability method. Under the liability method, deferred tax assets and deferred tax liabilities are recognized for future tax consequences attributable to differences between the financial statement carrying amounts of existing assets and liabilities and their respective tax bases and operating loss and tax credit carryforwards. Deferred tax assets and deferred tax liabilities are measured using enacted tax rates expected to apply to taxable income in the years in which those temporary differences are expected to be recovered or settled. The effect on deferred tax assets and deferred tax liabilities of a change in tax rates is recognized in operations in the period that includes the enactment date. A valuation allowance is established when it is more likely than not that all or a portion of a deferred tax asset will not be realized.
Comprehensive Income (Loss)
During fiscal 2014, 2013 and 2012, the Company did not recognize any other comprehensive income (loss) and, therefore, the net income (loss) and comprehensive income (loss) was the same for all periods presented.
Net Loss per Share Attributable to Common Stockholders
The Company calculates its basic and diluted net loss per share attributable to common stockholders in conformity with the two-class method required for companies with participating securities. The Company's basic net loss per share attributable to common stockholders is calculated by dividing the net loss attributable to common stockholders by the weighted average number of shares of common stock outstanding for the period. The diluted net loss per share attributable to common stockholders is computed by giving effect to all potential dilutive common stock equivalents outstanding for the period. For purposes of the diluted calculation, convertible preferred stock, options to purchase common stock and common stock warrants are considered common stock equivalents but are excluded from the calculation of diluted net loss per share attributable to common stockholders if their effect is antidilutive.
Cash and Cash Equivalents
The Company considers all highly liquid investments with original maturities of three months or less at the date of purchase to be cash equivalents. The Company generally invests funds that are in excess of current needs in high-credit-quality instruments, such as obligations of U.S. government agencies and money market funds.
96
CORIUM INTERNATIONAL, INC.
Notes to the Financial Statements (Continued)
As of and for the years ended September 30, 2014 and 2013
1. Organization, Description of Business, and Summary of Significant Accounting Policies (Continued)
Accounts Receivable and Allowance for Doubtful Accounts
Accounts receivable are stated at invoiced amounts. An allowance for doubtful accounts is established as needed based on a specific assessment of all invoices that remain unpaid following normal partner payment periods. All amounts deemed to be uncollectible are charged against the allowance for doubtful accounts in the period that the determination is made. The allowance for doubtful accounts was $0 as of September 30, 2014 and 2013.
Inventories
Inventories are stated at the lower of cost, on a first-in, first-out basis, or market. The Company records an allowance for excess and obsolete inventory based on anticipated obsolescence, usage, and historical write-offs.
Property and Equipment
Property and equipment are recorded at cost, net of accumulated depreciation and amortization. Equipment is depreciated over its useful life, ranging from 3 to 8 years using the straight-line method. Leasehold improvements are depreciated or amortized over the shorter of the lease term or their useful lives ranging from 3 to 15 years using the straight-line method. Expenditures for maintenance and repairs are charged to expense as incurred.
Capital Leases
The Company leases several pieces of equipment under capital lease arrangements. During the year ended September 30, 2011, the Company completed two transactions, whereby existing manufacturing equipment was sold to and leased back from the lessor. Under these transactions, a gain on the sale was deferred and is being amortized over the life of the lease. Equipment leased under capital leases is amortized over the life of the lease term using the straight-line method.
Intangible Assets
Intangible assets consist primarily of the cost of acquired patents and legal costs associated with patent development and contract acquisition costs. These costs are capitalized and amortized on a straight-line basis over the lesser of the estimated economic lives of the patents or the underlying contracts and the remaining legal lives of the patents, which approximates the consumption over the estimated useful lives of the assets, once a patent is granted. The Company periodically reevaluates the original assumptions and rationale utilized in the establishment of the carrying value and estimated lives of these assets.
Impairment of Long-Lived Assets
Long-lived assets to be held and used are reviewed for impairment whenever events or changes in circumstances indicate that the carrying amount of such assets may not be recoverable. Determination of recoverability is based on an estimate of undiscounted future cash flows resulting from the use of the assets and their eventual disposition. Measurement of an impairment loss for long-lived assets that
97
CORIUM INTERNATIONAL, INC.
Notes to the Financial Statements (Continued)
As of and for the years ended September 30, 2014 and 2013
1. Organization, Description of Business, and Summary of Significant Accounting Policies (Continued)
management expects to hold and use is based on the fair value of the asset. No impairment was recorded for fiscal 2014, 2013 or 2012.
Fair Value of Financial Instruments
Fair value accounting is applied for all financial assets and liabilities and non-financial assets and liabilities that are recognized or disclosed at fair value in the financial statements on a recurring basis (at least annually). Assets and liabilities recorded at fair value in the financial statements are categorized based upon the level of judgment associated with the inputs used to measure their fair value. Hierarchical levels, which are directly related to the amount of subjectivity associated with the inputs to the valuation of these assets or liabilities, are as follows:
Level I—Inputs that are unadjusted, quoted prices in active markets for identical assets or liabilities at the measurement date.
Level II—Inputs (other than quoted prices included in Level I) that are either directly or indirectly observable for the asset or liability through correlation with market data at the measurement date and for the duration of the instrument's anticipated life.
Level III—Unobservable inputs that are supported by little or no market activity, but are significant to the fair value of the assets or liabilities. They reflect management's best estimate of what market participants would use in pricing the asset or liability at the measurement date. Consideration is given to the risk inherent in the valuation technique and the risk inherent in the inputs to the model.
Convertible Preferred Stock Warrants
Prior to their conversion into common stock on April 8, 2014 in connection with the Company's IPO, the Company accounted for certain warrants to purchase shares of convertible preferred stock as liabilities at fair value, as it had determined that some of these warrants were derivative instruments because they contained antidilution provisions that protected the holders from certain equity issuances at a price below the original issue price of the underlying security. The Company remeasured these warrants to fair value at each balance sheet date, and recognized any change in the fair value as a change in the warrant liability in its statements of operations and comprehensive loss. The Company estimated the fair value of these warrants at the respective balance sheet dates using the Option Pricing Model, or OPM, in fiscal 2012 and the Probability-Weighted Expected Return Model, or PWERM, thereafter. The Company used a number of assumptions to estimate the fair value, including the likelihood of various scenarios, the expected volatility, and the fair value of the underlying stock under each scenario.
Subordinated Note Embedded Derivative Liability
Prior to its conversion into common stock on April 8, 2014 in connection with the Company's IPO, the Company had an outstanding subordinated note that the Company had determined contained an embedded derivative instrument related to redemption and conversion features of the note. These features required bifurcation and separate accounting, and were accounted for as a liability. The embedded derivative liability was remeasured to fair value at each balance sheet date, with the
98
CORIUM INTERNATIONAL, INC.
Notes to the Financial Statements (Continued)
As of and for the years ended September 30, 2014 and 2013
1. Organization, Description of Business, and Summary of Significant Accounting Policies (Continued)
corresponding gain or loss from the adjustment recorded in the statements of operations and comprehensive loss. The fair value of the embedded derivative was measured with the PWERM valuation methodology. Under this methodology, fair value is primarily driven by the assessment of the probability and timing of scenarios that could result in the redemption of the note prior to the note's maturity, which would trigger the payment of the additional amount equal to the outstanding principal of the subordinated note.
Recent Account Pronouncements
In February 2013, the FASB issued guidance which addresses the presentation of amounts reclassified from accumulated other comprehensive income. This guidance does not change current financial reporting requirements. Instead, an entity is required to cross-reference to other required disclosures that provide additional detail about amounts reclassified out of accumulated other comprehensive income. In addition, the guidance requires an entity to present significant amounts reclassified out of accumulated other comprehensive income by line item of net income if the amount reclassified is required to be reclassified to net income in its entirety in the same reporting period. Adoption of this standard is required for periods beginning after December 15, 2013. This new guidance impacts how the Company reports comprehensive income only, and had no effect on the Company's results of operations, financial position or liquidity during fiscal 2014 and 2013.
In May 2014, the Financial Accounting Standards Board issued ASU No. 2014-09, "Revenue from Contracts with Customers", Topic 606. This ASU affects any entity that either enters into contracts with customers to transfer goods or services or enters into contracts for the transfer of nonfinancial assets, unless those contracts are within the scope of other standards. The guidance in this ASU supersedes the revenue recognition requirements in Topic 605, Revenue Recognition and most industry-specific guidance. The core principle of the guidance is that an entity should recognize revenue to illustrate the transfer of promised goods or services to customers in an amount that reflects the consideration to which the entity expects to be entitled in exchange for those goods or services. The new guidance also includes a set of disclosure requirements that will provide users of financial statements with comprehensive information about the nature, amount, timing, and uncertainty of revenue and cash flows arising from a reporting organization's contracts with customers. This ASU is effective retrospectively for fiscal years, and interim periods within those years, beginning after December 15, 2016 for public companies. The Company is evaluating the effect, if any, on the Company's financial position and results of operations.
2. Fair Value Measurements
Financial assets and liabilities are recorded at fair value. Except as noted below, the carrying values of the Company's financial instruments, including cash equivalents, accounts receivable, and accounts payable, approximated their fair values due to the short period of time to maturity or repayment.
99
CORIUM INTERNATIONAL, INC.
Notes to the Financial Statements (Continued)
As of and for the years ended September 30, 2014 and 2013
2. Fair Value Measurements (Continued)
The Company's financial instruments that are measured at fair value on a recurring basis as of September 30, 2014 and 2013, by level within the fair value hierarchy, are as follows (in thousands):
| |
As of September 30, 2014 | ||||||||||||
|---|---|---|---|---|---|---|---|---|---|---|---|---|---|
| |
Level I | Level II | Level III | Total | |||||||||
Financial Assets: |
|||||||||||||
Money market funds |
$ | 36,019 | $ | — | $ | — | $ | 36,019 | |||||
| | | | | | | | | | | | | | |
Total financial assets |
$ | 36,019 | $ | — | $ | — | $ | 36,019 | |||||
| | | | | | | | | | | | | | |
| | | | | | | | | | | | | | |
| | | | | | | | | | | | | | |
| |
As of September 30, 2013 | ||||||||||||
|---|---|---|---|---|---|---|---|---|---|---|---|---|---|
| |
Level I | Level II | Level III | Total | |||||||||
Financial Assets: |
|||||||||||||
Money market funds |
$ | 13,342 | $ | — | $ | — | $ | 13,342 | |||||
| | | | | | | | | | | | | | |
Total financial assets |
$ | 13,342 | $ | — | $ | — | $ | 13,342 | |||||
| | | | | | | | | | | | | | |
| | | | | | | | | | | | | | |
| | | | | | | | | | | | | | |
Financial Liabilities: |
|||||||||||||
Preferred stock warrant liability |
$ | — | $ | — | $ | 560 | $ | 560 | |||||
Subordinated note embedded derivative liability |
— | — | 7,367 | 7,367 | |||||||||
| | | | | | | | | | | | | | |
Total financial liabilities |
$ | — | $ | — | $ | 7,927 | $ | 7,927 | |||||
| | | | | | | | | | | | | | |
| | | | | | | | | | | | | | |
| | | | | | | | | | | | | | |
The Company's Level III liabilities consist of a preferred stock warrant liability (see Note 11) and subordinated note embedded derivative liability (Note 8). The following table sets forth a summary of the changes in the fair value of the Company's Level III financial liabilities, which are measured on a recurring basis (in thousands):
| |
Year Ended September 30, |
||||||
|---|---|---|---|---|---|---|---|
| |
2014 | 2013 | |||||
Beginning balance |
$ | 7,927 | $ | 546 | |||
Change in fair value of preferred stock warrants |
274 | 14 | |||||
Change in fair value of subordinated note embedded derivative liability |
(7,367 | ) | 7,367 | ||||
Extinguishment of preferred stock warrant liability |
(834 | ) | — | ||||
| | | | | | | | |
Ending balance |
$ | — | $ | 7,927 | |||
| | | | | | | | |
| | | | | | | | |
| | | | | | | | |
100
CORIUM INTERNATIONAL, INC.
Notes to the Financial Statements (Continued)
As of and for the years ended September 30, 2014 and 2013
2. Fair Value Measurements (Continued)
The following financial instruments have carrying values which differ from their fair value as estimated by the Company based on market quotes for instruments with similar terms and remaining maturities (Level III valuation technique) (in thousands):
| |
As of September 30, 2014 | |||||||||
|---|---|---|---|---|---|---|---|---|---|---|
| |
Carrying Value |
Fair Value | Difference | |||||||
Long-term debt |
$ | 38,262 | $ | 40,357 | $ | 2,095 | ||||
| | | | | | | | | | | |
Total |
$ | 38,262 | $ | 40,357 | $ | 2,095 | ||||
| | | | | | | | | | | |
| | | | | | | | | | | |
| | | | | | | | | | | |
| |
As of September 30, 2013 | |||||||||
|---|---|---|---|---|---|---|---|---|---|---|
| |
Carrying Value |
Fair Value | Difference | |||||||
Long-term debt |
$ | 37,413 | $ | 37,413 | $ | — | ||||
Convertible notes |
9,399 | 14,316 | 4,917 | |||||||
Subordinated note |
13,000 | 9,508 | (3,492 | ) | ||||||
| | | | | | | | | | | |
Total |
$ | 59,812 | $ | 61,237 | $ | 1,425 | ||||
| | | | | | | | | | | |
| | | | | | | | | | | |
| | | | | | | | | | | |
3. Inventories
Inventories consist of the following (in thousands):
| |
As of September 30, |
||||||
|---|---|---|---|---|---|---|---|
| |
2014 | 2013 | |||||
Raw materials |
$ | 1,268 | $ | 2,410 | |||
Work in process |
898 | 1,546 | |||||
Finished goods |
632 | 667 | |||||
| | | | | | | | |
Total inventories, cost |
2,798 | 4,623 | |||||
Less inventory reserves |
(206 | ) | (115 | ) | |||
| | | | | | | | |
Total inventories, net |
$ | 2,592 | $ | 4,508 | |||
| | | | | | | | |
| | | | | | | | |
| | | | | | | | |
101
CORIUM INTERNATIONAL, INC.
Notes to the Financial Statements (Continued)
As of and for the years ended September 30, 2014 and 2013
4. Property and equipment
Property and equipment consist of the following (in thousands):
| |
As of September 30, | ||||||
|---|---|---|---|---|---|---|---|
| |
2014 | 2013 | |||||
Machinery and equipment |
$ | 12,242 | $ | 11,145 | |||
Manufacturing equipment acquired under capital leases |
2,341 | 1,825 | |||||
Transportation equipment |
25 | 25 | |||||
Furniture and fixtures |
995 | 928 | |||||
Computer equipment and software |
535 | 401 | |||||
Leasehold improvements |
3,658 | 3,145 | |||||
Land |
210 | 210 | |||||
Construction in progress |
6,849 | 8,843 | |||||
| | | | | | | | |
Total property and equipment, gross |
26,855 | 26,522 | |||||
Accumulated depreciation and amortization |
(14,197 | ) | (13,900 | ) | |||
| | | | | | | | |
Total property and equipment, net |
$ | 12,658 | $ | 12,622 | |||
| | | | | | | | |
| | | | | | | | |
| | | | | | | | |
The Company recorded depreciation and amortization of property and equipment of $2.2 million, $1.9 million and $2.0 million during fiscal 2014, 2013 and 2012.
5. Intangible Assets
Intangible assets and related accumulated amortization consist of the following (in thousands):
| |
As of September 30, | ||||||
|---|---|---|---|---|---|---|---|
| |
2014 | 2013 | |||||
Cost: |
|||||||
Patents and trademarks |
$ | 10,269 | $ | 9,686 | |||
Contract acquisition costs |
1,672 | 1,677 | |||||
| | | | | | | | |
Total carrying value |
11,941 | 11,363 | |||||
Accumulated amortization: |
|||||||
Patents and trademarks |
(3,756 | ) | (3,237 | ) | |||
Contract acquisition costs |
(1,502 | ) | (1,479 | ) | |||
| | | | | | | | |
Total accumulated amortization |
(5,258 | ) | (4,716 | ) | |||
| | | | | | | | |
Total intangible assets, net |
$ | 6,683 | $ | 6,647 | |||
| | | | | | | | |
| | | | | | | | |
| | | | | | | | |
The Company amortizes its intangible assets related to issued patents over the estimated useful lives of the patents, ranging from 7 to 20 years. Amortization of issued patents, excluding impairments or abandonments, was $0.5 million, $0.5 million and $0.4 million in fiscal 2014, 2013 and 2012.
102
CORIUM INTERNATIONAL, INC.
Notes to the Financial Statements (Continued)
As of and for the years ended September 30, 2014 and 2013
5. Intangible Assets (Continued)
The estimated remaining annual amortization expenses for issued patents and trademarks as of September 30, 2014 are as follows (in thousands):
Year Ending September 30:
|
Amounts | |||
|---|---|---|---|---|
2015 |
$ | 584 | ||
2016 |
584 | |||
2017 |
584 | |||
2018 |
584 | |||
2019 |
584 | |||
Thereafter |
1,480 | |||
| | | | | |
Total |
$ | 4,400 | ||
| | | | | |
| | | | | |
| | | | | |
Patents in process included in intangible assets were $2.1 million and $2.5 million during fiscal 2014 and 2013.
The Company amortizes its intangible assets related to contract acquisition costs over their estimated useful lives, ranging from 4 to 15 years. Amortization of contract acquisition costs was $29,000, $65,000 and $66,000 in fiscal 2014, 2013 and 2012.
The estimated remaining annual amortization expense for contract acquisition cost as of September 30, 2014 are as follows (in thousands):
Year Ending September 30:
|
Amounts | |||
|---|---|---|---|---|
2015 |
$ | 29 | ||
2016 |
29 | |||
2017 |
29 | |||
2018 |
29 | |||
2019 |
29 | |||
Thereafter |
25 | |||
| | | | | |
Total |
$ | 170 | ||
| | | | | |
| | | | | |
| | | | | |
6. Notes Receivable—Related Parties
Notes receivable as of September 30, 2013, consisted of an unsecured note payable by one of the executive officers of the Company. The note called for payment of one-half of the principal and accrued interest on December 28, 2015 and the remaining principal and interest on June 28, 2018. The note accrued interest at 1% below the prime rate, adjusted as of January 1 each year (an effective rate of 2.25% at September 30, 2013). The Company recognized less than $1,000 of related party interest income from this note in fiscal 2014 and 2013. The note was repaid in full in March 2014.
103
CORIUM INTERNATIONAL, INC.
Notes to the Financial Statements (Continued)
As of and for the years ended September 30, 2014 and 2013
7. Accrued Expenses and Other Current Liabilities
Accrued expenses and other current liabilities consist of the following (in thousands):
| |
September 30, | ||||||
|---|---|---|---|---|---|---|---|
| |
2014 | 2013 | |||||
Vacation |
$ | 1,747 | $ | 1,680 | |||
Bonus |
1,235 | 900 | |||||
Warranty liability |
284 | — | |||||
Employee stock purchase plan liability |
305 | — | |||||
Legal and professional fees |
5 | 339 | |||||
Other |
432 | 455 | |||||
| | | | | | | | |
Total accrued liabilities |
$ | 4,008 | $ | 3,374 | |||
| | | | | | | | |
| | | | | | | | |
| | | | | | | | |
8. Debt
The Company's outstanding debt was as follows (in thousands):
| |
As of September 30, | ||||||
|---|---|---|---|---|---|---|---|
| |
2014 | 2013 | |||||
Bank line of credit |
$ | — | $ | 3,873 | |||
Long-term debt |
38,262 | 37,413 | |||||
Convertible notes |
— | 9,399 | |||||
Subordinated note |
— | 13,000 | |||||
| | | | | | | | |
Total |
38,262 | 63,685 | |||||
Less current portion, consisting of bank line of credit and long-term debt |
107 | 4,330 | |||||
| | | | | | | | |
Long-term portion |
$ | 38,155 | $ | 59,355 | |||
| | | | | | | | |
| | | | | | | | |
| | | | | | | | |
Bank Line of Credit
The bank line of credit was established with the Company's commercial bank on August 31, 2012. The line of credit provided for borrowings up to $6.0 million, was collateralized by a first security interest in cash, accounts receivable, and inventory, as well as a second security interest in all other assets of the Company. The line of credit expired on August 31, 2014 and has not been renewed. Advances under the line of credit were based on 80% of eligible accounts receivable. The line of credit beared interest at 0.25%, plus the bank's prime rate (an effective rate of 4.25% as of September 30, 2013), and provided for a minimum monthly interest charge of $5,000. The line of credit contained a minimum monthly liquidity covenant of $2.0 million of net cash on deposit with the commercial bank. The Company was continuously in compliance with this covenant from August 31, 2012 through the expiration date, August 31, 2014.
104
CORIUM INTERNATIONAL, INC.
Notes to the Financial Statements (Continued)
As of and for the years ended September 30, 2014 and 2013
8. Debt (Continued)
Long-term Debt
Long-term debt was as follows (in thousands):
| |
As of September 30, | ||||||
|---|---|---|---|---|---|---|---|
| |
2014 | 2013 | |||||
Term loan agreement expiring June 30, 2017. See terms of the agreement below. |
|||||||
Less discount of $76 and $103 as of September 30, 2014 and 2013 |
$ | 37,625 | $ | 36,293 | |||
Notes payable to lessor for tenant improvements. The note calls for monthly payments of principal and interest of $3 at an interest rate of 7% and is due April 2015 |
96 | 124 | |||||
Notes payable to lessor for tenant improvements. The note calls for monthly payments of principal and interest of $6 at an interest rate of 7% and is due November 2024 |
541 | 575 | |||||
Notes payable to finance Company insurance premiums. The note calls for monthly payments of principal and interest of $71 at an interest rate of 2.192% and was due March 2014 |
— | 421 | |||||
| | | | | | | | |
Total |
38,262 | 37,413 | |||||
Less current portion |
107 | 457 | |||||
| | | | | | | | |
Long-term portion |
$ | 38,155 | $ | 36,956 | |||
| | | | | | | | |
| | | | | | | | |
| | | | | | | | |
On July 13, 2012, the Company completed a $35.0 million term loan agreement with a financial investment fund. In August 2012 and December 2012, the Company drew down $29.0 million and $6.0 million under this agreement. The agreement required interest to be paid quarterly at a simple annual rate of 15%, and all outstanding principal be repaid in four equal quarterly payments beginning September 30, 2016. The agreement also contained a provision whereby the Company could choose to defer cash payment of 3.5% on the original outstanding principal for the first 11 quarterly interest payments by converting that portion of the interest otherwise due into additional notes under the agreement. As of September 30, 2014 and 2013, the Company had converted $2.7 million and $1.4 million of interest into additional notes (payment-in-kind notes). Amounts outstanding under the term loan agreement are collateralized by all of the Company's assets. The agreement contained a 1% fee on all draws and provided for a prepayment penalty on the outstanding principal if the Company chose to repay principal prior to maturity, or upon other specified events, including a change of control. The term loan agreement provided for financial covenants for minimum revenues and minimum liquidity, which the Company was in compliance with as of September 30, 2014 and 2013.
This term loan agreement was amended and restated in November 2014 (see Note 21).
105
CORIUM INTERNATIONAL, INC.
Notes to the Financial Statements (Continued)
As of and for the years ended September 30, 2014 and 2013
8. Debt (Continued)
Minimum principal payments on the Company's outstanding long-term debt, as of September 30, 2014 were as follows (in thousands):
Year Ending September 30:
|
Amounts | |||
|---|---|---|---|---|
2015 |
$ | 107 | ||
2016 |
9,439 | |||
2017 |
28,296 | |||
2018 |
46 | |||
2019 |
49 | |||
Thereafter |
325 | |||
| | | | | |
Total |
$ | 38,262 | ||
| | | | | |
| | | | | |
| | | | | |
Convertible Notes
In 2008 and 2009, the Company issued convertible bridge notes (the "Convertible Notes") and warrant purchase agreements to several of the then-existing Series C preferred stock investors, whereby the Company raised a total of $20.0 million. On April 8, 2014, in connection with the closing of the IPO, all of the Convertible Notes, with an aggregate principal amount and accrued interest of $19.4 million, were converted into 2,036,555 shares of common stock. As originally issued, the Convertible Notes accrued interest at 10% per year and matured on the earliest of July 31, 2009, the consummation of a significant sale of assets of the Company outside the normal course of business, or upon an uncured event of default. Subsequently, the maturities of the Convertible Notes were initially extended to October 31, 2009, after which they became due. In connection with the closing of the $35.0 million term loan agreement in July 2012, the Company ratably repaid $10.0 million of principal on the Convertible Notes and further extended the maturity date of the Convertible Notes to July 1, 2017. Interest was not paid on the Convertible Notes since inception and is, therefore, presented as long-term accrued interest at September 30, 2013.
The Convertible Notes were secured by all assets of the Company, with such security interest being subordinated to the security interest granted by the Company to its commercial bank and the $35 million term loan agreement. Pursuant to an intercreditor agreement the Company entered into in July 2013, the Company was not permitted to pay interest on these notes until maturity.
The Convertible Notes also provided for an amendment of the voting agreement between the Company and the majority of its stockholders, pursuant to which one investor had the right to increase the maximum size of the board of directors to 11 and that same investor also had the right to appoint up to 6 of the directors. This investor never exercised either of these rights.
The Convertible Notes also provided for the issuance of common stock warrants exercisable for a number of shares equal to 60% of the principal amount of the Convertible Notes, divided by the conversion price of the Convertible Notes, which was, initially, the original issue price of the Series C preferred stock. The warrants were only exercisable following conversion of the Convertible Notes into preferred stock and would have been exercisable for shares of common stock of the Company. As of September 30, 2012, the warrants had all been issued, each with an expiration date five years from the date of each corresponding Convertible Note's issuance (see Note 11).
106
CORIUM INTERNATIONAL, INC.
Notes to the Financial Statements (Continued)
As of and for the years ended September 30, 2014 and 2013
8. Debt (Continued)
During fiscal 2013, the carrying value of the Convertible Notes was reduced by $0.6 million due to the recognition of value associated with the modification of common stock warrants issued in connection with the Convertible Notes.
Subordinated Note
In 2009, the Company issued a subordinated note (the "Subordinated Note") to one of the existing Series C preferred stock investors raising a total of $13.0 million. On April 8, 2014, in connection with the closing of the IPO, the Subordinated Note, with a principal amount, accrued interest and derivative liability totaling $19.2 million, was converted into 3,387,146 shares of common stock. The Subordinated Note accrued simple interest at 5% per year and had an original maturity of the earliest of June 30, 2010, the consummation of a significant sale of assets of the Company outside the normal course of business, or upon an uncured event of default. In connection with the closing of the term loan agreement during the year ended September 30, 2012, the maturity of the Subordinated Note was extended to July 1, 2017. Interest was never paid on the Subordinated Note since inception and is, therefore, presented as long-term accrued interest at September 30, 2013.
If the Company had consummated a merger of the Company or a sale of all or substantially all of the Company's assets, or a significant asset sale prior to the full repayment of the Subordinated Note, then, at the written election of the subordinated note holder, the holder of the Subordinated Note would have been entitled to be repaid the entire outstanding balance under the Subordinated Note plus an additional amount equal to the outstanding principal under the Subordinated Note, plus all accrued interest. The Company determined that this feature is an embedded derivative requiring bifurcation and separate accounting. The fair value of this embedded derivative liability was $7.4 million as of September 30, 2013. The change in fair value was recorded to change in fair value of Subordinated Note embedded derivative liability.
The Subordinated Note was secured by all assets of the Company, with such security interest subordinated to the security interest granted by the Company to both its commercial bank and the term loan agreement. Pursuant to an intercreditor agreement the Company entered into in July 2012, the Company was not permitted to pay interest on these notes until maturity.
As part of the recapitalization described below, in December 2013 the Subordinated Note was modified to provide that in the event of a qualifying IPO or equity financing, the note would automatically convert into 3.4 million shares of common stock or the equivalent amount of preferred stock. As this represented a substantial modification of the debt, it was accounted for as an extinguishment. Accordingly, the book value of the debt prior to the conversion was removed from the financial statements and the fair value of the debt after the modification of $16.5 million, including the value of the conversion feature, was recorded. As the holder of the subordinate debt controlled the majority of our equity and could have appointed the majority of our board, the modification of the debt was considered a transaction with owners. Accordingly the difference between the book value of the debt prior to the modification and the fair value of the debt after modification was recorded as a $3.5 million reduction in additional paid-in capital.
107
CORIUM INTERNATIONAL, INC.
Notes to the Financial Statements (Continued)
As of and for the years ended September 30, 2014 and 2013
8. Debt (Continued)
Recapitalization
In December 2013, the Company entered into an amendment and conversion agreement with Essex Woodlands pursuant to which (i) the Company and Essex Woodlands amended the Convertible Notes held by Essex Woodlands and other investors to provide that they would automatically convert either into 2,036,555 shares of the Company's common stock immediately prior to the closing of an initial public offering of the Company's common stock or into 2,036,555 shares of the Company's Series C preferred stock immediately prior to the first closing of a qualified equity financing that occurred prior to the closing of an initial public offering of the Company's common stock, and the Convertible Notes would be terminated; (ii) the Company and Essex Woodlands amended the terms of the Subordinated Note to provide that it would automatically convert either into 3,387,146 shares of the Company's common stock immediately prior to the closing of an initial public offering of the Company's common stock or into 3,387,146 shares of a new series of the Company's preferred stock (with identical rights, preferences and privileges as the Company's Series C preferred stock, but with a liquidation preference of one times its original issue price) immediately prior to the first closing of a qualified equity financing that occurred prior to the closing of an initial public offering of the Company's common stock, and the Subordinated Note would be terminated; and (iii) Essex Woodlands agreed that it would effect the automatic conversion of all outstanding shares of the Company's preferred stock in connection with the completion of an initial public offering of the Company's common stock.
Simultaneously, the Company also entered into a repurchase agreement pursuant to which the Company agreed to repurchase 1,077,809 shares of the Company's common stock from two of the Company's founders, for an aggregate repurchase price of $5.2 million. These repurchases would occur immediately prior to the earlier of the consummation of an initial public offering of the Company's common stock and the first closing of a qualified equity financing, and these repurchases would satisfy in full all of the Company's remaining obligations under the repurchase agreements (see Note 12).
9. Commitments and Contingencies
Capital Leases
Certain manufacturing equipment is accounted for as a capital lease and is included in property and equipment as of September 30, 2014 and 2013.
108
CORIUM INTERNATIONAL, INC.
Notes to the Financial Statements (Continued)
As of and for the years ended September 30, 2014 and 2013
9. Commitments and Contingencies (Continued)
Future minimum lease payments under capital leases, together with the present value of the net minimum lease payments as of September 30, 2014, are as follows (in thousands):
Year Ending September 30,
|
Amounts | |||
|---|---|---|---|---|
2015 |
$ | 897 | ||
2016 |
877 | |||
2017 |
73 | |||
| | | | | |
Total minimum lease payments |
1,847 | |||
Less amount representing estimated executory costs (such as taxes) |
— | |||
| | | | | |
Net minimum lease payments |
1,847 | |||
Less amount representing interest |
(185 | ) | ||
| | | | | |
Present value of net minimum lease payments |
1,662 | |||
Less discount related to warrants |
(11 | ) | ||
| | | | | |
Capital lease liability |
1,651 | |||
Less current portion |
(760 | ) | ||
| | | | | |
Long-term portion |
$ | 891 | ||
| | | | | |
| | | | | |
| | | | | |
Depreciation expense on equipment under capital leases was $1.0 million, $0.6 million and $0.6 million for fiscal 2014, 2013 and 2012. As of September 30, 2014 and 2013, there was $0 and $112,000 of unrecognized gain on sale of leased assets.
Operating Leases
The Company conducts certain operations using leased property and equipment. The property and equipment leases require the Company to pay certain property taxes, insurance, and maintenance expenses, and expire on dates ranging through 2025. Total rental expense on operating leases for fiscal 2014, 2013 and 2012 amounted to $1.7 million, $1.6 million and $1.4 million.
Future minimum lease payments under operating leases that had initial or remaining lease terms in excess of one year from September 30, 2014 were as follows (in thousands):
Years Ending September 30,
|
Amounts | |||
|---|---|---|---|---|
2015 |
$ | 1,284 | ||
2016 |
735 | |||
2017 |
603 | |||
2018 |
611 | |||
2019 |
623 | |||
Thereafter |
3,653 | |||
| | | | | |
Total |
$ | 7,509 | ||
| | | | | |
| | | | | |
| | | | | |
109
CORIUM INTERNATIONAL, INC.
Notes to the Financial Statements (Continued)
As of and for the years ended September 30, 2014 and 2013
9. Commitments and Contingencies (Continued)
Guarantees and Indemnifications
The Company, as permitted under Delaware law and in accordance with its certificate of incorporation and bylaws, and pursuant to indemnification agreements with certain directors, indemnifies its officers and directors for certain events or occurrences, subject to certain limits, while the officer or director is or was serving at the Company's request in such capacity. The term of the indemnification period lasts as long as an officer or director may be subject to any proceeding arising out of acts or omissions of such officer or director in such capacity.
The maximum amount of potential future indemnification is unlimited; however, the Company currently holds director and officer liability insurance. This insurance limits the Company's exposure and may enable it to recover a portion of any future amounts paid. The Company believes that the fair value of these indemnification obligations is minimal. Accordingly, the Company has not recognized any liabilities relating to these obligations for any period presented.
Contingencies
The Company may be subject to legal proceedings and litigation arising in the ordinary course of business. The Company will record a liability when it believes that it is both probable that a loss has been incurred and the amount can be reasonably estimated. The Company expects to periodically evaluate developments in its legal matters that could affect the amount of liability that it has previously accrued, if any, and make adjustments as appropriate. Significant judgment is required to determine both likelihood of there being, and the estimated amount of, a loss related to such matters, and the Company's judgment may be incorrect. The outcome of any proceeding is not determinable in advance. Until the final resolution of any such matters that the Company may be required to accrue for, there may be an exposure to loss in excess of the amount accrued, and such amounts could be material. Management is not aware of any legal matters in which the final disposition is expected to have a material effect on the business. See Note 15 for further discussion regarding product liabilities.
On August 3, 2012, a wrongful death lawsuit was filed in the U.S. District Court for the Northern District of Texas, Boudreaux vs. Corium International, Inc., et al, naming Actavis Inc. and Actavis South Atlantic LLC ("Actavis") and the Company as co-defendants. Plaintiffs have alleged a family member died in connection with the use of Fentanyl TDS manufactured by the Company and distributed and sold by Actavis. The amount of the damages has not been specified. For this pending suit, the Company has insurance coverage up to $10 million with a maximum liability of $50,000 of out-of-pocket expense. The Company does not believe that the case has merit and plans to defend against this claim.
110
CORIUM INTERNATIONAL, INC.
Notes to the Financial Statements (Continued)
As of and for the years ended September 30, 2014 and 2013
10. Collaboration and Partner Arrangements
The Company has recognized the following revenues from its collaboration and partner agreements during fiscal 2014, 2013, and 2012 (in thousands):
| |
Years ended September 30, | |||||||||
|---|---|---|---|---|---|---|---|---|---|---|
| |
2014 | 2013 | 2012 | |||||||
P&G |
$ | 11,719 | $ | 11,781 | $ | 7,880 | ||||
Teva |
13,550 | 16,683 | 11,350 | |||||||
Actavis/Par |
12,971 | 16,551 | 18,139 | |||||||
Agile |
1,976 | 4,904 | 3,014 | |||||||
Other |
2,224 | 351 | 2,477 | |||||||
| | | | | | | | | | | |
Total revenues |
$ | 42,440 | $ | 50,270 | $ | 42,860 | ||||
| | | | | | | | | | | |
| | | | | | | | | | | |
| | | | | | | | | | | |
The Procter & Gamble Company
In 2005, the Company entered into a multi-faceted collaboration arrangement with The Procter & Gamble Company, or P&G.
The relationship includes a world-wide license to P&G for the use of certain of the Company's technologies for products in specific fields in which P&G operates. P&G paid the Company a $3.0 million fee for the license, and the Company is entitled to receive additional milestone payments for each qualifying product that the Company develops for P&G. In 2008, the Company received a $2.0 million milestone payment for the first series of products developed by the Company. P&G's license from the Company is perpetual and irrevocable.
The Company entered into a long term joint development agreement under which the Company performs numerous development activities for P&G based upon agreed-upon statements of work and budgets. The development work performed by the Company under this agreement is billed to P&G on a time and materials basis, at cost. The P&G joint development agreement expires on June 13, 2015.
The Company also entered into a commercial supply agreement for the production of all products developed by the Company for P&G. The Company has developed and commercialized several products which are currently marketed and sold by P&G under the brand name Crest Advanced Seal Whitestrips, or Crest Whitestrips. Several additional products are currently being developed by the Company for P&G, which are expected to launch in 2015 and beyond. The Company's current supply agreement with P&G was amended during 2014 and will now expire on January 31, 2017.
In addition to these agreements, and as part of the overall collaboration agreement, the Company also acquired certain patents from P&G in 2005. In exchange for the assignment of these patents, the Company issued 125,428 shares of our common stock as payment for the patents acquired.
Teva Pharmaceuticals USA, Inc.
In 2004, the Company entered into an arrangement with Barr Laboratories, or Barr, for four generic products. The Company entered into three separate agreements with Barr, one in 2006 and two in 2007, to develop and commercialize three additional products. In 2008, Teva Pharmaceutical Industries, Ltd., or Teva, acquired Barr. Following this acquisition, Teva discontinued four of these
111
CORIUM INTERNATIONAL, INC.
Notes to the Financial Statements (Continued)
As of and for the years ended September 30, 2014 and 2013
10. Collaboration and Partner Arrangements (Continued)
development programs. Of the remaining three programs, one has resulted in an approved product, Clonidine Transdermal Delivery System, (TDS), which is currently marketed by Teva, one has been approved by the FDA for which Teva is currently assessing the launch strategy and timing, and the third product is pending regulatory approval. Under the Company's current agreements with Teva, the Company is not eligible for additional milestone payments.
Under the agreements, the Company receives compensation for developing the products, generally on a time and materials basis. Once the products are commercialized, the Company generates product sales to Teva with a cost-plus margin and receives a profit share based on net profits (as defined in the agreements) earned by Teva for each product.
The term of each commercial agreement with Teva extends, on a product-by-product basis, through the last day of the tenth full calendar year following the launch date of each product, with automatic one-year renewals.
Par Pharmaceutical, Inc.
On May 11, 2002, the Company entered into an arrangement to pursue development and commercialization of a generic version of the transdermal fentanyl product with Abrika LLLP. In 2007, Abrika was acquired by Actavis, Inc. Under the agreements, the Company agreed to develop the product and to assist Actavis with the regulatory filing and ultimate approval of such product. In October 2012, Actavis divested this product to Par who assumed the various agreements. Under the Company's current agreements, the Company is not eligible for additional milestone payments.
The commercial agreement with Par has a term of twenty years, and expires on November 12, 2023.
In September 2014, the Company recognized $1.8 million in non-cash product revenues which had previously been deferred since 2007. The recognition of this revenue related to the expiration of a contractual liability under an agreement with Par, and will not have an impact on future revenues.
Agile Therapeutics, Inc.
In 2006, the Company entered into an arrangement with Agile to develop a new transdermal patch product using Agile's previously developed technology. Under the arrangement, the Company has performed process development activities and manufacturing of the product ("AG200-15"). For the development work performed, Agile paid the Company in several ways, including time and materials and milestones for achievement of certain development goals. During fiscal 2013 and 2012, Agile paid the Company $3.5 million for leasehold improvements incurred by the Company for its facilities to provide for adequate manufacturing space for this product once it is approved, which will be recognized as rental income in future years as the facility is used for production. In addition, for fiscal 2014 and 2013, Agile paid $1.0 and $0.6 million to the Company for idle facility charges, which are presented on the income statement as other revenues. Under the current agreements with Agile, the Company is not eligible for additional milestone payments.
112
CORIUM INTERNATIONAL, INC.
Notes to the Financial Statements (Continued)
As of and for the years ended September 30, 2014 and 2013
10. Collaboration and Partner Arrangements (Continued)
The term of the Company's contract with Agile continues until the Company has commercially produced an agreed-upon quantity of patches, currently projected to occur no earlier than five years following the commercial launch of AG200-15.
Other Partner Arrangements
In 2013, the Company entered into an arrangement for the development of two generic transdermal products. Under the arrangement, the partner and the Company will equally fund all costs of developing the products. The Company will be reimbursed for its share of all out of pocket costs and will be required to reimburse the partner for its share of all development, clinical and other costs up to and including regulatory filing. The Company may be reimbursed for the development costs that it incurs through the payment of certain development milestones up to a combined total of $4.7 million for both products, based on achieving certain stages of development. The Company received $0.5 million of these milestones upon signing the agreement and is amortizing these into revenue over the expected development period of the products.
Upon regulatory approval, the Company will manufacture and sell the product to the partner at cost with no margin, but, provided that the Company has shared equally in all costs through regulatory approval, the Company will be paid a profit share equal to 50% of the net profits for each product.
11. Warrants
The Company issued warrants to purchase shares of the Company's stock as part of several transactions from 2008 through 2013. The warrants have been recorded as either equity instruments or liability instruments based on the terms of the warrants.
Preferred Stock Warrants
As of September 30, 2013, the Company had issued warrants to purchase 1,739,992 shares of Series C preferred stock, with a weighted average exercise price of $0.90 per share, which comprised the only warrants to purchase preferred stock issued by the Company.
All of the Series C preferred stock warrants were exercisable for a period of five years from issuance, except certain warrants to purchase 163,522 shares of Series C preferred stock which would have expired upon the closing of an IPO, unless exercised. The warrants were exercisable in cash or through a cashless exercise provision. Under the cashless exercise provision, the holder could, in lieu of payment of the exercise price in cash, surrender the warrant and receive a net amount of shares based on the fair market value of the Series C preferred stock at the time of exercise of the warrant after deducting the aggregate exercise price. In the event that all outstanding shares of the Series C convertible preferred stock were converted into common stock, the warrants would be exercisable for the same number of shares of common stock.
Of the warrants outstanding as of September 30, 2013, warrants to purchase 1,380,241 shares of Series C preferred stock contained antidilution protection. Accordingly, the Company evaluated these warrants as derivative instruments, and recorded the warrants as liabilities at fair value at the time of issuance, with the fair value then adjusted at each subsequent balance sheet date.
113
CORIUM INTERNATIONAL, INC.
Notes to the Financial Statements (Continued)
As of and for the years ended September 30, 2014 and 2013
11. Warrants (Continued)
The fair value of the outstanding convertible preferred stock warrants containing antidilution protection where remeasured quarterly using the Option Pricing Model in fiscal 2012 and the Probability-Weighted Expected Return Model thereafter. The Company used a number of assumptions to estimate the fair value including the likelihood of various scenarios, the expected volatility and the fair value of the underlying stock under each scenario. These assumptions were:
| |
Year ended September 30, 2013 |
|
|---|---|---|
Remaining contractual term (in years) |
5.07 - 8.24 | |
Risk-free interest rate |
1.39 - 2.02% | |
Expected volatility |
68 - 77% | |
Expected dividend rate |
0% |
The fair value of these warrants totaled $0.6 million as of September 30, 2013.
On April 8, 2014, in connection with the closing of the IPO, all of the warrants to purchase 163,522 shares of Series C convertible preferred stock that were otherwise set to expire upon completion of the IPO were converted and net exercised into 1,191 shares of common stock, and the remainder of the outstanding warrants to purchase 1,216,719 shares of Series C convertible preferred stock , were converted into warrants to purchase common stock, representing 120,464 shares with a weighted average exercise price of $1.88 per share. In addition, the preferred stock warrant liability of $0.8 million was reclassified to stockholders' equity (deficit).
Common Stock Warrants
As of September 30, 2014 and 2013, warrants to purchase 128,582 and 1,294,613 shares of common stock were outstanding with a weighted average exercise price of $1.77 and $1.95 per share, including 120,464 shares of preferred stock warrants that were converted into warrants to purchase common stock in connection with the IPO in 2014. All of the common stock warrants are exercisable at any time up to five years from issuance. The fair value of these warrants was recorded in stockholders' equity (deficit) upon issuance.
The Company issued a warrant for the purchase of 8,118 shares of common stock with a fair value totaling $15,000 in connection with a lease arrangement that closed in September 2013. The fair value of the warrant upon issuance was calculated using the Black-Scholes option-pricing valuation model with the following assumptions: common stock value of $3.03 per share, contractual term of 5 years, risk-free interest rate of 1.41%, expected volatility of 76%, and expected dividend yield of 0%. This warrant was outstanding as of September 30, 2014.
On April 8, 2014, in connection with the closing of the IPO, warrants to purchase 1,286,495 shares of common stock were net exercised into 970,249 shares of common stock.
114
CORIUM INTERNATIONAL, INC.
Notes to the Financial Statements (Continued)
As of and for the years ended September 30, 2014 and 2013
12. Convertible Preferred Stock, Redeemable Common Stock and Stockholders' Equity (Deficit)
Convertible Preferred Stock
Preferred stock totaling 5.0 million shares with a par value of $0.001 are authorized, but, as of September 30, 2014, no preferred stock was outstanding.
Convertible preferred stock as of September 30, 2013, on an unconverted basis, consisted of the following (in thousands, except for share and per share data):
| |
Shares Authorized |
Original Issue Price |
Shares Issued and Outstanding |
Aggregate Liquidation Amount |
|||||||||
|---|---|---|---|---|---|---|---|---|---|---|---|---|---|
Series A |
1,114,100 | $ | 0.220 | 1,114,066 | $ | 490 | |||||||
Series B |
7,602,200 | 0.875 | 7,602,132 | 6,652 | |||||||||
Series C |
57,000,000 | 0.917 | 27,318,702 | 50,119 | |||||||||
| | | | | | | | | | | | | | |
Balance as of September 30, 2013 |
65,716,300 | 36,034,900 | $ | 57,261 | |||||||||
| | | | | | | | | | | | | | |
| | | | | | | | | | | | | | |
| | | | | | | | | | | | | | |
The Company recorded the convertible preferred stock at fair value on the dates of issuance. The Company classified the convertible preferred stock outside of stockholders' equity (deficit) because the shares contained liquidation features that were not solely within the Company's control.
The rights, privileges, and preferences of Series A, Series B, and Series C convertible preferred stock were as follows:
Voting Rights—The Series A, B, and C preferred stockholders had a right to the number of votes equal to the number of shares of common stock issuable upon conversion of the preferred stock, except as otherwise required by law. The Series C stockholders had protective provisions that required the Company to obtain their consent, by majority vote, before undertaking certain actions. In addition, all preferred stockholders, as a class, had protective provisions that required the Company to obtain their consent, by majority vote, before undertaking certain actions.
Dividends—The Series A, B, and C preferred stockholders were entitled to receive noncumulative dividends, if and when declared by the board of directors prior and in preference to any dividend on common stock, at the rate of 8% of the original issue price.
Conversion—Each share of preferred stock could have been converted, at the option of the holder, into such number of fully paid and nonassessable shares of common stock as was determined by dividing the original issue price for the relevant series of preferred stock by the then-applicable conversion price in effect at the time of conversion.
Liquidation—In the event of a liquidation, dissolution, or winding up of the Company, the Series C preferred stockholders were entitled to a preference payment prior to any distribution of assets or surplus funds of the Company to the Series A and B preferred stockholders or to the common stockholders. The liquidation preference payments to the Series C preferred stockholders would have been two times the original issuance price of the Series C preferred stock, plus any accrued but unpaid dividends. Upon completion of the preference payment to the Series C preferred stockholders, the Series A and B preferred stockholders were entitled to share equally in preference payments until the Series B preferred stockholders received one times the original issuance price of the Series B preferred
115
CORIUM INTERNATIONAL, INC.
Notes to the Financial Statements (Continued)
As of and for the years ended September 30, 2014 and 2013
12. Convertible Preferred Stock, Redeemable Common Stock and Stockholders' Equity (Deficit) (Continued)
stock; thereafter, only the Series A preferred stockholders would have received preference payments until they had received a cumulative amount of two times the original issuance price of the Series A preferred stock. All of the foregoing preferred stock preferences would have been paid prior to any distribution of any assets or surplus funds of the Company to the common stockholders. The Company classified the convertible preferred stock outside of stockholders' equity (deficit) and recorded it at maximum liquidation value as the shares contained liquidation features that were not solely within its control.
Participation—In the event of a liquidation, dissolution, or winding up of the Company, and only after all of the Series A, B, and C preferred stockholders had received all of their preference payments, any remaining assets or surplus funds of the Company would have been distributed ratably to the common stockholders and Series B preferred stockholders as if the Series B preferred stock had all been converted into common, but only to the extent that Series B stockholders were entitled to receive a maximum of one times the original issuance price of the Series B preferred stock from such distribution.
Common Stock
The Company was authorized to issue up to 150,000,000 and 115,000,000 shares of common stock as of September 30, 2014 and 2013 with a par value of $0.001 per share. The Company had reserved shares of common stock, on an as-if converted basis, for issuance as follows:
| |
As of September 30, | ||||||
|---|---|---|---|---|---|---|---|
| |
2014 | 2013 | |||||
Issuances under stock option plans |
2,089,586 | 1,781,846 | |||||
Issuances upon conversion of convertible preferred stock |
— | 3,567,811 | |||||
Issuances upon exercise of convertible preferred stock warrants |
— | 172,276 | |||||
Issuances upon exercise of common stock warrants |
128,582 | 1,294,618 | |||||
Issuances under the 2014 employee stock purchase plan |
310,000 | — | |||||
| | | | | | | | |
|
2,528,168 | 6,816,551 | |||||
| | | | | | | | |
| | | | | | | | |
| | | | | | | | |
Repurchases of Common Stock from Founders—In connection with the 2007 Series C financing, the Company, in accordance with specific stock repurchase agreements approved by the board of directors, purchased from the two founders an aggregate of 215,872 shares of common stock at a purchase price of $9.26 per share. The stock repurchase agreements also provided for the Company to repurchase an additional 215,872 shares of common stock from each of the two founders at a price of $9.26 per share. These agreements were amended in March 2008 to suspend the Company's obligation to repurchase these shares if, in the discretion of the Company's board of directors, any such repurchase would result in a material adverse effect on the Company's financial condition. As these shares were conditionally redeemable, they were classified outside of stockholders' equity (deficit).
116
CORIUM INTERNATIONAL, INC.
Notes to the Financial Statements (Continued)
As of and for the years ended September 30, 2014 and 2013
12. Convertible Preferred Stock, Redeemable Common Stock and Stockholders' Equity (Deficit) (Continued)
As of September 30, 2013, the Company had a remaining agreement to repurchase 132,073 from one founder and 215,872 from the other founder, but such repurchase was contingent on approval by the board of directors. In December 2013, the Company entered into a revised repurchase agreement pursuant to which the Company agreed to repurchase 1,077,809 shares of the Company's common stock from the founders, for an aggregate repurchase price of $5.2 million. On April 8, 2014, in connection with the closing of the IPO, the Company repurchased all 1,077,809 shares of common stock from the founders, thereby satisfying in full all of the Company's remaining obligations under the earlier repurchase agreements.
13. Stock-Based Compensation
Equity Incentive Plan
As of September 30, 2014 and September 30, 2013, the Company had four and three equity incentive plans, respectively, all of which are sponsored by the Company, with the exception of the separate stock option plan of StrataGent, Inc., a corporation acquired by the Company on September 20, 2007 (the "StrataGent Plan"). The Company assumed all unexpired, unexercised options outstanding for those employees of StrataGent who remained Company employees after the merger. Each StrataGent option became exercisable into whole shares of Corium stock based on an agreed exchange ratio and per share exercise price such that the total value of the option grant did not change. The Company elected to make no further grants under the StrataGent Plan; however, its terms continue to govern all options issued under that plan. No additional shares available for grant were assumed by the Company, and any options that were returned to the pool subsequent to the merger were canceled and were not made available for future grants. This wholly-owned subsidiary was dissolved in 2008.
On March 20, 2014, the Company's board of directors approved the adoption of the 2014 Equity Incentive Plan (the "2014 Plan"), which became effective in connection with the IPO. Under the 2014 Plan, the Company has reserved a total of 1.0 million shares of common stock plus the remaining unissued shares under the Company's 2012 Equity Incentive Plan (the "2012 Plan"), which had been adopted in November 2012 and was replaced by the 2014 Plan. The Company also sponsored the 2002 Stock Option Plan that expired in 2012. On January 1 of each year for the ten year term of the 2014 Plan, the number of shares of common stock issuable under the 2014 Plan can be increased by an amount equal to up to 4% of the number of shares of common stock and common stock equivalents outstanding as of the preceding December 31, or such lesser number agreed to by the board of directors.
The exercise price of each option issued under each of the equity incentive plans is required to be no less than the fair value of the Company's capital stock, as determined by the board of directors on the date of the grant. The maximum term of the options is ten years and the vesting period is typically four years. The Corium Plan comprises the 2014 Plan, the 2012 Plan and the 2002 Stock Option Plan.
Performance-Based Stock Option Grants—During the year ended September 30, 2013, the Company granted options to purchase 146,024 shares of common stock to certain executive officers and directors, which contained performance-based vesting criteria. These shares vest upon completion of certain
117
CORIUM INTERNATIONAL, INC.
Notes to the Financial Statements (Continued)
As of and for the years ended September 30, 2014 and 2013
13. Stock-Based Compensation (Continued)
milestone events which are specific to the Company's corporate goals. Stock-based compensation expense associated with these performance-based stock options is recognized if the performance condition is considered probable of achievement using management's best estimates. Following the closing of the IPO in April 2014, the Compensation Committee of the Company's board of directors determined that the performance-based criteria was met for options related to 137,510 shares of common stock and, accordingly, the Company has recorded stock-based compensation expense of $0.3 million for the year ended September 30, 2014 related to these performance-based stock options.
A summary of activity under the Corium Plan during fiscal 2014, 2013 and 2012 is as follows:
| |
Shares Available for Grant |
Stock Options Outstanding |
Weighted Average Exercise Price |
Weighted Average Remaining Contractual Life (Years) |
Aggregate Intrinsic Value (In thousands) |
|||||||||||
|---|---|---|---|---|---|---|---|---|---|---|---|---|---|---|---|---|
Balance—October 1, 2011 |
175,811 | 813,900 | $ | 3.43 | ||||||||||||
Forfeited / Cancelled |
55,486 | (55,486 | ) | $ | 6.67 | |||||||||||
| | | | | | | | | | | | | | | | | |
Balance—September 30, 2012 |
231,297 | 758,414 | $ | 3.13 | 5.20 | |||||||||||
Additional shares authorized |
792,079 | — | — | |||||||||||||
Granted |
(993,327 | ) | 993,327 | $ | 2.22 | |||||||||||
Exercised |
— | (4,504 | ) | $ | 2.32 | |||||||||||
Forfeited / Cancelled |
218,361 | (218,361 | ) | $ | 5.93 | |||||||||||
| | | | | | | | | | | | | | | | | |
Balance—September 30, 2013 |
248,410 | 1,528,876 | $ | 2.22 | 7.22 | $ | 1,287 | |||||||||
Additional shares authorized |
1,272,277 | — | — | |||||||||||||
Granted |
(573,589 | ) | 573,589 | $ | 4.86 | |||||||||||
Exercised |
— | (14,650 | ) | $ | 2.32 | |||||||||||
Forfeited / Cancelled |
2,787 | (2,787 | ) | $ | 3.30 | |||||||||||
| | | | | | | | | | | | | | | | | |
Balance—September 30, 2014 |
949,885 | 2,085,028 | $ | 2.92 | 7.02 | $ | 6,710 | |||||||||
Options exercisable—September 30, 2014 |
1,240,629 | $ | 2.39 | 5.89 | $ | 4,647 | ||||||||||
| | | | | | | | | | | | | | | | | |
| | | | | | | | | | | | | | | | | |
| | | | | | | | | | | | | | | | | |
Options vested and expected to vest—September 30, 2014 |
2,047,439 | $ | 2.91 | 7.00 | $ | 6,589 | ||||||||||
| | | | | | | | | | | | | | | | | |
| | | | | | | | | | | | | | | | | |
| | | | | | | | | | | | | | | | | |
All outstanding options under the Corium Plan as of September 30, 2014 have an exercise price between $2.12 and $8.18 per share.
The weighted average grant date fair value of options granted was $8.03 and $1.31 for fiscal 2014 and 2013. The Company estimated the fair value of stock options granted during fiscal 2014 and 2013 using the Black-Scholes option pricing model. The fair value of stock options is being amortized on a
118
CORIUM INTERNATIONAL, INC.
Notes to the Financial Statements (Continued)
As of and for the years ended September 30, 2014 and 2013
13. Stock-Based Compensation (Continued)
straight-line basis over the requisite service period of the awards. The fair value of the employee stock options was estimated using the following assumptions:
| |
Year ended September 30, | |||
|---|---|---|---|---|
| |
2014 | 2013 | ||
Expected term (in years) |
5.27 - 6.08 | 2.50 - 6.08 | ||
Risk-free interest rate |
1.61% - 2.25% | 0.70% - 1.38% | ||
Expected volatility |
63% - 74% | 71% - 75% | ||
Expected dividend rate |
0% | 0% | ||
A summary of activity under the StrataGent Plan for fiscal 2014, 2013 and 2012 is as follows:
| |
Stock Options Outstanding |
Weighted Average Exercise Price |
Weighted Average Remaining Contractual Life (Years) |
Aggregate Intrinsic Value (In thousands) |
|||||||||
|---|---|---|---|---|---|---|---|---|---|---|---|---|---|
Balance—October 1, 2011 |
97,276 | $ | 0.20 | ||||||||||
Exercised |
(61,799 | ) | $ | 0.20 | |||||||||
| | | | | | | | | | | | | | |
Balance—September 30, 2012 |
35,477 | $ | 0.20 | 1.82 | |||||||||
Exercised |
(21,684 | ) | $ | 0.10 | |||||||||
Forfeited |
(9,233 | ) | $ | 0.20 | |||||||||
| | | | | | | | | | | | | | |
Balance—September 30, 2013 |
4,560 | $ | 0.71 | 3.13 | $ | 11 | |||||||
| | | | | | | | | | | | | | |
Balance—September 30, 2014 |
4,560 | $ | 0.71 | 2.13 | $ | 25 | |||||||
Options exercisable—September 30, 2014 |
4,560 | $ | 0.71 | 2.13 | $ | 25 | |||||||
| | | | | | | | | | | | | | |
| | | | | | | | | | | | | | |
| | | | | | | | | | | | | | |
Options vested and expected to vest—September 30, 2014 |
4,560 | $ | 0.71 | 2.13 | $ | 25 | |||||||
| | | | | | | | | | | | | | |
| | | | | | | | | | | | | | |
| | | | | | | | | | | | | | |
All outstanding options under the StrataGent Plan have an exercise price between $0.18 and $0.88 per share. There were no options granted under the StrataGent Plan during fiscal 2014, 2013 or 2012.
2014 Employee Stock Purchase Plan
On March 20, 2014, the Company's board of directors approved the adoption of the 2014 Employee Stock Purchase Plan (the "2014 ESPP"), which became effective in connection with the IPO. Under the 2014 ESPP, the Company has reserved a total of 310,000 shares of common stock for issuance to employees. On January 1 of each year for the ten year term of the plan, the number of shares issuable under the 2014 ESPP can be increased by action of the board of directors by an amount equal to up to 1% of the number of shares of common stock and common stock equivalents outstanding as of the preceding December 31, or a lesser number agreed to by the board of directors. No more than 4.0 million shares may be issued over the ten year term of the 2014 ESPP without the consent of the Company's stockholders. No shares under the 2014 Plan had been issued as of September 30, 2014. Shares subject to purchase rights granted under the Company's 2014 ESPP that terminate without having been exercised in full will not reduce the number of shares available for
119
CORIUM INTERNATIONAL, INC.
Notes to the Financial Statements (Continued)
As of and for the years ended September 30, 2014 and 2013
13. Stock-Based Compensation (Continued)
issuance under the Company's 2014 ESPP. The 2014 ESPP is intended to qualify as an "employee stock purchase plan," under Section 423 of the Internal Revenue Code of 1986 with the purpose of providing employees with an opportunity to purchase the Company's common stock through accumulated payroll deductions. The 2014 ESPP provides for a two-year offering period with four, six-month purchase windows during each offering period. Employees are able to purchase shares of common stock at 85% of the lower of the fair market value of the Company's common stock on the first day of the offering period or on the last day of the six-month purchase window. For the year ended September 30, 2014, the Company recorded stock-based compensation expense of $253,000 related to the 2014 ESPP.
The weighted average fair value of the shares expected to be purchased under the 2014 ESPP was estimated using the Black-Scholes option-pricing model with the following assumptions:
| |
Year Ended September 30, 2014 |
|
|---|---|---|
Expected term (in years) |
0.63 - 2.13 | |
Expected volatility |
42 - 55% | |
Risk-free interest rate |
0.07 - 0.52% | |
Expected dividend rate |
0% |
Fair Value of Common Stock—The fair value of the shares of common stock is based on 85% of the Company's IPO price for the first offering period.
Expected Term—The expected term is based on the term of the offering period under the 2014 ESPP and can be either six, twelve, eighteen or twenty four months.
Expected Volatility—Because the Company has limited information on the volatility of its common stock due to a lack of significant trading history and limited historical data regarding the volatility of its common stock, the expected volatility used is based on the volatility of a group of comparable publicly traded companies. In evaluating comparability, the Company considered factors such as industry, stage of life cycle and size. The Company will continue to analyze the historical stock price volatility and term assumptions as more historical data for the Company's common stock becomes available.
Risk-Free Interest Rate—The risk-free interest rate is based on the constant maturity yields of U.S. Treasury notes with remaining maturities similar to the expected term.
Expected Dividend Rate—The Company has never paid any dividends, does not plan to pay dividends in the foreseeable future, and, therefore, uses an expected dividend rate of zero in the valuation model.
120
CORIUM INTERNATIONAL, INC.
Notes to the Financial Statements (Continued)
As of and for the years ended September 30, 2014 and 2013
13. Stock-Based Compensation (Continued)
Stock-Based Compensation Expense
Employee stock-based compensation expense for fiscal 2014, 2013 and 2012 is classified in the statements of operations and comprehensive loss as follows (in thousands):
| |
Years ended September 30, |
|||||||||
|---|---|---|---|---|---|---|---|---|---|---|
| |
2014 | 2013 | 2012 | |||||||
Cost of product revenues |
$ | 188 | $ | 35 | $ | — | ||||
Cost of contract research and development revenues |
196 | 21 | — | |||||||
Research and development |
151 | 39 | — | |||||||
General and administrative |
1,094 | 235 | 66 | |||||||
| | | | | | | | | | | |
Total stock-based compensation |
$ | 1,629 | $ | 330 | $ | 66 | ||||
| | | | | | | | | | | |
| | | | | | | | | | | |
| | | | | | | | | | | |
As of September 30, 2014, there was a total of $4.1 million of unrecognized employee compensation cost, net of estimated forfeitures, related to non-vested stock option awards and the 2014 ESPP, which is expected to be recognized on a straight-line basis over a weighted-average period of approximately 3.1 years.
14. Product Recall Liability
In fiscal 2008 and fiscal 2010, Actavis issued two voluntary recalls of certain lots and strengths of Fentanyl TDS manufactured by the Company and sold and distributed by Actavis in the United States. The Company and Actavis negotiated financial settlements for these two recalls, and the Company accrued amounts related to these settlements in fiscal 2009 and 2011. Such recall liabilities were subsequently reduced through various mechanisms per the terms of the settlement agreements.
In October 2012, the Company reached a revised settlement related to the two recalls which provided for a total and combined remaining liability of $5.0 million as of September 30, 2012. The revised liability will be repaid through quarterly payments in arrears based on a percentage of the average of the total net revenues recorded by the Company related to Fentanyl TDS. These payments have been paid to Actavis starting in July 1, 2013 and will continue through April 1, 2017. To the extent that the revised settlement liability is not repaid as of April 1, 2017, the remaining liability, if any, will be converted into the most recent form of capital stock issued by the Company in connection with a financing, at the price per share of that financing. The revised liability does not accrue interest. As a result of the revised settlement, the Company recorded a gain on settlement of the recall liability of $0.6 million which is included in the statement of operations and comprehensive loss for the year ended September 30, 2012. During fiscal 2014 and 2013, the Company repaid $1.1 million and $0.2 million of this liability.
121
CORIUM INTERNATIONAL, INC.
Notes to the Financial Statements (Continued)
As of and for the years ended September 30, 2014 and 2013
14. Product Recall Liability (Continued)
The following table summarizes the changes to the product recall liability (in thousands):
| |
Year Ended September 30, | |||||||||
|---|---|---|---|---|---|---|---|---|---|---|
| |
2014 | 2013 | 2012 | |||||||
Beginning balance |
$ | 4,832 | $ | 5,000 | $ | 8,623 | ||||
Non-cash reductions in recall liability prior to settlement |
— | — | (3,041 | ) | ||||||
Gain on settlement of recall liability |
— | — | (582 | ) | ||||||
Payment of settlement liability |
(1,122 | ) | (168 | ) | — | |||||
| | | | | | | | | | | |
Ending balance |
$ | 3,710 | $ | 4,832 | $ | 5,000 | ||||
| | | | | | | | | | | |
| | | | | | | | | | | |
| | | | | | | | | | | |
15. Product Liability
As discussed in Note 9, there are other potential liabilities that the Company may incur relating to the products it manufactures, including potential product liability claims. For fiscal 2014, 2013 and 2012, the Company has provided a reserve for these claims taking into account the insurance coverage maintained for such claims, the nature and extent of such claims, and the Company's past success in defending and/or settling such claims. The Company does not expect a material financial impact to arise from such claims to date.
The following table summarizes the changes to the product liability reserve (in thousands):
| |
Year Ended September 30, | |||||||||
|---|---|---|---|---|---|---|---|---|---|---|
| |
2014 | 2013 | 2012 | |||||||
Beginning balance |
$ | 90 | $ | 720 | $ | 500 | ||||
Settlement payments |
— | (1,300 | ) | (307 | ) | |||||
Expense (income) |
(5 | ) | 670 | 527 | ||||||
| | | | | | | | | | | |
Ending balance |
$ | 85 | $ | 90 | $ | 720 | ||||
| | | | | | | | | | | |
| | | | | | | | | | | |
| | | | | | | | | | | |
16. Net Loss and Net Loss per Share Attributable to Common Stockholders
The following table sets forth the computation of the Company's basic and diluted net loss per share attributable to common stockholders during fiscal 2014, 2013 and 2012 (in thousands, except share and per share data):
| |
Year Ended September 30, | |||||||||
|---|---|---|---|---|---|---|---|---|---|---|
| |
2014 | 2013 | 2012 | |||||||
Net loss attributable to common stockholders, basic and diluted |
$ | (9,912 | ) | $ | (13,877 | ) | $ | (5,443 | ) | |
Weighted average shares used in computing net loss per share attributable to common stockholders, basic and diluted |
10,043,640 | 2,222,981 | 2,200,727 | |||||||
| | | | | | | | | | | |
Net loss per share attributable to common stockholders, basic and diluted |
$ | (0.99 | ) | $ | (6.24 | ) | $ | (2.47 | ) | |
| | | | | | | | | | | |
| | | | | | | | | | | |
| | | | | | | | | | | |
122
CORIUM INTERNATIONAL, INC.
Notes to the Financial Statements (Continued)
As of and for the years ended September 30, 2014 and 2013
16. Net Loss and Net Loss per Share Attributable to Common Stockholders (Continued)
The following outstanding shares of common stock equivalents were excluded from the computation of the diluted net loss per share attributable to common stockholders for the periods presented because including them would have been antidilutive:
| |
Year Ended September 30, | |||||||||
|---|---|---|---|---|---|---|---|---|---|---|
| |
2014 | 2013 | 2012 | |||||||
Convertible preferred stock |
— | 3,567,811 | 3,567,811 | |||||||
Stock options to purchase common stock |
2,089,586 | 1,781,844 | 1,025,188 | |||||||
Shares authorized under the 2014 ESPP |
310,000 | — | — | |||||||
Common stock warrants |
128,582 | 1,294,618 | 1,269,634 | |||||||
Preferred stock warrants |
— | 172,276 | 172,276 | |||||||
17. Income Taxes
The Company's effective tax rate differs from the statutory federal income tax rate, primarily as a result of the net operating loss carryforwards and research and development tax credit carryforwards.
The Company operates in only one jurisdiction, the United States. The following table presents a reconciliation of the tax expense (benefit) computed at the statutory federal rate and the Company's tax expense (benefit) for the period presented (in thousands):
| |
Year Ended September 30, | |||||||||
|---|---|---|---|---|---|---|---|---|---|---|
| |
2014 | 2013 | 2012 | |||||||
Income tax benefit—computed as 34% of pretax loss |
$ | (3,370 | ) | $ | (4,717 | ) | $ | (1,851 | ) | |
Effect of nondeductible expenses |
695 | 695 | 881 | |||||||
State and local income tax expenses |
1 | 1 | (6 | ) | ||||||
Valuation allowance |
2,403 | 4,270 | 876 | |||||||
Effect of tax credits and other |
(13 | ) | (50 | ) | (1 | ) | ||||
State deferred taxes |
285 | (188 | ) | 75 | ||||||
Other |
— | (10 | ) | 19 | ||||||
| | | | | | | | | | | |
Total |
$ | 1 | $ | 1 | $ | (7 | ) | |||
| | | | | | | | | | | |
| | | | | | | | | | | |
| | | | | | | | | | | |
123
CORIUM INTERNATIONAL, INC.
Notes to the Financial Statements (Continued)
As of and for the years ended September 30, 2014 and 2013
17. Income Taxes (Continued)
The tax effects of temporary differences and carryforwards that give rise to significant portions of deferred tax assets and liabilities as of September 30, 2014 and 2013 are as follows (in thousands):
| |
As of September 30, | ||||||
|---|---|---|---|---|---|---|---|
| |
2014 | 2013 | |||||
Deferred tax assets: |
|||||||
Net operating loss carryforward |
$ | 26,279 | $ | 21,491 | |||
Depreciation |
694 | 720 | |||||
Accrued expenses |
1,686 | 1,782 | |||||
Research and development tax credit |
1,982 | 1,970 | |||||
State deferred taxes |
1,651 | 1,965 | |||||
Subordinated debt embedded derivative |
— | 2,505 | |||||
Other |
1,508 | 801 | |||||
| | | | | | | | |
Gross deferred tax assets |
33,800 | 31,234 | |||||
Valuation allowance |
(33,518 | ) | (30,997 | ) | |||
| | | | | | | | |
Net deferred tax assets |
282 | 237 | |||||
Deferred tax liabilities: |
|||||||
Other |
(282 | ) | (237 | ) | |||
| | | | | | | | |
Gross deferred tax liabilities |
(282 | ) | (237 | ) | |||
| | | | | | | | |
Net deferred tax liabilities |
$ | — | $ | — | |||
| | | | | | | | |
| | | | | | | | |
| | | | | | | | |
As of September 30, 2014, the Company had net operating loss carryforwards for federal and state income tax purposes of $77.3 million and $12.8 million. These net operating loss carryforwards will expire, if not utilized, beginning in 2026 and 2017 for federal and state income tax purposes, respectively.
Realization of deferred tax assets is dependent on future taxable income, the existence and timing of which is uncertain. Based on the Company's history of losses, management has determined it cannot conclude that it is more likely than not that the deferred tax assets will be realized, and accordingly has placed a full valuation allowance on its net deferred tax assets. The valuation allowance increased by $2.5 million and $4.3 million in fiscal 2014 and 2013.
As of September 30, 2014, the Company had research and development tax credit carryforwards of $2.0 million and $1.4 million available to reduce future taxable income, if any, for federal and California state income tax purposes. The federal tax credit carryforwards begin to expire in 2022. California credits have no expiration date.
The Tax Reform Act of 1986 and similar California legislation impose substantial restrictions on the utilization of net operating losses and tax credits in the event of an ownership change of a corporation. Accordingly, the Company's ability to utilize net operating losses and research and development tax credit carryforwards may be significantly limited in the future as a result of such an ownership change.
124
CORIUM INTERNATIONAL, INC.
Notes to the Financial Statements (Continued)
As of and for the years ended September 30, 2014 and 2013
17. Income Taxes (Continued)
The Company did not have any material unrecognized tax benefits as of September 30, 2014 and 2013. It is difficult to predict the final timing and resolution of any particular uncertain tax position. Based on the Company's assessment, including experience and complex judgments about future events, the Company does not expect that changes in the amount of unrecognized tax benefits during the next 12 months will have a significant impact on the Company's financial position or results of operations. On January 1, 2009, the Company adopted the provisions of FASB's guidance for accounting for uncertain tax positions. The guidance prescribes a comprehensive model for the recognition, measurement, presentation and disclosure in financial statements of any uncertain tax positions that have been taken or expected to be taken on a tax return. The cumulative effect of adopting this guidance did not result in an adjustment to accumulated deficit as of January 1, 2009. No liability related to uncertain tax positions is recorded in the financial statements.
It is the Company's policy to include penalties and interest expense related to income taxes as a component of other expense and interest expense, as necessary. There was no interest expense or penalties related to unrecognized tax benefits recorded through September 30, 2014.
The Company files income tax returns in the U.S. federal jurisdiction as well as in California, Michigan, and New Jersey. The tax years ending September 30, 2011 to September 30, 2013 remain open to examination by the jurisdictions in which the Company is subject to tax. Fiscal years outside the normal statute of limitation remain open to audit by tax authorities due to tax attributes generated in those early years, which have been carried forward and may be audited in subsequent years when utilized.
18. Employee Benefit Plan
The Company has a defined-contribution retirement plan that allows for discretionary contributions from the Company. Contributions totaled $93,000, $90,000 and $80,000 for fiscal 2014, 2013 and 2012.
19. Segment and Enterprise-Wide Information
The Company's chief operating decision maker is its chief executive officer. The chief executive officer reviews its operating results on an aggregate basis for purposes of allocating resources and evaluating financial performance. The Company has one business activity and there are no segment managers who are held accountable for operations, or operating results for levels or components. Accordingly, the Company has a single reporting segment and operating unit structure.
All of the Company's revenues are derived from partners located in the United States and all long-lived assets are located in the United States.
125
CORIUM INTERNATIONAL, INC.
Notes to the Financial Statements (Continued)
As of and for the years ended September 30, 2014 and 2013
20. Selected Quarterly Financial Data (Unaudited)
Selected quarterly results from operations for the years ended September 30, 2014 and 2013 are as follows (in thousands, except per share amounts):
| |
Fiscal 2014 Quarter Ended | ||||||||||||
|---|---|---|---|---|---|---|---|---|---|---|---|---|---|
| |
December 31, 2013 |
March 31, 2014 |
June 30, 2014 |
September 30, 2014 |
|||||||||
Total revenue |
$ | 10,468 | $ | 10,717 | $ | 10,183 | $ | 11,072 | |||||
Operating expenses |
$ | 11,530 | $ | 11,511 | $ | 13,580 | $ | 15,869 | |||||
Net income (loss) |
$ | (2,098 | ) | $ | 3,534 | $ | (4,981 | ) | $ | (6,367 | ) | ||
Basic net income (loss) per common share |
$ | (0.94 | ) | $ | 0.50 | $ | (0.28 | ) | $ | (0.35 | ) | ||
Diluted net income (loss) per common share |
$ | (0.94 | ) | $ | 0.33 | (0.28 | ) | $ | (0.35 | ) | |||
| |
Fiscal 2013 Quarter Ended | ||||||||||||
|---|---|---|---|---|---|---|---|---|---|---|---|---|---|
| |
December 31, 2012 |
March 31, 2013 |
June 30, 2013 |
September 30, 2013 |
|||||||||
Total revenue |
$ | 12,624 | $ | 12,536 | $ | 12,566 | $ | 12,544 | |||||
Operating expenses |
$ | 12,287 | $ | 12,614 | $ | 11,795 | $ | 12,373 | |||||
Net loss |
$ | (1,433 | ) | $ | (1,999 | ) | $ | (9,163 | ) | $ | (1,282 | ) | |
Basic and diluted net loss per common share |
$ | (0.65 | ) | $ | (0.90 | ) | $ | (4.12 | ) | $ | (0.58 | ) | |
21. Subsequent Events
In November 2014, the Company amended and restated its existing term loan agreement (see Note 8). Among other things, this amendment increased the loan principal amount to $45.0 million (excluding PIK notes), and extended the maturity date to June 30, 2019. Interest only payments are due quarterly through June 30, 2018, and principal and interest payments are due in four quarterly installments beginning September 30, 2018. Interest will continue to accrue on both the loan and PIK notes at a rate of 15% per year, of which up to 3.5% can be converted each quarter into PIK notes on or prior to September 30, 2018.
* * * **
126
ITEM 9. CHANGES IN AND DISAGREEMENTS WITH ACCOUNTANTS ON ACCOUNTING AND FINACIAL DISCLOSURE
None.
ITEM 9A. CONTROLS AND PROCEDURES
Evaluation of disclosure controls and procedures
Regulations under the Exchange Act require public companies, including us, to maintain "disclosure controls and procedures," which are defined in Rule 13a-15(e) and Rule 15d-15(e) to mean a company's controls and other procedures that are designed to ensure that information required to be disclosed in the reports that it files or submits under the Exchange Act is recorded, processed, summarized and reported, within the time periods specified in the SEC's rules and forms. Disclosure controls and procedures include, without limitation, controls and procedures designed to ensure that information required to be disclosed in our reports filed under the Exchange Act is accumulated and communicated to management, including our principal executive officer and principal financial officer or persons performing similar functions, as appropriate to allow timely decisions regarding required or necessary disclosures. In designing and evaluating our disclosure controls and procedures, management recognizes that disclosure controls and procedures, no matter how well conceived and operated, can provide only reasonable, not absolute, assurance that the objectives of the disclosure controls and procedures are met. Additionally, in designing disclosure controls and procedures, our management necessarily was required to apply its judgment in evaluating the cost-benefit relationship of possible disclosure controls and procedures. Based on the evaluation of the effectiveness of the disclosure controls and procedures by our management as of September 30, 2014, our chief executive officer and chief financial officer have concluded that, as of such date, our disclosure controls and procedures were effective at the reasonable assurance level.
Management's Report on Internal Control Over Financial Reporting
This report does not include a report of management's assessment regarding internal control over financial reporting or an attestation report of our registered public accounting firm due to a transition period established by rules of the SEC for newly public companies.
Changes in internal control over financial reporting
Regulations under the Exchange Act require public companies, including our company, to evaluate any change in our "internal control over financial reporting" as such term is defined in Rule 13a-15(f) and Rule 15d-15(f) of the Exchange Act. In connection with their evaluation of our disclosure controls and procedures, our chief executive officer and chief financial officer did not identify any change in our internal control over financial reporting during the most recent fiscal quarter that materially affected, or is reasonably likely to materially affect, our internal control over financial reporting.
David Greenwood will transition from the role of Executive Chairman effective December 31, 2014, and will continue to serve as Chairman of our Board of Directors.
127
ITEM 10. DIRECTORS, EXECUTIVE OFFICERS AND CORPORATE GOVERNANCE
The information required by this item will be included in an amendment to this Annual Report on Form 10-K or incorporated by reference from our definitive proxy statement to be filed pursuant to Regulation 14A.
ITEM 11. EXECUTIVE COMPENSATION
The information required by this item will be included in an amendment to this Annual Report on Form 10-K or incorporated by reference from our definitive proxy statement to be filed pursuant to Regulation 14A.
ITEM 12. SECURITY OWNERSHIP OF CERTAIN BENEFICIAL OWNERS AND MANAGEMENT AND RELATED STOCKHOLDER MATTERS
The information required by this item will be included in an amendment to this Annual Report on Form 10-K or incorporated by reference from our definitive proxy statement to be filed pursuant to Regulation 14A.
ITEM 13. CERTAIN RELATIONSHIPS AND RELATED TRANSACTIONS AND DIRECTOR INDEPENDENCE
The information required by this item will be included in an amendment to this Annual Report on Form 10-K or incorporated by reference from our definitive proxy statement to be filed pursuant to Regulation 14A.
ITEM 14. PRINCIPAL ACCOUNTING FEES AND SERVICES
The information required by this item will be included in an amendment to this Annual Report on Form 10-K or incorporated by reference from our definitive proxy statement to be filed pursuant to Regulation 14A.
128
ITEM 15. EXHIBITS AND FINANCIAL STATEMENT SCHEDULES
The following documents are filed as a part of this Annual Report on Form 10-K:
- (a)
- Financial Statements
The information concerning our financial statements, and Report of Independent Registered Public Accounting Firm required by this Item is incorporated by reference herein to the section of this Annual Report on Form 10-K in Item 8, entitled "Financial Statements and Supplementary Data."
- (b)
- Financial Statement Schedules
All schedules have been omitted because the required information is not present or not present in amounts sufficient to require submission of the schedules, or because the information required is included in the Consolidated Financial Statements or notes thereto.
- (c)
- Exhibits.
The list of exhibits filed with this report is set forth in the Exhibit Index following the signature pages and is incorporated herein by reference.
129
Pursuant to the requirements of Section 13 or 15(d) of the Securities Exchange Act of 1934, the registrant has duly caused this report to be signed on its behalf by the undersigned thereunto duly authorized, in the City of Menlo Park, State of California, on December 15, 2014.
| CORIUM INTERNATIONAL, INC. | ||||
By: |
/s/ ROBERT S. BREUIL Robert S. Breuil Chief Financial Officer (Principal Financial Officer) |
|||
KNOW ALL BY THESE PRESENTS, that each person whose signature appears below constitutes and appoints Peter D. Staple and Robert S. Breuil, and each of them, as his true and lawful attorneys-in-fact and agents, each with the full power of substitution, for him and in his name, place or stead, in any and all capacities, to sign any and all amendments to this report, and to file the same, with exhibits thereto and other documents in connection therewith, with the Securities and Exchange Commission, granting unto said attorneys-in-fact and agents, and each of them, full power and authority to do and perform each and every act and thing requisite and necessary to be done in and about the premises, as fully to all intents and purposes as he might or could do in person, hereby ratifying and confirming all that said attorneys-in-fact and agents, or their or his substitute or substitutes, may lawfully do or cause to be done by virtue hereof.
Pursuant to the requirements of the Securities Exchange Act of 1934, this report has been signed by the following persons in the capacities and on the dates indicated.
Signature
|
Title
|
Date
|
||
|---|---|---|---|---|
| /s/ PETER D. STAPLE Peter D. Staple |
Chief Executive Officer and Director (Principal Executive Officer) | December 15, 2014 | ||
/s/ ROBERT S. BREUIL Robert S. Breuil |
Chief Financial Officer (Principal Financial Officer) |
December 15, 2014 |
||
/s/ TIMOTHY D. SWEEMER Timothy D. Sweemer |
Chief Accounting Officer (Principal Accounting Officer) |
December 15, 2014 |
||
/s/ BHASKAR CHAUDHURI, PH.D. Bhaskar Chaudhuri, Ph.D. |
Director |
December 15, 2014 |
||
/s/ RONALD EASTMAN Ronald Eastman |
Director |
December 15, 2014 |
Signature
|
Title
|
Date
|
||
|---|---|---|---|---|
| /s/ PHYLLIS GARDNER, M.D. Phyllis Gardner, M.D. |
Director | December 15, 2014 | ||
Ivan Gergel, M.D. |
Director |
|||
/s/ PAUL GODDARD, PH.D. Paul Goddard, Ph.D. |
Director |
December 15, 2014 |
||
/s/ DAVID GREENWOOD David Greenwood |
Director |
December 15, 2014 |
||
/s/ JOHN KOZARICH, PH.D. John Kozarich, Ph.D. |
Director |
December 15, 2014 |
||
/s/ ROBERT THOMAS Robert Thomas |
Director |
December 15, 2014 |
| |
|
Incorporated by Reference | |
||||||||||
|---|---|---|---|---|---|---|---|---|---|---|---|---|---|
| Exhibit Number |
|
Filed Herewith |
|||||||||||
| Description of Document | Form | File No. | Exhibit | Filing Date | |||||||||
| 3.1 | Restated Certificate of Incorporation | 10-Q | 001-36375 | 3.1 | May 14, 2014 | ||||||||
| 3.2 | Restated Bylaws | 10-Q | 001-36375 | 3.2 | May 14, 2014 | ||||||||
| 4.1 | Form of Common Stock Certificate. | S-1 | 333-194279 | 4.1 | March 24, 2014 | ||||||||
| 4.2 | Investors' Rights Agreement, dated September 20, 2007, by and among the Registrant and certain of its stockholders, as amended. | S-1 | 333-194279 | 4.2 | March 24, 2014 | ||||||||
| 10.1 | + | Form of Indemnity Agreement. | S-1 | 333-194279 | 10.1 | March 24, 2014 | |||||||
| 10.2 | + | 2002 Stock Option Plan and forms of award agreements. | S-1 | 333-194279 | 10.2 | March 3, 2014 | |||||||
| 10.3 | + | Stratagent 2003 Stock Option Plan. | S-8 | 333-195006 | 4.6 | April 3, 2014 | |||||||
| 10.4 | + | 2012 Equity Incentive Plan and forms of award agreements. | S-1 | 333-194279 | 10.3 | March 3, 2014 | |||||||
| 10.5 | + | 2014 Equity Incentive Plan. | S-1 | 333-194279 | 10.4 | March 24, 2014 | |||||||
| 10.6 | + | 2014 Employee Stock Purchase Plan | S-1 | 333-194279 | 10.5 | March 24, 2014 | |||||||
| 10.7 | + | Offer Letter, accepted and agreed to on March 14, 2008, by and between the Registrant and Peter D. Staple. | S-1 | 333-194279 | 10.6 | March 3, 2014 | |||||||
| 10.8 | + | Offer Letter, accepted and agreed to on August 28, 2012, by and between the Registrant and Robert S. Breuil. | S-1 | 333-194279 | 10.7 | March 3, 2014 | |||||||
| 10.9 | + | Severance Benefits Letter, accepted and agreed to on June 25, 2013, by and between the Registrant and Parminder Singh. | S-1 | 333-194279 | 10.8 | March 3, 2014 | |||||||
| 10.10 | Lease dated March 20, 2002, by and between the Registrant and Baker-Wilcox L.L.C. (predecessor to Virtu Brunswick Associates, LLC) as amended March 1, 2004, March 22, 2007, and July 13, 2012. | S-1 | 333-194279 | 10.9 | March 3, 2014 | ||||||||
| 10.11 | Lease dated April 5, 2004, by and between the Registrant and Firco Associates, L.L.C. (predecessor to Virtu Brunswick Associates, LLC), as amended November 10, 2004, March 22, 2007, and July 1, 2012. | S-1 | 333-194279 | 10.10 | March 3, 2014 | ||||||||
| 10.12 | Business Park Lease dated October 13, 2006, by and between the Registrant and David D. Bohannon Organization, as amended November 15, 2013. | S-1 | 333-194279 | 10.11 | March 3, 2014 | ||||||||
| |
|
Incorporated by Reference | |
||||||||||
|---|---|---|---|---|---|---|---|---|---|---|---|---|---|
| Exhibit Number |
|
Filed Herewith |
|||||||||||
| Description of Document | Form | File No. | Exhibit | Filing Date | |||||||||
| 10.13 | Lease dated April 30, 2012, by and between the Registrant and 4741 Talon Court L.L.C. | S-1 | 333-194279 | 10.12 | March 3, 2014 | ||||||||
| 10.14 | Term Loan Agreement dated July 13, 2012, by and among the Registrant and Capital Royalty Partners II L.P., Capital Royalty Partners II—Parallel Fund "A" L.P. and Parallel Investment Opportunities Partners II L.P. | S-1 | 333-194279 | 10.14 | March 3, 2014 | ||||||||
| 10.15 | † | Product Development, Collaboration and License Agreement, dated May 11, 2002, by and between the Registrant and Abrika LLLP (predecessor-in-interest to Par Pharmaceutical, Inc.), as amended November 12, 2003. | S-1 | 333-194279 | 10.15 | March 24, 2014 | |||||||
| 10.16 | † | Manufacturing and Supply Agreement For Transdermal Fentanyl, dated November 12, 2003, by and between the Registrant and Abrika LLLP (predecessor-in-interest to Par Pharmaceutical, Inc.), as amended July 24, 2013. | S-1 | 333-194279 | 10.16 | March 24, 2014 | |||||||
| 10.17 | † | Assignment and Assumption Agreement, dated November 6, 2012, by and between Actavis South Atlantic LLC, and Par Pharmaceutical, Inc., and acknowledged and consented to by the Registrant. | S-1 | 333-194279 | 10.17 | March 3, 2014 | |||||||
| 10.18 | † | Amended and Restated Settlement Agreement, dated November 6, 2012, by and between the Registrant and Actavis South Atlantic LLC. | S-1 | 333-194279 | 10.18 | March 24, 2014 | |||||||
| |
|
Incorporated by Reference | |
||||||||||
|---|---|---|---|---|---|---|---|---|---|---|---|---|---|
| Exhibit Number |
|
Filed Herewith |
|||||||||||
| Description of Document | Form | File No. | Exhibit | Filing Date | |||||||||
| 10.19 | † | Development, License and Commercialization Agreement, dated October 18, 2006, by and between the Registrant and Agile Therapeutics, Inc. as modified by the Addendum to the Development, License and Commercialization Agreement, dated January 10, 2012, by and between the Registrant and Agile Therapeutics, Inc. and Addendum No. 2 to Development, License and Commercialization Agreement, dated February 6, 2013, by and between the Registrant and Agile Therapeutics, Inc. | S-1 | 333-194279 | 10.19 | March 24, 2014 | |||||||
| 10.20 | † | Development, Manufacturing and Commercialization Agreement, dated May 5, 2004, by and between the Registrant and Barr Laboratories, Inc., as amended by letter agreements dated September 8, 2009 and June 21, 2010. | S-1 | 333-194279 | 10.20 | March 24, 2014 | |||||||
| 10.21 | † | Development, Manufacturing and Commercialization Agreement, dated August 14, 2006, by and between the Registrant and Barr Laboratories, Inc. | S-1 | 333-194279 | 10.21 | March 24, 2014 | |||||||
| 10.22 | † | License Agreement, dated June 13, 2005, by and between the Registrant and The Procter & Gamble Company. | S-1 | 333-194279 | 10.22 | March 24, 2014 | |||||||
| 10.23 | † | Restated Supply Agreement, dated June 4, 2010, by and between the Registrant and The Procter & Gamble Manufacturing Company as amended effective on October 8, 2010 and February 1, 2014. | S-1 | 333-194279 | 10.23 | March 24, 2014 | |||||||
| 10.24 | + | Form of Forfeiture of Bonus. | S-1 | 333-194279 | 10.24 | March 24, 2014 | |||||||
| 10.25 | † | Restated Supply Agreement between Registrant and The Procter & Gamble Manufacturing Company, dated June 30, 2014. | 10-Q | 001-36375 | 10.1 | August 12, 2014 | |||||||
| 10.26 | Amendment to Business Park Lease, by and between Registrant and David D. Bohannon Organization, dated July 19, 2014. | 10-Q | 001-36375 | 10.2 | August 12, 2014 | ||||||||
| |
|
Incorporated by Reference | |
||||||||||
|---|---|---|---|---|---|---|---|---|---|---|---|---|---|
| Exhibit Number |
|
Filed Herewith |
|||||||||||
| Description of Document | Form | File No. | Exhibit | Filing Date | |||||||||
| 10.27 | Amended and Restated Term Loan Agreement dated November 14, 2014, by and among the Registrant and with certain entities affiliated with Capital Royalty Group. | X | |||||||||||
| 21.1 | Subsidiaries of the Registrant. | S-1 | 333-194279 | 21.1 | March 3, 2014 | ||||||||
| 23.1 | Consent of Independent Registered Public Accounting Firm. | X | |||||||||||
| 31.1 | Certification of Periodic Report by Chief Executive Officer under Section 302 of the Sarbanes-Oxley Act of 2002 | X | |||||||||||
| 31.2 | Certification of Periodic Report by Chief Financial Officer under Section 302 of the Sarbanes-Oxley Act of 2002 | X | |||||||||||
| 32.1 | * | Certification of Chief Executive Officer Pursuant to 18 U.S.C. Section 1350 as Adopted Pursuant to Section 906 of the Sarbanes-Oxley Act of 2002 | X | ||||||||||
| 32.2 | * | Certification of Chief Financial Officer Pursuant to 18 U.S.C. Section 1350 as Adopted Pursuant to Section 906 of the Sarbanes-Oxley Act of 2002 | X | ||||||||||
| 101.INS | XBRL Instance Document | X | |||||||||||
| 101.SCH | XBRL Taxonomy Extension Schema Document | X | |||||||||||
| 101.CAL | XBRL Taxonomy Extension Calculation Linkbase Document | X | |||||||||||
| 101.DEF | XBRL Taxonomy Extension Definition Linkbase Document | X | |||||||||||
| 101.LAB | XBRL Taxonomy Extension Label Linkbase Document | X | |||||||||||
| 101.PRE | XBRL Taxonomy Extension Presentation Linkbase Document | X | |||||||||||
- +
- Indicates
a management contract or compensatory plan.
- †
- Portions
of exhibit have been granted confidential treatment by the SEC.
- *
- This certification is deemed not filed for purposes of Section 18 of the Exchange Act or otherwise subject to the liability of that section, nor shall it be deemed incorporated by reference into any filing under the Securities Act of 1933, as amended or the Exchange Act.