Attached files
| file | filename |
|---|---|
| EX-23.1 - EXHIBIT 23.1 - KEY TECHNOLOGY INC | exhibit23093014q4.htm |
| EX-31.2 - EXHIBIT 31.2 - KEY TECHNOLOGY INC | exhibit312093014q4.htm |
| EX-31.1 - EXHIBIT 31.1 - KEY TECHNOLOGY INC | exhibit311093014q4.htm |
| EX-21 - EXHIBIT 21 - KEY TECHNOLOGY INC | exhibit21093014q4.htm |
| EX-32.1 - EXHIBIT 32.1 - KEY TECHNOLOGY INC | exhibit321093014q4.htm |
| EXCEL - IDEA: XBRL DOCUMENT - KEY TECHNOLOGY INC | Financial_Report.xls |
| EX-32.2 - EXHIBIT 32.2 - KEY TECHNOLOGY INC | exhibit322093014q4.htm |
UNITED STATES SECURITIES AND EXCHANGE COMMISSION
WASHINGTON, D.C. 20549
____________________________________________
FORM 10-K
ý | ANNUAL REPORT PURSUANT TO SECTION 13 OR 15(d) OF THE SECURITIES EXCHANGE ACT OF 1934 FOR THE FISCAL YEAR ENDED SEPTEMBER 30, 2014 |
OR
o | TRANSITION REPORT PURSUANT TO SECTION 13 OR 15(d) OF THE SECURITIES EXCHANGE ACT OF 1934 FOR THE TRANSITION PERIOD FROM ____ TO ____. |
Commission File No. 0-21820
_________________________________________
KEY TECHNOLOGY, INC.
(Exact name of registrant as specified in its charter)
Oregon (State or jurisdiction of incorporation or organization) | 93-0822509 (I.R.S. Employer Identification No.) |
150 Avery Street Walla Walla, Washington (Address of Principal Executive Offices) | 99362 (Zip Code) |
Registrant’s telephone number, including area code: (509) 529-2161
__________________________________________
Securities registered pursuant to Section 12(b) of the Act:
Title of each class Common Stock, no par value Preferred Stock Purchase Right | Name of each exchange on which registered The NASDAQ Global Market |
Securities registered pursuant to Section 12(g) of the Act:
None
Indicate by check mark if the registrant is a well-known seasoned issuer, as defined in Rule 405 of the Securities Act.
Yes ¨ No ý
Indicate by check mark if the registrant is not required to file reports pursuant to Section 13 or Section 15(d) of the Act.
Yes ¨ No ý
Indicate by check mark whether the Registrant (1) has filed all reports required to be filed by Sections 13 or 15(d) of the Securities Exchange Act of 1934 during the preceding 12 months (or for such shorter period that the Registrant was required to file such reports), and (2) has been subject to such filing requirements for the past 90 days. Yes ý No ¨
Indicate by check mark whether the registrant has submitted electronically and posted on its corporate Web site, if any, every Interactive Data File required to be submitted and posted pursuant to Rule 405 of Regulation S-T during the preceding 12 months (or for such shorter period that the registrant was required to submit and post such files). Yes ý No ¨
Indicate by check mark if disclosure of delinquent filers pursuant to Item 405 of Regulation S-K is not contained herein, and will not be contained, to the best of Registrant's knowledge, in definitive proxy or information statements incorporated by reference in Part III of this Form 10-K or any amendment to this Form 10-K. ý
Indicate by check mark whether the registrant is a large accelerated filer, an accelerated filer, a non-accelerated filer, or a smaller reporting company. See the definitions of “accelerated filer,” “large accelerated filer” and “smaller reporting company” in Rule 12b-2 of Exchange Act. (Check one):
Large accelerated filer o | Accelerated filer ý |
Non-accelerated filer o (Do not check if a smaller reporting company.) | Smaller reporting company o |
Indicate by check mark whether the registrant is a shell company (as defined in Rule 12b-2 of the Exchange Act).
Yes ¨ No ý
The aggregate market value of the Registrant's common stock held by non-affiliates on March 31, 2014 (based on the last sale price of such shares) was approximately $74,700,161.
There were 6,296,839 shares of the Registrant's common stock outstanding on December 5, 2014.
DOCUMENTS INCORPORATED BY REFERENCE
Parts of Registrant's Proxy Statement, dated on or about January 2, 2015, prepared in connection with the Annual Meeting of Shareholders to be held on February 4, 2015, are incorporated by reference into Part III of this Report.
KEY TECHNOLOGY, INC.
2014 ANNUAL REPORT ON FORM 10-K
TABLE OF CONTENTS
PAGE | ||
INFORMATION CONCERNING FORWARD-LOOKING STATEMENTS
From time to time, Key Technology, Inc. (“we," "us" or "our"), through its management, may make forward-looking public statements with respect to the Company regarding, among other things, expected future revenues or earnings, projections, plans, future performance, product development and commercialization, and other estimates relating to our future operations. Forward-looking statements may be included in reports filed under the Securities Exchange Act of 1934, as amended (the “Exchange Act”), in press releases, in our president's letter to shareholders, or in oral statements made with the approval of an authorized executive officer of the Company. The words or phrases “will likely result,” “are expected to,” “intends,” “is anticipated,” “estimates,” “believes,” “projects” or similar expressions are intended to identify “forward-looking statements” within the meaning of Section 21E of the Exchange Act and Section 27A of the Securities Act of 1933, as amended, as enacted by the Private Securities Litigation Reform Act of 1995.
Forward-looking statements are subject to a number of risks and uncertainties, the occurrence of any of which could cause the price of our common stock to fluctuate significantly, making it difficult for shareholders to resell common stock at a time or price they find attractive. We caution investors not to place undue reliance on our forward-looking statements, which speak only as of the date on which they are made. Our actual results may differ materially from those described in the forward-looking statements as a result of various factors, including those listed below:
• | adverse changes in general economic conditions and disruption in financial markets may adversely affect the business of our customers and our business and results of operations; |
• | ongoing uncertainty and volatility in the global economy may adversely affect our operating results; |
• | adverse economic conditions in the food processing industry, either globally or regionally, may adversely affect our revenues; |
• | the loss of any of our significant customers could reduce our revenues and profitability; |
• | significant investments in unsuccessful research and development efforts could materially adversely affect our business; |
• | industry consolidation could increase competition in the food processing equipment industry; |
• | we are subject to price competition that may reduce our profitability; |
• | the timing and significance of major orders could result in significant fluctuation in quarterly and annual operating results; |
• | the failure of our independent sales representatives to perform as expected would harm our net sales; |
• | we have made, or may make, acquisitions or enter into distribution agreements or similar business relationships that could disrupt our operations and harm our operating results; |
• | our international operations subject us to a number of risks that could adversely affect our revenues, operating results and growth; |
• | fluctuations in foreign currency exchange rates could result in unanticipated losses that could adversely affect our liquidity and results of operations; |
• | our existing and new products may not compete successfully in either current or new markets, which would adversely affect our sales and operating results; |
• | advances in technology by competitors may adversely affect our sales and profitability; |
• | our expansion into new markets, increasingly complex projects and applications, and integrated product offerings could increase our cost of operations and reduce gross margins and profitability; |
• | our inability to obtain products and components from suppliers would adversely affect our ability to manufacture and market our products; |
• | our information systems, computer equipment and information databases are critical to our business operations and any damage or disruptions could adversely affect our business and results of operations; |
• | our potential inability to retain and recruit experienced management and other key personnel, or the loss of key management personnel, may adversely affect our business and prospects for growth; |
• | the potential inability to protect our intellectual property, especially as we expand geographically, may adversely affect our competitive advantage; |
• | intellectual property-related litigation expenses and other costs resulting from infringement claims asserted against us by third parties may adversely affect our results of operations and our customer relations; |
• | our financing agreements contain restrictive and financial covenants that may adversely affect us; |
• | our dependence on certain suppliers may leave us temporarily without adequate access to raw materials or products; |
• | our operating results are seasonal and may further fluctuate due to severe weather conditions affecting the agricultural industry in various parts of the world; |
• | the limited availability and possible cost fluctuations of materials used in our products could adversely affect our gross margins; |
• | our reported results may be affected adversely by the implementation of new, or changes in the interpretation of existing, accounting principles or financial reporting requirements; and |
1
• | compliance with changing regulation of corporate governance and public disclosure will result in additional expenses to us and pose challenges for our management. |
Given these uncertainties, readers are cautioned not to place undue reliance on the forward-looking statements. We disclaim any obligation subsequently to revise or update forward-looking statements to reflect events or circumstances after the date of such statements or to reflect the occurrence of anticipated or unanticipated events.
PART I
ITEM 1. | BUSINESS. |
General
Key Technology was founded in 1948 as a local producer of vegetable processing equipment. We have evolved into a worldwide supplier of process automation solutions to the food processing industry and other industries such as tobacco and pharmaceuticals. We were incorporated in 1982 as a result of a management buyout of our predecessor organization.
We and our operating subsidiaries design, manufacture, sell and service process automation systems that process product streams of discrete pieces to improve safety and quality. These systems integrate electro-optical automated inspection and sorting systems with process systems that include specialized conveying and preparation equipment. We provide parts and service for each of our product lines to customers throughout the world.
Net sales for the year ended September 30, 2014 were $118.3 million compared with $136.8 million for fiscal 2013 and $115.2 million for fiscal 2012. We reported a net loss for fiscal 2014 of $5.4 million, or $0.86 per diluted share, compared with net earnings of $4.0 million, or $0.69 per diluted share, for fiscal 2013 and net earnings of $0.4 million, or $0.08 per diluted share, for fiscal 2012. Export and international sales for the fiscal years ended September 30, 2014, 2013 and 2012 accounted for 48%, 45% and 45% of net sales in each year, respectively. Total assets at September 30, 2014 were $98.3 million compared to $114.6 million at September 30, 2013.
Industry Background
Food Processing Industry
Our primary market is the food processing industry where we apply our processing knowledge and application expertise to help customers improve quality, increase yield, and reduce cost. Our integrated sorting, conveying, and process automation systems are sold to small, medium and large-sized food processing companies for a range of specialized applications. Food processors generally experience thin profit margins and, therefore, are focused on increasing profitability and efficiency in their processing plants by improving the performance of their equipment and processing lines. In addition, food processors recognize the value of new technology and continue to demand innovative equipment that addresses food safety, quality, and automation to drive productivity in their plants.
Our strategy is to offer equipment solutions that reduce reliance on manual inspection and address the common food processing industry problems associated with high labor costs, workforce shortages, inadequate yields, inconsistent product quality and food safety. In highly developed markets, including those in North America and Western Europe, the substitution of automated processes for manual labor is well underway. Food processors in these regions typically appreciate the value of replacing manual labor with automated systems and look for systems that will help maximize yields, product quality and food safety. In developing countries, interest in automation is rising as food processors in these regions increasingly strive to compete in a global economy by improving product quality and food safety.
Within the food processing industry, the greatest opportunities for automated inspection systems have been in potatoes, vegetables, and fruits where the frequency and severity of foreign material and defects is highly variable, depending on the countless factors that affect crops. In addition, dried fruit and tree nuts are high value products and processors increasingly demand inspection and automation to increase profitability. We believe that many additional applications for our automated inspection systems exist in other food processing markets.
The principal potato market served by our systems is potato strips (commonly referred to as french fries in the United States). Potato strips have historically accounted for a very large portion of the frozen potato products produced in the U.S. and, with the expansion of American-style fast food chains in other countries, this market is growing internationally. Although we
2
have successfully been diversifying into other food and non-food markets in recent years to reduce dependence on this market, potato strips remain an important market along with other potato products such as wedges, curly fries, formed products, whole potatoes and potato chips.
Other important markets within the food processing industry are fruits and vegetables, including both fresh-cut produce and processed products that may ultimately be canned or frozen for institutional and retail customers. Because foreign material and product defects plague these field-harvested products, automated sorting enhances the quality and safety of the product while improving yields and reducing labor costs. Our principal fruit and vegetable markets are fresh, frozen, canned and dehydrated green beans, corn, carrots, peas, onions, berries, cranberries, pears and peaches, as well as ready-to-eat fresh-cut salads.
As a result of the acquisition of Visys NV in early 2013, we are able to offer a more comprehensive suite of products that address the dried fruit and nut market. Nut processors strive to produce various products (shelled or unshelled) that are free of foreign material, extraneous vegetative matter or out-of-specification nuts to increase the value of their product. Numerous technologies and methodologies are applied at various steps in the processing line to further increase this value. The processor’s quality objectives are achieved with our range of chute-fed sorting systems and, when combined with our mechanical grading systems, create an integrated product package.
We believe that selected areas of the food processing industry will continue to present opportunities for growth. In general, food processing companies remain financially viable, but are increasingly coming under pressure to increase profitability and improve product safety while maintaining or reducing prices for their own products. By offering equipment that increases yields, enhances product quality and food safety, and results in reduced processing costs, we believe we are well positioned to satisfy the needs of the food processing industry.
Cyclical and seasonal fluctuations in the potato, fruit, and vegetable processing industries cause us to experience some predictable seasonality of orders and shipments. Typically, orders and shipments for this industry tend to be lower during our first two fiscal quarters of the year than during the second half of the fiscal year. Other, less seasonal markets that are served by the company include snack, bakery, dairy, poultry, and seafood products, as well as non-food markets.
Non-food Industries – Tobacco, Pharmaceuticals and Nutraceuticals
Processors, manufacturers and packagers in several non-food industries are interested in automated inspection systems that reduce costs, increase yields, and improve product quality and safety. Our primary non-food markets include the tobacco industry, pharmaceuticals and nutraceuticals.
The tobacco industry typically accounts for less than 5% of our net sales. With systems that remove non-tobacco-related material from primary processing lines and threshing lines, we help tobacco processors maximize product quality. We have an original equipment manufacturer distribution agreement with Hauni Maschinenbau AG, a leading supplier of equipment to the tobacco industry. The agreement gives Hauni exclusive rights to market our equipment to tobacco processors worldwide and makes us the sole supplier of optical sorting equipment to Hauni for the tobacco market.
In fiscal 2014, the pharmaceutical and nutraceutical industry, which is served by our pharmaceutical product line, SYMETIX®, also represented less than 5% of our net sales. SYMETIX’s optical inspection systems for softgels and tablets remove defects and foreign capsules and tablets from the product stream. These systems are of interest to brand owners, product manufacturers, and contract packers looking to assure product quality while reducing labor costs.
We own a 15% minority interest in Proditec SAS. Proditec, headquartered in France, is a leading manufacturer of automated, solid dose pharmaceutical inspection systems based on machine vision technology. With Proditec, we are promoting and selling inspection solutions in the pharmaceutical and nutraceutical markets.
3
Products
The following table sets forth sales by product category for the periods indicated (in thousands):
Fiscal Year Ended September 30, | |||||||||||||||||||||
2014 | 2013 | 2012 | |||||||||||||||||||
Automated inspection systems | $ | 55,829 | 47 | % | $ | 59,336 | 43 | % | $ | 46,586 | 40 | % | |||||||||
Process systems | 34,580 | 29 | % | 50,729 | 37 | % | 44,940 | 39 | % | ||||||||||||
Parts and service | 27,849 | 24 | % | 26,718 | 20 | % | 23,648 | 21 | % | ||||||||||||
Net sales | $ | 118,258 | 100 | % | $ | 136,783 | 100 | % | $ | 115,174 | 100 | % | |||||||||
Service and maintenance contracts are less than 10% of total net sales and are therefore summarized with parts and service.
The following table sets forth the percent of total gross margin contributed by each product category for the periods indicated:
Fiscal Year Ended September 30, | |||||||||
2014 | 2013 | 2012 | |||||||
Automated inspection systems | 48 | % | 44 | % | 40 | % | |||
Process systems | 16 | % | 28 | % | 28 | % | |||
Parts and service | 36 | % | 28 | % | 32 | % | |||
Total gross margin | 100 | % | 100 | % | 100 | % | |||
Automated Inspection Systems
Automated inspection systems are used in various applications to detect and remove defects and foreign material from the product stream and help processors improve quality and increase the value of their end product. Key offers a sophisticated range of digital sorting systems that recognize color, size, shape, structural properties, and chemical composition to detect the widest range of visible and invisible defects.
Depending on the needs of each application, our sorters can be designed with a combination of cameras and lasers to detect and remove a wide variety of defects and foreign material, which is an important contributor to food safety. When lasers are combined with high resolution cameras for superior shape, size, and color determination, the result is a high quality product sort. Advanced color and shape sorting can be accomplished with monochromatic or color cameras, coupled with powerful software algorithms. In addition, BioPrint® technology identifies defects and foreign material based on unique biological characteristics and achieves enhanced performance, even under high incoming defect loads, and detects invisible defects.
Sort-to-Grade™ technology for potato strip processing was introduced in January 2014 for our belt-fed sorters. This software-driven intelligence enables sorters to grade by count, sorting by length or size, accepting or rejecting each defective piece to control the quality of output to a defined grade, as defined by the processor.
Our popular belt-fed sorters - Optyx®, Tegra®, and Manta® - are primarily used in the fresh and frozen fruit, vegetable and potato products segments. Our chute-fed sorters, including the Visys Spyder®, Visys Python, and Visys Cayman®, and the jointly developed Taurys™, are ideal for sorting nuts, dried fruits, and frozen vegetables. Our other automated inspection systems include Veo™, an optical sorter designed specifically for seed corn; Tobacco Sorter™ systems used in tobacco threshing and primary processing; and ADR® automatic defect removal systems used in the potato strip industry.
In November 2013, the Company introduced VitiSort®, a new sorter designed for red wine grapes. This compact system, combines a MOG (material other than grape) removal shaker and optical sorting with an integral juice recovery system. The system removes any unwanted objects and other MOG from the product flow, which enables the winery to better control product quality.
We also offer automated inspection equipment for solid dose pharmaceuticals and nutraceuticals through our SYMETIX pharmaceutical product line. Available in a range of sizes, VeriSym® sorting systems inspect the color, size, and shape of tablets and softgels and automatically remove defects and foreign tablets or capsules from the product stream at rates of up to 1,000,000
4
tablets or capsules per hour. These inspection systems help product manufacturers and contract packers assure the quality of their finished product and are designed to replace batch processing systems historically used in this industry.
In July 2013, we signed an exclusive licensing agreement with EVK DI Kerschhaggl GmbH and Insort GmbH to deploy chemical imaging technology (CIT®) in our products, further enhancing our potato sorting capabilities. Additionally, an exclusive distribution agreement enables us to market Insort’s chemical imaging sorters to North American and global accounts in the potato industry.
We have a large installed base of automated inspection systems, which we support with upgrades to extend the life of the equipment and enable customers to continue operating at peak performance as technology advances. Upgrades often provide customers with a less capital intensive alternative to acquiring new automated inspection systems.
Process Systems
Conveying and processing equipment are utilized worldwide throughout many industries to move and process product within a production plant. The process systems group includes standard and custom designed equipment that conveys, dewaters, transfers, distributes, aligns, feeds, meters, separates, grades, cleans, washes, and polishes products. Our Smart Shaker® vibratory solutions, which include Iso-Flo®, Impulse®, and Horizon™ systems, combine gentle material handling with a wide variety of processing functions in addition to vibratory conveying. Rotary sizing and grading systems, Turbo-Flo® steam blanchers and SYMETIX equipment for pharmaceuticals and nutraceuticals, complete our conveying and processing equipment product line.
The mechanical sizing, sorting, separating, and grading equipment manufactured at the Company’s Redmond, Oregon facility is used in many food processing and fresh vegetable packing operations. These rotary sizing and grading technologies can remove oversized, undersized, and small irregular-shaped pieces of product from the line or separate product into predetermined size categories. Additionally, this equipment can remove field debris, broken pieces, seeds, juice, fines, and other targeted material.
Preparation Systems. We design and manufacture preparation systems to prepare a wide range of food products prior to cooking, freezing, canning, or other types of processing. Equipment in this group includes air cleaners, air coolers, vegetable metering and blending systems, and bulk handling equipment. This equipment represents our most mature product line. Sales of these solutions over the years have formed a customer base for sales of our other solutions and are also establishing a new customer base in developing markets. Preparation system revenues include a variety of third-party supplied equipment and installation services, which are sold as components of larger, integrated processing lines, for which we have assumed turn-key sales responsibility. In addition, the Company maintains an agreement with ABCO Industries to sell their thermal processing equipment through our distribution channels.
Line Solutions
Integrated Solutions. Our Integrated Solutions Group (ISG) provides integrated whole-line solutions. From pre-engineering and project definition to plant start-up, ISG offers complete turn-key solutions that can include the integration of third-party products along with Key’s sorting, conveying, and processing systems to meet the specific needs of each application. We leverage our industry expertise and strong engineering and project management capabilities to deliver complete integration services, all from a single source.
Parts and Service
We have a large installed base of inspection and processing systems, which generates potential business for our parts, service, and training programs. Our PROliance™ suite of support services, parts, protection plans and training solutions, provides spare parts and post-sale field and telephone-based repair services to support our customers’ routine maintenance requirements, seasonal equipment startup and winterization processes. Our field service personnel are geographically located around the world in locations close to customers enabling quick response time and regional technical support. We typically provide incidental system installation support services in the sale price of select systems, principally automated inspection systems.
RemoteMD™. RemoteMD is a real-time condition and monitoring and diagnostics analysis tool for G6 optical sorters - Manta, Optyx, and Tegra - as well as G6 ADR systems. RemoteMD proactively monitors the condition of the customer’s system, assesses the status, and alerts the customer if problems are detected. By automating detection and diagnosis, RemoteMD provides detailed information to our service technicians, which increases the first-time fix-rate, reduces in-plant service calls, speeds resolution time and enhances customer productivity. We offer three distinct levels of RemoteMD services as part of our comprehensive protection plans - SelectPRO, PlusPRO, and PremierPRO. Each of the three protection plans is sold via annual subscription.
5
Online Training. This program provides customers with an interactive multimedia curriculum covering selected optical inspection systems and vibratory conveyors. The flexible, web-based program offers a wide variety of self-paced training modules designed for operators, maintenance personnel, sanitation crews, supervisors, and others working with this equipment. Our Online Training Program includes modules that cover ADR hardware, Optyx hardware, Tegra hardware, G6 software, Iso-Flo vibratory conveyors, and a variety of industry-related compliance topics.
Research and Development
At September 30, 2014, our research and development department had 49 employees who conduct new product research and development and sustaining engineering for released products. Our technical staff includes electronic, optical, mechanical and software engineers, mathematicians and technical support personnel.
In fiscal 2014, our research and development expenses were approximately $11.6 million, compared to $9.6 million in fiscal 2013 and $8.3 million in fiscal 2012.
Manufacturing
We maintain manufacturing facilities in Walla Walla, Washington; Redmond, Oregon; Beusichem, The Netherlands; and Hasselt, Belgium. Our current manufacturing facilities and our product design and manufacturing processes integrate Computer Aided Engineering (CAE), Finite Element Analysis (FEA), Computer Aided Design (CAD), Computer Aided Manufacturing (CAM) and Computer Integrated Manufacturing (CIM) technologies. Manufacturing activities include process engineering; fabrication, welding, finishing and assembly of custom-designed stainless steel systems; camera and electronics assembly; subsystem assembly; and system test and integration. The following table provides a summary of our manufacturing locations and manufacturing floor space:
Location | Manufacturing Facility | Products/Services Produced |
Walla Walla, Washington | 132,000 square feet | Automated Inspection Systems Process Systems Parts and Service |
Redmond, Oregon | 17,000 square feet | Process Systems Parts and Service |
Beusichem, The Netherlands | 37,000 square feet | Process Systems Automated Inspection Systems Parts and Service |
Hasselt, Belgium | 13,000 square feet | Automated Inspection Systems Parts and Service |
We manufacture certain products to Underwriters Laboratories and United States Department of Agriculture standards. Certain of our products also comply with the Canadian Standards Association (CSA), European CE (Conformité Européene) and Electronic Testing Laboratory (ETL) safety standards. Certain products for the pharmaceutical/nutraceutical industry are FDA 21 CFR 11-compliant and designed using GAMP4 guidelines. Our domestic facilities were recertified to the ISO 9001:2008 standard in 2011.
Certain components and subassemblies included in our products are obtained from limited-source or sole-source suppliers. We attempt to ensure that adequate supplies are available to maintain manufacturing schedules. We may also use contract or third-party manufacturers to fulfill customer needs for ancillary products or equipment that we do not manufacture. We do not have long-term contracts with any of our suppliers. We also rely on third-party domestic and foreign suppliers for certain raw materials. Several of these suppliers are the single source of the raw material. We may be adversely affected in the event that these suppliers cease operations or if pricing terms become less favorable.
Sales and Marketing
We market our equipment worldwide both directly and through independent sales representatives. Sales by independent sales representatives generally account for between 20% and 30% of our annual consolidated net sales. In the United States, we operate sales offices in Walla Walla, Washington and Redmond, Oregon. Our international sales offices are: Key Technology B.V. and Visys N.V., which provide sales and service to European, Middle Eastern, Indian, and African customers; Key Technology Australia Pty Ltd., which provide sales and service to customers primarily in Australia and New Zealand; and Productos Key Mexicana S.
6
de R.L. de C.V., which provides sales and service to customers in Mexico, and Central and South America. We supply equipment from both product groups - automated inspection systems and process systems - to customers in our primary markets through common sales and distribution channels. In addition, we supply parts and service through our worldwide service organization.
Sales of most exports of products manufactured in the United States for shipment into international markets, other than Europe, have been denominated in U.S. dollars. Sales of products in Europe are typically denominated in Euros. As we expand our operations in Australia and Latin America, transactions denominated in the local currencies of these countries may increase. In connection with our export and international sales, we are subject to the risks of conducting business internationally, including unexpected changes in regulatory requirements; fluctuations in the value of the U.S. dollar, which could increase or decrease the sales prices in local currencies of our products in international markets; tariffs and other barriers and restrictions; and the requirements of complying with a variety of international laws. Additional information regarding domestic and international sales is set forth in Note 17 to the Company’s Consolidated Financial Statements for the fiscal year ended September 30, 2014.
During fiscal 2014, 2013 and 2012, sales to McCain Foods Limited represented approximately 10%, 11%, and 10% of total net sales, respectively. During fiscal 2013, sales to ConAgra Foods, Inc. represented 11% of total net sales. While we believe that our relationship with these customers is satisfactory, the loss of either of these customers could have a material adverse effect on our revenues and results of operations. Each of these customers represents a group of plants under common control. Generally, purchasing decisions for these customers are made at the individual plant level which may diversify the concentration of risk.
Backlog
Our backlog as of September 30, 2014 and September 30, 2013 was approximately $18.1 million and $25.2 million, respectively. We schedule production based on firm customer commitments and forecasted requirements. We include in backlog only those customer orders for which we have accepted purchase orders, or the equivalent.
Competition
The markets for automated inspection systems and process systems are highly competitive. We experience severe price competition across almost all our product lines. Other important competitive factors include performance, reliability, and customer support and service. We believe that we currently compete effectively with respect to these factors, although there can be no assurance that existing or future competitors will not introduce comparable or superior products at lower prices. Certain of our competitors may have substantially greater financial, technical, marketing and other resources. Other companies which sell products in certain of our markets include Heat & Control, Inc. and its subsidiaries; Tomra Systems ASA and its subsidiaries, BEST N.V. and Odenberg Inc.; Sortex Ltd.; Kiremko B.V.; Meyer Industries, Inc.; KMG Systems Ltd.; VDL Industrial Products B.V.; TNA Australia Pty. Ltd.; and BMA AG. We have also encountered additional smaller competitors entering our markets. As we enter new markets, we expect to encounter additional new competitors.
Patents and Trademarks
We currently hold 35 United States patents on various features of our products issued from 1994 through fiscal 2014, and 16 other national patents issued by other countries. The first of these patents will expire in fiscal 2015. Although we consider our patents to be important to our business, we believe these expirations will not have a significant effect on us. Of the numbers above, seven patents were issued in fiscal 2014. As of December 5, 2014, 23 United States patent applications and 41 other foreign national patent applications were pending. We have 63 registered trademarks and two pending application for trademarks.
We also attempt to protect our trade secrets and other proprietary information through proprietary information agreements and security measures with employees, consultants and others. The laws of certain countries in which our products are or may be manufactured or sold may not protect our products and intellectual property rights to the same extent as the laws of the United States.
Employees
At September 30, 2014, we had 553 full-time employees, including 314 in manufacturing and project engineering, 49 in research and development, 141 in marketing, sales and service, and 49 in general administration and finance. A total of 166 employees are located outside the United States. We also use temporary contract employees, which improves our ability to adjust manpower in response to changing demand for our products. Of the total number of employees at September 30, 2014, six were contract employees. None of our employees in the United States are represented by a labor union. The employees located at our facility in Beusichem, The Netherlands are represented by the Small Metal Union. We have never experienced a work stoppage, slowdown or strike.
7
Available Information
Our annual and quarterly reports and other filings with the United States Securities and Exchange Commission (“SEC”) are made available free of charge through the Investor Relations section of our website at www.key.net as soon as reasonably practicable after we file such material with the SEC. The information on or that can be accessed through our website is not a part of this Annual Report on Form 10-K.
8
ITEM 1A. | RISK FACTORS. |
In addition to the other information in this Annual Report on Form 10-K, the following risk factors should be considered carefully in evaluating our business because such factors may have a significant effect on our operating results and financial condition. As a result of the risk factors set forth below and the information presented elsewhere in this Annual Report on Form 10-K, actual results could differ materially from those included in any forward-looking statements.
Adverse changes in general economic conditions and disruption in financial markets may adversely affect the business of our customers and our business and results of operations.
Our business may be affected by uncertainties and general economic conditions beyond our control that may cause customers to defer or cancel new orders and sales commitments previously made. Uncertainty about the direction and relative strength of the economy in the United States and other important markets may be sufficient reason for customers to delay, defer or cancel purchase decisions, including decisions previously made. Economic difficulties in the United States and certain international markets could cause a decrease in the overall demand for our products.
Deterioration of national and global economic conditions and disruptions in credit and other financial markets could, among other things:
• | adversely affect our expansion plans, including possible acquisitions; |
• | impair the financial condition of some of our customers and suppliers, thereby increasing customer bad debts or non-performance by suppliers; |
• | adversely affect our ability to fund new product development necessary to meet future customer requirements; |
• | negatively affect global demand for our customers' products, particularly in the food industry, which could result in underutilization of our production facilities and a reduction of sales, operating income and cash flows; |
• | negatively affect our customers' ability to obtain financing, which could result in a reduction in sales, operating income and cash flows; |
• | negatively affect our return on cash and cash equivalents; |
• | make it more difficult or costly for us to obtain financing for our operations or investments; |
• | negatively affect the results of our risk management activities if we are required to record losses related to financial instruments or experience counterparty failure; |
• | require asset write-downs; or |
• | impair the financial viability of our insurers. |
The ongoing uncertainty and volatility in the global economy may adversely affect our operating results.
Our operations and performance depend on worldwide economic conditions. In particular, we may be affected by the continuing uncertainties associated with certain countries in the European Union and the austerity measures being implemented or contemplated. If global economic and market conditions, or economic and financial market conditions in Europe, the United States or other key markets, remain uncertain, persist, or deteriorate further, our customers may respond by suspending, delaying or reducing their capital expenditures, which may adversely affect our cash flows and results of operations. Furthermore, our customers may experience increased difficulty in obtaining credit to finance purchases of the Company's products. In addition, these conditions may affect the ability of our suppliers to provide goods and materials to us on a consistent and timely basis which may adversely affect our operations.
Adverse economic conditions in the food processing industry, either globally or regionally, may adversely affect our revenues.
The markets we serve, particularly in the food processing industry, are generally experiencing variable economic conditions. Additionally, varying consumer demand due to economic conditions or dietary trends, product supply, and excess plant capacity, most notably in the potato market, could result in reduced or deferred capital equipment purchases for our product lines. While we have reacted to these developments with applications directed toward the growing fresh vegetable and fruit industries as well as the pharmaceutical and nutraceutical industries, loss of business, particularly in the potato industry, would have a negative effect on our net sales and net earnings.
9
The loss of any of our significant customers could reduce our revenues and profitability.
We have significant, strategic customers and we anticipate that our operating results may continue to depend on these customers for the foreseeable future. The loss of any one of those customers, or a significant decrease in the volume of products they purchase from us, could adversely affect our revenues and materially adversely affect our profitability. Any difficulty in collecting outstanding amounts due from one of those customers may also harm our operating results. In addition, sales to any particular large customer may fluctuate significantly from quarter to quarter, causing fluctuations in our quarterly operating results.
Significant investments in unsuccessful research and development efforts could materially adversely affect our business.
The product solutions we offer are very complex, and we need to successfully develop new products in a global competitive environment. If we fail to accurately predict and meet future customer needs and preferences, fail to incorporate critical industry-leading technologies and solutions in our products, or fail to allocate our research and development funding to products with higher customer acceptance and growth prospects, we may find we have invested heavily in the development of products that do not lead to significant revenue. Failure to successfully develop new products may also cause existing or potential customers to choose competitors' products. Any of these events may reduce future revenues and adversely affect our competitive position. Even if we successfully innovate and develop new products and product enhancements, we may incur substantial costs in doing so, and our profitability may be reduced.
Industry consolidation could increase competition in the food processing equipment industry.
The food processing equipment industry has experienced recent consolidation. Consolidation by our competitors may enhance their production capacity, technological abilities, broaden their product lines and resources, and lower their cost structure and prices, causing us to be at a competitive disadvantage. Increased competition and our ability to respond effectively to any of these changing market conditions could result in significant price erosion, reduced revenue, lower margins, and loss of market share, any of which could adversely affect our net earnings.
We are subject to price competition that may reduce our profitability.
We face price sensitivity from customers as well as aggressive pricing by our competitors, particularly in periods of excess capacity. Recent consolidation among our primary competitors may also allow these competitors to compete more effectively on price. These conditions may require us to lower prices in order to be price-competitive. In addition, because of their purchasing volume, our larger customers can influence market participants to compete on price terms. Such customers also use their buying power to negotiate lower prices. Customers are also increasing the use of integrated supply chain sourcing solutions focused solely on immediate cost savings. If we are not able to offset resulting price reductions by improving operating efficiencies and reducing expenses, such price reductions may have an adverse effect on our profit margins and net earnings.
The timing and significance of major orders could result in significant fluctuation in quarterly and annual operating results.
The timing of our significant orders depends on a number of factors over which we may have little or no control, including the size and complexity of a potential order, the level of competition that we encounter in our sales activities, and our current and potential customers' internal budgeting and approval process. In addition, the industries we serve, particularly the potato market, have buying patterns that vary greatly between fiscal years. As a result, we may expend significant effort over a long period of time in an attempt to obtain an order, but ultimately not obtain the order, or the order ultimately received may be smaller than anticipated. Our orders from different customers vary from quarter to quarter, and a customer with a large order in one quarter may generate significantly lower orders in subsequent quarters. Due to the resulting fluctuations, we believe that quarter-to-quarter comparisons of our revenue and operating results may not be meaningful, and that these comparisons may not be an accurate indicator of our future performance. These fluctuations in orders will result in fluctuations in our annual operating results. Additonally, operating margins may be adversely affected by a reduction in sales or changes in product mix, and we may not be able to reduce our costs in a timely manner to adjust for the difference between actual and forecasted sales.
10
The failure of our independent sales representatives to perform as expected would harm our net sales.
Sales by independent sales representatives generally account for between 20% and 30% of our consolidated net sales. If our independent sales representatives fail to market, promote and sell our products adequately, our business will be adversely affected. Our independent sales representatives could reduce or discontinue sales of our products, sell competitor's product lines, or they may not devote adequate resources to selling our products in the volumes and within the time frames that we expect, any of which events could adversely affect our revenues and net earnings.
We have made, or may make, acquisitions or enter into distribution agreements or similar business relationships that could disrupt our operations and harm our operating results.
We have made, or may in the future make, acquisitions of businesses, or enter into distribution agreements or similar business relationships that offer products, services, or technologies that we believe would complement our business. These changes in our business present significant challenges and risks and there can be no assurances that we will manage these changes successfully. These changes in our business involve numerous risks, including:
• | significant potential expenditures of cash, stock, and management resources; |
• | difficulty achieving the potential financial and strategic benefits of the acquisition or business relationship; |
• | difficulties in integrating acquired operations or products, including the potential loss of key employees from the acquired business; |
• | difficulties of integrating different technologies into products and markets due to technological challenges; |
• | assumption of product liabilities, including warranty costs, for third-party products; |
• | increased costs due to required minimum purchase levels and commitments for payments to third parties; |
• | difficulties and costs associated with evaluating and integrating the information systems and internal control systems of the acquired business; |
• | possible future impairment of assets related to goodwill and other intangible assets resulting from an acquisition, and reduction in our future operating results from amortization of intangible assets; |
• | diversion of management's attention from our core business, including loss of management focus on marketplace development; |
• | adverse effects on existing business relationships with suppliers and customers, including the potential loss of suppliers and customers of the acquired business; |
• | assumption of liabilities, known and unknown, related to the acquired business in general, and litigation and other legal process involving the acquired business in particular, including intellectual property litigation risk; |
• | entering geographic areas or distribution channels in which we have limited or no prior experience; and |
• | those risks related to general economic and political conditions. |
There can be no assurance that attractive acquisition opportunities will be available to us, that we will be able to obtain financing for or otherwise consummate any acquisition, or that any acquisition that we do consummate will be successful.
Our international operations subject us to a number of risks that could adversely affect our revenues, operating results and growth.
We conduct business outside the United States, which subjects us to the risks inherent in international operations. In fiscal 2014, our international sales represented approximately 48% of our consolidated net sales, compared to approximately 45% of our consolidated net sales in fiscal 2013. Risks inherent in international operations include the following:
• | unexpected changes in regulatory and certification requirements; |
• | restrictive governmental actions (such as restrictions on the transfer or repatriation of funds and trade protection measures, including export duties and quotas, customs duties and tariffs, or trade barriers erected by either the United States or other countries where we do business); |
• | currency restrictions and exchange rate fluctuations; |
• | scrutiny of foreign tax authorities which could result in significant fines, penalties and additional taxes; |
• | changes in import or export licensing requirements; |
• | longer payment cycles; |
• | transportation delays; |
• | competitive pricing that we may experience internationally; |
• | challenges in implementing cost effective operating and manufacturing strategies in varied geographic regions; |
• | challenges in understanding how to effectively compete and meet customer requirements in different operating environments; |
11
• | ability to globalize solutions for our global customers; |
• | economic downturns, civil disturbances or political instability; |
• | geopolitical turmoil, including terrorism or war; |
• | difficulties and costs of staffing and managing geographically disparate operations; |
• | changes in labor standards; |
• | laws and business practices favoring local companies; |
• | limitations on our ability under local law to protect our intellectual property; |
• | changes in domestic and foreign tax rates and laws; and |
• | difficulty in obtaining sales representatives and servicing products in foreign countries, which may adversely affect sales in those countries. |
The occurrence of any of the above risks could adversely affect our revenues, operating results and growth.
Fluctuations in foreign currency exchange rates could result in unanticipated losses that could adversely affect our liquidity and results of operations.
We are exposed to foreign currency exchange rate fluctuations because a portion of our revenues, expenses, assets and liabilities are denominated in foreign currencies. Changes in foreign currency exchange rates affect our results of operations and financial position. We attempt to manage certain effects of foreign currency fluctuations by entering into short-term forward exchange contracts in situations where it is both possible and practical. In these instances, these contracts are designed to minimize specific foreign currency gains or losses, as the gains or losses on the derivative are intended to offset the losses or gains on the underlying exposure. However, these contracts do not cover our full exposure and, additionally, there is no guarantee that these forward contracts will fully protect against the foreign exchange fluctuations in the underlying exposure. Accordingly, we could experience foreign currency gains or losses that could have a material impact on our operating results.
Our existing and new products may not compete successfully in either current or new markets, which would adversely affect our sales and operating results.
Our future success and growth is dependent upon our ability to develop, manufacture, market, and sell products and services in certain food processing markets as well as to introduce new products into other existing and potential markets. Customers have also become increasingly concerned about their return on investment, energy conservation, sanitation and food safety, and market solutions need to be cognizant of these considerations. There can be no assurance we can successfully and profitably penetrate these potential markets or expand into new international markets with our current or future products. In addition, new product introductions and enhancements of existing products may reduce demand for our existing products or delay purchases by customers awaiting arrival of our new products. As new or enhanced products are introduced, we must successfully manage the transition from existing products. There are also inherent risks in developing new technologies, entering new markets, and expanding in our existing markets including:
• | length of time and cost for development of these technologies and markets; |
• | development of the technological capability to address the requirements and performance specifications of new and existing markets; |
• | our ability to manufacture our products in various geographies, which may affect our success in certain emerging markets; |
• | our ability to design products for ease of manufacturability and service; |
• | our ability to manufacture and sell our new products at sustainable gross margins; |
• | product reliability issues related to both new technology and adapting existing products to operate in new or rugged operating environments at customer sites; |
• | design or manufacturing flaws that may lead to increased product liability or warranty claims; and |
• | failure to meet performance specifications, which could damage our profitability and the reputation of our products. |
Advances in technology by competitors may adversely affect our sales and profitability.
The rapidly changing needs of the markets for our products demand constant innovation. Competitors may be able to adapt or develop technologies to create or enhance product offerings that directly compete with our products. Advances in technology may also remove some barriers to market entry, enabling additional competitors to enter our markets. These innovations could cause our products to become less competitive or obsolete, and decrease our sales and profits, having a material adverse effect on our business and financial condition. There can be no assurance that we will be able to continue to develop new products to compete effectively in the future.
12
Our expansion into new markets, increasingly complex projects and applications, and integrated product offerings could increase our cost of operations and reduce gross margins and profitability.
Our growth strategy includes expansion into new product and geographic markets, complex projects and applications, and integrated product offerings to provide turnkey solutions to customers. As a result, we may encounter new types of competition and be required to develop new sales channels. Development of such markets and turnkey solutions is likely to require sustained investment, increase our cost of sales, reduce our gross margins to the extent products purchased from others are integrated into our product offerings, reduce margins due to competition or market conditions, and result in overall reduced profitability. We are also likely to encounter technical challenges and increased costs related to the integration of products from multiple vendors, adaptation and installation of products in larger and more complex plants, ensuring product performance in more difficult operating environments, and meeting unfamiliar customer requirements and performance specifications. Despite rigorous testing and quality processes, newly developed or enhanced products or solutions may encounter challenges during or after their initial introduction or installation. We may also encounter increased warranty costs, performance issues and liability risks from products we sell but do not manufacture.
Our inability to obtain products and components from suppliers would adversely affect our ability to manufacture and market our products.
In certain instances, we depend on original equipment manufacturers and other suppliers of components included in our products for the timely delivery of our integrated turnkey products. As we develop new products and solutions, we may become more dependent on original equipment manufacturers in the future. Such suppliers may experience problems beyond our control, which may disrupt our ability to deliver our products to our customers and damage our relationships with current and future customers. These risks may include varying lead times, supplier capacity, delayed shipments, and quality control problems. In addition, supplier pricing may change and be higher than anticipated. As a result of these and other factors, our revenues and profit margins may be adversely affected.
Our information systems, computer equipment and information databases are critical to our business operations and any damage or disruptions could adversely affect our business and results of operations.
Our operations are dependent on our ability to protect our information systems, computer equipment and information databases from systems failures. Such failures could be caused by internal or external events, such as incursions by intruders or hackers, computer viruses, failures in hardware or software, power fluctuations or cyber terrorists. The failure of these systems to perform as anticipated for any reason or any significant breach of security could disrupt our business and result in numerous adverse consequences, including reduced effectiveness and efficiency of operations, increased overhead costs and loss of important information, which could have a material adverse effect on our business and results of operations.
Our potential inability to retain and recruit experienced management and other key personnel, or the loss of key management personnel, may adversely affect our business and prospects for growth.
Our success depends in part on the skills and experience of our employees. The loss of services of such employees could adversely affect our business until suitable replacements can be found. In addition, our corporate headquarters is located in Walla Walla, Washington, a small, relatively remote geographic location. As such, there may be a limited number of individuals locally with the requisite skill and experience, and we have from time-to-time experienced difficulty recruiting individuals from larger metropolitan areas. The seasonal and cyclical nature of our business may also adversely affect our ability to attract suitable replacements.
Consequently, we may not be able to retain and recruit a sufficient number of qualified individuals on acceptable terms to maintain our business or achieve planned growth. Our success also depends, to a significant degree, upon the continued individual and collective contributions of our management team. A limited number of individuals have primary responsibility for managing our business, including our relationships with key customers. These individuals are integral to our success based on their expertise and knowledge of our business and products. The loss of the services of members of the management team and other key employees for any reason could have a material adverse effect on our business.
13
The potential inability to protect our intellectual property, especially as we expand geographically, may adversely affect our competitive advantage.
Our competitive position may be affected by our ability to protect our proprietary technology. We have obtained certain patents and have filed a number of patent applications. We also anticipate filing patent applications for protection of our future products and technology. There can be no assurance that any such patents will provide meaningful protection for our product innovations, or that the issuance of a patent will give us any material advantage over our competition in connection with any of our products. We may experience additional intellectual property risks in international markets where we may lack patent protection or experience challenges to our intellectual property. The patent laws of other countries differ from those of the U.S. as to the patentability of our products and processes. Moreover, the degree of protection afforded by foreign patents may be different from that of U.S. patents.
Intellectual property-related litigation expenses and other costs resulting from infringement claims asserted against us by third parties may adversely affect our results of operations and our customer relations.
The technologies used by us may infringe the patents or proprietary technology of others. There is also a trend toward aggressive, strategic enforcement of intellectual property rights. As a result, there is a risk that we would be subject to infringement claims which, regardless of validity, could:
• | be expensive, time consuming and divert management attention away from normal business operations; |
• | require us to pay monetary damages or enter into non-standard royalty and licensing agreements; |
• | require us to modify our product sales and development plans; or |
• | require us to satisfy indemnification obligations to our customers. |
Regardless of whether these claims have any merit, they can be burdensome to defend or settle and can harm our business and reputation.
Our financing agreements contain restrictive and financial covenants that may adversely affect us.
Certain of our financing agreements require us to comply with various restrictive covenants and contain financial covenants that require us to comply with specified financial ratios and tests. Our failure to meet these covenants could result in default under these agreements. At September 30, 2014, we were not in compliance with certain of our loan covenants. In the event of default and our inability to obtain a waiver of the default, all amounts outstanding under the loan agreements could be declared immediately due and payable and we would lose the ability to provide customers standby letters of credit and lose our ability to utilize short-term credit facilities. As a result, the failure to comply with these covenants could adversely affect our results of operations and financial condition.
Our dependence on certain suppliers may leave us temporarily without adequate access to raw materials or products.
We rely on third-party domestic and foreign suppliers for certain raw materials. Several of these suppliers are the single source of the raw material. As we develop new and more technologically advanced products, our reliance on single source providers may increase. We do not have long-term contracts with any supplier. We may be adversely affected in the event that these suppliers cease operations or if pricing terms become less favorable. The loss of a key vendor may force us to purchase our necessary raw materials and components in the open market, which may not be possible or may be at higher prices, until we could secure another source. There is no assurance that the terms of any subsequent supply arrangements we may enter into would be as favorable as the supply arrangements we currently have in place. If we are unable to replace a key supplier, we may face delays in delivering finished products, which could have an adverse effect on our sales, financial performance and reputation.
Our operating results are seasonal and may further fluctuate due to severe weather conditions affecting the agricultural industry in various parts of the world.
A large portion of our customer base processes agricultural products and its demand for our products and solutions fluctuates seasonally. These fluctuations can be independent of the effects of changes in general economic conditions. Consequently, we generally experience lower sales and net income in our first two fiscal quarters. As a result of these seasonal and quarterly fluctuations, comparisons of our sales and operating results between different quarters within a single fiscal year may not necessarily provide meaningful comparisons.
14
In addition, in the event of severe weather conditions, geological events or other natural disasters that negatively affect the production of growers, such as prolonged droughts, serious floods or earthquakes, and crop diseases, the food processing industry may not invest in a particular year or years in new equipment in the affected locations. As a result, our revenues, results of operations and cash flows could be materially adversely affected.
The limited availability and possible cost fluctuations of materials used in our products could adversely affect our gross margins.
Certain basic materials, such as stainless steel, are used extensively in our product fabrication processes. Such basic materials have, in the past, been subject to worldwide shortages or price fluctuations related to the supply of, or demand for, raw materials, such as nickel, which are used in their production by our suppliers. A significant increase in the price or decrease in the availability of one or more of these components, subassemblies or basic materials could adversely affect our results of operations.
Our reported results may be affected adversely by the implementation of new, or changes in the interpretation of existing, accounting principles or financial reporting requirements.
Our financial reporting complies with Generally Accepted Accounting Principles (“GAAP”) in the United States, and GAAP is subject to change over time. If new rules or interpretations of existing rules require us to change our financial reporting, our reported results of operations and financial condition could be affected substantially by the new requirements, which could include requirements to restate historical financial statements, and our management may need to devote significant time and financial resources to comply with evolving standards, which may lead to increased general and administrative expenses and a diversion of management time and attention.
Compliance with changing regulation of corporate governance and public disclosure will result in additional expenses to us and pose challenges for our management.
Changing laws, regulations and standards relating to corporate governance and public disclosure, including the Dodd-Frank Wall Street Reform and Consumer Protection Act and the rules and regulations promulgated under that act, the Sarbanes-Oxley Act and SEC regulations, have created uncertainty for public companies and significantly increased the costs and risks associated with accessing the U.S. public markets. Our management will need to devote significant time and our financial resources to comply with both existing and evolving standards for public companies, which will lead to increased general and administrative expenses and a diversion of management time and attention.
ITEM 1B. | UNRESOLVED STAFF COMMENTS |
None.
15
ITEM 2. | PROPERTIES |
We own or lease the following properties:
Location | Purpose | Square Feet | Owned or Leased | Lease Expires | Renewal Period |
Walla Walla, Washington | Corporate office, manufacturing, research and development, sales and marketing, administration | 173,000 | Owned | n/a | n/a |
Walla Walla, Washington | Customer Visitor Center, equipment demonstration facility | 31,500 | Leased | 2015 | Two five-year renewal periods |
Redmond, Oregon | Manufacturing, research and development, sales, administration | 19,000 | Leased | 2022 | Two five-year renewal periods |
Beusichem, The Netherlands | Manufacturing, sales and marketing, administration | 45,000 | Leased | 2020 | Five years |
Beusichem, The Netherlands | Warehouse | 11,000 | Leased | 2020 | Five years |
Hasselt, Belgium | Manufacturing, sales and marketing, research and development, administration | 19,500 | Leased | 2016 | Three years |
We also have leased office space for sales and service and other activities in Walla Walla, Washington; Sacramento, California; Dingley, Australia; Querétaro, Mexico; and Rotselaar and Hasselt, Belgium.
We consider all of our properties suitable for the purposes for which they are used.
ITEM 3. | LEGAL PROCEEDINGS. |
From time-to-time the Company is named as a defendant in legal proceedings arising out of the normal course of its business. As of December 5, 2014, the Company was not a party to any material legal proceedings.
ITEM 4. | MINE SAFETY DISCLOSURE. |
Not Applicable.
16
PART II
ITEM 5. | MARKET FOR REGISTRANT'S COMMON EQUITY, RELATED STOCKHOLDER MATTERS AND ISSUER PURCHASES OF EQUITY SECURITIES. |
Market Information
Shares of our common stock are quoted on The NASDAQ Global Market under the symbol “KTEC”. The following table shows the high and low sales prices per share of our common stock, as reported on NASDAQ, by quarter for the two most recent fiscal years ending September 30, 2014:
Stock price by quarter | High | Low | ||||||
Fiscal year ended September 30, 2014 | ||||||||
First Quarter | $ | 15.40 | $ | 13.56 | ||||
Second Quarter | $ | 14.74 | $ | 10.75 | ||||
Third Quarter | $ | 14.70 | $ | 11.50 | ||||
Fourth Quarter | $ | 13.25 | $ | 11.95 | ||||
Fiscal year ended September 30, 2013 | ||||||||
First Quarter | $ | 10.71 | $ | 8.19 | ||||
Second Quarter | $ | 13.09 | $ | 10.14 | ||||
Third Quarter | $ | 16.40 | $ | 12.35 | ||||
Fourth Quarter | $ | 15.50 | $ | 12.21 | ||||
We had approximately 1,352 beneficial owners of our common stock, of which 133 are of record, as of December 5, 2014.
We have not historically paid dividends on our common stock. The board of directors presently intends to continue its policy of retaining earnings for reinvestment in our operations.
Issuer Purchases of Equity Securities
The following table provides information about purchases made by us or on our behalf during the quarter ended September 30, 2014 of equity securities registered by us under Section 12 of the Exchange Act.
Period | Total Number of Shares Purchased(1) | Average Price Paid per Share | Total Number of Shares Purchased as Part of Publicly Announced Plans or Programs | Maximum Number of Shares that May Yet Be Purchased Under the Plans or Programs | |||||||
July 1-31, 2014 | — | — | — | ||||||||
August 1-31, 2014 | 110 | $ | 13.16 | — | |||||||
September 1-30, 2014 | — | — | — | ||||||||
Total | 110 | $ | 13.16 | — | 429,202(2) | ||||||
(1) | Includes shares of restricted stock surrendered to satisfy tax withholding obligations by plan participants under our employee stock incentive plans. The shares were subsequently canceled. |
(2) | We initiated a new stock repurchase program effective May 30, 2012. We were authorized to purchase up to 500,000 shares of our common stock under the program. The timing of any repurchases and the exact number of shares of common stock to be purchased will be determined by us and will depend on market conditions and other factors. The program does not incorporate a fixed expiration date. |
17
STOCK PERFORMANCE GRAPH
COMPARISON OF FIVE-YEAR CUMULATIVE TOTAL RETURN
AMONG KEY TECHNOLOGY, INC., THE RUSSELL MICROCAP INDEX, AND PEER GROUP
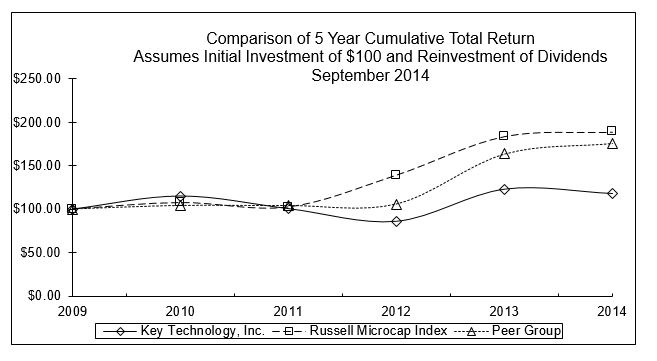
2009 | 2010 | 2011 | 2012 | 2013 | 2014 | |||||||||||||
Key Technology, Inc. | $ | 100.00 | $ | 114.84 | $ | 100.44 | $ | 86.04 | $ | 122.67 | $ | 117.69 | ||||||
Russell Microcap Index | 100.00 | 107.43 | 102.24 | 139.30 | 184.05 | 189.17 | ||||||||||||
Peer Group | 100.00 | 104.03 | 103.89 | 105.75 | 163.61 | 175.92 | ||||||||||||
PEER GROUP: Cognex Corporation, Perceptron, Inc., Flir Systems, Inc., John Bean Technologies Corporation, Tomra Systems, Inc., Isra Vision AG.
18
ITEM 6. | SELECTED FINANCIAL DATA. |
The selected consolidated financial information set forth below for each of the five years in the period ended September 30, 2014 has been derived from our audited consolidated financial statements. The information below should be read in conjunction with Management’s Discussion and Analysis of Financial Condition and Results of Operations and our Consolidated Financial Statements and the Notes thereto as provided in Item 7 and Item 8, respectively, of this Annual Report on Form 10-K.
Fiscal Year Ended September 30, | |||||||||||||||||||||
2014 | 2013 | 2012 | 2011 | 2010 | |||||||||||||||||
(in thousands, except per share data) | |||||||||||||||||||||
Statement of Operations Data: | |||||||||||||||||||||
Net sales | $ | 118,258 | $ | 136,783 | $ | 115,174 | $ | 116,328 | $ | 115,804 | |||||||||||
Cost of sales | 83,961 | 90,739 | 79,339 | 78,531 | 75,651 | ||||||||||||||||
Gross profit | 34,297 | 46,044 | 35,835 | 37,797 | 40,153 | ||||||||||||||||
Operating expenses | 42,309 | 40,213 | 34,867 | 35,310 | 34,896 | ||||||||||||||||
Gain (loss) on disposition of assets | 7 | 42 | (15 | ) | 4 | 77 | |||||||||||||||
Income (loss) from operations | (8,005 | ) | 5,873 | 953 | 2,491 | 5,334 | |||||||||||||||
Other income (expense) | (242 | ) | (460 | ) | (359 | ) | (542 | ) | (172 | ) | |||||||||||
Earnings (loss) from continuing operations before income taxes | (8,247 | ) | 5,413 | 594 | 1,949 | 5,162 | |||||||||||||||
Income tax (benefit) expense | (2,834 | ) | 1,402 | 145 | 495 | 1,524 | |||||||||||||||
Net earnings (loss) | $ | (5,413 | ) | $ | 4,011 | $ | 449 | $ | 1,454 | $ | 3,638 | ||||||||||
Earnings (loss) per share | – basic | $ | (0.86 | ) | $ | 0.69 | $ | 0.08 | $ | 0.27 | $ | 0.69 | |||||||||
– diluted | $ | (0.86 | ) | $ | 0.69 | $ | 0.08 | $ | 0.27 | $ | 0.69 | ||||||||||
Cash dividends per share | $ | — | $ | — | $ | — | $ | — | $ | — | |||||||||||
Shares used in per share calculation | – basic | 6,295 | 5,836 | 5,390 | 5,311 | 5,277 | |||||||||||||||
– diluted | 6,295 | 5,855 | 5,399 | 5,329 | 5,293 | ||||||||||||||||
Balance Sheet Data: | |||||||||||||||||||||
Cash and cash equivalents and short-term investments | $ | 9,741 | $ | 17,601 | $ | 23,755 | $ | 28,754 | $ | 29,096 | |||||||||||
Working capital | 38,203 | 42,338 | 44,136 | 42,484 | 41,475 | ||||||||||||||||
Property, plant and equipment, net. | 16,652 | 17,259 | 18,370 | 19,433 | 16,821 | ||||||||||||||||
Total assets | 98,345 | 114,624 | 86,354 | 94,405 | 91,267 | ||||||||||||||||
Current portion of long-term debt | 804 | 871 | 364 | 345 | 333 | ||||||||||||||||
Long-term debt, less current portion | 4,733 | 5,612 | 4,833 | 5,197 | 5,542 | ||||||||||||||||
Shareholders' equity | 68,168 | 73,125 | 59,430 | 58,774 | 56,338 | ||||||||||||||||
19
ITEM 7. | MANAGEMENT'S DISCUSSION AND ANALYSIS OF FINANCIAL CONDITION AND RESULTS OF OPERATIONS. |
Introduction
We and our wholly-owned subsidiaries design, manufacture and sell process automation systems integrating electro-optical inspection, sorting and process systems. We manufacture products in Walla Walla, Washington; Redmond, Oregon; Beusichem, The Netherlands; and Hasselt, Belgium.
Overview
Sales decreased $18.5 million, or 13.5%, to $118.3 million for the year ended September 30, 2014 compared with $136.8 million for fiscal 2013, while orders decreased $16.5 million, or 13.0%, in fiscal 2014 compared with fiscal 2013. We reported a net loss for fiscal 2014 of $5.4 million, or $0.86 per diluted share, compared with net earnings of $4.0 million, or $0.69 per diluted share, for fiscal 2013. Net earnings decreased in fiscal 2014 compared to fiscal 2013 as a result of an $11.7 million decrease in gross profit, and higher operating expenses of $42.3 million, or 35.8% of net sales, compared to $40.2 million, or 29.4% of net sales, for fiscal 2013. The decrease in gross margins to 29.0% in fiscal 2014 from 33.7% in fiscal 2013 reflected less favorable changes in the product mix, less efficient factory utilization due to lower sales and production volumes, and charges related to the cost reduction initiative, partially offset by lower warranty and customer support costs. Operating expenses increased $2.1 million, or 5.2%, in fiscal 2014 as compared to fiscal 2013 due to the inclusion of Visys operating expenses, including the amortization of intangible assets, for the entire fiscal year, increased research and development expenses related to developing new technology solutions, charges related to the cost reduction initiatives, and litigation settlement charges and the related legal costs.
Orders for fiscal 2014 were $110.5 million as compared to $126.9 million in the prior year. The decreases were primarily due to large orders in the processed potato market, which were received in fiscal 2013 but did not recur in fiscal 2014. Orders for automated inspection systems decreased 10%, process system orders decreased 27%, and parts and service orders increased 3% in fiscal 2014 compared to the prior fiscal year.
Our dependence on order volumes from large strategic customers in the processed potato and vegetable markets makes our business vulnerable to short-term fluctuations in revenue. As such, it remains typical for order and backlog quantities to vary on a quarter-by-quarter basis. We expect that our new developments and market expansion in our core and high-potential global adjacencies will enable us to drive a more stable growth revenue stream.
As we move forward, we are leveraging the investments made in previous years to augment the solid foundation we are building. These investments, coupled with our focus on achieving our objectives, are anticipated to propel profitable growth. We expect year-over-year double-digit bookings growth and we are confident in returning to profitability in fiscal 2015. We see activity starting to return in the processed potato industry, most likely during the latter half of fiscal 2015. We also anticipate opportunities for growth in our processed fruit and vegetable, and nuts and dried fruit markets globally. In addition, we expect to begin realizing positive impact from our new developments in late fiscal 2015. Aligned with our focus on profitability and shareholder value, we are continuing to take proactive steps to drive down operating expense levels and, most notably, we expect R&D expense to return to more normalized run rates of 6% to 8% of sales in fiscal 2015 as we bring our new developments to market. We continue to plan for an annualized business model of revenues in the area of $160 million to $170 million in fiscal year 2017, along with gross margins of 36%, and EBITDA of $18 million to $19 million. Six specific initiatives will be critical to our efforts to accomplish our growth objectives:
1. | Introducing innovative and differentiated technology, capabilities and solutions |
2. | Growing core market share in Europe, North America, and other geographic regions through existing and new insertion points |
3. | Penetrating global, high-potential adjacent markets |
4. | Leveraging global strategic customer opportunities |
5. | Improving operating margins through new solutions, efficiencies and scale |
6. | Developing strategic partnerships |
20
Application of Critical Accounting Policies
We have identified our critical accounting policies, the application of which may materially affect our financial statements, either because of the significance of the financial statement item to which they relate, or because they require management judgment to make estimates and assumptions in measuring, at a specific point in time, events which will be settled in the future. The critical accounting policies, judgments and estimates which management believes have the most significant effect on the financial statements are set forth below:
• | Revenue recognition |
• | Allowances for doubtful accounts |
• | Valuation of inventories |
• | Long-lived assets |
• | Allowances for warranties |
• | Accounting for income taxes |
Management has discussed the development, selection and related disclosures of these critical accounting estimates with the Audit Committee of our Board of Directors.
Revenue Recognition. We recognize revenue when persuasive evidence of an arrangement exists, delivery has occurred or services have been provided, the sale price is fixed or determinable, and collectability is reasonably assured. Additionally, we sell our goods on terms which transfer title and risk of loss at a specified location, typically shipping point, port of loading or port of discharge, depending on the final destination of the goods. Accordingly, revenue recognition from product sales occurs when all criteria are met, including transfer of title and risk of loss, which occurs either upon shipment by us or upon receipt by customers at the location specified in the terms of sale. Sales of system upgrades are recognized as revenue upon completion of the conversion of the customer’s existing system when this conversion occurs at the customer site. Revenue earned from services (maintenance, installation support, and repairs) is recognized ratably over the contractual period or as the services are performed. If any contract provides for both equipment and services (multiple deliverables), the sales price is allocated to the various elements based on the relative selling price. Each element is then evaluated for revenue recognition based on the previously described criteria. We typically have a very limited number of contracts with multiple deliverables and they are not material to the financial statements. Our sales arrangements provide for no other significant post-shipment obligations.
If all conditions of revenue recognition are not met, we defer revenue recognition. In the event of revenue deferral, the sale value is not recorded as revenue to us, accounts receivable are reduced by any related amounts owed by the customer, and the cost of the goods or services deferred is carried in inventory. In addition, we periodically evaluate whether an allowance for sales returns is necessary. Historically, we have experienced few sales returns. We account for cash consideration (such as sales incentives) that are given to customers or resellers as a reduction of revenue rather than as an operating expense unless an identified benefit is received for which fair value can be reasonably estimated. We believe that revenue recognition is a “critical accounting estimate” because our terms of sale vary significantly, and management exercises judgment in determining whether to recognize or defer revenue based on those terms. Such judgments may materially affect net sales for any period. Management exercises judgment within the parameters of accounting principles generally accepted in the United States of America (GAAP) in determining when contractual obligations are met, title and risk of loss are transferred, the sales price is fixed or determinable and collectability is reasonably assured. At September 30, 2014, we had invoiced $1.9 million, compared to $4.0 million at September 30, 2013, for which we have not recognized revenue.
Allowances for doubtful accounts. We have established allowances for doubtful accounts for specifically identified, as well as anticipated, doubtful accounts based on credit profiles of customers, current economic trends, contractual terms and conditions, and customers’ historical payment patterns. Factors that affect collectability of receivables include general economic or political factors in certain countries that affect the ability of customers to meet current obligations. We actively manage our credit risk by using an independent credit rating and reporting service, by requiring certain percentages of down payments, and by requiring secured forms of payment for customers with uncertain credit profiles or located in certain countries. Forms of secured payment could include irrevocable letters of credit, bank guarantees, third-party leasing arrangements or EX-IM Bank guarantees, each using Uniform Commercial Code filings, or the like, with governmental entities where possible. We believe that the accounting estimate related to allowances for doubtful accounts is a “critical accounting estimate” because it requires management judgment in making assumptions relative to customer or general economic factors that are outside our control. As of September 30, 2014, the balance sheet included allowances for doubtful accounts of $415,000 as compared to $296,000 at September 30, 2013. Amounts charged to bad debt expense for fiscal 2014 and 2013 were $163,000 and $2,000, respectively. Actual charges to the allowance for doubtful accounts for fiscal 2014 and 2013 were $30,000 and $26,000, respectively. If we experience actual bad debt expense in excess of estimates, or if estimates are adversely adjusted in future periods, the carrying value of accounts receivable would decrease and charges for bad debts would increase, resulting in decreased net earnings.
21
Valuation of inventories. Inventories are stated at the lower of cost or market. Our inventory includes purchased raw materials, manufactured components, purchased components, service and repair parts, work in process, finished goods and demonstration equipment. Write downs for excess and obsolete inventories are made after periodic evaluation of historical sales, current economic trends, forecasted sales, estimated product lifecycles and estimated inventory levels. The factors that contribute to inventory valuation risks are our purchasing practices, electronic component obsolescence, accuracy of sales and production forecasts, introduction of new products, product lifecycles and the associated product support. We actively manage our exposure to inventory valuation risks by maintaining low safety stocks and minimum purchase lots, using just in time purchasing practices, managing product end-of-life issues brought on by aging components or new product introductions, and by using inventory minimization strategies such as vendor-managed inventories. We believe that the accounting estimate related to valuation of inventories is a “critical accounting estimate” because it is susceptible to changes from period-to-period due to the requirement for management to make estimates relative to each of the underlying factors ranging from purchasing to sales to production to after-sale support. At September 30, 2014, cumulative inventory adjustments to lower of cost or market totaled $4.0 million compared to $3.5 million as of September 30, 2013. Amounts charged to expense to record inventory at lower of cost or market for fiscal 2014 and 2013 were $1.5 million and $1.7 million, respectively. Actual charges to the cumulative inventory adjustments upon disposition or sale of inventory were $986,000 and $867,000 for fiscal 2014 and 2013, respectively. If actual demand, market conditions or product lifecycles are adversely different from those estimated by management, inventory adjustments to lower market values would result in a reduction to the carrying value of inventory, an increase in inventory write-offs, and a decrease to gross margins.
Long-lived assets. We regularly review all of our long-lived assets, including property, plant and equipment, and amortizable intangible assets, for impairment whenever events or changes in circumstances indicate that the carrying value may not be recoverable. If the total of projected future undiscounted cash flows is less than the carrying amount of these assets, an impairment loss based on the excess of the carrying amount over the fair value of the assets is recorded. In addition, goodwill is reviewed based on its fair value at least annually. As of September 30, 2014, we held $36.5 million of long-lived assets, net of depreciation and amortization. There were no material changes in our long-lived assets that would result in an adjustment of the carrying value for these assets. Estimates of future cash flows arising from the utilization of these long-lived assets and estimated useful lives associated with the assets are critical to the assessment of recoverability and fair values. We believe that the accounting estimate related to long-lived assets is a “critical accounting estimate” because: (1) it is susceptible to change from period-to-period due to the requirement for management to make assumptions about future sales and cost of sales generated throughout the lives of several product lines over extended periods of time; and (2) the potential effect that recognizing an impairment could have on the assets reported on our balance sheet and the potential material adverse effect on reported earnings. Changes in these estimates could result in a determination of asset impairment, which would result in a reduction to the carrying value and a reduction to net earnings in the affected period.
Allowances for warranties. Our products are covered by standard warranty plans included in the price of the products ranging from 90 days to five years, depending upon the product and contractual terms of sale. The majority of the warranty periods are for one year or less. We establish allowances for warranties for specifically identified, as well as anticipated, warranty claims based on contractual terms, product conditions and actual warranty experience by product line. Our products include both manufactured and purchased components and, therefore, warranty plans include third-party sourced parts which may not be covered by the third-party manufacturer’s warranty. We actively manage our quality program by using a structured product introduction plan, process monitoring techniques utilizing statistical process controls, vendor quality metrics, and feedback loops to communicate warranty claims to designers and engineers for remediation in future production. We believe that the accounting estimate related to allowances for warranties is a “critical accounting estimate” because: (1) it is susceptible to significant fluctuation period-to-period due to the requirement for management to make assumptions about future warranty claims relative to potential unknown issues arising in both existing and new products, which assumptions are derived from historical trends of known or resolved issues; and (2) risks associated with third-party supplied components being manufactured using processes that we do not control. As of September 30, 2014, the balance sheet included warranty reserves of $2.2 million, while $3.7 million of warranty charges were incurred during the fiscal year then ended, compared to warranty reserves of $2.7 million as of September 30, 2013 and warranty charges of $4.2 million for the fiscal year then ended. If our actual warranty costs are higher than estimates, future warranty plan coverages are different, or estimates are adversely adjusted in future periods, reserves for warranty expense would need to increase, warranty expense would increase and gross margins would decrease.
Accounting for income taxes. Our provision for income taxes and the determination of the resulting deferred tax assets and liabilities involves a significant amount of management judgment. The quarterly provision for income taxes is based partially upon estimates of pre-tax financial accounting income for the full year and is affected by various differences between financial accounting income and taxable income. Judgment is also applied in determining whether the deferred tax assets will be realized in full or in part. In management’s judgment, when it is more likely than not that all or some portion of specific deferred tax assets will not be realized, a valuation allowance must be established for the amount of the deferred tax assets that are determined not to be realizable. At September 30, 2014, we had valuation reserves of approximately $185,000 for deferred tax assets for capital
22
loss carryforwards and changes in the carrying value of our investment in Proditec, and offsetting amounts for foreign deferred tax assets and U.S. deferred tax liabilities, primarily related to net operating loss carry forwards in the foreign jurisdictions that we believe will not be utilized during the carryforward periods. During fiscal 2014, we recorded net additional valuation reserves of $5,000 related to capital loss carry forwards. In addition, we reversed offsetting amounts of approximately $46,000 of valuation reserves for foreign deferred tax assets and U.S. deferred tax liabilities related to the utilization of net operating loss carry forwards in Europe in fiscal 2014. As these amounts were offsetting, these charges had no effect on net earnings. During fiscal 2013, we recorded net additional valuation reserves of $2,000 related to capital loss carryforwards and $3,000 as part of the acquisition of Visys related to net operating loss carryforwards. In addition, we reversed offsetting amounts of approximately $135,000 of valuation reserves for foreign deferred tax assets and U.S. deferred tax liabilities related to the utilization of net operating loss carryforwards in Europe in fiscal 2013. As these were offsetting amounts, these changes had no effect on net earnings. During fiscal 2012, we recorded net additional valuation reserves of $5,000 related to capital loss carryforwards. In addition, we recorded offsetting amounts of approximately $2.5 million of valuation reserves for foreign deferred tax assets and U.S. deferred tax liabilities related to net operating loss carryforwards in foreign jurisdictions that we believe will not be utilized during the carryforward periods. We also reversed offsetting amounts of approximately $700,000 of valuation reserves for Chinese deferred tax assets and U.S. deferred tax liabilities related to net operating loss carry forwards that were utilized in the foreign jurisdiction. As these were all offsetting amounts, these changes had no effect on net earnings. There were no other material valuation allowances at September 30, 2014 due to anticipated utilization of all the deferred tax assets as we believe we will have sufficient taxable income to use these assets. We maintain reserves for estimated tax exposures in jurisdictions of operation. These tax jurisdictions include federal, state and various international tax jurisdictions. Potential income tax exposures include potential challenges of various tax credits and deductions, and issues specific to state and local tax jurisdictions. Exposures are typically settled primarily through audits within these tax jurisdictions, but can also be affected by changes in applicable tax law or other factors, which could cause our management to believe a revision of past estimates is appropriate. At September 30, 2014, we had reserves of $109,000 for estimated tax exposures. During fiscal 2014 and 2013, there were no significant changes in these estimates. Management believes that an appropriate liability has been established for estimated exposures; however, actual results may differ materially from these estimates. We believe that the accounting estimate related to income taxes is a “critical accounting estimate” because it relies on significant management judgment in making assumptions relative to temporary and permanent timing differences of tax effects, estimates of future earnings, prospective application of changing tax laws in multiple jurisdictions, and the resulting ability to utilize tax assets at those future dates. If our operating results were to fall short of expectations, thereby affecting the likelihood of realizing the deferred tax assets, judgment would have to be applied to determine the amount of the valuation allowance required to be included in the financial statements in any given period. Establishing or increasing a valuation allowance would reduce the carrying value of the deferred tax asset, increase tax expense and reduce net earnings.
In fiscal 2013, the existing research and development tax credit was retroactively renewed and extended to December 31, 2013. Due to this change in tax law, the Company recorded approximately $192,000 of additional research and development credits in fiscal 2013 related to research and development expenditures incurred during fiscal 2012. The research and development credit was effective for the Company for only the first fiscal quarter of 2012 prior to its expiration date.
Recent Accounting Pronouncements Not Yet Adopted—In May 2014, the Financial Accounting Standards Board (“FASB”) issued Accounting Standard Update (“ASU”) 2014-09, “Revenue from Contracts with Customers” (“ASU 2014-09”). ASU 2014-09 supersedes nearly all existing revenue recognition guidance under US GAAP. The standard’s core principle is that a company will recognize revenue when it transfers promised goods or services to customers in an amount that reflects the consideration to which the company expects to be entitled in exchange for those goods or services. We are evaluating our existing revenue recognition policies to determine whether any contracts in the scope of the guidance will be affected by the new requirements. ASU 2014-09 is effective for annual reporting periods beginning after December 15, 2016, including interim periods therein.
23
Comparison of Fiscal 2014 to Fiscal 2013 | |||||||||||||||
Fiscal Year Ended September 30, | |||||||||||||||
2014 | 2013 | Change $ | Change % | ||||||||||||
(in thousands) | |||||||||||||||
Statement of Operations Data | |||||||||||||||
Net sales | $ | 118,258 | $ | 136,783 | $ | (18,525 | ) | (13.5 | ) | ||||||
Gross profit | 34,297 | 46,044 | (11,747 | ) | (25.5 | ) | |||||||||
Operating Expenses: | |||||||||||||||
Sales and marketing | 18,721 | 18,976 | (255 | ) | (1.3 | ) | |||||||||
Research and development | 11,564 | 9,647 | 1,917 | 19.9 | |||||||||||
General and administrative | 10,286 | 10,594 | (308 | ) | (2.9 | ) | |||||||||
Amortization | 1,738 | 996 | 742 | 74.5 | |||||||||||
Total operating expense | 42,309 | 40,213 | 2,096 | 5.2 | |||||||||||
Gain (loss) on disposition of assets | 7 | 42 | (35 | ) | (83.3 | ) | |||||||||
Income (loss) from operations | (8,005 | ) | 5,873 | (13,878 | ) | (236.3 | ) | ||||||||
Other income (expense) | (242 | ) | (460 | ) | 218 | 47.4 | |||||||||
Income tax expense (benefit) | (2,834 | ) | 1,402 | (4,236 | ) | (302.1 | ) | ||||||||
Net earnings (loss) | $ | (5,413 | ) | $ | 4,011 | $ | (9,424 | ) | (235.0 | ) | |||||
Balance Sheet Data | |||||||||||||||
Cash and cash equivalents | $ | 9,741 | $ | 17,601 | $ | (7,860 | ) | (44.7 | ) | ||||||
Accounts receivable | 12,557 | 17,725 | (5,168 | ) | (29.2 | ) | |||||||||
Inventories | 26,673 | 27,921 | (1,248 | ) | (4.5 | ) | |||||||||
Other Data (unaudited) | |||||||||||||||
Orders for year ended September 30 | 110,469 | 126,930 | (16,461 | ) | (13.0 | ) | |||||||||
Backlog at fiscal year end | 18,075 | 25,231 | (7,156 | ) | (28.4 | ) | |||||||||
Results of Operations
Fiscal 2014 compared to Fiscal 2013
Net sales for the year ended September 30, 2014 were $118.3 million, a 14% decrease from the $136.8 million reported for fiscal 2013. International sales for fiscal 2014 were 48% of net sales and 45% in the corresponding prior year. The decrease in net sales occurred most significantly in North America and the Asia-Pacific region, and to a lesser extent in Europe, partially offset by an increase in net sales in Latin America. Sales in our automated inspection systems product line decreased by 6% to $55.8 million in fiscal 2014, accounting for 47% of total revenues, compared to $59.3 million in fiscal 2013, or 43% of total revenues. The decrease in automated inspection system sales was principally in the processed potato market, as well as the pharmaceutical market, offset by an increase in the nuts and dried fruit market. The decrease in automated inspection system sales occurred primarily in certain belt-fed products and upgrade product lines, partially offset by an increase in chute-fed product lines. Process systems sales in fiscal 2014 were $34.6 million, a 32% decrease from the $50.7 million reported for fiscal 2013. Sales of process systems accounted for 29% of total revenues in fiscal 2014 compared to 37% in fiscal 2013. The decrease in process systems sales was across all process system equipment product lines. The decrease for both automated inspection systems and process systems was primarily related to the absence of large orders from our processed potato customers in fiscal 2014. Parts and service sales increased over the prior year by $1.1 million, or 4%, to $27.8 million compared to $26.7 million in fiscal 2013. Parts and service sales represented 24% of sales in fiscal 2014 and 20% in fiscal 2013. Net sales for the first quarter of fiscal 2015 are expected to decrease moderately as compared to the net sales recorded in the first quarter of fiscal 2014.
Orders decreased 13%, or $16.5 million, to $110.5 million in fiscal 2014 from the $126.9 million of new orders received in fiscal 2013. Backlog at September 30, 2014 decreased 28% to $18.1 million compared to the $25.2 million reported at the end of fiscal 2013. The order mix for the more recent year changed from fiscal 2013. For fiscal 2014, automated inspection systems orders decreased by $5.4 million, or 10%, representing 45% of order volume in fiscal 2014 compared to 44% in the prior year. This decrease occurred in almost all automated product inspection lines, except for chute-fed product lines. Automated inspection system orders decreased in fiscal 2014 across most major markets with the exception of the nuts and dried fruit market, and most significantly in the processed potato market, and principally in the North American and Asia-Pacific regions. Orders for process systems decreased by $11.9 million, or 27%, and represented 29% of order volume in fiscal 2014 compared to 35% in the prior
24
year. The decrease in orders for process systems occurred across all process system product lines and most geographic regions. The decrease for both automated inspection systems and process systems was primarily related to the absence of large orders from our processed potato customers in fiscal 2014. Parts and service orders increased from the prior year by $0.9 million, or 3%, and represented 25% and 21% of orders in fiscal 2014 and fiscal 2013, respectively. We expect to achieve double-digit bookings growth in fiscal 2015.
Automated inspection systems backlog was down $5.4 million, or 38%, to $8.8 million at the end of fiscal 2014 compared to $14.2 million at the same time a year ago. The backlog for automatic inspection systems decreased across almost all product lines. Backlog for process systems was down $1.9 million, or 20%, to $7.4 million at the end of fiscal 2014 compared to $9.3 million at the same time a year ago. The decrease in the backlog for process systems was across most process systems product lines. Backlog by product line at September 30, 2014 was 49% automated inspection systems, 41% process systems, and 10% parts and service, compared to 56% automated inspection systems, 37% process systems, and 7% parts and service at September 30, 2013.
Gross profit decreased to $34.3 million for fiscal 2014 compared to $46.0 million in fiscal 2013, or 29.0% and 33.7% of net sales, respectively. The principal reasons for the decrease in the gross profit margin percentage were less efficient factory utilization, a less favorable product mix, and charges related to the cost reduction initiative, partially offset by lower warranty expense. Gross margins are expected to be moderately higher in the first quarter of fiscal 2015 as compared to the first quarter of fiscal 2014.
Sales and marketing expense in fiscal 2014 decreased to $18.7 million compared to $19.0 million spent in fiscal 2013. As a percentage of sales, sales and marketing expense increased to 15.8% of sales in fiscal 2014 from 13.9% of sales in fiscal 2013. The primary reason for the sales and marketing expense decrease in spending was due to lower commissions related to the decrease in net sales.
Research and development expense increased $1.9 million to $11.6 million, or 9.8% of sales, in fiscal 2014 from $9.6 million, or 7.1% of sales, in fiscal 2013. In fiscal 2014, there was an increase in expenses related to developing new technology solutions, as well as the inclusion of the research and development expense of Visys for the entire fiscal year and field testing. We expect research and development expense to return to more normalized run rates of 6% to 8% of sales as we bring our new developments to market during fiscal 2015.
General and administrative expense in fiscal 2014 was $10.3 million or 8.7% of sales for the year, compared to $10.6 million or 7.7% of sales for fiscal 2013. The primary reason for the decrease in spending was the non-recurrence of acquisition related expenses that were incurred in the prior year.
Operating expenses for the first quarter of fiscal 2015 are anticipated to decrease significantly as compared to the first quarter of fiscal 2014 as we expect research and development expenses to return to a more normalized run rate and due to the effect of cost reduction initiatives.
Other income and expense was an expense of $242,000 for fiscal 2014 compared to $460,000 of expense for fiscal 2013. In fiscal 2014, we recognized foreign exchange gains of $105,000, net of the effects of forward contracts settled during the year, compared with exchange losses of $146,000 in fiscal 2013. This favorable result was partially offset by higher bank charges.
The effective tax rate for the Company was a tax benefit rate of 34.4% in fiscal 2014 compared to a tax expense rate of 25.9% in fiscal 2013. The effective tax rate for fiscal 2013 was affected by the research and development credits recorded in fiscal 2013, including $192,000 of additional research and development tax credits related to fiscal 2012 recorded in fiscal 2013 due to changes in tax law during fiscal 2013 to retroactively renew the research and development tax credit.
The net loss in fiscal 2014 was $5.4 million, or $0.86 per diluted share, compared to net earnings of $4.0 million, or $0.69 per diluted share, in fiscal 2013. The principal reasons for the decrease in earnings for fiscal 2014 compared to fiscal 2013 were lower net sales and related gross profit and higher operating expenses. The Company remains confident in returning to profitability in fiscal 2015.
Fiscal 2013 compared to Fiscal 2012
Net sales for the year ended September 30, 2013 were $136.8 million, a 19% increase from the $115.2 million reported for fiscal 2012. International sales for fiscal 2013 were 45% of net sales and 45% in the corresponding prior year. The increase in net sales occurred most significantly in North America and Europe, partially offset by decreases in net sales in Latin America. Sales in our automated inspection systems product line increased by 27% to $59.3 million in fiscal 2013, accounting for 43% of total revenues, compared to $46.6 million in fiscal 2012, or 40% of total revenues. The increase in automated inspection system sales
25
was principally in the potato market, as well as other food markets, offset by decreases in the processed fruit and vegetable and fresh cut markets. The increase in automated inspection system sales occurred in the ADR, Tegra, VEO, Verisym and upgrade product lines, partially offset by decreases in Optyx, Raptor, Manta and tobacco sorter product lines. Process systems sales in fiscal 2013 were $50.7 million, a 13% increase from the $44.9 million reported for fiscal 2012. Sales of process systems accounted for 37% of total revenues in fiscal 2013 compared to 39% in fiscal 2012. The increase in process systems sales related primarily to vibratory products in Europe and other process system equipment, partially offset by a decrease in rotary sizing and grading systems and third-party equipment. Parts and service sales increased from the prior year by $3.1 million, or 13%, to $26.7 million compared to $23.6 million in fiscal 2012. Parts and service sales represented 20% of sales in fiscal 2013 and 21% in fiscal 2012.
Orders increased 16%, or $17.9 million, to $126.9 million in fiscal 2013 from the $109.0 million of new orders received in fiscal 2012. Backlog at September 30, 2013 decreased 18% to $25.2 million compared to the $30.8 million reported at the end of fiscal 2012. The order mix for the more recent year changed from fiscal 2012. For fiscal 2013, our higher margin automated inspection systems orders increased by $18.0 million, or 48%, representing 44% of order volume in fiscal 2013 compared to 34% in the prior year. This increase occurred in almost all automated product inspection lines, except for Optyx and ADR systems. Automated inspection system orders increased in fiscal 2013 across most major markets, and most significantly in the potato market, and principally in the North American region. Orders for process systems decreased by $3.4 million, or 7%, and represented 35% of order volume in fiscal 2013 compared to 44% in the prior year. The decrease in orders for process systems occurred primarily in vibratory, rotary sizers and graders, and third-party equipment product lines, partially offset by increases in vibratory products in Europe and other process system equipment. Parts and service orders increased from the prior year by $3.4 million, or 15%, and represented 21% and 22% of orders in fiscal 2013 and fiscal 2012, respectively. Orders increased most significantly in the North American region, particularly in the potato market.
Automated inspection systems backlog was $14.2 million at the end of fiscal 2013, essentially the same as a year ago. The backlog for automatic inspection systems increased in the Manta, Tegra, tobacco sorter and Visys product lines offset by decreases in the ADR, Optyx and Raptor product lines. Backlog for process systems was down $6.0 million, or 39%, to $9.3 million at the end of fiscal 2013 compared to $15.3 million at the same time a year ago. The decrease in the backlog for process systems was primarily driven by a decrease in vibratory products, third-party equipment, and vibratory equipment in Europe. Backlog by product line at September 30, 2013 was 56% automated inspection systems, 37% process systems, and 7% parts and service, compared to 46% automated inspection systems, 50% process systems, and 4% parts and service at September 30, 2012.
Gross profit increased to $46.0 million for fiscal 2013 compared to $35.8 million in fiscal 2012, or 33.7% and 31.1% of net sales, respectively. The principal reasons for the increase in the gross profit margin percentage were a higher mix of higher margin automated inspection system sales and the product mix within automated inspection systems and more efficient factory utilization, partially offset by higher warranty and customer support costs due in part to the increase in net sales and $1.0 million of acquisition-related fair market value adjustments to acquired inventory.
Research and development expense increased $1.3 million to $9.6 million, or 7.1% of sales, in fiscal 2013 from $8.3 million, or 7.2% of sales, in fiscal 2012. In fiscal 2013, there was an increase in expenses related to developing new technology solutions, as well as the inclusion of the research and development expense of Visys since the acquisition date.
Sales and marketing expense in fiscal 2013 increased to $19.0 million compared to $17.4 million spent in fiscal 2012. As a percentage of sales, sales expense decreased to 13.9% of sales in fiscal 2013 from 15.1% of sales in fiscal 2012. The primary reasons for the sales and marketing expense increase in spending were increased net sales, higher commissions due to the increase in net sales, the inclusion of the sales and marketing expenses of Visys since the acquisition date, and increased sales incentive compensation.
General and administrative expense in fiscal 2013 was $10.6 million or 7.7% of sales for the year, compared to $9.1 million or 7.9% of sales for fiscal 2012. The primary reason for the increase in spending were the inclusion of Visys since the acquisition date, $785,000 of acquisition-related expenses, and incentive compensation expenses.
Other income and expense was an expense of $460,000 for fiscal 2013 compared to $359,000 of expense for fiscal 2012. In fiscal 2013, we recognized foreign exchange losses of $146,000, net of the effects of forward contracts settled during the year, compared with exchange gains of $183,000 in fiscal 2012. In fiscal 2012, we recorded $209,000 of expense related to accumulated foreign currency translation adjustments reclassified from other comprehensive income to the results of operations.
The effective tax rate for the Company was a tax expense rate of 25.9% in fiscal 2013 compared to a tax expense rate of 24.4% in fiscal 2012. The effective tax rate in fiscal 2013 was favorably affected by the domestic production deduction and the research and development tax credit offset by other permanent deductions. The effective tax rate for fiscal 2013 was affected by the research and development credits recorded in fiscal 2013, including $192,000 of additional research and development tax
26
credits related to fiscal 2012 recorded in fiscal 2013 due to changes in tax law during fiscal 2013 to retroactively renew the research and development tax credit. The ratios were also affected by the relative size of individual items compared to net earnings for fiscal 2013, which were significantly higher than net earnings in fiscal 2012.
Net earnings in fiscal 2013 were $4.0 million, or $0.69 per diluted share, compared to net earnings of $0.4 million, or $0.08 per diluted share, in fiscal 2012. The principal reasons for the increase in earnings for fiscal 2013 compared to fiscal 2012 were higher net sales and gross profit margins, partially offset by higher operating expenses.
Liquidity and Capital Resources
Fiscal 2014
For fiscal 2014, net cash decreased by $7.9 million to $9.7 million on September 30, 2014 from $17.6 million on September 30, 2013. Cash used in operating activities was $3.7 million during fiscal 2014. Investing activities consumed $3.1 million of cash. Financing activities used $0.9 million of cash.
Cash used in operating activities during fiscal 2014 was $3.7 million. For fiscal 2014, the net loss was $5.4 million. Non-cash items included in the net loss for fiscal 2014, such as depreciation, amortization and share-based compensation, were approximately $6.8 million. In fiscal 2014, changes in non-cash working capital used $5.1 million of cash in operating activities. The major changes in current assets and liabilities using cash during fiscal 2014 were a decrease of $3.3 million in accrued payroll liabilities due to payments of fiscal 2013 incentive compensation and the timing of payroll, a $2.2 million decrease in customer deposits related to the reduced backlog and timing of orders and collections, decreases in accounts payable of $0.5 million due to the timing of payments, decreases in accrued customer support and warranty costs of $0.6 million due to lower warranty costs and lower net sales, and changes of $3.3 million in income tax receivables and payables due to the timing of payments. These uses were partially offset by decreases in accounts receivable of $4.7 million due to the timing of collections and lower sales activity and decreases in inventory of $0.5 million due to the reduced backlog.
For fiscal 2013, $8.8 million of cash was provided by operating activities, composed of net earnings of $4.0 million; non-cash items such as depreciation, amortization and share-based compensation included in net earnings were $4.9 million; and changes in non-cash working capital of $2.0 million. The primary changes in fiscal 2014 as compared to fiscal 2013 were the net loss and increases in cash used for working capital for items such as payroll and accrued incentives, the timing of tax payments and deductions, lower customer deposits, and decreases in accounts receivable, partially offset by decreased inventory and increases in non-cash items included in the net loss.
Cash used in investing activities totaled $3.1 million during fiscal 2014, which primarily consisted of capital expenditures. Capital expenditures were primarily for manufacturing equipment, leasehold improvements, and information systems software and equipment.
Cash used in financing activities totaled $0.9 million in fiscal 2014, which included payments on long-term debt of $871,000 associated with our mortgage on our headquarters facility, and $229,000 for exchanges of shares for statutory tax withholding, offset by $124,000 of proceeds from the issuance of common stock for option exercises and employee stock purchases.
Our domestic credit facility provides for a variable-rate revolving credit line of up to $15 million and a credit sub-facility of $6 million for standby letters of credit of which up to €3 million ($3.8 million) is available to our Netherlands facility. The credit facility matures on March 31, 2016. The credit facility bears interest, at our option, at either the bank’s prime rate or the London Interbank Offered Rate (“LIBOR”) using a tiered structure depending upon our achievement of a specified financial ratio. Our prime rate option will be either the bank’s prime rate plus 0.75%, 1.00% or 1.25% per annum. Our LIBOR option will be either LIBOR plus 2.25%, 2.50% or 2.75% per annum. At September 30, 2014, the interest rate would have been 2.65% based on the lowest of the available alternative rates. The credit facility is secured by all U.S. accounts receivable, inventory, land and buildings and equipment and fixtures. The loan agreement also provided for a 15-year term loan in the amount of $6.4 million of which $4.5 million was outstanding at September 30, 2014. The term loan provided for a mortgage on our Avery Street headquarters’ land and building located in Walla Walla, Washington. The term loan bears interest at the LIBOR rate plus 1.40% and matures on January 2, 2024. We have also simultaneously entered into an interest rate swap agreement with the lender to fix the interest rate at 4.27%. The credit facilities contain covenants which require operating within a funded debt to EBITDA ratio, a fixed charge coverage ratio and minimum working capital levels. The loan agreement permits capital expenditures up to a certain level, and contains customary default and acceleration provisions. The credit facilities also restrict acquisitions, incurrence of additional indebtedness and lease expenditures above certain levels without the prior consent of the lender. In fiscal 2013, the relevant loan agreement was amended to permit the acquisition of Visys. At September 30, 2014, we had no borrowings outstanding under the credit facility and $752,000 in standby letters of credit. At September 30, 2014, we were not in compliance with our loan covenants.
27
The Company has received a waiver from the bank. The Company does not expect such non-compliance to have any material effect on its operations. At September 30, 2013, we had no borrowings outstanding under the credit facility and $548,000 in standby letters of credit.
Our Belgian subsidiary's credit accommodation with a commercial bank in Belgium provides a credit facility for our Belgian subsidiary. This credit accommodation totals €2.7 million ($3.4 million) and includes an operating line of €800,000 ($1.1 million), a bank guarantee facility of €500,000 ($0.6 million), and loan agreement provisions of €1.4 million ($1.8 million). The operating line and bank guarantee facility are secured by all of the subsidiary's current assets. The Belgian operating line bears interest at the bank's prime rate, plus 1.25%. At September 30, 2014, the interest rate was 9.75%. At September 30, 2014, the subsidiary had no borrowings under the operating line. At September 30, 2014, the subsidiary had various loans outstanding under the loan agreement provision totaling €0.8 million ($1.0 million). The fixed interest rates on these loans ranged from 2.91% to 3.98%. The loans mature between November 2016 and November 2017. The credit accommodation contains a covenant which requires the maintenance of a minimum tangible net worth and debt to EBITDA ratio levels at the subsidiary measured as of September 30 of each fiscal year. At September 30, 2014, the subsidiary was not in compliance with the tangible net worth covenant. The Company does not expect such non-compliance to have any material effect on its operations. At September 30, 2014, the subsidiary had no bank guarantees outstanding under the bank guarantee facility. Additionally, the subsidiary had a subordinated loan with another European lender of €78,000 ($99,000). The loan has a fixed interest rate of 4.99% and matures in March 2016.
We anticipate that current cash balances, ongoing cash flows from operations and borrowing capacity under currently available operating credit lines will be sufficient to fund our operating needs for the foreseeable future. Cash used for operating activities was $3.7 million in fiscal 2014, and cash provided by (used in) operating activities was $8.8 million and ($1.3) million in fiscal years 2013 and 2012, respectively. We had no material commitments for capital expenditures at September 30, 2014.
Prior Years - Fiscal 2013 and 2012
For fiscal 2013, net cash decreased by $6.2 million to $17.6 million on September 30, 2013 compared to September 30, 2012. We generated $8.8 million in cash from operating activities, used $14.0 million in investing activities and consumed $1.0 million in financing activities.
The net cash provided by operating activities during fiscal 2013 of $8.8 million included net earnings for the year of $4.0 million, non-cash expenses for depreciation and amortization of $4.9 million, non-cash share-based payments of $1.3 million, and increases of $3.4 million in deferred taxes. Non-cash working capital at September 30, 2013 decreased from the same time last year, providing $2.0 million of cash. The major changes in current assets and liabilities in fiscal 2013 were a $3.7 million reduction of inventory due to lower backlog and inventory requirements, and a $3.7 million increase in accrued payroll liabilities due to the timing of payroll and timing of payments for increased commissions and increased sales and other incentive compensation, and a $0.9 million increase in customer support and warranty costs accrued due to the increase in net sales. These sources of cash were partially offset by increases in accounts receivable of $5.5 million due to the timing of shipments during the last fiscal quarter of 2013 and related timing of collections, decreases in customer deposits of $1.1 million related to the decreased backlog at fiscal year end, the timing of orders received in the last fiscal quarter of 2013 and related timing of customer down payments received. The changes in working capital in fiscal 2013 reflects normal variations in our operations.
Cash used in investing activities totaled $14.0 million during fiscal 2013, which primarily consisted of $13.2 million of cash used for the acquisition of Visys, net of cash of $1.6 million acquired in the transaction, and capital expenditures of $2.5 million. Capital expenditures were primarily for manufacturing equipment and information systems software and equipment.
Cash used in financing activities totaled $1.0 million in fiscal 2013, which included payments on long-term debt of $697,000 associated with our mortgage on our headquarters facility, $240,000 for exchanges of shares for statutory tax withholding, and $30,000 of cash used for repurchases of our common stock, offset by $95,000 of proceeds from the issuance of common stock for option exercises and employee stock purchases.
For fiscal 2012, net cash decreased by $5.0 million, or 17%, to $23.8 million on September 30, 2012 compared to September 30, 2011. We used $1.3 million in cash from operating activities, used $2.6 million in investing activities and consumed $1.1 million in financing activities.
The net cash used by operating activities during fiscal 2012 of $1.3 million included net earnings for the year of $449,000, non-cash expenses for depreciation and amortization of $3.7 million, non-cash share-based payments of $1.2 million, and increases of $73,000 in deferred taxes. Non-cash working capital at September 30, 2012 decreased from the same time last year, resulting in $6.4 million of cash used in operating activities. The major changes in current assets and liabilities in fiscal 2012 were increases in accounts receivable of $2.7 million due to the timing of shipments during the last fiscal quarter of 2012 and related timing of
28
collections, decreases in customer deposits of $5.5 million related to the decreased backlog at fiscal year end, the timing of orders received in the last fiscal quarter of 2012 and related timing of customer down payments received, and reductions in accounts payable of $706,000 due to reduced purchases as a result of the lower backlog and current inventory levels. These uses of cash were partially offset by an $887,000 reduction of inventory due to the lower backlog and inventory requirements, reductions of $880,000 of income taxes receivable related to net cash refunded during the period due to net operating loss carrybacks and a $1.1 million reduction in prepaid expenses and other assets due to reduced vendor deposits and VAT receivables. The changes in working capital in fiscal 2012 reflects normal variations in our operations.
Cash used in investing activities totaled $2.6 million during fiscal 2012, which primarily consisted of capital expenditures of $2.6 million. Capital expenditures were primarily for manufacturing equipment and information systems software and equipment.
Cash used in financing activities totaled $1.1 million in fiscal 2012, which included payments on long-term debt of $345,000 associated with our mortgage on our headquarters facility, $205,000 for exchanges of shares for statutory tax withholding, and $710,000 of cash used for repurchases of our common stock, offset by $94,000 of proceeds from the issuance of common stock for option exercises and employee stock purchases.
Contractual Obligations
Our continuing contractual obligations and commercial commitments existing on September 30, 2014 are as follows:
Payments due by period (in thousands) | ||||||||||||||||||||
Contractual Obligations(1) | Total | Less than 1 year | 1 – 3 years | 4 – 5 years | After 5 years | |||||||||||||||
Long-term debt | $ | 5,537 | $ | 804 | $ | 1,487 | $ | 954 | $ | 2,292 | ||||||||||
Interest on long-term debt (2) | 1,032 | 226 | 342 | 237 | 227 | |||||||||||||||
Operating leases | 4,940 | 1,133 | 1,697 | 1,255 | 855 | |||||||||||||||
Purchase obligations(3) | 647 | 647 | — | — | — | |||||||||||||||
Total contractual cash obligations | $ | 12,156 | $ | 2,810 | $ | 3,526 | $ | 2,446 | $ | 3,374 | ||||||||||
(1) | We also have $109,000 of contractual obligations related to uncertain tax positions for which the timing and amount of payment cannot be reasonably estimated due to the nature of the uncertainties and the unpredictability of jurisdictional examinations in relation to the statute of limitations. |
(2) | Includes the effect of the interest-rate swap agreement that fixes the interest rate at 4.27%. |
(3) | Purchase obligations are commitments to purchase certain materials and supplies which will be used in the ordinary course of business. |
At September 30, 2014, we had standby letters of credit totaling $0.8 million, which includes secured bank guarantees under our domestic and European credit facilities and domestic letters of credit securing certain self-insurance contracts. If we fail to meet our contractual obligations, these bank guarantees and letters of credit may become liabilities of the Company. We have no off-balance sheet arrangements or transactions, or arrangements or relationships with “special purpose entities.”
29
ITEM 7A. | QUANTITATIVE AND QUALITATIVE DISCLOSURES ABOUT MARKET RISK. |
Foreign Currency Exchange Risk. We have assessed our exposure to market risks for our financial instruments and have determined that our exposures to such risks are generally limited to those affected by the value of the U.S. dollar compared to the Euro and to a lesser extent the Australian dollar and Mexican peso.
The terms of sales to European customers are typically denominated in Euros. We expect that our standard terms of sale to international customers, other than those in Europe, will continue to be denominated in U.S. dollars, although as we expand our operations in Australia and Latin America, transactions denominated in the local currencies of these countries may increase. As of September 30, 2014, management estimates that a 10% change in foreign exchange rates would affect net earnings before taxes by approximately $13,000 on an annual basis as a result of the conversion to U.S. dollars of cash, accounts receivable, loans to foreign subsidiaries, and sales or other contracts denominated in foreign currencies. These changes would positively affect net earnings if the U.S. dollar weakens on world markets and negatively affect net earnings if the U.S. dollar strengthens on world markets. We assess our currency exchange risk and may enter into forward contracts to minimize such risk. At September 30, 2014, we held a 30-day forward contract for €3.5 million ($4.4 million).
As of September 30, 2014, the Euro lost approximately 6% in value against the U.S. dollar compared to its value at September 30, 2013. During the twelve-month period ended September 30, 2014, changes in the value of the Euro against the U.S. dollar ranged between a 2% gain and a 6% loss as compared to the value at September 30, 2013. Most other relevant foreign currencies lost in value against the U.S. dollar during fiscal 2014. The effect of these fluctuations on our operations and financial results in fiscal 2014 were:
• | Translation adjustments of $(901,000), net of income tax, were recognized as a component of comprehensive income as a result of converting the Euro denominated balance sheets of our European subsidiaries into U.S. dollars, and to a lesser extent, the Australian dollar balance sheet of our Australian subsidiary and Peso balance sheets of our Mexican subsidiaries. |
• | Foreign exchange gains of $105,000, net of the effects of forward contracts settled during the year, were recognized in the other income and expense section of the consolidated statement of operations as a result of conversion of Euro and other foreign currency denominated receivables, intercompany loans, and cash carried on the balance sheet of the U.S. operations, as well as the result of the conversion of other non-functional currency receivables, payables and cash carried on the balance sheets of the European, Australian, and Mexican operations. |
When the U.S. dollar strengthens on the world markets, our market and economic outlook for international sales could be adversely affected as products sold to international customers become relatively more expensive to those customers. Conversely, a relatively weaker U.S. dollar makes our U.S.-manufactured goods less expensive to international customers when denominated in U.S. dollars or potentially more profitable to us when denominated in a foreign currency. On the other hand, materials or components imported into the U.S. may be more expensive. Our Netherlands-based subsidiary transacts business primarily in Euros and does not have significant exports to the U.S, but does import a significant portion of its products from its U.S.-based parent company. Our Belgian-based subsidiary also transacts business primarily in Euros and has significant exports to the U.S.-based parent Company.
Interest Rate Risk. Under our domestic credit facilities, we may borrow at either (a) the lender’s prime rate plus 75, 100 or 125 basis points or (b) at LIBOR plus 225, 250 or 275 basis points depending on our achievement of a specified financial ratio. Our Belgian subsidiary may borrow on our Belgian credit facility at the lender's prime rate plus 1.25%. At September 30, 2014, we had no borrowings under these arrangements. During the year ended September 30, 2014, interest rates applicable to these variable rate credit facilities ranged from 1.57% to 9.75%. At September 30, 2014, the rate was 2.65% on our domestic credit facility and 9.75% on our Belgian credit facility based on the lowest of the available alternative rates. Our mortgage on our headquarters facility bears interest at the BBA LIBOR plus 140 basis points, but we simultaneously entered into an interest rate swap agreement with the lender to fix the interest rate at 4.27%. Long-term fixed borrowings at our Belgian subsidiary bear interest rates ranging from 2.91% to 4.99%. As of September 30, 2014, management estimate that a 100 basis point change in these interest rates would not affect net income before taxes because we had no borrowings outstanding under our variable interest rate credit facilities and the interest rate swap effectively converts our variable rate mortgage to a fixed rate mortgage.
30
ITEM 8. | FINANCIAL STATEMENTS AND SUPPLEMENTARY DATA. |
Title | Page | |
Report of Independent Registered Public Accounting Firm | 32 | |
Report of Independent Registered Public Accounting Firm | 33 | |
Consolidated Balance Sheets at September 30, 2014 and 2013 | 34 | |
Consolidated Statements of Operations for the three years ended September 30, 2014 | 36 | |
Consolidated Statements of Comprehensive Income for the three years ended September 30, 2014 | 37 | |
Consolidated Statements of Shareholders' Equity for the three years ended September 30, 2014 | 38 | |
Consolidated Statements of Cash Flows for the three years ended September 30, 2014 | 39 | |
Notes to Consolidated Financial Statements | 41 | |
Supplementary Data | 61 | |
31
REPORT OF INDEPENDENT REGISTERED PUBLIC ACCOUNTING FIRM
Board of Directors and Shareholders
Key Technology, Inc.
We have audited the accompanying consolidated balance sheets of Key Technology, Inc. (an Oregon corporation) and subsidiaries (the “Company”) as of September 30, 2014 and 2013, and the related consolidated statements of operations, statements of comprehensive income, changes in shareholders’ equity, and cash flows for each of the three years in the period ended September 30, 2014. These consolidated financial statements are the responsibility of the Company’s management. Our responsibility is to express an opinion on these financial statements based on our audits.
We conducted our audits in accordance with the standards of the Public Company Accounting Oversight Board (United States). Those standards require that we plan and perform the audit to obtain reasonable assurance about whether the financial statements are free of material misstatement. An audit includes examining, on a test basis, evidence supporting the amounts and disclosures in the financial statements. An audit also includes assessing the accounting principles used and significant estimates made by management, as well as evaluating the overall financial statement presentation. We believe that our audits provide a reasonable basis for our opinion.
In our opinion, the consolidated financial statements referred to above present fairly, in all material respects, the financial position of Key Technology, Inc. and subsidiaries as of September 30, 2014 and 2013, and the results of their operations and their cash flows for each of the three years in the period ended September 30, 2014 in conformity with accounting principles generally accepted in the United States of America.
We also have audited, in accordance with the standards of the Public Company Accounting Oversight Board (United States), the Company’s internal control over financial reporting as of September 30, 2014, based on criteria established in the 1992 Internal Control-Integrated Framework issued by the Committee of Sponsoring Organizations of the Treadway Commission (COSO), and our report dated December 12, 2014 expressed an unqualified opinion.
/s/ GRANT THORNTON LLP
Seattle, Washington
December 12, 2014
32
REPORT OF INDEPENDENT REGISTERED PUBLIC ACCOUNTING FIRM
Board of Directors and Shareholders
Key Technology, Inc.
We have audited the internal control over financial reporting of Key Technology, Inc. (an Oregon corporation) and subsidiaries’ (the “Company”) as of September 30, 2014, based on criteria established in the 1992 Internal Control-Integrated Framework issued by the Committee of Sponsoring Organizations of the Treadway Commission (COSO). The Company’s management is responsible for maintaining effective internal control over financial reporting and for its assessment of the effectiveness of internal control over financial reporting included in the accompanying Management’s Annual Report on Internal Control over Financial Reporting. Our responsibility is to express an opinion on the Company’s internal control over financial reporting based on our audit.
We conducted our audit in accordance with the standards of the Public Company Accounting Oversight Board (United States). Those standards require that we plan and perform the audit to obtain reasonable assurance about whether effective internal control over financial reporting was maintained in all material respects. Our audit included obtaining an understanding of internal control over financial reporting, assessing the risk that a material weakness exists, testing and evaluating the design and operating effectiveness of internal control based on the assessed risk, and performing such other procedures as we considered necessary in the circumstances. We believe that our audit provides a reasonable basis for our opinion.
A company’s internal control over financial reporting is a process designed to provide reasonable assurance regarding the reliability of financial reporting and the preparation of financial statements for external purposes in accordance with generally accepted accounting principles. A company’s internal control over financial reporting includes those policies and procedures that (1) pertain to the maintenance of records that, in reasonable detail, accurately and fairly reflect the transactions and dispositions of the assets of the company; (2) provide reasonable assurance that transactions are recorded as necessary to permit preparation of financial statements in accordance with generally accepted accounting principles, and that receipts and expenditures of the company are being made only in accordance with authorizations of management and directors of the company; and (3) provide reasonable assurance regarding prevention or timely detection of unauthorized acquisition, use, or disposition of the company’s assets that could have a material effect on the financial statements.
Because of its inherent limitations, internal control over financial reporting may not prevent or detect misstatements. Also, projections of any evaluation of effectiveness to future periods are subject to the risk that controls may become inadequate because of changes in conditions, or that the degree of compliance with the policies or procedures may deteriorate.
In our opinion, the Company maintained, in all material respects, effective internal control over financial reporting as of September 30, 2014, based on criteria established in the 1992 Internal Control-Integrated Framework issued by COSO.
We also have audited, in accordance with the standards of the Public Company Accounting Oversight Board (United States), the consolidated financial statements of the Company as of and for the year ended September 30, 2014, and our report dated December 12, 2014, expressed an unqualified opinion on these consolidated financial statements.
/s/ GRANT THORNTON LLP
Seattle, Washington
December 12, 2014
33
KEY TECHNOLOGY, INC. AND SUBSIDIARIES | ||||||||
CONSOLIDATED BALANCE SHEETS | ||||||||
SEPTEMBER 30, 2014 AND 2013 | ||||||||
(In thousands) | ||||||||
2014 | 2013 | |||||||
ASSETS | ||||||||
CURRENT ASSETS: | ||||||||
Cash and cash equivalents | $ | 9,741 | $ | 17,601 | ||||
Trade accounts receivable, net of allowance for doubtful accounts of $415 and $296, respectively | 12,557 | 17,725 | ||||||
Inventories | 26,673 | 27,921 | ||||||
Deferred income taxes | 3,809 | 5,034 | ||||||
Income tax receivable | 2,888 | 86 | ||||||
Prepaid expenses and other assets | 4,325 | 4,206 | ||||||
Total current assets | 59,993 | 72,573 | ||||||
PROPERTY, PLANT AND EQUIPMENT, Net | 16,652 | 17,259 | ||||||
DEFERRED INCOME TAXES | 615 | 760 | ||||||
INTANGIBLES, Net | 8,656 | 10,982 | ||||||
INVESTMENT IN PRODITEC | 1,127 | 1,148 | ||||||
GOODWILL | 11,222 | 11,821 | ||||||
OTHER ASSETS | 80 | 81 | ||||||
TOTAL | $ | 98,345 | $ | 114,624 | ||||
See notes to consolidated financial statements. | ||||||||
34
KEY TECHNOLOGY, INC. AND SUBSIDIARIES | ||||||||
CONSOLIDATED BALANCE SHEETS | ||||||||
SEPTEMBER 30, 2014 AND 2013 | ||||||||
(In thousands, except shares) | ||||||||
2014 | 2013 | |||||||
LIABILITIES AND SHAREHOLDERS' EQUITY | ||||||||
CURRENT LIABILITIES: | ||||||||
Accounts payable | $ | 6,073 | $ | 6,669 | ||||
Accrued payroll liabilities and commissions | 5,893 | 9,440 | ||||||
Customers' deposits | 3,702 | 6,048 | ||||||
Accrued customer support and warranty costs | 2,607 | 3,301 | ||||||
Income tax payable | 2 | 430 | ||||||
Current portion of long-term debt | 804 | 871 | ||||||
Customer purchase plans | 1,523 | 1,731 | ||||||
Other accrued liabilities | 1,186 | 1,745 | ||||||
Total current liabilities | 21,790 | 30,235 | ||||||
LONG-TERM DEBT | 4,733 | 5,612 | ||||||
DEFERRED INCOME TAXES | 3,281 | 5,226 | ||||||
OTHER LONG TERM LIABILITIES | 373 | 426 | ||||||
COMMITMENTS AND CONTINGENCIES | ||||||||
SHAREHOLDERS' EQUITY: | ||||||||
Preferred stock-no par value; 5,000,000 shares authorized; none issued and outstanding | — | — | ||||||
Common stock-no par value; 45,000,000 shares authorized; 6,307,543 and 6,168,654 issued and outstanding at September 30, 2014 and 2013, respectively | 31,414 | 30,086 | ||||||
Warrants, no par value; 250,000 issued and outstanding at September 30, 2014 | 665 | 665 | ||||||
Retained earnings | 36,264 | 41,677 | ||||||
Accumulated other comprehensive income (loss) | (175 | ) | 697 | |||||
Total shareholders' equity | 68,168 | 73,125 | ||||||
TOTAL | $ | 98,345 | $ | 114,624 | ||||
See notes to consolidated financial statements. | ||||||||
35
KEY TECHNOLOGY, INC. AND SUBSIDIARIES | ||||||||||||
CONSOLIDATED STATEMENTS OF OPERATIONS | ||||||||||||
THREE YEARS ENDED SEPTEMBER 30, 2014 | ||||||||||||
(In thousands, except per share data) | ||||||||||||
2014 | 2013 | 2012 | ||||||||||
NET SALES | $ | 118,258 | $ | 136,783 | $ | 115,174 | ||||||
COST OF SALES | 83,961 | 90,739 | 79,339 | |||||||||
Gross profit | 34,297 | 46,044 | 35,835 | |||||||||
OPERATING EXPENSES: | ||||||||||||
Sales and marketing | 18,721 | 18,976 | 17,439 | |||||||||
Research and development | 11,564 | 9,647 | 8,343 | |||||||||
General and administrative | 10,286 | 10,594 | 9,070 | |||||||||
Amortization of intangibles | 1,738 | 996 | 15 | |||||||||
Total operating expenses | 42,309 | 40,213 | 34,867 | |||||||||
GAIN (LOSS) ON DISPOSITION OF ASSETS | 7 | 42 | (15 | ) | ||||||||
INCOME (LOSS) FROM OPERATIONS | (8,005 | ) | 5,873 | 953 | ||||||||
OTHER INCOME (EXPENSE): | ||||||||||||
Royalty income | 38 | 52 | 51 | |||||||||
Interest income | 32 | 27 | 22 | |||||||||
Interest expense | (276 | ) | (277 | ) | (264 | ) | ||||||
Reclassification from Other comprehensive income | — | — | (209 | ) | ||||||||
Foreign exchange gain (loss) | 105 | (146 | ) | 183 | ||||||||
Other, net | (141 | ) | (116 | ) | (142 | ) | ||||||
Total other income (expense)-net | (242 | ) | (460 | ) | (359 | ) | ||||||
Earnings (loss) before income taxes | (8,247 | ) | 5,413 | 594 | ||||||||
Income tax expense (benefit) | (2,834 | ) | 1,402 | 145 | ||||||||
Net earnings (loss) | $ | (5,413 | ) | $ | 4,011 | $ | 449 | |||||
EARNINGS (LOSS) PER SHARE - Basic | $ | (0.86 | ) | $ | 0.69 | $ | 0.08 | |||||
EARNINGS (LOSS) PER SHARE - Diluted | $ | (0.86 | ) | $ | 0.69 | $ | 0.08 | |||||
SHARES USED IN PER SHARE CALCULATION - Basic | 6,295 | 5,836 | 5,390 | |||||||||
SHARES USED IN PER SHARE CALCULATION - Diluted | 6,295 | 5,855 | 5,399 | |||||||||
See notes to consolidated financial statements. | ||||||||||||
36
KEY TECHNOLOGY, INC. AND SUBSIDIARIES | ||||||||||||
CONSOLIDATED STATEMENTS OF COMPREHENSIVE INCOME | ||||||||||||
THREE YEARS ENDED SEPTEMBER 30, 2014 | ||||||||||||
(Dollars in thousands) | ||||||||||||
2014 | 2013 | 2012 | ||||||||||
Net earnings (loss) | $ | (5,413 | ) | $ | 4,011 | $ | 449 | |||||
Other comprehensive income (loss): | ||||||||||||
Foreign currency translation adjustment | (1,365 | ) | 890 | (202 | ) | |||||||
Unrealized changes in fair value of derivatives | 44 | 254 | (102 | ) | ||||||||
Reclassification adjustment for foreign currency translation included in net earnings | — | — | 209 | |||||||||
Income tax (expense) benefit related to items of comprehensive income (loss) | 449 | (389 | ) | 32 | ||||||||
Total comprehensive income (loss) | $ | (6,285 | ) | $ | 4,766 | $ | 386 | |||||
See notes to consolidated financial statements. | ||||||||||||
37
KEY TECHNOLOGY, INC. AND SUBSIDIARIES | |||||||||||||||||||||||
CONSOLIDATED STATEMENTS OF SHAREHOLDERS' EQUITY | |||||||||||||||||||||||
THREE YEARS ENDED SEPTEMBER 30, 2014 | |||||||||||||||||||||||
(Dollars in thousands) | |||||||||||||||||||||||
Common Stock | |||||||||||||||||||||||
Shares | Amount | Warrants | Retained Earnings | Accumulated Other Comprehensive Income (Loss) | Total | ||||||||||||||||||
Balance at September 30, 2011 | 5,337,250 | $ | 21,138 | $ | — | $ | 37,631 | $ | 5 | $ | 58,774 | ||||||||||||
Net earnings | — | — | — | 449 | — | 449 | |||||||||||||||||
Comprehensive income - foreign currency translation adjustment, net of tax benefit of $69 | — | — | — | — | (133 | ) | (133 | ) | |||||||||||||||
Reclassification adjustment for foreign currency translation included in net earnings, net of tax of $71 | — | — | — | — | 138 | 138 | |||||||||||||||||
Unrealized changes in value of derivatives, net of tax benefit of $34 | — | — | — | — | (68 | ) | (68 | ) | |||||||||||||||
Tax benefits from share-based payments | — | (103 | ) | — | — | — | (103 | ) | |||||||||||||||
Share based payments | — | 1,194 | — | — | — | 1,194 | |||||||||||||||||
Issuance of stock upon exercise of stock options | 9,056 | 13 | — | — | — | 13 | |||||||||||||||||
Issuance of stock for Employee Stock Purchase Plan | 8,417 | 81 | — | — | — | 81 | |||||||||||||||||
Stock buyback | (70,853 | ) | (312 | ) | — | (398 | ) | — | (710 | ) | |||||||||||||
Stock grants - performance-based | 92,910 | — | — | — | — | — | |||||||||||||||||
Stock grants - employment-based | 95,805 | — | — | — | — | — | |||||||||||||||||
Restricted stock surrendered in payment of taxes | (19,127 | ) | (205 | ) | — | — | — | (205 | ) | ||||||||||||||
Stock forfeitures and retirements | (141,313 | ) | — | — | — | — | — | ||||||||||||||||
Balance at September 30, 2012 | 5,312,145 | 21,806 | — | 37,682 | (58 | ) | 59,430 | ||||||||||||||||
Net earnings | — | — | — | 4,011 | — | 4,011 | |||||||||||||||||
Comprehensive income - foreign currency translation adjustment, net of tax expense of $303 | — | — | — | — | 587 | 587 | |||||||||||||||||
Unrealized changes in value of derivatives, net of tax expense of $86 | — | — | — | — | 168 | 168 | |||||||||||||||||
Tax benefits from share-based payments | — | (60 | ) | — | — | — | (60 | ) | |||||||||||||||
Share based payments | — | 1,298 | — | — | — | 1,298 | |||||||||||||||||
Issuance of stock upon exercise of stock options | 10,000 | 28 | — | — | — | 28 | |||||||||||||||||
Issuance of stock for Employee Stock Purchase Plan | 6,257 | 67 | — | — | — | 67 | |||||||||||||||||
Issuance of stock for acquisition, net of issuance costs of $126 | 600,000 | 7,201 | — | — | — | 7,201 | |||||||||||||||||
Issuance of warrants (250,000) for acquisition, net of issuance costs of $62 | — | — | 665 | — | — | 665 | |||||||||||||||||
Stock buyback | (3,288 | ) | (14 | ) | — | (16 | ) | — | (30 | ) | |||||||||||||
Stock grants - performance-based | 178,163 | — | — | — | — | — | |||||||||||||||||
Stock grants - employment-based | 103,026 | — | — | — | — | — | |||||||||||||||||
Restricted stock surrendered in payment of taxes | (24,187 | ) | (240 | ) | — | — | — | (240 | ) | ||||||||||||||
Stock forfeitures and retirements | (13,462 | ) | — | — | — | — | — | ||||||||||||||||
Balance at September 30, 2013 | 6,168,654 | 30,086 | 665 | 41,677 | 697 | 73,125 | |||||||||||||||||
Net loss | — | — | — | (5,413 | ) | — | (5,413 | ) | |||||||||||||||
Comprehensive income - foreign currency translation adjustment, net of tax benefit of $464 | — | — | — | — | (901 | ) | (901 | ) | |||||||||||||||
Unrealized changes in value of derivatives, net of tax expense of $15 | — | — | — | — | 29 | 29 | |||||||||||||||||
Tax benefits from share-based payments | — | (15 | ) | — | — | — | (15 | ) | |||||||||||||||
Share based payments | — | 1,448 | — | — | — | 1,448 | |||||||||||||||||
Issuance of stock upon exercise of stock options | 5,000 | 56 | — | — | — | 56 | |||||||||||||||||
Issuance of stock for Employee Stock Purchase Plan | 6,013 | 68 | — | — | — | 68 | |||||||||||||||||
Stock grants - performance-based | 95,522 | — | — | — | — | — | |||||||||||||||||
Stock grants - employment-based | 75,013 | — | — | — | — | — | |||||||||||||||||
Restricted stock surrendered in payment of taxes | (16,968 | ) | (229 | ) | — | — | — | (229 | ) | ||||||||||||||
Stock forfeitures and retirements | (25,691 | ) | — | — | — | — | — | ||||||||||||||||
Balance at September 30, 2014 | 6,307,543 | $ | 31,414 | $ | 665 | $ | 36,264 | $ | (175 | ) | $ | 68,168 | |||||||||||
See notes to consolidated financial statements. | |||||||||||||||||||||||
38
KEY TECHNOLOGY, INC. AND SUBSIDIARIES | ||||||||||||
CONSOLIDATED STATEMENTS OF CASH FLOWS | ||||||||||||
THREE YEARS ENDED SEPTEMBER 30, 2014 | ||||||||||||
(In thousands) | ||||||||||||
2014 | 2013 | 2012 | ||||||||||
CASH FLOWS FROM OPERATING ACTIVITIES: | ||||||||||||
Net earnings (loss) | $ | (5,413 | ) | $ | 4,011 | $ | 449 | |||||
Adjustments to reconcile net earnings (loss) to net cash provided by (used in) operating activities: | ||||||||||||
Reclassification from Other comprehensive income | — | — | 209 | |||||||||
(Gain) loss on disposition of assets | (7 | ) | (42 | ) | 15 | |||||||
Foreign currency exchange (gain) loss | (105 | ) | 146 | (183 | ) | |||||||
Depreciation and amortization | 5,346 | 4,868 | 3,654 | |||||||||
Share based payments | 1,445 | 1,276 | 1,182 | |||||||||
Excess tax benefit from share based payments | (41 | ) | (40 | ) | (55 | ) | ||||||
Deferred income taxes | (33 | ) | (3,421 | ) | (73 | ) | ||||||
Deferred rent | 14 | (5 | ) | (33 | ) | |||||||
Bad debt expense | 163 | 2 | 24 | |||||||||
Trade accounts receivable | 4,701 | (5,511 | ) | (2,671 | ) | |||||||
Inventories | 548 | 3,665 | 887 | |||||||||
Prepaid expenses and other current assets | 240 | (628 | ) | 1,124 | ||||||||
Income taxes receivable | (2,802 | ) | 241 | 880 | ||||||||
Patents | — | (135 | ) | — | ||||||||
Accounts payable | (462 | ) | (123 | ) | (706 | ) | ||||||
Accrued payroll liabilities and commissions | (3,295 | ) | 3,698 | (221 | ) | |||||||
Accrued customer support and warranty costs | (618 | ) | 863 | (459 | ) | |||||||
Income taxes payable | (444 | ) | 367 | 70 | ||||||||
Other accrued liabilities | (708 | ) | 556 | 137 | ||||||||
Customers' deposits | (2,244 | ) | (1,090 | ) | (5,505 | ) | ||||||
Other | (1 | ) | 71 | 13 | ||||||||
Cash provided by (used in) operating activities | (3,716 | ) | 8,769 | (1,262 | ) | |||||||
CASH FLOWS FROM INVESTING ACTIVITIES: | ||||||||||||
Proceeds from sale of property | 25 | 77 | 8 | |||||||||
Purchases of property, plant, and equipment | (3,107 | ) | (2,468 | ) | (2,600 | ) | ||||||
Cash paid for the acquisition of Visys, net of cash acquired | — | (11,607 | ) | — | ||||||||
Cash used in investing activities | (3,082 | ) | (13,998 | ) | (2,592 | ) | ||||||
(Continued) | ||||||||||||
39
KEY TECHNOLOGY, INC. AND SUBSIDIARIES | ||||||||||||
CONSOLIDATED STATEMENTS OF CASH FLOWS | ||||||||||||
THREE YEARS ENDED SEPTEMBER 30, 2014 | ||||||||||||
(In thousands) | ||||||||||||
2014 | 2013 | 2012 | ||||||||||
CASH FLOWS FROM FINANCING ACTIVITIES: | ||||||||||||
Payments on long-term debt | (871 | ) | (697 | ) | (345 | ) | ||||||
Proceeds from issuance of common stock | 124 | 95 | 94 | |||||||||
Stock buyback | — | (30 | ) | (710 | ) | |||||||
Issuance costs of stock and warrants | — | (188 | ) | — | ||||||||
Excess tax benefits from share based payments | 41 | 40 | 55 | |||||||||
Exchange of shares for statutory withholding | (229 | ) | (240 | ) | (205 | ) | ||||||
Cash used in financing activities | (935 | ) | (1,020 | ) | (1,111 | ) | ||||||
EFFECT OF EXCHANGE RATE CHANGES ON CASH | (127 | ) | 95 | (34 | ) | |||||||
NET DECREASE IN CASH AND CASH EQUIVALENTS | (7,860 | ) | (6,154 | ) | (4,999 | ) | ||||||
CASH AND CASH EQUIVALENTS, BEGINNING OF YEAR | 17,601 | 23,755 | 28,754 | |||||||||
CASH AND CASH EQUIVALENTS, END OF YEAR | $ | 9,741 | $ | 17,601 | $ | 23,755 | ||||||
SUPPLEMENTAL DISCLOSURES OF CASH FLOW | ||||||||||||
INFORMATION: | ||||||||||||
Cash paid during the period for interest | $ | 287 | $ | 275 | $ | 278 | ||||||
Cash paid (refunded) during the period for income taxes | $ | 438 | $ | 4,179 | $ | (705 | ) | |||||
SUPPLEMENTAL DISCLOSURE OF NONCASH | ||||||||||||
FINANCING ACTIVITIES: | ||||||||||||
Common stock issued for acquisition | $ | — | $ | 7,325 | $ | — | ||||||
Warrants issued for acquisition | $ | — | $ | 727 | $ | — | ||||||
See notes to consolidated financial statements. | (Concluded) | |||||||||||
40
KEY TECHNOLOGY, INC. AND SUBSIDIARIES
NOTES TO CONSOLIDATED FINANCIAL STATEMENTS
THREE YEARS ENDED SEPTEMBER 30, 2014
1. | THE COMPANY AND SUMMARY OF SIGNIFICANT ACCOUNTING POLICIES |
Key Technology, Inc. and its wholly-owned subsidiaries (the “Company”) design, manufacture, sell and service process automation systems that integrate electro-optical inspection and sorting systems with process systems that include specialized conveying and product preparation equipment. The consolidated financial statements include the accounts of Key Technology, Inc. and its subsidiaries, which are all wholly-owned. All significant intercompany accounts and transactions have been eliminated.
Revenue Recognition—The Company recognizes revenue when persuasive evidence of an arrangement exists, delivery has occurred or services have been provided, the sale price is fixed or determinable, and collectability is reasonably assured. Additionally, the Company sells its goods on terms which transfer title and risk of loss at a specified location, typically shipping point, port of loading or port of discharge, depending on the final destination of the goods. Accordingly, revenue recognition from product sales occurs when all criteria are met, including transfer of title and risk of loss, which occurs either upon shipment by the Company or upon receipt by customers at the location specified in the terms of sale. Sales of system upgrades are recognized as revenue upon completion of the conversion of the customer’s existing system when this conversion occurs at the customer site. Revenue earned from services (maintenance, installation support, and repairs) is recognized ratably over the contractual period or as the services are performed. If any contract provides for both equipment and services (multiple deliverables), the sales price is allocated to the various elements based on the relative selling price. Each element is then evaluated for revenue recognition based on the previously described criteria. The Company typically has a very limited number of contracts with multiple deliverables and they are not material to the financial statements. The Company’s sales arrangements provide for no other significant post-shipment obligations. If all conditions of revenue recognition are not met, the Company defers revenue recognition. In the event of revenue deferral, the sale value is not recorded as revenue to the Company, accounts receivable are reduced by any related amounts owed by the customer, and the cost of the goods or services deferred is carried in inventory. In addition, the Company periodically evaluates whether an allowance for sales returns is necessary. Historically, the Company has experienced few sales returns. If the Company believes there are potential sales returns, the Company would provide any necessary provision against sales. The Company accounts for cash consideration (such as sales incentives) that are given to customers or resellers as a reduction of revenue rather than as an operating expense unless an identified benefit is received for which fair value can be reasonably estimated. Upon receipt of an order, the Company generally receives a deposit which is recorded as customers’ deposits. The Company makes periodic evaluations of the creditworthiness of its customers and generally does not require collateral. An allowance for credit losses is provided based upon historical experience and anticipated losses. The Company records revenues net of any taxes, such as sales tax, which are passed through to the customer.
Cash and Cash Equivalents—The Company considers all highly liquid investments with original maturities of 90 days or less at date of acquisition to be cash equivalents. Accounts at each institution regularly exceed Federal Deposit Insurance Corporation insurance coverage. The Company has not experienced any losses in such accounts.
Inventories are stated at the lower of cost (first-in, first-out method) or market.
41
Property, Plant and Equipment are recorded at cost and depreciated over estimated useful lives on the straight-line basis, and depreciation commences at the time assets are placed in service. Leasehold improvements are amortized over the lesser of useful life or the term of the applicable lease using the straight-line method. The range of useful lives for fixed assets is as follows:
Years | |
Buildings and improvements | 7 to 40 |
Manufacturing equipment | 3 to 10 |
Office equipment, furniture and fixtures | 3 to 7 |
Computer equipment and software | 3 to 7 |
Goodwill and Other Intangibles—The Company has only one reporting unit, and the estimated fair value of the Company approximates the market value of the Company. The Company performed its annual assessment on July 31, 2014 and determined that there has been no impairment of goodwill due to the fair value of the reporting unit exceeding its carrying amount. The fair value of the Company was calculated based on the market capitalization of the Company as of July 31, 2014.
Other intangibles are amortized over the estimated useful lives of the related assets, which are between 3 to 16 years. Management evaluates the recoverability of other intangibles based upon current and anticipated results of operations and undiscounted future cash flows whenever events or changes in circumstances indicate the carrying value may not be recoverable. Amortization of other intangibles was $1,738,000, $996,000, and $15,000 for the years ended September 30, 2014, 2013, and 2012, respectively (see Note 3).
Product Warranties—The Company provides a warranty on its products ranging from 90 days to five years following the date of shipment, the majority of which are for periods of one year or less. Management establishes allowances for warranty costs based upon the types of products shipped and product warranty experience. The provision for warranty costs is charged to cost of sales at the time of sale, and it is periodically assessed for adequacy based on changes in these factors.
A reconciliation of the changes in the Company’s allowances for warranties is as follows (in thousands):
2014 | 2013 | |||||||
Beginning Balance | $ | 2,736 | $ | 2,030 | ||||
Warranty costs incurred | (3,688 | ) | (4,194 | ) | ||||
Warranty expense accrued | 3,153 | 4,741 | ||||||
Balance acquired in acquisition | — | 107 | ||||||
Translation adjustments | (50 | ) | 52 | |||||
Ending balance | $ | 2,151 | $ | 2,736 | ||||
Research and Development—Expenditures for research and development are expensed when incurred.
Foreign Currency Translation—Assets and liabilities denominated in a foreign currency are translated to U.S. dollars at the exchange rate on the balance sheet date. Translation adjustments are shown as part of accumulated other comprehensive income (loss). Revenues, costs, and expenses are translated using an average rate. Realized and unrealized foreign currency transaction gains and losses are included in the consolidated statement of operations.
Impairment of Long-Lived Assets—The Company regularly reviews all of its long-lived assets, including property, plant and equipment, and amortizable intangible assets, for impairment whenever events or changes in circumstances indicate that the carrying value may not be recoverable. If the total of future undiscounted cash flows is less than the carrying amount of these assets, an impairment loss, if any, based on the excess of the carrying amount over the fair value of the assets, is recorded. There were no events during the period that indicated the carrying value of long-lived assets may be impaired.
42
Estimates—The preparation of financial statements in conformity with accounting principles generally accepted in the United States requires management to make estimates and assumptions that affect the reported amounts of assets and liabilities and disclosure of contingent assets and liabilities at the date of the financial statements and reported amounts of revenues and expenses during the reporting period. Actual results could differ from those estimates.
Termination Costs—In fiscal 2014, the Company announced certain cost reduction initiatives. As a result, the Company incurred approximately $1.2 million in costs related to the reduction in force, the majority of which relates to one-time termination benefits. Approximately $750,000 and $450,000 of these costs were expensed as cost of goods sold and operating expenses, respectively, in fiscal 2014. At September 30, 2014, approximately $226,000 remained accrued as liabilities for amounts expensed in fiscal 2014 that were not paid as of September 30, 2014. The Company expects that these amounts will be paid in the first and second quarters of fiscal 2015.
In fiscal 2012, the Company announced certain cost reduction initiatives. As a result, the Company incurred approximately $800,000 in costs related to the reduction in force, the majority of which relates to one-time termination benefits. In addition, the Company incurred approximately $500,000 of other employment separation charges during fiscal 2012. Approximately $1.0 million and $300,000 of these costs were expensed as operating expenses and costs of goods sold, respectively, in fiscal 2012.
Financial Instruments—The carrying value of the Company’s cash and cash equivalents, accounts receivable, accounts payable, accrued payroll liabilities and commissions, accrued customer support and warranty costs, and other accrued liabilities approximates their estimated fair values due to the short maturities of those instruments.
Derivative Financial Instruments—The Company recognizes all derivatives on the balance sheet at fair value. The Company enters into such instruments only with financial institutions of good standing, and the total credit exposure related to non-performance by those institutions is not material to the operations of the Company.
Earnings Per Share—Basic earnings per share (“EPS”) is computed by dividing net earnings available to common shareholders by the weighted average number of shares outstanding for the period. Diluted EPS is computed by dividing net earnings available to common shareholders by the weighted average common stock and common stock equivalent shares outstanding during each period using the treasury stock method for employee stock option plans, warrants and service-based stock awards. The calculation of the basic and diluted EPS from continuing operations is as follows (in thousands except per share data):
For the year ended September 30, 2014 | |||||||||||
Loss | Shares | Per-Share Amount | |||||||||
Basic EPS: | |||||||||||
Net loss available to common shareholders | $ | (5,413 | ) | 6,295 | $ | (0.86 | ) | ||||
Effect of dilutive securities: | |||||||||||
Common stock options | — | — | |||||||||
Warrants | — | — | |||||||||
Diluted EPS: | |||||||||||
Net loss available to common shareholders plus assumed conversions | $ | (5,413 | ) | 6,295 | $ | (0.86 | ) | ||||
43
For the year ended September 30, 2013 | |||||||||||
Earnings | Shares | Per-Share Amount | |||||||||
Basic EPS: | |||||||||||
Net earnings available to common shareholders | $ | 4,011 | 5,836 | $ | 0.69 | ||||||
Effect of dilutive securities: | |||||||||||
Common stock options | — | 5 | |||||||||
Warrants | — | 14 | |||||||||
Diluted EPS: | |||||||||||
Net earnings available to common shareholders plus assumed conversions | $ | 4,011 | 5,855 | $ | 0.69 | ||||||
For the year ended September 30, 2012 | |||||||||||
Earnings | Shares | Per-Share Amount | |||||||||
Basic EPS: | |||||||||||
Net earnings available to common shareholders | $ | 449 | 5,390 | $ | 0.08 | ||||||
Effect of dilutive securities: | |||||||||||
Common stock options | — | 9 | |||||||||
Diluted EPS: | |||||||||||
Net earnings available to common shareholders plus assumed conversions | $ | 449 | 5,399 | $ | 0.08 | ||||||
The weighted average number of diluted shares does not include potential common shares which are anti-dilutive. The following potential common shares were not included in the calculation of diluted EPS as they were anti-dilutive:
For the year ended September 30, | |||||||||
2014 | 2013 | 2012 | |||||||
Common shares from: | |||||||||
Assumed exercise of stock options | 10,000 | 10,000 | 10,000 | ||||||
Warrants | 250,000 | — | — | ||||||
The options expire in February 2015. The restrictions on stock grants may lapse between October 2014 and March 2017. The warrants expire in March 2016.
Comprehensive Income (loss)—In fiscal 2012, the Company reclassified losses of $209,000 for accumulated currency translation adjustments from Other Comprehensive Income to the results of operations in Other Income (expense).This reclassification was related to an operational restructuring where the Company announced that it believed it could most effectively address the China market through its existing distributor and representative partnerships. Operations related to the China market would continue through these sales channels and internal sales functions in the United States. In fiscal 2012, as part of the implementation of this decision, the Company closed its small China sales office operating as a wholly-owned foreign subsidiary, Key Technology (Shanghai) Trading Co. Ltd., which resulted in the liquidation of the assets and liabilities of the foreign subsidiary.
Share-Based Compensation—The Company measures the cost of share-based payments based on the grant-date fair value of the award. The cost is recognized as expense over the requisite service period required in exchange for the award. No compensation cost is recognized for awards where the requisite service period is not completed. For awards with a performance condition, compensation cost is only recognized if the performance condition is probable of being achieved.
Accounting for Income Taxes—Deferred income taxes are provided for the effects of temporary differences arising from differences in the reporting of revenues and expenses for financial statement and for income tax purposes under the asset and liability method using currently enacted tax rates. The Company recognizes the financial statement benefit of a tax
44
position only after determining that the relevant tax authority would more likely than not sustain the position following an audit. For tax positions meeting the more-likely-than-not threshold, the amount recognized in the financial statements is the largest benefit that has a greater than 50% likelihood of being realized upon ultimate settlement with the relevant tax authority.
Recent Accounting Pronouncements Not Yet Adopted—In May 2014, the Financial Accounting Standards Board (“FASB”) issued Accounting Standard Update (“ASU”) 2014-09, “Revenue from Contracts with Customers” (“ASU 2014-09”). ASU 2014-09 supersedes nearly all existing revenue recognition guidance under US GAAP. The standard’s core principle is that a company will recognize revenue when it transfers promised goods or services to customers in an amount that reflects the consideration to which the company expects to be entitled in exchange for those goods or services. We are evaluating our existing revenue recognition policies to determine whether any contracts in the scope of the guidance will be affected by the new requirements. ASU 2014-09 is effective for annual reporting periods beginning after December 15, 2016, including interim periods therein.
2. | ACQUISITION |
Effective February 28, 2013, the Company acquired all the outstanding stock of Visys N.V., a privately-held Belgian company. Accordingly, the results of operations for Visys N.V. have been included in the accompanying consolidated financial statements from that date forward. The acquisition was made for the purpose of acquiring and developing next-generation technologies and expanding the Company's product offerings consistent with its strategic growth initiatives.
Fair Value of Consideration - Consideration for the acquisition consisted of the following (at fair value):
Amount | ||||
(in thousands) | ||||
Cash | $ | 13,200 | ||
Common shares of the Company issued (600,000) | 7,327 | |||
Warrants issued (250,000) | 727 | |||
Total | $ | 21,254 | ||
Fair value of the Company's common shares issued was determined on the basis of the closing market price on the date of the closing of the acquisition. The fair value of the warrants was determined with a Black-Scholes valuation model using the current stock price at the acquisition date, time until expiration, a 34% volatility rate and a 0.36% risk-free interest rate. The warrants may be exercised within three years after the date of issue at a price per share of $11.78 as stated in the acquisition agreement. One-half of the warrants may be exercised following the first anniversary of the closing date and the other half following the second anniversary of the closing date. The warrants may be exercised for cash or on a cashless basis. No warrants were exercised as of September 30, 2014.
45
The following table summarizes the estimated fair values of the assets acquired and liabilities assumed at the acquisition date.
Amount | ||||
(in thousands) | ||||
Cash | $ | 1,593 | ||
Accounts receivable | 668 | |||
Inventory | 8,250 | |||
Property and equipment | 299 | |||
Other assets | 848 | |||
Intangible assets (identifiable) | 11,400 | |||
Current liabilities, including current portion of long term debt | (5,609 | ) | ||
Long term debt | (1,372 | ) | ||
Deferred taxes | (3,794 | ) | ||
Total identifiable net assets | 12,283 | |||
Goodwill | 8,971 | |||
$ | 21,254 | |||
Goodwill - Goodwill in the amount of $9.0 million was recognized in the acquisition of Visys N.V. and is attributable to the benefits expected to arise after the acquisition, including additional distribution and market penetration, which can be leveraged from the combined product portfolios. None of the total amount of goodwill recognized is expected to be deductible for income tax purposes.
The fair value of accounts receivable acquired was $668,000. The fair value of the $1.9 million of debt assumed in the acquisition approximated its carrying value.
The fair value of inventory acquired included an increase of $1.8 million related to the fair value adjustment of the acquisition date inventory.
Identified intangible assets acquired includes:
Amount | Average Life | |||||
(in thousands) | (Years) | |||||
Developed technology | $ | 5,000 | 8 | |||
Patents | 3,300 | 16 | ||||
Non-compete agreements | 1,600 | 3 | ||||
Trade name | 1,000 | 8 | ||||
Customer relationships | 500 | 4 | ||||
$ | 11,400 | |||||
The identifiable intangible assets of $11.4 million are subject to a weighted-average useful life of approximately 9.4 years.
46
Pro forma Information - The following consolidated pro forma information is based on the assumption that the acquisition occurred on October 1, 2012 (in thousands except per share data).
Year Ended September 30, | ||||||||
2013 (unaudited) | 2012 (unaudited) | |||||||
Net sales | $ | 141,549 | $ | 124,342 | ||||
Net earnings (loss) | $ | 4,685 | $ | (1,170 | ) | |||
Pro forma net earnings (loss) per share | $ | 0.77 | $ | (0.20 | ) | |||
Pro forma weighted average shares outstanding | 6,185 | 5,999 | ||||||
Pro forma net earnings was adjusted to exclude $785,000 of acquisition-related costs incurred in the year ended September 30, 2013 and $883,000 of non-recurring expenses related to the fair value adjustment of acquired inventory for the year ended September 30, 2013.
Acquisition-Related Costs - In fiscal 2013, costs related to the acquisition, which included legal, accounting and valuation fees, in the amount of $785,000 were charged directly to operations and were included in Operating expenses as General and Administrative expenses in the fiscal 2013 consolidated statement of operations. The Company also recognized $188,000 in costs associated with issuing the common stock and warrants issued as consideration in the acquisition. Those costs were deducted from the recognized proceeds of issuance within shareholders' equity.
Litigation - The acquired company was subject to litigation proceedings in Belgium and the Netherlands for alleged patent infringement and unfair competition claims seeking damages for lost profits, procedural costs and other damages. The cumulative amount of claims was in excess of €12.75 million. In fiscal 2014, the Company and Visys N.V. entered into a Settlement Agreement with Tomra Systems ASA and Tomra Sorting N.V. (formerly BEST N.V.) resolving all litigation related to alleged infringement of intellectual property rights owned by Tomra Sorting N.V. and Visys N.V., including all patent claims, trademark claims, counterclaims, invalidity proceedings, patent entitlement proceedings, and unfair competition claims. Under the Settlement Agreement, the parties settled all such disputes and waived all future rights of action related to the subject matter of the pending proceedings, which were withdrawn from the relevant court dockets. The Company recorded an expense related to the settlement of approximately $550,000 before tax in fiscal 2014.
3. | GOODWILL AND OTHER INTANGIBLE ASSETS |
As of September 30, 2014, the Company had the following intangible assets (in thousands):
Cost | Net Book Value | Amortization Life (Years) | |||||||||
Patents and developed technologies | $ | 18,421 | $ | 6,853 | 3 to 16 | ||||||
Trademarks and trade names | 970 | 778 | 8 | ||||||||
Customer relationships | 485 | 293 | 4 | ||||||||
Non-compete agreements | 1,551 | 732 | 3 | ||||||||
$ | 21,427 | $ | 8,656 | ||||||||
Amortization expense for the next five fiscal years is expected to be approximately:
47
Year Ended September 30, | (In thousands) | ||
2015 | $ | 1,622 | |
2016 | 1,283 | ||
2017 | 985 | ||
2018 | 928 | ||
2019 | 927 | ||
Thereafter | 2,911 | ||
Total | $ | 8,656 | |
As of September 30, 2014, the Company had $11.2 million of goodwill which is not being amortized. Other than the acquired goodwill in fiscal 2013, there were no changes to goodwill, other than foreign translation adjustments, during the fiscal years ended September 30, 2014 and 2013.
4. | TRADE ACCOUNTS RECEIVABLE |
Trade accounts receivable consist of the following (in thousands):
September 30, | ||||||||
2014 | 2013 | |||||||
Trade accounts receivable | $ | 12,972 | $ | 18,021 | ||||
Allowance for doubtful accounts | (415 | ) | (296 | ) | ||||
Total trade accounts receivable, net | $ | 12,557 | $ | 17,725 | ||||
Amounts charged to bad debt expense for fiscal 2014, 2013, and 2012 were $163,000, $2,000, and $24,000, respectively. Actual charges to the allowance for doubtful accounts for fiscal 2014, 2013, and 2012 were $30,000, $26,000, and $84,000, respectively.
48
5. INVENTORIES
Inventories consist of the following (in thousands):
September 30, | ||||||||
2014 | 2013 | |||||||
Purchased components and raw materials | $ | 10,321 | $ | 10,657 | ||||
Work-in-process and sub-assemblies | 9,505 | 7,802 | ||||||
Finished goods | 6,847 | 9,462 | ||||||
Total inventories | $ | 26,673 | $ | 27,921 | ||||
At September 30, 2014 and 2013, respectively, cumulative inventory adjustments to lower of cost or market totaled $4.0 million and $3.5 million. Amounts charged to cost of goods sold to record inventory at lower of cost or market were $1.5 million for fiscal 2014, $1.7 million for fiscal 2013, and $1.6 million for fiscal 2012. Actual charges to the cumulative inventory adjustments upon disposition or sale of inventory were $1.0 million, $0.9 million, and $0.8 million for fiscal 2014, 2013, and 2012, respectively.
6. | PROPERTY, PLANT AND EQUIPMENT |
Property, plant and equipment consist of the following (in thousands):
September 30, | ||||||||
2014 | 2013 | |||||||
Land and land improvements | $ | 2,596 | $ | 2,571 | ||||
Buildings and improvements | 9,205 | 9,161 | ||||||
Manufacturing equipment | 13,108 | 12,969 | ||||||
Computer equipment and software | 18,591 | 18,299 | ||||||
Office equipment, furniture and fixtures | 2,461 | 2,475 | ||||||
Construction in progress | 1,623 | 40 | ||||||
47,584 | 45,515 | |||||||
Accumulated depreciation | (30,932 | ) | (28,256 | ) | ||||
Total property, plant and equipment, net | $ | 16,652 | $ | 17,259 | ||||
Depreciation expense was $3.6 million, $3.9 million, and $3.6 million for fiscal 2014, 2013, and 2012, respectively.
7. | INVESTMENT IN PRODITEC |
In fiscal 2009, the Company acquired a 15% minority interest in Proditec SAS, a French manufacturer of automated, solid dose pharmaceutical inspection systems for approximately $1.5 million. The Company has certain tag along rights related to any capital changes at Proditec and may sell its shares to any third party subject to Proditec’s by-laws and right of pre-emption by Proditec. This investment is being accounted for under the cost method of accounting. In fiscal 2014 and 2013, the Company received $20,000 and $6,000, respectively, in dividends from Proditec which reduced the cost of the Company's investment.
49
As of September 30, 2014, the Company's non-controlling interest in Proditec had a carrying value of approximately $1.1 million and the fair value of the Company’s investment in Proditec was not estimated as there were no events or changes in circumstances that may have a significant adverse effect on the fair value of the investment, and the Company’s management determined that it was not practicable to estimate the fair value of the investment. Further, there are no quoted market prices for the Company’s investment, and sufficient information is not readily available for the Company to utilize a valuation model to determine its fair value without incurring excessive costs relative to the materiality of the investment. The Company’s cost method investment is evaluated for potential other-than-temporary impairment on at least a quarterly basis, or when an event or change in circumstances has occurred that may have a significant adverse effect on the fair value of the investment.
8. | FINANCING AGREEMENTS |
The Company’s domestic credit facility provides a revolving line of credit to the Company in the maximum principal amount of $15 million and a credit sub-facility of up to $6 million for standby letters of credit of which up to €3.0 million ($3.8 million) is available to our Netherlands facility. The revolving line of credit matures on March 31, 2016. The credit facility bears interest, at the Company’s option, at either the bank’s prime rate or the London Interbank Offered Rate (“LIBOR”) using a tiered structure depending upon the Company’s achievement of a specified financial ratio. The Company’s prime rate option will be either the bank’s prime rate plus 0.75%, 1.00% or 1.25% per annum. The Company’s LIBOR option will be either LIBOR plus 2.25%, 2.50% or 2.75% per annum. At September 30, 2014, the interest rate would have been 2.65% based on the lowest of the available alternative rates. The revolving line of credit is secured by all U.S. accounts receivable, inventory, land and buildings, equipment, and fixtures. At September 30, 2014 and 2013, the Company had no outstanding borrowings under the revolving line of credit and $752,000 and $548,000, respectively, in standby letters of credit.
The loan agreement also provided for a 15-year term loan in the amount of $6.4 million of which $4.5 million was outstanding as of September 30, 2014. The term loan provides for a mortgage on the Company’s Avery Street headquarters land and building located in Walla Walla, Washington. The term loan bears interest at the LIBOR rate plus 1.40% and matures on January 2, 2024. The Company has also simultaneously entered into an interest rate swap agreement with the lender to fix the interest rate at 4.27%.
The credit facilities contain covenants which require operating within a funded debt to EBITDA ratio, a fixed charge coverage ratio and minimum working capital levels. The loan agreement permits capital expenditures up to a certain level, and contains customary default and acceleration provisions. The credit facilities also restrict acquisitions, incurrence of additional indebtedness and lease expenditures above certain levels without the prior consent of the lender. In fiscal 2013, the relevant loan agreement was amended to permit the acquisition of Visys N.V. At September 30, 2014, the Company was not in compliance with its loan covenants. The Company has received a waiver from the bank. The Company does not expect such non-compliance to have any material effect on its operations.
The Company's Belgian subsidiary's credit accommodation with a commercial bank in Belgium provides a credit facility for its Belgian subsidiary. This credit accommodation totals €2.7 million ($3.4 million) and includes an operating line of €800,000 ($1.1 million), a bank guarantee facility of €500,000 ($0.6 million), and loan agreement provisions of €1.4 million ($1.8 million). The operating line and bank guarantee facility are secured by all of the subsidiary's current assets.The Belgian operating line bears interest at the bank's prime rate, plus 1.25%. At September 30, 2014, the interest rate was 9.75%. At September 30, 2014, the subsidiary had no borrowings under the operating line. At September 30, 2014, the subsidiary had various loans outstanding under the loan agreement provision totaling €0.8 million ($1.0 million). The fixed interest rates on these loans ranged from 2.91% to 3.98%. The loans mature between November 2016 and November 2017. The credit accommodation contains a covenant which requires the maintenance of a minimum tangible net worth and debt to EBITDA ratio levels at the subsidiary measured as of September 30 of each fiscal year. At September 30, 2014, the subsidiary was not in compliance with the bank covenants. The Company does not expect such non-compliance to have any material effect on its operations. At September 30, 2014, the subsidiary had no bank guarantees outstanding under the bank guarantee facility. Additionally, the subsidiary had a subordinated loan with another European lender of €78,000 ($99,000). The loan has a fixed interest rate of 4.99% and matures in March 2016.
50
Principal payments on long-term debt are as follows:
Year Ended September 30, | (In thousands) | ||
2015 | $ | 804 | |
2016 | 793 | ||
2017 | 693 | ||
2018 | 484 | ||
2019 | 471 | ||
Thereafter | 2,292 | ||
Total | $ | 5,537 | |
Based on the borrowing rates currently available to the Company for loans with similar terms and maturities, the fair value of long-term debt at September 30, 2014 approximates its carrying value.
9. | DERIVATIVE INSTRUMENTS |
The Company uses derivative instruments as risk management tools but does not use derivative instruments for trading or speculative purposes. Derivatives used for interest rate swap hedging purposes are designated and effective as a cash flow hedge of the identified risk exposure related to the Company’s variable rate mortgage at the inception of the contract. A hedge is deemed effective if changes in the fair value of the derivative contract are highly correlated with changes in the underlying hedged item at inception of the hedge and over the life of the hedge contract. To the extent the interest rate swap is effective, changes in the fair value will be recognized in Other Comprehensive Income over the term of the derivative contract. To the extent the interest rate swap is not effective, changes in the fair value will be recognized in earnings.
At September 30, 2014, the Company had an interest rate swap with a notional amount of $4.5 million that effectively fixes the interest rate on its LIBOR-based variable rate mortgage at 4.27%. At September 30, 2014, the fair value of the swap agreement recorded as a liability in Other long-term liabilities on the Consolidated Balance Sheet was $203,000. There were no gains or losses recognized as part of net earnings in the Consolidated Statement of Operations related to the swap agreement during the fiscal year ended September 30, 2014, as the interest rate swap was highly effective as a cash flow hedge. Consequently, changes in the fair value of the interest rate swap of $44,000 during fiscal 2014 were recorded as part of Other Comprehensive Income in the Equity section of the Company’s Consolidated Balance Sheet. During fiscal 2014, the Company recorded $127,000 as interest expense related to the interest rate swap reflecting actual interest payments and settlements on the interest rate swap. The interest rate swap matures in January 2024.
At September 30, 2014, the Company had a one-month undesignated forward exchange contract for €3.5 million ($4.4 million). Forward exchange contracts are used to manage the Company’s foreign currency exchange risk related to its ongoing operations. Net foreign currency gains of $574,000 were recorded for forward exchange contracts in the year ended September 30, 2014 in Other income (expense) on the Company’s Consolidated Statement of Operations. The gains on the Company’s forward exchange contracts are generally offset by losses recorded on the underlying assets or liabilities held in foreign currencies. At September 30, 2014, the Company had assets of $278,000 for settlements under these forward contracts in Other Current Assets on the Company’s Consolidated Balance Sheet. At September 30, 2013, the Company had liabilities of $46,000 under these forward contracts in Other accrued liabilities on the Company’s Consolidated Balance Sheet.
10. | FAIR VALUE MEASUREMENTS |
Fair value measurements are classified under the following hierarchy:
• | Level 1 – Quoted prices for identical instruments in active markets. |
• | Level 2 – Quoted prices for similar instruments in active markets; quoted prices for identical or similar instruments in markets that are not active; and model-derived valuations in which all significant inputs or significant value-drivers are observable in active markets. |
• | Level 3 – Model-derived valuations in which one or more significant inputs or significant value-drivers are unobservable. |
51
When available, the Company uses quoted market prices to determine fair value and classifies such measurements within Level 1. In some cases where market prices are not available, the Company makes use of observable market-based inputs to calculate fair value, in which case the measurements are classified within Level 2. If quoted or observable market processes are not available, fair value is based upon internally developed models that use, where possible, current market-based parameters such as interest rates, yield curves and currency rates. These measurements are classified within
Level 3.
Derivative financial instruments
Interest rate swap agreements are measured on a recurring basis based on quoted prices for similar financial instruments and other observable inputs which approximate fair value. The fair value of foreign currency forward contracts is based on the differential between contract price and the market-based forward rate.
The following table presents the Company’s assets and liabilities that are measured and recorded at fair value on a recurring basis consistent with the fair value hierarchy provisions.
Fair Value Measurements at September 30, 2014, (in thousands) | ||||||||||||||
Description | Level 1 | Level 2 | Level 3 | Total Assets/Liabilities at Fair Value | ||||||||||
Derivatives: | ||||||||||||||
Interest rate swap | — | $ | (203 | ) | — | $ | (203 | ) | ||||||
Forward exchange contracts | — | — | — | — | ||||||||||
At September 30, 2014, the Company had long-term debt of approximately $5.5 million. The Company’s long-term debt is recorded at historical cost, and the Company has not elected to fair value such financial instruments. The estimated fair value of the debt approximated its carrying value based on the borrowing rates currently available to the Company for loans with similar terms and maturities.
Fair value estimates are made at a specific point in time based on relevant market information and information about the financial instrument. These estimates are subjective in nature and involve uncertainties and matters of significant judgment and, therefore, cannot be determined with precision. Forward exchange contracts had a fair value of zero at the reporting date, as these contracts were entered into as of that date. Changes in assumptions could significantly affect these estimates.
11. | LEASES |
The Company has a leased sales facility in Washington State. The lease expires in 2015, with two five year renewal options. The Company has the option to purchase the facility at any time over the rental period for $1.5 million declining to $1.4 million during the remaining lease term. The Company has a leased operating facility in Oregon under a lease that expires in 2022, with two five-year renewal options. The Company has leased an operating facility in The Netherlands under a lease that expires in 2020, with a five-year renewal option, and a leased warehouse facility under a lease that expires in 2020 with a five year renewal option. The Company has a leased operating facility in Belgium under a lease that expires in 2016, with a three-year renewal option. The Company also has leased office space for sales and service and other activities in Australia, Mexico, and Belgium, and other leased facilities in Walla Walla. The Company also has leased vehicles, primarily in international locations.
Rental expense is recognized on a straight-line basis over the term of the lease. Rental expense for the Company’s operating leases referred to above was $1.6 million for the year ended September 30, 2014, $1.3 million for the year ended September 30, 2013, and $1.2 million for the year ended September 30, 2012.
52
The following is a schedule of future minimum rental payments required under operating leases and future rental expense (in thousands):
Year Ending September 30, | Rental Payments | Rental Expense | ||||||
2015 | $ | 1,133 | $ | 1,144 | ||||
2016 | 929 | 937 | ||||||
2017 | 768 | 772 | ||||||
2018 | 665 | 664 | ||||||
2019 | 590 | 586 | ||||||
Thereafter | 855 | 812 | ||||||
Total | $ | 4,940 | $ | 4,915 | ||||
12. | CONTRACTUAL GUARANTEES AND INDEMNITIES |
Intellectual property and general contractual indemnities
The Company, in the normal course of business, provides specific, limited indemnification to its customers for liability and damages related to intellectual property rights. In addition, the Company may enter into contracts with customers where it has agreed to indemnify the customer for personal injury or property damage caused by the Company’s products and services. Indemnification is typically limited to replacement of the items or the actual price of the products and services. The Company maintains product liability insurance as well as errors and omissions insurance, which may provide a source of recovery in the event of an indemnification claim, but does not maintain insurance coverage for claims related to intellectual property rights.
Historically, any amounts payable under these indemnifications have not had a material effect on the Company’s business, financial condition, results of operations, or cash flows. The Company has not recorded any provision for future obligations under these indemnifications. If the Company determines it is probable that a loss has occurred under these indemnifications, then any such reasonably estimable loss would be recognized.
Director and officer indemnities
The Company has entered into indemnification agreements with its directors and certain executive officers that require the Company to indemnify such individuals against certain expenses, judgments and fines in third-party and derivative proceedings. The Company may recover, under certain circumstances, some of the expenses and liabilities that arise in connection with such indemnifications under the terms of its directors’ and officers’ insurance policies. The Company has not recorded any provision for future obligations under these indemnification agreements.
Bank guarantees and letters of credit
At September 30, 2014, the Company had standby letters of credit totaling $752,000, which includes secured bank guarantees under the Company's domestic and European credit facilities. If the Company fails to meet its contractual obligations, these bank guarantees and letters of credit may become liabilities of the Company. This amount consists of approximately $752,000 of outstanding performance guarantees secured by bank guarantees under the Company's domestic credit facility, and no outstanding performance guarantees secured by bank guarantees under the Company's Belgian subsidiary's credit facility. Bank guarantees arise when the Company collects customer deposits prior to order fulfillment. The customer deposits received are recorded as current liabilities on the Company's balance sheet. The bank guarantees repayment of the customer deposit in the event an order is not completed. The bank guarantee is canceled upon shipment and transfer of title. These bank guarantees arise in the normal course of the Company's business and are not deemed to expose the Company to any significant risks since they are satisfied as part of the design and manufacturing process.
53
13. | INCOME TAXES |
The provision (benefit) for income taxes from continuing operations consists of the following (in thousands):
Year Ended September 30, | ||||||||||||
2014 | 2013 | 2012 | ||||||||||
Current: | ||||||||||||
Federal | $ | (2,643 | ) | $ | 4,381 | $ | 255 | |||||
Foreign | 3 | 14 | 10 | |||||||||
State | (27 | ) | 387 | 35 | ||||||||
(2,667 | ) | 4,782 | 300 | |||||||||
Deferred: | ||||||||||||
Federal | 563 | (2,180 | ) | (101 | ) | |||||||
Foreign | (628 | ) | (1,092 | ) | (48 | ) | ||||||
State | (107 | ) | (110 | ) | (11 | ) | ||||||
(172 | ) | (3,382 | ) | (160 | ) | |||||||
Valuation reserves: | ||||||||||||
Federal | 50 | 137 | (1,749 | ) | ||||||||
Foreign | (46 | ) | (135 | ) | 1,754 | |||||||
State | 1 | — | — | |||||||||
5 | 2 | 5 | ||||||||||
Total income tax expense (benefit) | $ | (2,834 | ) | $ | 1,402 | $ | 145 | |||||
The Company accounts for its deferred tax assets and liabilities, including excess tax benefits of share-based payments, based on the tax ordering of deductions to be used on its tax returns. The tax effects of temporary differences that give rise to significant portions of deferred tax assets and deferred tax liabilities are as follows (in thousands):
September 30, | ||||||||
2014 | 2013 | |||||||
Deferred tax asset: | ||||||||
Reserves and accruals | $ | 3,891 | $ | 4,807 | ||||
Tax benefits of share-based payments | 684 | 704 | ||||||
NOL and other carry forwards | 711 | 878 | ||||||
Unrealized changes in value of derivatives to equity | 69 | 84 | ||||||
Deferred tax liability: | ||||||||
Accumulated depreciation | (946 | ) | (1,437 | ) | ||||
Intangible assets | (3,287 | ) | (4,025 | ) | ||||
Translation adjustment to equity | 21 | (443 | ) | |||||
Net deferred tax asset | $ | 1,143 | $ | 568 | ||||
Net deferred tax: | ||||||||
Current asset | $ | 3,809 | $ | 5,034 | ||||
Long-term asset | 615 | 760 | ||||||
Long-term liability | (3,281 | ) | (5,226 | ) | ||||
Net deferred tax asset | $ | 1,143 | $ | 568 | ||||
At September 30, 2014, the Company had valuation reserves of approximately $185,000 for deferred tax assets for capital loss carry forwards and changes in the carrying value of its investment in Proditec, and offsetting amounts for foreign deferred tax assets and U.S. deferred tax liabilities, primarily related to net operating loss carry forwards in the foreign jurisdictions that the Company believes will not be utilized during the carryforward period. During fiscal 2014, the Company recorded net additional valuation reserves of $5,000 related to capital loss carryforwards. In addition, the Company reversed offsetting amounts of approximately $46,000 of valuation reserves for foreign deferred tax assets and
54
U.S. deferred tax liabilities related to the utilization of net operating loss carryforwards in Europe in fiscal 2014. As these were offsetting amounts, these changes had no effect on net earnings. There were no other valuation allowances at September 30, 2014 due to anticipated utilization of all the deferred tax assets as the Company believes it will have sufficient taxable income to utilize these assets.
During fiscal 2013, the Company recorded net additional valuation reserves of $2,000 related to capital loss carryforwards and $3,000 as part of the acquisition of Visys related to net operating loss carryforwards. In addition, the Company reversed offsetting amounts of approximately $135,000 of valuation reserves for foreign deferred tax assets and U.S. deferred tax liabilities related to the utilization of net operating loss carryforwards in Europe in fiscal 2013. As these were offsetting amounts, these changes had no effect on net earnings.
During fiscal 2012, the Company recorded net additional valuation reserves of $5,000 related to capital loss carryforwards. In addition, the Company recorded offsetting amounts of approximately $2.5 million of valuation reserves for foreign deferred tax assets and U.S. deferred tax liabilities related to net operating loss carryforwards in foreign jurisdictions that the Company believes will not be utilized during the carryforward periods. The Company also reversed offsetting amounts of approximately $700,000 of valuation reserves for Chinese deferred tax assets and U.S. deferred tax liabilities related to net operating loss carryforwards that were utilized in the foreign jurisdiction. As these were all offsetting amounts, these changes had no effect on net earnings.
Income tax expense is computed at rates different than statutory rates. The reconciliation between effective and statutory rates is as follows:
Year Ended September 30, | |||||||||
2014 | 2013 | 2012 | |||||||
Statutory rates | (34.0 | )% | 34.0 | % | 34.0 | % | |||
Increase (reduction) in income taxes resulting from: | |||||||||
Domestic production deduction | 1.3 | % | (6.5 | )% | (7.5 | )% | |||
Research and development credit | (1.3 | )% | (6.2 | )% | (13.3 | )% | |||
Changes in tax law, R&D credit | — | % | (3.5 | )% | — | % | |||
State income taxes, net of federal benefit | (1.0 | )% | 3.4 | % | 2.7 | % | |||
Rate differential, surtax on taxable income levels | (0.5 | )% | 0.8 | % | — | % | |||
Differences in foreign effective tax rates | 0.4 | % | 0.1 | % | — | % | |||
Non-deductible acquisition costs | — | % | 2.5 | % | — | % | |||
Valuation reserve-capital losses | — | % | — | % | (0.7 | )% | |||
Valuation reserve-Proditec | 0.1 | % | — | % | 1.5 | % | |||
Meals and entertainment deduction limitation | 0.8 | % | 1.2 | % | 9.6 | % | |||
Non-deductible stock compensation | — | % | 0.1 | % | 0.8 | % | |||
Other permanent differences | (0.2 | )% | — | % | (2.7 | )% | |||
Income tax combined effective rate | (34.4 | )% | 25.9 | % | 24.4 | % | |||
In fiscal 2013, the existing research and development tax credit was retroactively renewed and extended to December 31, 2013. Due to this change in tax law, the Company recorded approximately $192,000 of additional research and development credits in fiscal 2013 related to research and development expenditures incurred during fiscal 2012. The research and development credit was effective for the Company for only the first fiscal quarter of 2012 prior to its expiration date.
A reconciliation of the beginning and ending amount of unrecognized tax benefits is as follows (in thousands):
Balance at October 1, 2013 | $ | 126 | |
Additions based on tax positions related to the current period | 4 | ||
Reductions for tax positions of prior periods | (21 | ) | |
Balance at September 30, 2014 | $ | 109 | |
55
As of September 30, 2014, the amount of unrecognized tax benefits, which if recognized would favorably affect the Company’s effective tax rate, is $109,000.
The Company is subject to income taxes in the U.S. federal jurisdiction and various state and foreign jurisdictions. Tax regulations within each jurisdiction are subject to the interpretation of the related tax laws and regulations and require significant judgment to apply. The Company is generally no longer subject to U.S. federal, state and local, or non-U.S. income tax examinations by tax authorities for the years before 2009.
The Company is not currently under examination by any U.S. federal or state jurisdictions, or foreign jurisdictions, and there are no expected material changes in the unrecognized tax benefit liability within the next twelve months. While it is often difficult to predict the final outcome or the timing of resolution of any particular uncertain tax positions, the Company believes its recorded liabilities for income taxes represent the most probable outcome. The Company adjusts these liabilities in light of changing facts and circumstances.
The Company recognizes interest accrued related to unrecognized tax benefits in interest expense and penalties in other income and expense for all periods presented. As of September 30, 2014 and 2013, the Company had accrued $35,000 and $42,000, respectively, for possible interest and penalties.
14. | SHARE-BASED COMPENSATION PLANS |
At September 30, 2014, the Company had three share-based compensation plans, which are shareholder-approved, as described below. The Company issues new shares of common stock for exercises and awards under these plans and non-employee awards.
Share-based compensation costs charged against income are as follows (in thousands):
Year Ended September 30, | ||||||||||||
2014 | 2013 | 2012 | ||||||||||
Cost of goods sold | $ | 218 | $ | 200 | $ | 126 | ||||||
Operating expenses | 1,227 | 1,076 | 1,056 | |||||||||
Total share-based compensation expense | 1,445 | 1,276 | 1,182 | |||||||||
Income tax benefit | 516 | 455 | 420 | |||||||||
Approximately $25,000, $21,000, and $11,000 of share-based compensation expense remained capitalized in inventory as of September 30, 2014, 2013, and 2012, respectively.
As of September 30, 2014, the total unrecognized compensation cost related to these plans was $1.7 million and was composed of: $1.7 million related to service-based stock awards that is expected to be recognized over a weighted-average period of 1.55 years and $0 related to performance-based stock awards that are expected to be recognized over the weighted-average period of 1.13 years.
Employees’ Stock Incentive Plans—Under the 2010 Equity Incentive Plan and the 2003 Restated Employees’ Stock Incentive Plan (the “Incentive Plans”), eligible employees may receive restricted stock, incentive stock options or non-qualified stock options. The restrictions on restricted stock awards lapse based on employment-based or performance-based measures. Options have a contractual term of 10 years and the option exercise price is the fair market value of the underlying stock at the date of grant. At September 30, 2014, the total number of shares reserved for issuance under the Incentive Plans was 922,542, of which 410,046 were available for grant.
56
Incentive Stock Options—A summary of option activity under the Incentive Plan as of September 30, 2014 and the year then ended is presented below:
Options | Number of Shares | Weighted-Average Exercise Price | Weighted-Average Remaining Contractual Term | Aggregate Intrinsic Value ($000) | ||||||||||
Outstanding at October 1, 2013 | 25,000 | $ | 12.32 | — | — | |||||||||
Granted | — | — | — | — | ||||||||||
Exercised | (5,000 | ) | $ | 11.22 | — | — | ||||||||
Forfeited or expired | (10,000 | ) | 15.55 | — | — | |||||||||
Outstanding at September 30, 2014 | 10,000 | $ | 9.64 | 0.35 | $ | 36 | ||||||||
Exercisable at September 30, 2014 | 10,000 | $ | 9.64 | 0.35 | $ | 36 | ||||||||
There were no options granted in fiscal 2014, 2013, or 2012. The total intrinsic value of options exercised during the years ended September 30, 2014, 2013, and 2012 was $10,000, $66,000, and $108,000, respectively. No shares vested in fiscal 2014, 2013 or 2012.
As of September 30, 2014, there was no unrecognized compensation cost related to stock options granted under the Incentive Plans.
Service-Based Stock Awards—Under the Incentive Plans, the Company may award service-based stock grants to selected executives and other key employees, the lapse of the restrictions on which is contingent upon meeting the required service period, generally two or three years, and in the case of certain executives, in increments over a three-year period, or in the case of members of the board of directors, one year. The fair value of these grants is based on the closing fair market value at the grant date. The restrictions on the grants lapse at the end of the required service period. Stock compensation expense is recognized based on the grant date fair value of the stock over the vesting period.
The summary of activity for service-based stock awards as of September 30, 2014, and changes during the year then ended, is presented below:
Service-Based Stock Awards | Number of Shares | Weighted-Average Grant Date Fair Value per Share | |||||
Non-vested balance at October 1, 2013 | 252,235 | $ | 12.86 | ||||
Granted | 95,522 | $ | 13.67 | ||||
Vested | (69,629 | ) | $ | 14.73 | |||
Forfeited | (6,850 | ) | $ | 13.39 | |||
Non-vested and expected to vest balance at September 30, 2014 | 271,278 | $ | 12.66 | ||||
The number of shares granted in fiscal 2014 that vest in one year or less was 30,767, vest in two years was 14,127, and vest in three years was 50,628. The total fair value of shares vested in fiscal 2014, 2013, and 2012 was $0.9 million, $1.5 million, and $0.9 million, respectively. As of September 30, 2014, there was $1.7 million of total unrecognized compensation cost related to service-based stock awards that is expected to be recognized over a weighted-average period of 1.55 years. In fiscal 2013, the Company granted 178,163 shares of service-based awards with a weighted average grant date fair value of $11.65. In fiscal 2012, the Company granted 95,805 shares of service-based awards with a weighted average grant date fair value of $13.06.
Employee Performance-Based Stock Awards—In fiscal 2014, the Company awarded performance-based stock grants to selected executives. The lapse of restrictions on the awards is contingent on achievement of performance-based objectives as determined by the Compensation and Management Development Committee of the Board of Directors over a three-year period ending September 30, 2016. In fiscal 2013, the Company awarded performance-based stock grants
57
to selected executives. The lapse of restrictions on some of the awards is contingent on achievement of performance-based objectives as determined by the Compensation and Management Development Committee of the Board of Directors over a three-year period ending September 30, 2015. In fiscal 2012, the Company awarded performance-based stock grants to selected executives. The lapse of restrictions on some of the awards was contingent on achievement of performance-based objectives as determined by the Compensation and Management Development Committee of the Board of Directors for the fiscal year ended September 30, 2014.
Compensation expense is recognized over the period the employee performs related services based on the estimated number of shares expected to vest at the grant date fair value and if it is probable that the performance goal will be achieved. If the performance goals are not met or the service period is not fulfilled, no compensation cost is recognized and any recognized compensation cost will be reversed.
A summary of the activity for performance-based stock awards as of September 30, 2014, and changes during the year then ended, is presented below:
Performance-Based Stock Awards | Number of Shares | Weighted-Average Grant Date Fair Value per Share | |||||
Non-vested balance at October 1, 2013 | 175,046 | $ | 13.94 | ||||
Granted | 75,013 | $ | 13.80 | ||||
Vested | — | ||||||
Forfeited | (18,841 | ) | $ | 17.94 | |||
Non-vested balance at September 30, 2014 | 231,218 | $ | 13.57 | ||||
The total fair value of shares that vested in fiscal 2014, 2013, and 2012 was $0, $0, and $0, respectively. The Company estimates it is less than probable that the performance based objectives will be achieved on all these awards and, therefore, no compensation cost is expected to be recognized on these awards. During fiscal 2014, the Company determined that 5,304 shares, where the achievement of the performance based objectives were previously considered probable, were no longer estimated to be probable. As a result, in fiscal 2014 the Company reversed approximately $22,000 of compensation expense that had been recorded in the prior fiscal year. As of September 30, 2014, there was no unrecognized compensation cost related to the performance-based stock awards. In fiscal 2013, the Company granted 103,026 shares of performance based awards with a grant date fair value of $14.67. In fiscal 2012, the Company granted 92,910 shares of performance-based awards with a grant date fair value of $11.20.
Employee Stock Purchase Plan—Most employees are eligible to participate in the Company’s Employee Stock Purchase Plan (the “Purchase Plan”). Shares are not available to employees who already own 5% or more of the Company’s stock. Employees can withhold, by payroll deductions, up to 5% of their regular compensation to purchase shares at a purchase price of 85% of the fair market value of the common stock on the purchase date. There were 500,000 shares reserved for purchase under the Purchase Plan of which 351,756 remained available at September 30, 2014.
During the years ended September 30, 2014, 2013, and 2012, the Company issued 6,013, 6,257, and 8,417 shares, respectively, under the Purchase Plan and recorded compensation cost based on the 15% discount from market price paid by the employees.
Cash received from option exercises and employee stock purchase plan purchases was $124,000, $95,000, and $94,000 for the years ended September 30, 2014, 2013 and 2012, respectively. The tax benefit to be realized for the tax deductions from option exercises and restricted shares vesting under the share-based payment arrangements was $412,000, $453,000, and $392,000 for the years ended September 30, 2014, 2013 and 2012, respectively.
58
15. | STOCK REPURCHASE PROGRAM |
The Company initiated a stock repurchase program effective May 30, 2012 to repurchase up to 500,000 shares of its common stock. The timing of any repurchases and the exact number of shares to be purchased will be determined by the Company and will depend on market conditions and other factors. The Company retires the shares upon repurchase. The program does not incorporate a fixed expiration date. In fiscal 2014, the Company did not repurchase any shares. In fiscal 2013, the Company purchased and retired 3,288 shares at an average price of $9.20 per share. In fiscal 2012, the Company purchased and retired 67,509 shares at an average price of $9.83 per share. Included in the 2012 amount was the repurchase of 25,000 shares of Common Stock from a former executive under the terms of a separation agreement. The shares were purchased at an average price of $9.88 per share based on the daily closing price of the Company's Common Stock on The NASDAQ Global Market less $0.03 per share. The total purchase price paid was approximately $247,000. The aggregate purchase price of the shares repurchased under the program has been reflected as a reduction in shareholders' equity.
16. | EMPLOYEE BENEFIT PLANS |
The Company has a 401(k) profit sharing plan which covers substantially all United States employees. The Company matches 50% of employee contributions for a maximum match of 4% of each participating employee’s compensation. The Company contributed $714,000, $632,000, and $676,000 in matching funds to the plan for the years ended September 30, 2014, 2013 and 2012, respectively.
17. | SEGMENT INFORMATION |
The Company’s business units serve customers in its primary market—the food processing and agricultural products industry—through common sales and distribution channels. Therefore, the Company reports on one segment. The following table summarizes information about products and services (in thousands).
Year Ended September 30, | ||||||||||||
2014 | 2013 | 2012 | ||||||||||
Net sales by product category: | ||||||||||||
Automated inspection systems | $ | 55,829 | $ | 59,336 | $ | 46,586 | ||||||
Process systems | 34,580 | 50,729 | 44,940 | |||||||||
Parts and service | 27,849 | 26,718 | 23,648 | |||||||||
Total net sales by product category | $ | 118,258 | $ | 136,783 | $ | 115,174 | ||||||
Net sales for service were less than 10% of total net sales for the years ended September 30, 2014, 2013, and 2012, respectively, and is therefore summarized with parts and service. Upgrades of automated inspection systems are included with automated inspection systems.
59
The following table summarizes certain information about geographic areas (in thousands):
Year Ended September 30, | ||||||||||||
2014 | 2013 | 2012 | ||||||||||
Net sales: | ||||||||||||
Domestic | $ | 61,421 | $ | 75,423 | $ | 63,831 | ||||||
International | 56,837 | 61,360 | 51,343 | |||||||||
Total net sales | $ | 118,258 | $ | 136,783 | $ | 115,174 | ||||||
Long-lived assets: | ||||||||||||
Domestic | $ | 17,221 | $ | 17,812 | ||||||||
International | 20,438 | 23,446 | ||||||||||
Total long-lived assets | $ | 37,659 | $ | 41,258 | ||||||||
There was one customer that accounted for greater than 10% of net sales during fiscal 2014, 2013 and 2012. There was one additional customer that individually accounted for 10% of net sales during fiscal 2013. No single country outside the United States accounted for more than 10% of net sales in 2014, 2013 or 2012. Location of the customer is the basis for the categorization of net sales.
60
* * * * * *
SUPPLEMENTARY DATA
QUARTERLY FINANCIAL INFORMATION (Unaudited)
The following is a summary of operating results by quarter for the years ended September 30, 2014 and 2013 (in thousands, except per share data):
2014 Quarter Ended | December 31 | March 31 | June 30 | September 30 | Total | |||||||||||||||
Net sales | $ | 22,725 | $ | 31,598 | $ | 31,292 | $ | 32,643 | $ | 118,258 | ||||||||||
Gross profit | 6,170 | 10,264 | 8,150 | 9,713 | 34,297 | |||||||||||||||
Net loss | (2,606 | ) | (697 | ) | (2,023 | ) | (88 | ) | (5,413 | ) | ||||||||||
Net loss per share - basic | $ | (0.42 | ) | $ | (0.11 | ) | $ | (0.32 | ) | $ | (0.01 | ) | $ | (0.86 | ) | |||||
Net loss per share - diluted | $ | (0.42 | ) | $ | (0.11 | ) | $ | (0.32 | ) | $ | (0.01 | ) | $ | (0.86 | ) | |||||
2013 Quarter Ended | December 31 | March 31 | June 30 | September 30 | Total | |||||||||||||||
Net sales | $ | 19,854 | $ | 35,486 | $ | 39,433 | $ | 42,012 | $ | 136,783 | ||||||||||
Gross profit | 6,484 | 12,813 | 13,302 | 13,447 | 46,044 | |||||||||||||||
Net earnings (loss) | (874 | ) | 2,146 | 1,444 | 1,295 | 4,011 | ||||||||||||||
Net earnings (loss) per share - basic | $ | (0.16 | ) | $ | 0.38 | $ | 0.23 | $ | 0.21 | $ | 0.69 | |||||||||
Net earnings (loss) per share - diluted | $ | (0.16 | ) | $ | 0.38 | $ | 0.23 | $ | 0.21 | $ | 0.69 | |||||||||
Note: Annual totals may not agree to the summarization of quarterly information due to insignificant rounding and the required calculation conventions.
* * * * * *
61
ITEM 9. | CHANGES IN AND DISAGREEMENTS WITH ACCOUNTANTS ON ACCOUNTING AND FINANCIAL DISCLOSURE. |
None.
ITEM 9A. | CONTROLS AND PROCEDURES. |
Evaluation of Disclosure Controls and Procedures
Our management, with the participation of our President and Chief Executive Officer and Vice President and Chief Financial Officer, conducted an evaluation of the effectiveness of the design and operation of our disclosure controls and procedures, as required by Exchange Act Rule 13a-15. Based on that evaluation, the President and Chief Executive Officer and Vice President and Chief Financial Officer have concluded that, as of the end of the period covered by this report, our disclosure controls and procedures were effective to ensure that information required to be disclosed by us in the reports that we file or submit under the Exchange Act is recorded, processed, summarized and reported within the time periods specified by the SEC’s rules and forms and such information is accumulated and communicated to management as appropriate to allow timely decisions regarding required disclosures.
Management’s Report on Internal Control over Financial Reporting
Our management is responsible for establishing and maintaining adequate internal control over financial reporting. Our internal control over financial reporting is a process designed under the supervision of our President and Chief Executive Officer and Vice President and Chief Financial Officer to provide reasonable assurance regarding the reliability of financial reporting and the preparation of our financial statements for external reporting in accordance with accounting principles generally accepted in the United States of America. Management evaluates the effectiveness of our internal control over financial reporting using the criteria set forth by the Committee of Sponsoring Organizations of the Treadway Commission (COSO) in “Internal Control – Integrated Framework (1992).” Management, under the supervision and with the participation of our President and Chief Executive Officer and Vice President and Chief Financial Officer, assessed the effectiveness of the design and operation of our internal control over financial reporting as of September 30, 2014 and concluded that our internal control over financial reporting was effective.
Attestation Report of the Company’s Independent Registered Public Accounting Firm
Our independent registered public accounting firm, Grant Thornton LLP, has audited the effectiveness of our internal control over financial reporting as of September 30, 2014, and has issued an attestation report expressing an unqualified opinion on our internal control over financial reporting, which appears in this Annual Report on Form 10-K.
Changes in Internal Controls
There were no changes in our internal control over financial reporting identified in connection with the evaluation referred to above that occurred during the fourth quarter of the fiscal year ended September 30, 2014 that have materially affected, or are reasonably likely to materially affect, our internal control over financial reporting.
Limitations on the Effectiveness of Controls
We believe that a control system, no matter how well designed and operated, cannot provide absolute assurance that the objectives of the control system are met, and no evaluation of controls can provide absolute assurance that all controls issues and instances of fraud, if any, within a Company have been detected. Our disclosure controls and procedures are designed to provide reasonable assurance of achieving their objectives, and our President and Chief Executive Officer and Vice President and Chief Financial Officer have concluded that such controls and procedures are effective at the “reasonable assurance” level.
62
PART III
ITEM 10. | DIRECTORS, EXECUTIVE OFFICERS AND CORPORATE GOVERNACE. |
There is hereby incorporated by reference the information under the captions “Information About Key’s Board of Directors,” “Election of Directors,” “Section 16(a) Beneficial Ownership Reporting Compliance” and “Report of the Audit Committee of the Board of Directors” in our definitive Proxy Statement to be filed pursuant to Regulation 14A, which Proxy Statement is expected to be filed with the Securities and Exchange Commission within 120 days after the end of our fiscal year ended September 30, 2014.
ITEM 11. | EXECUTIVE COMPENSATION. |
There is hereby incorporated by reference the information under the captions “Compensation Discussion and Analysis,” "Compensation Committee Interlocks and Insider Participation," “Compensation and Management Development Committee Report” and “Executive Compensation” in our definitive Proxy Statement to be filed pursuant to Regulation 14A, which Proxy Statement is expected to be filed with the Securities and Exchange Commission within 120 days after the end of our fiscal year ended September 30, 2014.
ITEM 12. | SECURITY OWNERSHIP OF CERTAIN BENEFICIAL OWNERS AND MANAGEMENT AND RELATED STOCKHOLDER MATTERS. |
There is hereby incorporated by reference the information under the captions “Principal Shareholders” and "Executive Compensation" in our definitive Proxy Statement to be filed pursuant to Regulation 14A, which Proxy Statement is expected to be filed with the Securities and Exchange Commission within 120 days after the end of our fiscal year ended September 30, 2014.
ITEM 13. | CERTAIN RELATIONSHIPS AND RELATED TRANSACTIONS, AND DIRECTOR INDEPENDENCE. |
There is hereby incorporated by reference the information under the caption “Information About Key’s Board of Directors” in our definitive Proxy Statement to be filed pursuant to Regulation 14A, which Proxy Statement is expected to be filed with the Securities and Exchange Commission within 120 days after the end of our fiscal year ended September 30, 2014.
ITEM 14. | PRINCIPAL ACCOUNTANT FEES AND SERVICES. |
There is hereby incorporated by reference the information under the caption “Audit Committee Report and Other Related Matters” in our definitive Proxy Statement to be filed pursuant to Regulation 14A, which Proxy Statement is expected to be filed with the Securities and Exchange Commission within 120 days after the end of our fiscal year ended September 30, 2014.
63
PART IV
ITEM 15. | EXHIBITS AND FINANCIAL STATEMENT SCHEDULES. |
PAGE
(a) | The following documents are filed as part of this report: |
1. Financial Statements:
Reference is made to Part II, Item 8, for a listing of required financial statements filed with this report | 31 |
2. Financial Statement Schedules:
Financial statement schedules are omitted because they are not applicable or the required information is included in the accompanying consolidated financial statements or notes thereto. | |
3. Exhibits:
(3) | Articles of Incorporation and Bylaws |
(3.1) | Registrant’s Restated Articles of Incorporation of Key Technology, Inc. (as of May 6, 2008) (filed as Exhibit 3.1 to the Form 10-Q filed with the Securities and Exchange Commission on May 9, 2008 and incorporated herein by reference) |
(3.2) | Registrant’s Amended and Restated Bylaws (as amended through May 13, 2009) (filed as Exhibit 3.2 to the Form 10-K filed with the SEC on December 9, 2011 and incorporated herein by reference) |
(4) | Instruments defining the rights of security holders, including indentures |
(4.1) | Registrant’s Second Amended and Restated Rights Agreement, dated as of November 13, 2007, between the Registrant and American Stock Transfer & Trust Company (filed as Exhibit 10.1 to the Form 8-K filed with the Securities and Exchange Commission on November 19, 2007 and incorporated herein by reference) |
(10) | Material contracts |
(10.1)* | Restated 1996 Employee Stock Purchase Plan (including Amendment No. 1) (filed as Exhibit 10.1 to the Form 10-Q filed with the Securities and Exchange Commission on May 12, 2006 and incorporated herein by reference) |
(10.2)* | 2003 Restated Employees’ Stock Incentive Plan (as approved by the shareholders of the Company on February 6, 2008) (filed as Exhibit 10.1 to the Form 8-K filed with the Securities and Exchange Commission on April 28, 2008 and incorporated herein by reference) |
(10.3) | Loan Agreement, dated December 10, 2008, between Registrant and Bank of America, N.A. (filed as Exhibit 10.1 to the Form 8-K filed with the Securities and Exchange Commission on December 22, 2008 and incorporated herein by reference) |
(10.4) | Amendment No. 1 to Loan Agreement, dated February 16, 2009, between Registrant and Bank of America, N.A. (filed as Exhibit 10.9 to the Form 10-K filed with the Securities and Exchange Commission on December 11, 2009 and incorporated herein by reference) |
(10.5) | Amendment No. 2 to Loan Agreement, dated September 30, 2009, between Registrant and Bank of America, N.A. (filed as Exhibit 10.1 to the Form 8-K filed with the Securities and Exchange Commission on October 9, 2009 and incorporated herein by reference) |
64
(10.6)* | Form of Restricted Stock Bonus Agreement (Continued Employment Vesting) (filed as Exhibit 10.11 to the Form 10-K filed with the Securities and Exchange Commission on December 11, 2009 and incorporated herein by reference) |
(10.7)* | Form of Restricted Stock Bonus Agreement (Performance Vesting) (filed as Exhibit 10.12 to the Form 10-K filed with the Securities and Exchange Commission on December 11, 2009 and incorporated herein by reference) |
(10.8)* | Form of Restricted Stock Bonus Agreement (Three-Year Performance Vesting) (filed as Exhibit 10.13 to the Form 10-K filed with the Securities and Exchange Commission on December 11, 2009 and incorporated herein by reference) |
(10.9)* | Employment letter to Dr. Louis Vintro, dated September 12, 2011 (filed as Exhibit 10.1 to Form 8-K filed with the Securities and Exchange Commission on October 12, 2011 and incorporated herein by reference) |
(10.10)* | 2010 Equity Incentive Plan (as approved by the shareholders of the Company on February 11, 2011) (filed as Appendix A to the Company’s Proxy Statement on Schedule 14A filed with the Securities and Exchange Commission on January 3, 2011 and incorporated herein by reference) |
(10.11) | Amendment No. 3 to Loan Agreement, dated September 30, 2009, between Registrant and Bank of America, N.A. (filed as Exhibit 10.1 to the Form 8-K filed with the Securities and Exchange Commission on April 29, 2011 and incorporated herein by reference) |
(10.12)* | Employment letter to Jeffrey T. Siegal, dated March 14, 2013 (filed as Exhibit 10.1 to Form 8-K filed with the Securities and Exchange Commission on April 15, 2013 and incorporated herein by reference) |
(10.13) | Share Purchase Agreement dated February 24, 2013 between Key Technology, Inc., Key Technology Holdings USA LLC and Visys N.V. (filed as Exhibit 10.1 to the Form 8-K filed with the Securities and Exchange Commission on February 28, 2013 and incorporated herein by reference) |
(10.14) | Amendment No. 4 to Loan Agreement, dated February 12, 2013, between Registrant and Bank of America, N.A. (filed as Exhibit 10.1 to the Form 10-Q filed with the Securities and Exchange Commission on May 9, 2013 and incorporated herein by reference) |
(10.15) | Credit Agreement between Visys NV and KBC Bank NV, dated October 7, 2004 (filed as Exhibit 10.2 to the Form 10-Q filed with the Securities and Exchange Commission on May 9, 2013 and incorporated herein by reference) |
(10.16) | Amendment No. 5 to Loan Agreement, dated May 28, 2013, between Registrant and Bank of America, N.A. (filed as Exhibit 10.1 to the Form 10-Q filed with the Securities and Exchange Commission on August 9, 2013 and incorporated herein by reference) |
(10.17) | Sixth Loan Modification Agreement between Key Technology, Inc. and Bank of America, N.A., effective September 30, 2014 (filed as Exhibit 10.1 to the Form 8-K filed with the Securities and Exchange Commission on October 3, 2014 and incorporated herein by reference) |
(14) | Registrant’s amended Code of Business Conduct and Ethics, dated February 4, 2014 (filed as Exhibit 14.1 to the Form 8-K filed with the Securities and Exchange Commission on February 10, 2014 and incorporated herein by reference) |
(21) | List of Subsidiaries |
(23.1) | Consent of Independent Registered Public Accounting Firm |
(31.1) | Certification pursuant to Section 302 of the Sarbanes-Oxley Act of 2002 |
65
(31.2) | Certification pursuant to Section 302 of the Sarbanes-Oxley Act of 2002 |
(32.1) | Certification pursuant to 18 U.S.C. Section 1350 as adopted pursuant to Section 906 of the Sarbanes-Oxley Act of 2002 |
(32.2) | Certification pursuant to 18 U.S.C. Section 1350 as adopted pursuant to Section 906 of the Sarbanes-Oxley Act of 2002 |
(101) | The following materials from Key Technology, Inc.’s Annual Report on Form 10-K for the year ended September 30, 2014, formatted in XBRL (eXtensible Business Reporting Language); (i) Consolidated Balance Sheets at September 30, 2014 and September 30, 2013, (ii) Consolidated Statements of Operations for the three years ended September 30, 2014, (iii) Consolidated Statements of Comprehensive Income for the three years ended September 30, 2014; (iv) Consolidated Statements of Shareholders’ Equity for the three years ended September 30, 2014, (v) Consolidated Statements of Cash Flows for the three years ended September 30, 2014, and (vi) Notes to Consolidated Financial Statements for the three years ended September 30, 2014.** |
_______________________________________________
* Management contract or compensatory plan or arrangement.
**Pursuant to Rule 406T of Regulation S-T, the Interactive Data Files in Exhibit 101 hereto are deemed not filed or part of a registration statement or prospectus for purposes of Sections 11 or 12 of the Securities Act of 1933, as amended, are deemed not filed for purposes of Section 18 of the Securities Exchange Act of 1934, as amended, and otherwise are not subject to liability under those sections.
66
SIGNATURES
Pursuant to the requirements of Section 13 or 15(d) of the Securities Exchange Act of 1934, the Registrant has duly caused this report to be signed on its behalf by the undersigned, thereunto duly authorized.
KEY TECHNOLOGY, INC. | ||
By: | /s/ John J. Ehren | |
John J. Ehren | ||
President and Chief Executive Officer | ||
(Principal Executive Officer) | ||
By: | /s/ Jeffrey T. Siegal | |
Jeffrey T. Siegal | ||
Vice President and Chief Financial Officer | ||
(Principal Financial and Accounting Officer) | ||
December 12, 2014
Pursuant to the requirements of the Securities Exchange Act of 1934, this report has been signed by the following persons on behalf of the Registrant and in the capacities and on the dates indicated.
/s/ Charles H. Stonecipher | December 12, 2014 | |
Charles H. Stonecipher, Chairman | ||
/s/ John E. Pelo | December 12, 2014 | |
John E. Pelo, Director | ||
/s/ Richard Lawrence | December 12, 2014 | |
Richard Lawrence, Director | ||
/s/ Michael L. Shannon | December 12, 2014 | |
Michael L. Shannon, Director | ||
/s/ Donald A. Washburn | December 12, 2014 | |
Donald A. Washburn, Director | ||
/s/ John J. Ehren | December 12, 2014 | |
John J. Ehren, Director | ||
/s/ Frank L. A. Zwerts | December 12, 2014 | |
Frank L. A. Zwerts, Director | ||
67
KEY TECHNOLOGY, INC.
FORM 10-K
INDEX OF ATTACHED EXHIBITS
EXHIBIT
NUMBER
21 | List of Subsidiaries |
23.1 | Consent of Independent Registered Public Accounting Firm |
31.1 | Certification pursuant to Section 302 of the Sarbanes-Oxley Act of 2002 |
31.2 | Certification pursuant to Section 302 of the Sarbanes-Oxley Act of 2002 |
32.1 | Certification pursuant to 18 U.S. C. Section 1350 as adopted pursuant to Section 906 of the Sarbanes-Oxley Act of 2002 |
32.2 | Certification pursuant to 18 U.S. C. Section 1350 as adopted pursuant to Section 906 of the Sarbanes-Oxley Act of 2002 |
101 | The following materials from Key Technology, Inc.’s Annual Report on Form 10-K for the year ended September 30, 2014, formatted in XBRL (eXtensible Business Reporting Language); (i) Consolidated Balance Sheets at September 30, 2014 and September 30, 2013, (ii) Consolidated Statements of Operations for the three years ended September 30, 2014, (iii) Consolidated Statements of Comprehensive Income for the three years ended September 30, 2014, (iv) Consolidated Statements of Shareholders’ Equity for the three years ended September 30, 2014, (v) Consolidated Statements of Cash Flows for the three years ended September 30, 2014, and (vi) Notes to Consolidated Financial Statements for the three years ended September 30, 2014.* *Pursuant to Rule 406T of Regulation S-T, the Interactive Data Files on Exhibit 101 hereto are deemed not filed or part of a registration statement or prospectus for purposes of Sections 11 or 12 of the Securities Act of 1933, as amended, are deemed not filed for purposes of Section 18 of the Securities Exchange Act of 1934, as amended, and otherwise are not subject to liability under those sections. |
68