Attached files
| file | filename |
|---|---|
| 8-K - FORM 8K - Pacific Oak Strategic Opportunity REIT, Inc. | kbssor8k.htm |
| EX-99.1 - CONSENT OF DUFF & PHELPS, LLC - Pacific Oak Strategic Opportunity REIT, Inc. | kbssorex991duffphelps.htm |
| EX-99.2 - CONSENT OF LANDAUER SERVICES, LLC - Pacific Oak Strategic Opportunity REIT, Inc. | kbssorex992landauer.htm |
KBS Strategic Opportunity REIT Valuation and Portfolio Update December 11, 2014 1 Exhibit 99.3
Forward-Looking Statements The information contained herein should be read in conjunction with, and is qualified by, the information in the KBS Strategic Opportunity REIT, Inc. (“KBS Strategic Opportunity REIT”) Annual Report on Form 10-K for the year ended December 31, 2013, filed with the Securities and Commission Exchange (the “SEC”) on March 11, 2014 (the “Annual Report”), and in KBS Strategic Opportunity REIT’s Quarterly Report on Form 10-Q for the period ended September 30, 2014, filed with the SEC on November 13, 2014, including the “Risk Factors” contained therein. For a full description of the limitations, methodologies and assumptions used to value KBS Strategic Opportunity REIT’s assets and liabilities in connection with the calculation of KBS Strategic Opportunity REIT’s estimated value per share, see KBS Strategic Opportunity REIT’s Current Report on Form 8-K, filed with the SEC on December 11, 2014. Forward-Looking Statements Certain statements contained herein may be deemed to be forward-looking statements within the meaning of the Federal Private Securities Litigation Reform Act of 1995. KBS Strategic Opportunity REIT intends that such forward-looking statements be subject to the safe harbors created by Section 27A of the Securities Act of 1933, as amended, and Section 21E of the Securities Exchange Act of 1934, as amended. These statements include statements regarding the intent, belief or current expectations of KBS Strategic Opportunity REIT and members of its management team, as well as the assumptions on which such statements are based, and generally are identified by the use of words such as “may,” “will,” “seeks,” “anticipates,” “believes,” “estimates,” “expects,” “plans,” “intends,” “should” or similar expressions. Further, forward-looking statements speak only as of the date they are made, and KBS Strategic Opportunity REIT undertakes no obligation to update or revise forward- looking statements to reflect changed assumptions, the occurrence of unanticipated events or changes to future operating results over time, unless required by law. Actual results may differ materially from those contemplated by such forward-looking statements. The valuation methodology for KBS Strategic Opportunity REIT’s real estate investments assumes that its properties realize the projected cash flows and exit cap rates and that investors would be willing to invest in such properties at cap rates equal to the cap rates used in the valuation. Though the appraisals and valuation estimates used in calculating the estimated value per share are Duff & Phelps and Landauer Services’ best estimates as September 30, 2014, and/or KBS Strategic Opportunity REIT’s and KBS Capital Advisors LLC’s (“the Advisor”) best estimates as of December 9, 2014, KBS Strategic Opportunity REIT can give no assurance that these estimated values will be realized by KBS Strategic Opportunity REIT. These statements also depend on factors such as future economic, competitive and market conditions, KBS Strategic Opportunity REIT’s ability to maintain occupancy levels and lease rates at its properties, and other risks identified in Part I, Item IA of KBS Strategic Opportunity REIT’s Annual Report on form 10-K for the year ended December 31, 2013, and its subsequent quarterly reports. Actual events may cause the value and returns on KBS Strategic Opportunity REIT’s investments to be less than that used for purposes of KBS Strategic Opportunity REIT’s estimated value per share. 2
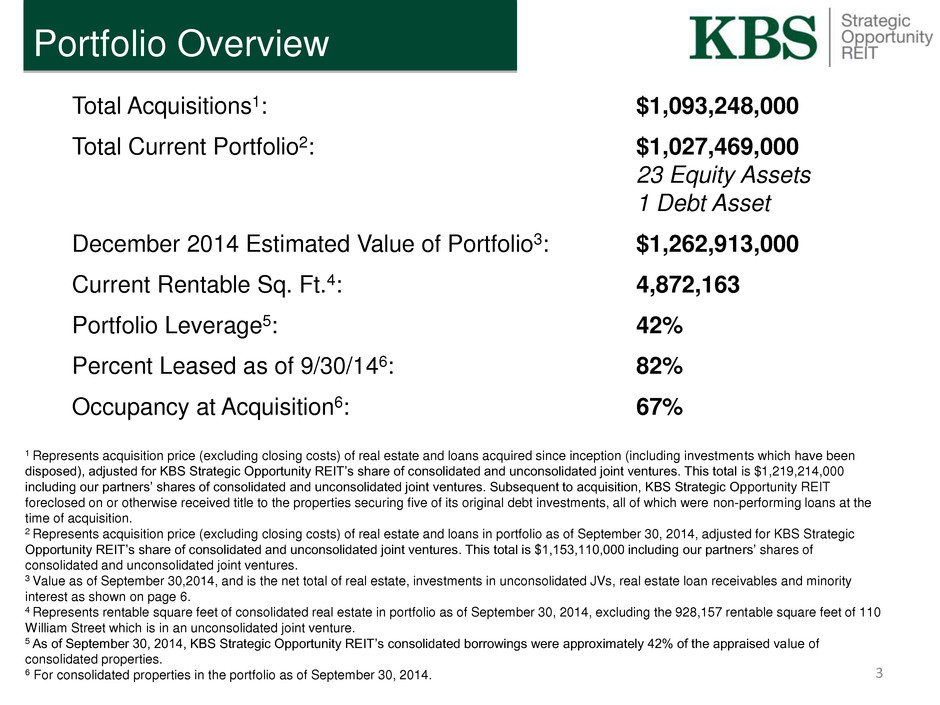
Total Acquisitions1: $1,093,248,000 Total Current Portfolio2: $1,027,469,000 23 Equity Assets 1 Debt Asset December 2014 Estimated Value of Portfolio3: $1,262,913,000 Current Rentable Sq. Ft.4: 4,872,163 Portfolio Leverage5: 42% Percent Leased as of 9/30/146: 82% Occupancy at Acquisition6: 67% 1 Represents acquisition price (excluding closing costs) of real estate and loans acquired since inception (including investments which have been disposed), adjusted for KBS Strategic Opportunity REIT’s share of consolidated and unconsolidated joint ventures. This total is $1,219,214,000 including our partners’ shares of consolidated and unconsolidated joint ventures. Subsequent to acquisition, KBS Strategic Opportunity REIT foreclosed on or otherwise received title to the properties securing five of its original debt investments, all of which were non-performing loans at the time of acquisition. 2 Represents acquisition price (excluding closing costs) of real estate and loans in portfolio as of September 30, 2014, adjusted for KBS Strategic Opportunity REIT’s share of consolidated and unconsolidated joint ventures. This total is $1,153,110,000 including our partners’ shares of consolidated and unconsolidated joint ventures. 3 Value as of September 30,2014, and is the net total of real estate, investments in unconsolidated JVs, real estate loan receivables and minority interest as shown on page 6. 4 Represents rentable square feet of consolidated real estate in portfolio as of September 30, 2014, excluding the 928,157 rentable square feet of 110 William Street which is in an unconsolidated joint venture. 5 As of September 30, 2014, KBS Strategic Opportunity REIT’s consolidated borrowings were approximately 42% of the appraised value of consolidated properties. 6 For consolidated properties in the portfolio as of September 30, 2014. Portfolio Overview 3

Estimated value per share2 calculated using information as of September 30, 2014 • Net asset value; no enterprise (portfolio) premium or discount applied • Considered potential participation fee that would be due to the advisor in a hypothetical liquidation if the required shareholder return thresholds are met. KBS Strategic Opportunity REIT followed the IPA Valuation Guidelines, which included independent third-party appraisals for 100% of its consolidated properties, and one of its two unconsolidated joint venture investments in real estate properties. Duff & Phelps and Landauer Services, LLC were engaged to provide appraisals of the estimated market values of real estate assets. Duff & Phelps provided appraisals of all investments in consolidated real estate properties (excluding undeveloped land) and 110 William Street, and Landauer provided appraisals of all investments in undeveloped land. The appraisals were performed in accordance with the Code of Professional Ethics and Standards of Profession Practice set forth by the Appraisal Institute and the Uniform Standards of Professional Appraisal Practice (USPAP). Non-controlling interest liability due to our joint venture partners calculated by assuming a hypothetical liquidation of the underlying real estate properties at their current appraised values and the payoff of any related debt at its fair value, based on the profit participation thresholds contained in the joint venture agreements. 1For more information, see KBS Strategic Opportunity REIT’s Current Report on Form 8-K filed with the SEC on December 11, 2014. 2The estimated value of the REIT’s assets less the estimated value of the REIT’s liabilities, divided by the number of shares outstanding, all as of September 30, 2014. Valuation1 4
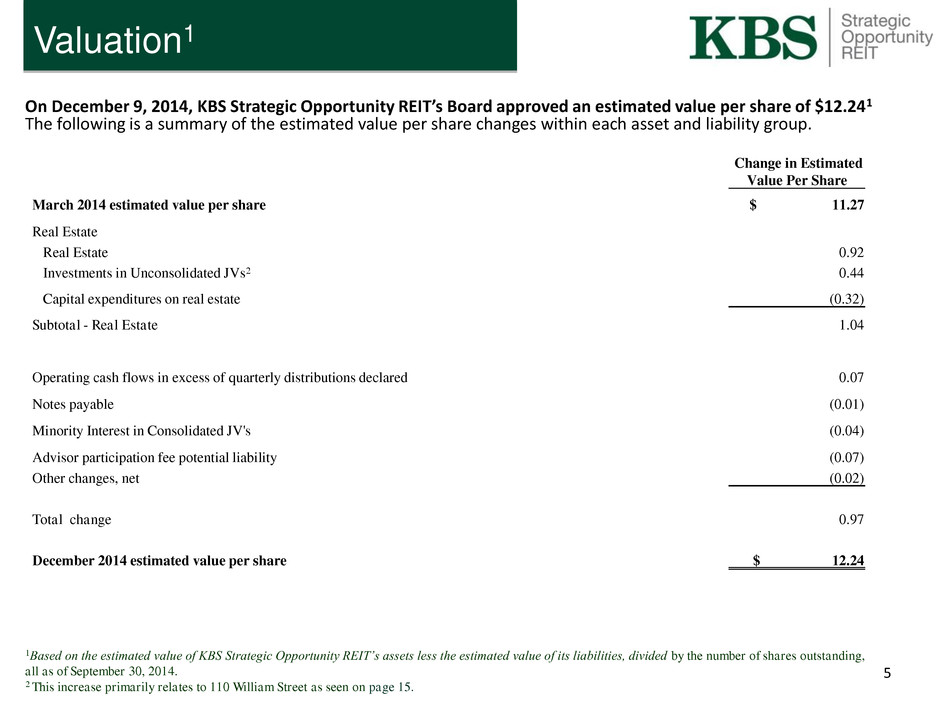
Change in Estimated Value Per Share March 2014 estimated value per share $ 11.27 Real Estate Real Estate 0.92 Investments in Unconsolidated JVs2 0.44 Capital expenditures on real estate (0.32) Subtotal - Real Estate 1.04 Operating cash flows in excess of quarterly distributions declared 0.07 Notes payable (0.01) Minority Interest in Consolidated JV's (0.04) Advisor participation fee potential liability (0.07) Other changes, net (0.02) Total change 0.97 December 2014 estimated value per share $ 12.24 On December 9, 2014, KBS Strategic Opportunity REIT’s Board approved an estimated value per share of $12.241 The following is a summary of the estimated value per share changes within each asset and liability group. 5 1Based on the estimated value of KBS Strategic Opportunity REIT’s assets less the estimated value of its liabilities, divided by the number of shares outstanding, all as of September 30, 2014. 2 This increase primarily relates to 110 William Street as seen on page 15. Valuation1
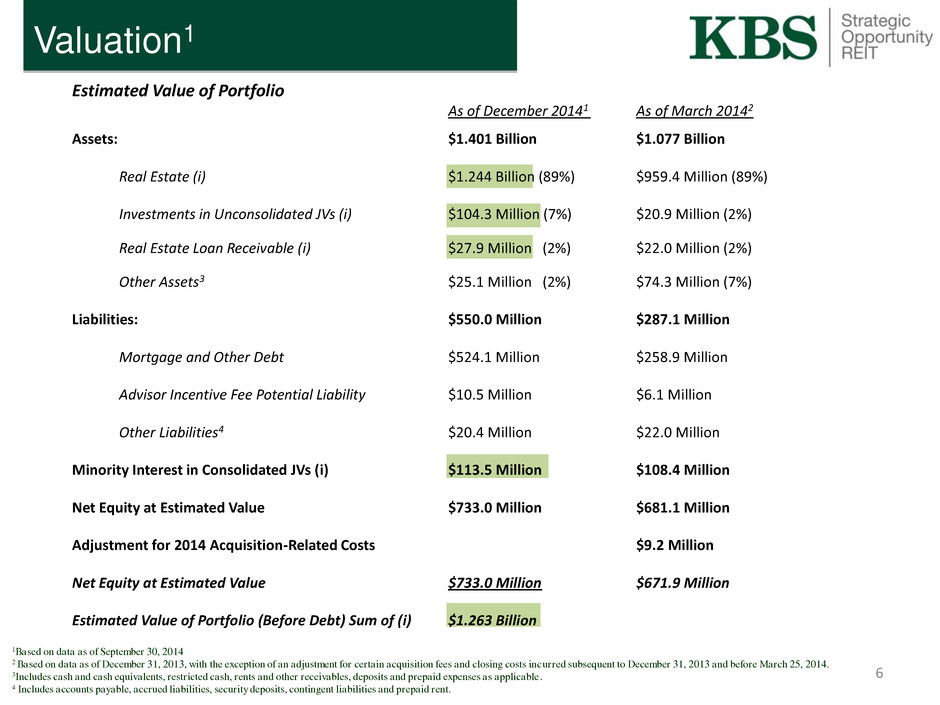
6 1Based on data as of September 30, 2014 2 Based on data as of December 31, 2013, with the exception of an adjustment for certain acquisition fees and closing costs incurred subsequent to December 31, 2013 and before March 25, 2014. 3Includes cash and cash equivalents, restricted cash, rents and other receivables, deposits and prepaid expenses as applicable. 4 Includes accounts payable, accrued liabilities, security deposits, contingent liabilities and prepaid rent. Valuation1 Estimated Value of Portfolio As of December 20141 As of March 20142 Assets: $1.401 Billion $1.077 Billion Real Estate (i) $1.244 Billion (89%) $959.4 Million (89%) Investments in Unconsolidated JVs (i) $104.3 Million (7%) $20.9 Million (2%) Real Estate Loan Receivable (i) $27.9 Million (2%) $22.0 Million (2%) Other Assets3 $25.1 Million (2%) $74.3 Million (7%) Liabilities: $550.0 Million $287.1 Million Mortgage and Other Debt $524.1 Million $258.9 Million Advisor Incentive Fee Potential Liability $10.5 Million $6.1 Million Other Liabilities4 $20.4 Million $22.0 Million Minority Interest in Consolidated JVs (i) $113.5 Million $108.4 Million Net Equity at Estimated Value $733.0 Million $681.1 Million Adjustment for 2014 Acquisition-Related Costs $9.2 Million Net Equity at Estimated Value $733.0 Million $671.9 Million Estimated Value of Portfolio (Before Debt) Sum of (i) $1.263 Billion
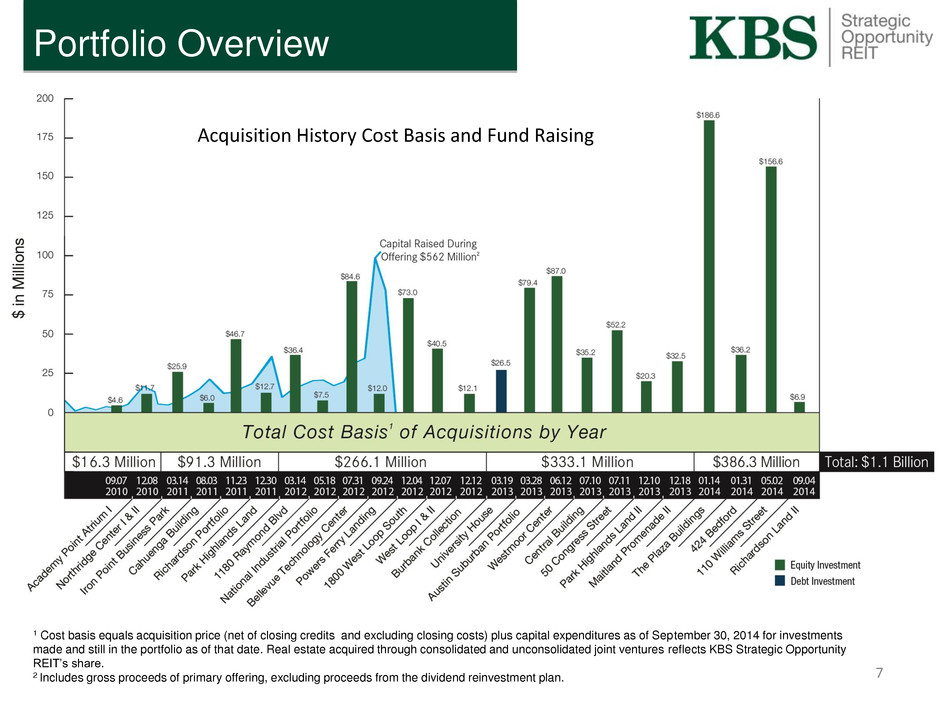
Portfolio Overview 7 1 Cost basis equals acquisition price (net of closing credits and excluding closing costs) plus capital expenditures as of September 30, 2014 for investments made and still in the portfolio as of that date. Real estate acquired through consolidated and unconsolidated joint ventures reflects KBS Strategic Opportunity REIT’s share. 2 Includes gross proceeds of primary offering, excluding proceeds from the dividend reinvestment plan. Acquisition History Cost Basis and Fund Raising

March 2014 Portfolio Overview: $11.27 NAV 8 1 For real estate held in consolidated joint ventures, the value presented is equal to the real estate value less the minority interest value. 2 For real estate held in unconsolidated joint ventures, the value presented for National Industrial Portfolio is equal to KBS Strategic Opportunity REIT’s equity value since the company owns a minority share of the joint venture’s equity. 3 Equals acquisition price (net of closing credits and excluding closing costs) , adjusted for KBS Strategic Opportunity REIT’s share of consolidated and unconsolidated joint ventures. 4 Cost basis equals acquisition price (net of closing credits and excluding closing costs) plus capital expenditures for investments made and still in portfolio as of December 31, 2013. March 2014 Estimated Values of Real Estate1,2 and Loan Receivable
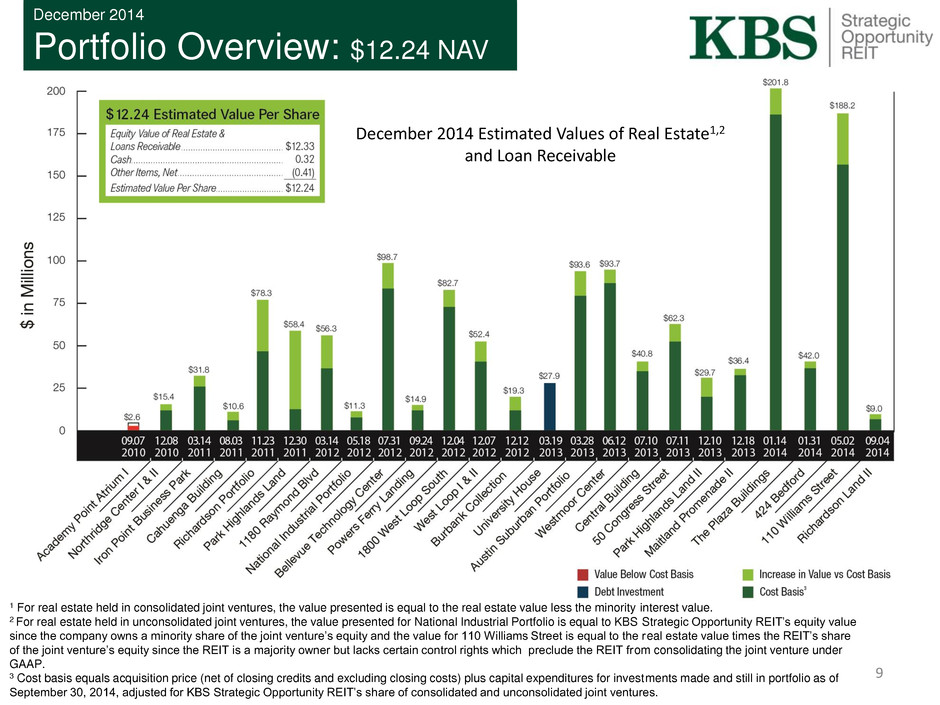
December 2014 Portfolio Overview: $12.24 NAV 9 1 For real estate held in consolidated joint ventures, the value presented is equal to the real estate value less the minority interest value. 2 For real estate held in unconsolidated joint ventures, the value presented for National Industrial Portfolio is equal to KBS Strategic Opportunity REIT’s equity value since the company owns a minority share of the joint venture’s equity and the value for 110 Williams Street is equal to the real estate value times the REIT’s share of the joint venture’s equity since the REIT is a majority owner but lacks certain control rights which preclude the REIT from consolidating the joint venture under GAAP. 3 Cost basis equals acquisition price (net of closing credits and excluding closing costs) plus capital expenditures for investments made and still in portfolio as of September 30, 2014, adjusted for KBS Strategic Opportunity REIT’s share of consolidated and unconsolidated joint ventures. December 2014 Estimated Values of Real Estate1,2 and Loan Receivable
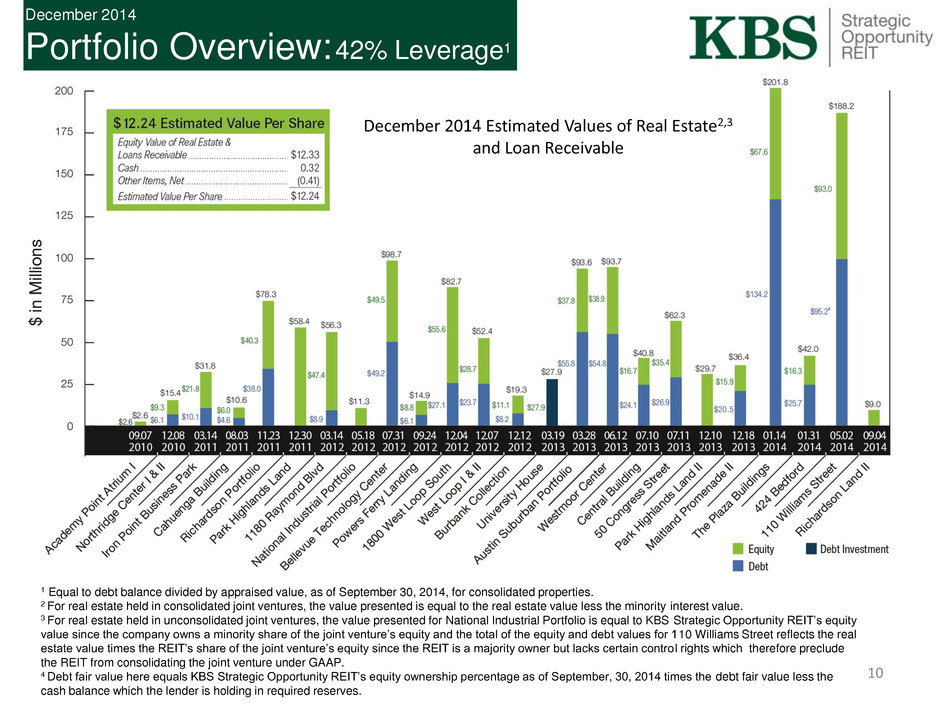
December 2014 Portfolio Overview: 42% Leverage1 10 1 Equal to debt balance divided by appraised value, as of September 30, 2014, for consolidated properties. 2 For real estate held in consolidated joint ventures, the value presented is equal to the real estate value less the minority interest value. 3 For real estate held in unconsolidated joint ventures, the value presented for National Industrial Portfolio is equal to KBS Strategic Opportunity REIT’s equity value since the company owns a minority share of the joint venture’s equity and the total of the equity and debt values for 110 Williams Street reflects the real estate value times the REIT’s share of the joint venture’s equity since the REIT is a majority owner but lacks certain contro l rights which therefore preclude the REIT from consolidating the joint venture under GAAP. 4 Debt fair value here equals KBS Strategic Opportunity REIT’s equity ownership percentage as of September, 30, 2014 times the debt fair value less the cash balance which the lender is holding in required reserves. December 2014 Estimated Values of Real Estate2,3 and Loan Receivable
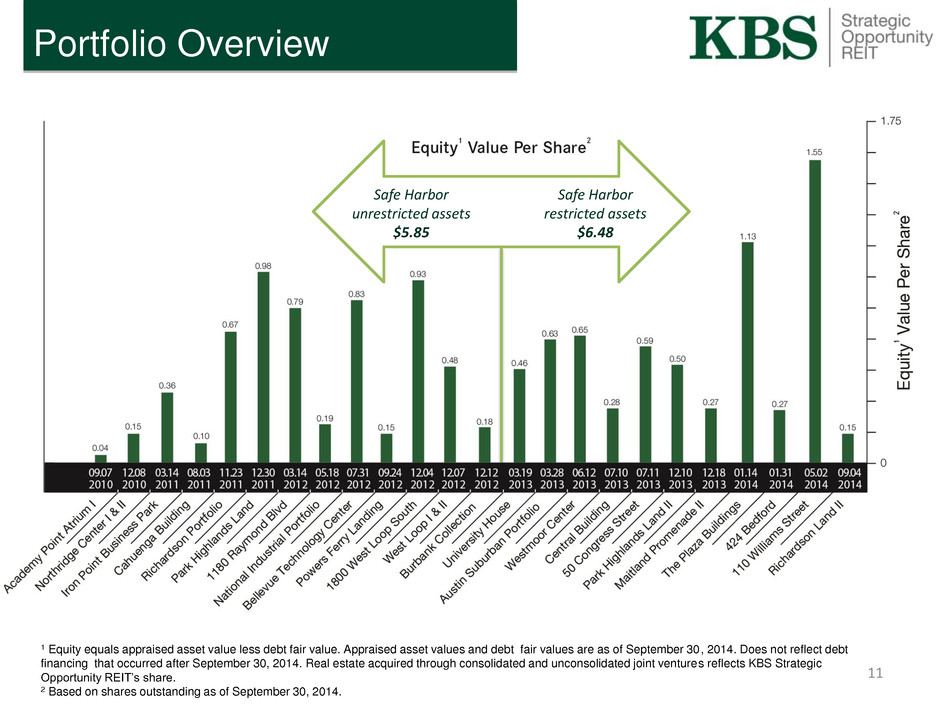
Portfolio Overview 11 1 Equity equals appraised asset value less debt fair value. Appraised asset values and debt fair values are as of September 30, 2014. Does not reflect debt financing that occurred after September 30, 2014. Real estate acquired through consolidated and unconsolidated joint ventures reflects KBS Strategic Opportunity REIT’s share. 2 Based on shares outstanding as of September 30, 2014. Safe Harbor unrestricted assets $5.85 Safe Harbor restricted assets $6.48
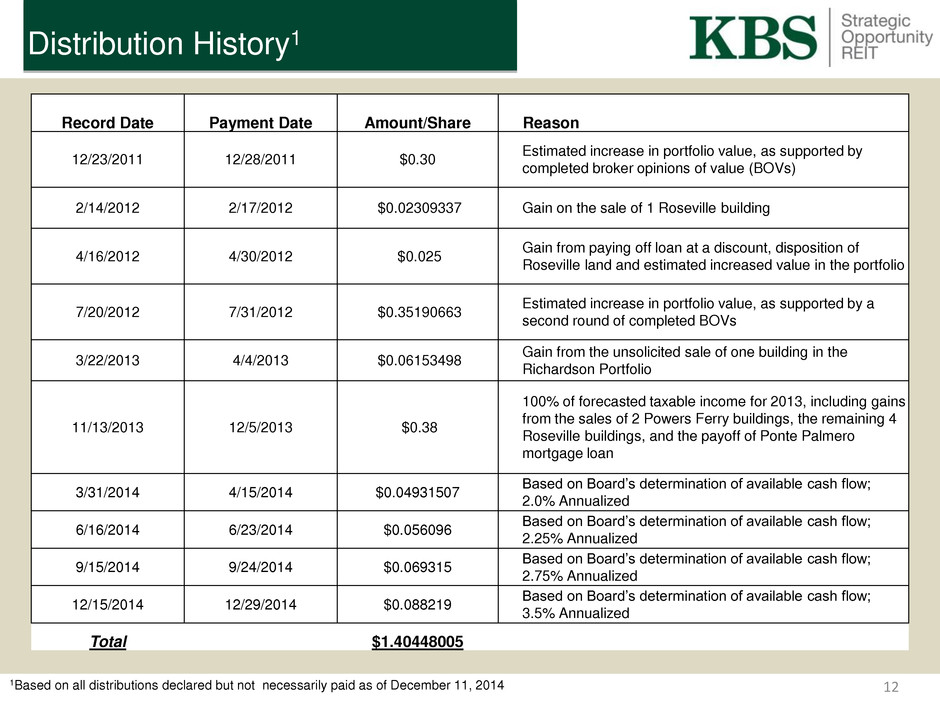
Distribution History1 1Based on all distributions declared but not necessarily paid as of December 11, 2014 12 Record Date Payment Date Amount/Share Reason 12/23/2011 12/28/2011 $0.30 Estimated increase in portfolio value, as supported by completed broker opinions of value (BOVs) 2/14/2012 2/17/2012 $0.02309337 Gain on the sale of 1 Roseville building 4/16/2012 4/30/2012 $0.025 Gain from paying off loan at a discount, disposition of Roseville land and estimated increased value in the portfolio 7/20/2012 7/31/2012 $0.35190663 Estimated increase in portfolio value, as supported by a second round of completed BOVs 3/22/2013 4/4/2013 $0.06153498 Gain from the unsolicited sale of one building in the Richardson Portfolio 11/13/2013 12/5/2013 $0.38 100% of forecasted taxable income for 2013, including gains from the sales of 2 Powers Ferry buildings, the remaining 4 Roseville buildings, and the payoff of Ponte Palmero mortgage loan 3/31/2014 4/15/2014 $0.04931507 Based on Board’s determination of available cash flow; 2.0% Annualized 6/16/2014 6/23/2014 $0.056096 Based on Board’s determination of available cash flow; 2.25% Annualized 9/15/2014 9/24/2014 $0.069315 Based on Board’s determination of available cash flow; 2.75% Annualized 12/15/2014 12/29/2014 $0.088219 Based on Board’s determination of available cash flow; 3.5% Annualized Total $1.40448005
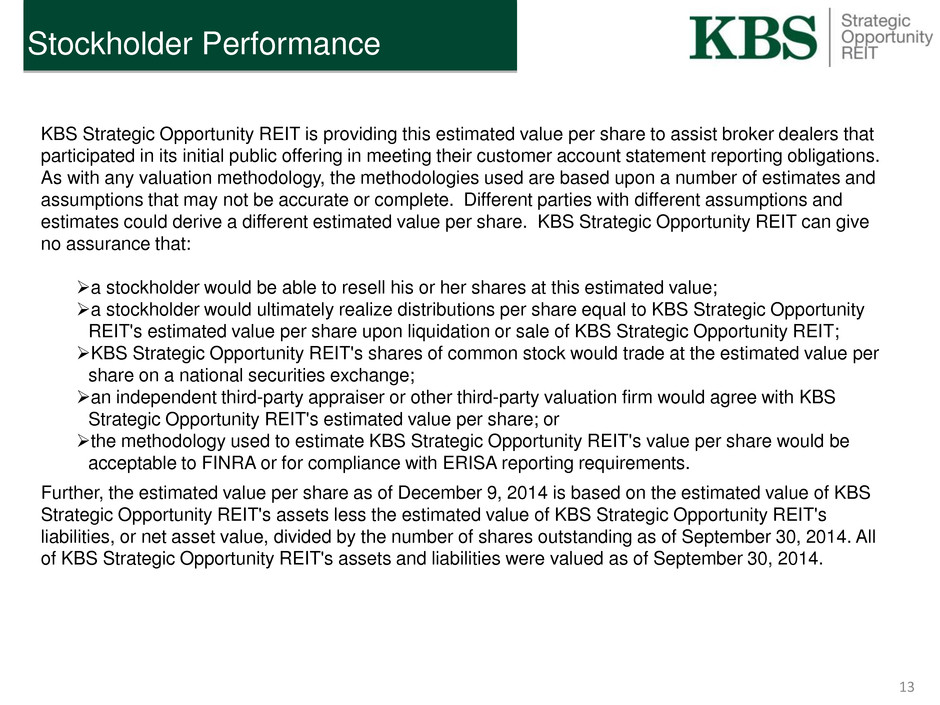
KBS Strategic Opportunity REIT is providing this estimated value per share to assist broker dealers that participated in its initial public offering in meeting their customer account statement reporting obligations. As with any valuation methodology, the methodologies used are based upon a number of estimates and assumptions that may not be accurate or complete. Different parties with different assumptions and estimates could derive a different estimated value per share. KBS Strategic Opportunity REIT can give no assurance that: a stockholder would be able to resell his or her shares at this estimated value; a stockholder would ultimately realize distributions per share equal to KBS Strategic Opportunity REIT's estimated value per share upon liquidation or sale of KBS Strategic Opportunity REIT; KBS Strategic Opportunity REIT's shares of common stock would trade at the estimated value per share on a national securities exchange; an independent third-party appraiser or other third-party valuation firm would agree with KBS Strategic Opportunity REIT's estimated value per share; or the methodology used to estimate KBS Strategic Opportunity REIT's value per share would be acceptable to FINRA or for compliance with ERISA reporting requirements. Further, the estimated value per share as of December 9, 2014 is based on the estimated value of KBS Strategic Opportunity REIT's assets less the estimated value of KBS Strategic Opportunity REIT's liabilities, or net asset value, divided by the number of shares outstanding as of September 30, 2014. All of KBS Strategic Opportunity REIT's assets and liabilities were valued as of September 30, 2014. Stockholder Performance 13
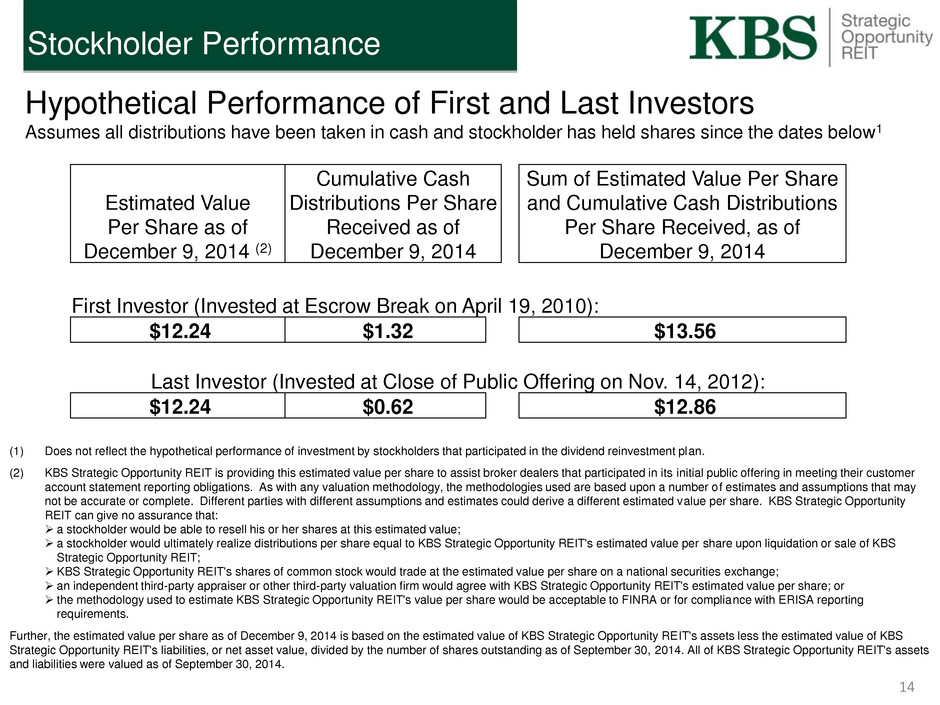
(1) Does not reflect the hypothetical performance of investment by stockholders that participated in the dividend reinvestment plan. (2) KBS Strategic Opportunity REIT is providing this estimated value per share to assist broker dealers that participated in its initial public offering in meeting their customer account statement reporting obligations. As with any valuation methodology, the methodologies used are based upon a number of estimates and assumptions that may not be accurate or complete. Different parties with different assumptions and estimates could derive a different estimated value per share. KBS Strategic Opportunity REIT can give no assurance that: a stockholder would be able to resell his or her shares at this estimated value; a stockholder would ultimately realize distributions per share equal to KBS Strategic Opportunity REIT's estimated value per share upon liquidation or sale of KBS Strategic Opportunity REIT; KBS Strategic Opportunity REIT's shares of common stock would trade at the estimated value per share on a national securities exchange; an independent third-party appraiser or other third-party valuation firm would agree with KBS Strategic Opportunity REIT's estimated value per share; or the methodology used to estimate KBS Strategic Opportunity REIT's value per share would be acceptable to FINRA or for compliance with ERISA reporting requirements. Further, the estimated value per share as of December 9, 2014 is based on the estimated value of KBS Strategic Opportunity REIT's assets less the estimated value of KBS Strategic Opportunity REIT's liabilities, or net asset value, divided by the number of shares outstanding as of September 30, 2014. All of KBS Strategic Opportunity REIT's assets and liabilities were valued as of September 30, 2014. Stockholder Performance Estimated Value Per Share as of December 9, 2014 (2) Cumulative Cash Distributions Per Share Received as of December 9, 2014 Sum of Estimated Value Per Share and Cumulative Cash Distributions Per Share Received, as of December 9, 2014 First Investor (Invested at Escrow Break on April 19, 2010): $12.24 $1.32 $13.56 Last Investor (Invested at Close of Public Offering on Nov. 14, 2012): $12.24 $0.62 $12.86 Hypothetical Performance of First and Last Investors Assumes all distributions have been taken in cash and stockholder has held shares since the dates below1 14

JV acquisition of Class B office building in Manhattan, NYC • Acquired on May 2, 2014 • $257 million purchase price • 32 floors • 928,157 rentable square feet • Located in Financial District • 97% occupied at acquisition • 60% ownership interest through joint venture 110 William Street Acquisition Update 15

Statements will reflect new estimated value per share of $12.24 beginning with December 2014 statements. Shareholder letter will be included with December statements mailed in early January 2015. Estimated value per share visible through DST will be updated to show new estimated value. Expected next NAV date: December 2015 Shareholder Communication 16
2015 Goals & Objectives 1) Strategically sell assets 2) Explore value-add opportunities for existing assets, primarily in land holdings, both direct development and added entitlements 3) Refinance upcoming maturities to capitalize on an ever competitive lending environment 4) Distribute available cash to stockholders through growing rents, leasing, sales and refinancing 5) Explore all liquidity options while managing continued value creation 17

Thank you! If you have any questions, please contact your financial advisor or contact us at: KBS Capital Markets Group Member FINRA & SIPC 660 Newport Center Dr., Suite 1200 Newport Beach, CA 92660 (866) 527-4264 18
