Attached files
| file | filename |
|---|---|
| 8-K - CURRENT REPORT OF MATERIAL EVENTS OR CORPORATE CHANGES - Helmerich & Payne, Inc. | a14-25970_18k.htm |
Exhibit 99.1
|
|
Helmerich & Payne, Inc. Capital One Securities, Inc. 2014 Energy Conference December 11, 2014 |

|
|
Statements within this presentation are “forward-looking statements” within the meaning of the Securities Act of 1933 and the Securities Exchange Act of 1934, and are based on current expectations and assumptions that are subject to risks and uncertainties. All statements other than statements of historical facts included in this release, including, without limitation, statements regarding the registrant’s future financial position, business strategy, budgets, projected costs and plans and objectives of management for future operations, are forward looking statements. For information regarding risks and uncertainties associated with the Company’s business, please refer to the “Risk Factors” and “Management’s Discussion & Analysis of Financial Condition and Results of Operations” sections of the Company’s SEC filings, including but not limited to, its annual report on Form 10-K and quarterly reports on Form 10-Q. As a result of these factors, Helmerich & Payne, Inc.’s actual results may differ materially from those indicated or implied by such forward-looking statements. We undertake no duty to update or revise our forward-looking statements based on changes in internal estimates, expectations or otherwise, except as required by law. |
|
|
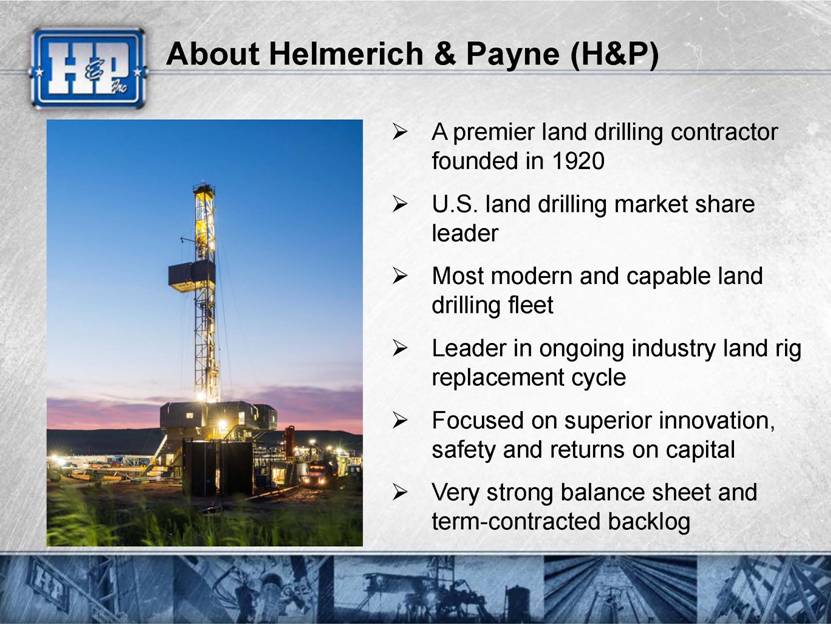
A premier land drilling contractor founded in 1920 U.S. land drilling market share leader Most modern and capable land drilling fleet Leader in ongoing industry land rig replacement cycle Focused on superior innovation, safety and returns on capital Very strong balance sheet and term-contracted backlog About Helmerich & Payne (H&P) |
|
|
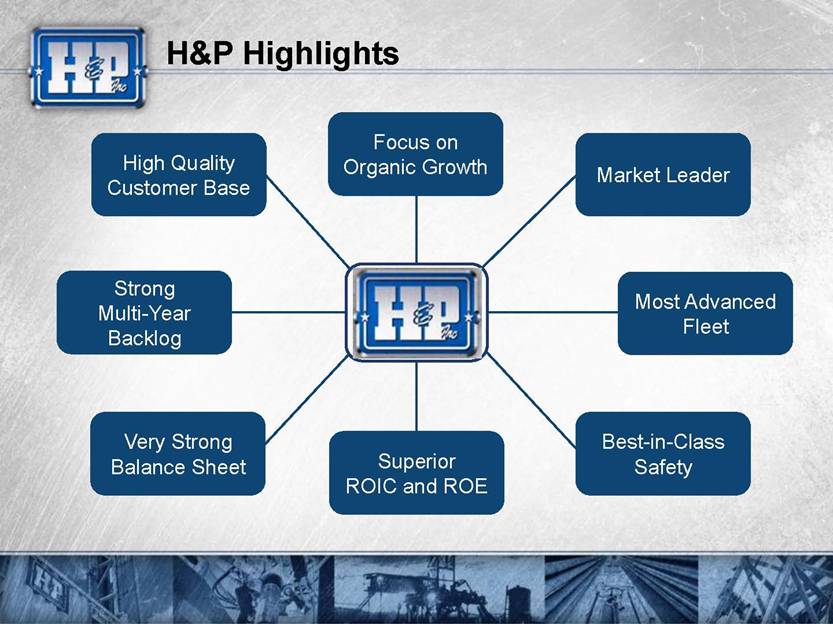
H&P Highlights Very Strong Balance Sheet Most Advanced Fleet Strong Multi-Year Backlog Market Leader Superior ROIC and ROE Focus on Organic Growth High Quality Customer Base Best-in-Class Safety |
|
|
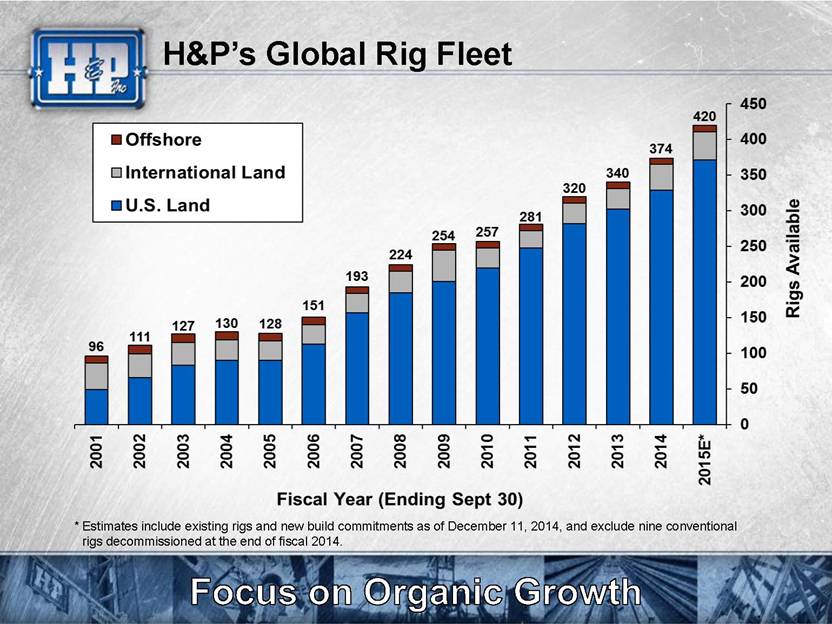
H&P’s Global Rig Fleet * Estimates include existing rigs and new build commitments as of December 11, 2014, and exclude nine conventional rigs decommissioned at the end of fiscal 2014. |
|
|
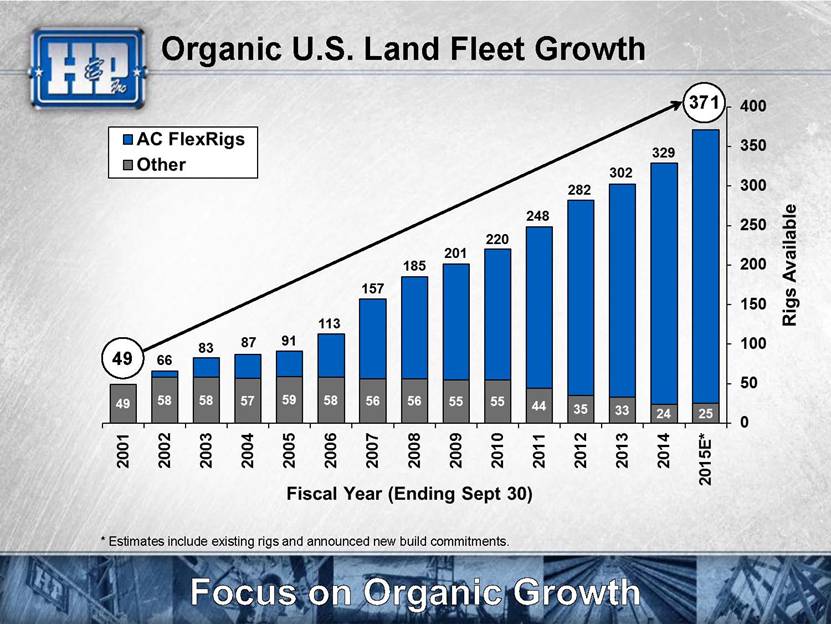
Organic U.S. Land Fleet Growth * Estimates include existing rigs and announced new build commitments. 371 49 |
|
|
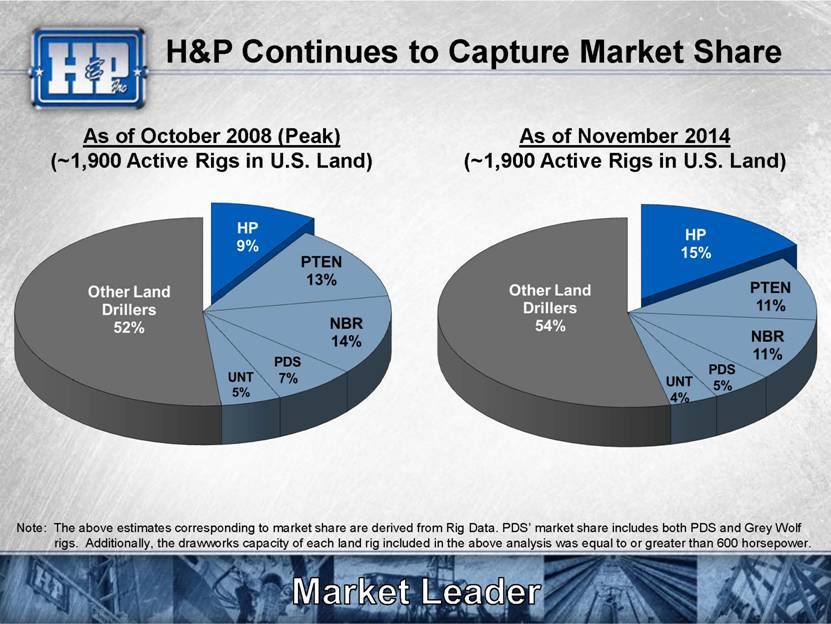
H&P Continues to Capture Market Share As of October 2008 (Peak) (~1,900 Active Rigs in U.S. Land) As of November 2014 (~1,900 Active Rigs in U.S. Land) Note: The above estimates corresponding to market share are derived from Rig Data. PDS’ market share includes both PDS and Grey Wolf rigs. Additionally, the drawworks capacity of each land rig included in the above analysis was equal to or greater than 600 horsepower. |
|
|
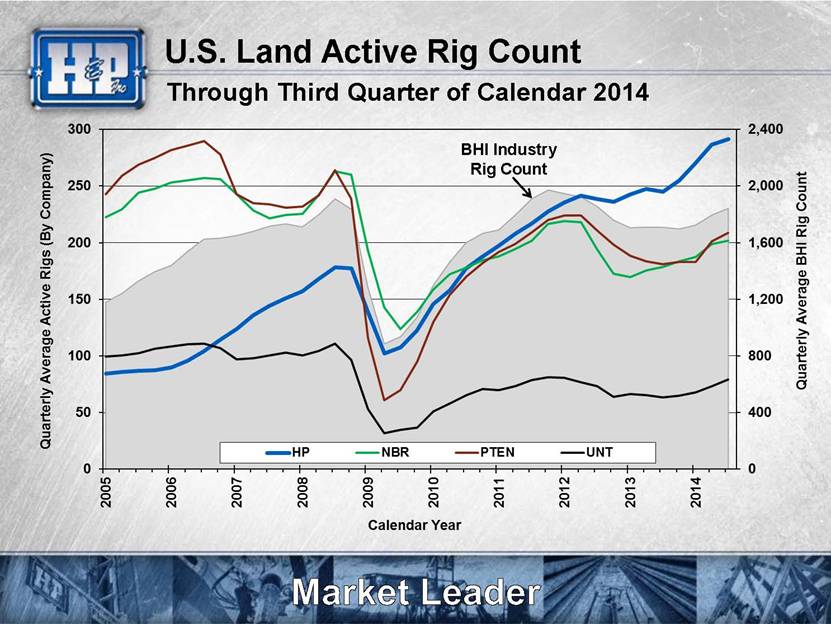
U.S. Land Active Rig Count BHI Industry Rig Count Through Third Quarter of Calendar 2014 |
|
|
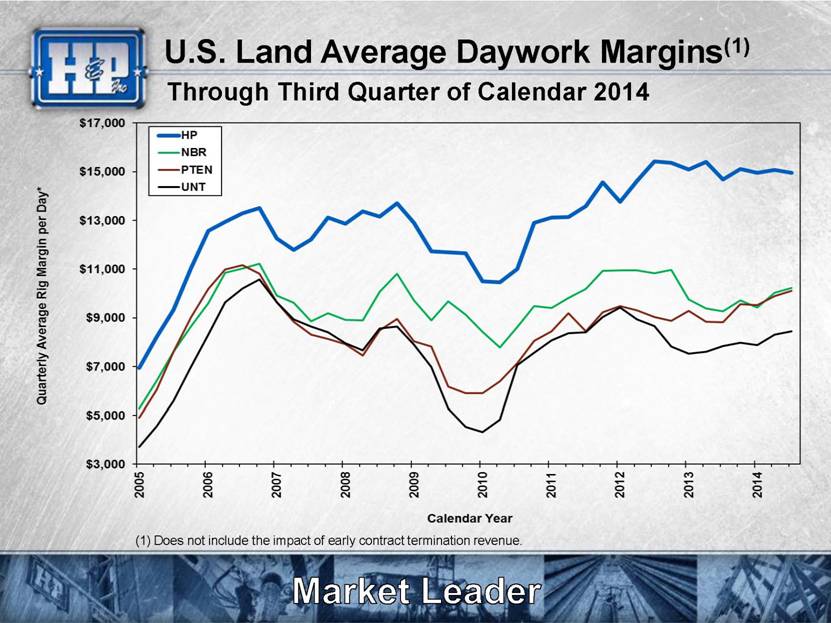
U.S. Land Average Daywork Margins(1) (1) Does not include the impact of early contract termination revenue. Through Third Quarter of Calendar 2014 |
|
|
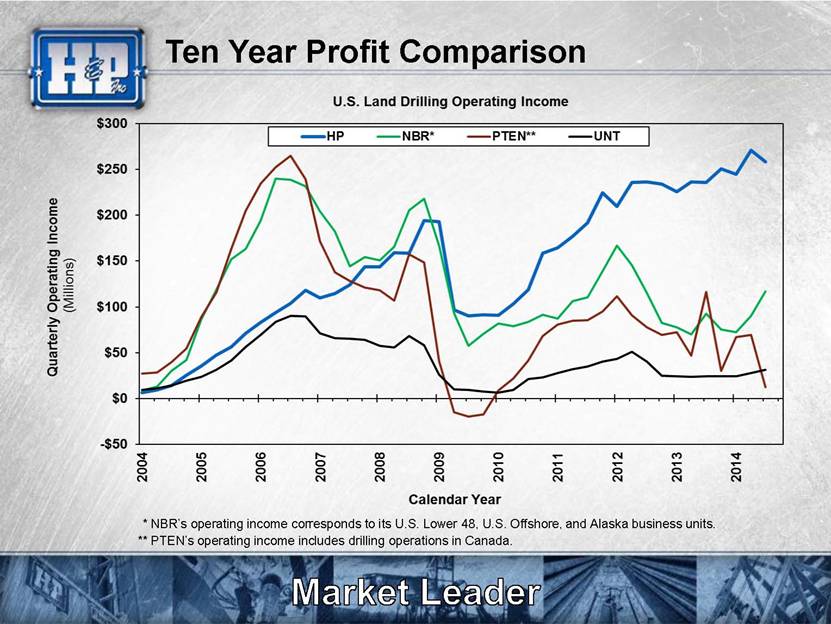
* NBR’s operating income corresponds to its U.S. Lower 48, U.S. Offshore, and Alaska business units. Ten Year Profit Comparison ** PTEN’s operating income includes drilling operations in Canada. |
|
|
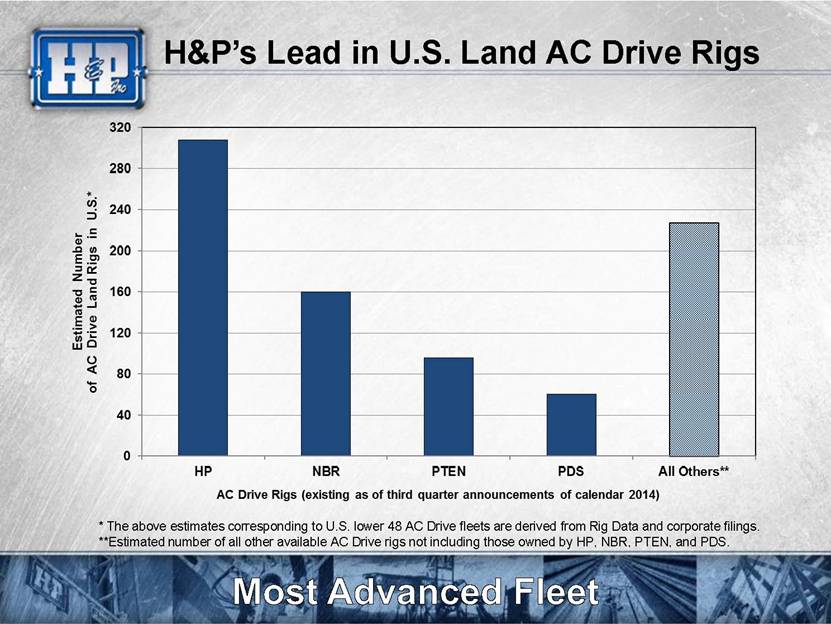
H&P’s Lead in U.S. Land AC Drive Rigs * The above estimates corresponding to U.S. lower 48 AC Drive fleets are derived from Rig Data and corporate filings. **Estimated number of all other available AC Drive rigs not including those owned by HP, NBR, PTEN, and PDS. |
|
|
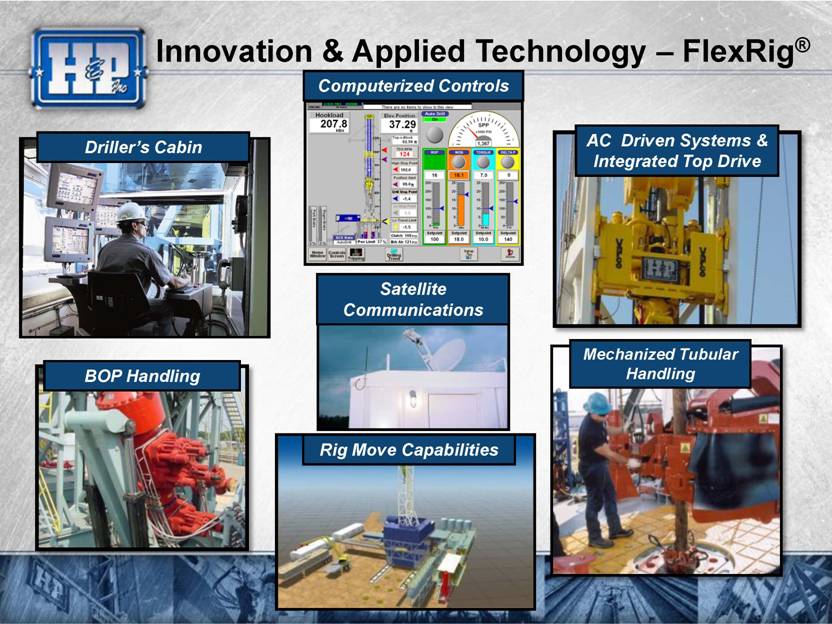
Innovation & Applied Technology – FlexRig® AC Driven Systems & Integrated Top Drive Mechanized Tubular Handling Computerized Controls BOP Handling Driller’s Cabin Satellite Communications Rig Move Capabilities 31 |
|
|
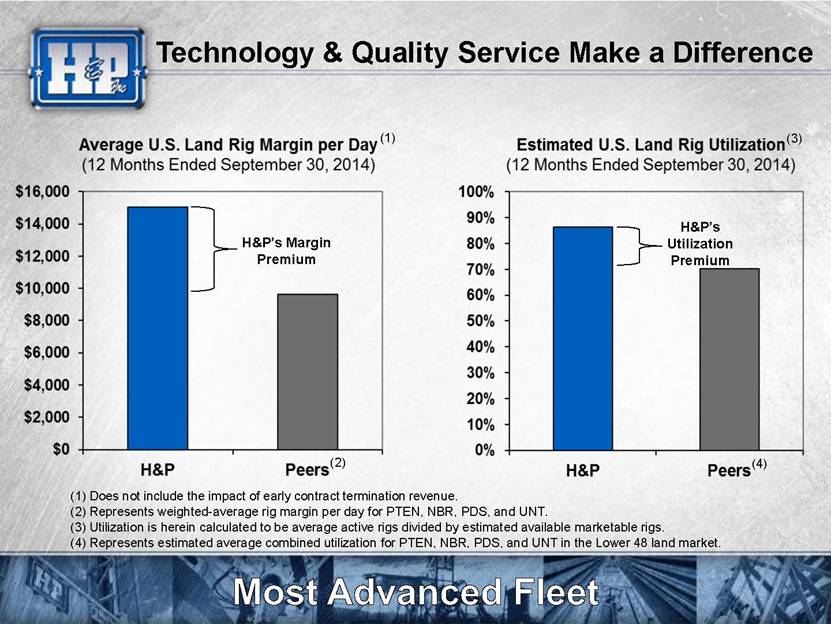
Technology & Quality Service Make a Difference (1) Does not include the impact of early contract termination revenue. (2) Represents weighted-average rig margin per day for PTEN, NBR, PDS, and UNT. (3) Utilization is herein calculated to be average active rigs divided by estimated available marketable rigs. (4) Represents estimated average combined utilization for PTEN, NBR, PDS, and UNT in the Lower 48 land market. H&P’s Margin Premium H&P’s Utilization Premium (1) (2) (3) (4) |
|
|
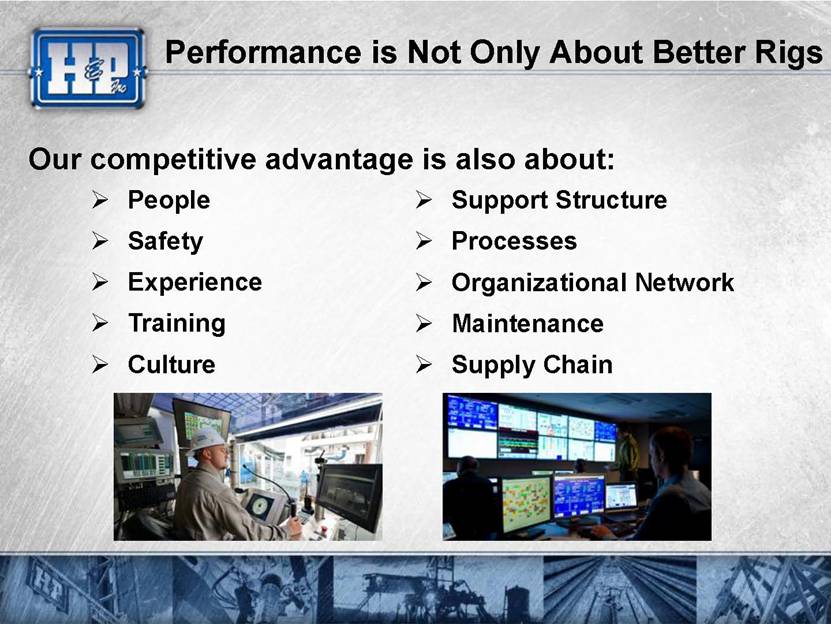
Performance is Not Only About Better Rigs Our competitive advantage is also about: People Safety Experience Training Culture Support Structure Processes Organizational Network Maintenance Supply Chain |
|
|
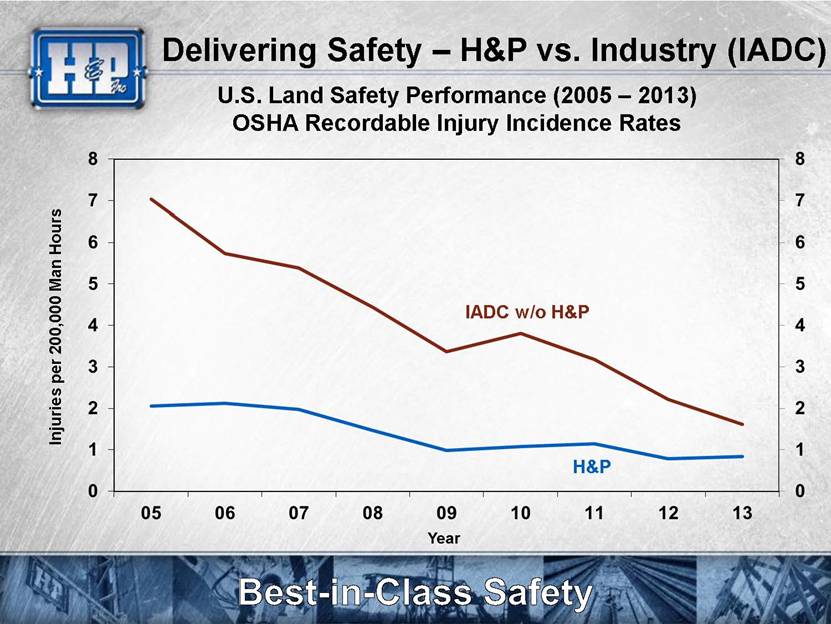
Delivering Safety – H&P vs. Industry (IADC) U.S. Land Safety Performance (2005 – 2013) OSHA Recordable Injury Incidence Rates H&P IADC w/o H&P Injuries per 200,000 Man Hours |
|
|
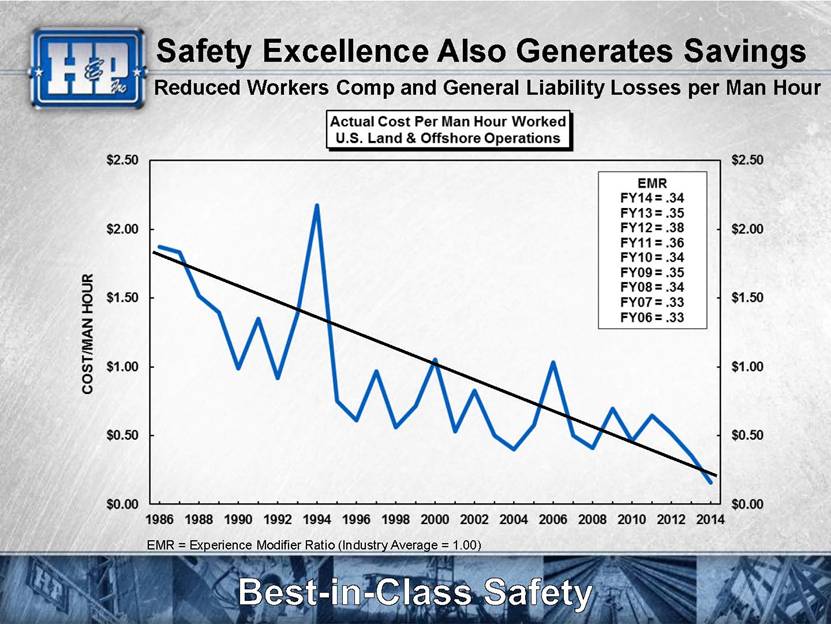
Safety Excellence Also Generates Savings Reduced Workers Comp and General Liability Losses per Man Hour EMR = Experience Modifier Ratio (Industry Average = 1.00) |
|
|
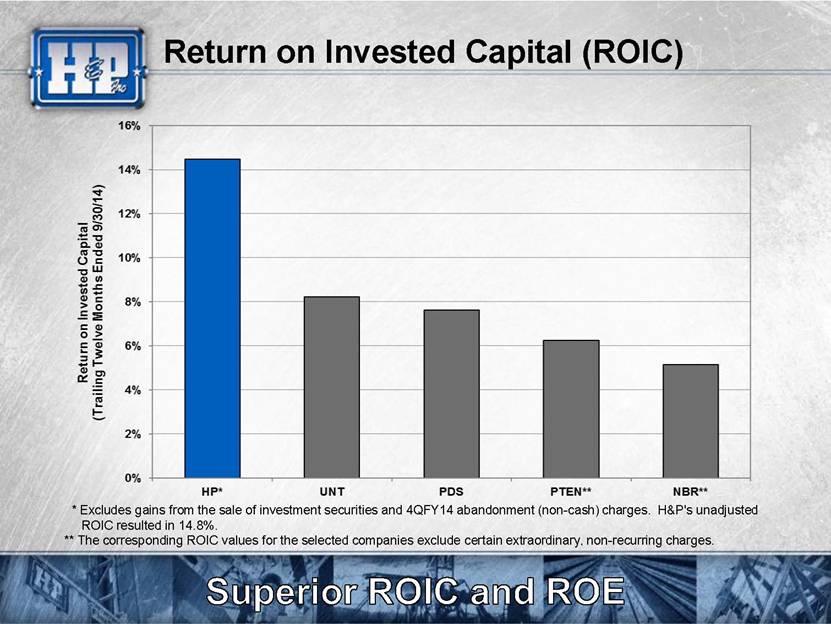
Return on Invested Capital (ROIC) * Excludes gains from the sale of investment securities and 4QFY14 abandonment (non-cash) charges. H&P's unadjusted ROIC resulted in 14.8%. ** The corresponding ROIC values for the selected companies exclude certain extraordinary, non-recurring charges. |
|
|
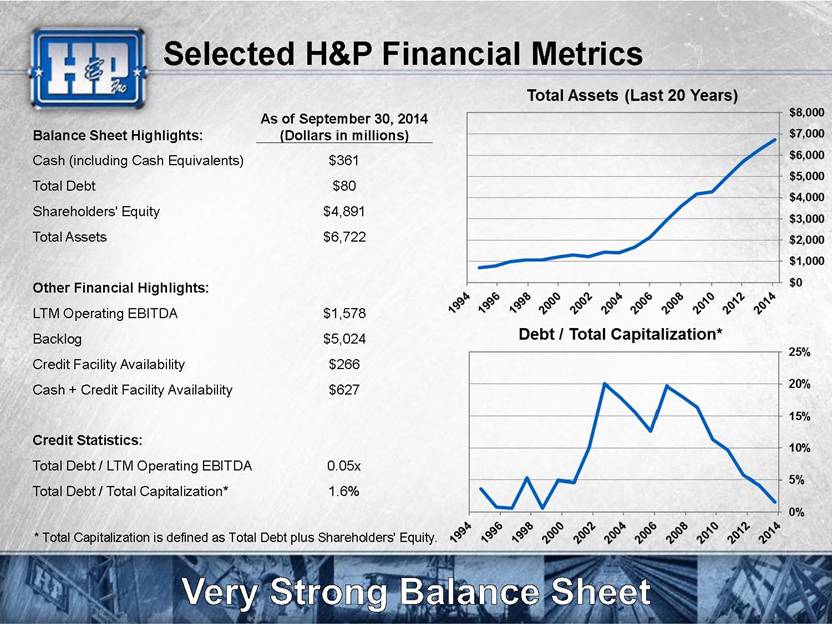
Selected H&P Financial Metrics * Total Capitalization is defined as Total Debt plus Shareholders' Equity. Balance Sheet Highlights: As of September 30, 2014 (Dollars in millions) Cash (including Cash Equivalents) $361 Total Debt $80 Shareholders' Equity $4,891 Total Assets $6,722 Other Financial Highlights: LTM Operating EBITDA $1,578 Backlog $5,024 Credit Facility Availability $266 Cash + Credit Facility Availability $627 Credit Statistics: Total Debt / LTM Operating EBITDA 0.05x Total Debt / Total Capitalization* 1.6% |
|
|
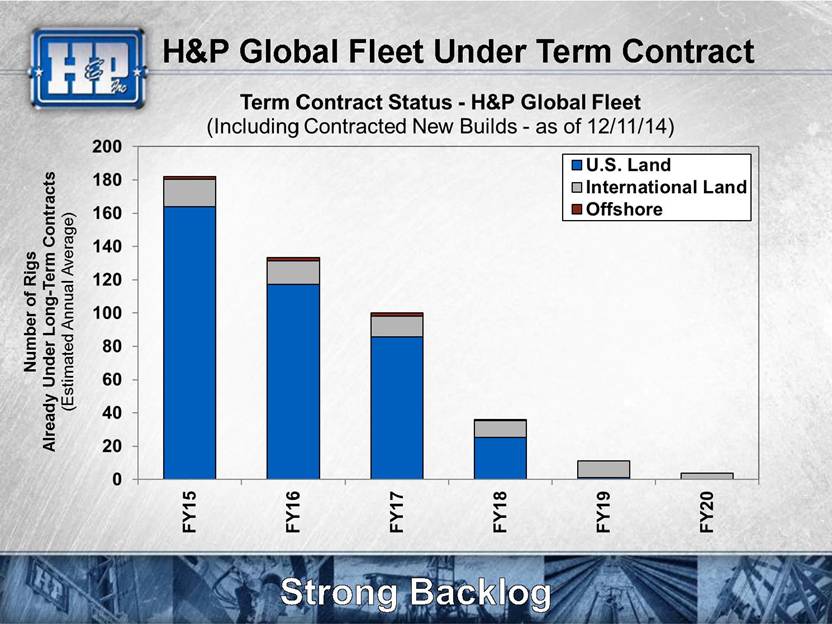
H&P Global Fleet Under Term Contract |
|
|
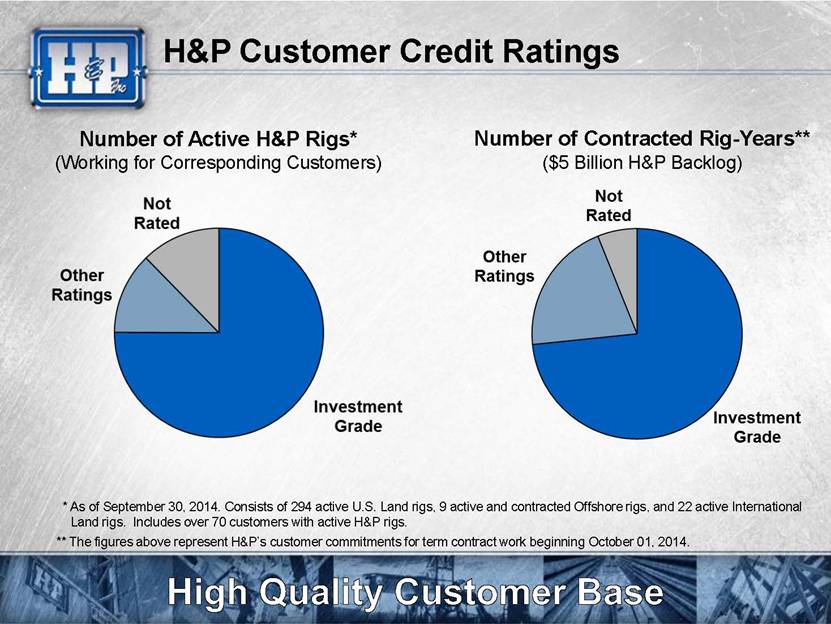
H&P Customer Credit Ratings * As of September 30, 2014. Consists of 294 active U.S. Land rigs, 9 active and contracted Offshore rigs, and 22 active International Land rigs. Includes over 70 customers with active H&P rigs. ** The figures above represent H&P’s customer commitments for term contract work beginning October 01, 2014. Number of Active H&P Rigs* (Working for Corresponding Customers) Number of Contracted Rig-Years** ($5 Billion H&P Backlog) |
|
|
H&P vs. Industry U.S. Land Customer Base Note: The above estimates corresponding to the active rig fleet in the U.S. are derived from multiple sources including Rig Data and corporate filings. |

|
|
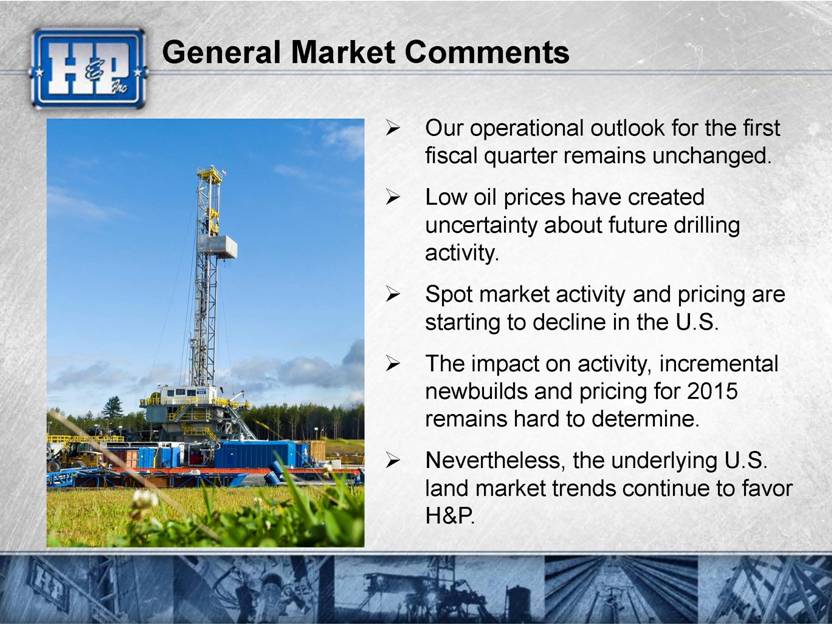
General Market Comments Our operational outlook for the first fiscal quarter remains unchanged. Low oil prices have created uncertainty about future drilling activity. Spot market activity and pricing are starting to decline in the U.S. The impact on activity, incremental newbuilds and pricing for 2015 remains hard to determine. Nevertheless, the underlying U.S. land market trends continue to favor H&P. |
|
|
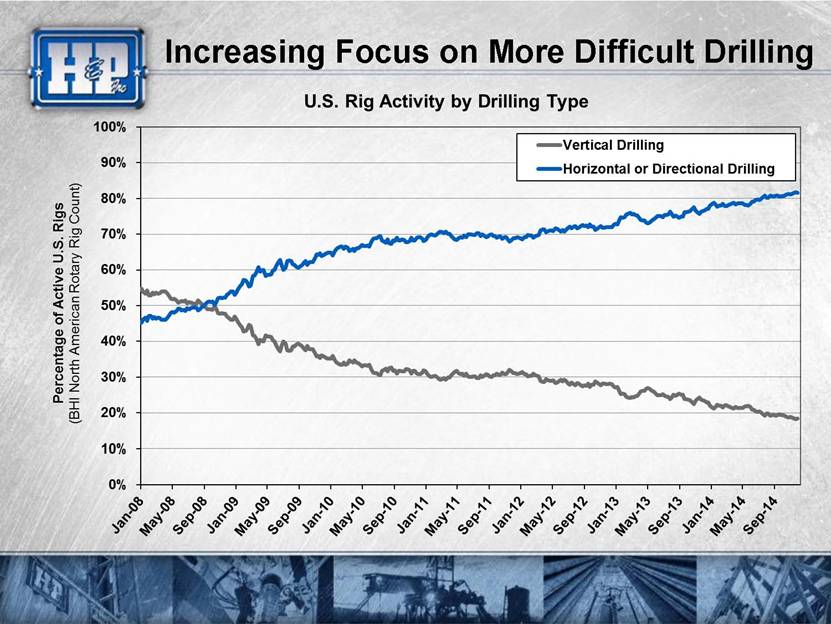
Unconventional Plays Shaping Landscape Well Complexity is increasing: Horizontal and directional wells make up about 80% of wells drilled in the U.S. Extended reach laterals progressively longer Multi-well pad drilling gaining acceptance in more areas This all creates an expanding level of demand for FlexRigs |

|
|
Increasing Focus on More Difficult Drilling |
|
|
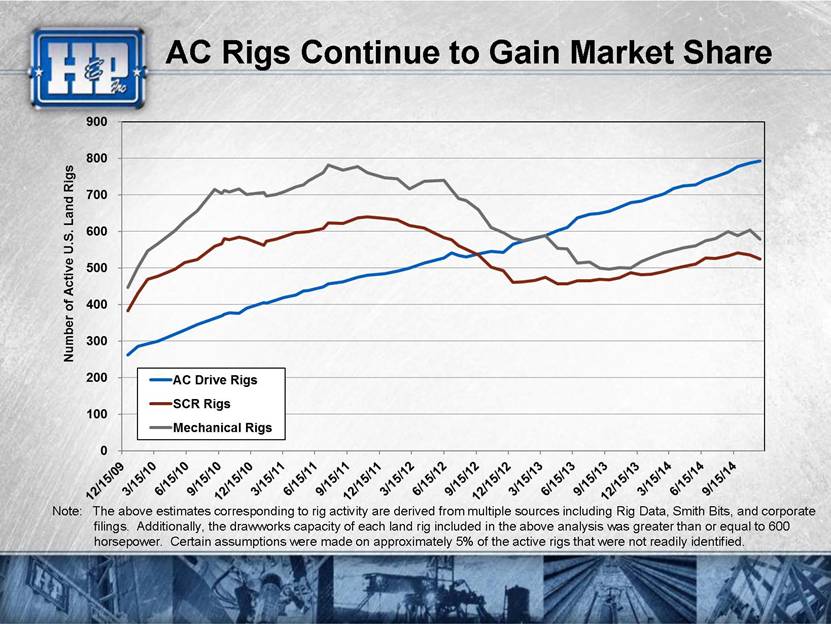
AC Rigs Continue to Gain Market Share Note: The above estimates corresponding to rig activity are derived from multiple sources including Rig Data, Smith Bits, and corporate filings. Additionally, the drawworks capacity of each land rig included in the above analysis was greater than or equal to 600 horsepower. Certain assumptions were made on approximately 5% of the active rigs that were not readily identified. |
|
|
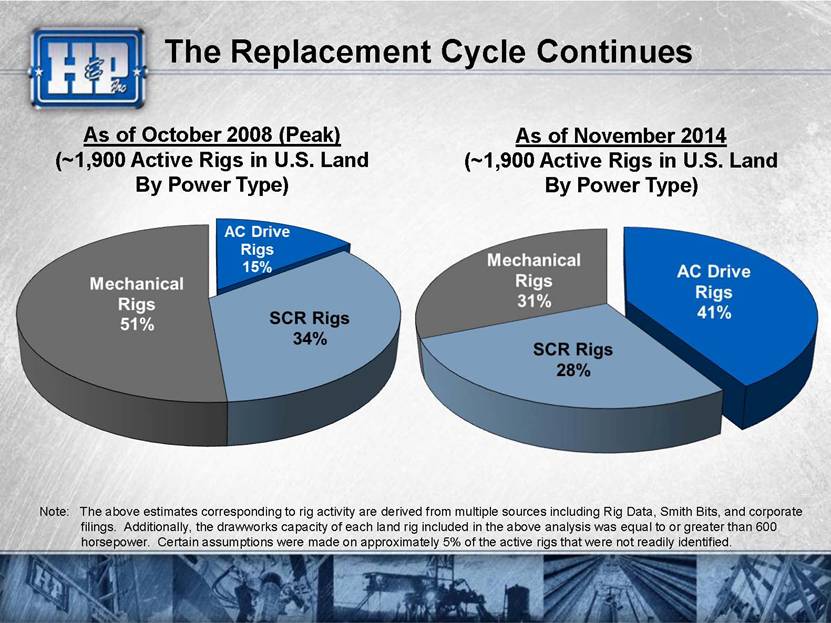
As of November 2014 (~1,900 Active Rigs in U.S. Land By Power Type) The Replacement Cycle Continues As of October 2008 (Peak) (~1,900 Active Rigs in U.S. Land By Power Type) Note: The above estimates corresponding to rig activity are derived from multiple sources including Rig Data, Smith Bits, and corporate filings. Additionally, the drawworks capacity of each land rig included in the above analysis was equal to or greater than 600 horsepower. Certain assumptions were made on approximately 5% of the active rigs that were not readily identified. |
|
|
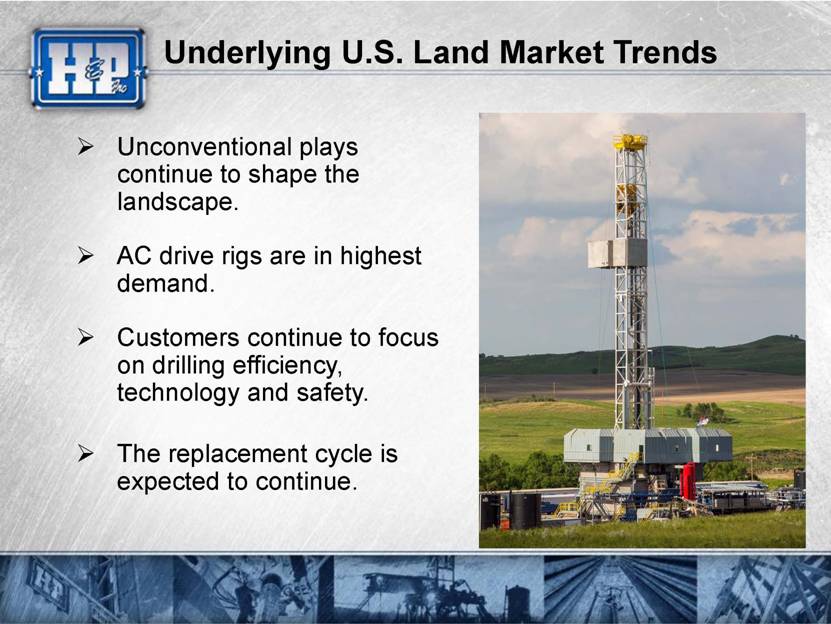
Underlying U.S. Land Market Trends Unconventional plays continue to shape the landscape. AC drive rigs are in highest demand. Customers continue to focus on drilling efficiency, technology and safety. The replacement cycle is expected to continue. |
|
|
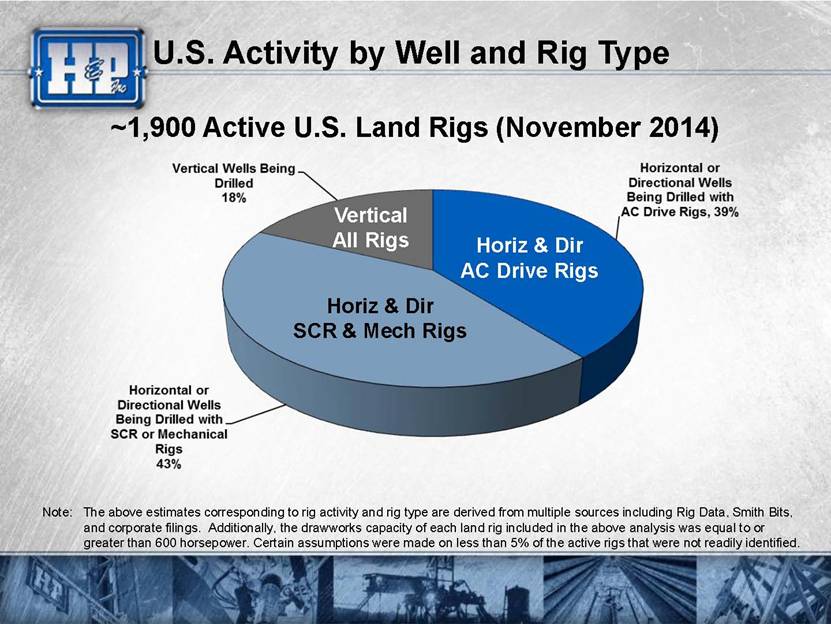
U.S. Activity by Well and Rig Type Note: The above estimates corresponding to rig activity and rig type are derived from multiple sources including Rig Data, Smith Bits, and corporate filings. Additionally, the drawworks capacity of each land rig included in the above analysis was equal to or greater than 600 horsepower. Certain assumptions were made on less than 5% of the active rigs that were not readily identified. ~1,900 Active U.S. Land Rigs (November 2014) Horiz & Dir AC Drive Rigs Horiz & Dir SCR & Mech Rigs Vertical All Rigs |
|
|
U.S. Activity by Well and Rig Type Note: The above estimates corresponding to rig activity and rig type are derived from multiple sources including Rig Data, Smith Bits, and corporate filings. Additionally, the drawworks capacity of each land rig included in the above analysis was equal to or greater than 600 horsepower. Certain assumptions were made on less than 5% of the active rigs that were not readily identified. Horiz & Dir AC Drive Rigs Horiz & Dir SCR & Mech Rigs Vertical All Rigs ~1,900 Active U.S. Land Rigs (November 2014) |

|
|
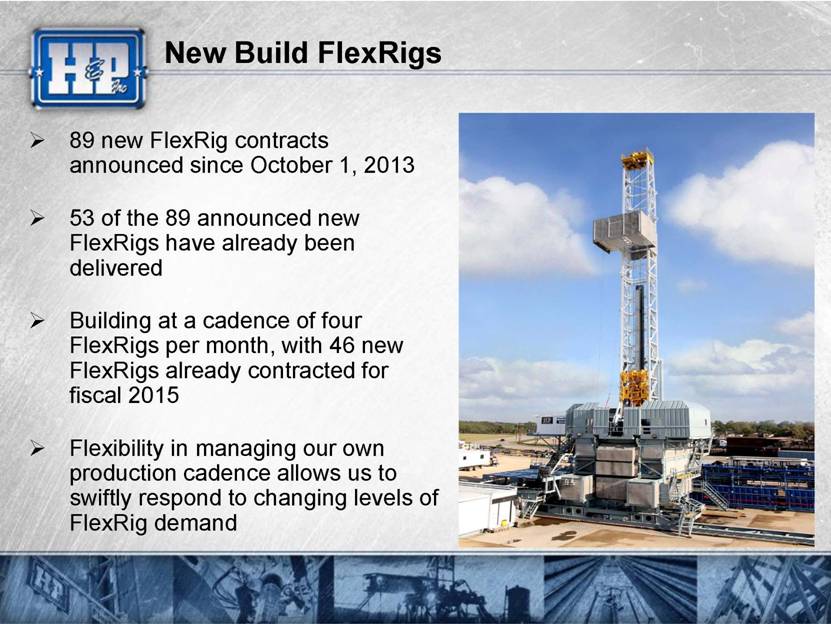
New Build FlexRigs 89 new FlexRig contracts announced since October 1, 2013 53 of the 89 announced new FlexRigs have already been delivered Building at a cadence of four FlexRigs per month, with 46 new FlexRigs already contracted for fiscal 2015 Flexibility in managing our own production cadence allows us to swiftly respond to changing levels of FlexRig demand |
|
|
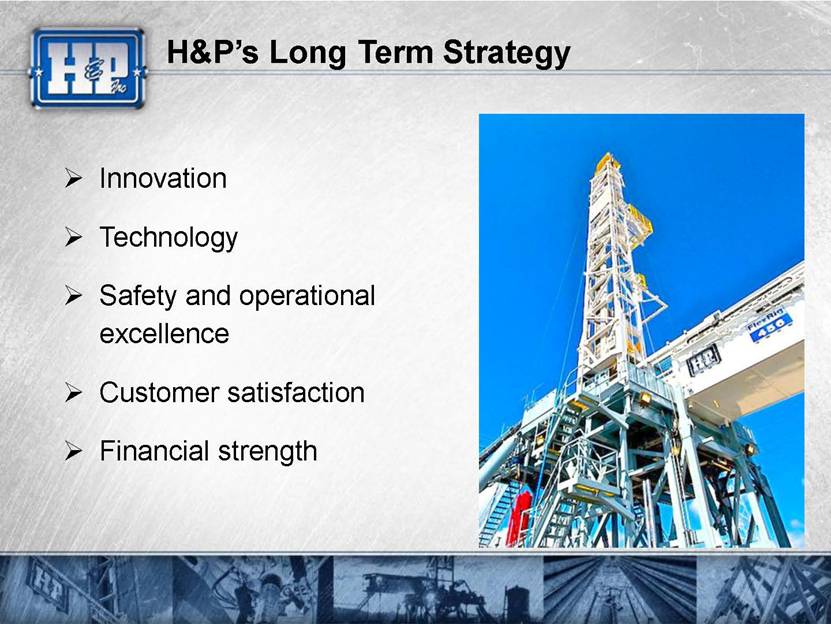
H&P’s Long Term Strategy Innovation Technology Safety and operational excellence Customer satisfaction Financial strength |
|
|
Additional References |

|
|
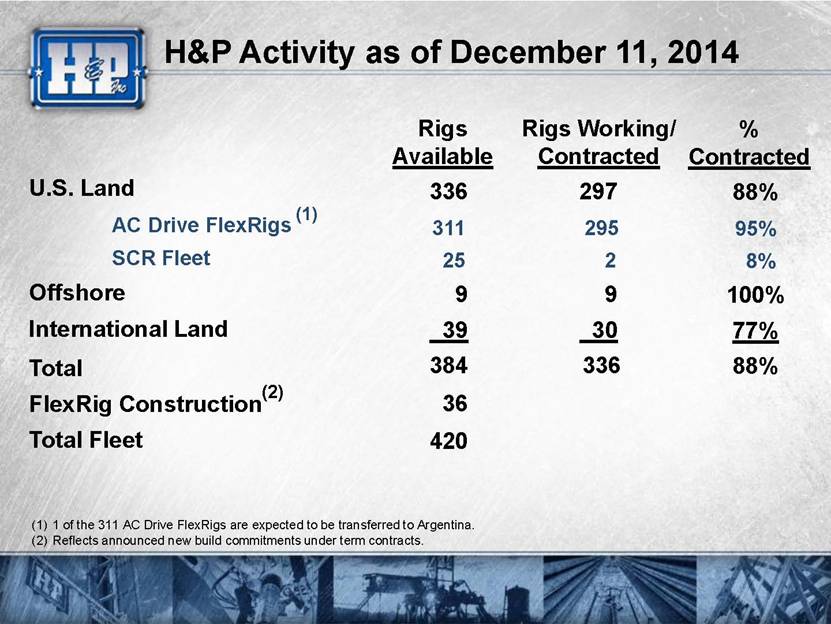
H&P Activity as of December 11, 2014 Rigs Working/ Contracted 297 295 2 9 30 336 Rigs Available 336 311 25 9 39 384 36 420 % Contracted 88% 95% 8% 100% 77% 88% U.S. Land AC Drive FlexRigs SCR Fleet Offshore International Land Total FlexRig Construction Total Fleet 1 of the 311 AC Drive FlexRigs are expected to be transferred to Argentina. Reflects announced new build commitments under term contracts. (1) (2) |
|
|
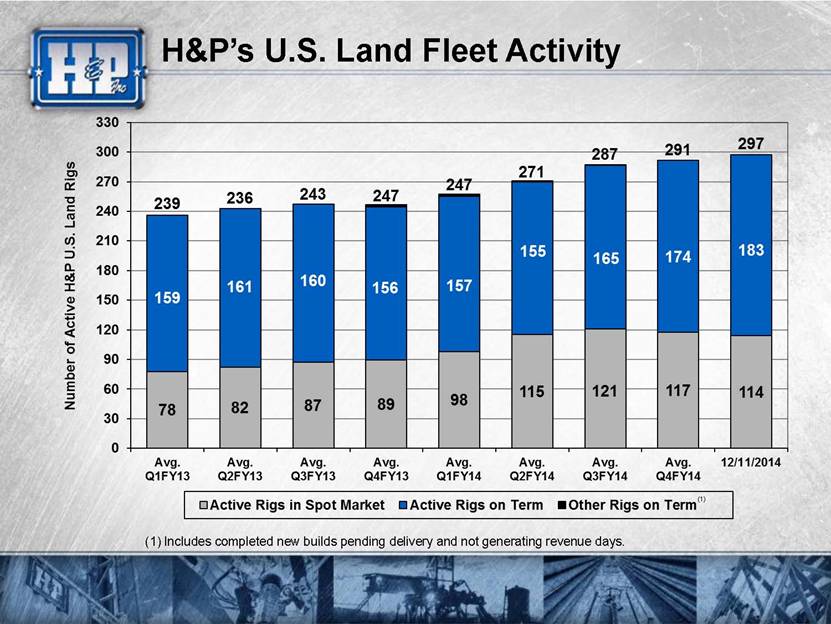
H&P’s U.S. Land Fleet Activity (1) (1) Includes completed new builds pending delivery and not generating revenue days. |
|
|
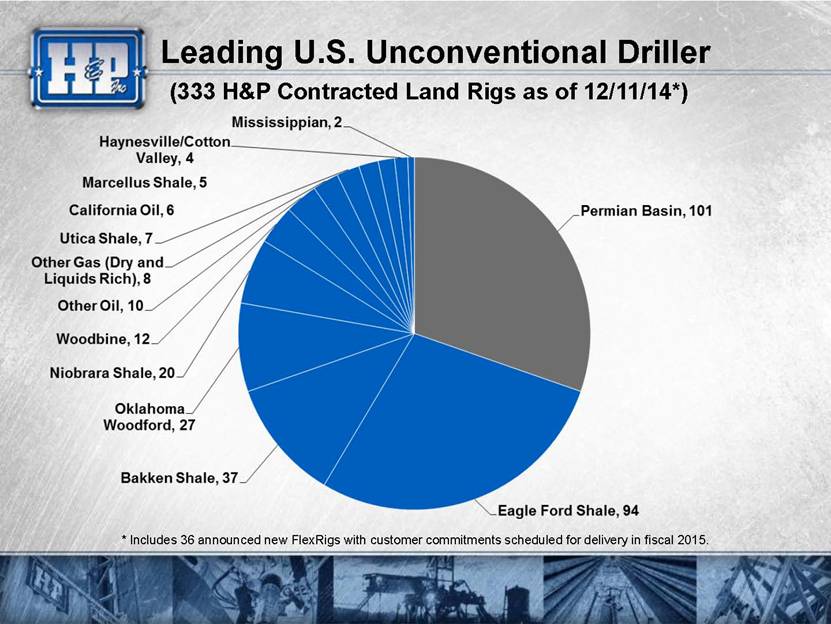
Leading U.S. Unconventional Driller * Includes 36 announced new FlexRigs with customer commitments scheduled for delivery in fiscal 2015. (333 H&P Contracted Land Rigs as of 12/11/14*) |
|
|
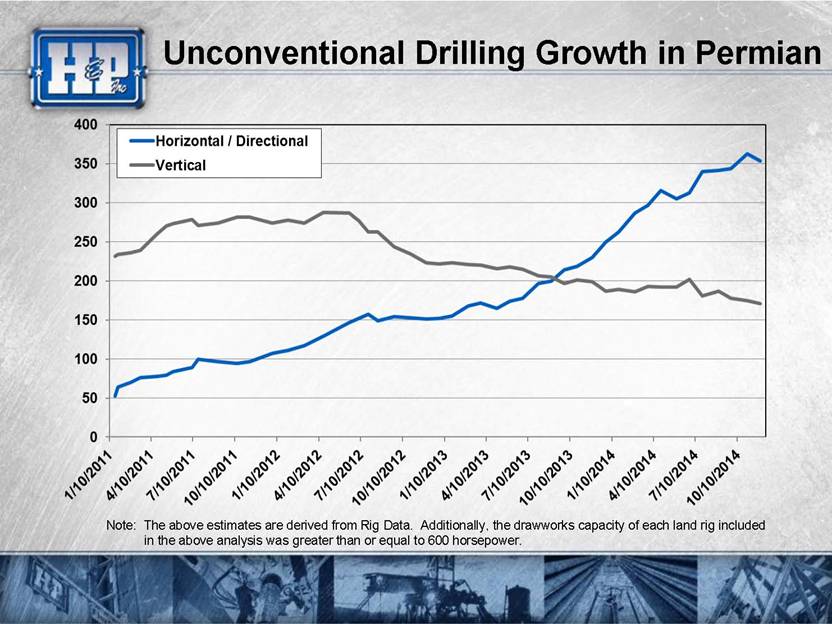
Unconventional Drilling Growth in Permian Note: The above estimates are derived from Rig Data. Additionally, the drawworks capacity of each land rig included in the above analysis was greater than or equal to 600 horsepower. |
|
|
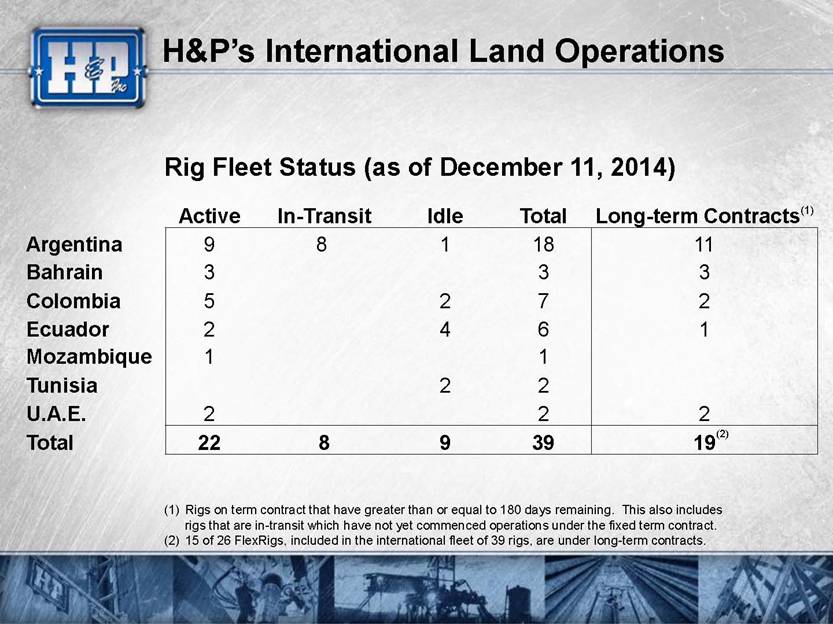
Active In-Transit Idle Total Long-term Contracts(1) Argentina 9 8 1 18 11 Bahrain 3 3 3 Colombia 5 2 7 2 Ecuador 2 4 6 1 Mozambique 1 1 Tunisia 2 2 U.A.E. 2 2 2 Total 22 8 9 39 19 H&P’s International Land Operations Rigs on term contract that have greater than or equal to 180 days remaining. This also includes rigs that are in-transit which have not yet commenced operations under the fixed term contract. 15 of 26 FlexRigs, included in the international fleet of 39 rigs, are under long-term contracts. (2) Rig Fleet Status (as of December 11, 2014) |
|
|
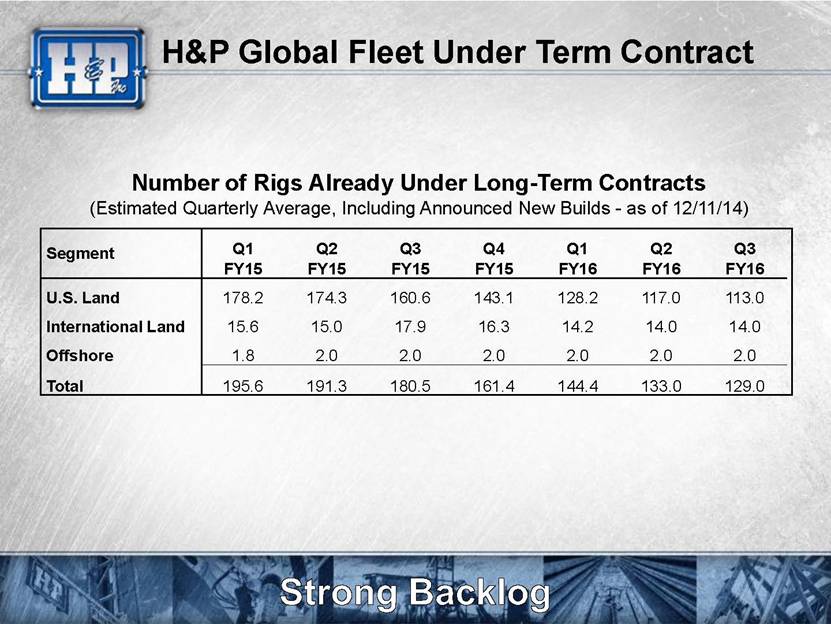
H&P Global Fleet Under Term Contract Segment Q1 Q2 Q3 Q4 Q1 Q2 Q3 FY15 FY15 FY15 FY15 FY16 FY16 FY16 U.S. Land 178.2 174.3 160.6 143.1 128.2 117.0 113.0 International Land 15.6 15.0 17.9 16.3 14.2 14.0 14.0 Offshore 1.8 2.0 2.0 2.0 2.0 2.0 2.0 Total 195.6 191.3 180.5 161.4 144.4 133.0 129.0 Number of Rigs Already Under Long-Term Contracts (Estimated Quarterly Average, Including Announced New Builds - as of 12/11/14) |
|
|
Distribution of Announced New Builds Of the 89 new build FlexRigs announced since 10/1/2013, 39 are going to the Permian, 18 to the Oklahoma Woodford, 15 to the Eagle Ford, five to the Tuscaloosa Marine Shale, four each to the Utica and Bakken, two to the Haynesville and one each to the Niobrara and Woodbine. 17 customers have ordered these new FlexRigs under multi-year term contracts (53 FlexRig3 rigs, 35 FlexRig5 rigs, and one FlexRig4 rig). More than two-thirds of these new FlexRigs will be equipped with hydraulic skid systems designed for multi-well pad locations. |
|
|
The FlexRig Difference: Key Advantages Increased drilling productivity and reliability Variable frequency AC technology providing precise control and increased capability Computerized electronic driller more precisely controls down-hole parameters FlexRig designs are suited for both efficient well to well moves and multi-well pad applications Accelerated well programs and NPV gains A safer and more environmentally friendly workplace Fleet size and uniformity Total well cost savings even at premium dayrates H&P’s FlexRig Advantage |
|
|
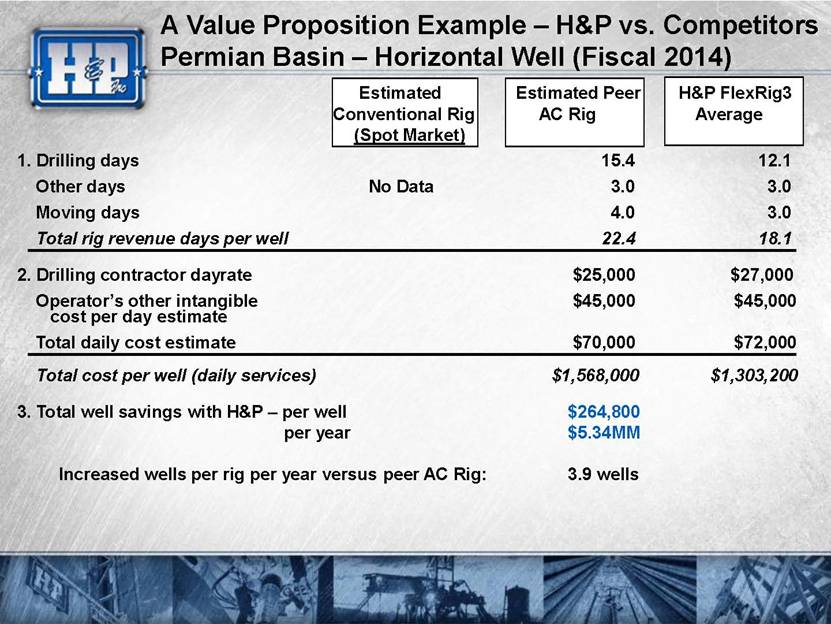
A Value Proposition Example – H&P vs. Competitors Permian Basin – Horizontal Well (Fiscal 2014) Estimated Estimated Peer H&P FlexRig3 Conventional Rig AC Rig Average (Spot Market) 1. Drilling days 15.4 12.1 Other days No Data 3.0 3.0 Moving days 4.0 3.0 Total rig revenue days per well 22.4 18.1 2. Drilling contractor dayrate $25,000 $27,000 Operator’s other intangible $45,000 $45,000 cost per day estimate Total daily cost estimate $70,000 $72,000 Total cost per well (daily services) $1,568,000 $1,303,200 3. Total well savings with H&P – per well $264,800 per year $5.34MM Increased wells per rig per year versus peer AC Rig: 3.9 wells |
|
|
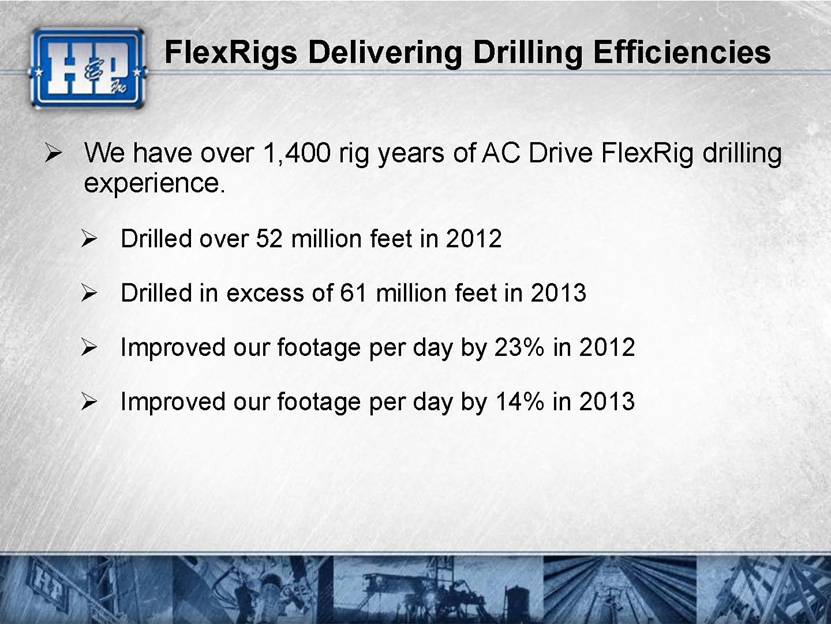
FlexRigs Delivering Drilling Efficiencies We have over 1,400 rig years of AC Drive FlexRig drilling experience. Drilled over 52 million feet in 2012 Drilled in excess of 61 million feet in 2013 Improved our footage per day by 23% in 2012 Improved our footage per day by 14% in 2013 |
|
|
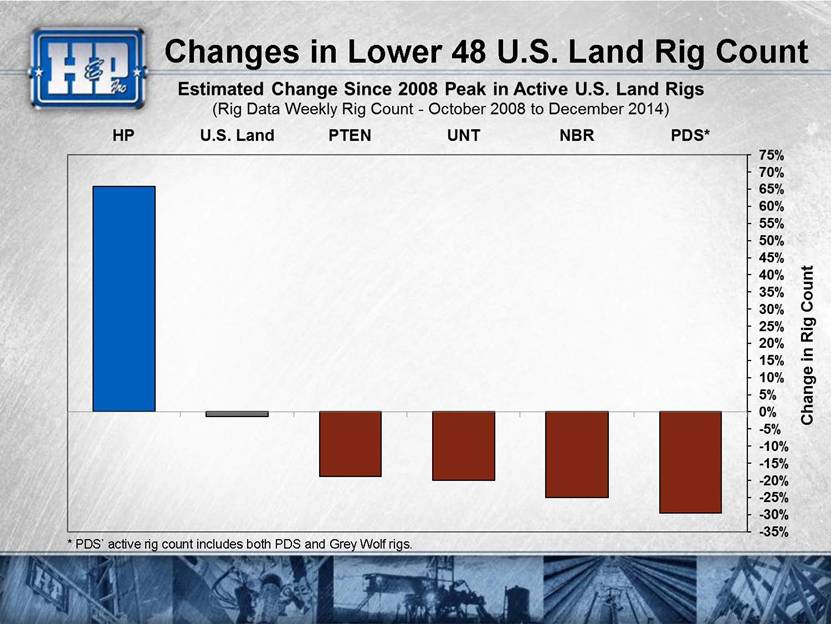
Changes in Lower 48 U.S. Land Rig Count * PDS’ active rig count includes both PDS and Grey Wolf rigs. |
|
|
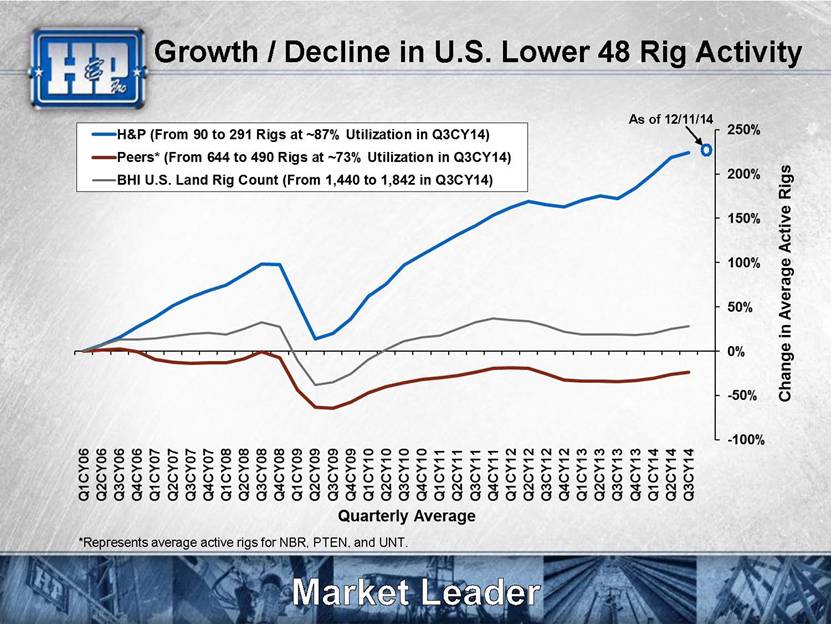
Growth / Decline in U.S. Lower 48 Rig Activity As of 12/11/14 *Represents average active rigs for NBR, PTEN, and UNT. |
|
|
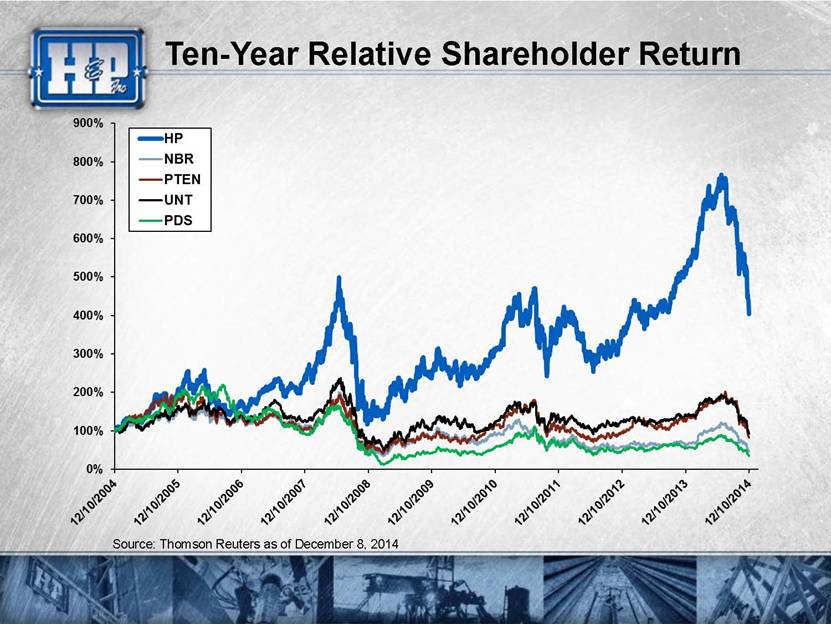
Ten-Year Relative Shareholder Return Source: Thomson Reuters as of December 8, 2014 |
|
|
Land Drilling Market Valuations Source: Thomson Reuters as of December 8, 2014. |

|
|
Return on Equity * Excludes gains from the sale of investment securities and 4QFY14 abandonment (non-cash) charges. H&P's unadjusted ROE resulted in 15.2%. ** The corresponding ROIC values for the selected companies exclude certain extraordinary, non-recurring charges. |

|
|
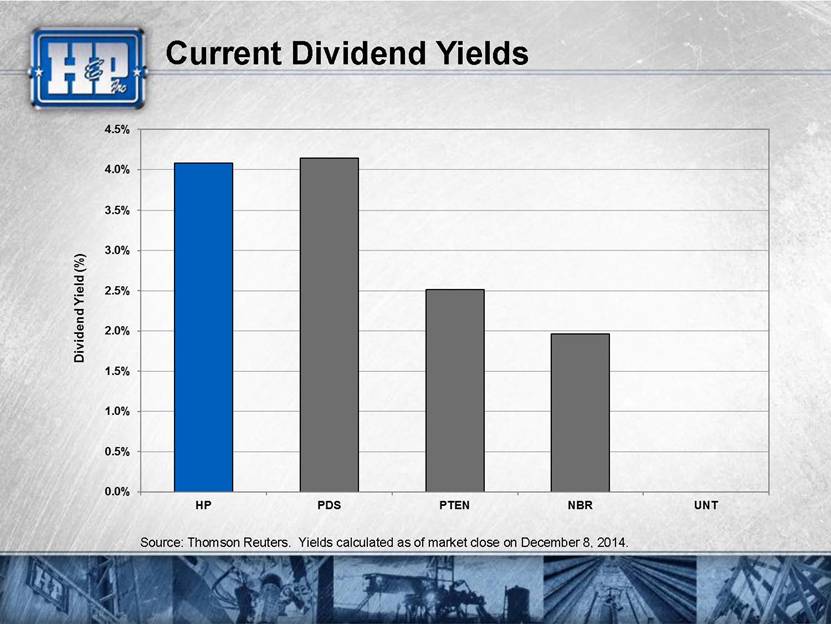
Current Dividend Yields Source: Thomson Reuters. Yields calculated as of market close on December 8, 2014. |
|
|
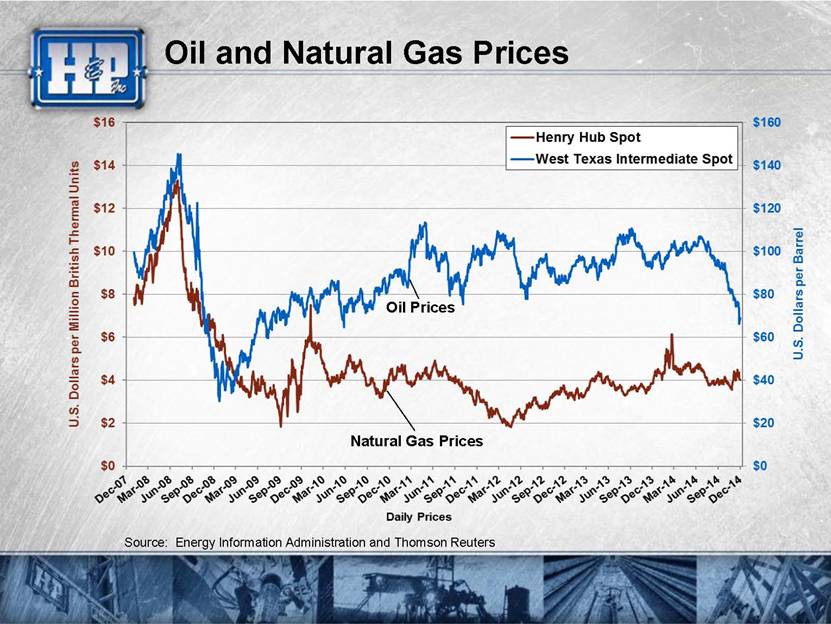
Oil and Natural Gas Prices Source: Energy Information Administration and Thomson Reuters Oil Prices Natural Gas Prices |
|
|
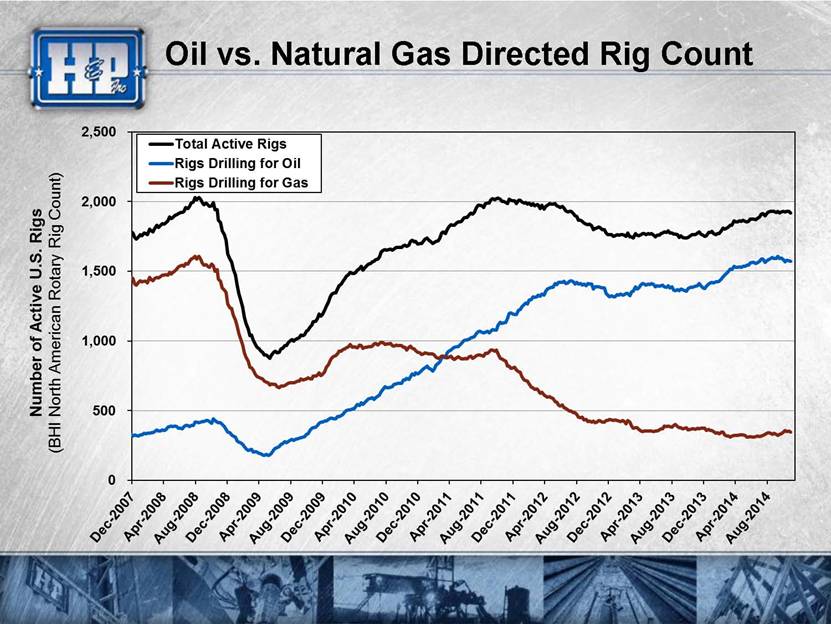
Oil vs. Natural Gas Directed Rig Count |
|
|
End of Document |