Attached files
| file | filename |
|---|---|
| EX-23.7 - EX-23.7 - TerraForm Power NY Holdings, Inc. | d827022dex237.htm |
| EX-23.1 - EX-23.1 - TerraForm Power NY Holdings, Inc. | d827022dex231.htm |
| EX-23.6 - EX-23.6 - TerraForm Power NY Holdings, Inc. | d827022dex236.htm |
| EX-23.4 - EX-23.4 - TerraForm Power NY Holdings, Inc. | d827022dex234.htm |
| EX-23.5 - EX-23.5 - TerraForm Power NY Holdings, Inc. | d827022dex235.htm |
| EX-23.2 - EX-23.2 - TerraForm Power NY Holdings, Inc. | d827022dex232.htm |
| EX-23.3 - EX-23.3 - TerraForm Power NY Holdings, Inc. | d827022dex233.htm |
| EX-23.8 - EX-23.8 - TerraForm Power NY Holdings, Inc. | d827022dex238.htm |
| EX-23.9 - EX-23.9 - TerraForm Power NY Holdings, Inc. | d827022dex239.htm |
Table of Contents
As filed with the Securities and Exchange Commission on December 9, 2014
No. 333-
UNITED STATES
SECURITIES AND EXCHANGE COMMISSION
Washington, D.C. 20549
FORM S-1
REGISTRATION STATEMENT
UNDER
THE SECURITIES ACT OF 1933
TerraForm Power, Inc.
(Exact name of registrant as specified in its charter)
| Delaware | 4911 | 46-4780940 | ||
| (State or other jurisdiction of incorporation or organization) | (Primary Standard Industrial Classification Code Number) | (I.R.S. Employer Identification No.) |
12500 Baltimore Avenue
Beltsville, Maryland 20705
(443) 909-7200
(Address, including zip code, and telephone number, including area code, of registrant’s principal executive offices)
Sebastian Deschler, Esq.
Senior Vice President, General Counsel and Secretary
TerraForm Power, Inc.
12500 Baltimore Avenue
Beltsville, Maryland 20705
(443) 909-7200
(Name, address, including zip code, and telephone number, including area code, of agent for service)
Copies of all communications, including communications sent to agent for service, should be sent to:
| Andrea L. Nicolas Skadden, Arps, Slate, Meagher & Flom LLP Four Times Square New York, New York 10036 (212) 735-3000 |
Kirk A. Davenport II Latham & Watkins LLP 885 Third Avenue New York, New York 10022 (212) 906-1200 |
Approximate date of commencement of proposed sale to the public: As soon as practicable after this Registration Statement becomes effective.
If any of the securities being registered on this Form are to be offered on a delayed or continuous basis pursuant to Rule 415 under the Securities Act of 1933, check the following box: ¨
If this Form is filed to register additional securities for an offering pursuant to Rule 462(b) under the Securities Act, please check the following box and list the Securities Act registration statement number of the earlier effective registration statement for the same offering. ¨
If this Form is a post-effective amendment filed pursuant to Rule 462(c) under the Securities Act, check the following box and list the Securities act registration statement number of the earlier effective registration statement for the same offering. ¨
If this Form is a post-effective amendment filed pursuant to Rule 462(d) under the Securities Act, check the following box and list the Securities Act registration statement number of the earlier effective registration statement for the same offering. ¨
Indicate by check mark whether the registrant is a large accelerated filer, an accelerated filer, a non-accelerated filer, or a smaller reporting company. See the definitions of “large accelerated filer,” “accelerated filer” and “smaller reporting company” in Rule 12b-2 of the Exchange Act. (Check one):
| Large accelerated filer | ¨ | Accelerated filer | ¨ | |||
| Non-accelerated filer | x (Do not check if a smaller reporting company) | Smaller reporting company | ¨ | |||
CALCULATION OF REGISTRATION FEE
|
| ||||
| Title of Each Class of Securities to be Registered |
Proposed Maximum Aggregate |
Amount of Registration Fee(2) | ||
| Class A Common Stock, $0.01 par value per share |
$350,000,000 | $40,670 | ||
|
| ||||
|
| ||||
| (1) | Estimated solely for purposes of calculating the registration fee pursuant to Rule 457(o) of the Securities Act of 1933, as amended. |
| (2) | Includes the offering price of any additional shares of Class A Common Stock that the underwriters have the option to purchase. |
The registrant hereby amends this Registration Statement on such date or dates as may be necessary to delay its effective date until the registrant shall file a further amendment which specifically states that this Registration Statement shall thereafter become effective in accordance with Section 8(a) of the Securities Act of 1933, as amended, or until this Registration Statement shall become effective on such date as the Securities and Exchange Commission, acting pursuant to said Section 8(a), may determine.
Table of Contents
The information in this prospectus is not complete and may be changed. We may not sell these securities until the registration statement filed with the Securities and Exchange Commission is effective. This prospectus is not an offer to sell these securities and it is not soliciting an offer to buy these securities in any state where the offer or sale is not permitted.
Subject to Completion, Dated December 9, 2014
Shares

TerraForm Power, Inc.
Class A Common Stock
We are selling shares of our Class A common stock.
Our Class A common stock trades on the NASDAQ Global Select Market under the symbol “TERP.” The last reported trading price of shares of our Class A common stock on December 5, 2014 was $30.99.
We are an “emerging growth company” as the term is used in the Jumpstart Our Business Startups Act of 2012 and, as such, have elected to comply with certain reduced public company reporting requirements.
See “Risk Factors” beginning on page 31 to read about factors you should consider before buying shares of our Class A common stock.
Neither the Securities and Exchange Commission nor any state securities commission has approved or disapproved of these securities or passed upon the accuracy or adequacy of this prospectus. Any representation to the contrary is a criminal offense.
| Per Share |
Total | |||||||
| Price to the public |
$ | $ | ||||||
| Underwriting discount |
$ | $ | ||||||
| Proceeds, before expenses, to us |
$ | $ | ||||||
The underwriters have the option to purchase up to an additional shares from TerraForm Power, Inc. at the price to the public less the underwriting discount for a period of 30 days after the date of this prospectus.
The underwriters expect to deliver the shares against payment in New York, New York on , .
| Barclays | Goldman, Sachs & Co. | Morgan Stanley |
| BofA Merrill Lynch | Citigroup | Macquarie Capital |
Prospectus Dated , .
Table of Contents
| Page | ||||
| 1 | ||||
| 31 | ||||
| 78 | ||||
| 80 | ||||
| 81 | ||||
| 82 | ||||
| 83 | ||||
| 87 | ||||
| 102 | ||||
| MANAGEMENT’S DISCUSSION AND ANALYSIS OF FINANCIAL CONDITION AND RESULTS OF OPERATIONS |
104 | |||
| 131 | ||||
| 140 | ||||
| 176 | ||||
| 182 | ||||
| SECURITY OWNERSHIP OF CERTAIN BENEFICIAL OWNERS AND MANAGEMENT |
188 | |||
| 191 | ||||
| 215 | ||||
| 220 | ||||
| 228 | ||||
| UNITED STATES FEDERAL INCOME TAX CONSEQUENCES TO NON-U.S. HOLDERS |
231 | |||
| 236 | ||||
We have not and the underwriters have not authorized anyone to provide you with any information other than that contained in this prospectus or in any free writing prospectus prepared by or on behalf of us or to which we have referred you. We are offering to sell, and seeking offers to buy, shares of our Class A common stock only in jurisdictions where such offers and sales are permitted. The information in this prospectus or any free writing prospectus is accurate only as of its date, regardless of its time of delivery or the time of any sale of shares of our Class A common stock. Our business, financial condition, results of operations and prospects may have changed since that date.
Trademarks and Trade Names
We own or have rights to various trademarks, service marks and trade names that we use in connection with the operation of our business. This prospectus may also contain trademarks, service marks and trade names of SunEdison, Inc. and third parties, which are the property of their respective owners. Our use or display of third parties’ trademarks, service marks, trade names or products in this prospectus is not intended to, and should not be read to, imply a relationship with or endorsement or sponsorship of us. Solely for convenience, the trademarks, service marks and trade names referred to in this prospectus may appear without the ®, TM or SM symbols, but such references are not intended to indicate, in any way, that we will not assert, to the fullest extent under applicable law, our rights or the right of the applicable licensor to these trademarks, service marks and trade names.
Industry and Market Data
This prospectus includes industry data and forecasts that we obtained from industry publications and surveys, public filings and internal company sources. Industry publications and surveys and forecasts generally state that the information contained therein has been obtained from sources
i
Table of Contents
believed to be reliable, but there can be no assurance as to the accuracy or completeness of the included information. Statements as to our market position and market estimates are based on independent industry publications, government publications, third party forecasts, management’s estimates and assumptions about our markets and our internal research. While we are not aware of any misstatements regarding the market, industry or similar data presented herein, such data involve risks and uncertainties and are subject to change based on various factors, including those discussed under the headings “Risk Factors” and “Cautionary Statement Concerning Forward-Looking Statements” in this prospectus.
As used in this prospectus, all references to watts (e.g., Megawatts, Gigawatts, MW, GW, etc.) refer to measurements of direct current, or “DC,” with respect to solar generation assets, and measurements of alternating current, or “AC,” with respect to wind generation assets.
Certain Defined Terms
Unless the context provides otherwise, references herein to:
| • | “COD” refers to commercial operations date; |
| • | “IPO” refers to our initial public offering in July 2014; |
| • | “PPAs” refers to our long-term power purchase agreements and energy hedge contracts; |
| • | “SunEdison” and “Sponsor” refer to SunEdison, Inc. together with, where applicable, its consolidated subsidiaries; |
| • | “Support Agreement” refers to the project support agreement entered into with our Sponsor in connection with our IPO; |
| • | “Terra LLC” refers to TerraForm Power, LLC; |
| • | “Terra Operating LLC” refers to TerraForm Power Operating, LLC, a wholly owned subsidiary of Terra LLC; and |
| • | “we,” “our,” “us,” “our company” and “TerraForm Power” refer to TerraForm Power, Inc., together with, where applicable, its consolidated subsidiaries. |
See “Summary—Organizational Structure” for more information regarding our ownership structure.
ii
Table of Contents
The following summary highlights information contained elsewhere in this prospectus. It does not contain all the information you need to consider in making your investment decision. Before making an investment decision, you should read this entire prospectus carefully and should consider, among other things, the matters set forth under “Risk Factors,” “Selected Historical Combined Consolidated Financial Data,” “Management’s Discussion and Analysis of Financial Condition and Results of Operations” and our and our predecessor’s financial statements and related notes thereto appearing elsewhere in this prospectus.
About TerraForm Power, Inc.
We are a dividend growth-oriented company formed to own and operate contracted clean power generation assets acquired from SunEdison and third parties. Our business objective is to acquire high-quality contracted cash flows, primarily from owning solar and wind generation assets serving utility, commercial and residential customers. Over time, we intend to acquire other clean power generation assets, including natural gas and hydro-electricity facilities, as well as hybrid energy solutions that enable us to provide contracted power on a 24/7 basis. We believe the renewable power generation segment is growing more rapidly than other power generation segments due in part to the emergence in various energy markets of “grid parity,” which is the point at which renewable energy sources can generate electricity at a cost equal to or lower than prevailing electricity prices. We expect retail electricity prices to continue to rise due to the increasing cost of producing electricity from fossil fuels caused by required investments in generation plants and transmission and distribution infrastructure and increasing regulatory costs, among other factors.
Our current portfolio consists of solar projects located in the United States, Canada, the United Kingdom and Chile with an aggregate nameplate capacity of 887.1 MW. As of our IPO, our portfolio consisted of projects with an aggregate nameplate capacity of 807.7 MW. Since then, we acquired several Call Right Projects from our Sponsor with a total capacity of 54.6 MW and also completed the Hudson Energy Acquisition (as defined herein), in which we acquired 25.5 MW of operating solar power assets. In addition, we expect to complete the Capital Dynamics Acquisition (as defined herein) in December 2014, which will add a further 77.6 MW of operating solar power assets to our portfolio. In November 2014, we agreed to acquire 521.1 MW of operating power assets, including 500.0 MW of wind power assets and 21.1 MW of solar power assets, in the First Wind Acquisition (as defined herein) for a total consideration of $862.0 million. If the Capital Dynamics Acquisition and the First Wind Acquisition are consummated, our portfolio will include both solar and wind projects and will increase to a total nameplate capacity of 1,485.8 MW.
In addition to growing our current portfolio, our pipeline of call right projects has increased since the IPO. As of November 30, 2014, the Call Right Projects that are specifically identified pursuant to the Support Agreement have a total nameplate capacity of 1.7 GW. Additionally, in connection with the First Wind Acquisition, we entered into an Intercompany Agreement with our Sponsor, or the “Intercompany Agreement,” under which we will be granted additional call rights with respect to certain projects in the First Wind pipeline, which are expected to represent an additional 1.6 GW of wind and solar generation assets. If the First Wind Acquisition is consummated, the total nameplate capacity of the projects to which we have call rights under both the Intercompany Agreement and the Support Agreement will be over 3.3 GW. We anticipate the First Wind Acquisition will close in the first quarter of 2015. See “—Recent Developments—Acquisition Transactions.”
We intend to further expand and diversify our current project portfolio by acquiring utility-scale, distributed and residential assets located in the United States, Canada, the United Kingdom, Chile and
1
Table of Contents
certain other jurisdictions, each of which we expect will have a long-term PPA with a creditworthy counterparty. Substantially all of the projects we will acquire in the Capital Dynamics Acquisition and First Wind Acquisition have a long-term PPA with a creditworthy counterparty, and the weighted average (based on MW) remaining life of our PPAs if both acquisitions are consummated would be approximately 16 years.
Further growth in our project portfolio will be driven by our relationship with our Sponsor, including access to its project pipeline, and by our access to third party developers and owners of clean generation assets in our core markets. As of September 30, 2014, our Sponsor had a 4.5 GW pipeline of development stage solar projects. An additional 1.6 GW pipeline of solar and wind development projects will be acquired by our Sponsor if the First Wind Acquisition is consummated. In addition, our Sponsor is a leading operator of solar power plants with approximately 3.0 GW of total nameplate capacity under management. Our Sponsor has provided us with a dedicated management team that has significant experience in clean power generation. We believe we are well-positioned for substantial growth due to the high quality, diversification and scale of our project portfolio, the PPAs we have with creditworthy counterparties, our dedicated management team and our Sponsor’s project origination and asset management capabilities.
We entered into the Support Agreement with our Sponsor in connection with our IPO, which requires our Sponsor to offer us additional qualifying projects from its development pipeline by the end of 2016 that are projected to generate an aggregate of at least $175.0 million of cash available for distribution, or “CAFD,” during the first 12 months following the qualifying projects’ respective COD, or “Projected FTM CAFD.” We refer to these projects as the “Call Right Projects.” Specifically, the Support Agreement requires our Sponsor to offer us:
| • | from the completion of our IPO through the end of 2015, projects that are projected to generate an aggregate of at least $75.0 million of cash available for distribution during the first 12 months following their respective COD; and |
| • | during calendar year 2016, projects that are projected to generate an aggregate of at least $100.0 million of cash available for distribution during the first 12 months following their respective COD. |
If the amount of Projected FTM CAFD of the projects we acquire under the Support Agreement through the end of 2015 is less than $75.0 million, or the amount of Projected FTM CAFD of the projects we acquire under the Support Agreement during 2016 is less than $100.0 million, our Sponsor has agreed that it will continue to offer us sufficient Call Right Projects until the total aggregate Projected FTM CAFD commitment has been satisfied. Since our IPO, our Sponsor has updated the list of Call Right Projects, with projects representing a further 1.7 GW of total nameplate capacity identified as Call Right Projects as of November 30, 2014. We believe the currently identified Call Right Projects, along with the 54.6 MW of Call Right Projects we have acquired from our Sponsor since our IPO, will be sufficient to satisfy a majority of the Projected FTM CAFD commitment for 2015 and between 45% and 70% of the Projected FTM CAFD commitment for 2016 (depending on the amount of debt financing we use for such projects).
In addition, the Support Agreement grants us a right of first offer with respect to any solar projects (other than Call Right Projects) located in the United States, Canada, the United Kingdom, Chile and certain other jurisdictions that our Sponsor decides to sell or otherwise transfer during the six-year period following the completion of our IPO. We refer to these projects as the “ROFO Projects.” The Support Agreement does not identify the ROFO Projects since our Sponsor will not be obligated to sell any project that would constitute a ROFO Project. As a result, we do not know when, if ever, any
2
Table of Contents
ROFO Projects or other assets will be offered to us. In addition, in the event that our Sponsor elects to sell such assets, it will not be required to accept any offer we make to acquire any ROFO Project and, following the completion of good faith negotiations with us, our Sponsor may choose to sell such assets to a third party or not to sell the assets at all.
In addition to the Call Right Projects under the Support Agreement, pursuant to the Intercompany Agreement we will have additional call rights with respect to certain projects in the First Wind pipeline, which are expected to represent an additional 1.6 GW of wind and solar generation assets from 2015 to 2017, subject to the consummation of the First Wind Acquisition. These additional call right projects will not count towards our Sponsor’s Projected FTM CAFD commitment under the Support Agreement.
3
Table of Contents
Our Portfolio and the Call Right Projects
The following table provides an overview of the assets that comprise our portfolio as of November 30, 2014:
| Offtake Agreements |
||||||||||||||||||||||
| Project Names |
Location | COD(1) | Nameplate Capacity (MW)(2) |
# of Sites |
Project Origin(3) |
Counterparty |
Counterparty Credit Rating(4) |
Remaining Duration of PPA (Years)(5) |
||||||||||||||
| Distributed Generation: |
||||||||||||||||||||||
| U.S. Projects 2014 |
U.S. | Q2 2014-Q4 2014 |
45.4 | 41 | C | Various utilities, municipalities and commercial entities | A+, A1 | 20 | ||||||||||||||
| Hudson Energy |
U.S. | 2011-2013 | 25.5 | 101 | A | Various commercial, residential and governmental entities | A+, A1 | 15 | ||||||||||||||
| Summit Solar Projects |
U.S. | 2007-2014 | 19.6 | 50 | A | Various commercial and governmental entities | A, A2 | 14 | ||||||||||||||
| Canada | 2011-2013 | 3.8 | 7 | A | Ontario Power Authority | A-, Aa1 | 18 | |||||||||||||||
| Enfinity |
U.S. | 2011-2013 | 15.7 | 16 | A | Various commercial, residential and governmental entities | A, A2 | 18 | ||||||||||||||
| U.S. Projects 2009-2013 |
U.S. | 2009-2013 | 15.2 | 73 | C | Various commercial and governmental entities | BBB+, Baa1 | 16 | ||||||||||||||
| California Public Institutions |
U.S. | Q4 2013-Q3 2014 |
13.5 | 5 | C | State of California Department of Corrections and Rehabilitation | A+, A3 | 19 | ||||||||||||||
| MA Operating |
U.S. | Q3 2013-Q4 2013 |
12.2 | 4 | A | Various municipalities | A+, A1 | 20 | ||||||||||||||
| SunE Solar Fund X |
U.S. | 2010-2011 | 8.8 | 12 | C | Various utilities, municipalities and commercial entities | AA, Aa2 | 17 | ||||||||||||||
| LPT II Fund |
U.S. | Q4 2014-Q2 2015 |
4.6 | 9 | S | Various commercial and governmental entities | A, A2 | 19 | ||||||||||||||
|
|
|
|
|
|||||||||||||||||||
| Subtotal |
164.3 | 318 | ||||||||||||||||||||
4
Table of Contents
| Offtake Agreements |
||||||||||||||||||||||
| Project Names |
Location | COD(1) | Nameplate Capacity (MW)(2) |
# of Sites |
Project Origin(3) |
Counterparty |
Counterparty Credit Rating(4) |
Remaining Duration of PPA (Years)(5) |
||||||||||||||
| Utility: |
||||||||||||||||||||||
| Mt. Signal |
U.S. | Q1 2014 | 265.9 | 1 | A | San Diego Gas & Electric | A, A1 | 24 | ||||||||||||||
| Regulus Solar |
U.S. | Q4 2014 | 81.6 | 1 | C | Southern California Edison | BBB+, A2 | 20 | ||||||||||||||
| North Carolina Portfolio |
U.S. | Q4 2014 - Q1 2015 |
26.0 | 4 | C | Duke Energy Progress | BBB+, A1 | 15 | ||||||||||||||
| Atwell Island |
U.S. | Q1 2013 | 23.5 | 1 | A | Pacific Gas & Electric Company | BBB, A3 | 23 | ||||||||||||||
| Nellis |
U.S. | Q4 2007 | 14.1 | 1 | A | U.S. Government (PPA); Nevada Power Company (RECs)(6) | AA+, Aaa, BBB+, Baa2 |
13 | ||||||||||||||
| Alamosa |
U.S. | Q4 2007 | 8.2 | 1 | C | Xcel Energy | A-, A3 | 13 | ||||||||||||||
| CalRENEW-1 |
U.S. | Q2 2010 | 6.3 | 1 | A | Pacific Gas & Electric Company | BBB, A3 | 16 | ||||||||||||||
| Marsh Hill |
Canada | Q2 2015 | 18.7 | 1 | A | Ontario Power Authority | A-, Aa1 | 20 | ||||||||||||||
| SunE Perpetual Lindsay |
Canada | Q4 2014 | 15.5 | 1 | C | Ontario Power Authority | A-, Aa1 | 20 | ||||||||||||||
| Stonehenge |
U.K. | Q2 2014 | 41.1 | 3 | A | Statkraft AS | A-, Baa1 | 15 | ||||||||||||||
| Crundale |
U.K. | Q4 2014 | 37.8 | 1 | S | Statkraft AS | A-, Baa1 | 15 | ||||||||||||||
| Stonehenge Operating |
U.K. | Q1 2013 - Q2 2013 |
23.6 | 3 | A | Total Gas & Power Limited | NR, NR | 14 | ||||||||||||||
| Says Court |
U.K. | Q2 2014 | 19.8 | 1 | C | Statkraft AS | A-, Baa1 | 15 | ||||||||||||||
| Crucis Farm |
U.K. | Q3 2014 | 16.1 | 1 | C | Statkraft AS | A-, Baa1 | 15 | ||||||||||||||
| Fairwinds |
U.K. | Q4 2014 | 12.2 | 1 | S | Statkraft AS | A-, Baa1 | 15 | ||||||||||||||
| Norrington |
U.K. | Q2 2014 | 11.2 | 1 | A | Statkraft AS | A-, Baa1 | 15 | ||||||||||||||
| CAP(7) |
Chile | Q1 2014 | 101.2 | 1 | C | Compañia Minera del Pacifico (CMP) | BBB-, NR | 19 | ||||||||||||||
|
|
|
|
|
|||||||||||||||||||
| Subtotal |
722.8 | 24 | ||||||||||||||||||||
|
|
|
|
|
|||||||||||||||||||
| Total Portfolio |
887.1 | 342 | ||||||||||||||||||||
|
|
|
|
|
|||||||||||||||||||
| (1) | Represents actual or anticipated COD, as applicable, unless otherwise indicated. |
| (2) | Nameplate capacity for solar projects represents the maximum generating capacity at standard test conditions of a facility multiplied by our percentage ownership of that facility (disregarding any equity interests held by any tax equity investor or lessor under any sale-leaseback financing or of any non-controlling interests in a partnership). Generating capacity may vary based on a variety of factors discussed elsewhere in this prospectus. |
5
Table of Contents
| (3) | Projects which were contributed by our Sponsor prior to our IPO, or “Contributed Projects,” are reflected in the Predecessor’s combined consolidated historical financial statements, and are identified with a “C” above. Projects which were acquired either contemporaneously with the completion of our IPO or in the period since our IPO are identified with an “A” above. Projects which have been sold to us by our Sponsor in the period since our IPO are identified with an “S” above. |
| (4) | For our distributed generation projects with one counterparty and for our utility-scale projects the counterparty credit rating reflects the counterparty’s or guarantor’s issuer credit ratings issued by Standard & Poor’s Ratings Services, or “S&P,” and Moody’s Investors Service Inc., or “Moody’s.” For distributed generation projects with more than one counterparty the counterparty credit rating represents a weighted average (based on nameplate capacity) credit rating of the project’s counterparties that are rated by S&P, Moody’s or both. The percentage of counterparties that are rated by S&P, Moody’s or both (based on nameplate capacity) of each of our distributed generation projects is as follows: |
| • | U.S. Projects 2014: 82% |
| • | Hudson Energy: 54% |
| • | Summit Solar Projects (U.S.): 21% |
| • | Summit Solar Projects (Canada): 100% |
| • | Enfinity: 85% |
| • | U.S. Projects 2009-2013: 35% |
| • | California Public Institutions: 100% |
| • | MA Operating: 100% |
| • | SunE Solar Fund X: 89% |
| • | LPT II Fund: 68% |
| (5) | Calculated as of September 30, 2014. For distributed generation projects, the number represents a weighted average (based on nameplate capacity) remaining duration. For Nellis, the number represents the remaining duration of the renewable energy credit, or “REC,” contract. |
| (6) | The REC contract for the Nellis project, which represents over 90% of the expected revenues, has remaining duration of approximately 13 years. The PPA of the Nellis project has an indefinite term subject to one-year reauthorizations. |
| (7) | The PPA counterparty has the right, under certain circumstances, to purchase up to 40% of the project equity from us pursuant to a predetermined purchase price formula. See “Business—Our Portfolio—Current Portfolio—Utility Projects—CAP.” |
The projects in our portfolio, as well as the Call Right Projects discussed below, were selected because they are located in the geographic locations we intend to initially target. All of the projects in our portfolio have, and all of the Call Right Projects have, or will have, long-term PPAs with creditworthy counterparties that we believe will provide sustainable and predictable cash flows to fund the regular quarterly cash dividends that we intend to continue to pay to holders of our Class A common stock. The Call Right Projects generally are not expected to reach COD until the first quarter of 2015 or later.
The Support Agreement has established an aggregate cash purchase price that, when taken together with applicable project-level debt, equals $846.5 million (subject to such adjustments as the parties may mutually agree) for the Call Right Projects set forth in the table below under the heading “Priced Call Right Projects.” This aggregate price was determined by good faith negotiations between us and our Sponsor.
6
Table of Contents
We will have the right to acquire additional Call Right Projects set forth in the table below under the heading “Unpriced Call Right Projects” at prices that will be determined in the future. The price for each Unpriced Call Right Project will be the fair market value of such project. The Support Agreement provides that we will work with our Sponsor to mutually agree on the fair market value, but if we are unable to, we and our Sponsor will engage a third-party advisor to determine the fair market value, after which we have the right (but not the obligation) to acquire such Call Right Project. Until the price for a Call Right Asset is mutually agreed to by us and our Sponsor, in the event our Sponsor receives a bona fide offer for a Call Right Project from a third party, we will have the right to match any price offered by such third party and acquire such Call Right Project on the terms our Sponsor could obtain from the third party. After the price for a Call Right Asset has been agreed upon and until the total aggregate Projected FTM CAFD commitment has been satisfied, our Sponsor may not market, offer or sell that Call Right Asset to any third party without our consent. The Support Agreement further provides that our Sponsor is required to offer us additional qualifying Call Right Projects from its pipeline on a quarterly basis until we have acquired projects under the Support Agreement that have the specified minimum amount of Projected FTM CAFD for each of the periods covered by the Support Agreement. We cannot assure you that we will be offered these Call Right Projects on terms that are favorable to us. See “Certain Relationships and Related Party Transactions—Project Support Agreement” for additional information.
The following table provides an overview of the Call Right Projects that are identified pursuant to the Support Agreement as of November 30, 2014:
| Project Names(1) |
Country | Estimated Acquisition Date(2) |
Nameplate Capacity (MW)(3) |
# of Sites | ||||||||
| Priced Call Right Projects |
||||||||||||
| Ontario 2015 projects |
Canada | Q1 2015 - Q4 2015 | 8.5 | 30 | ||||||||
| U.K. projects #1-11 |
U.K. | Q1 2015 - Q2 2015 | 150.8 | 11 | ||||||||
| Chile project #1(4) |
Chile | Q1 2015 | 41.7 | 1 | ||||||||
| U.S. DG 2H2014 & 2015 projects |
U.S. | Q4 2014 - Q4 2015 | 83.7 | 59 | ||||||||
| Chile project #2 |
Chile | Q1 2016 | 94.0 | 1 | ||||||||
|
|
|
|
|
|||||||||
| Total Priced Call Right Projects |
378.6 | 102 | ||||||||||
| Unpriced Call Right Projects |
||||||||||||
| U.S. DG 2H2014 & 2015 projects |
U.S. | Q4 2014 - Q4 2015 | 58.4 | 69 | ||||||||
| U.S. AP North Lake I |
U.S. | Q2 2015 | 24.1 | 1 | ||||||||
| U.S. Bluebird |
U.S. | Q2 2015 | 7.8 | 1 | ||||||||
| U.S. River Mountains Solar |
U.S. | Q4 2015 | 18.0 | 1 | ||||||||
| U.S. Kingfisher |
U.S. | Q4 2015 | 6.5 | 1 | ||||||||
| U.S. Commanche |
U.S. | Q2 2016 | 156.0 | 1 | ||||||||
| U.S. Island project #1 |
U.S. | Q2 2016 | 65.0 | 1 | ||||||||
| U.S. Southwest project #1 |
U.S. | Q3 2016 | 100.0 | 1 | ||||||||
| Tenaska Imperial Solar Energy Center West(5) |
U.S. | Q4 2016 | 72.5 | 1 | ||||||||
| U.S. Utah project #1 |
U.S. | Q3 2016 | 163.0 | 2 | ||||||||
| U.S. California project #1 |
U.S. | Q3 2016 | 54.2 | 1 | ||||||||
| U.S. California project #2 |
U.S. | Q4 2016 | 44.8 | 1 | ||||||||
| U.S. DG 2016 projects |
U.S. | Q1 2016 - Q4 2016 | 54.1 | 12 | ||||||||
| U.S. California projects #3-4 |
U.S. | 2016-2019 | 513.0 | 2 | ||||||||
|
|
|
|
|
|||||||||
| Total Unpriced Call Right Projects |
1,337.5 | 95 | ||||||||||
| Total 2015 Projects |
399.5 | 174 | ||||||||||
| Total 2016 Projects |
1,316.7 | 23 | ||||||||||
|
|
|
|
|
|||||||||
| Total Call Right Projects |
1,716.1 | 197 | ||||||||||
7
Table of Contents
| (1) | The overview above does not include the First Wind projects to which we will be granted call rights pursuant to the Intercompany Agreement if the First Wind Acquisition is consummated. See “—Acquisition Portfolios.” Our Sponsor may remove a project from the Call Right Project list effective upon notice to us if, in its reasonable discretion, a project is unlikely to be successfully completed. In that case, the Sponsor will be required to replace such project with one or more additional reasonably equivalent projects that have a similar economic profile. |
| (2) | Represents date of anticipated acquisition. |
| (3) | Nameplate capacity for solar projects represents the maximum generating capacity at standard test conditions of a facility multiplied by our expected percentage ownership of such facility (disregarding equity interests of any tax equity investor or lessor under any sale-leaseback financing or any non-controlling interests in a partnership). Generating capacity may vary based on a variety of factors discussed elsewhere in this prospectus. |
| (4) | Represents an expected 60% interest in a 69.5 MW project. |
| (5) | Our Sponsor acquired an indirect 19.8% interest in the Tenaska Imperial Solar Energy Center West project in July 2014 and has entered into an agreement to acquire an additional 19.8% interest in such project from Silver Ridge Power, LLC, or “Silver Ridge,” upon the project achieving COD. This acquisition is in addition to the acquisition of the Mt. Signal project from Silver Ridge. The 72.5 MW nameplate capacity included in the table above reflects a 39.6% interest in the 183.1 MW Tenaska Imperial Solar Energy Center West project. We expect the project to achieve COD in the second half of 2016. Our Sponsor’s acquisitions of the interest in the Tenaska Imperial Solar Energy Center West project are subject to certain regulatory approvals, including Federal Energy Regulatory Commission, or “FERC,” approval and third-party consents, as well as customary closing conditions. |
Acquisition Portfolios
The following table provides an overview of the projects that will become part of our portfolio upon consummation of the Capital Dynamics Acquisition, which we refer to as the CD DG Portfolio. We may not be able to complete the Capital Dynamics Acquisition on a timely basis or at all, and this offering is not conditioned upon the completion of the Capital Dynamics Acquisition. See “—Recent Developments—Capital Dynamics Acquisition.”
| Project Name |
Location | COD | Nameplate Capacity (MW)(1) |
# of Sites |
Offtake Agreements |
|||||||||||||||||||||
| Counterparty |
Counterparty Credit Rating(2) |
Remaining Duration of PPA (Years)(3) |
||||||||||||||||||||||||
| CD DG Portfolio |
U.S. | 2011-2014 | 77.6 | 39 | Various utilities and commercial and governmental entities |
A-, A3 | 19 | |||||||||||||||||||
| (1) | Nameplate capacity for solar projects represents the maximum generating capacity at standard test conditions of a facility multiplied by our percentage ownership of that facility (disregarding any equity interests held by any tax equity investor or lessor under any sale-leaseback financing or of any non-controlling interests in a partnership). Generating capacity may vary based on a variety of factors discussed elsewhere in this prospectus. |
| (2) | The counterparty credit rating represents a weighted average (based on nameplate capacity) credit rating of the project’s counterparties that are rated by S&P, Moody’s or both. The percentage of counterparties that are rated by S&P, Moody’s or both (based on nameplate capacity) of this distributed generation project is 99%. |
| (3) | Calculated as of September 30, 2014. For distributed generation projects, the number represents a weighted average (based on nameplate capacity) remaining duration. |
8
Table of Contents
The following table provides an overview of the projects that will become part of our portfolio upon consummation of the First Wind Acquisition. We may not be able to complete the First Wind Acquisition on a timely basis or at all, and this offering is not conditioned upon the completion of the First Wind Acquisition. See “—Recent Developments—First Wind Acquisition.”
| Offtake Agreements |
||||||||||||||||||||||||||||
| Project Names |
Location | COD(1) | Nameplate Capacity (MW)(2) |
# of Sites |
Project Origin(3) |
Counterparty |
Counterparty Credit Rating |
Remaining Duration of PPA (Years)(4) |
||||||||||||||||||||
| Wind: |
||||||||||||||||||||||||||||
| Cohocton |
U.S. | 2009 | 125.0 | 1 | A | Citigroup Energy | A-, Baa2 | 6 | ||||||||||||||||||||
| Rollins |
U.S. | 2011 | 60.0 | 1 | A | Central Maine Power; Bangor Hydro Electric | BBB+, A3; NR, NR |
17, 17 | ||||||||||||||||||||
| Stetson I |
U.S. | 2009 | 57.0 | 1 | A | Exelon Generation Company | BBB, Baa2 | 5 | ||||||||||||||||||||
| Mars Hill |
U.S. | 2007 | 42.0 | 1 | A | New Brunswick Power(5) | A+, Aa2 | <1 | ||||||||||||||||||||
| Sheffield |
U.S. | 2011 | 40.0 | 1 | A | City of Burlington; Vermont Electric Cooperative; Washington Electric Cooperative | NR, NR; NR, NR; NR, NR |
7, 17, 17 | ||||||||||||||||||||
| Bull Hill |
U.S. | 2012 | 34.5 | 1 | A | NSTAR | A-, Baa1 | 13 | ||||||||||||||||||||
| Kaheawa Wind Power I |
U.S. | 2006 | 30.0 | 1 | A | Maui Electric Company | BBB-, NR | 12 | ||||||||||||||||||||
| Kahuku |
U.S. | 2011 | 30.0 | 1 | A | Hawaiian Electric Company | BBB-, Baa1 | 16 | ||||||||||||||||||||
| Stetson II |
U.S. | 2010 | 25.5 | 1 | A | Exelon Generation Company; Harvard University | BBB, Baa2; NR, NR |
5, 11 | ||||||||||||||||||||
| Kaheawa Wind Power II |
U.S. | 2012 | 21.0 | 1 | A | Maui Electric Company | BBB-, NR | 18 | ||||||||||||||||||||
| Steel Winds I |
U.S. | 2007 | 20.0 | 1 | A | Morgan Stanley Capital Group | A-, Baa2 | 5 | ||||||||||||||||||||
| Steel Winds II |
U.S. | 2012 | 15.0 | 1 | A | Morgan Stanley Capital Group | A-, Baa2 | 5 | ||||||||||||||||||||
|
|
|
|
|
|||||||||||||||||||||||||
| Subtotal |
500.0 | 12 | ||||||||||||||||||||||||||
| Solar: |
||||||||||||||||||||||||||||
| MA Solar |
U.S. | 2014 | 21.1 | 4 | A | Various municipalities and universities | A+, A1(6) | 24 | ||||||||||||||||||||
|
|
|
|
|
|||||||||||||||||||||||||
| Subtotal |
21.1 | 4 | ||||||||||||||||||||||||||
|
|
|
|
|
|||||||||||||||||||||||||
| Total First Wind Portfolio |
521.1 | 16 | ||||||||||||||||||||||||||
|
|
|
|
|
|||||||||||||||||||||||||
| (1) | Represents actual or anticipated COD, as applicable, unless otherwise indicated. |
| (2) | Nameplate capacity for solar projects represents the maximum generating capacity at standard test conditions of a facility multiplied by our percentage ownership of that facility (disregarding any equity interests held by any tax equity investor or lessor under any sale-leaseback financing or any noncontrolling interests in a partnership). Nameplate capacity for wind facilities represents the manufacturer’s maximum nameplate generating capacity of each turbine multiplied by the number of turbines at a facility multiplied by our anticipated percentage ownership of that facility (disregarding any equity interests held by any tax equity investor or lessor under any sale-leaseback financing or of any non-controlling interests in a partnership). Generating capacity may vary based on a variety of factors discussed elsewhere in this prospectus. |
| (3) | Projects which will be acquired in connection with the First Wind Acquisition are identified with an “A” above. |
| (4) | Calculated as of September 30, 2014. For distributed generation projects, the number represents a weighted average (based on nameplate capacity) of remaining duration. |
| (5) | First Wind is currently in the process of negotiating an extension to the PPA with New Brunswick Power. |
| (6) | The counterparty credit rating represents a weighted average (based on nameplate capacity) credit rating of the project’s counterparties that are rated by S&P, Moody’s or both. The percentage of counterparties that are rated by S&P, Moody’s or both (based on nameplate capacity) of the MA Solar project is 39%. |
9
Table of Contents
The following table provides an overview as of November 30, 2014 of the projects in the First Wind pipeline to which we expect to be granted additional call rights pursuant to the Intercompany Agreement:
| Project Names |
Country | Estimated Acquisition Date(1) |
Nameplate Capacity (MW)(2) |
# of Sites |
||||||||||||
| Solar Projects |
||||||||||||||||
| Mililani Solar I |
U.S. | Q4 2015 | 26.0 | 1 | ||||||||||||
| Seven Sisters |
U.S. | Q4 2015 | 22.6 | 7 | ||||||||||||
| Kawailoa Solar |
U.S. | Q4 2016 | 65.0 | 1 | ||||||||||||
| Waiawa |
U.S. | Q4 2016 | 61.1 | 1 | ||||||||||||
| Mililani Solar II |
U.S. | Q4 2016 | 19.5 | 1 | ||||||||||||
| Four Brothers |
U.S. | Q4 2016 | 400.0 | 4 | ||||||||||||
|
|
|
|
|
|||||||||||||
| Total Intercompany Solar Projects |
594.2 | 15 | ||||||||||||||
| Wind Projects |
||||||||||||||||
| South Plains |
U.S. | Q4 2015 | 200.0 | 1 | ||||||||||||
| Oakfield |
U.S. | Q4 2015 | 147.6 | 1 | ||||||||||||
| South Plains II |
U.S. | Q4 2015 | 150.0 | 1 | ||||||||||||
| Bingham |
U.S. | Q4 2016 | 184.8 | 1 | ||||||||||||
| Hancock |
U.S. | Q4 2016 | 51.0 | 1 | ||||||||||||
| Weaver |
U.S. | 2017 | 73.6 | 1 | ||||||||||||
| Rattlesnake |
U.S. | 2017 | 62.0 | 1 | ||||||||||||
| Route 66 II |
U.S. | 2017 | 100.0 | 1 | ||||||||||||
| Bowers |
U.S. | 2017 | 48.0 | 1 | ||||||||||||
|
|
|
|
|
|||||||||||||
| Total Intercompany Wind Projects |
1,017.0 | 9 | ||||||||||||||
| Total 2015 Projects |
546.2 | 11 | ||||||||||||||
| Total 2016 Projects |
781.4 | 9 | ||||||||||||||
| Total 2017 Projects |
283.6 | 4 | ||||||||||||||
|
|
|
|
|
|||||||||||||
| Total Intercompany Projects |
1,611.2 | 24 | ||||||||||||||
The following table shows the total projects to which we expect to have call rights under both the Intercompany Agreement and the Support Agreement, if the First Wind Acquisition is consummated:
| Nameplate Capacity (MW)(2) |
# of Sites |
|||||||||||
| Total 2015 Projects |
945.7 | 185 | ||||||||||
| Total 2016 Projects |
2,098.0 | 32 | ||||||||||
| Total 2017 Projects |
283.6 | 4 | ||||||||||
|
|
|
|
|
|||||||||
| Total |
3,327.3 | 221 | ||||||||||
| (1) | Represents date of anticipated acquisition. The acquisition date is subject to change, including to preserve the project’s eligibility for federal governmental incentives including Investment Tax Credits or Production Tax Credits. |
| (2) | Nameplate capacity for solar projects represents the maximum generating capacity at standard test conditions of a facility multiplied by our percentage ownership of that facility (disregarding any equity interests held by any tax equity investor or lessor under any sale-leaseback financing or any non-controlling interests in a partnership). Nameplate capacity for wind facilities represents the manufacturer’s maximum nameplate generating capacity of each turbine multiplied by the number |
10
Table of Contents
| of turbines at a facility multiplied by our anticipated percentage ownership of that facility (disregarding any equity interests held by any tax equity investor or lessor under any sale-leaseback financing or any noncontrolling interests in a partnership). Generating capacity may vary based on a variety of factors discussed elsewhere in this prospectus. |
Our Business Strategy
Our primary business strategy is to increase the cash dividends we pay to the holders of our Class A common stock over time. Our plan for executing this strategy includes the following:
Focus on long-term contracted clean power generation assets. Our portfolio has, and we expect any projects that we acquire from our Sponsor or others will have, long-term PPAs with creditworthy counterparties. We intend to focus on owning and operating long-term contracted clean power generation assets with proven technologies, low operating risks and stable cash flows consistent with our portfolio. We believe industry trends will support significant growth opportunities for long-term contracted power in the clean power generation segment as various markets around the world reach grid parity.
Grow our business through acquisitions of contracted operating assets. We intend to acquire additional contracted clean power generation assets from our Sponsor and unaffiliated third parties to increase our cash available for distribution. The Support Agreement provides us with (i) the option to acquire the identified Call Right Projects, which currently represent an aggregate nameplate capacity of approximately 1.7 GW, and additional projects from our Sponsor’s development pipeline that will be designated as Call Right Projects under the Support Agreement to satisfy the aggregate Projected FTM CAFD commitment of $175.0 million and (ii) a right of first offer on the ROFO Projects. If the First Wind Acquisition is consummated, we will also be granted call rights with respect to projects in the First Wind pipeline expected to represent an additional 1.6 GW of wind and solar generation assets from 2015 to 2017. In addition, we expect to have significant opportunities to acquire other clean power generation assets from third-party developers, independent power producers and financial investors. We believe our knowledge of the market, third-party relationships, operating expertise and access to capital will provide us with a competitive advantage in acquiring new assets.
Attractive asset classes. Our current focus is on the solar and wind energy segments because we believe they are currently the fastest growing segments of the clean power generation industry and offer attractive opportunities to own assets and deploy long-term capital due to the predictability of their cash flows. In particular, we believe the solar and wind segments are attractive because there is no associated fuel cost risk and the relevant technologies have become highly reliable. We also believe the declining levelized costs of energy for solar and wind projects will enable these asset classes to continue to add additional MW of completed projects to our portfolio and enable us to gain market share. Solar and wind projects also have an expected life which can exceed 30 years. In addition, the solar and wind energy generation projects in or to be added to our portfolio generally operate under long-term PPAs with terms of up to 30 years.
Focus on core markets with favorable investment attributes. We intend to focus on growing our portfolio through investments in markets with (i) creditworthy PPA counterparties, (ii) high clean energy demand growth rates, (iii) low political risk, stable market structures and well-established legal systems, (iv) grid parity or the potential to reach grid parity in the near term and (v) favorable government policies to encourage renewable energy projects. We believe there will be ample opportunities to acquire high-quality contracted power generation assets in markets with these attributes. While our current focus is on solar and wind generation assets in the United States, Canada, the United Kingdom and Chile, we will selectively consider acquisitions of contracted clean generation sources in other countries.
11
Table of Contents
Maintain sound financial practices. We intend to maintain our commitment to disciplined financial analysis and a balanced capital structure. Our financial practices include (i) a risk and credit policy focused on transacting with creditworthy counterparties, (ii) a financing policy focused on achieving an optimal capital structure through various capital formation alternatives to minimize interest rate and refinancing risks, and (iii) a dividend policy that is based on distributing the cash available for distribution generated by our project portfolio (after deducting appropriate reserves for our working capital needs and the prudent conduct of our business). Our initial dividend was established based on our targeted payout ratio of approximately 85% of projected cash available for distribution. See “Cash Dividend Policy.”
Our Competitive Strengths
We believe our key competitive strengths include:
Scale and diversity. Our portfolio provides us with significant diversification in terms of market segment, counterparty and geography. Our operating projects, in the aggregate, represent 887.1 MW of nameplate capacity, which consist of 722.8 MW of nameplate capacity from utility projects and 164.3 MW of nameplate capacity of commercial, industrial, government and residential customers. If the Capital Dynamics Acquisition and the First Wind Acquisition are consummated, our portfolio will include both solar and wind projects and will increase to an aggregate of 1,485.8 MW of nameplate capacity, consisting of 1,222.8 MW of nameplate capacity from utility projects and 263.0 MW of nameplate capacity of commercial, industrial, government and residential customers. Of the projects in our portfolio, no single project accounts for more than 20% of our total MW nameplate capacity assuming the Capital Dynamics Acquisition and First Wind Acquisition are consummated. Our diversification reduces our operating risk profile and our reliance on any single market or segment. We believe our scale and geographic diversity improve our business development opportunities through enhanced industry relationships, reputation and understanding of regional power market dynamics. Over time, as we acquire additional projects from our Sponsor and third parties, we expect to become further diversified.
Stable, high-quality cash flows. Our portfolio of projects, together with the Call Right Projects, the projects to which we expect to have call rights under the Intercompany Agreement and third-party projects that we acquire, provide us with a stable, predictable cash flow profile. We sell the electricity generated by our projects under long-term PPAs with creditworthy counterparties. The weighted average (based on MW) remaining life of our PPAs would be approximately 16 years, as of September 30, 2014, if the Capital Dynamics Acquisition and the First Wind Acquisition are consummated. The weighted average credit rating (based on nameplate capacity) of the counterparties to the PPAs for the projects in our portfolio would be A-/A3, which includes only those counterparties that are rated by S&P, Moody’s or both (representing approximately 90% of the total MW of our portfolio) if the Capital Dynamics Acquisition and the First Wind Acquisition are consummated. Based on our portfolio of projects, we do not expect to pay significant federal income taxes for at least the next several years.
Newly constructed solar portfolio. We benefit from a portfolio of relatively newly constructed solar assets, with most of the projects in our portfolio having achieved COD within the past three years. The projects in our portfolio and the Call Right Projects utilize proven and reliable technologies provided by leading equipment manufacturers and, as a result, we expect to achieve high generation availability and predictable maintenance capital expenditures.
12
Table of Contents
Relationship with SunEdison. We believe our relationship with our Sponsor provides us with significant benefits, including the following:
| • | Strong asset development and acquisition track record. Over the last five calendar years, our Sponsor has constructed or acquired solar power generation assets with an aggregate nameplate capacity of 1.4 GW and, as of September 30, 2014, was constructing additional solar power generation assets expected to have an aggregate nameplate capacity of approximately 610 MW. Our Sponsor has been one of the top five developers and installers of solar energy facilities in the world in each of the past four years based on megawatts installed. In addition, our Sponsor had a 4.5 GW pipeline of development stage solar projects as of September 30, 2014. Our Sponsor’s operating history demonstrates its organic project development capabilities and its ability to work with third-party developers and asset owners in our target markets. We believe our Sponsor’s relationships, knowledge and employees will facilitate our ability to acquire operating projects from our Sponsor and unaffiliated third parties in our target markets. |
| • | Project financing experience. We believe our Sponsor has demonstrated a successful track record of sourcing long duration capital to fund project acquisitions, development and construction. Since 2005, our Sponsor has raised approximately $5 billion in long-term, non-recourse project and tax equity financing for hundreds of projects. We expect that we will realize significant benefits from our Sponsor’s financing and structuring expertise as well as its relationships with financial institutions and other providers of capital. |
| • | Management and operations expertise. We will have access to the significant resources of our Sponsor to support the growth strategy of our business. As of September 30, 2014, our Sponsor had over 3.0 GW of projects under management across 20 countries. In addition, our Sponsor maintains four renewable energy operation centers to service assets under management. Our Sponsor’s operational and management experience helps ensure that our facilities will be monitored and maintained to maximize their cash generation. If the First Wind Acquisition is consummated, we will also benefit from First Wind’s operational and management expertise as the First Wind team joins our Sponsor. To date, First Wind has constructed or acquired wind power generation assets with an aggregate nameplate capacity of 1.0 GW and, as of November 30, 2014, was constructing additional wind power generation assets expected to have an aggregate nameplate capacity of approximately 500 MW. |
Dedicated management team. Under the Management Services Agreement, our Sponsor has provided us with a dedicated team of professionals to serve as our executive officers and other key officers. Our officers have considerable experience in developing, acquiring and operating clean power generation assets, with an average of over nine years of experience in the sector. For example, our President and Chief Executive Officer served as the President of SunEdison’s solar energy business from November 2009 to March 2013. Our management team also has access to the other significant management resources of our Sponsor to support the operational, financial, legal and regulatory aspects of our business.
Recent Developments
Acquisition Transactions
Hudson Energy Acquisition
On September 18, 2014, we entered into an agreement whereby we agreed to acquire from Hudson Energy Solar Corporation 25.5 MW of operating solar power assets (the “Hudson Energy Acquisition”) and SunEdison purchased 4.5 MW of developmental pipeline. In connection with the
13
Table of Contents
Hudson Energy Acquisition, we also entered into a right-of-first-offer agreement with Just Energy Group to acquire certain new operating solar power assets located in New Jersey, New York, Massachusetts and Pennsylvania. The total consideration for the Hudson Energy Acquisition was approximately $35 million and was funded with cash-on-hand. The Hudson Energy Acquisition closed on November 4, 2014.
Crundale and Fairwinds Acquisitions
On November 4, 2014, we completed the acquisition of two Call Right Projects, Fairwinds and Crundale, from our Sponsor. The two utility scale power projects, with a total nameplate capacity of 50.0 MW, are located in the United Kingdom and reached COD in October 2014. The purchase price was approximately $32.2 million in cash, and in addition we assumed approximately $63.7 million of project-level debt of the project companies. We expect to repay all of the outstanding project-level debt in the second quarter of 2015.
Capital Dynamics Acquisition
On October 29, 2014, we entered into a securities purchase agreement whereby we agreed to acquire 77.6 MW of operating solar power assets located in California, Massachusetts, New Jersey, New York and Pennsylvania (the “Capital Dynamics Acquisition”) from Capital Dynamics U.S. Solar Energy Fund, L.P. and its affiliates. The purchase price for the Capital Dynamics Acquisition is expected to be approximately $250 million and will be funded through borrowings under our increased Term Loan (as defined herein). See “Description of Certain Indebtedness.”
The Capital Dynamics Acquisition is subject to customary closing conditions. We expect the Capital Dynamics Acquisition to close during the fourth quarter of 2014, but we may not be able to complete the Capital Dynamics Acquisition on a timely basis or at all. This offering is not conditioned upon the completion of the Capital Dynamics Acquisition.
First Wind Acquisition
On November 17, 2014, we entered into a purchase and sale agreement (the “First Wind Acquisition Agreement”), pursuant to which we agreed to acquire from First Wind Holdings, LLC (together with its subsidiaries, “First Wind”) 521.1 MW of operating power assets, including 500.0 MW of wind power assets and 21.1 MW of solar power assets (the “First Wind Acquisition”) located in Maine, New York, Hawaii, Vermont and Massachusetts. We will acquire the First Wind Assets for total consideration of $862.0 million, which includes the equity purchase price, the refinancing of certain existing indebtedness, certain swap and debt breakage fees and the purchase of a partner’s ownership stake in certain assets held by First Wind through a joint venture. In addition, pursuant to the First Wind Acquisition Agreement, SunEdison will purchase First Wind’s development platform, pipeline and projects in development, including over 1.6 GW of wind and solar generation assets to which we will be granted call rights pursuant to the Intercompany Agreement, as described below.
In addition to entering into the First Wind Acquisition Agreement, we and SunEdison entered into an Intercompany Agreement. The Intercompany Agreement sets forth the agreement among the parties with respect to, among other things, (i) contributions between, and allocations among, the parties and their respective affiliates of certain costs, expenses, indemnity payments and purchase price adjustments under the First Wind Acquisition Agreement and certain excess capital expenditures and operation and maintenance costs for operating projects following the closing of the First Wind Acquisition, (ii) the grant by SunEdison to us of certain additional call rights, and (iii) the modification of certain terms of the Interest Payment Agreement (as defined herein).
14
Table of Contents
In connection with the First Wind Acquisition, SunEdison also intends to arrange up to $1.5 billion in debt and equity financing to fund the construction of projects with respect to which we will have call rights, including certain development projects to be acquired from First Wind.
The First Wind Acquisition is subject to customary closing conditions, including the receipt of regulatory approval by the Federal Energy Regulatory Commission and other public utility commissions and the Federal Trade Commission under the Hart-Scott-Rodino Act. We expect the First Wind Acquisition to close during the first quarter of 2015.
We may not be able to complete the First Wind Acquisition on a timely basis or at all. This offering is not conditioned upon the completion of the First Wind Acquisition, and, to the extent the First Wind Acquisition is not completed, we will use the net proceeds from this offering for general corporate purposes and to fund other acquisition opportunities that may become available to us. See “Risk Factors—Risks Related to the First Wind Acquisition.”
Acquisition Private Placement
On November 26, 2014, we completed the sale of a total of 11,666,667 shares of our Class A common stock in a private placement (the “Acquisition Private Placement”) to certain eligible investors (the “Acquisition Private Placement Purchasers”) for an aggregate purchase price of $350.0 million. We intend to use the net proceeds from the Acquisition Private Placement to fund a portion of the consideration payable by us in the First Wind Acquisition.
In connection with the Acquisition Private Placement, we entered into a registration rights agreement with the Acquisition Private Placement Purchasers, pursuant to which we have filed a registration statement with the SEC covering the resale of the purchased shares.
Acquisition Financing
We intend to fund the consideration payable by us in the First Wind Acquisition through a combination of the net proceeds from this offering, the net proceeds from the issuance of newly issued senior unsecured notes and cash on hand (including cash from the Acquisition Private Placement).
The consolidated combined pro forma financial information included in this prospectus reflects an assumed issuance of $800.0 million of senior notes and the use of the net proceeds therefrom to pay a portion of the purchase price payable by us in the First Wind Acquisition and to repay certain existing debt. To the extent we obtain financing in excess of the amount needed to fund the First Wind Acquisition, we will use the excess proceeds from this offering for working capital and general corporate purposes. We may not be able to obtain any such debt financing on acceptable terms or at all.
Relationship with our Sponsor
We believe our relationship with our Sponsor provides us with the opportunity to benefit from our Sponsor’s expertise in solar technology, project development, finance, management and operation. Our Sponsor is a solar industry leader based on its history of innovation in developing, financing and operating solar energy projects and its strong market share relative to other U.S. and global installers and integrators. As of September 30, 2014, our Sponsor had a development pipeline of approximately 4.5 GW and solar power generation assets under management of approximately 3.0 GW, comprised of approximately 1,200 solar generation facilities across 20 countries. These projects were managed by a
15
Table of Contents
dedicated team using four renewable energy operation centers globally. As of September 30, 2014, our Sponsor had approximately 2,400 employees. Our Sponsor owns 100.0% of Terra LLC’s outstanding Class B units and holds all of the IDRs (as defined herein).
If the First Wind Acquisition is consummated, our Sponsor will become a wind industry leader, with a development pipeline of approximately 1.0 GW of wind generation assets and approximately 1.0 GW of wind generation assets under management, and we will benefit from our Sponsor’s expertise in wind technology.
On September 29, 2014, our Sponsor announced that it confidentially submitted a draft registration statement to the SEC relating to the proposed initial public offering of the common stock of a yieldco vehicle focused on contracted clean power generation assets in emerging markets, primarily in Asia (excluding Japan) and Africa. If this initial public offering is completed, our Sponsor would have obligations to present opportunities in these or other emerging markets to the other yieldco vehicle, or may otherwise determine that certain opportunities are more appropriate for the other yieldco vehicle than they are for us. Because our primary target markets do not include the expected primary target markets of the other yieldco vehicle, we do not expect any significant competition for project opportunities with the other yieldco vehicle. Our Sponsor’s development pipeline of approximately 4.5 GW as of September 30, 2014 represents its total development pipeline, including projects under development in emerging markets that would be offered to the other yieldco vehicle.
While our relationship with our Sponsor and its subsidiaries is a significant strength, it is also a source of potential conflicts. As a result of their employment by, and economic interest in, our Sponsor, our officers may be conflicted when advising our board of directors or Corporate Governance and Conflicts Committee or otherwise participating in the negotiation or approval of such transactions.
Notwithstanding the significance of the services to be rendered by our Sponsor or its designated affiliates on our behalf or of the assets which we may elect to acquire from our Sponsor, our Sponsor will not owe fiduciary duties to us or our stockholders and will have significant discretion in allocating acquisition opportunities (except with respect to the Call Right Projects and ROFO Projects) to us or to itself or third parties and will not be prohibited from acquiring operating assets of the kind that we seek to acquire.
For a discussion of certain agreements we have with our Sponsor, see “Certain Relationships and Related Party Transactions.” For a discussion of the risks related to our relationship with our Sponsor, see “Risk Factors—Risks Related to our Relationship with our Sponsor.”
16
Table of Contents
Organizational Structure
The following diagram depicts certain relevant aspects of our ownership structure and principal indebtedness, as of December 5, 2014, after giving effect to this offering:
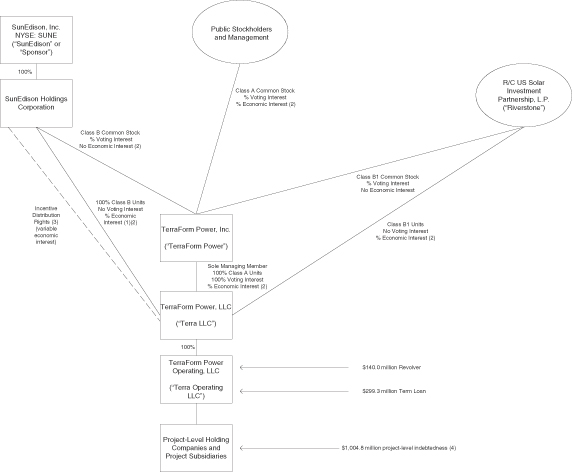
| (1) | Our Sponsor’s economic interest is subject to certain limitations on distributions to holders of Class B units during the Subordination Period (as defined herein) and the Distribution Forbearance Period (as defined herein). See “Certain Relationships and Related Party Transactions—Amended and Restated Operating Agreement of Terra LLC— Distributions.” In the future, our Sponsor may receive Class B1 units and Class B1 common stock in connection with a reset of the IDR target distribution levels or sales of projects to Terra LLC. |
| (2) | The economic interest of holders of Class A units, Class B units and Class B1 units, and, in turn, holders of shares of Class A common stock, is subject to the right of holders of the IDRs to receive a portion of distributions after certain distribution thresholds are met. See “Certain Relationships and Related Party Transactions—Amended and Restated Operating Agreement of Terra LLC—Distributions.” |
| (3) | Incentive distribution rights, or “IDRs,” represent a variable interest in distributions by Terra LLC and therefore cannot be expressed as a fixed percentage interest. All of our IDRs are currently issued to SunEdison Holdings Corporation, which is a wholly owned subsidiary of our Sponsor. In |
17
Table of Contents
| connection with a reset of the target distribution levels, holders of IDRs will be entitled to receive newly-issued Class B1 units of Terra LLC and shares of our Class B1 common stock. Please read “Certain Relationships and Related Party Transactions—Amended and Restated Operating Agreement of Terra LLC—Distributions” for further description of the IDRs and “Description of Capital Stock—Class B1 Common Stock” for further description of the Class B1 common stock. |
| (4) | For additional information regarding our project-level indebtedness, see “Description of Certain Indebtedness—Project-Level Financing Arrangements.” |
Our Initial Public Offering and Related Transactions
On July 23, 2014, we closed our initial public offering, or “IPO,” of 20,065,000 shares of our Class A common stock at a price to the public of $25.00 per share, or the “IPO Price.” In addition, the underwriters exercised in full their option to purchase an additional 3,009,750 shares of Class A common stock at the IPO price. Concurrently with our IPO, we sold an aggregate of 2,600,000 shares of our Class A common stock at the IPO Price to Altai Capital Master Fund, Ltd., or “ACMF” and Everstream Opportunities Fund I, LLC, or “Everstream Opportunities” (the “IPO Private Placements”). In addition, on July 23, 2014, as consideration for the acquisition of the Mt. Signal project from Silver Ridge at an aggregate purchase price of $292.0 million, Terra LLC issued to Silver Ridge 5,840,000 Class B units (and we issued a corresponding number of shares of Class B common stock) and 5,840,000 Class B1 units (and we issued a corresponding number of shares of Class B1 common stock). Silver Ridge distributed the Class B shares and units to SunEdison and the Class B1 shares and units to R/C US Solar Investment Partnership, L.P., or “Riverstone”, the owners of Silver Ridge.
We received $533.5 million of net proceeds from our IPO (including the net proceeds from the underwriters exercise in full of their option to purchase additional shares of Class A common stock in our IPO), after deducting underwriting discounts, commissions and offering expenses. We also received $65.0 million of net proceeds from the IPO Private Placements.
Certain Risk Factors
We are subject to a number of risks, including risks that may prevent us from achieving our business objectives or may materially and adversely affect our business, financial condition, results of operations, cash flows and prospects. You should carefully consider these risks, including the risks discussed in the section entitled “Risk Factors,” before investing in our Class A common stock.
Risks related to the First Wind Acquisition include, among others:
| • | completion of the First Wind Acquisition is subject to conditions and if these conditions are not satisfied or waived, the First Wind Acquisition will not be completed; |
| • | integrating the assets we intend to acquire in the First Wind Acquisition may be more difficult, costly or time consuming than expected and the anticipated benefits of the First Wind Acquisition may not be realized; and |
| • | in connection with the First Wind Acquisition, we expect to incur significant additional indebtedness and may also assume certain of First Wind’s outstanding indebtedness, which could adversely affect us, including by decreasing our business flexibility, and will increase our interest expense. |
Risks related to our business include, among others:
| • | counterparties to our PPAs may not fulfill their obligations, which could result in a material adverse impact on our business, financial condition, results of operations and cash flows; |
18
Table of Contents
| • | a portion of the revenues under the PPAs for the U.K. projects in our portfolio are subject to price adjustments after a period of time; if the market price of electricity decreases and we are otherwise unable to negotiate more favorable pricing terms, our business, financial condition, results of operations and cash flows may be materially and adversely affected; |
| • | certain of the PPAs for power generation projects in our portfolio and that we may acquire in the future contain or will contain provisions that allow the offtake purchaser to terminate or buyout a portion of the project upon the occurrence of certain events; if such provisions are exercised and we are unable to enter into a PPA on similar terms, in the case of PPA termination, or find suitable replacement projects to invest in, in the case of a buyout, our cash available for distribution could materially decline; and |
| • | the growth of our business depends on locating and acquiring interests in additional, attractive clean energy projects from our Sponsor and unaffiliated third parties at favorable prices. |
Risks related to our relationship with our Sponsor include, among others:
| • | our Sponsor is our controlling stockholder and exercises substantial influence over TerraForm Power, and we are highly dependent on our Sponsor; |
| • | we may not be able to consummate future acquisitions from our Sponsor; |
| • | our organizational and ownership structure may create significant conflicts of interest that may be resolved in a manner that is not in our best interests or the best interests of holders of our Class A common stock and that may have a material adverse effect on our business, financial condition, results of operations and cash flows; |
| • | the holder or holders of our IDRs may elect to cause Terra LLC to issue Class B1 units in connection with a resetting of target distribution levels which could result in lower distributions to holders of our Class A common stock; and |
| • | as a result of our Sponsor holding all of our Class B common stock (each share of which entitles our Sponsor to 10 votes on matters presented to our stockholders generally), our Sponsor controls a majority of the vote on all matters submitted to a vote of our stockholders for the foreseeable future. |
Risks related to an investment in the Class A common stock offered in this offering include, among others:
| • | we may not be able to continue paying comparable or growing cash dividends to holders of our Class A common stock in the future; |
| • | we are a holding company and our only material asset is our interest in Terra LLC, and we are accordingly dependent upon distributions from Terra LLC and its subsidiaries to pay dividends and taxes and other expenses; and |
| • | we are an “emerging growth company” and have elected, and may elect in future SEC filings, to comply with reduced public company reporting requirements, which could make our Class A common stock less attractive to investors. |
Corporate Information
Our principal executive offices are located at 12500 Baltimore Avenue, Beltsville, Maryland 20705. Our telephone number is (443) 909-7200. Our internet site is www.terraform.com. Information contained on our internet site is not incorporated by reference into the prospectus and does not constitute part of this prospectus.
19
Table of Contents
JOBS Act
As a company with less than $1.0 billion in revenue during our last fiscal year, we currently qualify as an “emerging growth company,” as defined in the Jumpstart Our Business Startups Act, or the “JOBS Act.” Section 107 of the JOBS Act provides that an emerging growth company can take advantage of the extended transition period provided in Section 7(a)(2)(B) of the Securities Act for complying with new or revised accounting standards. Thus, an emerging growth company can delay the adoption of certain accounting standards until those standards would otherwise apply to private companies.
An emerging growth company may also take advantage of reduced reporting requirements that are otherwise applicable to public companies. These provisions include, but are not limited to:
| • | not being required to comply with the auditor attestation requirements of Section 404 of the Sarbanes-Oxley Act of 2002, as amended, or the “Sarbanes-Oxley Act;” |
| • | reduced disclosure obligations regarding executive compensation in our periodic reports, proxy statements and registration statements; and |
| • | exemptions from the requirements of holding a nonbinding advisory vote on executive compensation and stockholder approval of any golden parachute payments not previously approved. |
We may take advantage of these provisions until the last day of our fiscal year following the fifth anniversary of the date of the first sale of our common equity securities pursuant to an effective registration statement under the Securities Act, which such fifth anniversary will occur in 2019. However, if certain events occur prior to the end of such five-year period, including if we become a “large accelerated filer,” our annual gross revenues exceed $1.0 billion or we issue more than $1.0 billion of non-convertible debt in any three-year period, we will cease to be an emerging growth company prior to the end of such five-year period.
We have elected to take advantage of certain of the reduced disclosure obligations regarding financial statements and executive compensation in this prospectus and may elect to take advantage of other reduced burdens in future filings. As a result, the information that we provide to our stockholders may be different than you might receive from other public reporting companies in which you hold equity interests.
In addition, Section 107(b) of the JOBS Act also provides that an emerging growth company can take advantage of the extended transition period provided in Section 7(a)(2)(B) of the Securities Act for complying with new or revised accounting standards. In other words, an emerging growth company can delay the adoption of certain accounting standards until those standards would otherwise apply to private companies. We are choosing to “opt in” to such extended transition period election under Section 107(b). Therefore we are electing to delay adoption of new or revised accounting standards, and as a result, we may choose to not comply with new or revised accounting standards on the relevant dates on which adoption of such standards is required for non-emerging growth companies. As a result of such election, our financial statements may not be comparable to the financial statements of other public companies.
20
Table of Contents
THE OFFERING
| Shares of Class A common stock offered by us |
shares of our Class A common stock. |
| Option to purchase additional shares of our Class A common stock |
We have granted the underwriters an option to purchase up to an additional shares of our Class A common stock, at the price to the public, less the underwriting discounts and commissions, within 30 days of the date of this prospectus. |
| Shares of Class A common stock outstanding after this offering |
shares of our Class A common stock (or shares, if the underwriters exercise in full their option to purchase additional shares of Class A common stock). |
| Shares of Class B common stock outstanding after this offering |
64,526,654 shares of our Class B common stock, all of which will be beneficially owned by our Sponsor. |
| Class A units and Class B units of Terra LLC outstanding after this offering |
Class A units (or Class A units if the underwriters exercise in full their option to purchase additional shares of Class A common stock) and 64,526,654 Class B units of Terra LLC. |
| Shares of Class B1 common stock and Class B1 units outstanding after this offering |
5,840,000 shares of our Class B1 common stock and 5,840,000 Class B1 units of Terra LLC. |
| Use of proceeds |
Assuming no exercise of the underwriters’ option to purchase additional shares of Class A common stock, we expect to receive approximately $ of net proceeds from the sale of the Class A common stock offered hereby, after deducting underwriting discounts and commissions but before offering expenses. If the underwriters exercise in full their option to purchase additional shares of Class A common stock, we estimate that additional net proceeds will be approximately $ , after deducting underwriting discounts and commissions. |
21
Table of Contents
| The following table illustrates the sources and uses of funds assuming the consummation of the Acquisition Financing Transactions and Acquisition Transactions, see “Unaudited Pro Forma Consolidated Financial Statements”: |
| Sources of Funds |
Uses of Funds | |||||
| Class A Common Stock Offered Hereby |
Total Consideration of First Wind Acquisition |
|||||
| Acquisition Private Placement |
Refinance Term Loan |
|||||
| Senior Notes |
Fees and Expenses |
|||||
| General Corporate Purposes |
||||||
|
|
| |||||
| Total Sources |
Total Uses |
|||||
|
|
| |||||
| We may not be able to complete the First Wind Acquisition on a timely basis or at all. This offering is not conditioned upon the completion of the First Wind Acquisition, and, to the extent the First Wind Acquisition is not completed, we will use the net proceeds from this offering for general corporate purposes, including to fund other acquisition opportunities that may become available to us. See “Recent Developments—Acquisition Transactions,” and “Risk Factors—Risks Related to the Acquisition Transactions.” |
| Voting rights and stock lock up |
Each share of our Class A common stock and Class B1 common stock entitles its holder to one vote on all matters to be voted on by stockholders generally. |
| All of our Class B common stock is held by our Sponsor or its controlled affiliates. Each share of our Class B common stock entitles our Sponsor to 10 votes on matters presented to our stockholders generally. Our Sponsor, as the holder of our Class B common stock, retains control over a majority of the vote on all matters submitted to a vote of stockholders for the foreseeable future. Additionally, Terra LLC’s amended and restated operating agreement provides that our Sponsor (and its controlled affiliates) must continue to own a number of Class B units equal to 25% of the number of Class B units held by the Sponsor upon the IPO until the earlier of: (i) three years from the completion of our IPO or (ii) the date Terra LLC has made cash distributions in excess of the Third Target Distribution (as defined herein) for four quarters (which need not be consecutive). Any Class B units of Terra LLC transferred by our Sponsor (other than to its controlled affiliates) will be automatically exchanged (along with a corresponding number of shares of Class B common stock) into shares of our Class A common stock in connection with such transfer. See “Certain Relationships and Related Party Transactions—Amended and Restated Operating Agreement of Terra LLC—Issuances and |
22
Table of Contents
| Transfer of Units” and “Certain Relationships and Related Party Transactions—Amended and Restated Operating Agreement of Terra LLC—Exchange Agreements.” |
| Holders of our Class A common stock, Class B common stock and Class B1 common stock will vote together as a single class on all matters presented to stockholders for their vote or approval, except as otherwise required by law. See “Description of Capital Stock.” |
| Economic interest |
Immediately following this offering, subject to the right of holders of IDRs to receive a portion of distributions after certain thresholds are met, holders of our Class A common stock will own in the aggregate a % economic interest in our business through our ownership of Class A units of Terra LLC, our Sponsor will own a % economic interest in our business through its ownership of Class B units of Terra LLC and Riverstone will own a % economic interest in our business through its ownership of Class B1 units of Terra LLC (or a % economic interest, a % economic interest and a % economic interest, respectively, if the underwriters exercise in full their option to purchase additional shares of our Class A common stock). See “Certain Relationships and Related Party Transactions—Amended and Restated Operating Agreement of Terra LLC—Distributions.” |
| Exchange and registration rights |
Each Class B unit and each Class B1 unit of Terra LLC, together with a corresponding number of shares of Class B common stock or Class B1 common stock, as applicable, is exchangeable for a share of our Class A common stock at any time, subject to equitable adjustments for stock splits, stock dividends and reclassifications, in accordance with the terms of the exchange agreements we entered into with our Sponsor and Riverstone. Our Sponsor or Riverstone (or any other permitted holder) may exchange its Class B units or Class B1 units in Terra LLC, together with a corresponding number of shares of Class B common stock or shares of Class B1 common stock, as applicable, for shares of our Class A common stock on a one-for-one basis, subject to equitable adjustments for stock splits, stock dividends and reclassifications, in accordance with the terms of the exchange agreements. When a holder exchanges a Class B unit or Class B1 unit of Terra LLC for a share of our Class A common stock, (i) such holder will surrender such Class B unit or Class B1 unit, as applicable, and a corresponding share of our Class B common stock or Class B1 common stock, as applicable, to Terra LLC, (ii) we will issue and contribute a share of Class A common stock to Terra LLC for delivery of such share by Terra LLC to the exchanging holder, (iii) Terra LLC will issue a Class A unit to us, (iv) Terra LLC will cancel |
23
Table of Contents
| the Class B unit or Class B1 unit, as applicable, and we will cancel the corresponding share of our Class B common stock or Class B1 common stock, as applicable, and (v) Terra LLC will deliver the share of Class A common stock it receives to the exchanging holder. See “Certain Relationships and Related Party Transactions—Amended and Restated Operating Agreement of Terra LLC—Exchange Agreements.” |
| Pursuant to registration rights agreements that we entered into with our Sponsor and Riverstone, we agreed to file registration statements for the sale of the shares of our Class A common stock that are issuable upon exchange of Class B units or Class B1 units of Terra LLC upon request and cause that registration statement to be declared effective by the SEC as soon as practicable thereafter. See “Certain Relationships and Related Party Transactions—Registration Rights Agreements” for a description of the timing and manner limitations on resales of these shares of our Class A common stock. |
| In addition, pursuant to the registration rights agreement we entered into in connection with our Acquisition Private Placement, we have filed a registration statement for the sale of the shares of our Class A common stock that were sold thereby. See “—Recent Developments—Acquisition Private Placement.” |
Cash dividends:
| Class A common stock |
Our ability to pay the regular quarterly dividend is subject to various restrictions and other factors described in more detail under the caption “Cash Dividend Policy.” We expect to pay a quarterly dividend on or about the 75th day following the expiration of each fiscal quarter to holders of our Class A common stock of record on or about the 60th day following the last day of such fiscal quarter. On October 27, 2014, we declared a quarterly dividend of $0.1717 per share on our outstanding Class A common stock payable on December 15, 2014 to holders of record on December 1, 2014. This amount represents a quarterly dividend of $0.2257 per share, or $0.9028 per share on an annualized basis, prorated to adjust for a partial quarter as we consummated our IPO part-way through the quarter, on July 23, 2014. |
| We believe, based on our financial forecast and related assumptions and our acquisition strategy, that we will generate sufficient cash available for distribution to support our Minimum Quarterly Distribution of $0.2257 per share of Class A common stock ($0.9028 per share on an annualized basis). However, we do not have a legal obligation to declare or pay dividends at such initial quarterly dividend level or at all. See “Cash Dividend Policy.” |
24
Table of Contents
| Class B common stock |
Holders of our Class B common stock do not have any right to receive cash dividends. See “Description of Capital Stock—Class B Common Stock—Dividend and Liquidation Rights.” However, holders of our Class B common stock also hold Class B units issued by Terra LLC. As a result of holding the Class B units, subject to certain limitations during the Subordination Period and the Distribution Forbearance Period, our Sponsor is entitled to share in distributions from Terra LLC to its unit holders (including distributions to us as the holder of the Class A units of Terra LLC). See “Certain Relationships and Related Party Transactions—Amended and Restated Operating Agreement of Terra LLC—Distributions.” |
| Class B1 common stock |
Holders of our Class B1 common do not have any right to receive cash dividends. See “Description of Capital Stock—Class B1 Common Stock—Dividend and Liquidation Rights.” However, holders of our Class B1 common stock also hold Class B1 units issued by Terra LLC. As a result of holding Class B1 units, such holders are be entitled to share in distributions from Terra LLC to its unit holders (including distributions to us as the holder of the Class A units of Terra LLC) pro rata based on the number of units held. See “Certain Relationships and Related Party Transactions—Amended and Restated Operating Agreement of Terra LLC—Distributions.” |
| U.S. Federal income tax consequences to non-U.S. holders |
For a discussion of the material federal income tax consequences that may be relevant to prospective investors who are non-U.S. holders, please read “United States Federal Income Tax Consequences to Non-U.S. Holders.” |
| FERC-related purchase restrictions |
Except to the extent authorized by FERC pursuant to Section 203 of the Federal Power Act, or the “FPA,” a purchaser of Class A common stock in this offering will not be permitted to acquire (i) an amount of our Class A common stock that, after giving effect to such acquisition, would allow such purchaser together with its affiliates (as understood for purposes of FPA Section 203) to exercise 10% or more of the total voting power of the outstanding shares of our Class A common stock, Class B common stock and Class B1 common stock in the aggregate, or (ii) an amount of our Class A common stock as otherwise determined by our board of directors sufficient to allow such purchaser together with its affiliates to exercise control over our company. See “Business—Regulatory Matters.” |
| Stock exchange listing |
Our Class A common stock is listed on the NASDAQ Global Select Market under the symbol “TERP.” |
25
Table of Contents
| Controlled company exemption |
We are considered a “controlled company” for the purposes of the NASDAQ Global Select Market listing requirements. As a “controlled company,” we are not required to establish a compensation or nominating committee under the listing rules of the NASDAQ Global Select Market. |
Certain Assumptions
The number of shares of our common stock and the number of units of Terra LLC to be outstanding after this offering, the combined voting power that identified stockholders will hold after this offering and the economic interest in our business that identified stockholders will hold after this offering are based on shares of our Class A common stock (including shares offered by us in this offering), 64,526,654 shares of our Class B common stock, 5,840,000 shares of our Class B1 common stock, Class A units of Terra LLC, 64,526,654 Class B units of Terra LLC and 5,840,000 Class B1 units of Terra LLC outstanding as of December 5, 2014 and excludes (i) shares of our Class A common stock which may be issued upon the exercise of the underwriters’ option to purchase additional shares of our Class A common stock; and (ii) 3,710,048 shares of our Class A common stock reserved for future issuance under our 2014 Incentive Plan.
Except as otherwise indicated, all information in this prospectus assumes that the underwriters do not exercise their option to purchase additional Class A common stock.
26
Table of Contents
SUMMARY HISTORICAL AND PRO FORMA FINANCIAL DATA
The following table shows summary historical and pro forma financial data at the dates and for the periods indicated. The summary historical financial data as of and for the years ended December 31, 2012 and 2013 have been derived from the audited combined consolidated financial statements of our accounting predecessor included elsewhere in this prospectus. The summary historical financial data as of and for the nine months ended September 30, 2013 have been derived from the unaudited condensed combined consolidated financial statements of our accounting predecessors included elsewhere in this prospectus, which include all adjustments, consisting of normal recurring adjustments, that management considers necessary for a fair presentation of the financial position and the results of operations for such periods. The summary historical financial data as of and for the nine months ended September 30, 2014, have been derived from the unaudited condensed consolidated financial statements of TerraForm Power, Inc. Results for the interim periods are not necessarily indicative of the results for the full year. The historical combined consolidated financial statements of our accounting predecessors as of December 31, 2013 and 2012, for the years ended December 31, 2013 and 2012, and as of September 30, 2013 and for the nine months then ended, are intended to represent the financial results of SunEdison’s contracted renewable energy assets that have been contributed to Terra LLC as part of our initial portfolio.
The summary unaudited pro forma financial data have been derived by the application of pro forma adjustments to the historical financial statements of our accounting predecessor included elsewhere in this prospectus. The summary unaudited pro forma statements of operations data for the year ended December 31, 2013 and for the nine months ended September 30, 2014 give pro forma effect to (i) certain historical items related to the IPO, and (ii) the Acquisition Transactions and the Acquisition Financing Transactions (each as defined under “Unaudited Pro Forma Condensed Consolidated Financial Statements”), including the use of the estimated net proceeds from this offering, as if they had occurred on January 1, 2013. The summary unaudited pro forma balance sheet data as of September 30, 2014 give effect to the Acquisition Transactions and the Acquisition Financing Transactions, including the use of the estimated net proceeds from this offering, as if each had occurred on September 30, 2014. See “Unaudited Pro Forma Condensed Consolidated Financial Statements” for additional information.
The following table should be read together with, and is qualified in its entirety by reference to, the historical financial statements and the accompanying notes appearing elsewhere in this prospectus. Among other things, the historical financial statements include more detailed information regarding the basis of presentation for the information in the following table. The table should also be read together with “Management’s Discussion and Analysis of Financial Condition and Results of Operations.”
Our summary unaudited pro forma financial data are presented for informational purposes only. The pro forma adjustments are based upon available information and certain assumptions that we believe are reasonable. Our summary unaudited pro forma financial information does not purport to represent what our results of operations or financial position would have been if we operated as a public company during the periods presented and may not be indicative of our future performance.
27
Table of Contents
Financial data of TerraForm Power, Inc. has not been presented in this prospectus for periods prior to its date of incorporation of January 15, 2014.
| Pro Forma | Pro Forma | |||||||||||||||||||||||
| For the Year Ended December 31, |
For the Year Ended December 31, 2013 |
For the Nine Months Ended September 30, |
For the Nine Months Ended September 30, 2014 |
|||||||||||||||||||||
| (in thousands, except operational data) | 2012 | 2013 | 2013 | 2014 | ||||||||||||||||||||
| (unaudited) | (unaudited) | (unaudited) | ||||||||||||||||||||||
| Statement of Operations Data: |
||||||||||||||||||||||||
| Operating revenue |
||||||||||||||||||||||||
| Energy |
$ | 8,193 | $ | 8,928 | $ | 119,168 | $ | 6,884 | $ | 59,692 | $ | 143,432 | ||||||||||||
| Incentives |
5,930 | 7,608 | 45,271 | 5,409 | 22,832 | 55,274 | ||||||||||||||||||
| Incentives-affiliate |
1,571 | 933 | 933 | 746 | 774 | 774 | ||||||||||||||||||
|
|
|
|
|
|
|
|
|
|
|
|
|
|||||||||||||
| Total operating revenues |
15,694 | 17,469 | 165,372 | 13,039 | 83,298 | 199,480 | ||||||||||||||||||
| Operating costs and expenses: |
||||||||||||||||||||||||
| Cost of operations |
837 | 1,024 | 56,911 | 780 | 6,051 | 59,636 | ||||||||||||||||||
| Cost of operations-affiliate |
680 | 911 | 911 | 478 | 3,911 | 3,911 | ||||||||||||||||||
| General and administrative |
177 | 289 | 13,028 | 92 | 3,767 | 14,430 | ||||||||||||||||||
| General and administrative-affiliate |
4,425 | 5,158 | 5,158 | 3,568 | 8,783 | 8,783 | ||||||||||||||||||
| Acquisition costs |
— | — | — | — | 2,537 | — | ||||||||||||||||||
| Acquisition costs-affiliate |
— | — | — | — | 2,826 | — | ||||||||||||||||||
| Formation and offering related fees and expenses |
— | — | — | — | 3,399 | 3,399 | ||||||||||||||||||
| Depreciation, amortization and accretion |
4,267 | 4,961 | 60,636 | 3,542 | 21,053 | 69,601 | ||||||||||||||||||
|
|
|
|
|
|
|
|
|
|
|
|
|
|||||||||||||
| Total operating costs and expenses |
10,386 | 12,343 | 136,644 | 8,460 | 52,327 | 159,760 | ||||||||||||||||||
|
|
|
|
|
|
|
|
|
|
|
|
|
|||||||||||||
| Operating income |
5,308 | 5,126 | 28,728 | 4,579 | 30,971 | 39,720 | ||||||||||||||||||
| Other (income) expense: |
||||||||||||||||||||||||
| Interest expense, net |
5,702 | 6,267 | 75,828 | 4,716 | 53,217 | 102,268 | ||||||||||||||||||
| (Gain) loss on extinguishment of debt, net |
— | — | — | — | (7,635 | ) | (7,635 | ) | ||||||||||||||||
| (Gain) loss on foreign currency exchange |
— | (771 | ) | (771 | ) | — | 6,914 | 7,103 | ||||||||||||||||
| Other (income) loss, net |
— | — | (36,648 | ) | (1 | ) | 582 | 13,473 | ||||||||||||||||
|
|
|
|
|
|
|
|
|
|
|
|
|
|||||||||||||
| Total other expense |
5,702 | 5,496 | 38,409 | 4,715 | 53,078 | 115,209 | ||||||||||||||||||
|
|
|
|
|
|
|
|
|
|
|
|
|
|||||||||||||
| Loss before income tax benefit |
(394 | ) | (370 | ) | (9,681 | ) | (136 | ) | (22,107 | ) | (75,489 | ) | ||||||||||||
| Income tax (benefit) provision |
(1,270 | ) | (88 | ) | — | (60 | ) | (4,069 | ) | (33 | ) | |||||||||||||
|
|
|
|
|
|
|
|
|
|
|
|
|
|||||||||||||
| Net income (loss) |
$ | 876 | $ | (282 | ) | (9,681 | ) | $ | (76 | ) | (18,038 | ) | (75,456 | ) | ||||||||||
|
|
|
|
|
|
|
|||||||||||||||||||
| Less: Predecessor loss prior to initial public offering on July 23, 2014 |
(10,357 | ) | ||||||||||||||||||||||
|
|
|
|||||||||||||||||||||||
| Net loss subsequent to initial public offering |
(7,681 | ) | ||||||||||||||||||||||
| Less net income (loss) attributable to non-controlling interests |
11,599 | (3,667 | ) | (47,541 | ) | |||||||||||||||||||
|
|
|
|
|
|
|
|||||||||||||||||||
| Net loss attributable to TerraForm Power, Inc. |
$ | (21,280 | ) | $ | (4,014 | ) | $ | (27,915 | ) | |||||||||||||||
|
|
|
|
|
|
|
|||||||||||||||||||
| Other Financial Data: (unaudited) |
||||||||||||||||||||||||
| Adjusted EBITDA(1) |
$ | 9,575 | $ | 10,858 | $ | 95,275 | $ | 11,690 | $ | 74,112 | $ | 122,046 | ||||||||||||
| Loss per share: |
||||||||||||||||||||||||
| Class A common stock - Basic and Diluted |
$ | (0.43 | ) | $ | (0.15 | ) | $ | (0.56 | ) | |||||||||||||||
| Cash Flow Data: |
||||||||||||||||||||||||
| Net cash provided by (used in): |
||||||||||||||||||||||||
| Operating activities |
$ | 2,890 | $ | (7,202 | ) | $ | (44,111 | ) | $ | 27,567 | ||||||||||||||
| Investing activities |
(410 | ) | (264,239 | ) | (5,534 | ) | (969,592 | ) | ||||||||||||||||
| Financing activities |
(2,477 | ) | 272,482 | 50,047 | 1,200,686 | |||||||||||||||||||
| Balance Sheet Data (at period end): |
||||||||||||||||||||||||
| Cash and cash equivalents |
$ | 3 | $ | 1,044 | $ | 405 | $ | 259,363 | $ | 231,396 | ||||||||||||||
| Restricted cash(2) |
8,828 | 69,722 | 14,204 | 74,839 | 113,677 | |||||||||||||||||||
| Property and equipment, net |
111,697 | 407,356 | 211,385 | 1,848,635 | 2,945,221 | |||||||||||||||||||
| Total assets |
158,955 | 566,877 | 267,245 | 2,613,080 | 4,039,069 | |||||||||||||||||||
| Total liabilities |
128,926 | 551,425 | 222,671 | 1,481,795 | 2,124,477 | |||||||||||||||||||
| Total equity |
30,029 | 15,452 | 44,574 | 1,131,285 | 1,896,740 | |||||||||||||||||||
| Operating Data (for the period): |
||||||||||||||||||||||||
| MWh sold(3) (unaudited) |
52,325 | 60,176 | 42,250 | 439,683 | ||||||||||||||||||||
28
Table of Contents
| (1) | Adjusted EBITDA is a measurement that is not recognized in accordance with U.S. Generally Accepted Accounting Procedures, or “GAAP,” and should not be viewed as an alternative to GAAP measures of performance. The presentation of Adjusted EBITDA should not be construed as an inference that our future results will be unaffected by unusual or non-recurring items. |
We define Adjusted EBITDA as net income plus interest expense, net, income taxes, depreciation, amortization and accretion, and stock compensation expense after eliminating the impact of non-recurring items and other factors that we do not consider indicative of future operating performance. We believe Adjusted EBITDA is useful to investors in evaluating our operating performance because:
| • | securities analysts and other interested parties use such calculations as a measure of financial performance and debt service capabilities; and |
| • | it is used by our management for internal planning purposes, including aspects of our consolidated operating budget and capital expenditures. |
Adjusted EBITDA has limitations as an analytical tool, and you should not consider it in isolation or as a substitute for analysis of our results as reported under GAAP. Some of these limitations include:
| • | it does not reflect our cash expenditures or future requirements for capital expenditures or contractual commitments; |
| • | it does not reflect changes in, or cash requirements for, working capital; |
| • | it does not reflect significant interest expense or the cash requirements necessary to service interest or principal payments on our outstanding debt; |
| • | it does not reflect payments made or future requirements for income taxes; |
| • | it reflects adjustments for factors that we do not consider indicative of future performance, even though we may, in the future, incur expenses similar to the adjustments reflected in our calculation of Adjusted EBITDA in this prospectus; and |
| • | although depreciation and accretion are non-cash charges, the assets being depreciated and the liabilities being accreted will often have to be replaced or paid in the future and Adjusted EBITDA does not reflect cash requirements for such replacements or payments. |
Investors are encouraged to evaluate each adjustment and the reasons we consider it appropriate for supplemental analysis.
The following table represents a reconciliation of net income to Adjusted EBITDA:
| Pro Forma | Pro Forma | |||||||||||||||||||||||
| For the Year Ended December 31, |
For the Year Ended December 31, 2013 |
For the Nine Months Ended September 30, |
For the Nine Months Ended September 30, 2014 |
|||||||||||||||||||||
| (in thousands) | 2012 | 2013 | 2013 | 2014 | ||||||||||||||||||||
| (unaudited) | (unaudited) | (unaudited) | ||||||||||||||||||||||
| Net income (loss) |
$ | 876 | $ | (282 | ) | $ | (9,681 | ) | $ | (76 | ) | $ | (18,038 | ) | $ | (75,456 | ) | |||||||
| Add: |
||||||||||||||||||||||||
| Depreciation, amortization and accretion |
4,267 | 4,961 | 60,636 | 3,542 | 24,611 | 69,601 | ||||||||||||||||||
| Interest expense, net(a) |
5,702 | 6,267 | 75,828 | 4,716 | 53,217 | 102,268 | ||||||||||||||||||
| Income tax benefit |
(1,270 | ) | (88 | ) | — | (60 | ) | (4,069 | ) | (33 | ) | |||||||||||||
| General and administrative—affiliate(b) |
4,425 | 5,158 | 5,158 | 3,568 | 8,783 | 8,783 | ||||||||||||||||||
| Stock compensation expense |
— | — | — | — | 1,567 | 1,567 | ||||||||||||||||||
| Acquisition costs, including affiliate(c) |
— | — | — | — | 5,363 | — | ||||||||||||||||||
| Formation and offering related fees and expenses(d) |
— | — | — | — | 3,399 | 3,399 | ||||||||||||||||||
| Gain on extinguishment of debt(e) |
— | — | — | — | (7,635 | ) | (7,635 | ) | ||||||||||||||||
| (Gain) Loss on foreign currency exchange(f) |
— | (771 | ) | (771 | ) | — | 6,914 | 7,103 | ||||||||||||||||
| Other—First Wind(g) |
— | — | (35,895 | ) | — | — | 12,449 | |||||||||||||||||
|
|
|
|
|
|
|
|
|
|
|
|
|
|||||||||||||
| Adjusted EBITDA |
$ | 14,000 | $ | 15,245 | $ | 95,275 | $ | 11,690 | $ | 74,112 | $ | 122,046 | ||||||||||||
|
|
|
|
|
|
|
|
|
|
|
|
|
|||||||||||||
| (a) | Immediately prior to the completion of the IPO, Terra LLC and Terra Operating LLC entered into an interest payment agreement (the “Interest Payment Agreement”) with SunEdison and its wholly owned subsidiary, SunEdison Holdings Corporation, pursuant to which SunEdison has agreed to pay all of the scheduled interest on our term loan facility, or the “Term Loan,” through the third anniversary of Terra LLC and Terra Operating LLC entering into the Term Loan, up to an aggregate of $48.0 million over such period (plus any interest due on any payment not remitted when due). During the period from July 24, 2014 to September 30, 2014, we received a $1.5 million equity contribution from |
29
Table of Contents
| SunEdison pursuant to the Interest Payment Agreement. There was no cash consideration paid to SunEdison for these services for the period from July 24, 2014 through September 30, 2014. Total actual costs for these services during the period from July 24, 2014 to September 30, 2014 of $5.1 million is reflected in the consolidated statement of operations and has been treated as an equity contribution from SunEdison. Pursuant to the Intercompany Agreement, Terra LLC and SunEdison have agreed that the Interest Payment Agreement shall be amended to provide that SunEdison’s interest payment obligations will apply to any replacement financing for the Term Loan up to the same maximum aggregate amount for the same period of time. |
| (b) | Represents the non-cash allocation of SunEdison’s corporate overhead. In conjunction with the closing of the IPO, we entered into the Management Services Agreement with SunEdison, pursuant to which SunEdison provides or arranges for other service providers to provide management and administrative services to us. There will be no cash payments to SunEdison for these services during 2014, and in subsequent years, the cash fees payable to SunEdison will be capped at $4.0 million in 2015, $7.0 million in 2016 and $9.0 million in 2017. |
| (c) | Represents transaction related costs, including affiliate acquisition costs, associated with the acquisitions completed during the three and nine month periods ended September 30, 2014. There were no such costs during the same periods in the prior year. |
| (d) | Represents non-recurring professional fees for legal, tax and accounting services incurred in connection with the IPO. |
| (e) | We recognized a net gain on extinguishment of debt of $7.6 million for the nine months ended September 30, 2014, due primarily to the termination of our capital lease obligations upon acquiring the lessor interest in the SunE Solar Fund X solar generation assets. |
| (f) | We incurred a loss on foreign currency exchange of $6.9 million during the nine months ended September 30, 2014. These losses are driven by unrealized losses of $4.3 million during the nine months ended September 30, 2014, on the remeasurement of intercompany loans which are denominated in British pounds. We also realized a $2.8 million loss on the payment of outstanding Chilean peso denominated payables related to the construction of the CAP project in Chile, which were paid subsequent to the project reaching commercial operations in March 2014. |
| (g) | Represents gains or losses on the sale of assets, losses on disposal and impairment of assets, losses on early extinguishments of debt, settlements, and other income included in the historical financial results of First Wind. These amounts are added or subtracted from Adjusted EBITDA as they are not representative of acquired operations. |
| (2) | Restricted cash includes current restricted cash and non-current restricted cash included in “Other assets” in the consolidated financial statements. |
| (3) | For any period presented, MWh sold represents the amount of electricity measured in MWh that our projects generated and sold. |
30
Table of Contents
This offering and an investment in our Class A common stock involve a high degree of risk. You should carefully consider the risks described below, together with the financial and other information contained in this prospectus, before you decide to purchase shares of our Class A common stock. If any of the following risks actually occurs, our business, financial condition, results of operations, cash flows and prospects could be materially and adversely affected. As a result, the trading price of our Class A common stock could decline and you could lose all or part of your investment in our Class A common stock.
Risks Related to the First Wind Acquisition
Completion of the First Wind Acquisition is subject to conditions and if these conditions are not satisfied or waived, the First Wind Acquisition will not be completed.
Completion of the First Wind Acquisition is subject to satisfaction or waiver of a number of conditions, including certain regulatory approvals. The closing of the First Wind Acquisition is not a condition precedent to, or condition subsequent of, this offering. Each party’s obligation to complete the First Wind Acquisition is subject to the satisfaction or waiver (to the extent permitted under applicable law) of certain other conditions, the accuracy of the representations and warranties of the other party under the First Wind Acquisition Agreement (subject to the materiality standards set forth in the First Wind Acquisition Agreement), the performance by the other party of its respective obligations under the First Wind Acquisition Agreement in all material respects and delivery of officer certificates by the other party certifying satisfaction of the preceding conditions.
The failure to satisfy all of the required conditions could delay the completion of the First Wind Acquisition for a significant period of time or prevent it from occurring. Any delay in completing the First Wind Acquisition could cause us not to realize some or all of the benefits that we expect to achieve if the First Wind Acquisition is successfully completed within its expected timeframe. The conditions to the closing of the First Wind Acquisition may not be satisfied or waived and the First Wind Acquisition may not be completed. Investors should not make an investment in the shares of Class A common stock offered hereby in reliance on the expectation that the First Wind Acquisition will be completed on the currently anticipated timeframe, or at all.
Integrating the assets we intend to acquire in the First Wind Acquisition may be more difficult, costly or time consuming than expected and the anticipated benefits of the First Wind Acquisition may not be realized.
Until the completion of the First Wind Acquisition, we will continue to operate independently from the assets to be acquired in the First Wind Acquisition. The success of the First Wind Acquisition, including anticipated benefits, will depend, in part, on our ability to successfully combine and integrate those assets with our existing operations. In addition, the acquisition of the wind projects represents a substantial change in the nature of our business, and we may not be able to adapt to such change in a timely manner, or at all. It is possible that the pendency of the First Wind Acquisition or the integration process could result in the loss of key employees, higher than expected costs, diversion of management attention and resources, the disruption of either company’s ongoing businesses or inconsistencies in standards, controls, procedures and policies that adversely affect the combined company’s ability to maintain relationships with customers, vendors and employees or to achieve the anticipated benefits of the First Wind Acquisition. If we experience difficulties with the integration process, the anticipated benefits of the First Wind Acquisition may not be realized fully or at all, or may take longer to realize than expected. Management continues to refine its integration plan, which may vary from plans previously disclosed. These integration matters could have an adverse effect during this transition period and for an undetermined period after completion of the First Wind Acquisition.
31
Table of Contents
In connection with the First Wind Acquisition, we expect to incur significant additional indebtedness and may also assume certain of First Wind’s outstanding indebtedness, which could adversely affect us, including by decreasing our business flexibility, and will increase our interest expense.
We will have substantially increased indebtedness following completion of the First Wind Acquisition in comparison to our indebtedness on a recent historical basis, which could have the effect, among other things, of reducing our flexibility to respond to changing business and economic conditions and increasing our interest expense. We will also incur various costs and expenses associated with the financing. The amount of cash required to pay interest on our increased indebtedness following completion of the First Wind Acquisition, and thus the demands on our cash resources, will be greater than the amount of cash flows required to service our indebtedness prior to the transaction. The increased levels of indebtedness following completion of the First Wind Acquisition could also reduce funds available for working capital, capital expenditures, acquisitions and other general corporate purposes and may create competitive disadvantages for us relative to other companies with lower debt levels. If we do not achieve the expected benefits from the First Wind Acquisition, or if our financial performance after completion of the First Wind Acquisition does not meet current expectations, then our ability to service our indebtedness may be adversely impacted.
In connection with the debt financing for the First Wind Acquisition, we anticipate seeking ratings of our indebtedness from one or more nationally recognized statistical rating organizations. We may not achieve a particular rating or maintain a particular rating in the future. Our credit ratings may affect the cost and availability of future borrowings and our cost of capital.
Moreover, we may be required to raise substantial additional financing to fund working capital, capital expenditures, acquisitions or other general corporate requirements. Our ability to arrange additional financing or refinancing will depend on, among other factors, our financial position and performance, as well as prevailing market conditions and other factors beyond our control. We may not be able to obtain additional financing or refinancing on terms acceptable to us or at all.
The agreements that will govern the senior unsecured notes we expect to issue in connection with the First Wind Acquisition, or any indebtedness of First Wind we may assume, are expected to contain various covenants that impose restrictions on us and certain of our subsidiaries that may affect our ability to operate our businesses.
The agreements that will govern the senior unsecured notes we expect to issue in connection with the First Wind Acquisition, or any indebtedness of First Wind we may assume, are expected to contain various affirmative and negative covenants that may, subject to certain significant exceptions, restrict our and certain of our subsidiaries ability to, among other things, have liens on our property, change the nature of our business, and/or acquire, merge or consolidate with any other person or sell or convey certain of our assets to any one person. Our and our subsidiaries ability to comply with these provisions may be affected by events beyond our control. Failure to comply with these covenants could result in an event of default, which, if not cured or waived, could accelerate our repayment obligations.
The First Wind Acquisition will involve substantial costs.
We have incurred, and expect to continue to incur, a number of non-recurring costs associated with the First Wind Acquisition. The substantial majority of non-recurring expenses will be comprised of transaction and regulatory costs related to the First Wind Acquisition. We continue to assess the magnitude of these costs, and additional unanticipated costs may be incurred in the First Wind Acquisition.
32
Table of Contents
Risks Related to our Business
The Risk Factors below describe both the risks to our business as it currently exists and the risks to our business if the Acquisition Transactions are consummated.
Counterparties to our PPAs may not fulfill their obligations, which could result in a material adverse impact on our business, financial condition, results of operations and cash flows.
All of the electric power generated by our current portfolio of projects is sold under long-term PPAs with public utilities or commercial, industrial or government end-users. We expect the Call Right Projects will also have long-term PPAs. If, for any reason, any purchaser of power under these contracts is unable or unwilling to fulfill their related contractual obligations or if they refuse to accept delivery of power delivered thereunder or otherwise terminate such agreements prior to the expiration thereof, our assets, liabilities, business, financial condition, results of operations and cash flows could be materially adversely affected. Furthermore, to the extent any of our power purchasers are, or are controlled by, governmental entities, legislative or other political action may impair the results we achieve from the corresponding facilities in our portfolio.
A portion of the revenues under the PPAs for the U.K. projects included in our portfolio are subject to price adjustments after a period of time. If the market price of electricity decreases and we are otherwise unable to negotiate more favorable pricing terms, our business, financial condition, results of operations and cash flows may be materially and adversely affected.
The PPAs for the U.K. projects included in our portfolio have fixed electricity prices for a specified period of time (typically four years), after which such electricity prices are subject to an adjustment based on the then current market price. While the PPAs with price adjustments specify a minimum price, the minimum price is significantly below the initial fixed price. The pricing for renewable obligation certificates, or “ROCs,” under the PPAs for the U.K. projects is fixed by U.K. laws or regulations for the entire term of the PPA. A decrease in the market price of electricity, including due to lower prices for traditional fossil fuels, could result in a decrease in the pricing under such contracts if the fixed-price period has expired, unless we are able to negotiate more favorable pricing terms. Any decrease in the price payable to us under our PPAs could materially and adversely affect our business, financial condition, results of operations and cash flows.
Certain of the PPAs for power generation projects in our portfolio and that we may acquire in the future contain or will contain provisions that allow the offtake purchaser to terminate the PPA or buy out a portion of the project upon the occurrence of certain events. If such provisions are exercised and we are unable to enter into a PPA on similar terms, in the case of PPA termination, or find suitable replacement projects to invest in, in the case of a buyout, our cash available for distribution could materially decline.
Certain of the PPAs for power generation projects in our portfolio and that we may acquire in the future allow the offtake purchaser to purchase all or a portion of the applicable project from us. For example, in connection with the PPA for the CAP project, the off-taker has, under certain circumstances, the right to purchase up to 40% of the project equity from us pursuant to a predetermined purchase price formula. If the off-taker of the CAP project exercises its right to purchase a portion of the project, we would need to reinvest the proceeds from the sale in one or more projects with similar economic attributes in order to maintain our cash available for distribution. Additionally,
33
Table of Contents
under the PPAs for the U.S. distributed generation projects, off-takers have the option to either (i) purchase the applicable solar photovoltaic system, typically five to six years after COD under such PPA, for a purchase price equal to the greater of a value specified in the contract or the fair market value of the project determined at the time of exercise of the purchase option, or (ii) pay an early termination fee as specified in the contract, terminate the contract and require the project company to remove the applicable solar photovoltaic system from the site. If we were unable to locate and acquire suitable replacement projects in a timely fashion it could have a material adverse effect on our results of operations and cash available for distribution.
Additionally, certain of the PPAs associated with projects in our portfolio allow the offtake purchaser to terminate the PPA in the event certain operating thresholds or performance measures are not achieved within specified time periods, and we are therefore subject to the risk of counterparty termination based on such criteria for such projects. Certain of the PPAs associated with distributed generation projects also allow the offtaker to terminate the PPA by paying an early termination fee. In the event a PPA for one or more of our projects is terminated, it could materially and adversely affect our results of operations and cash available for distribution until we are able to replace the PPA on similar terms. We cannot provide any assurance that PPAs containing such provisions will not be terminated or, in the event of termination, we will be able to enter into a replacement PPA. Moreover, any replacement PPA may be on terms less favorable to us than the PPA that was terminated.
Most of our PPAs do not include inflation-based price increases.
In general, the PPAs that have been entered into for the projects in our portfolio and the Call Right Projects do not contain inflation-based price increase provisions. Certain of the countries in which we have operations, or that we may expand into in the future, have in the past experienced high inflation. To the extent that the countries in which we conduct our business experience high rates of inflation, thereby increasing our operating costs in those countries, we may not be able to generate sufficient revenues to offset the effects of inflation, which could materially and adversely affect our business, financial condition, results of operations and cash flows.
A material drop in the retail price of utility-generated electricity or electricity from other sources could increase competition for new PPAs.
We believe that an end-user’s decision to buy clean energy from us is primarily driven by their desire to pay less for electricity, and is therefore sensitive to the cost of both other clean energy and conventional energy sources. Decreases in the retail prices of electricity supplied by utilities or other clean energy sources would harm our ability to offer competitive pricing and could harm our ability to sign new customers. The price of electricity from utilities could decrease for a number of reasons, including:
| • | the construction of a significant number of new power generation plants, including nuclear, coal, natural gas or renewable energy facilities; |
| • | the construction of additional electric transmission and distribution lines; |
| • | a reduction in the price of natural gas, including as a result of new drilling techniques or a relaxation of associated regulatory standards; |
| • | energy conservation technologies and public initiatives to reduce electricity consumption; and |
| • | the development of new clean energy technologies that provide less expensive energy. |
A reduction in utility retail electricity prices would make the purchase of solar or wind energy less economically attractive. In addition, a shift in the timing of peak rates for utility-supplied electricity to a time of day when solar energy generation is less efficient could make solar energy less competitive
34
Table of Contents
and reduce demand. If the retail price of energy available from utilities were to decrease, we would be at a competitive disadvantage, we may be unable to attract new customers and our growth would be limited.
We are exposed to risks associated with the projects in our portfolio and the Call Right Projects that are newly constructed or are under construction.
Certain of the projects in our portfolio are still under construction. We may experience delays or unexpected costs during the completion of construction of these projects, and if any project is not completed according to specification, we may incur liabilities and suffer reduced project efficiency, higher operating costs and reduced cash flows. Additionally, the remedies available to us under the applicable engineering, procurement and construction, or “EPC,” contract may not sufficiently compensate us for unexpected costs and delays related to project construction. If we are unable to complete the construction of a project for any reason, we may not be able to recover our related investment. In addition, certain of the Call Right Projects are under construction and may not be completed on schedule or at all, in which case any such project would not be available for acquisition by us during the time frame we currently expect or at all. Since our primary growth strategy is the acquisition of new clean energy projects, including under the Support Agreement, a delay in our ability to acquire a Call Right Project could materially and adversely affect our expected growth.
In addition, our expectations for the operating performance of newly constructed projects and projects under construction are based on assumptions and estimates made without the benefit of operating history. However, the ability of these projects to meet our performance expectations is subject to the risks inherent in newly constructed power generation facilities and the construction of such facilities, including, but not limited to, degradation of equipment in excess of our expectations, system failures and outages. The failure of these facilities to perform as we expect could have a material adverse effect on our business, financial condition, results of operations and cash flows and our ability to pay dividends to holders of our Class A common stock.
Certain of our PPAs and project-level financing arrangements include provisions that would permit the counterparty to terminate the contract or accelerate maturity in the event our Sponsor ceases to control or own, directly or indirectly, a majority of our company.
Certain of our PPAs and project-level financing arrangements contain change in control provisions that provide the counterparty with a termination right or the ability to accelerate maturity if a change of control consent is not received. These provisions are triggered in the event our Sponsor ceases to own, directly or indirectly, capital stock representing more than 50% of the voting power (which is equal to approximately 9% ownership) of all of our capital stock outstanding on such date, or, in some cases, if our Sponsor ceases to be the majority owner, directly or indirectly, of the applicable project subsidiary. As a result, if our Sponsor ceases to control, or in some cases, own a majority of TerraForm Power, the counterparties could terminate such contracts or accelerate the maturity of such financing arrangements. The termination of any of our PPAs or the acceleration of the maturity of any of our project-level financing as a result of a change in control of TerraForm Power could have a material adverse effect on our business, financial condition, results of operations and cash flows.
35
Table of Contents
We may not be able to replace expiring PPAs with contracts on similar terms. If we are unable to replace an expired distributed generation PPA with an acceptable new contract, we may be required to remove the solar energy assets from the site or, alternatively, we may sell the assets to the site host.
We may not be able to replace an expiring PPA with a contract on equivalent terms and conditions, including at prices that permit operation of the related facility on a profitable basis. If we are unable to replace an expiring PPA with an acceptable new project revenue contract, the affected site may temporarily or permanently cease operations. In the case of a distributed generation project that ceases operations, the PPA terms generally require that we remove the assets, including fixing or reimbursing the site owner for any damages caused by the assets or the removal of such assets. The cost of removing a significant number of distributed generation projects could be material. Alternatively, we may agree to sell the assets to the site owner, but the terms and conditions, including price, that we would receive in any sale, and the sale price may not be sufficient to replace the revenue previously generated by the project.
First Wind’s Mars Hill project’s PPA is expiring in February 2015, and First Wind is currently negotiating for an extension of the PPA. If the PPA is not extended or replaced, Mars Hill may be able to sell into the wholesale markets administered by ISO New England Inc., or “ISO-NE,” only by building approximately 15 miles of transmission line, or buying firm transmission rights, if available. The Mars Hill PPA may not be extended or replaced, and the project may not be able to sell into the ISO-NE markets or may only be able to sell into the ISO-NE markets at costs that make such sales uneconomic.
Projects in the First Wind portfolio located in Maine have experienced curtailment issues which may adversely affect revenues.
First Wind’s Stetson and Rollins projects have experienced significant curtailment starting in February 2012 due to a combination of construction on the Maine Power Reliability Project, or “MPRP,” a large transmission upgrade project affecting generation and transmission throughout Maine and adjoining areas, and transmission export limits at the Keane Road transmission interface, or “Keane Road.” These projects in the aggregate have had curtailment of approximately 58 GWh for each of 2012 and 2013, attributable in the aggregate to each of the MPRP and Keane Road. First Wind currently expects the MPRP to be completed in 2015, although it may not be able to be completed on this timeline or at all. First Wind also is currently pursuing several different solutions that may help to eliminate the Keane Road issue in 2015, including implementation of (i) General Electric “Fast Stop” software/firmware, which is designed to detect system instability and shut down turbines when needed, (ii) various market efficiencies, with the cost absorbed by ISO-NE, and (iii) elective transmission upgrades with the cost absorbed by First Wind. Together with our Sponsor, we expect to continue to pursue these solutions after the closing of the First Wind Acquisition. However, such solutions may not ameliorate or eliminate the Keane Road curtailment issues.
The growth of our business depends on locating and acquiring interests in additional, attractive clean energy projects from our Sponsor and unaffiliated third parties at favorable prices.
Our primary business strategy is to acquire clean energy projects that are operational. We may also, in limited circumstances, acquire clean energy projects that are pre-operational. We intend to pursue opportunities to acquire projects from both our Sponsor and third parties. The following factors, among others, could affect the availability of attractive projects to grow our business:
| • | competing bids for a project, including from companies that may have substantially greater capital and other resources than we do; |
36
Table of Contents
| • | fewer third-party acquisition opportunities than we expect, which could result from, among other things, available projects having less desirable economic returns or higher risk profiles than we believe suitable for our business plan and investment strategy; |
| • | our Sponsor’s failure to complete the development of (i) the Call Right Projects (and, if the First Wind Acquisition is consummated, the additional projects to which we expect to have call rights pursuant to the Intercompany Agreement), which could result from, among other things, permitting challenges, failure to procure the requisite financing, equipment or interconnection, or an inability to satisfy the conditions to effectiveness of project agreements such as PPAs, and (ii) any of the other projects in its development pipeline in a timely manner, or at all, in either case, which could limit our acquisition opportunities under the Support Agreement or the Intercompany Agreement; and |
| • | our failure to exercise our rights under the Support Agreement or the Intercompany Agreement to acquire assets from our Sponsor. |
We will not be able to achieve our target compound annual growth rate of CAFD per unit unless we are able to acquire additional clean energy projects at favorable prices.
Our acquisition strategy exposes us to substantial risks.
The acquisition of power generation assets is subject to substantial risks, including the failure to identify material problems during due diligence (for which we may not be indemnified post-closing), the risk of over-paying for assets (or not making acquisitions on an accretive basis), the ability to obtain or retain customers and, if the projects are in new markets, the risks of entering markets where we have limited experience. While we will perform our due diligence on prospective acquisitions, we may not be able to discover all potential operational deficiencies in such projects. The integration and consolidation of acquisitions requires substantial human, financial and other resources and may divert management’s attention from our existing business concerns, disrupt our ongoing business or not be successfully integrated. Future acquisitions may not perform as expected or that the returns from such acquisitions will support the financing utilized to acquire them or maintain them. As a result, the consummation of acquisitions may have a material adverse effect on our business, financial condition, results of operations and cash flows and ability to pay dividends to holders of our Class A common stock.
In addition, the development of clean energy projects is a capital intensive, high-risk business that relies heavily on the availability of debt and equity financing sources to fund projected construction and other projected capital expenditures. As a result, in order to successfully develop a clean energy project, development companies, including our Sponsor, from which we may seek to acquire projects, must obtain at-risk funds sufficient to complete the development phase of their projects. We, on the other hand, must anticipate obtaining funds from equity or debt financing sources, including under our Term Loan or our revolving credit facility, or the “Revolver,” or from government grants in order to successfully fund and complete acquisitions of projects. Any significant disruption in the credit or capital markets, or a significant increase in interest rates, could make it difficult for our Sponsor or other development companies to successfully develop attractive projects as well as limit their ability to obtain project-level financing to complete the construction of a project we may seek to acquire, or may make it difficult for us to obtain the funding we require to acquire such projects. If our Sponsor or other development companies from which we seek to acquire projects are unable to raise funds when needed, or if we or they are unable to secure adequate financing, the ability to grow our project portfolio may be limited, which could have a material adverse effect on our ability to implement our growth strategy and, ultimately, our business, financial condition, results of operations and cash flows.
37
Table of Contents
We may not be able to effectively identify or consummate any future acquisitions on favorable terms, or at all. Additionally, even if we consummate acquisitions on terms that we believe are favorable, such acquisitions may in fact result in a decrease in cash available for distribution per Class A common share.
The number of future acquisition opportunities for renewable energy projects is limited. While our Sponsor has granted us the option to purchase the Call Right Projects and a right of first offer with respect to the ROFO Projects, we will compete with other companies for future acquisition opportunities. This may increase our cost of making acquisitions or cause us to refrain from making acquisitions at all. Some of our competitors for acquisitions are much larger than us with substantially greater resources. These companies may be able to pay more for acquisitions and may be able to identify, evaluate, bid for and purchase a greater number of assets than our resources permit.
In addition, if we are unable to reach agreement with our Sponsor regarding the pricing of the Unpriced Call Right Projects, our acquisition opportunities may be more limited than we currently expect. In addition, if our Sponsor’s development of new projects slows, we also may have fewer opportunities to purchase projects from our Sponsor. If we are unable to identify and consummate future acquisitions, it will impede our ability to execute our growth strategy and limit our ability to increase the amount of dividends paid to holders of our Class A common stock.
Even if we consummate acquisitions that we believe will be accretive to CAFD per unit, those acquisitions may in fact result in a decrease in CAFD per unit as a result of incorrect assumptions in our evaluation of such acquisitions, unforeseen consequences or other external events beyond our control. Furthermore, if we consummate any future acquisitions, our capitalization and results of operations may change significantly, and stockholders will generally not have the opportunity to evaluate the economic, financial and other relevant information that we will consider in determining the application of these funds and other resources.
New projects being developed that we may acquire may need governmental approvals and permits, including environmental approvals and permits, for construction and operation. Any failure to obtain necessary permits could adversely affect our growth.
The design, construction and operation of clean energy projects is highly regulated, requires various governmental approvals and permits, including environmental approvals and permits, and may be subject to the imposition of related conditions that vary by jurisdiction. We cannot predict whether all permits required for a given project will be granted or whether the conditions associated with the permits will be achievable. The denial or loss of a permit essential to a project or the imposition of impractical conditions upon renewal could impair our sponsor’s ability to construct and our ability to operate a project. In addition, we cannot predict whether the permits will attract significant opposition or whether the permitting process will be lengthened due to complexities, legal claims or appeals. Delays in the review and permitting process for a project can impair or delay our ability to acquire a project or increase the cost such that the project is no longer attractive to us.
Our ability to grow and make acquisitions with cash on hand may be limited by our cash dividend policy.
As discussed in “Cash Dividend Policy,” our dividend policy is to cause Terra LLC to distribute approximately 85% of CAFD each quarter and to rely primarily upon external financing sources, including the issuance of debt and equity securities and, if applicable, borrowings under our Term Loan or our Revolver, to fund our acquisitions and growth capital expenditures (which we define as costs and expenses associated with the acquisition of project assets from our Sponsor and third parties and capitalized expenditures on existing projects to expand capacity). We may be precluded from pursuing
38
Table of Contents
otherwise attractive acquisitions if the projected short-term cash flow from the acquisition or investment is not adequate to service the capital raised to fund the acquisition or investment, after giving effect to our available cash reserves. See “Cash Dividend Policy—Our Ability to Grow our Business and Dividend.”
We intend to use a portion of the CAFD generated by our project portfolio to pay regular quarterly cash dividends to holders of our Class A common stock. Our initial quarterly dividend was set at $0.2257 per share of Class A common stock, or $0.9028 per share on an annualized basis. We established our initial quarterly dividend based upon a target payout ratio by Terra LLC of approximately 85% of projected annual CAFD. As such, our growth may not be as fast as that of businesses that reinvest their available cash to expand ongoing operations. To the extent we issue additional equity securities in connection with any acquisitions or growth capital expenditures, the payment of dividends on these additional equity securities may increase the risk that we will be unable to maintain or increase our per share dividend. There are no limitations in our amended and restated certificate of incorporation (other than a specified number of authorized shares) on our ability to issue equity securities, including securities ranking senior to our common stock. The incurrence of bank borrowings or other debt by Terra Operating LLC or by our project-level subsidiaries to finance our growth strategy will result in increased interest expense and the imposition of additional or more restrictive covenants which, in turn, may impact the cash distributions we distribute to holders of our Class A common stock.
Our indebtedness could adversely affect our financial condition and ability to operate our business, including restricting our ability to pay cash dividends or react to changes in the economy or our industry.
As of September 30, 2014, we had approximately $299.3 million of indebtedness and an additional $140.0 million available for future borrowings under our Revolver. In addition, we expect to incur a significant amount of additional debt in connection with the Acquisition Transactions. Our substantial debt could have important negative consequences on our financial condition, including:
| • | increasing our vulnerability to general economic and industry conditions; |
| • | requiring a substantial portion of our cash flow from operations to be dedicated to the payment of principal and interest on our indebtedness, thereby reducing our ability to pay dividends to holders of our Class A common stock or to use our cash flow to fund our operations, capital expenditures and future business opportunities; |
| • | limiting our ability to enter into or receive payments under long-term power sales or fuel purchases which require credit support; |
| • | limiting our ability to fund operations or future acquisitions; |
| • | restricting our ability to make certain distributions with respect to our capital stock and the ability of our subsidiaries to make certain distributions to us, in light of restricted payment and other financial covenants in our credit facilities and other financing agreements; |
| • | exposing us to the risk of increased interest rates because certain of our borrowings, which may include borrowings under our Revolver, are at variable rates of interest; |
| • | limiting our ability to obtain additional financing for working capital, including collateral postings, capital expenditures, debt service requirements, acquisitions and general corporate or other purposes; and |
| • | limiting our ability to adjust to changing market conditions and placing us at a competitive disadvantage compared to our competitors who have less debt. |
39
Table of Contents
Our Revolver and Term Loan contain financial and other restrictive covenants that limit our ability to return capital to stockholders or otherwise engage in activities that may be in our long-term best interests. Our inability to satisfy certain financial covenants could prevent us from paying cash dividends, and our failure to comply with those and other covenants could result in an event of default which, if not cured or waived, may entitle the related lenders to demand repayment or enforce their security interests, which could have a material adverse effect on our business, financial condition, results of operations and cash flows. In addition, failure to comply with such covenants may entitle the related lenders to demand repayment and accelerate all such indebtedness.
The agreements governing our project-level financing contain, and we expect project financings incurred or assumed on future projects we acquire to contain, financial and other restrictive covenants that limit our project subsidiaries’ ability to make distributions to us or otherwise engage in activities that may be in our long-term best interests. The project-level financing agreements generally prohibit distributions from the project entities to us unless certain specific conditions are met, including the satisfaction of certain financial ratios. Our inability to satisfy certain financial covenants may prevent cash distributions by the particular project(s) to us and our failure to comply with those and other covenants could result in an event of default which, if not cured or waived may entitle the related lenders to demand repayment or enforce their security interests, which could have a material adverse effect on our business, results of operations and financial condition. In addition, failure to comply with such covenants may entitle the related lenders to demand repayment and accelerate all such indebtedness. If we are unable to make distributions from our project-level subsidiaries, it would likely have a material adverse effect on our ability to pay dividends to holders of our Class A common stock.
If our subsidiaries default on their obligations under their project-level indebtedness, this may constitute an event of default under our Term Loan and Revolver, and we may be required to make payments to lenders to avoid such default or to prevent foreclosure on the collateral securing the project-level debt. If we are unable to or decide not to make such payments, we would lose certain of our solar energy projects upon foreclosure.
Our subsidiaries incur, and we expect will in the future incur, various types of project-level indebtedness. Non-recourse debt is repayable solely from the applicable project’s revenues and is secured by the project’s physical assets, major contracts, cash accounts and, in many cases, our ownership interest in the project subsidiary. Limited recourse debt is debt where we have provided a limited guarantee, and recourse debt is debt where we have provided a full guarantee, which means if our subsidiaries default on these obligations, we will be liable directly to those lenders, although in the case of limited recourse debt only to the extent of our limited recourse obligations. To satisfy these obligations, we may be required to use amounts distributed by our other subsidiaries as well as other sources of available cash, reducing our cash available to execute our business plan and pay dividends to holders of our Class A common stock. In addition, if our subsidiaries default on their obligations under non-recourse financing agreements this may, under certain circumstances, result in an event of default under our Term Loan and Revolver, allowing our lenders to foreclose on their security interests.
Even if that is not the case, we may decide to make payments to prevent the lenders of these subsidiaries from foreclosing on the relevant collateral. Such a foreclosure could result in our losing our ownership interest in the subsidiary or in some or all of its assets. The loss of our ownership interest in one or more of our subsidiaries or some or all of their assets could have a material adverse effect on our business, financial condition, results of operations and cash flow.
If we are unable to renew letter of credit facilities our business, financial condition, results of operations and cash flows may be materially adversely affected.
Our Revolver includes a letter of credit facility to support project-level contractual obligations. This letter of credit facility will need to be renewed as of July 23, 2017, at which time we will need to satisfy
40
Table of Contents
applicable financial ratios and covenants. If we are unable to renew our letters of credit as expected or if we are only able to replace them with letters of credit under different facilities on less favorable terms, we may experience a material adverse effect on our business, financial condition, results of operations and cash flows. Furthermore, the inability to provide letters of credit may constitute a default under certain project-level financing arrangements, restrict the ability of the project-level subsidiary to make distributions to us and/or reduce the amount of cash available at such subsidiary to make distributions to us.
Our ability to raise additional capital to fund our operations may be limited.
Our ability to arrange additional financing, either at the corporate level or at a non-recourse project-level subsidiary, may be limited. Additional financing, including the costs of such financing, will be dependent on numerous factors, including:
| • | general economic and capital market conditions; |
| • | credit availability from banks and other financial institutions; |
| • | investor confidence in us, our partners, our Sponsor, as our principal stockholder (on a combined voting basis), and manager under the Management Services Agreement, and the regional wholesale power markets; |
| • | our financial performance and the financial performance of our subsidiaries; |
| • | our level of indebtedness and compliance with covenants in debt agreements; |
| • | maintenance of acceptable project credit ratings or credit quality, including maintenance of the legal and tax structure of the project-level subsidiary upon which the credit ratings may depend; |
| • | cash flow; and |
| • | provisions of tax and securities laws that may impact raising capital. |
We may not be successful in obtaining additional financing for these or other reasons. Furthermore, we may be unable to refinance or replace project-level financing arrangements or other credit facilities on favorable terms or at all upon the expiration or termination thereof. Our failure, or the failure of any of our projects, to obtain additional capital or enter into new or replacement financing arrangements when due may constitute a default under such existing indebtedness and may have a material adverse effect on our business, financial condition, results of operations and cash flows.
Our ability to generate revenue from certain utility solar and wind energy projects depends on having interconnection arrangements and services.
Our future success will depend, in part, on our ability to maintain satisfactory interconnection agreements. If the interconnection or transmission agreement of a solar energy project or any other clean energy project we acquire, including the projects we expect to acquire as part of the First Wind Acquisition, is terminated for any reason, we may not be able to replace it with an interconnection and transmission arrangement on terms as favorable as the existing arrangement, or at all, or we may experience significant delays or costs related to securing a replacement. If a network to which one or more of our existing solar energy projects, or projects we acquire, is connected experiences “down time,” the affected project may lose revenue and be exposed to non-performance penalties and claims from its customers. These may include claims for damages incurred by customers, such as the additional cost of acquiring alternative electricity supply at then-current spot market rates. The owners of the network will not usually compensate electricity generators for lost income due to down time. These factors could materially affect our ability to forecast operations and negatively affect our business, results of operations, financial condition and cash flow.
41
Table of Contents
For some of our projects, we rely on electric interconnection and transmission facilities that we do not own or control and that are subject to transmission constraints within a number of our regions. If these facilities fail to provide us with adequate transmission capacity, we may be restricted in our ability to deliver electric power to our customers and we may incur additional costs or forego revenues.
For our utility-scale projects we depend on electric transmission facilities owned and operated by others to deliver the power we generate and sell at wholesale to our utility customers. A failure or delay in the operation or development of these transmission facilities or a significant increase in the cost of the development of such facilities could result in our losing revenues. Such failures or delays could limit the amount of power our operating facilities deliver or delay the completion of our construction projects. Additionally, such failures, delays or increased costs could have a material adverse effect on our business, financial condition and results of operations. If a region’s power transmission infrastructure is inadequate, our recovery of wholesale costs and profits may be limited. If restrictive transmission price regulation is imposed, the transmission companies may not have a sufficient incentive to invest in expansion of transmission infrastructure. We also cannot predict whether transmission facilities will be expanded in specific markets to accommodate competitive access to those markets. In addition, certain of our operating facilities’ generation of electricity may be physically or economically curtailed without compensation due to transmission limitations or limitations on the transmission grid’s ability to accommodate all of the generating resources seeking to move power over or sell power through the grid, reducing our revenues and impairing our ability to capitalize fully on a particular facility’s generating potential. Such curtailments could have a material adverse effect on our business, financial condition, results of operations and cash flows. Furthermore, economic congestion on the transmission grid (for instance, a positive price difference between the location where power is put on the grid by a project and the location where power is taken off the grid by the project’s customer) in certain of the bulk power markets in which we operate may occur and we may be deemed responsible for those congestion costs. If we were liable for such congestion costs, our financial results could be adversely affected.
We face competition from traditional and renewable energy companies.
The solar energy industry, and the broader renewable energy industry, including wind, is highly competitive and continually evolving as market participants strive to distinguish themselves within their markets and compete with large incumbent utilities and new market entrants. We believe that our primary competitors are the traditional incumbent utilities that supply energy to our potential customers under highly regulated rate and tariff structures. We compete with these traditional utilities primarily based on price, predictability of price and the ease with which customers can switch to electricity generated by our solar energy systems. If we cannot offer compelling value to our customers based on these factors, then our business will not grow. Traditional utilities generally have substantially greater financial, technical, operational and other resources than we do. As a result of their greater size, these competitors may be able to devote more resources to the research, development, promotion and sale of their products or respond more quickly to evolving industry standards and changes in market conditions than we can. Traditional utilities could also offer other value-added products or services that could help them to compete with us even if the cost of electricity they offer is higher than ours. In addition, a majority of traditional utilities’ sources of electricity is non-solar and non-renewable, which may allow them to sell electricity more cheaply than electricity generated by our solar energy systems and other types of clean energy systems we acquire, including the projects we expect to acquire through the First Wind Acquisition.
We also face risks that traditional utilities could change their volumetric-based (i.e., cents per kWh) rate and tariff structures to make distributed solar generation less economically attractive to their retail customers. Currently, net metering programs are utilized in 43 states to support the growth of distributed generation solar by requiring traditional utilities to reimburse their retail customers who are
42
Table of Contents
home and business owners for the excess power they generate at the level of the utilities’ retail rates rather than the rates at which those utilities buy power at wholesale. These net metering policies have generated controversy recently because the difference between traditional utilities’ retail rates and the rates at which they can buy power at wholesale can be significant and solar owners can escape most of the infrastructure surcharges that are part of other electricity users’ bills recovered through volumetric-based rates. To address those concerns and to allow traditional utilities to cover their transmission and distribution fixed charges, at least one state public utility commission, in Arizona, has allowed its largest traditional utility, Arizona Public Service, to assess a surcharge on customers with solar energy systems for their use of the utility’s grid, based on the size of the customer’s solar energy system. This surcharge will reduce the economic returns for the excess electricity that the solar energy systems produce. These types of changes or other types of changes that could reduce or eliminate the economic benefits of net-metering could be implemented by state public utility commissions or state legislatures in the other 43 states throughout the United States that utilize net-metering programs, and could significantly change the economic benefits of solar energy as perceived by traditional utilities’ retail customers.
We also face competition in the energy efficiency evaluation and upgrades market and we expect to face competition in additional markets as we introduce new energy-related products and services. As the solar industry grows and evolves, we will also face new competitors who are not currently in the market. Our failure to adapt to changing market conditions and to compete successfully with existing or new competitors will limit our growth and will have a material adverse effect on our business and prospects.
There are a limited number of purchasers of utility-scale quantities of electricity, which exposes us and our utility-scale projects to additional risk.
Since the transmission and distribution of electricity is either monopolized or highly concentrated in most jurisdictions, there are a limited number of possible purchasers for utility-scale quantities of electricity in a given geographic location, including transmission grid operators, state and investor-owned power companies, public utility districts and cooperatives. As a result, there is a concentrated pool of potential buyers for electricity generated by our plants and projects, which may restrict our ability to negotiate favorable terms under new PPAs and could impact our ability to find new customers for the electricity generated by our generation facilities should this become necessary. Furthermore, if the financial condition of these utilities and/or power purchasers deteriorated or the Renewable Portfolio Standard, or “RPS,” climate change programs or other regulations to which they are currently subject and that compel them to source renewable energy supplies change, demand for electricity produced by our plants could be negatively impacted. In addition, provisions in our power sale arrangements may provide for the curtailment of delivery of electricity for various operational reasons at no cost to the power purchaser, including to prevent damage to transmission systems and for system emergencies, force majeure, safety, reliability, maintenance and other operational reasons. Such curtailment would reduce revenues to at no cost to the purchaser including, in addition to certain of the general types noted above, events in which energy purchases would result in costs greater than those which the purchaser would incur if it did not make such purchases but instead generated an equivalent amount of energy (provided that such curtailment is due to operational reasons and does not occur solely as a consequence of purchaser’s filed avoided energy cost being lower than the agreement rates or purchasing less-expensive energy from another facility). Even though the Hawaii purchasers are required to take reasonable steps to minimize the number and duration of curtailment events, and that such curtailments will generally be made in reverse chronological order based upon Hawaii utility commission approval (which is beneficial to older projects such as KWP I), such curtailments could still occur and reduce revenues to the Hawaii wind projects. If we cannot enter into power sale arrangements on terms favorable to us, or at all, or if the purchaser under our power sale arrangements were to exercise its curtailment or other rights to reduce purchases or payments under such arrangements, our revenues and our decisions regarding development of additional projects may be adversely affected.
43
Table of Contents
A significant deterioration in the financial performance of the retail industry could materially adversely affect our distributed generation business.
The financial performance of our distributed generation business depends in part upon the continued viability and financial stability of our customers in the retail industry, such as medium and large independent retailers and distribution centers. If the retail industry is materially and adversely affected by an economic downturn, increase in inflation or other factors, one or more of our largest customers could encounter financial difficulty, and possibly, bankruptcy. If one or more of our largest customers were to encounter financial difficulty or declare bankruptcy, they may reduce their PPA payments to us or stop them altogether. Any interruption or termination in payments by our customers would result in less cash being paid to the special purpose legal entities we establish to finance our projects, which could adversely affect the entities’ ability to make lease payments to the financing parties which are the legal owners of many of our solar energy systems or to pay our lenders in the case of the solar energy systems that we own. In such a case, the amount of distributable cash held by the entities would decrease, adversely affecting the cash flows we receive from such entities. In addition, our ability to finance additional new projects with PPAs from such customers would be adversely affected, undermining our ability to grow our business. Any reduction or termination of payments by one or more of our principal distributed generation customers could have a material adverse effect on our business, financial condition and results of operations.
The generation of electric energy from solar and wind energy sources depends heavily on suitable meteorological conditions. If solar or wind conditions are unfavorable, our electricity generation, and therefore revenue from our renewable generation facilities using our systems, may be substantially below our expectations.
The electricity produced and revenues generated by a solar electric generation facility and any wind facilities that we may acquire as part of the First Wind Acquisition or otherwise are highly dependent on suitable solar and wind conditions and associated weather conditions, which are beyond our control. Furthermore, components of our system, such as solar panels and inverters or wind turbines, could be damaged by severe weather, such as hailstorms, tornadoes or lightning strikes. We generally will be obligated to bear the expense of repairing the damaged solar energy systems and wind projects that we own, and replacement and spare parts for key components may be difficult or costly to acquire or may be unavailable. Unfavorable weather and atmospheric conditions could impair the effectiveness of our assets or reduce their output beneath their rated capacity or require shutdown of key equipment, impeding operation of our solar assets and our ability to achieve forecasted revenues and cash flows. Sustained unfavorable weather could also unexpectedly delay the installation of solar energy systems, which could result in a delay in us acquiring new projects or increase the cost of such projects.
We base our investment decisions with respect to each solar energy facility and any wind facilities that we may acquire as part of the First Wind Acquisition or otherwise on the findings of related solar and wind studies conducted on-site prior to construction or based on historical conditions at existing facilities. However, actual climatic conditions at a facility site may not conform to the findings of these studies and therefore, our facilities may not meet anticipated production levels or the rated capacity of our generation assets, which could adversely affect our business, financial condition and results of operations and cash flows. In particular, the electricity produced and revenues generated by a wind energy project depend heavily on wind conditions, which are variable and difficult to predict. In assessing the merits of undertaking the First Wind Acquisition, we considered the operating history of the wind facilities we expect to acquire as part of that transaction. Operating results for wind projects can vary significantly from period to period depending on the wind conditions during the periods in question and are estimated based on long-term wind and other meteorological studies. Actual wind conditions and future operating results, however, may not conform to these studies and may be affected by variations in weather patterns, including any potential impact of climate change. Therefore, the electricity generated by the wind projects we expect to acquire as part of the First Wind Acquisition
44
Table of Contents
may not meet our anticipated production levels or the expected capacity of the turbines, which could adversely affect our business, financial condition and results of operations. If the wind resources at a project are below the average level we expect, our rate of return for the project would be below our expectations and we could be adversely affected. Projections of wind resources also rely upon assumptions about turbine placement, interference between turbines and the effects of vegetation, land use and terrain, which involve uncertainty and require us to exercise considerable judgment. Any of these factors could cause any of the wind projects to have less wind potential than we expected, which could cause the return on our investment in these projects to be lower than expected.
Our hedging activities and those related to the First Wind assets that we intend to acquire may not adequately manage our exposure to commodity and financial risk, which could result in significant losses or require us to use cash collateral to meet margin requirements, each of which could have a material adverse effect on our business, financial condition, results of operations and liquidity, which could impair our ability to execute favorable financial hedges in the future.
First Wind has entered into, and, after the First Wind Acquisition, we may enter into, financial swaps or other hedging arrangements. We may also acquire additional assets with similar hedging arrangements in the future. Under the terms of First Wind’s existing financial swaps, the projects are not obligated to physically deliver or purchase electricity. Instead, they receive payments for specified quantities of electricity based on a fixed-price and are obligated to pay the counterparty the market price for the same quantities of electricity. These financial swaps cover quantities of electricity that First Wind estimates are highly likely to be produced. As a result, gains or losses under the financial swaps are designed to be offset by decreases or increases in a project’s revenues from spot sales of electricity in liquid ISO markets. However, the actual amount of electricity a project generates from operations may be materially different from First Wind’s estimates for a variety of reasons, including variable wind conditions and wind turbine availability. If a project does not generate the volume of electricity covered by the associated swap contract, we could incur significant losses if electricity prices in the market rise substantially above the fixed-price provided for in the swap. If a project generates more electricity than is contracted in the swap, the excess production will not be hedged and the related revenues will be exposed to market-price fluctuations.
We sometimes seek to sell forward a portion of our RECs or other environmental attributes to fix the revenues from those attributes and hedge against future declines in prices of RECs or other environmental attributes. If our projects do not generate the amount of electricity required to earn the RECs or other environmental attributes sold forward or if for any reason the electricity we generate does not produce RECs or other environmental attributes for a particular state, we may be required to make up the shortfall of RECs or other environmental attributes through purchases on the open market or make payments of liquidated damages. Further, current market conditions may limit our ability to hedge sufficient volumes of our anticipated RECs or other environmental attributes, leaving us exposed to the risk of falling prices for RECs or other environmental attributes. Future prices for RECs or other environmental attributes are also subject to the risk that regulatory changes will adversely affect prices.
While we currently own only solar energy projects, we intend to acquire a number of wind energy projects in the First Wind Acquisition and in the future we may decide to further expand our acquisition strategy to include other types of energy or transmission projects. To the extent that we expand our operations to include new business segments, our business operations may suffer from a lack of experience, which may materially and adversely affect our business, financial condition, results of operations and cash flows.
We have limited experience in energy generation operations. As a result of this lack of experience, we may be prone to errors if we expand our projects beyond such energy projects other than solar and,
45
Table of Contents
upon consummation of the First Wind Acquisition, wind. We lack the technical training and experience with developing, starting or operating non-solar generation facilities. With no direct training or experience in these areas, our management may not be fully aware of the many specific requirements related to working in industries beyond solar energy generation. Additionally, we may be exposed to increased operating costs, unforeseen liabilities or risks, and regulatory and environmental concerns associated with entering new sectors of the power generation industry, which could have an adverse impact on our business as well as place us at a competitive disadvantage relative to more established non-solar energy market participants. In addition, such ventures could require a disproportionate amount of our management’s attention and resources. Our operations, earnings and ultimate financial success could suffer irreparable harm due to our management’s lack of experience in these industries. We may rely, to a certain extent, on the expertise and experience of industry consultants and we may have to hire additional experienced personnel to assist us with our operations.
Operation of power generation facilities involves significant risks and hazards that could have a material adverse effect on our business, financial condition, results of operations and cash flows. We may not have adequate insurance to cover these risks and hazards.
The ongoing operation of our facilities involves risks that include the breakdown or failure of equipment or processes or performance below expected levels of output or efficiency due to wear and tear, latent defect, design error or operator error or force majeure events, among other things. Operation of our facilities also involves risks that we will be unable to transport our product to our customers in an efficient manner due to a lack of transmission capacity. Unplanned outages of generating units, including extensions of scheduled outages, occur from time to time and are an inherent risk of our business. Unplanned outages typically increase our operation and maintenance expenses and may reduce our revenues as a result of generating and selling less power or require us to incur significant costs as a result of obtaining replacement power from third parties in the open market to satisfy our forward power sales obligations.
Our inability to efficiently operate our solar energy assets and the wind assets we intend to acquire from First Wind, manage capital expenditures and costs and generate earnings and cash flow from our asset-based businesses could have a material adverse effect on our business, financial condition, results of operations and cash flows. While we maintain insurance, obtain warranties from vendors and obligate contractors to meet certain performance levels, the proceeds of such insurance, warranties or performance guarantees may not cover our lost revenues, increased expenses or liquidated damages payments should we experience equipment breakdown or non-performance by contractors or vendors.
Power generation involves hazardous activities, including delivering electricity to transmission and distribution systems. In addition to natural risks such as earthquake, flood, lightning, hurricane and wind, other hazards, such as fire, structural collapse and machinery failure are inherent risks in our operations. These and other hazards can cause significant personal injury or loss of life, severe damage to and destruction of property, plant and equipment and contamination of, or damage to, the environment and suspension of operations. The occurrence of any one of these events may result in our being named as a defendant in lawsuits asserting claims for substantial damages, including for environmental cleanup costs, personal injury and property damage and fines and/or penalties. We maintain an amount of insurance protection that we consider adequate but we cannot provide any assurance that our insurance will be sufficient or effective under all circumstances and against all hazards or liabilities to which we may be subject. Furthermore, our insurance coverage is subject to deductibles, caps, exclusions and other limitations. A loss for which we are not fully insured could have a material adverse effect on our business, financial condition, results of operations or cash flows. Further, due to rising insurance costs and changes in the insurance markets, we cannot provide any
46
Table of Contents
assurance that our insurance coverage will continue to be available at all or at rates or on terms similar to those presently available. Any losses not covered by insurance could have a material adverse effect on our business, financial condition, results of operations and cash flows.
Our business is subject to substantial governmental regulation and may be adversely affected by changes in laws or regulations, as well as liability under, or any future inability to comply with, existing or future regulations or other legal requirements.
Our business is subject to extensive federal, state and local laws and regulations in the countries in which we operate. Compliance with the requirements under these various regulatory regimes may cause us to incur significant costs, and failure to comply with such requirements could result in the shutdown of the non-complying facility or, the imposition of liens, fines and/or civil or criminal liability.
With the exception of the Mt. Signal project, the Regulus project and certain of the projects we intend to acquire as part of the First Wind Acquisition, all of the U.S. Projects in our portfolio are “qualifying small power production facilities,” or “Qualifying Facilities,” as defined under the Public Utility Regulatory Policies Act of 1978, as amended, or “PURPA.” Depending upon the power production capacity of the project in question, our Qualifying Facilities and their immediate project company owners may be entitled to various exemptions from ratemaking and certain other regulatory provisions of the FPA, from the books and records access provisions of the Public Utility Holding Company Act of 2005, or “PUHCA”, and from state organizational and financial regulation of electric utilities.
Each of the Mt. Signal ProjectCo, the Regulus ProjectCo and the project company owners of the projects we intend to acquire in the First Wind Acquisition (such First Wind entities the “EWG ProjectCos”) is an “Exempt Wholesale Generator” as defined in PUHCA which exempts it and us (for purposes of our ownership of each such company) from the federal books and access provisions of PUHCA. The projects owned by certain of the EWG ProjectCos are Qualifying Facilities and in one instance may receive exemptions from regulation as “public utilities” under certain provisions of the FPA. However, the Mt. Signal ProjectCo, the Regulus ProjectCo and the EWG Project Cos are subject to regulation for most purposes as “public utilities” under the FPA, including regulation of their rates and their issuances of securities. Each of the Mt. Signal ProjectCo, the Regulus ProjectCo and the EWG ProjectCos has obtained “market-based rate authorization” and associated blanket authorizations and waivers from FERC under the FPA, which allows it to sell electric energy, capacity and ancillary services at wholesale at negotiated, market-based rates, instead of cost-of-service rates, as well as waivers of, and blanket authorizations under, certain FERC regulations that are commonly granted to market based rate sellers, including blanket authorizations to issue securities.
The failure of the project company owners of our Qualifying Facilities to maintain available exemptions under PURPA may result in their becoming subject to significant additional regulatory requirements. In addition, the failure of the Mt. Signal ProjectCo, the Regulus ProjectCo, the EWG ProjectCos, or other project company owners of our Qualifying Facilities to comply with applicable regulatory requirements may result in the imposition of penalties as discussed further in “Business—Regulatory Matters.”
In particular, the Mt. Signal ProjectCo, the Regulus ProjectCo, the EWG ProjectCos, and any of the other owners of our project companies that obtain market-based rate authority from FERC under the FPA are or will be subject to certain market behavior rules as established and enforced by FERC, and if they are determined to have violated those rules, will be subject to potential disgorgement of profits associated with the violation, penalties, and suspension or revocation of their market-based rate authority. If such entities were to lose their market-based rate authority, they would be required to obtain FERC’s acceptance of a cost-of-service rate schedule for wholesale sales of electric energy, capacity and ancillary services and could become subject to significant accounting, record-keeping,
47
Table of Contents
and reporting requirements that are imposed on FERC-regulated public utilities with cost-based rate schedules.
Substantially all of our assets are also subject to the rules and regulations applicable to power generators generally, in particular the reliability standards of the North American Electric Reliability Corporation or similar standards in Canada, the United Kingdom and Chile. If we fail to comply with these mandatory reliability standards, we could be subject to sanctions, including substantial monetary penalties, increased compliance obligations and disconnection from the grid.
The regulatory environment for electric generation in the United States has undergone significant changes in the last several years due to state and federal policies affecting the wholesale and retail power markets and the creation of incentives for the addition of large amounts of new renewable generation, demand response resources and, in some cases, transmission assets. These changes are ongoing and we cannot predict the future design of the wholesale and retail power markets or the ultimate effect that the changing regulatory environment will have on our business. In addition, in some of these markets, interested parties have proposed material market design changes, including the elimination of a single clearing price mechanism, as well as made proposals to re-regulate the markets or require divestiture of electric generation assets by asset owners or operators to reduce their market share. Other proposals to re-regulate may be made and legislative or other attention to the electric power market restructuring process may delay or reverse the deregulation process. If competitive restructuring of the electric power markets is reversed, discontinued or delayed, our business prospects and financial results could be negatively impacted.
Similarly, we cannot predict if the significant increase in the installation of renewable energy projects in the other markets we operate in could result in modifications to applicable rules and regulations.
Laws, governmental regulations and policies supporting renewable energy, and specifically solar and wind energy (including tax incentives), could change at any time, including as a result of new political leadership, and such changes may materially adversely affect our business and our growth strategy.
Renewable generation assets currently benefit from various federal, state and local governmental incentives. In the United States, these incentives include investment tax credits, or “ITCs,” production tax credits, or “PTCs,” loan guarantees, RPS programs and modified accelerated cost-recovery system of depreciation. For example, the United States Internal Revenue Code of 1986, as amended, or the “Code,” provides an ITC of 30% of the cost-basis of an eligible resource, including solar energy facilities placed in service prior to the end of 2016, which percentage is currently scheduled to be reduced to 10% for solar energy systems placed in service after December 31, 2016. The U.S. Congress could reduce the ITC to below 30% prior to the end of 2016, reduce the ITC to below 10% for periods after 2016 or replace the expected 10% ITC with an untested production tax credit of an unknown amount. Any reduction in the ITC could materially and adversely affect our business, financial condition, results of operations and cash flows. PTCs, which are federal income tax credits related to the quantity of renewable energy produced and sold during a taxable year, or ITCs in lieu of PTCs, are available only for wind energy projects that began construction on or prior to December 31, 2013. Pending legislation would extend the begun-construction deadline one year to December 31, 2014. PTCs and accelerated tax depreciation benefits generated by operating projects can be monetized by entering into tax equity financing agreements with investors that can utilize the tax benefits, which have been a key financing tool for wind energy projects. The growth of our wind energy business may be dependent on the U.S. Congress extending the expiration date of, renewing or replacing PTCs, without which the market for tax equity financing for wind projects would likely cease to exist. Recent legislative efforts to extend or renew PTCs have failed, and we cannot assure that current or any subsequent
48
Table of Contents
efforts to extend, renew or replace PTCs will be successful. Any failure to extend, renew or replace PTCs could materially and adversely affect our business, financial condition, results of operations and cash flows.
Many U.S. states have adopted RPS programs mandating that a specified percentage of electricity sales come from eligible sources of renewable energy. However, the regulations that govern the RPS programs, including pricing incentives for renewable energy, or reasonableness guidelines for pricing that increase valuation compared to conventional power (such as a projected value for carbon reduction or consideration of avoided integration costs), may change. If the RPS requirements are reduced or eliminated, it could lead to fewer future power contracts or lead to lower prices for the sale of power in future power contracts, which could have a material adverse effect on our future growth prospects. Such material adverse effects may result from decreased revenues, reduced economic returns on certain project company investments, increased financing costs and/or difficulty obtaining financing.
Renewable energy sources in Canada benefit from federal and provincial incentives, such as RPS programs, accelerated cost recovery deductions allowed for tax purposes, the availability of off-take agreements through RPS and the Ontario Feed-in Tariff, or “FiT” program, and other commercially oriented incentives. Renewable energy sources in the United Kingdom benefit from renewable obligation certificates, climate change levy exemption certificates, embedded benefits and contracts for difference. Renewable energy sources in Chile benefit from an RPS program. Any adverse change to, or the elimination of, these incentives could have a material adverse effect on our business and our future growth prospects.
In addition, governmental regulations and policies could be changed to provide for new rate programs that undermine the economic returns for both new and existing distributed solar assets by charging additional, non-negotiable fixed or demand charges or other fees or reductions in the number of projects allowed under net metering policies. Our business could also be subject to new and burdensome interconnection processes, delays and upgrade costs or local permit and site restrictions.
If any of the laws or governmental regulations or policies that support renewable energy, including solar energy, change, or if we are subject to new and burdensome laws or regulations, such changes may have a material adverse effect on our business, financial condition, results of operations and cash flows.
We have a limited operating history and as a result we may not operate on a profitable basis.
We have a relatively new portfolio of assets, including several projects that have only recently commenced operations or that we expect will commence operations in the near future, and a limited operating history on which to base an evaluation of our business and prospects. Our prospects must be considered in light of the risks, expenses and difficulties frequently encountered by companies in their early stages of operation, particularly in a rapidly evolving industry such as ours. We cannot assure you that we will be successful in addressing the risks we may encounter, and our failure to do so could have a material adverse effect on our business, financial condition, results of operations and cash flows.
Our Sponsor may incur additional costs or delays in completing the construction of certain generation facilities, which could materially adversely affect our growth strategy.
Our growth strategy is dependent to a significant degree on acquiring new solar energy projects from our Sponsor and third parties. Our Sponsor’s or such third parties’ failure to complete such projects in a timely manner, or at all, could have a material adverse effect on our growth strategy. The construction of solar energy facilities and wind energy facilities, including those development stage
49
Table of Contents
facilities our Sponsor intends to acquire as part of the First Wind Acquisition involves many risks including:
| • | delays in obtaining, or the inability to obtain, necessary permits and licenses; |
| • | delays and increased costs related to the interconnection of new generation facilities to the transmission system; |
| • | the inability to acquire or maintain land use and access rights; |
| • | the failure to receive contracted third party services; |
| • | interruptions to dispatch at our facilities; |
| • | supply interruptions; |
| • | work stoppages; |
| • | labor disputes; |
| • | weather interferences; |
| • | unforeseen engineering, environmental and geological problems; |
| • | unanticipated cost overruns in excess of budgeted contingencies; |
| • | failure of contracting parties to perform under contracts, including engineering, procurement and construction contractors; and |
| • | operations and maintenance costs not covered by warranties or that occur following expiration of warranties. |
Any of these risks could cause a delay in the completion of projects under development, which could have a material adverse effect on our growth strategy.
Moreover, our Sponsor intends to acquire substantially all of the assets, business and operations of First Wind, other than the operating projects we intend to acquire in the First Wind Acquisition. Our Sponsor does not have independent expertise in developing, constructing or operating wind energy assets. This inexperience may impact the ability of our Sponsor to complete wind projects, including those wind projects to which we expect to have call rights pursuant to the Intercompany Agreement.
Maintenance, expansion and refurbishment of power generation facilities involve significant risks that could result in unplanned power outages or reduced output.
Our facilities may require periodic upgrading and improvement. Any unexpected operational or mechanical failure, including failure associated with breakdowns and forced outages, and any decreased operational or management performance, could reduce our facilities’ generating capacity below expected levels, reducing our revenues and jeopardizing our ability to pay dividends to holders of our Class A common stock at forecasted levels or at all. Degradation of the performance of our solar facilities above levels provided for in the related PPAs may also reduce our revenues. Unanticipated capital expenditures associated with maintaining, upgrading or repairing our facilities may also reduce profitability.
We may also choose to refurbish or upgrade our facilities based on our assessment that such activity will provide adequate financial returns. Such facilities require time for development and capital expenditures before COD, and key assumptions underpinning a decision to make such an investment may prove incorrect, including assumptions regarding construction costs, timing, available financing and future power prices. This could have a material adverse effect on our business, financial condition, results of operations and cash flows.
50
Table of Contents
Moreover, spare parts for wind turbines and solar facilities and key pieces of equipment may be hard to acquire or unavailable to us. Sources of some significant spare parts and other equipment are located outside of North America. If we were to experience a shortage of or inability to acquire critical spare parts we could incur significant delays in returning facilities to full operation, which could negatively impact our business financial condition, results of operations and cash flows.
First Wind’s KWP II project is required under its PPA to install and maintain a battery energy storage system, the manufacturer of which is in bankruptcy and no longer operational. If First Wind is unable to source acceptable replacement batteries, this could result in a default under, or termination of, KWP II’s PPA.
First Wind’s KWP II project is required under its PPA to install and maintain a battery energy storage system, or “BESS,” for electric grid stability and system reliability purposes. The manufacturer of the BESS, Xtreme Power, is in bankruptcy and is no longer providing replacement batteries and other components for the BESS. First Wind is sourcing replacement batteries from a new supplier that we expect will be installed and tested in the near future, but such replacement batteries may not be sufficient for the system to operate as designed or may not be available in the quantities or at a price that permit the KWP II to operate economically or in compliance with its PPA. First Wind’s Kahuku project had a similar BESS that was required to be operated under its PPA, but the BESS was destroyed in a catastrophic fire. The project installed a Dynamic Volt-Amp Reactive System, or “D-Var,” as a replacement for the BESS under the Kahuku project PPA, which D-Var has been operating as designed. If the BESS system at KWP II was damaged or could no longer operate due to a lack of sufficient batteries or other system components, a D-Var could not be used at the KWP II project as a replacement to the BESS due to technical constraints, and another replacement system may not be compatible or available at a price that would allow the project to operate economically. Failure to maintain the battery system constitutes a default under KWP II’s PPA and could result in the termination of KWP II’s PPA, which could negatively impact our business financial condition, results of operations and cash flows.
Certain of the wind projects use equipment originally produced and supplied by Clipper, which no longer manufactures, warrants or services the wind turbine it produced. If Clipper equipment experiences defects in the future, we will not have the benefit of a manufacturer’s warranty on such original equipment, may not be able to obtain replacement components and will need to self fund the correction or replacement of such equipment.
Certain of the wind projects use equipment originally produced and supplied by Clipper Windpower, LLC, or its affiliates, or “Clipper,” which no longer manufactures, warrants or services the wind turbine it produced that are owned by First Wind. Such equipment has experienced certain technical issues with its wind turbine technology and may continue to experience similar issues.
The Cohocton, Kahuku, Sheffield, and Steel Winds I and II projects operate 92 Liberty turbines (230 MW) supplied by Clipper. Since initial deployment, Clipper has announced and remediated various defects affecting the Liberty turbines deployed by First Wind in its wind projects and by other customers that resulted in prolonged downtime for turbines at various projects.
Beginning in 2012, First Wind and Clipper engaged in a number of litigation and arbitration proceedings concerning the performance of the Liberty turbines. On February 12, 2013, all such disputes were settled pursuant to a Settlement, Release and O&M Transition Agreement among certain First Wind and Clipper entities, or the “Settlement Agreement.” Pursuant to the Settlement Agreement, First Wind has, among other things, released Clipper of all of its warranty obligations with respect to the equipment supplied by Clipper, and the obligations under the related operation and maintenance contracts, and has been granted by Clipper a non-exclusive, royalty-free, perpetual,
51
Table of Contents
irrevocable license to make, improve and modify any Clipper-supplied equipment and to create derivative works from such equipment.
As a result, if Clipper equipment experiences defects in the future, we will not have the benefit of a manufacturer’s warranty on such original equipment, may not be able to obtain replacement components and will need to self fund the correction or replacement of such equipment, which could negatively impact our business financial condition, results of operations and cash flows.
Our Sponsor and other developers of solar energy projects and other clean energy projects depend on a limited number of suppliers of solar panels, inverters, modules turbines, towers and other system components and turbines and other equipment associated with wind energy facilities. Any shortage, delay or component price change from these suppliers could result in construction or installation delays, which could affect the number of projects we are able to acquire in the future.
Our solar projects are constructed with solar panels, inverters, modules and other system components from a limited number of suppliers, making us susceptible to quality issues, shortages and price changes. If our Sponsor or third parties from whom we may acquire solar projects or other clean power generation projects in the future fail to develop, maintain and expand relationships with these or other suppliers, or if they fail to identify suitable alternative suppliers in the event of a disruption with existing suppliers, the construction or installation of new solar energy projects or other clean power generation projects, including any wind and solar projects we intend to acquire from First Wind, may be delayed or abandoned, which would reduce the number of available projects that we may have the opportunity to acquire in the future.
There have also been periods of industry-wide shortage of key components, including solar panels and wind turbines, in times of rapid industry growth. The manufacturing infrastructure for some of these components has a long lead time, requires significant capital investment and relies on the continued availability of key commodity materials, potentially resulting in an inability to meet demand for these components. In addition, the United States government has imposed tariffs on solar cells manufactured in China. Based on determinations by the United States government, the applicable anti-dumping tariff rates range from approximately 8% to 239%. To the extent that United States market participants experience harm from Chinese pricing practices, an additional tariff of approximately 15%-16% will be applied. If our Sponsor or other unaffiliated third parties purchase solar panels containing cells manufactured in China, our purchase price for projects would reflect the tariff penalties mentioned above. A shortage of key commodity materials could also lead to a reduction in the number of projects that we may have the opportunity to acquire in the future, or delay or increase the costs of acquisitions.
We may incur unexpected expenses if the suppliers of components in our energy projects default in their warranty obligations.
The solar panels, inverters, modules and other system components utilized in our solar energy projects are generally covered by manufacturers’ warranties, which typically range from 5 to 20 years. When purchasing wind turbines, the purchaser will enter into warranty agreements with the manufacturer which typically expire within two to five years after the turbine delivery date. In the event any such components fail to operate as required, we may be able to make a claim against the applicable warranty to cover all or a portion of the expense associated with the faulty component. However, these suppliers could cease operations and no longer honor the warranties, which would leave us to cover the expense associated with the faulty component. Our business, financial condition, results of operations and cash flows could be materially adversely affected if we cannot make claims under warranties covering our projects.
52
Table of Contents
Decommissioning costs must be paid or accrued in advance in many cases.
Both wind energy systems and solar systems must be authorized by permits or other governmental approvals that, in many cases, are conditioned upon establishing financial assurance (in the form of a trust fund or security device, such as a letter of credit) to assure the payment of estimated decommissioning costs. The amounts of such estimates can vary over time and could rise to levels that are not expected at this time. Accrual or payment into such trust fund, or security device, or posting of letters of credit, can involve material costs that adversely affect the financial performance of our projects. In addition, the amounts of such trust fund or security devices, or letters of credit, vary depending upon the estimates of the net costs of decommissioning (taking into account the revenue obtained from selling the project equipment at the end of the project’s commercial life). Additional decommissioning deposits, payments or security instruments may be required at a later time, depending on the estimates for scrap value recovery and changing requirements for demolition. Decommissioning costs, and required accruals, payments or security devices could generate new or unplanned costs that could have a material adverse effect on our business, financial condition and results of operations.
We are subject to environmental, health and safety laws and regulations and related compliance expenditures and liabilities.
Our assets are subject to numerous and significant federal, state, local and foreign laws, including statutes, regulations, guidelines, policies, directives and other requirements governing or relating to, among other things: protection of wildlife, including threatened and endangered species and their habitat; air emissions; discharges into water; water use; the storage, handling, use, transportation and distribution of dangerous goods and hazardous, residual and other regulated materials, such as chemicals; the prevention of releases of hazardous materials into the environment; the prevention, investigation, monitoring and remediation of hazardous materials in soil and groundwater, both on and offsite; land use and zoning matters; workers’ health and safety matters or other potential nuisances such as the flickering effect caused when rotating wind turbine blades periodically cast shadows through openings such as the windows of neighboring buildings, which is known as shadow flicker; and the presence or discovery of archaeological, religious or cultural resources at or near project operations. Our facilities and any wind facilities that we may acquire from First Wind could experience incidents, malfunctions and other unplanned events, such as spills of hazardous materials that may result in personal injury, penalties and property damage. In addition, certain environmental laws may result in liability, regardless of fault, concerning contamination at a range of properties, including properties currently or formerly owned, leased or operated by us and properties where we disposed of, or arranged for disposal of, waste and other hazardous materials. As such, the operation of our facilities carries an inherent risk of environmental, health and safety liabilities (including potential civil actions, compliance or remediation orders, fines and other penalties), and may result in our involvement from time to time in administrative and judicial proceedings relating to such matters. While we have implemented environmental, health and safety management programs designed to continually improve environmental, health and safety performance, we cannot assure you that such liabilities including significant required capital expenditures, as well as the costs for complying with environmental laws and regulations, will not have a material adverse effect on our business, financial condition, results of operations and cash flows.
We may be required to take action or restrict operations to mitigate hazards to air navigation and interference with other air space users.
Wind energy towers and turbines can physically interfere with air navigation, and solar facilities can generate glare that may have a distracting effect on pilots. Although First Wind is required to notify the Federal Aviation Administration, or “FAA,” of the location of its wind towers and facilities, they may not have correctly notified the FAA in all cases. There is some chance that the facilities we expect to
53
Table of Contents
acquire as part of the First Wind Acquisition could result in adverse effects on air safety, or that we could be ordered to mark our facilities or modify operations to avoid such effects. In addition, we could incur fines or penalties in connection with the failure to property notify the FAA or otherwise fail to comply with regulations relating to hazardous to air navigation. In addition, wind energy facilities can interfere with military radar operations or telecommunications. If such interference occurs, we may be required to modify our operations to avoid such interference. Any of these events could have a material adverse effect on our business, financial condition and results of operations.
Harming of protected species can result in curtailment of wind project operations.
The construction and operation of energy projects can adversely affect endangered, threatened or otherwise protected animal species. Wind projects, in particular, involve a risk that protected species will be harmed, as the turbine blades travel at a high rate of speed and may strike flying animals (birds or bats) that happen to travel into the path of spinning blades. While pre-construction studies are conducted to avoid siting wind projects in areas where protected species are highly concentrated, there is often a level of unavoidable risk that flying species will be harmed by project operation.
First Wind’s wind energy projects that we intend to acquire are known to strike and kill bats and birds, and occasionally strike and kill endangered or protected species, including protected golden or bald eagles. As a result, we will attempt to observe all industry guidelines and governmentally-recommended best practices to avoid harm to protected species, such as avoiding structures with perches, avoiding guy wires that may kill birds or bats in flight, or avoiding lighting that may attract protected species at night. In addition, we will attempt to reduce the attractiveness of a site to predatory birds by site maintenance (e.g., by mowing or removal of animal and bird carcasses).
Where possible, we will obtain permits for incidental take of protected species. First Wind holds such permits for some of its wind projects, particularly in Hawaii, where several species are endangered and protected by law. First Wind is currently in discussions with the U.S. Fish & Wildlife Service, or “USFWS,” about obtaining incidental take permits for bald and golden eagles at locations with low to moderate risk of such events. First Wind is also discussing with USF&WS amending its incidental take permits for certain wind projects in Hawaii, where observed endangered species mortality has exceeded prior estimates and may exceed permit limits on such takings.
Excessive taking of protected species can result in requirements to implement mitigation strategies, including curtailment of operations. First Wind’s projects in Hawaii that we intend to acquire, several of which hold incidental take permits to authorize the incidental taking of small numbers of protected species, are subject to curtailment (i.e., reduction in operations) if excessive taking of protected species is detected through monitoring. At some of the projects in Hawaii, curtailment has been implemented, but not at levels that materially reduce electricity generation or revenues. Such curtailments (to protect bats) have reduced nighttime operation and limited operation to times when wind speeds are high enough to prevent bats from flying into a project’s blades. Based on continuing concerns about species other than bats, however, additional curtailments are possible at those locations.
Risks that are beyond our control, including but not limited to acts of terrorism or related acts of war, natural disasters, hostile cyber intrusions, theft or other catastrophic events, could have a material adverse effect on our business, financial condition, results of operations and cash flows.
Our solar energy generation facilities that we acquired for our initial portfolio or those that we otherwise acquire in the future, including the Call Right Projects and any ROFO Projects and the wind and solar projects we intend to acquire through the First Wind Acquisition, and the properties of unaffiliated third parties on which they may be located may be targets of terrorist activities, as well as
54
Table of Contents
events occurring in response to or in connection with them, that could cause environmental repercussions and/or result in full or partial disruption of the facilities’ ability to generate, transmit, transport or distribute electricity or natural gas. Strategic targets, such as energy-related facilities, may be at greater risk of future terrorist activities than other domestic targets. Hostile cyber intrusions, including those targeting information systems as well as electronic control systems used at the generating plants and for the related distribution systems, could severely disrupt business operations and result in loss of service to customers, as well as create significant expense to repair security breaches or system damage.
Furthermore, certain of the projects that we acquired for our Initial Portfolio or the Call Right Projects are located in active earthquake zones in Chile, California and Arizona, and our Sponsor and unaffiliated third parties from whom we may seek to acquire projects in the future may conduct operations in the same region or in other locations that are susceptible to natural disasters. The occurrence of a natural disaster, such as an earthquake, drought, flood or localized extended outages of critical utilities or transportation systems, or any critical resource shortages, affecting us, SunEdison or third parties from whom we may seek to acquire projects in the future, could cause a significant interruption in our business, damage or destroy our facilities or those of our suppliers or the manufacturing equipment or inventory of our suppliers.
Additionally, certain of our power generation assets and equipment are at risk for theft and damage. Although theft of equipment is rare, its occurrence can be significantly disruptive to our operations. For example, because we utilize copper wire as an essential component in our electricity generation and transportation infrastructure, we are at risk for copper wire theft, especially at our international projects, due to an increased demand for copper in the United States and internationally. Theft of copper wire or solar panels can cause significant disruption to our operations for a period of months and can lead to operating losses at those locations.
Any such terrorist acts, environmental repercussions or disruptions, natural disasters or theft incidents could result in a significant decrease in revenues or significant reconstruction, remediation or replacement costs, beyond what could be recovered through insurance policies, which could have a material adverse effect on our business, financial condition, results of operations and cash flows.
Our use and enjoyment of real property rights for our projects may be adversely affected by the rights of lienholders and leaseholders that are superior to those of the grantors of those real property rights to us.
Solar and wind projects generally are and are likely to be located on land occupied by the project pursuant to long-term easements and leases. The ownership interests in the land subject to these easements and leases may be subject to mortgages securing loans or other liens (such as tax liens) and other easement and lease rights of third parties (such as leases of oil or mineral rights) that were created prior to the project’s easements and leases. As a result, the project’s rights under these easements or leases may be subject, and subordinate, to the rights of those third parties. We perform title searches and obtain title insurance to protect ourselves against these risks. Such measures may, however, be inadequate to protect us against all risk of loss of our rights to use the land on which the wind projects are located, which could have a material adverse effect on our business, financial condition and results of operations.
Current or future litigation or administrative proceedings could have a material adverse effect on our business, financial condition and results of operations.
We have and continue to be involved in legal proceedings, administrative proceedings, claims and other litigation that arise in the ordinary course of business of operating our projects, and we will likely
55
Table of Contents
become subject to similar litigation when we acquire the wind projects upon consummation of the First Wind Acquisition. Individuals and interest groups may sue to challenge the issuance of a permit for a solar or wind energy project. In addition, a project may be subject to legal proceedings or claims contesting the operation of the wind projects. Unfavorable outcomes or developments relating to these proceedings, such as judgments for monetary damages, injunctions or denial or revocation of permits, could have a material adverse effect on our business, financial condition and results of operations. In addition, settlement of claims could adversely affect our financial condition and results of operations.
International operations subject us to political and economic uncertainties.
Our portfolio consists of solar projects located in the United States and its unincorporated territories, Canada, the United Kingdom and Chile. We intend to rapidly expand and diversify our current project portfolio by acquiring utility-scale and distributed clean generation assets located in the United States, Canada, the United Kingdom and Chile. As a result, our activities are subject to significant political and economic uncertainties that may adversely affect our operating and financial performance. These uncertainties include, but are not limited to:
| • | the risk of a change in renewable power pricing policies, possibly with retroactive effect; |
| • | measures restricting the ability of our facilities to access the grid to deliver electricity at certain times or at all; |
| • | the macroeconomic climate and levels of energy consumption in the countries where we have operations; |
| • | the comparative cost of other sources of energy; |
| • | changes in taxation policies and/or the regulatory environment in the countries in which we have operations, including reductions to renewable power incentive programs; |
| • | the imposition of currency controls and foreign exchange rate fluctuations; |
| • | high rates of inflation; |
| • | protectionist and other adverse public policies, including local content requirements, import/export tariffs, increased regulations or capital investment requirements; |
| • | changes to land use regulations and permitting requirements; |
| • | difficulty in timely identifying, attracting and retaining qualified technical and other personnel; |
| • | difficulty competing against competitors who may have greater financial resources and/or a more effective or established localized business presence; |
| • | difficulty in developing any necessary partnerships with local businesses on commercially acceptable terms; and |
| • | being subject to the jurisdiction of courts other than those of the United States, which courts may be less favorable to us. |
These uncertainties, many of which are beyond our control, could have a material adverse effect on our business, financial condition, results of operations and cash flows.
We may expand our international operations into countries where we currently have no presence, which would subject us to risks that may be specific to those new markets.
Since solar energy generation and other forms of clean energy are in the early stages of development and the industry is evolving rapidly, we could decide to expand into other international
56
Table of Contents
markets. Risks inherent in an expansion of operations into new international markets include the following:
| • | inability to work successfully with third parties having local expertise to develop and construct projects and operate plants; |
| • | restrictions on repatriation of earnings and cash; |
| • | multiple, conflicting and changing laws and regulations, including those relating to export and import, the power market, tax, the environment, labor and other government requirements, approvals, permits and licenses; |
| • | difficulties in enforcing agreements in foreign legal systems; |
| • | changes in general economic and political conditions, including changes in government-regulated rates and incentives relating to solar energy generation; |
| • | political and economic instability, including wars, acts of terrorism, political unrest, boycotts, sanctions and other business restrictions; |
| • | difficulties with, and extra-normal costs of, recruiting and retaining local individuals skilled in international business operations; |
| • | international business practices that may conflict with other customs or legal requirements to which we are subject, including anti-bribery and anti-corruption laws; |
| • | risk of nationalization or other expropriation of private enterprises and land; |
| • | financial risks, such as longer sales and payment cycles and greater difficulty collecting accounts receivable; |
| • | fluctuations in currency exchange rates; |
| • | high rates of inflation; |
| • | inability to obtain, maintain or enforce intellectual property rights; and |
| • | inability to obtain adequate financing on attractive terms and conditions. |
Doing business in new international markets will require us to be able to respond to rapid changes in the particular market, legal and political conditions in these countries. While we have gained significant experience from our international operations to date, we may not be able to timely develop and implement policies and strategies that will be effective in each international jurisdiction where we may decide to conduct business.
Changes in foreign withholding taxes could adversely affect our results of operations.
We conduct a portion of our operations in Canada, the United Kingdom and Chile, and may in the future expand our business into other foreign countries. We are subject to risks that foreign countries may impose additional withholding taxes or otherwise tax our foreign income. Currently, distributions of earnings and other payments, including interest, to us from our foreign projects could constitute ordinary dividend income taxable to the extent of our earnings and profits, which may be subject to withholding taxes imposed by the jurisdiction in which such entities are formed or operating. Any such withholding taxes will reduce the amount of after-tax cash we can receive. If those withholding taxes are increased, the amount of after-tax cash we receive will be further reduced.
We are exposed to foreign currency exchange risks because certain of our solar energy projects are located in foreign countries.
We generate a portion of our revenues and incur a portion of our expenses in currencies other than U.S. dollars. Changes in economic or political conditions in any of the countries in which we
57
Table of Contents
operate could result in exchange rate movement, new currency or exchange controls or other restrictions being imposed on our operations or expropriation. Because our financial results are reported in U.S. dollars, if we generate revenue or earnings in other currencies, the translation of those results into U.S. dollars can result in a significant increase or decrease in the amount of those revenues or earnings. To the extent that we are unable to match revenues received in foreign currencies with costs paid in the same currency, exchange rate fluctuations in any such currency could have an adverse effect on our profitability. Our debt service requirements are primarily in U.S. dollars even though a percentage of our cash flow is generated in other foreign currencies and therefore significant changes in the value of such foreign currencies relative to the U.S. dollar could have a material adverse effect on our financial condition and our ability to meet interest and principal payments on debts denominated in U.S. dollars. In addition to currency translation risks, we incur currency transaction risks whenever we or one of our projects enter into a purchase or sales transaction using a currency other than the local currency of the transacting entity.
Given the volatility of exchange rates, we cannot assure you that we will be able to effectively manage our currency transaction and/or translation risks. It is possible that volatility in currency exchange rates will have a material adverse effect on our financial condition or results of operations. We expect to experience economic losses and gains and negative and positive impacts on earnings as a result of foreign currency exchange rate fluctuations, particularly as a result of changes in the value of the Canadian dollar, the British pound and other currencies. We expect that our revenues denominated in non-U.S. dollar currencies will continue to increase in future periods.
Additionally, although a portion of our revenues and expenses are denominated in foreign currency, we will pay dividends to holders of our Class A common stock in U.S. dollars. The amount of U.S. dollar denominated dividends paid to our holders of our Class A common stock will therefore be exposed to currency exchange rate risk. Although we intend to enter into hedging arrangements to help mitigate some of this exchange rate risk, these arrangements may not be sufficient. Changes in the foreign exchange rates could have a material adverse effect on our results of operations and may adversely affect the amount of cash dividends paid by us to holders of our Class A common stock.
Our international operations require us to comply with anti-corruption laws and regulations of the United States government and various non-U.S. jurisdictions.
Doing business in multiple countries requires us and our subsidiaries to comply with the laws and regulations of the United States government and various non-U.S. jurisdictions. Our failure to comply with these rules and regulations may expose us to liabilities. These laws and regulations may apply to us, our subsidiaries, individual directors, officers, employees and agents, and those of our Sponsor, and may restrict our operations, trade practices, investment decisions and partnering activities. In particular, our non-U.S. operations are subject to United States and foreign anti-corruption laws and regulations, such as the Foreign Corrupt Practices Act of 1977, or the “FCPA.” The FCPA prohibits United States companies and their officers, directors, employees and agents acting on their behalf from corruptly offering, promising, authorizing or providing anything of value to foreign officials for the purposes of influencing official decisions or obtaining or retaining business or otherwise obtaining favorable treatment. The FCPA also requires companies to make and keep books, records and accounts that accurately and fairly reflect transactions and dispositions of assets and to maintain a system of adequate internal accounting controls. As part of our business, we deal with state-owned business enterprises, the employees and representatives of which may be considered foreign officials for purposes of the FCPA. As a result, business dealings between our or our Sponsor’s employees and any such foreign official could expose our company to the risk of violating anti-corruption laws even if such business practices may be customary or are not otherwise prohibited between our company and a private third party. Violations of these legal requirements are punishable by criminal fines and imprisonment, civil penalties, disgorgement of profits, injunctions, debarment from government
58
Table of Contents
contracts as well as other remedial measures. We have established policies and procedures designed to assist us and our personnel in complying with applicable United States and non-U.S. laws and regulations; however, we cannot assure you that these policies and procedures will completely eliminate the risk of a violation of these legal requirements, and any such violation (inadvertent or otherwise) could have a material adverse effect on our business, financial condition and results of operations.
In the future, we may acquire certain assets in which we have limited control over management decisions and our interests in such assets may be subject to transfer or other related restrictions.
We may seek to acquire additional assets in the future in which we own less than a majority of the related interests in the assets. In these investments, we will seek to exert a degree of influence with respect to the management and operation of assets in which we own less than a majority of the interests by negotiating to obtain positions on management committees or to receive certain limited governance rights, such as rights to veto significant actions. However, we may not always succeed in such negotiations, and we may be dependent on our co-venturers to operate such assets. Our co-venturers may not have the level of experience, technical expertise, human resources management and other attributes necessary to operate these assets optimally. In addition, conflicts of interest may arise in the future between us and our stockholders, on the one hand, and our co-venturers, on the other hand, where our co-venturers’ business interests are inconsistent with our interests and those of our stockholders. Further, disagreements or disputes between us and our co-venturers could result in litigation, which could increase our expenses and potentially limit the time and effort our officers and directors are able to devote to our business.
The approval of co-venturers also may be required for us to receive distributions of funds from assets or to sell, pledge, transfer, assign or otherwise convey our interest in such assets, or for us to acquire our Sponsor’s interests in such co-ventures as an initial matter. Alternatively, our co-venturers may have rights of first refusal or rights of first offer in the event of a proposed sale or transfer of our interests in such assets. These restrictions may limit the price or interest level for our interests in such assets, in the event we want to sell such interests.
Certain PPAs signed in connection with our utility-scale business are subject to public utility commission approval, and such approval may not be obtained or may be delayed.
As a renewable energy provider in the United States, the PPAs associated with our utility-scale projects are generally subject to approval by the applicable state public utility commission. It cannot be assured that such public utility commission approval will be obtained, and in certain markets, including California and Nevada, the public utility commissions have recently demonstrated a heightened level of scrutiny on renewable energy purchase agreements that have come before them for approval. If the required public utility commission approval is not obtained for any particular PPA, the utility counterparty may exercise its right to terminate such PPA, which could materially and adversely affect our business, financial condition, results of operations and cash flows.
We may not be able to renew our sale-leasebacks on similar terms. If we are unable to renew a sale-leaseback on acceptable terms we may be required to remove the solar energy assets from the project site subject to the sale-leaseback transaction or, alternatively, we may be required to purchase the solar energy assets from the lessor at unfavorable terms.
Provided the lessee is not in default, customary end of lease term provisions for sale-leaseback transactions obligate the lessee to (i) renew the sale-leaseback assets at fair market value, (ii) purchase the solar energy assets at fair market value or (iii) return the solar energy assets to the lessor. The cost of acquiring or removing a significant number of solar energy assets could be material. Further, we may not be successful in obtaining the additional financing necessary to purchase such
59
Table of Contents
solar energy assets from the lessor. Failure to renew our sale-leaseback transactions as they expire may have a material adverse effect on our business, financial condition, results of operations and cash flows.
The accounting treatment for many aspects of our solar energy business, and the wind business we expect to acquire upon consummation of the First Wind Acquisition, is complex and any changes to the accounting interpretations or accounting rules governing our solar energy business could have a material adverse effect on our GAAP reported results of operations and financial results.
The accounting treatment for many aspects of our solar energy business is complex, and our future results could be adversely affected by changes in the accounting treatment applicable to our solar energy business. In particular, any changes to the accounting rules regarding the following matters may require us to change the manner in which we operate and finance our business:
| • | revenue recognition and related timing; |
| • | intra-company contracts; |
| • | operation and maintenance contracts; |
| • | joint venture accounting, including the consolidation of joint venture entities and the inclusion or exclusion of their assets and liabilities on our balance sheet; |
| • | long-term vendor agreements; and |
| • | foreign holding company tax treatment. |
Negative public or community response to energy projects could adversely affect construction of our projects.
Negative public or community response to solar and other clean energy projects, including wind, could adversely affect our ability to acquire and operate our projects. Among concerns often cited by local community and other interest groups are objections to the aesthetic effect of plants on rural sites near residential areas, reduction of farmland and the possible displacement or disruption of wildlife. We expect this type of opposition to continue as we complete existing projects and acquire future projects. It is possible that we may also face resistance from aboriginal communities in connection with any proposed expansion onto sites that may be subject to land claims. Opposition to our requests for permits or successful challenges or appeals to permits issued to us could lead to legal, public relations and other drawbacks and costs that impede our ability to meet our growth targets, achieve commercial operations for a project on schedule and generate revenues.
Some of our and First Wind’s projects are and have been challenged at the development stage in administrative or judicial challenges from groups opposed to wind or solar energy projects on the basis of potential environmental, health or aesthetic impacts, noise or adverse effects on property values. In addition, continuing public opposition exists at some of our and First Wind’s projects, or has existed in the past. Our experience is that such opposition subsides over time after projects are completed and are operating, but there are cases where opposition, disputes and even litigation continue into the operating period and could lead to curtailment of a project or other project modifications.
The seasonality of our operations may affect our liquidity.
We will need to maintain sufficient financial liquidity to absorb the impact of seasonal variations in energy production or other significant events. Following the completion of this offering, we expect that our principal source of liquidity will be cash generated from our operating activities, the cash retained by us for working capital purposes out of the gross proceeds of this offering and borrowing capacity
60
Table of Contents
under our Term Loan and Revolver. Our quarterly results of operations may fluctuate significantly for various reasons, mostly related to economic incentives and weather patterns.
For instance, the amount of electricity our solar power generation assets produce is dependent in part on the amount of sunlight, or irradiation, where the assets are located. Because shorter daylight hours in winter months results in less irradiation, the generation of particular assets will vary depending on the season. Additionally, to the extent more of our power generation assets are located in the northern or southern hemisphere, overall generation of our entire asset portfolio could be impacted by seasonality. Further, time-of-day pricing factors vary seasonally which contributes to variability of revenues. We expect our portfolio of power generation assets to generate the lowest amount of electricity during the fourth quarter of each year. As a result, we expect our revenue and cash available for distribution to be lower during the fourth quarter. However, we expect aggregate seasonal variability to decrease if geographic diversity of our portfolio between the northern and southern hemisphere increases.
In addition, in Canada, the construction of solar energy systems may be concentrated during the second half of the calendar year, largely due to periodic reductions of the applicable minimum feed-in tariff and the fact that the coldest winter months are January through March, which impacts the amount of construction that occurs. In the United States, customers will sometimes make purchasing decisions towards the end of the year in order to take advantage of tax credits or for other budgetary reasons. If we fail to adequately manage the fluctuations in the timing of our projects, our business, financial condition or results of operations could be materially affected. The seasonality of our energy production may create increased demands on our working capital reserves and borrowing capacity under our Revolver during periods where cash generated from operating activities are lower. In the event that our working capital reserves and borrowing capacity under our Revolver are insufficient to meet our financial requirements, or in the event that the restrictive covenants in our Revolver restrict our access to such facilities, we may require additional equity or debt financing to maintain our solvency. Additional equity or debt financing may not be available when required or available on commercially favorable terms or on terms that are otherwise satisfactory to us, in which event our financial condition may be materially adversely affected.
Changes in tax laws may limit the current benefits of solar energy investment.
We face risks related to potential changes in tax laws that may limit the current benefits of solar energy investment. As discussed below in “Industry—Government Incentives for Solar Energy,” government incentives provide significant support for renewable energy sources such as solar energy, and a decrease in these tax benefits could increase the costs of investment in solar energy. For example, in 2013 the Czech Republic and Spain announced retroactive taxes for solar energy producers. If these types of changes are enacted in other countries as well, the costs of solar energy may increase.
Additionally, we receive grant payments for specified energy property from the U.S. Department of the Treasury in lieu of tax credits pursuant to Section 1603 of the American Recovery and Reinvestment Act of 2009, each, a “Section 1603 Grant.” As a condition to claiming a Section 1063 Grant, we are required to maintain compliance with the terms of the Section 1603 program for a period of five years beginning on the date the eligible solar energy property is placed in service. Failure to maintain compliance with the requirements of Section 1603 could result in recapture of all or a part of the amounts received under a Section 1603 Grant, plus interest.
61
Table of Contents
Risks Related to our Relationship with our Sponsor
Our Sponsor is our controlling stockholder and exercises substantial influence over TerraForm Power, and we are highly dependent on our Sponsor.
Our Sponsor beneficially owns all of our outstanding Class B common stock. Each share of our outstanding Class B common stock entitles our Sponsor to 10 votes on all matters presented to our stockholders generally. Following this offering, as a result of its ownership of our Class B common stock, our Sponsor will possess approximately % (or approximately % if the underwriters exercise in full their option to purchase additional shares of Class A common stock) of the combined voting power of our Class A common stock and Class B common stock even though our Sponsor will own only % of our Class A common stock, Class B common stock and Class B1 common stock on a combined basis (or approximately % if the underwriters exercise in full their option to purchase additional shares of Class A common stock). Our Sponsor has expressed its intention to maintain a controlling interest in us going forward. As a result of this ownership, our Sponsor has a substantial influence on our affairs and its voting power will constitute a large percentage of any quorum of our stockholders voting on any matter requiring the approval of our stockholders. Such matters include the election of directors, the adoption of amendments to our amended and restated certificate of incorporation and bylaws and approval of mergers or sale of all or substantially all of our assets. This concentration of ownership may also have the effect of delaying or preventing a change in control of our company or discouraging others from making tender offers for our shares, which could prevent stockholders from receiving a premium for their shares. In addition, our Sponsor, for so long as it and its controlled affiliates possess a majority of the combined voting power, has the power to appoint all of our directors. Our Sponsor also has a right to specifically designate up to two additional directors to our board of directors until such time as our Sponsor and its controlled affiliates cease to own shares representing a majority voting power in us. Our Sponsor may cause corporate actions to be taken even if its interests conflict with the interests of our other stockholders (including holders of our Class A common stock). See “Certain Relationships and Related Party Transactions—Procedures for Review, Approval and Ratification of Related-Person Transactions; Conflicts of Interest.”
Furthermore, we depend on the management and administration services provided by or under the direction of our Sponsor under the Management Services Agreement. Other than personnel designated as dedicated to us, SunEdison personnel and support staff that provide services to us under the Management Services Agreement are not be required to, and we do not expect that they will, have as their primary responsibility the management and administration of our business or act exclusively for us. Under the Management Services Agreement, our Sponsor has the discretion to determine which of its employees, other than the designated TerraForm Power personnel, will perform assignments required to be provided to us under the Management Services Agreement. Any failure to effectively manage our operations or to implement our strategy could have a material adverse effect on our business, financial condition, results of operations and cash flows. The Management Services Agreement will continue in perpetuity, until terminated in accordance with its terms. The non-compete provisions of the Management Services Agreement will survive termination indefinitely.
The Support Agreement provides us the option to purchase additional solar projects that have Projected FTM CAFD of at least $75.0 million from the completion of our IPO through the end of 2015 and $100.0 million during 2016, representing aggregate additional Projected FTM CAFD of $175.0 million. The Support Agreement also provides us a right of first offer with respect to the ROFO Projects. Additionally, we depend upon our Sponsor for the provision of management and administration services at all of our facilities. Any failure by our Sponsor to perform its requirements under these arrangements or the failure by us to identify and contract with replacement service providers, if required, could adversely affect the operation of our facilities and have a material adverse effect on our business, financial condition, results of operations and cash flows.
62
Table of Contents
We may not be able to consummate future acquisitions from our Sponsor.
Our ability to grow through acquisitions depends, in part, on our Sponsor’s ability to identify and present us with acquisition opportunities. While SunEdison established our company to hold and acquire a diversified suite of power generating assets, there are a number of factors which could materially and adversely impact the extent to which suitable acquisition opportunities are made available from our Sponsor.
In particular, the question of whether a particular asset is suitable is highly subjective and is dependent on a number of factors, including an assessment by our Sponsor relating to our liquidity position at the time, the risk profile of the opportunity and its fit with the balance of our portfolio. If our Sponsor determines that an opportunity is not suitable for us, it may still pursue such opportunity on its own behalf. In addition, on September 29, 2014, our Sponsor announced that it confidentially submitted a draft registration statement to the SEC relating to the proposed initial public offering of the common stock of a yieldco vehicle focused on owning contracted clean power generation assets in emerging markets, primarily in Asia (excluding Japan) and Africa. If this initial public offering is completed, our Sponsor would have obligations to present opportunities in these or other emerging markets to the other yieldco vehicle, or may otherwise determine that certain opportunities are more appropriate for the other yieldco vehicle than they are for us.
In making these determinations, our Sponsor may be influenced by factors that result in a misalignment or conflict of interest. See “Risks Related to our Business—We may not be able to effectively identify or consummate any future acquisitions on favorable terms, or at all. Additionally, even if we consummate acquisitions on terms that we believe are favorable, such acquisitions may in fact result in a decrease in cash available for distribution per Class A common share.”
Certain PPAs signed in connection with our Sponsor’s utility-scale business are subject to public utility commission approval, and such approval may not be obtained or may be delayed.
As a solar energy provider in the United States, the PPAs associated with our Sponsor’s utility-scale projects, including any developmental-stage wind projects our Sponsor acquires, as part of the First Wind Acquisition, are generally subject to approval by the applicable state public utility commission. Such public utility commission approval may not be obtained, and in certain markets, including California and Nevada, the public utility commissions have recently demonstrated a heightened level of scrutiny on solar energy purchase agreements that have come before them for approval. If the required public utility commission approval is not obtained for any particular PPA, the utility counterparty may exercise its right to terminate such PPA, which could materially and adversely affect our Sponsor’s business, financial condition, results of operations and cash flows.
The departure of some or all of our Sponsor’s employees, particularly executive officers or key employees, could prevent us from achieving our objectives.
Our growth strategy relies on our and our Sponsor’s executive officers and key employees for their strategic guidance and expertise in the selection of projects that we may acquire in the future. Because the solar power industry is relatively new, there is a scarcity of experienced executives and employees in the solar power industry and the clean energy industry more widely. Our future success will depend on the continued service of these individuals, including any key executives or employees who join our Sponsor as part of the expected acquisition of First Wind and who are expected to contribute key wind energy experience to our Sponsor. Our Sponsor has experienced departures of key professionals and personnel in the past and may do so in the future, and we cannot predict the impact that any such departures will have on our ability to achieve our objectives. The departure of a significant number of our Sponsor’s professionals or a material portion of its employees who perform services for us or on our behalf, or the failure to appoint qualified or effective successors in the event of such departures,
63
Table of Contents
could have a material adverse effect on our ability to achieve our objectives. The Management Services Agreement does not require our Sponsor to maintain the employment of any of its professionals or, except with respect to the dedicated TerraForm Power personnel, to cause any particular professional to provide services to us or on our behalf and our Sponsor may terminate the employment of any professional.
Our organizational and ownership structure may create significant conflicts of interest that may be resolved in a manner that is not in our best interests or the best interests of holders of our Class A common stock and that may have a material adverse effect on our business, financial condition, results of operations and cash flows.
Our organizational and ownership structure involves a number of relationships that may give rise to certain conflicts of interest between us and holders of our Class A common stock, on the one hand, and our Sponsor, on the other hand. We have entered into the Management Services Agreement with our Sponsor. Our executive officers are employees of our Sponsor and certain of them will continue to have equity interests in our Sponsor and, accordingly, the benefit to our Sponsor from a transaction between us and our Sponsor will proportionately inure to their benefit as holders of equity interests in our Sponsor. Our Sponsor is a related party under the applicable securities laws governing related party transactions and may have interests which differ from our interests or those of holders of our Class A common stock, including with respect to the types of acquisitions made, the timing and amount of dividends by TerraForm Power, the reinvestment of returns generated by our operations, the use of leverage when making acquisitions and the appointment of outside advisors and service providers. Any material transaction between us and our Sponsor (including the acquisition of the Call Right Projects and any ROFO Projects) are subject to our related party transaction policy, which will require prior approval of such transaction by our Corporate Governance and Conflicts Committee, as discussed in “Management—Committees of the Board of Directors—Corporate Governance and Conflicts Committee.” Those of our executive officers who continue to have economic interests in our Sponsor may be conflicted when advising our Corporate Governance and Conflicts Committee or otherwise participating in the negotiation or approval of such transactions. These executive officers have significant project- and industry-specific expertise that could prove beneficial to our Corporate Governance and Conflicts Committee’s decision-making process and the absence of such strategic guidance could have a material adverse effect on the Corporate Governance and Conflicts Committee’s ability to evaluate any such transaction. Furthermore, the creation of our Corporate Governance and Conflicts Committee and our related party transaction approval policy may not insulate us from derivative claims related to related party transactions and the conflicts of interest described in this risk factor. Regardless of the merits of such claims, we may be required to expend significant management time and financial resources in the defense thereof. Additionally, to the extent we fail to appropriately deal with any such conflicts, it could negatively impact our reputation and ability to raise additional funds and the willingness of counterparties to do business with us, all of which could have a material adverse effect on our business, financial condition, results of operations and cash flows.
The holder or holders of our IDRs may elect to cause Terra LLC to issue Class B1 units to it or them in connection with a resetting of target distribution levels related to the IDRs, without the approval of our Corporate Governance and Conflicts Committee or the holders of Terra LLC’s units, us as manager of Terra LLC, or our board of directors (or any committee thereof). This could result in lower distributions to holders of our Class A common stock.
The holder or holders of a majority of the IDRs (currently our Sponsor through a wholly owned subsidiary) have the right, if the Subordination Period has expired and if we have made cash distributions in excess of the then-applicable Third Target Distribution for each of the prior four consecutive fiscal quarters, to reset the initial target distribution levels at higher levels based on Terra
64
Table of Contents
LLC’s cash distribution levels at the time of the exercise of the reset election. The right to reset the target distribution levels may be exercised without the approval of the holders of Terra LLC’s units, us, as manager of Terra LLC, or our board of directors (or any committee thereof). Following a reset election, a baseline distribution amount will be calculated as an amount equal to the average cash distribution per Class A unit, Class B1 unit and Class B unit for the two consecutive fiscal quarters immediately preceding the reset election (such amount is referred to as the “Reset Minimum Quarterly Distribution”), and the target distribution levels will be reset to correspondingly higher levels based on percentage increases above the Reset Minimum Quarterly Distribution.
In connection with the reset election, the holders of the IDRs will receive Terra LLC Class B1 units and shares of our Class B1 common stock. Therefore, the reset of the IDRs will dilute existing stockholders’ ownership. This dilution of ownership may cause dilution of future distributions per share as a higher percentage of distributions per share would go to our Sponsor or a future owner of the IDRs if the IDRs are sold.
We anticipate that our Sponsor would exercise this reset right in order to facilitate acquisitions or internal growth projects that would not be sufficiently accretive to cash distributions without such conversion. However, it is possible that our Sponsor (or another holder) could exercise this reset election at a time when Terra LLC is experiencing declines in aggregate cash distributions or is expected to experience declines in its aggregate cash distributions. In such situations, the holder of the IDRs may desire to be issued Class B1 units rather than retain the right to receive incentive distributions based on the initial target distribution levels. As a result, a reset election may cause TerraForm Power (which holds all of Terra LLC’s Class A units), and, in turn, holders of our Class A common stock to experience a reduction in the amount of cash distributions that they would have otherwise received had Terra LLC not issued new Class B1 units to the holders of the IDRs in connection with resetting the target distribution levels. See “Certain Relations and Related Party Transactions—Amended and Restated Operating Agreement of Terra LLC—Distributions.”
The IDRs may be transferred to a third party without the consent of holders of Terra LLC’s units, us, as manager of Terra LLC, or our board of directors (or any committee thereof).
Our Sponsor may not sell, transfer, exchange, pledge (other than as collateral under its credit facilities) or otherwise dispose of the IDRs to any third party (other than its controlled affiliates) until after it has satisfied its $175.0 million aggregate Projected FTM CAFD commitment to us in accordance with the Support Agreement. Our Sponsor has pledged the IDRs as collateral under its existing credit agreement, but the IDRs may not be transferred upon foreclosure until after our Sponsor has satisfied its Projected FTM CAFD commitment to us. After that period, our Sponsor may transfer the IDRs to a third party at any time without the consent of the holders of Terra LLC’s units, us, as manager of Terra LLC, or our board of directors (or any committee thereof). However, our Sponsor has granted us a right of first refusal with respect to any proposed sale of IDRs to a third party (other than its controlled affiliates), which we may exercise to purchase the IDRs proposed to be sold on the same terms offered to such third party at any time within 30 days after we receive written notice of the proposed sale and its terms. If our Sponsor transfers the IDRs to a third party, our Sponsor would not have the same incentive to grow our business and increase quarterly distributions to holders of Class A common stock over time. For example, a transfer of IDRs by our Sponsor could reduce the likelihood of our Sponsor accepting offers made by us relating to assets owned by our Sponsor, as it would have less of an economic incentive to grow our business, which in turn would impact our ability to grow our portfolio.
65
Table of Contents
If we incur material tax liabilities, distributions to holders of our Class A common stock may be reduced, without any corresponding reduction in the amount of distributions paid to our Sponsor or other holders of the IDRs, Class B units and Class B1 units.
We are entirely dependent upon distributions we receive from Terra LLC in respect of the Class A units held by us for payment of our expenses and other liabilities. We must make provisions for the payment of our income tax liabilities, if any, before we can use the cash distributions we receive from Terra LLC to make distributions to our Class A common stockholders. If we incur material tax liabilities, our distributions to holders of our Class A common stock may be reduced. However, the cash available to make distributions to the holders of the Class B units and IDRs issued by Terra LLC (all of which are currently held by our Sponsor), or to the holders of any Class B1 units that may be issued by Terra LLC in connection with an IDR reset or otherwise, will not be reduced by the amount of our tax liabilities. As a result, if we incur material tax liabilities, distributions to holders of our Class A common stock may be reduced, without any corresponding reduction in the amount of distributions paid to our Sponsor or other holders of the IDRs, Class B units and Class B1 units of Terra LLC.
Our ability to terminate the Management Services Agreement early will be limited.
The Management Services Agreement provides that we may terminate the agreement upon 30 days prior written notice to our Sponsor upon the occurrence of any of the following: (i) our Sponsor defaults in the performance or observance of any material term, condition or covenant contained therein in a manner that results in material harm to us and the default continues unremedied for a period of 30 days after written notice thereof is given to our Sponsor; (ii) our Sponsor engages in any act of fraud, misappropriation of funds or embezzlement that results in material harm to us; (iii) our Sponsor is grossly negligent in the performance of its duties under the agreement and such negligence results in material harm to us; (iv) upon the happening of certain events relating to the bankruptcy or insolvency of our Sponsor; (v) upon the earlier to occur of the five-year anniversary of the date of the agreement and the end of any 12-month period ending on the last day of a calendar quarter during which we generated cash available for distribution in excess of $350 million; (vi) on such date as our Sponsor and its affiliates no longer beneficially hold more than 50% of the voting power of our capital stock; and (v) upon the date that our Sponsor experiences a change in control. Furthermore, if we request an amendment to the scope of services provided by our Sponsor under the Management Services Agreement and we are not able to agree with our Sponsor as to a change to the service fee resulting from a change in the scope of services within 180 days of the request, we will be able to terminate the agreement upon 30 days’ prior notice to our Sponsor.
We will not be able to terminate the agreement for any other reason, and the agreement continues in perpetuity until terminated in accordance with its terms. The Management Services Agreement includes non-compete provisions that prohibit us from engaging in certain activities competitive with our Sponsor’s power project development and construction business. These non-compete provisions will survive termination indefinitely. If our Sponsor’s performance does not meet the expectations of investors, and we are unable to terminate the Management Services Agreement, the market price of our Class A common stock could suffer.
If our Sponsor terminates the Management Services Agreement or defaults in the performance of its obligations under the agreement we may be unable to contract with a substitute service provider on similar terms, or at all.
We will rely on our Sponsor to provide us with management services under the Management Services Agreement and will not have independent executive, senior management or other personnel. The Management Services Agreement provides that our Sponsor may terminate the agreement upon 180 days prior written notice of termination to us if we default in the performance or observance of any material term, condition or covenant contained in the agreement in a manner that results in material
66
Table of Contents
harm to our Sponsor and the default continues unremedied for a period of 30 days after written notice of the breach is given to us. If our Sponsor terminates the Management Services Agreement or defaults in the performance of its obligations under the agreement, we may be unable to contract with a substitute service provider on similar terms or at all, and the costs of substituting service providers may be substantial. In addition, in light of our Sponsor’s familiarity with our assets, a substitute service provider may not be able to provide the same level of service due to lack of preexisting synergies. If we cannot locate a service provider that is able to provide us with substantially similar services as our Sponsor does under the Management Services Agreement on similar terms, it would likely have a material adverse effect on our business, financial condition, results of operation and cash flows.
Our Sponsor may offer Unpriced Call Right Projects to third parties or remove Call Right Projects identified in the Support Agreement and we must still agree on a number of additional matters covered by the Support Agreement.
Pursuant to the Support Agreement, our Sponsor has provided us with the right, but not the obligation, to purchase for cash certain solar projects from its project pipeline with aggregate Projected FTM CAFD of at least $175.0 million by the end of 2016. The Support Agreement identifies certain of the Call Right Projects, which we believe will collectively satisfy a majority of the total Projected FTM CAFD commitment. Our Sponsor may, however, remove a project from the Call Right Project list effective upon notice to us, if, in its reasonable discretion, a project is unlikely to be successfully completed. In that case, the Sponsor will be required to replace such project with one or more additional reasonably equivalent projects that have a similar economic profile.
The Support Agreement also provides that our Sponsor is required to offer us additional qualifying Call Right Projects from its pipeline on a quarterly basis until we have acquired Call Right Projects that are projected to generate the specified minimum amount of Projected FTM CAFD for each of the periods covered by the Support Agreement. These additional Call Right Projects must satisfy certain criteria, include being subject to a fully-executed PPA with a counterparty that, in our reasonable discretion, is creditworthy. The price for each Unpriced Call Right Project will be the fair market value. The Support Agreement provides that we will work with our Sponsor to mutually agree on the fair market value and Projected FTM CAFD of each Unpriced Call Right Project within a reasonable time after it is added to the list of identified Call Right Projects. If we are unable to agree on the fair market value or Projected FTM CAFD for a project within 90 calendar days after it is added to the list (or such shorter period as will still allow us to complete the call right exercise process), we or our Sponsor, upon written notice from either party, will engage a third-party advisor to determine the disputed item so that such material economic terms reflect common practice in the relevant market. The other economic terms with respect to our purchase of a Call Right Project will also be determined by mutual agreement or, if we are unable to reach agreement, by a third-party advisor. We may not achieve all of the expected benefits from the Support Agreement if we are unable to mutually agree with our Sponsor with respect to these matters. Until the price for a Call Right Project is agreed or determined, in the event our Sponsor receives a bona fide offer for a Call Right Project from a third party, we have the right to match the price offered by such third party and acquire such Call Right Project on the terms our Sponsor could obtain from the third party. In addition, our effective remedies under the Support Agreement may also be limited in the event that a material dispute with our Sponsor arises under the terms of the Support Agreement.
In addition, our Sponsor has agreed to grant us a right of first offer on any of the ROFO Projects that it determines to sell or otherwise transfer during the six-year period following the completion of our IPO. Under the terms of the Support Agreement, our Sponsor agrees to negotiate with us in good faith, for a period of 30 days, to reach an agreement with respect to any proposed sale of a ROFO Project for which we have exercised our right of first offer before it may sell or otherwise transfer such ROFO Project to a third party. However, our Sponsor will not be obligated to sell any of the ROFO Projects
67
Table of Contents
and, as a result, we do not know when, if ever, any ROFO Projects will be offered to us. Furthermore, in the event that our Sponsor elects to sell ROFO Projects, our Sponsor will not be required to accept any offer we make and may choose to sell the assets to a third party or not sell the assets at all.
The liability of our Sponsor is limited under our arrangements with it and we have agreed to indemnify our Sponsor against claims that it may face in connection with such arrangements, which may lead it to assume greater risks when making decisions relating to us than it otherwise would if acting solely for its own account.
Under the Management Services Agreement, our Sponsor will not assume any responsibility other than to provide or arrange for the provision of the services described in the Management Services Agreement in good faith. In addition, under the Management Services Agreement, the liability of our Sponsor and its affiliates will be limited to the fullest extent permitted by law to conduct involving bad faith, fraud, willful misconduct or gross negligence or, in the case of a criminal matter, action that was known to have been unlawful. In addition, we have agreed to indemnify our Sponsor to the fullest extent permitted by law from and against any claims, liabilities, losses, damages, costs or expenses incurred by an indemnified person or threatened in connection with our operations, investments and activities or in respect of or arising from the Management Services Agreement or the services provided by our Sponsor, except to the extent that the claims, liabilities, losses, damages, costs or expenses are determined to have resulted from the conduct in respect of which such persons have liability as described above. These protections may result in our Sponsor tolerating greater risks when making decisions than otherwise would be the case, including when determining whether to use leverage in connection with acquisitions. The indemnification arrangements to which our Sponsor is a party may also give rise to legal claims for indemnification that are adverse to us or holders of our Class A common stock.
Risks Inherent in an Investment in TerraForm Power, Inc.
We may not be able to continue paying comparable or growing cash dividends to holders of our Class A common stock in the future.
The amount of our cash available for distribution principally depends upon the amount of cash we generate from our operations, which will fluctuate from quarter to quarter based on, among other things:
| • | the level and timing of capital expenditures we make; |
| • | the completion of our ongoing construction activities on time and on budget; |
| • | the level of our operating and general and administrative expenses, including reimbursements to our Sponsor for services provided to us in accordance with the Management Services Agreement; |
| • | seasonal variations in revenues generated by the business; |
| • | our debt service requirements and other liabilities; |
| • | fluctuations in our working capital needs; |
| • | our ability to borrow funds and access capital markets; |
| • | restrictions contained in our debt agreements (including our project-level financing and, if applicable, our Revolver); and |
| • | other business risks affecting our cash levels. |
As a result of all these factors, we cannot guarantee that we will have sufficient cash generated from operations to pay a specific level of cash dividends to holders of our Class A common stock.
68
Table of Contents
Furthermore, holders of our Class A common stock should be aware that the amount of cash available for distribution depends primarily on our cash flow, and is not solely a function of profitability, which is affected by non-cash items. We may incur other expenses or liabilities during a period that could significantly reduce or eliminate our cash available for distribution and, in turn, impair our ability to pay dividends to holders of our Class A common stock during the period. Because we are a holding company, our ability to pay dividends on our Class A common stock is limited by restrictions on the ability of our subsidiaries to pay dividends or make other distributions to us, including restrictions under the terms of the agreements governing project-level financing. Our project-level financing agreements generally prohibit distributions from the project entities prior to COD and thereafter prohibit distributions to us unless certain specific conditions are met, including the satisfaction of financial ratios. Our Term Loan and Revolver also restrict our ability to declare and pay dividends if an event of default has occurred and is continuing or if the payment of the dividend would result in an event of default.
Terra LLC’s cash available for distribution will likely fluctuate from quarter to quarter, in some cases significantly, due to seasonality. See “Management’s Discussion and Analysis of Financial Condition and Results of Operations—Factors that Significantly Affect our Results of Operations and Business—Seasonality.” As result, we may cause Terra LLC to reduce the amount of cash it distributes to its members in a particular quarter to establish reserves to fund distributions to its members in future periods for which the cash distributions we would otherwise receive from Terra LLC would otherwise be insufficient to fund our quarterly dividend. If we fail to cause Terra LLC to establish sufficient reserves, we may not be able to maintain our quarterly dividend with respect to a quarter adversely affected by seasonality.
Finally, dividends to holders of our Class A common stock will be paid at the discretion of our board of directors. Our board of directors may decrease the level of or entirely discontinue payment of dividends. For a description of additional restrictions and factors that may affect our ability to pay cash dividends, please read “Cash Dividend Policy.”
We are a holding company and our only material asset is our interest in Terra LLC, and we are accordingly dependent upon distributions from Terra LLC and its subsidiaries to pay dividends and taxes and other expenses.
TerraForm Power is a holding company and has no material assets other than its ownership of membership interests in Terra LLC, a holding company that will have no material assets other than its interest in Terra Operating LLC, whose sole material assets are the projects that comprise our portfolio and the projects that we subsequently acquire. None of TerraForm Power, Terra LLC or Terra Operating LLC have any independent means of generating revenue. We intend to cause Terra Operating LLC’s subsidiaries to make distributions to Terra Operating LLC and, in turn, make distributions to Terra LLC, and, Terra LLC, in turn, to make distributions to TerraForm Power in an amount sufficient to cover all applicable taxes payable and dividends, if any, declared by us. To the extent that we need funds to pay a quarterly cash dividend to holders of our Class A common stock or otherwise, and Terra Operating LLC or Terra LLC is restricted from making such distributions under applicable law or regulation or is otherwise unable to provide such funds (including as a result of Terra Operating LLC’s operating subsidiaries being unable to make distributions), it could materially adversely affect our liquidity and financial condition and limit our ability to pay dividends to holders of our Class A common stock.
Market interest rates may have an effect on the value of our Class A common stock.
One of the factors that influences the price of shares of our Class A common stock will be the effective dividend yield of such shares (i.e., the yield as a percentage of the then market price of our shares) relative to market interest rates. An increase in market interest rates, which are currently at low levels relative to historical rates, may lead prospective purchasers of shares of our Class A common
69
Table of Contents
stock to expect a higher dividend yield. If market interest rates increase and we are unable to increase our dividend in response, including due to an increase in borrowing costs, insufficient cash available for distribution or otherwise, investors may seek alternative investments with higher yield, which would result in selling pressure on, and a decrease in the market price of, our Class A common stock. As a result, the price of our Class A common stock may decrease as market interest rates increase.
If we are deemed to be an investment company, we may be required to institute burdensome compliance requirements and our activities may be restricted, which may make it difficult for us to complete strategic acquisitions or effect combinations.
If we are deemed to be an investment company under the Investment Company Act of 1940, or the “Investment Company Act,” our business would be subject to applicable restrictions under the Investment Company Act, which could make it impractical for us to continue our business as contemplated.
We believe our company is not an investment company under Section 3(b)(1) of the Investment Company Act because we are primarily engaged in a non-investment company business, and we intend to conduct our operations so that we will not be deemed an investment company. However, if we were to be deemed an investment company, restrictions imposed by the Investment Company Act, including limitations on our capital structure and our ability to transact with affiliates, could make it impractical for us to continue our business as contemplated.
The market price and marketability of our shares may from time to time be significantly affected by numerous factors beyond our control, which may adversely affect our ability to raise capital through future equity financings.
The market price of our shares may fluctuate significantly. Many factors that are beyond our control may significantly affect the market price and marketability of our shares and may adversely affect our ability to raise capital through equity financings. These factors include, but are not limited to, the following:
| • | price and volume fluctuations in the stock markets generally; |
| • | significant volatility in the market price and trading volume of securities of registered investment companies, business development companies or companies in our sectors, which may not be related to the operating performance of these companies; |
| • | changes in our earnings or variations in operating results; |
| • | changes in regulatory policies or tax law; |
| • | operating performance of companies comparable to us; and |
| • | loss of funding sources. |
We are a “controlled company,” controlled by our Sponsor, whose interest in our business may be different from ours or yours.
Each share of our Class B common stock entitles our Sponsor or its controlled affiliates to 10 votes on matters presented to our stockholders generally. Our Sponsor owns all of our Class B common stock, representing % of our Class A common stock, Class B common stock and Class B1 common stock on a combined basis and representing approximately % of our combined voting power, based on the assumptions sets forth in “The Offering—Certain Assumptions,” including no exercise by the underwriters of their option to purchase additional shares. Therefore, our Sponsor will control a majority of the vote on all matters submitted to a vote of the stockholders, including the election of our directors, for the foreseeable future even if its ownership of our Class B common stock represents less than 50% of the outstanding Class A common stock, Class B common stock and Class
70
Table of Contents
B1 common stock on a combined basis. As a result, we are and will likely continue to be considered a “controlled company” for the purposes of the NASDAQ Global Select Market listing requirements. As a “controlled company,” we are permitted to opt out of the NASDAQ Global Select Market listing requirements that require (i) a majority of the members of our board of directors to be independent, (ii) that we establish a compensation committee and a nominating and governance committee, each comprised entirely of independent directors, and (iii) an annual performance evaluation of the nominating and governance and compensation committees. We rely on exceptions with respect to having a majority of independent directors, establishing a compensation committee or nominating committee and annual performance evaluations of such committees.
The NASDAQ Global Select Market listing requirements are intended to ensure that directors who meet the independence standard are free of any conflicting interest that could influence their actions as directors. As further described above in “—Risks Related to our Relationship with our Sponsor,” it is possible that the interests of our Sponsor may in some circumstances conflict with our interests and the interests of holders of our Class A common stock. Should our Sponsor’s interests differ from those of other stockholders, the other stockholders may not have the same protections afforded to stockholders of companies that are subject to all of the corporate governance rules for publicly-listed companies. Our status as a controlled company could make our Class A common stock less attractive to some investors or otherwise harm our stock price.
Provisions of our charter documents or Delaware law could delay or prevent an acquisition of us, even if the acquisition would be beneficial to holders of our Class A common stock, and could make it more difficult for you to change management.
Provisions of our amended and restated certificate of incorporation and bylaws may discourage, delay or prevent a merger, acquisition or other change in control that holders of our Class A common stock may consider favorable, including transactions in which such stockholders might otherwise receive a premium for their shares. This is because these provisions may prevent or frustrate attempts by stockholders to replace or remove members of our management. These provisions include:
| • | a prohibition on stockholder action through written consent once our Sponsor ceases to hold a majority of the combined voting power of our common stock; |
| • | a requirement that special meetings of stockholders be called upon a resolution approved by a majority of our directors then in office; |
| • | the right of our Sponsor as the holder of our Class B common stock, to appoint up to two additional directors to our board of directors; |
| • | advance notice requirements for stockholder proposals and nominations; and |
| • | the authority of the board of directors to issue preferred stock with such terms as the board of directors may determine. |
Section 203 of the Delaware General Corporation Law, or the “DGCL,” prohibits a publicly held Delaware corporation from engaging in a business combination with an interested stockholder, generally a person that together with its affiliates owns or within the last three years has owned 15% of voting stock, for a period of three years after the date of the transaction in which the person became an interested stockholder, unless the business combination is approved in a prescribed manner. As a result of these provisions in our charter documents and Delaware law, the price investors may be willing to pay in the future for shares of our Class A common stock may be limited. See “Description of Capital Stock—Antitakeover Effects of Delaware Law and our Certificate of Incorporation and Bylaws.”
Additionally, in order to ensure compliance with Section 203 of the FPA, our amended and restated certificate of incorporation prohibits any person from acquiring, without prior FERC authorization or the written consent of our board of directors, through this offering or in subsequent
71
Table of Contents
purchases other than secondary market transactions (i) an amount of our Class A or Class B1 common stock that, after giving effect to such acquisition, would allow such purchaser together with its affiliates (as understood for purposes of FPA Section 203) to exercise 10% or more of the total voting power of the outstanding shares of our Class A, Class B and Class B1 common stock in the aggregate, or (ii) an amount of our Class A common stock or Class B1 common stock as otherwise determined by our board of directors sufficient to allow such purchaser together with its affiliates to exercise control over our company. Any acquisition of our Class A common stock or Class B1 common stock in violation of this prohibition shall not be effective to transfer record, beneficial, legal or any other ownership of such common stock, and the transferee shall not be entitled to any rights as a stockholder with respect to such common stock (including, without limitation, the right to vote or to receive dividends with respect thereto). While we do not anticipate that this offering will result in the acquisition of 10% or greater voting power or a change of control with respect to us or any of our solar generation project companies, any such acquisition of 10% or greater voting power or change of control could require prior authorization from FERC under Section 203 the FPA. Furthermore, a “holding company” (as defined in PUHCA) and its “affiliates” (as defined in PUHCA) may be subject to restrictions on the acquisition of our Class A common stock or Class B1 common stock in secondary market transactions to which other acquirors are not subject. A purchaser of our securities which is a “holding company” or an “affiliate” or “associate company” of such a “holding company” (as defined in PUHCA) should seek their own legal counsel to determine whether a given purchase of our securities may require prior FERC approval. See “Business—Regulatory Matters.”
You may experience dilution of your ownership interest due to the future issuance of additional shares of our Class A common stock.
We are in a capital intensive business, and may not have sufficient funds to finance the growth of our business, future acquisitions or to support our projected capital expenditures. As a result, we may require additional funds from further equity or debt financings, including tax equity financing transactions or sales of preferred shares or convertible debt to complete future acquisitions, expansions and capital expenditures and pay the general and administrative costs of our business. In the future, we may issue our previously authorized and unissued securities, resulting in the dilution of the ownership interests of purchasers of our Class A common stock offered hereby. Under our amended and restated certificate of incorporation, we are authorized to issue 850,000,000 shares of Class A common stock, 140,000,000 shares of Class B common stock, 260,000,000 shares of Class B1 common stock and 50,000,000 shares of preferred stock with preferences and rights as determined by our board of directors. The potential issuance of additional shares of common stock or preferred stock or convertible debt may create downward pressure on the trading price of our Class A common stock. We may also issue additional shares of our Class A common stock or other securities that are convertible into or exercisable for our Class A common stock in future public offerings or private placements for capital raising purposes or for other business purposes, potentially at an offering price, conversion price or exercise price that is below the offering price for our Class A common stock in this offering.
If securities or industry analysts do not publish or cease publishing research or reports about us, our business or our market, or if they change their recommendations regarding our Class A common stock adversely, the stock price and trading volume of our Class A common stock could decline.
The trading market for our Class A common stock will be influenced by the research and reports that industry or securities analysts may publish about us, our business, our market or our competitors. If any of the analysts who may cover us change their recommendation regarding our Class A common stock adversely, or provide more favorable relative recommendations about our competitors, the price of our Class A common stock would likely decline. If any analyst who may cover us were to cease
72
Table of Contents
coverage of our company or fail to regularly publish reports on us, we could lose visibility in the financial markets, which in turn could cause the stock price or trading volume of our Class A common stock to decline.
Future sales of our common stock by our Sponsor, Riverstone or the Private Placement Purchasers may cause the price of our Class A common stock to fall.
The market price of our Class A common stock could decline as a result of sales of such shares (issuable to our Sponsor or Riverstone upon the exchange of some or all of its Class B units or Class B1 units of Terra LLC) by our Sponsor, Riverstone or the purchasers of shares in the private placements of our Class A common stock consummated concurrently with our IPO (the “IPO Private Placement Purchasers” and, together with the Acquisition Private Placement Purchasers, the “Private Placement Purchasers”) in the market, or the perception that these sales could occur. After the completion of this offering, we will have 850,000,000 shares of Class A common stock authorized and shares of Class A common stock outstanding. Approximately shares, or % of our total outstanding shares of Class A common stock, and all of the outstanding shares of our Class B common stock, are restricted from immediate resale under the lock-up agreements entered into between the holders thereof, including our Sponsor, executive officers, directors, Riverstone and the IPO Private Placement Purchasers, and the underwriters of this offering. These shares (including shares of Class A common stock issuable to our Sponsor or Riverstone upon the exchange of some or all of its Terra LLC Class B units or Class B1 units) will become available for sale following the expiration of the lock-up agreements, which, without the prior consent of the representatives of the underwriters, is 90 days after the date of the closing of this offering, subject to compliance with the applicable requirements of Rule 144 promulgated under the Securities Act.
The market price of our Class A common stock may also decline as a result of our Sponsor disposing or transferring some or all of our outstanding Class B common stock, which disposals or transfers would reduce our Sponsor’s ownership interest in, and voting control over, us. These sales might also make it more difficult for us to sell equity securities at a time and price that we deem appropriate. In connection with the First Wind Acquisition, our Sponsor is expected to issue $340.0 million of seller notes that, pursuant to their terms, may be converted into shares of our Class A common stock that are issued in exchange for Class B units and Class B common stock currently held by our Sponsor.
Our Sponsor, certain of its affiliates, Riverstone and the Private Placement Purchasers have certain registration rights with respect to shares of our Class A common stock issued or issuable upon the exchange of Class B units or Class B1 units of Terra LLC. We have filed a registration statement relating to the resale of the shares of our Class A common stock issued in the Acquisition Private Placement and such shares will be freely tradable without restriction by the Acquisition Private Placement Purchasers prior to the completion of this offering. The presence of additional shares of our Class A common stock trading in the public market, including as a result of the exercise of such registration rights, may have a material adverse effect on the market price of our securities. See “Certain Relationships and Related Party Transactions—Registration Rights Agreements.”
Our Sponsor has pledged the shares of Class B common stock that it owns to its lenders under its credit facility. If the lenders foreclose on these shares, the market price of our shares of Class A common stock could be materially adversely affected.
Our Sponsor has pledged all of the shares of Class B common stock that it owns to its lenders as security under its credit facility with Wells Fargo Bank, National Association, as administrative agent, Goldman Sachs Bank USA and Deutsche Bank Securities Inc., as joint lead arrangers and joint syndication agents, Goldman Sachs Bank USA, Deutsche Bank Securities Inc., Wells Fargo Securities, LLC and Macquarie Capital (USA) Inc., as joint bookrunners, and the lenders identified in the credit
73
Table of Contents
agreement. If SunEdison breaches certain covenants and obligations in its credit facility, an event of default could result and the lenders could exercise their right to accelerate all the debt under the credit facility and foreclose on the pledged shares (and a corresponding number of Class B units). While the pledged shares are subject to the 90-day lock-up restrictions described in “Shares Eligible for Future Sale—Lock-Up Agreements” and the restrictions on transfer described in “Certain Relationships and Related Party Transactions—Amended and Restated Operating Agreement of Terra LLC—Stock Lock-Up,” any future sale of the shares of Class A common stock received upon foreclosure of the pledged securities after the expiration of the lock-up periods could cause the market price of our Class A common stock to decline. In addition, because SunEdison owns a majority of the combined voting power of our common stock, the occurrence of an event of default, foreclosure, and a subsequent sale of all, or substantially all, of the shares of Class A common stock received upon foreclosure of the pledged securities could result in a change of control, even when such change may not be in the best interest of our stockholders.
We incur increased costs as a result of being a publicly traded company.
As a public company, we incur additional legal, accounting and other expenses that have not been reflected in our predecessor’s historical financial statements. In addition, rules implemented by the SEC and the NASDAQ Global Select Market have imposed various requirements on public companies, including establishment and maintenance of effective disclosure and financial controls and changes in corporate governance practices. Our management and other personnel need to devote a substantial amount of time to these compliance initiatives. These rules and regulations result in our incurring legal and financial compliance costs and will make some activities more time-consuming and costly.
Our legal, accounting and other expenses relating to being a publicly traded company will be paid for by our Sponsor under the Management Services Agreement without a fee for 2014, and with the relevant service fees for 2015, 2016 and 2017 capped at $4.0 million, $7.0 million, and $9.0 million, respectively. The Management Services Agreement does not have a fixed term, but may be terminated by us in certain circumstances, including upon the earlier to occur of (i) the five-year anniversary of the date of the agreement and (ii) the end of any 12-month period ending on the last day of a calendar quarter during which we generated cash available for distribution in excess of $350 million. Following the termination of the Management Services Agreement we will be required to pay for these expenses directly.
Our failure to achieve and maintain effective internal control over financial reporting in accordance with Section 404 of the Sarbanes-Oxley Act as a public company could have a material adverse effect on our business and share price.
Prior to completion of our IPO on July 23, 2014, we had not operated as a public company and had not had to independently comply with Section 404(a) of the Sarbanes-Oxley Act. We are required to meet these standards in the course of preparing our financial statements as of and for the year ended December 31, 2014, and our management is required to report on the effectiveness of our internal control over financial reporting for such year. Additionally, once we are no longer an emerging growth company, as defined by the JOBS Act, our independent registered public accounting firm will be required pursuant to Section 404(b) of the Sarbanes-Oxley Act to attest to the effectiveness of our internal control over financial reporting on an annual basis. The rules governing the standards that must be met for our management to assess our internal control over financial reporting are complex and require significant documentation, testing and possible remediation.
Internal control over financial reporting is a process designed to provide reasonable assurance regarding the reliability of financial reporting and the preparation of financial statements in accordance with generally accepted accounting principles. We are currently in the process of reviewing, documenting and testing our internal control over financial reporting, but we are not currently in
74
Table of Contents
compliance with, and we cannot be certain when we will be able to implement the requirements of Section 404(a). We may encounter problems or delays in implementing any changes necessary to make a favorable assessment of our internal control over financial reporting. In addition, we may encounter problems or delays in completing the implementation of any requested improvements and receiving a favorable attestation in connection with the attestation to be provided by our independent registered public accounting firm after we cease to be an emerging growth company. If we cannot favorably assess the effectiveness of our internal control over financial reporting, or if our independent registered public accounting firm is unable to provide an unqualified attestation report on our internal controls after we cease to be an emerging growth company, investors could lose confidence in our financial information and the price of our Class A common stock could decline.
Additionally, the existence of any material weakness or significant deficiency would require management to devote significant time and incur significant expense to remediate any such material weaknesses or significant deficiencies and management may not be able to remediate any such material weaknesses or significant deficiencies in a timely manner. The existence of any material weakness in our internal control over financial reporting could also result in errors in our financial statements that could require us to restate our financial statements, cause us to fail to meet our reporting obligations and cause shareholders to lose confidence in our reported financial information, all of which could materially and adversely affect our business and share price.
We are an “emerging growth company” and have elected in this prospectus, and may elect in future SEC filings, to comply with reduced public company reporting requirements, which could make our Class A common stock less attractive to investors.
We are an “emerging growth company,” as defined by the JOBS Act. For as long as we continue to be an emerging growth company, we may choose to take advantage of exemptions from various public company reporting requirements. These exemptions include, but are not limited to, (i) not being required to comply with the auditor attestation requirements of Section 404 of the Sarbanes-Oxley Act, (ii) reduced disclosure obligations regarding executive compensation in our periodic reports, proxy statements and registration statements, and (iii) exemptions from the requirements of holding a nonbinding advisory vote on executive compensation and stockholder approval of any golden parachute payments not previously approved. In this prospectus, we have elected to take advantage of certain of the reduced disclosure obligations regarding financial statements and executive compensation. In addition, Section 107(b) of the JOBS Act also provides that an emerging growth company can take advantage of the extended transition period provided in Section 7(a)(2)(B) of the Securities Act for complying with new or revised accounting standards. In other words, an emerging growth company can delay the adoption of certain accounting standards until those standards would otherwise apply to private companies. We are choosing to “opt in” to such extended transition period election under Section 107(b). Therefore we are electing to delay adoption of new or revised accounting standards, and as a result, we may choose to not comply with new or revised accounting standards on the relevant dates on which adoption of such standards is required for non-emerging growth companies. As a result of such election, our financial statements may not be comparable to the financial statements of other public companies.
We could be an emerging growth company for up to five years after the first sale of our common equity securities pursuant to an effective registration statement under the Securities Act, which such fifth anniversary will occur in 2019. However, if certain events occur prior to the end of such five-year period, including if we become a “large accelerated filer,” our annual gross revenues exceed $1.0 billion or we issue more than $1.0 billion of non-convertible debt in any three-year period, we would cease to be an emerging growth company prior to the end of such five-year period. We have taken advantage of certain of the reduced disclosure obligations regarding executive compensation in this prospectus and may elect to take advantage of other reduced burdens in future filings. As a result, the
75
Table of Contents
information that we provide to holders of our Class A common stock may be different than you might receive from other public reporting companies in which you hold equity interests. We cannot predict if investors will find our Class A common stock less attractive as a result of our reliance on these exemptions. If some investors find our Class A common stock less attractive as a result of any choice we make to reduce disclosure, there may be a less active trading market for our Class A common stock and the price for our Class A common stock may be more volatile.
Under the JOBS Act, emerging growth companies can delay adopting new or revised accounting standards until such time as those standards apply to private companies. We have elected to avail ourselves of this extended transition period for complying with new or revised accounting standards and, therefore, we will not be subject to the same new or revised accounting standards as other public companies that are not emerging growth companies.
Risks Related to Taxation
In addition to reading the following risk factors, if you are a non-U.S. investor, please read “United States Federal Income Tax Consequences to Non-U.S. Holders” for a more complete discussion of the expected material United States federal income tax consequences of owning and disposing of shares of our Class A common stock.
Tax provisions and policies supporting renewable energy could change at any time, and such changes may result in a material increase in our estimated future income tax liability.
Renewable generation assets currently benefit from various federal, state and local tax incentives, including ITCs, PTCs and a modified accelerated cost-recovery system of depreciation. The Code currently provides an ITC of 30% of the cost-basis of an eligible resource, including certain solar energy facilities placed in service prior to the end of 2016, which percentage is currently scheduled to be reduced to 10% for solar energy systems placed in service after December 31, 2016. The U.S. Congress could reduce, replace or eliminate the ITC. PTCs, or ITCs in lieu of PTCs, for wind generation assets apply only to projects the construction of which began prior to the end of 2013 and the U.S. Congress could fail to extend the termination of, renew or replace such incentives. Pending legislation would extend the begun-construction deadline one year to the end of 2014. In addition, we benefit from an accelerated tax depreciation schedule for our eligible solar energy projects. The U.S. Congress could in the future eliminate or modify such accelerated depreciation. Moreover, the cost-basis of eligible resources and projects acquired from our Sponsor may be reduced if a tax authority were to successfully challenge our transfer prices as not reflecting arms’ length prices, in which case the amount of our expected ITC and depreciation deductions would be reduced. Additionally, we may be required to repay a Section 1603 Grant, with interest, if the U.S. Treasury were to successfully challenge a solar energy property for which such a Section 1603 Grant has been made as not complying with the requirements of Section 1603.
Any reduction in our ITCs, PTCs or depreciation deductions as a result of a change in law or successful transfer pricing challenge, or any elimination or modification of the accelerated tax depreciation schedule, may result in a material increase in our estimated future income tax liability and may negatively impact our business, financial condition and results of operations.
Our future tax liability may be greater than expected if we do not generate NOLs sufficient to offset taxable income.
We expect to generate NOLs and NOL carryforwards that we can utilize to offset future taxable income. Based on our portfolio of assets that we expect will benefit from an accelerated tax depreciation schedule, and subject to tax obligations resulting from potential tax audits, we do not expect to pay significant United States federal income tax in the near term. However, in the event
76
Table of Contents
these losses are not generated as expected (including if our accelerated tax depreciation schedule for our eligible solar energy projects is eliminated or adversely modified), are successfully challenged by the United States Internal Revenue Service, or “IRS,” (in a tax audit or otherwise), or are subject to future limitations as a result of an “ownership change” as discussed below, our ability to realize these future tax benefits may be limited. Any such reduction, limitation, or challenge may result in a material increase in our estimated future income tax liability and may negatively impact our business, financial condition and operating results.
Our ability to use NOLs to offset future income may be limited.
Our ability to use NOLs generated in the future could be substantially limited if we were to experience an “ownership change” as defined under Section 382 of the Code. In general, an ownership change occurs if the aggregate stock ownership of certain holders (generally 5% holders, applying certain look-through and aggregation rules) increases by more than 50% over such holders’ lowest percentage ownership over a rolling three-year period. If a corporation undergoes an ownership change, its ability to use its pre-change NOL carryforwards and other pre-change deferred tax attributes to offset its post-change income and taxes may be limited. Future sales of our Class A common stock by SunEdison, as well as future issuances by us, could contribute to a potential ownership change.
A valuation allowance may be required for our deferred tax assets.
Our expected NOLs will be reflected as a deferred tax asset as they are generated until utilized to offset income. Valuation allowances may need to be maintained for deferred tax assets that we estimate are more likely than not to be unrealizable, based on available evidence at the time the estimate is made. Valuation allowances related to deferred tax assets can be affected by changes to tax laws, statutory tax rates and future taxable income levels and based on input from our auditors, tax advisors or regulatory authorities. In the event that we were to determine that we would not be able to realize all or a portion of our net deferred tax assets in the future, we would reduce such amounts through a charge to income tax expense in the period in which that determination was made, which could have a material adverse impact on our financial condition and results of operations and our ability to maintain profitability.
Distributions to holders of our Class A common stock may be taxable as dividends.
If we make distributions from current or accumulated earnings and profits as computed for U.S. federal income tax purposes, such distributions will generally be taxable to holders of our Class A common stock in the current period as ordinary dividend income for U.S. federal income tax purposes, eligible under current law for the lower tax rates applicable to qualified dividend income of non-corporate taxpayers. While we expect that a portion of our distributions to holders of our Class A common stock may exceed our current and accumulated earnings and profits as computed for U.S. federal income tax purposes and therefore constitute a non-taxable return of capital to the extent of a holder’s basis in our Class A common stock, this may not occur.
77
Table of Contents
CAUTIONARY STATEMENT CONCERNING FORWARD-LOOKING STATEMENTS
This prospectus contains forward-looking statements within the meaning of the federal securities laws. All statements other than statements of historical fact included in this prospectus are forward-looking statements. These statements relate to analyses and other information, which are based on forecasts of future results and estimates of amounts not yet determinable. These statements also relate to our future prospects, developments and business strategies. These forward-looking statements are identified by the use of terms and phrases such as “anticipate,” “believe,” “could,” “estimate,” “expect,” “intend,” “may,” “plan,” “predict,” “project,” “target,” “will” and similar terms and phrases, including references to assumptions. However, these words are not the exclusive means of identifying such statements. These statements are contained in many sections of this prospectus, including those entitled “Summary,” “Cash Dividend Policy,” “Management’s Discussion and Analysis of Financial Condition and Results of Operations,” and “Business.” Although we believe that our plans, intentions and expectations reflected in or suggested by such forward-looking statements are reasonable, we cannot assure you that we will achieve those plans, intentions or expectations. All forward-looking statements are subject to risks and uncertainties that may cause actual results to differ materially from those that we expected.
The following factors, among others, could cause our actual results, performance or achievements to differ from those set forth in the forward-looking statements:
| • | counterparties to our offtake agreements willingness and ability to fulfill their obligations under such agreements; |
| • | price fluctuations, termination provisions and buyout provisions related to our offtake agreements; |
| • | our ability to enter into contracts to sell power on acceptable terms as our offtake agreements expire; |
| • | delays or unexpected costs during the completion of construction of these projects; |
| • | our ability to complete the First Wind Acquisition and integrate the assets we intend to acquire in the First Wind Acquisition; |
| • | our ability to successfully identify, evaluate and consummate acquisitions; |
| • | government regulation, including compliance with regulatory and permit requirements and changes in market rules, rates, tariffs and environmental laws; |
| • | operating and financial restrictions placed on us and our subsidiaries related to agreements governing our indebtedness and other agreements of certain of our subsidiaries and project-level subsidiaries generally and in our Revolver and Term Loan; |
| • | our ability to borrow additional funds and access capital markets, as well as our substantial indebtedness and the possibility that we may incur additional indebtedness going forward; |
| • | our ability to compete against traditional and renewable energy companies; |
| • | hazards customary to the power production industry and power generation operations such as unusual weather conditions, catastrophic weather-related or other damage to facilities, unscheduled generation outages, maintenance or repairs, interconnection problems or other developments, environmental incidents, or electric transmission constraints and the possibility that we may not have adequate insurance to cover losses as a result of such hazards; |
| • | our ability to expand into new business segments or new geographies; and |
| • | our ability to operate our businesses efficiently, manage capital expenditures and costs tightly, manage risks related to international operations and generate earnings and cash flows from our asset-based businesses in relation to our debt and other obligations. |
78
Table of Contents
Additional factors that could cause actual results to differ materially from our expectations, or cautionary statements, are disclosed under the sections entitled “Risk Factors” and “Management’s Discussion and Analysis of Financial Condition and Results of Operations” in this prospectus. All written and oral forward-looking statements attributable to us, or persons acting on our behalf, are expressly qualified in their entirety by the cautionary statements contained in this prospectus under the heading “Risk Factors,” as well as other cautionary statements that are made from time to time in our other SEC filings and public communications. You should evaluate all forward-looking statements made in this prospectus in the context of these risks and uncertainties.
We caution you that the important factors referenced above may not contain all of the factors that are important to you. In addition, we cannot assure you that we will realize the results or developments we expect or anticipate or, even if substantially realized, that they will result in the consequences or affect us or our operations in the way we expect. The forward-looking statements included in this prospectus are made only as of the date hereof. We undertake no obligation to publicly update or revise any forward-looking statement as a result of new information, future events or otherwise, except as otherwise required by law.
79
Table of Contents
Assuming no exercise of the underwriters’ option to purchase additional shares of Class A common stock, we expect to receive approximately $ of net proceeds from the sale of the Class A common stock offered hereby, after deducting underwriting discounts and commissions but before offering expenses. If the underwriters exercise in full their option to purchase additional shares of Class A common stock, we estimate that additional net proceeds will be approximately $ , after deducting underwriting discounts and commissions.
The following table illustrates the sources and uses of funds assuming the consummation of the Acquisition Financing Transactions and the Acquisition Transactions. See “Unaudited Pro Forma Consolidated Financial Statements” for additional information.
| Sources of Funds |
Uses of Funds | |||||
| Class A Common Stock Offered Hereby |
Total Consideration of First Wind Acquisition |
|||||
| Acquisition Private Placement |
Refinance Term Loan |
|||||
| Senior Notes |
Fees and Expenses |
|||||
| General Corporate Purposes |
||||||
|
|
| |||||
| Total Sources |
Total Uses |
|||||
|
|
| |||||
We may not be able to complete the First Wind Acquisition on a timely basis or at all. This offering is not conditioned upon the completion of the First Wind Acquisition, and, to the extent the First Wind Acquisition is not completed, we will use the net proceeds from this offering for general corporate purposes, including to fund other acquisition opportunities that may become available to us. See “Recent Developments—Acquisition Transactions,” and “Risk Factors—Risks Related to the Acquisition Transactions.”
80
Table of Contents
The following table sets forth our predecessor’s cash and cash equivalents, restricted cash and consolidated capitalization as of September 30, 2014 on: (i) an historical basis and (ii) a pro forma basis to give effect to the Acquisition Transactions, the Acquisition Financing Transactions and the other adjustments described in the unaudited Pro Forma Consolidated Financial Statements set out herein.
You should read the following table in conjunction with the sections entitled “Use of Proceeds,” “Selected Historical Consolidated Financial Data,” “Unaudited Pro Forma Consolidated Financial Statements,” “Management’s Discussion and Analysis of Financial Condition and Results of Operations,” “Description of Certain Indebtedness” and our consolidated financial statements and related notes thereto included elsewhere in this prospectus.
| September 30, 2014 | ||||||||
| (in thousands, except share data) | Actual | Pro Forma | ||||||
| (unaudited) | ||||||||
| Cash and restricted cash(1) |
$ | 334,202 | $ | 345,073 | ||||
|
|
|
|
|
|||||
| Long-term debt (including current portion): |
||||||||
| Revolver |
$ | — | $ | — | ||||
| Term Loan |
299,250 | — | ||||||
| Project-level debt(2) |
1,004,784 | 1,093,046 | ||||||
| Senior Notes |
— | 800,000 | ||||||
|
|
|
|
|
|||||
| Total long-term debt (including current portion) |
$ | 1,304,034 | $ | 1,893,046 | ||||
| Shareholders’ Equity: |
||||||||
| Class A common stock, par value $0.01 per share, 850,000,000 shares authorized, 30,652,336 shares issued and outstanding, actual; |
$ | 271 | $ | 501 | ||||
| Class B common stock, par value $0.01 per share, 140,000,000 shares authorized, 64,526,654 shares issued and outstanding, actual and as adjusted |
645 | 645 | ||||||
| Class B1 common stock, par value $0.01 per share, 260,000,000 shares authorized, 5,840,000 shares issued and outstanding, actual and as adjusted |
58 | 58 | ||||||
| Preferred stock, par value $0.01 per share, 50,000,000 shares authorized, none issued and outstanding, actual and as adjusted |
— | — | ||||||
| Additional paid-in-capital |
317,482 | 992,752 | ||||||
| Accumulated Deficit |
(4,014 | ) | (36,585 | ) | ||||
| Accumulated Other Comprehensive Income (Loss) |
(931 | ) | (937 | ) | ||||
| Non-controlling interests |
817,774 | 940,306 | ||||||
|
|
|
|
|
|||||
| Total equity |
$ | 1,131,285 | $ | 1,896,740 | ||||
|
|
|
|
|
|||||
| Total capitalization |
$ | 2,435,319 | $ | 3,789,786 | ||||
|
|
|
|
|
|||||
| (1) | Amount includes non-current restricted cash of $7.3 million actual and pro forma. |
| (2) | See “Management’s Discussion and Analysis of Financial Condition and Results of Operations—Liquidity and Capital Resources—Sources of Liquidity—Project-Level Financing Arrangements.” |
These share numbers do not give effect to the exercise of the underwriters’ option to purchase additional shares of our Class A common stock.
81
Table of Contents
MARKET PRICE OF OUR CLASS A COMMON STOCK
Our Class A common stock began trading on the NASDAQ Global Select Market under the symbol “TERP” on July 18, 2014. Prior to that, there was no public market for our Class A common stock. The table below sets forth, for the periods indicated, the high and low sale prices per share of our Class A common stock since July 18, 2014.
| High | Low | |||||||
| Second Quarter(1) |
$ | 34.74 | $ | 21.58 | ||||
| First Quarter(2) |
$ | 34.34 | $ | 28.53 | ||||
| (1) | For the period from October 1, 2014 to December 5, 2014. |
| (2) | For the period from July 18, 2014 to September 30, 2014 |
The last reported trading price of our Class A common stock on December 5, 2014 was $30.99. As of December 5, 2014, we had approximately 48 holders of record of our Class A common stock. This number excludes owners for whom Class A common stock may be held in “street” name.
82
Table of Contents
You should read the following discussion of our cash dividend policy in conjunction with “Cautionary Statement Concerning Forward-Looking Statements” and “Risk Factors” for information regarding statements that do not relate strictly to historical or current facts and certain risks inherent in our business.
For additional information regarding our historical combined consolidated results of operations, you should refer to our audited historical combined consolidated financial statements as of and for the years ended December 31, 2012 and 2013 and unaudited historical combined consolidated financial statements as of and for the nine months ended September 30, 2013 and 2014 included elsewhere in this prospectus.
General
We intend to pay regular quarterly cash dividends to holders of our Class A common stock. We expect to pay a quarterly dividend on or about the 75th day following the expiration of each fiscal quarter to holders of our Class A common stock of record on or about the 60th day following the last day of such fiscal quarter. On October 27, 2014, we declared a quarterly dividend of $0.1717 per share on our outstanding Class A common stock payable on December 15, 2014 to holders of record on December 1, 2014. This amount represents a quarterly dividend of $0.2255 cents per share, or $0.90 per share on an annualized basis, prorated to adjust for a partial quarter as we consummated our IPO part-way through the quarter, on July 23, 2014.
We intend to cause Terra LLC to distribute approximately 85% of its CAFD to its members, including to us as the sole holder of the Class A units, to our Sponsor as the sole holder of the Class B units and to Riverstone as the holder of Class B1 units, pro rata based on the number of units held, and, if applicable, to the holders of the IDRs (all of which are currently held by our Sponsor). However, during the Subordination Period described below, the Class B units held by our Sponsor are deemed “subordinated” because for a three-year period, the Class B units will not be entitled to receive any distributions from Terra LLC until the Class A units and Class B1 units have received quarterly distributions in an amount equal to $0.2257 per unit, or the “Minimum Quarterly Distribution,” plus any arrearages in the payment of the Minimum Quarterly Distribution from prior quarters. The practical effect of the subordination of the Class B units is to increase the likelihood that during the Subordination Period there will be sufficient CAFD to pay the Minimum Quarterly Distribution on the Class A units (and Class B1 units, if any).
Our Sponsor has further agreed to forego any distributions on its Class B units declared prior to March 31, 2015, and thereafter has agreed to a reduction of distributions on its Class B units until the expiration of the Distribution Forbearance Period. The amount of the distribution reduction during the Distribution Forbearance Period is based on the percentage of the As Delivered CAFD compared to the expected CAFD attributable to the projects in our initial portfolio as of the IPO which were contributed by our Sponsor. The practical effect of this forbearance is to ensure that the Class A units
83
Table of Contents
will not be affected by delays in completion of the Contributed Construction Projects. For a description of the IDRs, the Subordination Period and the Distribution Forbearance Period, including the definitions of Subordination Period, As Delivered CAFD, Distribution Forbearance Period and CAFD Forbearance Threshold see “Certain Relationships and Related Party Transactions—Amended and Restated Operating Agreement of Terra LLC—Distributions.”
Rationale for our Dividend
In accordance with its operating agreement and our capacity as the sole managing member, we intend to cause Terra LLC to make regular quarterly cash distributions to its members in an amount equal to cash available for distribution generated during a particular quarter, less reserves for working capital needs and the prudent conduct of our business, and to use the amount distributed to us to pay regular quarterly dividends to holders of our Class A common stock.
Our cash available for distribution is likely to fluctuate from quarter to quarter, in some cases significantly, as a result of the seasonality of our assets, and maintenance and outage schedules, among other factors. Accordingly, during quarters in which Terra LLC generates cash available for distribution in excess of the amount necessary to distribute to us to pay our stated quarterly dividend, we may cause it to reserve a portion of the excess to fund its cash distribution in future quarters. In quarters in which we do not generate sufficient cash available for distribution to fund our stated quarterly cash dividend, if our board of directors so determines, we may use sources of cash not included in our calculation of cash available for distribution, such as net cash provided by financing activities, receipts from network upgrade reimbursements from certain United States utility projects, all or any portion of the cash on hand or, if applicable, borrowings under our Revolver, to pay dividends to holders of our Class A common stock. Although these other sources of cash may be substantial and available to fund a dividend payment in a particular period, we exclude these items from our calculation of cash available for distribution because we consider them non-recurring or otherwise not representative of the operating cash flows we typically expect to generate.
Limitations on Cash Dividends and our Ability to Change our Cash Dividend Policy
There is no guarantee that we will pay quarterly cash dividends to holders of our Class A common stock. We do not have a legal obligation to pay our initial quarterly dividend or any other dividend. Our cash dividend policy may be changed at any time and is subject to certain restrictions and uncertainties, including the following:
| • | As the sole managing member of Terra LLC, we and, accordingly, our board of directors will have the authority to establish, or cause Terra LLC to establish, cash reserves for working capital needs and the prudent conduct of our business, and the establishment of or increase in those reserves could result in a reduction in cash dividends from levels we currently anticipate pursuant to our stated cash dividend policy. These reserves may account for the fact that our project-level cash flows may vary from year to year based on, among other things, changes in prices under offtake agreements for energy and RECs and other environmental attributes, other project contracts, changes in regulated transmission rates, compliance with the terms of non-recourse project-level financing, including debt repayment schedules, the transition to market or recontracted pricing following the expiration of offtake agreements, domestic and international tax laws and tax rates, working capital requirements and the operating performance of the assets. Furthermore, our board of directors may increase, or cause Terra LLC to increase reserves to account for the seasonality that has historically existed in our assets’ cash flows and the variances in the pattern and frequency of distributions to us from our assets during the year. |
| • | Prior to Terra LLC making any cash distributions to its members, Terra LLC will reimburse our Sponsor and its affiliates for certain governmental charges they incur on our behalf pursuant |
84
Table of Contents
| to the Management Services Agreement. Terra LLC’s operating agreement will not limit the amount of governmental charges for which our Sponsor and its affiliates may be reimbursed. The Management Services Agreement provides that our Sponsor will determine in good faith the governmental charges that are allocable to us. Accordingly, the reimbursement of governmental charges and payment of fees, if any, to our Sponsor and its affiliates will reduce the amount of our cash available for distribution. |
| • | Section 170 of the DGCL allows our board of directors to declare and pay dividends on the shares of our Class A common stock either: |
| • | out of its surplus, as defined in and computed in accordance with the DGCL; or |
| • | in case there shall be no such surplus, out of its net profits for the fiscal year in which the dividend is declared and/or the preceding fiscal year. |
| • | We may lack sufficient cash to pay dividends to holders of our Class A common stock due to cash flow shortfalls attributable to a number of operational, commercial or other factors, including low availability, as well as increases in our operating and/or general and administrative expenses, principal and interest payments on our outstanding debt, income tax expenses, working capital requirements or anticipated cash needs at our project-level subsidiaries. |
| • | Terra LLC’s cash distributions to us and, as a result, our ability to pay or grow our dividends is dependent upon the performance of our subsidiaries and their ability to distribute cash to us. The ability of our project-level subsidiaries to make cash distributions to Terra LLC may be restricted by, among other things, the provisions of existing and future indebtedness, applicable state corporation laws and other laws and regulations. |
Our Ability to Grow our Business and Dividend
We intend to grow our business primarily through the acquisition of contracted clean power generation assets, which, we believe, will facilitate the growth of our cash available for distribution and enable us to increase our dividend per share over time. However, the determination of the amount of cash dividends to be paid to holders of our Class A common stock will be made by our board of directors and will depend upon our financial condition, results of operations, cash flow, long-term prospects and any other matters that our board of directors deems relevant.
We expect that we will rely primarily upon external financing sources, including commercial bank borrowings and issuances of debt and equity securities, to fund any future growth capital expenditures. To the extent we are unable to finance growth externally, our cash dividend policy could significantly impair our ability to grow because we do not currently intend to reserve a substantial amount of cash generated from operations to fund growth opportunities. If external financing is not available to us on acceptable terms, our board of directors may decide to finance acquisitions with cash from operations, which would reduce or even eliminate our cash available for distribution and, in turn, impair our ability to pay dividends to holders of our Class A common stock. To the extent we issue additional shares of capital stock to fund growth capital expenditures, the payment of dividends on those additional shares may increase the risk that we will be unable to maintain or increase our per share dividend level. There are no limitations in our bylaws or certificate of incorporation (other than a specified number of authorized shares), or under our Revolver, on our ability to issue additional shares of capital stock, including preferred stock that would have priority over our Class A common stock with respect to the payment of dividends. Additionally, the incurrence of additional commercial bank borrowings or other debt to finance our growth, such as in connection with the Acquisition Financing Transactions, will result in increased interest expense, which in turn may impact our cash available for distribution and, in turn, our ability to pay dividends to holders of our Class A common stock.
85
Table of Contents
Minimum Quarterly Distribution
The amended and restated operating agreement of Terra LLC provides that, during the Subordination Period, the holders of Class A units (and Class B1 units, if any), will have the right to receive the “Minimum Quarterly Distribution” of $0.2257 per unit for each whole quarter, or $0.9028 per unit on an annualized basis, before any distributions are made to the holders of Class B units. The payment of the full Minimum Quarterly Distribution on all of the Class A units, Class B1 units and Class B units to be outstanding after completion of this offering would require Terra LLC to have CAFD of approximately $ million per quarter, or $ million per year (assuming an 85% payout ratio). Terra LLC’s ability to make cash distributions at the Minimum Quarterly Distribution rate will be subject to the factors described above under “—Limitations on Cash Dividends.” The table below sets forth the amount of Class A units, Class B units and Class B1 units that will be outstanding immediately after this offering and the CAFD needed to pay the aggregate Minimum Quarterly Distribution on all of such units for a single fiscal quarter and a four-quarter period (assuming no exercise and full exercise of the underwriters’ option to purchase additional shares of Class A common stock):
| No exercise of option to purchase additional Class A common stock |
Full exercise of option to purchase additional Class A common stock |
|||||||||||||||||||||||
| Aggregate minimum quarterly distributions |
Aggregate minimum quarterly distributions |
|||||||||||||||||||||||
| Number of Units |
One Quarter |
Four Quarters |
Number of Units |
One Quarter |
Four Quarters |
|||||||||||||||||||
| Class A units |
$ | $ | $ | $ | ||||||||||||||||||||
| Class B units |
64,526,654 | 64,526,654 | ||||||||||||||||||||||
| Class B1 units |
5,840,00 | 5,840,00 | ||||||||||||||||||||||
|
|
|
|
|
|
|
|
|
|
|
|
|
|||||||||||||
| Total |
||||||||||||||||||||||||
|
|
|
|
|
|
|
|
|
|
|
|
|
|||||||||||||
Subordination of Class B Units
During the Subordination Period, holders of the Class B units are not entitled to receive any distribution until the Class A units and Class B1 units (if any) have received the Minimum Quarterly Distribution for the current quarter plus any arrearages in the payment of the Minimum Quarterly Distribution from prior quarters. The Class B units will not accrue arrearages.
To the extent Terra LLC does not pay the Minimum Quarterly Distribution on the Class A units and Class B1 units, holders of such units will not be entitled to receive such payments in the future except during the Subordination Period. To the extent Terra LLC has CAFD in any future quarter during the Subordination Period in excess of the amount necessary to pay the Minimum Quarterly Distribution to holders of its Class A units and Class B1 units, Terra LLC will use this excess cash to pay any distribution arrearages on Class A units and Class B1 units related to prior quarters ending during the Subordination Period before any cash distribution is made to holders of Class B units. After the Subordination Period ends, Class A units and Class B1 units will not accrue arrearages. Please read “Certain Relationships and Related Party Transactions—Amended and Restated Operating Agreement of Terra LLC—Distributions—Subordination Period.”
86
Table of Contents
UNAUDITED PRO FORMA CONSOLIDATED FINANCIAL STATEMENTS
The Unaudited Pro Forma Consolidated Statement of Operations for the year ended December 31, 2013 and the nine months ended September 30, 2014 have been derived from the financial data of TerraForm Power, Inc. and its Predecessor (as derived from historical financial statements appearing elsewhere in this prospectus) and give pro forma effect to (i) certain historical items relating to the IPO and (ii) the Acquisition Transactions (as defined below) and the Acquisition Financing Transactions (as defined below), including the use of the estimated net proceeds from this offering as if they had occurred on January 1, 2013. The Unaudited Pro Forma Consolidated Balance Sheet as of September 30, 2014 gives effect to the Acquisition Transactions and the Acquisition Financing Transactions, including the use of the estimated proceeds from this offering, as if they had occurred on such date.
The Acquisition Transactions for which we have made pro forma adjustments are as follows:
| • | the acquisition of the Fairwinds and Crundale Call Right Projects from SunEdison, or the “Acquired Call Right Projects”; |
| • | the acquisition of certain assets from third parties, including the Capital Dynamics Acquisition, the Hudson Energy Acquisition and the First Wind Acqusition (the “Acquired Projects” and, together with the Acquired Call Right Projects, the “Acquisition Transactions”). |
The Acquisition Financing Transactions for which we have made pro forma adjustments are as follows:
| • | adjustments to reflect the payment of approximately $35 million, plus an estimate for working capital, for the Hudson Energy Acquisition, which we financed with available cash on hand; |
| • | adjustments to reflect the payment of approximately $250 million, plus an estimate for working capital, for the Capital Dynamics Acquisition; |
| • | adjustments to reflect the $275 million increase of the Term Loan; |
| • | adjustments to reflect the payment of approximately $850 million for the First Wind Acquisition, plus approximately $12 million of debt breakage fees. |
| • | adjustments to reflect estimated net proceeds of approximately $338 million from this offering, $338 million of net proceeds from the Acquisition Private Placement, and the assumed issuance of $800 million of senior unsecured notes (“Senior Notes”) (collectively, the “First Wind Acquisition Financing” and, together with the Capital Dynamics Acquisition Financing, the “Acquisition Financing Transactions”); |
The pro forma adjustments we have made in respect of the Acquired Projects are as follows:
| • | adjustments to record acquired assets and assumed liabilities at their fair value; |
| • | adjustments to reflect depreciation and amortization of fair value adjustments for acquired property, plant and equipment, intangible assets, and debt assumed; and |
| • | adjustments to reflect operating activity. |
The pro forma financial statements were based on, and should be read in conjunction with:
| • | the accompanying notes to the Unaudited Pro Forma Consolidated Financial Statements; |
| • | the combined consolidated financial statements of our Predecessor for the year ended December 31, 2013 and the notes relating thereto, included elsewhere in this prospectus; |
87
Table of Contents
| • | the consolidated financial statements of TerraForm Power, Inc. for the nine months ended September 30, 2014 and the notes relating thereto, included elsewhere in this prospectus; and |
| • | the consolidated financial statements of Acquired Projects purchased from third parties for the year ended December 31, 2013 and for the periods indicated in Note 2 of the Unaudited Pro Forma Consolidated Statements of Operations for the nine months ended September 30, 2014, and the notes relating thereto, included elsewhere in this prospectus. |
The historical consolidated financial statements have been adjusted in the pro forma financial statements to give pro forma effect to events that are (1) directly attributable to the items described above, (2) factually supportable and (3) with respect to the pro forma statements of operations, expected to have a continuing impact on the consolidated results.
As described in the accompanying notes, the Unaudited Consolidated Pro Forma Financial Statements have been prepared using the acquisition method of accounting under existing GAAP. The purchase price will be allocated to the assets and liabilities acquired based upon their estimated fair values as of the date of completion of the applicable Acquisition Transactions. The allocation is dependent on certain valuations and other studies that have not progressed to a stage where there is sufficient information to make a final definitive allocation. A final determination of the fair value of the Acquired Projects’ assets and liabilities, which cannot be made prior to the completion of the Acquisition Transactions, will be based on the actual net tangible and intangible assets of the Acquired Projects that existed as of the date of completion of the applicable Acquisition Transactions. Accordingly, the pro forma purchase price adjustments are preliminary, subject to future adjustments, and have been made solely for the purpose of providing the pro forma financial information presented below. Adjustments to these preliminary estimates are expected to occur and these adjustments could have a material impact on the accompanying pro forma financial statements, although we do not expect the adjustments to have a material effect on the Company’s future results of operations and financial position.
The pro forma financial statements are presented for informational purposes only. The pro forma financial statements do not purport to represent what our results of operations or financial condition would have been had the Acquisition Transactions to which the pro forma adjustments relate actually occurred on the dates indicated, and they do not purport to project our results of operations or financial condition for any future period or as of any future date.
The unaudited pro forma consolidated balance sheet and statement of operations should be read in conjunction with the sections entitled “Recent Developments,” “Use of Proceeds,” “Capitalization,” “Selected Historical Combined Consolidated Financial Data,” “Management’s Discussion and Analysis of Financial Condition and Results of Operations” and our historical consolidated financial statements and related notes thereto included elsewhere in this prospectus.
88
Table of Contents
Unaudited Pro Forma Consolidated Statement of Operations
For the Nine Months Ended September 30, 2014
| Pro Forma Adjustments | TerraForm Power, Inc. Pro Forma |
|||||||||||||||||||||||
| (in thousands, except shares and per share data) |
TerraForm Power, Inc. |
Combined Acquired Call Right Projects(1) |
Combined Acquired 3rd Party Projects(2) |
Acquisition Adjustments |
Acquisition Financing Transactions |
|||||||||||||||||||
| Statement of Operations Data: |
||||||||||||||||||||||||
| Operating revenues: |
||||||||||||||||||||||||
| Energy |
$ | 59,692 | $ | 893 | $ | 121,348 | $ | (38,501 | )(3) | $ | — | $ | 143,432 | |||||||||||
| Incentives |
22,832 | — | 8,275 | 24,167 | (3) | — | 55,274 | |||||||||||||||||
| Incentives—affiliate |
774 | — | — | — | — | 774 | ||||||||||||||||||
|
|
|
|
|
|
|
|
|
|
|
|
|
|||||||||||||
| Total operating revenues |
83,298 | 893 | 129,623 | (14,334 | ) | — | 199,480 | |||||||||||||||||
| Operating costs and expenses: |
||||||||||||||||||||||||
| Cost of operations |
6,051 | — | 53,585 | — | — | 59,636 | ||||||||||||||||||
| Cost of operations—affiliate |
3,911 | — | — | — | — | 3,911 | ||||||||||||||||||
| General and administrative |
3,767 | — | 10,663 | — | — | 14,430 | ||||||||||||||||||
| General and administrative—affiliate |
8,783 | — | — | — | — | 8,783 | ||||||||||||||||||
| Acquisition costs |
2,537 | — | — | (2,537 | )(4) | — | — | |||||||||||||||||
| Acquisition costs—affiliate |
2,826 | — | — | (2,826 | )(4) | — | — | |||||||||||||||||
| Formation and offering related fees and expenses |
3,399 | — | — | — | — | 3,399 | ||||||||||||||||||
| Depreciation, amortization and accretion |
21,053 | 353 | 61,830 | (13,635 | )(5) | — | 69,601 | |||||||||||||||||
|
|
|
|
|
|
|
|
|
|
|
|
|
|||||||||||||
| Total operating costs and expenses |
52,327 | 353 | 126,078 | (18,998 | ) | — | 159,760 | |||||||||||||||||
|
|
|
|
|
|
|
|
|
|
|
|
|
|||||||||||||
| Operating income |
30,971 | 540 | 3,545 | 4,664 | — | 39,720 | ||||||||||||||||||
| Other (income) expense: |
||||||||||||||||||||||||
| Interest expense, net |
53,217 | — | 60,903 | (37,582 | )(6) | 25,730 | (9) | 102,268 | ||||||||||||||||
| Loss/(Gain) on extinguishment of debt, net |
(7,635 | ) | — | — | — | — | (7,635 | ) | ||||||||||||||||
| Loss on foreign currency exchange, net |
6,914 | — | 189 | — | — | 7,103 | ||||||||||||||||||
| Other, net |
582 | — | 12,891 | — | — | 13,473 | ||||||||||||||||||
|
|
|
|
|
|
|
|
|
|
|
|
|
|||||||||||||
| Total other (income) expense |
53,078 | — | 73,983 | (37,582 | ) | 25,730 | 115,209 | |||||||||||||||||
|
|
|
|
|
|
|
|
|
|
|
|
|
|||||||||||||
| Income (loss) before income tax benefit |
(22,107 | ) | 540 | (70,438 | ) | 42,246 | (25,730 | ) | (75,489 | ) | ||||||||||||||
| Income tax benefit |
(4,069 | ) | — | 698 | 3,338 | (7) | — | (33 | ) | |||||||||||||||
|
|
|
|
|
|
|
|
|
|
|
|
|
|||||||||||||
| Net (loss) income |
(18,038 | ) | 540 | (71,136 | ) | 38,908 | (25,730 | ) | (75,456 | ) | ||||||||||||||
| Less net loss attributable to non-controlling interests |
(3,667 | ) | — | (18,029 | ) | (25,845 | )(8) | — | (47,541 | ) | ||||||||||||||
|
|
|
|
|
|
|
|
|
|
|
|
|
|||||||||||||
| Net loss attributable to TerraForm Power, Inc. |
$ | (14,371 | ) | $ | 540 | $ | (53,107 | ) | $ | 64,753 | $ | (25,730 | ) | $ | (27,915 | ) | ||||||||
|
|
|
|
|
|
|
|
|
|
|
|
|
|||||||||||||
| Pro Forma basic and diluted loss per share(10) |
$ | (0.56) | ||||||||||||||||||||||
|
|
|
|||||||||||||||||||||||
| Pro Forma weighted average shares outstanding(10) |
50,026,795 | |||||||||||||||||||||||
|
|
|
|||||||||||||||||||||||
89
Table of Contents
Notes to the Unaudited Pro Forma Consolidated Statements of Operations
| (1) | Represents the acquisition of Fairwinds and Crundale Call Rights projects from SunEdison. |
| (2) | The following table represents the consolidating schedule of Acquired Projects results reflected in the Unaudited Pro Forma Consolidated Statement of Operations for the nine months ended September 30, 2014: |
| For the Period Ended(a) | Combined Acquired 3rd Party Projects |
|||||||||||||||||||||||||||||||||||
| 3/31/14 | 3/31/14 | 3/31/14 | 3/31/14 | 3/31/14 | 6/30/2014 | 9/30/2014 | ||||||||||||||||||||||||||||||
| (in thousands) | Nellis | CalRenew-1 | Atwell Island |
Summit Solar |
Stonehenge Group(b) |
Mt. Signal |
First Wind |
All Other(c) |
||||||||||||||||||||||||||||
| Statement of Operations Data: |
||||||||||||||||||||||||||||||||||||
| Operating Revenues |
||||||||||||||||||||||||||||||||||||
| Energy Revenues |
$ | 154 | $ | 470 | $ | 864 | $ | 725 | $ | 341 | $ | 23,032 | $ | 70,662 | $ | 25,100 | $ | 121,348 | ||||||||||||||||||
| Incentive Revenues |
1,524 | — | — | 742 | 562 | — | — | 5,447 | 8,275 | |||||||||||||||||||||||||||
|
|
|
|
|
|
|
|
|
|
|
|
|
|
|
|
|
|
|
|||||||||||||||||||
| Total operating revenues |
1,678 | 470 | 864 | 1,467 | 903 | 23,032 | 70,662 | 30,547 | 129,623 | |||||||||||||||||||||||||||
| Operating costs and expenses: |
||||||||||||||||||||||||||||||||||||
| Cost of operations |
96 | 100 | 19 | 97 | 114 | 4,783 | 40,216 | 8,160 | 53,585 | |||||||||||||||||||||||||||
| Depreciation and accretion |
1,061 | 136 | 756 | 706 | 627 | 11,440 | 33,947 | 13,157 | 61,830 | |||||||||||||||||||||||||||
| General and administrative |
89 | — | 268 | 266 | 159 | 714 | 5,074 | 4,093 | 10,663 | |||||||||||||||||||||||||||
|
|
|
|
|
|
|
|
|
|
|
|
|
|
|
|
|
|
|
|||||||||||||||||||
| Total operating costs and expenses |
1,246 | 236 | 1,043 | 1,069 | 900 | 16,937 | 79,237 | 25,410 | 126,078 | |||||||||||||||||||||||||||
|
|
|
|
|
|
|
|
|
|
|
|
|
|
|
|
|
|
|
|||||||||||||||||||
| Operating income |
432 | 234 | (179 | ) | 398 | 3 | 6,095 | (8,575 | ) | 5,137 | 3,545 | |||||||||||||||||||||||||
| Other expense (income): |
||||||||||||||||||||||||||||||||||||
| Interest expense, net |
750 | 475 | 348 | 443 | 683 | 19,631 | 28,402 | 10,171 | 60,903 | |||||||||||||||||||||||||||
| Other (income) expense |
— | — | — | — | (225 | ) | 189 | 12,449 | (d) | 667 | 13,080 | |||||||||||||||||||||||||
|
|
|
|
|
|
|
|
|
|
|
|
|
|
|
|
|
|
|
|||||||||||||||||||
| Total other expense, net |
750 | 475 | 348 | 443 | 458 | 19,820 | 40,851 | 10,838 | 73,983 | |||||||||||||||||||||||||||
|
|
|
|
|
|
|
|
|
|
|
|
|
|
|
|
|
|
|
|||||||||||||||||||
| Income before income benefit |
(318 | ) | (241 | ) | (527 | ) | (45 | ) | (455 | ) | (13,725 | ) | (49,426 | ) | (5,701 | ) | (70,438 | ) | ||||||||||||||||||
| Income tax expense (benefit) |
— | — | — | — | (33 | ) | — | — | 731 | 698 | ||||||||||||||||||||||||||
|
|
|
|
|
|
|
|
|
|
|
|
|
|
|
|
|
|
|
|||||||||||||||||||
| Net loss |
(318 | ) | (241 | ) | (527 | ) | (45 | ) | (422 | ) | (13,725 | ) | (49,426 | ) | (6,432 | ) | (71,136 | ) | ||||||||||||||||||
|
|
|
|
|
|
|
|
|
|
|
|
|
|
|
|
|
|
|
|||||||||||||||||||
| Less net loss attributable to non-controlling interests |
— | — | — | (1 | ) | — | (12,807 | ) | (2,110 | ) | (3,111 | ) | (18,029 | ) | ||||||||||||||||||||||
|
|
|
|
|
|
|
|
|
|
|
|
|
|
|
|
|
|
|
|||||||||||||||||||
| Net loss attributable to TerraForm Power, Inc. |
$ | (318 | ) | $ | (241 | ) | $ | (527 | ) | $ | (44 | ) | $ | (422 | ) | $ | (918 | ) | $ | (47,316 | ) | $ | (3,321 | ) | $ | (53,107 | ) | |||||||||
|
|
|
|
|
|
|
|
|
|
|
|
|
|
|
|
|
|
|
|||||||||||||||||||
| (a) | Periods presented are for the interim period through the quarter end date prior to acquisition. |
| (b) | The statements of operations for the three months ended March 31, 2014 have been translated from British pounds (GBP) to U.S. dollars (USD) at a rate of $1.655 USD/GBP. |
| (c) | Represents the combined results of operations of individually insignificant acquisitions for periods prior to acquisition |
| (d) | Represents the net of gains or losses on the sale of assets, losses on disposal and impairment of assets, losses on early extinguishments of debt, settlements, and other income reflected in the historical results of First Wind. |
| (3) | Amortization of power purchase agreements intangible—Represents amortization of acquired off-market PPAs and incentive arrangements over the terms of such agreements resulting from fair value adjustments of the Acquired Projects, and a reclassification of green energy credit revenue for Acquired Projects from energy revenues to incentive revenues to conform accounting policies. The estimate of the amortization of the PPA intangible is preliminary, subject to change and could vary materially from the actual adjustment at the time the acquisition is completed. |
| (4) | Acquisition costs—Represents adjustments to remove acquisition costs reflected in the historical financial statements. |
| (5) | Depreciation and amortization—Represents the net depreciation expense resulting from the fair value adjustments of the Acquired Projects’ property, plant and equipment. The fair values of |
90
Table of Contents
| property, plant and equipment acquired were valued primarily using a cost approach and limited to what is economically supportable as indicated by an income approach. Under this approach, the fair value approximates the current cost of replacing an asset with another of equivalent economic utility adjusted for functional obsolescence and physical depreciation. The estimate is preliminary, subject to change and could vary materially from the actual adjustment at the time the acquisition is completed. The estimated useful life of the property, plant and equipment acquired range from 24 to 29 years. Approximately 1/25 of the change in fair value adjustments to property, plant and equipment would be recognized annually. |
| (6) | Interest expense—Represents the elimination of interest expense related to debt not assumed, the elimination of interest expense on terminated financing lease arrangements, and a reduction of interest expense related to purchase accounting fair value adjustments for debt assumed. The fair value of debt was estimated based on market rates for similar project-level debt. |
| (7) | Income taxes—Represents an adjustment to eliminate federal and state tax benefits from net losses. A valuation allowance is recognized for all tax benefits until it becomes more likely than not the benefits will be realized by the Company. |
| (8) | Non-controlling interests— Adjustment to allocate pro forma net loss to non-controlling interests. This adjustment includes project-level interests and interests in Terra LLC held by Riverstone and SunEdison. |
| (9) | Interest expense is adjusted to include the estimated impact of the issuance of the Senior Notes at an assumed interest rate per annum of %, plus an estimate of amortization of debt issuance costs and discounts. The actual interest expense may vary from that estimate and a 1/8% variance in the estimated interest rate would result in a $0.6 million change in pro forma interest expense for the nine months ended September 30, 2014. |
| (10) | The pro forma basic and diluted loss per share is calculated as follows: |
| (in thousands, except share and per share data) | Basic | Diluted | ||||||
| EPS Numerator: |
||||||||
| Net loss attributable to Class A common stock |
$ | (27,915 | ) | $ | (27,915 | ) | ||
|
|
|
|
|
|||||
| EPS Denominator: |
||||||||
| Class A shares offered hereby(a) |
11,293,966 | 11,293,966 | ||||||
| Class A shares—IPO |
23,074,750 | 23,074,750 | ||||||
| Acquisition Private Placement |
11,666,667 | 11,666,667 | ||||||
| IPO Private Placement |
2,600,000 | 2,600,000 | ||||||
| Restricted Class A shares |
1,391,412 | 1,391,412 | ||||||
|
|
|
|
|
|||||
| Total Class A shares |
50,026,795 | 50,026,795 | ||||||
|
|
|
|
|
|||||
| Loss per share |
$ | (0.56 | ) | $ | (0.56 | ) | ||
|
|
|
|
|
|||||
| (a) | Assumes the issuance of 11,293,966 shares of Class A common stock in this offering, which reflects gross proceeds to the issuer of $350 million at an assumed price to the public of $30.99 per share, which was the closing price of our Class A common stock on December 5, 2014. |
91
Table of Contents
Unaudited Pro Forma Consolidated Statement of Operations
for the Year Ended December 31, 2013
| Pro Forma Adjustments | ||||||||||||||||||||
| (in thousands, except shares and per share data) |
TerraForm Power (Predecessor) |
Combined Acquired 3rd Party Projects(1) |
Acquisition Adjustments |
Acquisition Financing Transactions |
TerraForm Power, Inc. Pro Forma |
|||||||||||||||
| Statement of Operations Data: |
||||||||||||||||||||
| Operating revenues: |
||||||||||||||||||||
| Energy |
$ | 8,928 | $ | 148,096 | $ | (37,856 | )(2) | $ | — | $ | 119,168 | |||||||||
| Incentives |
7,608 | 19,907 | 17,756 | (2) | — | 45,271 | ||||||||||||||
| Incentives—affiliate |
933 | — | — | — | 933 | |||||||||||||||
|
|
|
|
|
|
|
|
|
|
|
|||||||||||
| Total operating revenues |
17,469 | 168,003 | (20,100 | ) | — | 165,372 | ||||||||||||||
| Operating costs and expenses: |
||||||||||||||||||||
| Cost of operations |
1,024 | 55,887 | — | — | 56,911 | |||||||||||||||
| Cost of operations—affiliate |
911 | — | — | — | 911 | |||||||||||||||
| General and administrative |
289 | 12,739 | — | — | 13,028 | |||||||||||||||
| General and administrative—affiliate |
5,158 | — | — | — | 5,158 | |||||||||||||||
| Depreciation, amortization and accretion |
4,961 | 69,127 | (13,452 | )(3) | — | 60,636 | ||||||||||||||
|
|
|
|
|
|
|
|
|
|
|
|||||||||||
| Total operating costs and expenses |
12,343 | 137,753 | (13,452 | ) | — | 136,644 | ||||||||||||||
|
|
|
|
|
|
|
|
|
|
|
|||||||||||
| Operating income (loss) |
5,126 | 30,250 | (6,648 | ) | — | 28,728 | ||||||||||||||
| Other expense (income): |
||||||||||||||||||||
| Interest expense, net |
6,267 | 59,865 | (43,360 | )(4) | 53,056 | (7) | 75,828 | |||||||||||||
| Gain on foreign currency exchange |
(771 | ) | — | — | — | (771 | ) | |||||||||||||
| Other, net |
— | (36,648 | ) | — | — | (36,648 | ) | |||||||||||||
|
|
|
|
|
|
|
|
|
|
|
|||||||||||
| Total other expense (income) |
5,496 | 23,217 | (43,360 | ) | 53,056 | 38,409 | ||||||||||||||
|
|
|
|
|
|
|
|
|
|
|
|||||||||||
| (Loss)/Income before income tax (benefit)/provision |
(370 | ) | 7,033 | 36,712 | (53,056 | ) | (9,681 | ) | ||||||||||||
| Income tax (benefit) |
(88 | ) | 484 | (396 | )(5) | — | — | |||||||||||||
|
|
|
|
|
|
|
|
|
|
|
|||||||||||
| Net (loss) income |
(282 | ) | 6,549 | 37,108 | (53,056 | ) | (9,681 | ) | ||||||||||||
| Less net (loss) income attributable to non-controlling interests |
— | 10,605 | 994 | (6) | — | 11,599 | ||||||||||||||
|
|
|
|
|
|
|
|
|
|
|
|||||||||||
| Net loss attributable to TerraForm Power, Inc. |
$ | (282 | ) | $ | (4,056 | ) | $ | 36,114 | $ | (53,056 | ) | $ | (21,280 | ) | ||||||
|
|
|
|
|
|
|
|
|
|
|
|||||||||||
| Pro Forma basic and diluted loss per share(8) |
$ | (0.43 | ) | |||||||||||||||||
|
|
|
|||||||||||||||||||
| Pro Forma weighted average shares outstanding(8) |
50,026,795 | |||||||||||||||||||
|
|
|
|||||||||||||||||||
92
Table of Contents
Notes to the Unaudited Pro Forma Consolidated Statements of Operations
| (1) | The following table represents the consolidating schedule of Predecessor Acquired Projects reflected in the Unaudited Pro Forma Consolidated Statement of Operations for the year ended December 31, 2013. |
| (in thousands) | Nellis | CalRenew-1 | Atwell Island |
Summit Solar Combined |
Stonehenge Group(a) |
Mt. Signal |
First Wind |
All Other(b) |
Combined Acquired 3rd Party Projects |
|||||||||||||||||||||||||||
| Statement of Operations Data: |
||||||||||||||||||||||||||||||||||||
| Operating revenues: |
||||||||||||||||||||||||||||||||||||
| Energy |
$ | 698 | $ | 2,628 | $ | 5,371 | $ | 5,327 | $ | 1,467 | $ | 1,777 | $ | 96,453 | $ | 34,375 | $ | 148,096 | ||||||||||||||||||
| Incentives |
6,920 | — | — | 4,501 | 2,619 | — | — | 5,867 | 19,907 | |||||||||||||||||||||||||||
|
|
|
|
|
|
|
|
|
|
|
|
|
|
|
|
|
|
|
|||||||||||||||||||
| Total operating revenues |
7,618 | 2,628 | 5,371 | 9,828 | 4,086 | 1,777 | 96,453 | 40,242 | 168,003 | |||||||||||||||||||||||||||
| Operating costs and expenses: |
||||||||||||||||||||||||||||||||||||
| Cost of operations |
435 | 372 | 79 | 1,706 | 305 | 536 | 45,924 | 6,530 | 55,887 | |||||||||||||||||||||||||||
| General and administrative |
314 | — | 1,123 | 260 | 546 | 1,209 | 5,926 | 3,361 | 12,739 | |||||||||||||||||||||||||||
| Depreciation, amortization and accretion |
4,241 | 538 | 2,266 | 2,726 | 1,791 | 2,012 | 43,650 | 11,903 | 69,127 | |||||||||||||||||||||||||||
|
|
|
|
|
|
|
|
|
|
|
|
|
|
|
|
|
|
|
|||||||||||||||||||
| Total operating costs and expenses |
4,990 | 910 | 3,468 | 4,692 | 2,642 | 3,757 | 95,500 | 21,794 | 137,753 | |||||||||||||||||||||||||||
|
|
|
|
|
|
|
|
|
|
|
|
|
|
|
|
|
|
|
|||||||||||||||||||
| Operating income |
2,628 | 1,718 | 1,903 | 5,136 | 1,444 | (1,980 | ) | 953 | 18,448 | 30,250 | ||||||||||||||||||||||||||
| Other (income) expense: |
||||||||||||||||||||||||||||||||||||
| Interest expense, net |
3,079 | 1,447 | 1,393 | 1,485 | 2,822 | 8,351 | 33,496 | 7,792 | 59,865 | |||||||||||||||||||||||||||
| Other, net |
— | — | 3 | — | (108 | ) | 3 | (35,895 | )(c) | (651 | ) | (36,648 | ) | |||||||||||||||||||||||
|
|
|
|
|
|
|
|
|
|
|
|
|
|
|
|
|
|
|
|||||||||||||||||||
| Total other (income) expense |
3,079 | 1,447 | 1,396 | 1,485 | 2,714 | 8,354 | (2,399 | ) | 7,141 | 23,217 | ||||||||||||||||||||||||||
|
|
|
|
|
|
|
|
|
|
|
|
|
|
|
|
|
|
|
|||||||||||||||||||
| Income (loss) before income tax benefit |
(451 | ) | 271 | 507 | 3,651 | (1,270 | ) | (10,334 | ) | 3,352 | 11,307 | 7,033 | ||||||||||||||||||||||||
| Income tax benefit |
— | — | — | 53 | — | — | 431 | 484 | ||||||||||||||||||||||||||||
|
|
|
|
|
|
|
|
|
|
|
|
|
|
|
|
|
|
|
|||||||||||||||||||
| Net (loss) income |
(451 | ) | 271 | 507 | 3,651 | (1,323 | ) | (10,334 | ) | 3,352 | 10,876 | 6,549 | ||||||||||||||||||||||||
| Less net (loss) income attributable to non-controlling interests |
— | — | — | 39 | — | 4,425 | 2,692 | 3,449 | 10,605 | |||||||||||||||||||||||||||
|
|
|
|
|
|
|
|
|
|
|
|
|
|
|
|
|
|
|
|||||||||||||||||||
| Net (loss) income attributable to Acquired 3rd Party Projects |
$ | (451 | ) | $ | 271 | $ | 507 | $ | 3,612 | $ | (1,323 | ) | $ | (14,759 | ) | $ | 660 | $ | 7,427 | $ | (4,056 | ) | ||||||||||||||
|
|
|
|
|
|
|
|
|
|
|
|
|
|
|
|
|
|
|
|||||||||||||||||||
| (a) | The statements of operations for the year ended December 31, 2013 have been translated from British pounds (GBP) to U.S. dollars (USD) at a rate of $1.564 USD/GBP. |
| (b) | Represents the combined results of operations of individually insignificant acquisitions for periods prior to acquisition. |
| (c) | Represents gains or losses on the sale of assets, losses on disposal and impairment of assets, losses on early extinguishments of debt, settlements, and other income reflected in the historical results of First Wind. |
| (2) | Amortization of power purchase agreements intangible—Represents amortization of acquired off-market PPAs and incentive arrangements over the terms of such agreements resulting from fair value adjustments of the Acquired Projects, and a reclassification of of green energy credit revenue for Acquired Projects from energy revenues to incentive revenues to conform accounting policies. The estimate of the amortization of the PPA intangible is preliminary, subject to change and could vary materially from the actual adjustment at the time the acquisition is completed. |
93
Table of Contents
| (3) | Depreciation and amortization—Represents the net depreciation expense resulting from the fair value adjustments of the Acquired Projects’ property, plant and equipment. The fair values of property, plant and equipment acquired were valued primarily using a cost approach and limited to what is economically supportable as indicated by an income approach. The fair value approximates the current cost of replacing an asset with another of equivalent economic utility adjusted for functional obsolescence and physical depreciation. The estimate is preliminary, subject to change and could vary materially from the actual adjustment at the time the acquisition is completed. The estimated useful lives of the property, plant and equipment acquired range from 24 to 29 years. |
| (4) | Interest expense—Represents the elimination of interest expense related to debt not assumed, the elimination of interest expense on terminated financing lease agreements, and a reduction of interest expense related to purchase accounting fair value adjustments for debt assumed. The fair value of debt was estimated based on market rates for similar project-level debt. |
| (5) | Income taxes—Represents an adjustment to eliminate federal and state tax benefits from net losses. A valuation allowance is recognized for all federal and state tax benefits until it becomes more likely than not the benefits will be realized by the Company. |
| (6) | Non-controlling interests—Represents the allocation of pro forma net loss to non-controlling interests. This adjustment includes project level interests and interests in Terra LLC held by Riverstone and SunEdison. |
| (7) | Interest expense is adjusted to include the estimated impact of the issuance of the Senior Notes at an assumed interest rate per annum of %, plus an estimate of amortization of debt issuance costs and discounts. The actual interest expense may vary from that estimate and a 1/8% variance in the estimated interest rate would result in a $1.0 million change in pro forma interest expense for the year ended December 31, 2013. |
| (8) | The pro forma basic and diluted loss per share is calculated as follows: |
| (in thousands, except share and per share data) | Basic | Diluted | ||||||
| EPS Numerator: |
||||||||
| Net loss attributable to Class A common stock |
$ | (21,280 | ) | $ | (21,280 | ) | ||
|
|
|
|
|
|||||
| EPS Denominator: |
||||||||
| Class A shares offered hereby(a) |
11,293,966 | 11,293,966 | ||||||
| Class A shares - IPO |
23,074,750 | 23,074,750 | ||||||
| Acquisition Private Placement |
11,666,667 | 11,666,667 | ||||||
| IPO Private Placement |
2,600,000 | 2,600,000 | ||||||
| Restricted Class A shares |
1,391,412 | 1,391,412 | ||||||
|
|
|
|
|
|||||
| Total Class A shares |
50,026,795 | 50,026,795 | ||||||
|
|
|
|
|
|||||
| Loss per share |
$ | (0.43 | ) | $ | (0.43 | ) | ||
|
|
|
|
|
|||||
| (a) | Assumes the issuance of 11,293,966 shares of Class A common stock in this offering, which reflects gross proceeds to the issuer of $350 million at an assumed price to the public of $30.99 per share, which was the closing price of our Class A common stock on December 5, 2014. |
94
Table of Contents
Unaudited Pro Forma Consolidated Balance Sheet
As of September 30, 2014
| Pro Forma Adjustments | ||||||||||||||||||||||||||||
| (in thousands, except share data) | TerraForm Power, Inc. |
Combined Acquired Call Right Projects(1) |
Combined Acquired 3rd Party Projects(2) |
Acquisition Adjustments |
Acquisition Financing Transactions(18) |
Consideration for Acquisitions and Refinancing of Term Loan |
TerraForm Power, Inc. Pro Forma |
|||||||||||||||||||||
| Assets |
||||||||||||||||||||||||||||
| Current assets: |
||||||||||||||||||||||||||||
| Cash and cash equivalents |
$ | 259,363 | $ | 11 | $ | 19,138 | $ | (21,250 | )(3) | $ | 1,724,936 | $ | (1,750,802 | )(19) | $ | 231,396 | ||||||||||||
| Restricted cash |
67,567 | — | 38,838 | — | — | — | 106,405 | |||||||||||||||||||||
| Accounts receivable |
50,028 | 882 | 16,026 | — | — | — | 66,936 | |||||||||||||||||||||
| Deferred income taxes |
— | 192 | 1,369 | (1,369 | )(4) | — | — | 192 | ||||||||||||||||||||
| Due from affiliates |
— | — | 6,166 | (6,166 | )(5) | — | — | — | ||||||||||||||||||||
| Prepayments and other current assets |
51,720 | — | 11,960 | (1,544 | )(6) | — | — | 62,136 | ||||||||||||||||||||
|
|
|
|
|
|
|
|
|
|
|
|
|
|
|
|||||||||||||||
| Total currents assets |
428,678 | 1,085 | 93,497 | (30,329 | ) | 1,724,936 | (1,750,802 | ) | 467,065 | |||||||||||||||||||
| Property and equipment, net |
1,848,635 | 95,478 | 1,295,794 | (294,686 | )(7) | — | — | 2,945,221 | ||||||||||||||||||||
| Intangible assets |
289,209 | — | — | 217,582 | (8) | — | — | 506,790 | ||||||||||||||||||||
| Goodwill |
— | — | — | 16,200 | (9) | — | — | 16,200 | ||||||||||||||||||||
| Deferred financing costs, net |
36,081 | 3,121 | 19,847 | (19,847 | )(10) | 25,564 | (11,861 | )(19) | 52,905 | |||||||||||||||||||
| Other assets |
10,477 | — | 75,802 | (35,392 | )(11) | — | — | 50,887 | ||||||||||||||||||||
|
|
|
|
|
|
|
|
|
|
|
|
|
|
|
|||||||||||||||
| Total assets |
$ | 2,613,080 | $ | 99,684 | $ | 1,484,940 | $ | (146,473 | ) | $ | 1,750,500 | $ | (1,762,663 | ) | $ | 4,039,068 | ||||||||||||
|
|
|
|
|
|
|
|
|
|
|
|
|
|
|
|||||||||||||||
| Liabilities and Equity |
||||||||||||||||||||||||||||
| Current liabilities: |
||||||||||||||||||||||||||||
| Current portion of long-term debt |
$ | 270,900 | $ | — | $ | 52,584 | $ | (51,373 | )(12) | $ | 2,750 | $ | (5,750 | )(19) | $ | 269,111 | ||||||||||||
| Accounts payable and other current liabilities |
87,718 | 266 | 18,535 | (1,725 | )(13) | — | — | 104,794 | ||||||||||||||||||||
| Deferred revenue |
7,245 | — | 18,519 | (18,519 | )(14) | — | — | 7,245 | ||||||||||||||||||||
| Due to parents and affiliates |
1,507 | — | — | — | — | — | 1,507 | |||||||||||||||||||||
|
|
|
|
|
|
|
|
|
|
|
|
|
|
|
|||||||||||||||
| Total current liabilities |
367,370 | 266 | 89,638 | (71,617 | ) | 2,750 | (5,750 | ) | 382,657 | |||||||||||||||||||
| Long-term debt |
1,033,134 | 63,716 | 527,335 | (504,000 | )(12) | 1,072,250 | (568,500 | )(19) | 1,623,935 | |||||||||||||||||||
| Deferred revenue |
35,840 | — | 27,112 | (27,112 | )(14) | — | — | 35,840 | ||||||||||||||||||||
| Deferred income taxes |
702 | — | 4,073 | (4,073 | )(4) | — | — | 702 | ||||||||||||||||||||
| Other long-term liabilities |
— | — | 12,736 | (519 | )(14) | — | — | 12,217 | ||||||||||||||||||||
| Asset retirement obligations |
44,749 | 4,617 | 19,759 | — | — | — | 69,125 | |||||||||||||||||||||
|
|
|
|
|
|
|
|
|
|
|
|
|
|
|
|||||||||||||||
| Total liabilities |
1,481,795 | 68,599 | 680,653 | (607,321 | ) | 1,075,000 | (574,250 | ) | 2,124,476 | |||||||||||||||||||
| Redeemable interest in subsidiaries |
— | 85,761 | (67,909 | )(16) | — | — | 17,852 | |||||||||||||||||||||
| Equity: |
||||||||||||||||||||||||||||
| Members’ equity |
— | 33,000 | 595,275 | 548,277 | (17) | — | (1,176,552 | )(19) | — | |||||||||||||||||||
| Class A common stock, par value $0.01 per share, 850,000,000 shares authorized, 30,652,336 shares issued and outstanding, actual; 53,612,969 shares issued and outstanding, as adjusted |
271 | — | — | — | 230 | — | 501 | |||||||||||||||||||||
| Class B common stock, par value $0.01 per share, 140,000,000 shares authorized, 64,526,654 shares issued and outstanding, actual and as adjusted |
645 | — | — | — | — | — | 645 | |||||||||||||||||||||
| Class B1 common stock, par value $0.01 per share, 260,000,000 shares authorized, 5,840,000 shares issued and outstanding, actual and as adjusted |
58 | — | — | — | — | — | 58 | |||||||||||||||||||||
| Preferred stock, par value $0.01 per share, no shares authorized, issued and outstanding, actual; 50,000,000 authorized and no shares issued and outstanding, actual and as adjusted |
— | — | — | — | — | — | — | |||||||||||||||||||||
| Additional paid-in-capital |
317,482 | — | — | — | 675,270 | — | 992,752 | |||||||||||||||||||||
| Accumulated deficit |
(4,014 | ) | 540 | — | (21,250 | )(3) | — | (11,861 | )(20) | (36,585 | ) | |||||||||||||||||
| Accumulated OCI |
(931 | ) | (6 | ) | — | — | — | — | (937 | ) | ||||||||||||||||||
|
|
|
|
|
|
|
|
|
|
|
|
|
|
|
|||||||||||||||
| Total TerraForm Power Stockholders’ equity |
313,511 | 33,534 | 595,275 | 527,027 | 675,500 | (1,188,413 | ) | 956,434 | ||||||||||||||||||||
| Non-controlling interests |
817,774 | (2,449 | ) | 123,251 | 1,730 | — | — | 940,306 | ||||||||||||||||||||
|
|
|
|
|
|
|
|
|
|
|
|
|
|
|
|||||||||||||||
| Total equity |
1,131,285 | 31,085 | 718,526 | 528,757 | 675,500 | (1,188,413 | ) | 1,896,740 | ||||||||||||||||||||
|
|
|
|
|
|
|
|
|
|
|
|
|
|
|
|||||||||||||||
| Total liabilities and equity |
$ | 2,613,080 | $ | 99,684 | $ | 1,484,940 | $ | (146,473 | ) | $ | 1,750,500 | $ | (1,762,663 | ) | $ | 4,039,068 | ||||||||||||
|
|
|
|
|
|
|
|
|
|
|
|
|
|
|
|||||||||||||||
95
Table of Contents
Notes to the Unaudited Pro Forma Consolidated Balance Sheet
| (1) | Represents the acquisition of Fairwinds and Crundale Call Right projects from SunEdison. |
| (2) | The following table represents the consolidating schedule of Acquired Projects reflected in the Unaudited Pro Forma Consolidated Balance Sheet as of September 30, 2014: |
| (in thousands) | First Wind | All Other |
Combined Acquired 3rd Party Projects |
|||||||||
| Assets |
||||||||||||
| Current assets: |
||||||||||||
| Cash and cash equivalents |
$ | 15,699 | $ | 3,439 | $ | 19,138 | ||||||
| Restricted cash |
35,803 | 3,035 | 38,838 | |||||||||
| Accounts receivable |
10,572 | 5,454 | 16,026 | |||||||||
| Deferred income taxes |
— | 1,369 | 1,369 | |||||||||
| Due from affiliates |
— | 6,166 | 6,166 | |||||||||
| Prepayments and other current assets |
9,829 | 2,131 | 11,960 | |||||||||
|
|
|
|
|
|
|
|||||||
| Total currents assets |
71,903 | 21,594 | 93,497 | |||||||||
| Property and equipment, net |
938,470 | 357,324 | 1,295,794 | |||||||||
| Deferred financing costs, net |
18,015 | 1,832 | 19,847 | |||||||||
| Other assets |
57,766 | 18,036 | 75,802 | |||||||||
|
|
|
|
|
|
|
|||||||
| Total assets |
$ | 1,086,154 | $ | 398,786 | $ | 1,484,940 | ||||||
|
|
|
|
|
|
|
|||||||
| Liabilities and Equity |
||||||||||||
| Current liabilities: |
||||||||||||
| Current portion of long-term debt |
$ | 52,584 | $ | — | $ | 52,584 | ||||||
| Accounts payable and other current liabilities |
9,266 | 9,269 | 18,535 | |||||||||
| Deferred revenue |
919 | 17,600 | 18,519 | |||||||||
|
|
|
|
|
|
|
|||||||
| Total current liabilities |
62,769 | 26,869 | 89,638 | |||||||||
| Long-term debt |
494,265 | 33,070 | 527,335 | |||||||||
| Deferred revenue |
3,671 | 23,441 | 27,112 | |||||||||
| Other long-term liabilities |
11,624 | 1,112 | 12,736 | |||||||||
| Deferred income taxes |
— | 4,073 | 4,073 | |||||||||
| Asset retirement obligations |
12,081 | 7,678 | 19,759 | |||||||||
|
|
|
|
|
|
|
|||||||
| Total liabilities |
$ | 584,410 | $ | 96,243 | $ | 680,653 | ||||||
| Redeemable interests in subsidiaries |
$ | 17,852 | $ | 67,909 | $ | 85,761 | ||||||
| Equity: |
||||||||||||
| Members’ equity |
384,024 | 211,251 | 595,275 | |||||||||
| Non-controlling interests |
99,868 | 23,383 | 123,251 | |||||||||
|
|
|
|
|
|
|
|||||||
| Total equity, including non-controlling interests |
$ | 483,892 | $ | 234,634 | $ | 718,526 | ||||||
|
|
|
|
|
|
|
|||||||
| Total liabilities and equity, including redeemable interests in subsidiaries |
$ | 1,086,154 | $ | 398,786 | $ | 1,484,940 | ||||||
|
|
|
|
|
|
|
|||||||
| (3) | Reflects an adjustment to record an estimate for acquisition costs related to the Acquisition Transactions, and an estimate for debt breakage fees related to the First Wind Acquisition. |
| (4) | Adjustments eliminate historical deferred tax positions of acquired third party projects that are not recognizable post acquisition. |
| (5) | This reflects the elimination of intercompany transactions that were not acquired. |
| (6) | Prepayment and other current assets—Represents adjustment for accrued prepaid expenses at the acquisition date related to the elimination of cash grant awards as these receivables were not acquired. |
| (7) | Property, plant and equipment—Represents the adjustment to reflect the Acquired Projects’ property, plant and equipment at their estimated fair values. The fair values of property, plant, and equipment acquired were valued primarily using a cost approach and limited to what is economically supportable as indicated by an income approach. The fair value approximates the current cost of replacing an asset with another asset of equivalent economic utility adjusted further for obsolescence and physical depreciation. The estimate is preliminary, subject to change and |
96
Table of Contents
| could vary materially from the actual adjustment at the time the acquisition is completed. The estimated useful lives of the property, plant and equipment acquired range from 24 to 28 years. |
| (8) | Intangible assets—Represents the adjustment to record the Acquired Projects’ PPAs at their estimated fair values. The estimated fair values were determined based on income approach. The estimated useful lives of the intangibles range from 14 to 28 years. |
| (9) | Goodwill—Represents adjustment related to the valuation of acquired net operating losses, which can not be recognized as it is more likely than not that the benefits will not be realized by the Company. |
| (10) | Deferred financing costs, net—Represents adjustment for removal of the Acquired Projects historical deferred financing cost as the debt was revalued under acquisition accounting. |
| (11) | Other Assets—Represents the elimination of other assets that were not acquired and the write-off of prepaid interest associated with the purchase of lessor’s interest of certain financing lease arrangements. |
| (12) | Long-term debt, including current portion—Represents adjustments to the Acquired Projects’ long-term debt based on preliminary estimates of fair value and to eliminate debt not assumed. |
| (13) | Accounts payable and other current liabilities—Adjustment represents trade payables and accrued liabilities adjusted to fair value at the acquisition date. |
| (14) | Deferred revenue including current portion—Adjustments represent elimination of the Acquired Projects’ deferred revenue as power purchase agreements are adjusted to fair value. |
| (15) | Other long-term liabilities—Represents the elimination of other long-term liabilities that were not acquired. |
| (16) | Redeemable interests in subsidiaries—Represents adjustment to reflect the fair value of redeemable interests in subsidiaries at the acquisition date. |
| (17) | Members’ equity—Represents adjustment to historical equity of acquired entities to reflect the Company’s net investment. |
| (18) | Represents the effects of the following expected Acquisition Financing Transactions: |
| Expected net proceeds from this offering(a) |
$ | 337,750 | ||
| Net proceeds from the Acquisition Private Placement |
337,750 | |||
|
|
|
|||
| Total expected from this offering and Acquisition Private Placement |
675,500 | |||
| Expected net proceeds from the increased Term Loan |
275,000 | |||
| Expected net proceeds from the First Wind Acquisition Financing |
800,000 | |||
|
|
|
|||
| Total Acquisition Financing Transactions |
1,750,500 | |||
| Payment of deferred financing costs related to the Acquisition Financing Transactions |
(25,564 | ) | ||
|
|
|
|||
| Total expected net proceeds |
$ | 1,724,936 | ||
|
|
|
| (a) | Assumes the issuance of 11,293,966 shares of Class A common stock in this offering, which reflects gross proceeds to the issuer of $350 million at an assumed price to the public of $30.99 per share, which was the closing price of our Class A common stock on December 5, 2014. |
| (19) | Represents the effects of the following expected transactions: |
| Refinancing of the Term Loan |
$ | (574,250 | ) | |
| Total consideration for the Acquisition Transactions |
(1,176,552 | ) | ||
|
|
|
|||
| Total |
$ | (1,750,802 | ) | |
|
|
|
| (20) | Represents the loss on extinguishment of debt as a result of the Acquisition Financing Transactions. |
97
Table of Contents
Note 1. Basis of Pro Forma Presentation
The pro forma statements of operations for the year ended December 31, 2013 give effect to the Acquisitions as if they were completed on January 1, 2013. The pro forma balance sheet as of September 30, 2014 gives effect to the Acquisitions as if they were completed on September 30, 2014.
The pro forma financial statements have been derived from the historical financial statements of Terraform Power Inc., the Predecessor and Acquired Projects that are included elsewhere in this registration statement. Assumptions and estimates underlying the pro forma adjustments are described in the accompanying notes, which should be read in connection with the pro forma financial statements.
The pro forma financial statements were prepared using the acquisition method of accounting under GAAP. Acquisition accounting requires, among other things, that most assets acquired and liabilities assumed be recognized at fair value as of the acquisition date. Because acquisition accounting is dependent upon certain valuations and other studies that must be completed as of the acquisition date, there is not currently sufficient information for a definitive measurement. Therefore, the pro forma financial statements are preliminary and have been prepared solely for the purpose of providing unaudited pro forma financial information. Differences between these preliminary estimates and the final acquisition accounting will occur and these differences could have a material impact on the accompanying pro forma financial statements and the combined company’s future results of operations and financial position.
The Acquisitions are reflected in the pro forma financial statements as being accounted for based on the accounting guidance for business combinations. Under the acquisition method, the total estimated purchase price is calculated as described in Note 2 to the pro forma financial statements. In accordance with accounting guidance for business combinations, the assets acquired and the liabilities assumed have been measured at fair value. The fair value measurements use estimates based on key assumptions of the acquisition, including prior acquisition experience, benchmarking of similar acquisitions and historical and current market data. The pro forma adjustments included herein are likely to be revised as additional information becomes available and as additional analyses are performed. The final purchase price allocation will be determined after the acquisitions are completed and the final amounts recorded for the acquisitions may differ materially from the information presented in these pro forma financial statements.
The pro forma financial statements do not reflect any cost savings from operating efficiencies or synergies that could result from the Acquisitions.
For the purpose of measuring the estimated fair value of the assets acquired and liabilities assumed, as reflected in the pro forma financial statements, we have applied the accounting guidance for fair value measurements, which defines fair value as the price that would be received to sell an asset or paid to transfer a liability in an orderly transaction between market participants at the measurement date.
Note 2. Acquired Projects
Subsequent to the year ended December 31, 2013, we completed the following acquisitions described below to expand our initial portfolio. The initial accounting for these business combinations is not complete because the evaluation necessary to assess the fair values of certain net assets acquired is still in process. The provisional amounts are subject to revision until the evaluations are completed to the extent that any additional information is obtained about the facts and circumstances that existed as of the acquisition date.
98
Table of Contents
Nellis
On March 28, 2014, we acquired 100% of the controlling investor member interests in MMA NAFB Power, LLC, or Nellis, which owns a 14.1 MW solar energy generation system located on Nellis Air Force Base in Clark County, Nevada. A wholly owned subsidiary of SunEdison holds the non-controlling interest in Nellis. The purchase price for this acquisition was $14.2 million, net of acquired cash.
CR-1
On May 15, 2014, we acquired 100% of the issued and outstanding membership interests of CalRenew-1, LLC, which owns a 6.3 MW solar energy generation system located in Mendota, California. The purchase price for this acquisition was $14.3 million, net of acquired cash.
Atwell Island
On May 16, 2014, we acquired 100% of the membership interests in SPS Atwell Island, LLC, a 23.5 MW solar energy generation system located in Tulare County, California. The purchase price for this acquisition was $67.2 million, net of acquired cash.
MA Operating
On June 26, 2014, we acquired four operating solar energy systems located in Massachusetts, that achieved commercial operations during 2013. The total nameplate capacity of these projects is 12.2 MW. The purchase price for this acquisition was $39.5 million.
Stonehenge Operating Projects
On May 21, 2014, we acquired 100% of the issued share capital of three operating solar energy systems located in the United Kingdom from ib Vogt GmbH. These acquisitions are collectively referred to as Stonehenge Operating Projects. The Stonehenge Operating Projects consists of Sunsave 6 (Manston) Limited, Boyton Solar Park Limited and KS SPV24 Limited. The total combined nameplate capacity for the Stonehenge Operating Projects is 23.6 MW. The purchase price for the Stonehenge Operating Projects was $26.8 million, net of acquired cash.
Summit Solar Projects
On May 22, 2014, we acquired the equity interests in 23 solar energy systems located in the U.S. from Nautilus Solar PV Holdings, Inc. These 23 systems have a combined nameplate capacity of 19.6 MW. The purchase price for these systems was $29.1 million, net of acquired cash. In addition, an affiliate of the seller owned certain interests in seven operating solar energy systems in Canada with a total nameplate capacity of 3.8 MW. We purchased the Canadian assets on July 23, 2014 for a purchase price of $20.2 million, net of acquired cash.
Mt. Signal
On July 23, 2014, we acquired a controlling interest in Imperial Valley Solar 1 Holdings II, LLC, which owns a 265.9 MW utility scale solar energy system located in Mt. Signal, California. We acquired Mt. Signal from an indirect subsidiary of Silver Ridge in exchange for $292.0 million in total consideration consisting of (i) 5,840,000 Class B1 units (and a corresponding number of shares Class B1 common stock) equal in value to $146.0 million and (ii) 5,840,000 Class B units (and a corresponding number of shares Class B common stock) equal in value to $146.0 million. Prior to the
99
Table of Contents
IPO, Silver Ridge was owned 50% by Riverstone and 50% by SunEdison, who acquired substantially all of AES Corporation’s equity ownership interest in Silver Ridge on July 2, 2014. In connection with its acquisition of AES Corporation’s interest in Silver Ridge, SunEdison entered into a Master Transaction Agreement with Riverstone pursuant to which the parties agreed to sell Mt. Signal to us and to distribute the Class B units (and shares of Class B common stock) to SunEdison and the Class B1 units (and shares of Class B1 common stock) to Riverstone.
Hudson Energy Solar Corp
On September 18, 2014, we entered into an agreement whereby we acquired from Hudson Energy Solar Corporation 25.5 MW of operating solar power assets and SunEdison purchased 4.5 MW of developmental pipeline. In connection with the Hudson Energy Acquisition, we also entered into a right-of-first-offer agreement with Just Energy Group to acquire certain new operating solar power assets located in New Jersey, New York, Massachusetts and Pennsylvania. The total consideration for the Hudson Energy Acquisition was approximately $35.0 million and was funded with cash-on-hand. The Hudson Energy Acquisition closed on November 4, 2014.
Capital Dynamics
On October 29, 2014, we entered into a securities purchase agreement whereby we agreed to acquire 77.6 MW of operating solar power assets located in California, Massachusetts, New Jersey, New York and Pennsylvania from Capital Dynamics U.S. Solar Energy Fund, L.P. and its affiliates. The purchase price for the Capital Dynamics Acquisition is expected to be approximately $250 million and will be funded by a draw on our increased Term Loan. We expect the Capital Dynamics Acquisition to close during the fourth quarter of 2014.
First Wind
On November 17, 2014, we entered into a purchase and sale agreement to acquire 521.1 MW of operating power assets, including 500.0 MW of wind power assets and 21.1 MW of solar power assets located in Maine, New York, Hawaii, Vermont and Massachusetts. We will acquire First Wind from First Wind Holdings, LLC for $862.0 million of total consideration, which includes the equity purchase price, the refinancing of certain existing indebtedness, certain swap, and debt breakage fees, which will be reflected as a loss on extinquishment of debt and the purchase of a partner’s ownership stake in certain assets held by First Wind through a joint venture.
Fairwinds and Crundale
On November 4, 2014, we completed the acquisition of two Call Right Projects, Fairwinds and Crundale, from our Sponsor. The two utility scale power projects, with a total capacity of 50.0 MW, are located in the United Kingdom and reached COD in October 2014. The purchase price was approximately $32.2 million in cash, and we additionally assumed approximately $63.7 million of project-level debt of the project companies. We expect to repay all of the outstanding project-level debt in the second quarter of 2015. This acquisition will be accounted for at SunEdison’s historical cost basis and the excess fair value over SunEdison’s historical cost basis will be reflected as a distribution and reduction of SunEdisons’ non-controlling interest.
100
Table of Contents
Note 3. Estimated Purchase Price and Preliminary Purchase Price Allocation
The allocation of the preliminary purchase price to the fair values of assets acquired and liabilities assumed includes pro forma adjustments to reflect the fair values of the Acquired Projects’ assets and liabilities at the acquisition date. The final allocation of the purchase price could differ materially from the preliminary allocation used for the Unaudited Pro Forma Condensed Consolidated Balance Sheet primarily because power market prices, interest rates and other valuation variables will fluctuate over time and be different at the time of completion of the acquisition compared to the amounts assumed in the pro forma adjustments. The following is a summary of the preliminary purchase price allocation, net of acquired cash, for our acquisitions:
| (In thousands) | Mt. Signal | First Wind |
Other Acquisitions |
Total Estimated Allocation |
||||||||||||
| Property and equipment |
$ | 643,084 | $ | 762,200 | $ | 444,208 | $ | 1,849,492 | ||||||||
| Accounts receivable |
9,951 | 10,572 | 11,311 | 31,834 | ||||||||||||
| Restricted cash |
22,165 | 35,803 | 14,735 | 72,703 | ||||||||||||
| Other assets |
14,087 | 32,722 | 20,345 | 67,154 | ||||||||||||
| Goodwill |
— | — | 16,200 | 16,200 | ||||||||||||
| Intangible assets |
121,456 | 144,195 | 193,556 | 459,207 | ||||||||||||
|
|
|
|
|
|
|
|
|
|||||||||
| Total assets acquired |
810,743 | 985,492 | 700,355 | 2,496,590 | ||||||||||||
|
|
|
|
|
|
|
|
|
|||||||||
| Long-term debt, including current portion |
413,464 | — | 137,471 | 550,936 | ||||||||||||
| Accounts payable, accrued expenses and other current liabilities |
29,565 | 9,266 | 11,856 | 50,687 | ||||||||||||
| Asset retirement obligations |
3,000 | 12,081 | 22,610 | 37,690 | ||||||||||||
| Other long-term liabilities |
— | 11,624 | 593 | 12,217 | ||||||||||||
| Deferred income taxes |
— | — | 1,990 | 1,990 | ||||||||||||
|
|
|
|
|
|
|
|
|
|||||||||
| Total liabilities assumed |
446,029 | 32,971 | 174,520 | 653,520 | ||||||||||||
|
|
|
|
|
|
|
|
|
|||||||||
| Redeemable interest in subsidiaries |
— | 17,852 | — | 17,852 | ||||||||||||
| Non-controlling interests |
73,060 | 99,868 | 26,513 | 199,441 | ||||||||||||
|
|
|
|
|
|
|
|
|
|||||||||
| Purchase price, net of cash acquired |
$ | 291,654 | $ | 834,801 | $ | 499,322 | $ | 1,625,777 | ||||||||
|
|
|
|
|
|
|
|
|
|||||||||
Note 4. Significant Accounting Policies
Based upon the Company’s initial review of the Acquired Projects’ significant accounting policies, as disclosed in their consolidated historical financial statements included in this registration statement, as well as on preliminary discussions with their management, the pro forma consolidated financial statements assume there will be no significant adjustments necessary to conform the Acquired Projects’ accounting policies to our accounting policies. Upon completion of the Acquisition Transactions and a more comprehensive comparison and assessment, differences may be identified that would necessitate changes to the Acquired Projects’ future accounting policies and such changes could result in material differences in future reported results of operations and financial position for the Acquired Projects’ operations as compared to historically reported amounts.
101
Table of Contents
SELECTED HISTORICAL CONSOLIDATED FINANCIAL DATA
The following table shows selected historical combined consolidated financial data at the dates and for the periods indicated. The selected historical combined consolidated financial data as of and for the years ended December 31, 2013 and 2012 have been derived from the audited combined consolidated financial statements of our accounting predecessor included elsewhere in this prospectus. The selected historical consolidated financial data and balance sheet data as of September 30, 2014 and for the nine months ended September 30, 2014 and 2013 have been derived from our unaudited condensed consolidated financial statements included elsewhere in this prospectus, which include all adjustments, consisting of normal recurring adjustments, that management considers necessary for a fair presentation of the financial position and the results of operations for such periods. Results for the interim periods are not necessarily indicative of the results for the full year. The historical combined consolidated financial statements as of December 31, 2013 and 2012, for the years ended December 31, 2013 and 2012, are prepared on a carve-out basis and are intended to represent the financial results of SunEdison’s contracted renewable energy assets that were contributed to Terra LLC as part of our initial portfolio.
The following table should be read together with, and is qualified in its entirety by reference to, the historical combined consolidated financial statements and the accompanying notes appearing elsewhere in this prospectus. Among other things, the historical combined consolidated financial statements include more detailed information regarding the basis of presentation for the information in the following table. The table should also be read together with “Management’s Discussion and Analysis of Financial Condition and Results of Operations.”
102
Table of Contents
Financial data of TerraForm Power, Inc. has not been presented in this prospectus for periods prior to its date of incorporation of January 15, 2014.
| For the Year Ended December 31, |
For the Nine Months Ended September 30, |
|||||||||||||||
| (in thousands, except operational data) | 2012 | 2013 | 2013 | 2014 | ||||||||||||
| (unaudited) | ||||||||||||||||
| Statement of Operations Data: |
||||||||||||||||
| Operating revenue |
||||||||||||||||
| Energy |
$ | 8,193 | $ | 8,928 | $ | 6,884 | $ | 59,692 | ||||||||
| Incentives |
5,930 | 7,608 | 5,409 | 22,832 | ||||||||||||
| Incentives-affiliate |
1,571 | 933 | 746 | 774 | ||||||||||||
|
|
|
|
|
|
|
|
|
|||||||||
| Total operating revenues |
15,694 | 17,469 | 13,039 | 83,298 | ||||||||||||
| Operating costs and expenses: |
||||||||||||||||
| Cost of operations |
837 | 1,024 | 780 | 6,051 | ||||||||||||
| Cost of operations-affiliate |
680 | 911 | 478 | 3,911 | ||||||||||||
| General and administrative |
177 | 289 | 92 | 3,767 | ||||||||||||
| General and administrative-affiliate |
4,425 | 5,158 | 3,568 | 8,783 | ||||||||||||
| Acquisition costs |
— | — | — | 2,537 | ||||||||||||
| Acquisition costs-affiliate |
— | — | — | 2,826 | ||||||||||||
| Formation and offering related fees and expenses |
— | — | — | 3,399 | ||||||||||||
| Depreciation, amortization and accretion |
4,267 | 4,961 | 3,542 | 21,053 | ||||||||||||
|
|
|
|
|
|
|
|
|
|||||||||
| Total operating costs and expenses |
10,386 | 12,343 | 8,460 | 52,327 | ||||||||||||
|
|
|
|
|
|
|
|
|
|||||||||
| Operating income |
5,308 | 5,126 | 4,579 | 30,971 | ||||||||||||
| Other (income) expense: |
||||||||||||||||
| Interest expense, net |
5,702 | 6,267 | 4,716 | 53,217 | ||||||||||||
| Gain on extinguishment of debt, net |
— | — | — | (7,635 | ) | |||||||||||
| (Gain) loss on foreign currency exchange |
— | (771 | ) | — | 6,914 | |||||||||||
| Other, net |
— | (1 | ) | 582 | ||||||||||||
|
|
|
|
|
|
|
|
|
|||||||||
| Total other expense |
5,702 | 5,496 | 4,715 | 53,078 | ||||||||||||
|
|
|
|
|
|
|
|
|
|||||||||
| Loss before income tax benefit |
(394 | ) | (370 | ) | (136 | ) | (22,107 | ) | ||||||||
| Income tax benefit |
(1,270 | ) | (88 | ) | (60 | ) | (4,069 | ) | ||||||||
|
|
|
|
|
|
|
|
|
|||||||||
| Net income (loss) |
$ | 876 | $ | (282 | ) | $ | (76 | ) | (18,038 | ) | ||||||
|
|
|
|
|
|
|
|||||||||||
| Less: Predecessor loss prior to initial public offering on July 23, 2014 |
(10,357 | ) | ||||||||||||||
|
|
|
|||||||||||||||
| Net loss subsequent to initial public offering |
(7,681 | ) | ||||||||||||||
| Less net loss attributable to non-controlling interest |
(3,667 | ) | ||||||||||||||
|
|
|
|||||||||||||||
| Net loss attributable to TerraForm Power |
$ | (4,014 | ) | |||||||||||||
|
|
|
|||||||||||||||
| Loss per share: |
||||||||||||||||
| Class A common stock — Basic and Diluted |
$ | (0.15 | ) | |||||||||||||
| Cash Flow Data: |
||||||||||||||||
| Net cash provided by (used in): |
||||||||||||||||
| Operating activities |
$ | 2,890 | $ | (7,202 | ) | $ | (44,111 | ) | $ | 27,567 | ||||||
| Investing activities |
(410 | ) | (264,239 | ) | (5,534 | ) | (969,592 | ) | ||||||||
| Financing activities |
(2,477 | ) | 272,482 | 50,047 | 1,200,686 | |||||||||||
| Balance Sheet Data (at period end): |
||||||||||||||||
| Cash and cash equivalents |
$ | 3 | $ | 1,044 | $ | 405 | $ | 259,363 | ||||||||
| Restricted cash(1) |
8,828 | 69,722 | 14,204 | 74,839 | ||||||||||||
| Property and equipment, net |
111,697 | 407,356 | 211,385 | 1,848,635 | ||||||||||||
| Total assets |
158,955 | 566,877 | 267,245 | 2,613,080 | ||||||||||||
| Total liabilities |
128,926 | 551,425 | 222,671 | 1,481,795 | ||||||||||||
| Total equity |
30,029 | 15,452 | 44,574 | 1,131,285 | ||||||||||||
| (1) | Restricted cash includes current restricted cash and non-current restricted cash included in “other assets” in the consolidated financial statements. |
103
Table of Contents
MANAGEMENT’S DISCUSSION AND ANALYSIS OF FINANCIAL CONDITION
AND RESULTS OF OPERATIONS
The following discussion contains forward-looking statements that involve risks and uncertainties. Our actual results may differ materially from those discussed in the forward-looking statements as a result of various factors, including, without limitation, those set forth in “Risk Factors,” “Cautionary Statement Concerning Forward-Looking Statements” and other matters included elsewhere in this prospectus. The following discussion of our financial condition and results of operations should be read in conjunction with our predecessor’s historical combined consolidated financial statements and the notes thereto included elsewhere in this prospectus and our unaudited pro forma financial data, as well as the information presented under “Summary Historical and Pro Forma Financial Data,” “Selected Historical Consolidated Financial Data,” and “Unaudited Pro Forma Consolidated Financial Statements.”
Overview
We are a dividend growth-oriented company formed to own and operate contracted clean power generation assets acquired from SunEdison and third parties. Our business objective is to acquire high-quality contracted cash flows, primarily from owning solar and wind generation assets serving utility, commercial and residential customers. Over time, we intend to acquire other clean power generation assets, including natural gas and hydro-electricity facilities, as well as hybrid energy solutions that enable us to provide contracted power on a 24/7 basis. We believe the renewable power generation segment is growing more rapidly than other power generation segments due in part to the emergence in various energy markets of “grid parity,” which is the point at which renewable energy sources can generate electricity at a cost equal to or lower than prevailing electricity prices. We expect retail electricity prices to continue to rise due to the increasing cost of producing electricity from fossil fuels caused by required investments in generation plants and transmission and distribution infrastructure and increasing regulatory costs, among other factors.
Our current portfolio consists of solar projects located in the United States, Canada, the United Kingdom and Chile with an aggregate nameplate capacity of 887.1 MW. As of our IPO, our portfolio consisted of projects with an aggregate nameplate capacity of 807.7 MW. Since then, we acquired several Call Right Projects from our Sponsor with a total capacity of 54.6 MW and also completed the Hudson Energy Acquisition, in which we acquired 25.5 MW of operating solar power assets. In addition, we expect to complete the Capital Dynamics Transaction in December 2014, which will add a further 77.6 MW of operating solar power assets to our portfolio. In November 2014, we agreed to acquire 521.1 MW of operating power assets, including 500.0 MW of wind power assets and 21.1 MW of solar power assets, in the First Wind Acquisition for a total consideration of $862.0 million. If the Capital Dynamics Acquisition and the First Wind Acquisitions are consummated, our portfolio will include both solar and wind projects and will increase to a total nameplate capacity of 1,485.8 MW.
In addition to growing our current portfolio, our pipeline of call right projects has increased since the IPO. As of November 30, 2014, the Call Right Projects that are specifically identified pursuant to the Support Agreement have a total nameplate capacity of 1.7 GW. Additionally, in connection with the First Wind Acquisition, we entered into the Intercompany Agreement with our Sponsor under which we will be granted additional call rights with respect to certain projects in the First Wind pipeline, which are expected to represent an additional 1.6 GW of wind and solar generation assets from 2015 to 2017. If the First Wind acquisition is consummated, the total nameplate capacity of the projects to which we have call rights under both the Intercompany Agreement and the Support Agreement is over 3.3 GW. We anticipate the First Wind Acquisition will close in the first quarter of 2015.
We intend to further expand and diversify our current project portfolio by acquiring utility-scale, distributed and residential assets located in the United States, Canada, the United Kingdom, Chile and
104
Table of Contents
certain other jurisdictions, each of which we expect will also have a long-term PPA with a creditworthy counterparty. Substantially all of the projects we will acquire in the Capital Dynamics Acquisition and First Wind Acquisition have a long-term PPA with a creditworthy counterparty, and the weighted average (based on MW) remaining life of our PPAs if both Acquisitions are consummated would be approximately 16 years.
Factors that Significantly Affect our Results of Operations and Business
We expect the following factors will affect our results of operations:
Increasing Utilization of Clean Power Generation Sources
Clean energy has been one of the fastest growing sources of electricity generation in North America and globally over the past decade. We expect the renewable energy generation segment in particular to continue to offer high growth opportunities driven by:
| • | the significant reduction in the cost of solar and other renewable energy technologies, which will lead to grid parity in an increasing number of markets; |
| • | distribution charges and the effects of an aging transmission infrastructure, which enable renewable energy generation sources located at a customer’s site, or distributed generation, to be more competitive with, or cheaper than, grid-supplied electricity; |
| • | the replacement of aging and conventional power generation facilities in the face of increasing industry challenges, such as regulatory barriers, increasing costs of and difficulties in obtaining and maintaining applicable permits, and the decommissioning of certain types of conventional power generation facilities, such as coal and nuclear facilities; |
| • | the ability to couple renewable power generation with other forms of power generation, creating a hybrid energy solution capable of providing energy on a 24/7 basis while reducing the average cost of electricity obtained through the system; |
| • | the desire of energy consumers to lock in long-term pricing of a reliable energy source; |
| • | renewable power generation’s ability to utilize freely available sources of fuel, thus avoiding the risks of price volatility and market disruptions associated with many conventional fuel sources; |
| • | environmental concerns over conventional power generation; and |
| • | government policies that encourage development of renewable power, such as state or provincial renewable portfolio standard programs, which motivate utilities to procure electricity from renewable resources. |
In addition to renewable energy, we expect natural gas to grow as a source of electricity generation due to its relatively lower cost and lower environmental impact compared to other fossil fuel sources, such as coal and oil.
Project Operations and Generation
Our revenue is primarily a function of the volume of electricity generated and sold by our solar energy projects as well as, to a lesser extent, where applicable, the sale of green energy certificates and other environmental attributes related to energy generation. Our portfolio of power generation assets is or will be fully contracted under long-term PPAs with creditworthy counterparties. As of September 30, 2014, the weighted average remaining life of our PPAs was 20 years. Pricing of the electricity sold under these PPAs is or will be fixed for the duration of the contract. In the case of our U.K. projects, the price for electricity is fixed for a specified period of time (typically four years), after
105
Table of Contents
which the price is subject to an adjustment based on the current market price (subject to a price floor). The prices for green energy certificates are fixed by U.K. laws or regulations, and certain other attributes are indexed to prices set by U.K. laws or regulations. In the case of our Massachusetts projects, a portion of the contracted revenue is fixed and the remainder is subject to an adjustment based on the current market price. Certain of our PPA have price escalators based on an index (such as the consumer price index) or other rates specified in the applicable PPA. For more information regarding green energy certificates and other environmental attributes, see “Business—Government Incentives.”
We define “generation availability” as the actual amount of time a power generation asset produces electricity divided by the amount of time such asset is expected to produce electricity, which reflects anticipated maintenance and interconnection interruptions. Our ability to generate electricity in an efficient and cost-effective manner is impacted by our ability to maintain and utilize the electrical generation capacity of our projects. The volume of electricity generated and sold by our projects during a particular period is also impacted by the number of projects that have commenced commercial operations, as well as both scheduled and unexpected repair and maintenance required to keep our projects operational. Equipment performance represents the primary factor affecting our operating results because equipment downtime impacts the volume of the electricity that we are able to generate from our projects. The volume of electricity generated and sold by our projects will be negatively impacted if any projects experience higher than normal downtime as a result of equipment failures, electrical grid disruption or curtailment, weather disruptions or other events beyond our control.
Generally, over longer time periods, we expect our portfolio will exhibit less variability in generation compared to shorter periods. It is likely that we will experience more generation variability in monthly or quarterly production than we do for annual production. As a result, our periodic cash flows and payout ratios will reflect more variability during periods shorter than a year. While we intend to reserve a portion of our cash available for distribution and maintain a revolving credit facility in order to, among other things, facilitate the payment of dividends to our stockholders, unpredicted variability in generation could result in variability of our dividend payments to the extent we lack sufficient reserves and liquidity.
We use reliable and proven solar panels, inverters and other equipment for each of our projects. We believe this significantly reduces the probability of unexpected equipment failures. Additionally, through our Management Services Agreement with our Sponsor, one of the world’s largest solar energy developers and operators, we have access to significant resources to support the maintenance and operation of our business. We believe our relationship with our Sponsor provides us with the opportunity to benefit from our Sponsor’s expertise in solar technology, project development, finance, and management and operations.
Project Acquisitions
Our ability to execute our growth strategy is dependent on our ability to acquire additional clean power generation assets from our Sponsor and unaffiliated third parties. We are focused on acquiring long-term contracted clean power generation assets with proven technologies, low operating risks and stable cash flows in geographically diverse locations with growing demand and stable legal and political systems. We expect to have the opportunity to increase our cash available for distribution and, in turn, our quarterly dividend per share by acquiring additional assets from our Sponsor, including those available to us under the Support Agreement, and from third parties.
As of September 30, 2014, our Sponsor’s pipeline (as defined below) was 4.6 GW of total nameplate capacity. We benefit from this pipeline because our Sponsor has granted us a right to acquire the Call Right Projects and a right of first offer with respect to the ROFO Projects pursuant to the Support Agreement.
106
Table of Contents
SunEdison includes a solar energy system project in its “pipeline” when it has a signed or awarded PPA or other energy offtake agreement or has achieved each of the following three items: site control, an identified interconnection point with an estimate of the interconnection costs and an executed energy offtake agreement or the determination that there is a reasonable likelihood that an energy offtake agreement will be signed. SunEdison’s pipeline may not be converted into completed projects and we may not acquire these projects.
We have entered into the Support Agreement with our Sponsor, which requires our Sponsor to offer us Call Right Projects from its development pipeline by the end of 2016 that have at least $175.0 million of Projected FTM CAFD. Specifically, the Support Agreement requires our Sponsor to offer us:
| • | after the completion of our IPO and prior to the end of 2015, projects that have at least $75.0 million of Projected FTM CAFD; and |
| • | during calendar year 2016, projects that have at least $100.0 million of Projected FTM CAFD. |
If the amount of Projected FTM CAFD of the projects we acquire under the Support Agreement through the end of 2015 is less than $75.0 million, or the amount of Projected FTM CAFD of the projects we acquire under the Support Agreement during 2016 is less than $100.0 million, our Sponsor has agreed that it will continue to offer us sufficient Call Right Projects until the total aggregate Projected FTM CAFD commitment has been satisfied. Since our IPO, our Sponsor has updated the list of Call Right Projects, with projects representing a further 1.7 GW of total nameplate capacity identified as Call Right Projects as of November 30, 2014. We believe the currently identified Call Right Projects, along with the 54.6 MW of Call Right Projects we have acquired from our Sponsor since our IPO, will be sufficient to satisfy a majority of the Projected FTM CAFD commitment for 2015 and between 45% and 70% of the Projected FTM CAFD commitment for 2016 (depending on the amount of debt financing we use for such projects).
In addition, the Support Agreement grants us a right of first offer with respect to the ROFO Projects. The Support Agreement does not identify the ROFO Projects since our Sponsor will not be obligated to sell any project that would constitute a ROFO Project. As a result, we do not know when, if ever, any ROFO Projects or other assets will be offered to us. In addition, in the event that our Sponsor elects to sell such assets, it will not be required to accept any offer we make to acquire any ROFO Project and, following the completion of good faith negotiations with us, our Sponsor may choose to sell such assets to a third party or not sell the assets at all.
In addition to acquiring clean power generation assets from our Sponsor, we intend to pursue additional acquisition opportunities that are complementary to our business from unaffiliated third parties. See “Business—Our Business Strategy.”
When we acquire clean power generation assets from a party other than our Sponsor, our financial statements will generally reflect such assets and their associated operations beginning on the date the acquisition is consummated. For so long as our Sponsor controls us, acquisitions from it will result in a recast of our financial statements for prior periods in accordance with accounting rules applicable to transactions between entities under common control. As a result, our financial statements would reflect such assets and resulting costs and operations for periods prior to the consummation of the acquisition.
Seasonality
The amount of electricity our solar power generation assets produce is dependent in part on the amount of sunlight, or irradiation, where the assets are located. Because shorter daylight hours in winter months results in less irradiation, the generation of particular assets will vary depending on the
107
Table of Contents
season. Additionally, to the extent more of our power generation assets are located in the northern or southern hemisphere, overall generation of our entire asset portfolio could be impacted by seasonality. While we expect seasonal variability to occur, we expect aggregate seasonal variability to decrease if geographic diversity of our portfolio between the northern and southern hemisphere increases.
We expect our portfolio’s power generation to be at its lowest during the fourth quarter of each year. Similarly, we expect our fourth quarter revenue generation to be lower than other quarters. We intend to reserve a portion of our cash available for distribution and maintain a revolving credit facility in order to, among other things, facilitate the payment of dividends to our stockholders. As a result, we do not expect seasonality to have a material effect on the amount of our quarterly dividends.
Location of Power Generation Assets/Tax Repatriation
While we are a United States taxpayer, a significant portion of our assets are located in foreign tax jurisdictions and we expect that we will acquire additional power generation assets in foreign tax jurisdictions in the future. Changes in tax rates and the application of foreign tax withholding requirements in foreign jurisdictions where we own power generation assets will impact the contribution from such assets to cash available for distribution.
Cash Distribution Restrictions
In many cases we obtain project-level financing for our clean power generation assets. These project financing arrangements typically restrict the ability of our project subsidiaries to distribute funds to us unless specific financial thresholds are satisfied on specified dates. Although our calculation of cash available for distribution will reflect the cash generated by such project subsidiaries, we may not have sufficient liquidity to make corresponding distributions until the cash is actually distributed and/or such financial thresholds are satisfied. As a result, Terra LLC may incur borrowings under our Revolver to fund dividends or increase our reserves for the prudent conduct of our business.
Foreign Exchange
Our operating results are reported in United States dollars. However, in the future, we expect a significant amount of our revenues and expenses will be generated in currencies other than United States dollars (including the British pound, the Canadian dollar and other currencies). As a result, we expect our revenues and expenses will be exposed to foreign exchange fluctuations in local currencies where our clean power generation assets are located. To the extent we do not hedge these exposures, fluctuations in foreign exchange rates could negatively impact our profitability.
Interest Rates
As of September 30, 2014, our long-term debt was borrowed at both fixed and variable interest rates. In the future, we expect a substantial amount of our corporate and project-level capital structure will be financed with variable rate debt or similar arrangements. We also expect that we will refinance fixed rate debt from time to time. If we incur variable rate debt or refinance our fixed rate debt, changes in interest rates could have an adverse effect on our cost of capital.
Key Metrics
Operating Metrics
Nameplate Megawatt Capacity
We measure the electricity-generating production capacity of our power generation assets in nameplate megawatt capacity. Rated capacity is the expected maximum output a power generation
108
Table of Contents
system can produce without exceeding its design limits. Nameplate capacity is the rated capacity of all of the power generation assets we own adjusted to reflect our economic ownership of joint ventures and similar projects. The size of our power generation assets varies significantly among the assets comprising our portfolio. We believe the aggregate nameplate megawatt capacity of our portfolio is indicative of our overall production capacity and period to period comparisons of our nameplate megawatt capacity are indicative of the growth rate of our business.
Generation Availability
Generation availability refers to the actual amount of time a power generation asset produces electricity divided by the amount of time such asset is expected to produce electricity, which reflects anticipated maintenance and interconnection interruptions. We track generation availability as a measure of the operational efficiency of our business.
Megawatt Hour Generation
Megawatt hour generation refers to the actual amount of electricity a power generator produces over a specific period of time. We track the aggregate generation of our power generation assets as it is indicative of the periodic production of our business operations.
Megawatt Hours Sold
Megawatt hours sold refers to the actual volume of electricity generated and sold by our projects during a particular period. We track megawatt hours sold as an indicator of our ability to recognize revenue from the generation of electricity at our projects.
Financial Metrics
Cash Available for Distribution
As calculated in this prospectus, cash available for distribution represents net cash provided by (used in) operating activities of Terra LLC (i) plus or minus changes in assets and liabilities as reflected on our statements of cash flows, (ii) minus deposits into (or plus withdrawals from) restricted cash accounts required by project financing arrangements to the extent they decrease (or increase) cash provided by operating activities, (iii) minus cash distributions paid to non-controlling interests in our projects, if any, (iv) minus scheduled project-level and other debt service payments and repayments in accordance with the related borrowing arrangements, to the extent they are paid from operating cash flows during a period, (v) minus non-expansionary capital expenditures, if any, to the extent they are paid from operating cash flows during a period, (vi) plus cash contributions from our Sponsor pursuant to the Interest Payment Agreement, (vii) plus operating costs and expenses paid by our Sponsor pursuant to the Management Services Agreement to the extent such costs or expenses exceed the fee payable by us pursuant to such agreement but otherwise reduce our net cash provided by operating activities and (viii) plus or minus operating items as necessary to present the cash flows we deem representative of our core business operations, with the approval of the audit committee.
We believe cash available for distribution is useful to investors in evaluating our operating performance because securities analysts and other interested parties use such calculations as a measure of financial performance. In addition, cash available for distribution is used by our management team for internal planning purposes. For a further discussion of cash available for distribution, including a reconciliation of net cash provided by (used in) operating activities to cash available for distribution and a discussion of its limitations, see Note 2 under the heading “Summary Historical and Pro Forma Financial Data” elsewhere in this prospectus.
109
Table of Contents
Adjusted EBITDA
We define Adjusted EBITDA as net income plus interest expense, net, income taxes, depreciation, amortization and accretion general and administrative-affiliate expense, and stock compensation expense, after eliminating the impact of non-recurring items and other factors that we do not consider indicative of future operating performance.
We believe Adjusted EBITDA is useful to investors in evaluating our operating performance because securities analysts and other interested parties use such calculations as a measure of financial performance and debt service capabilities. In addition, Adjusted EBITDA is used by our management for internal planning purposes, including for certain aspects of our consolidated operating budget and capital expenditures. See Note 1 under the heading “Summary Historical and Pro Forma Financial Data” elsewhere in this prospectus for a discussion on the limitations of Adjusted EBITDA.
Components of Results of Operations
Operating Revenues
Energy
A significant majority of our revenues are obtained through the sale of energy pursuant to terms of PPAs or other contractual arrangements which have a weighted-average (based on MW) remaining life of 20 years as of September 30, 2014. All of these PPAs are accounted for as operating leases and have no minimum lease payments and all of the rental income under these leases is recorded as income when the electricity is delivered.
Incentives
We also generate revenue through various government incentive arrangements including RECs, performance-based incentives, upfront incentives and ROCs. RECs are generated and revenue is recognized as the projects produce electricity. The term “RECs” is used generically throughout this prospectus to include both renewable energy credits and solar renewable energy credits. These RECs are currently sold pursuant to agreements with our parent, third parties and a certain debt holder. We did not have any RECs in inventory at September 30, 2014.
We also receive PBIs from public utilities in connection with certain sponsored programs. PBI revenue is based on the actual level of output generated from our solar energy systems recognized upon validation of the kilowatt hours produced from a third party metering company because the quantities to be billed to the utility are determined and agreed to at that time.
In addition, we receive upfront incentives or subsidies from various state governmental jurisdictions for operating certain of our solar energy systems. The amounts that have been deferred are recognized as revenue on a straight-line basis over the depreciable life of the solar energy system as we fulfill our obligation to operate these solar energy systems.
We also receive incentives from the government of the United Kingdom in the form of ROCs which we expect to sell to unaffiliated third parties. ROCs are based on the actual level of output generated from the applicable power generation facility. Revenue is recognized in respect of ROCs when the energy is produced, specified criteria are met and the ROC is transferred to a third party with a specified price.
110
Table of Contents
We expect incentive revenues to increase in the future as a result of the completion of project contributions and acquisitions. We expect incentive revenue as a percentage of total revenue to decrease primarily due to the increase in MWh’s of operating projects and mix of countries without incentive revenues.
Operating Costs and Expenses
Cost of operations
Our cost of operations is comprised of the contractual costs incurred under our fixed price operations and maintenance and project-level management administration agreements with annual escalators for our solar power generation assets. Cost of operations also includes costs incurred for property taxes, property insurance, land leases, licenses and other maintenance not covered by our operations and maintenance agreements.
General and administrative
Our general and administrative expenses consist primarily of the allocation of general corporate overhead costs from our Sponsor that are attributable to our predecessor operations. These costs include legal, accounting, tax, treasury, information technology, insurance, employee benefit costs, communications, human resources, and procurement. Our general and administrative expense will be comprised of the management fee we will pay to our Sponsor for the management and administration services provided to us under the Management Services Agreement and all costs of doing business, including all expenses paid by our Sponsor in excess of the payments required under the Management Services Agreement. See “Certain Relationships and Related Party Transactions—Management Services Agreement.”
Acquisition Costs
These fees primarily consist of professional fees for legal and accounting services related to acquisitions completed by us.
Formation and offering related fees and expenses
These fees primarily consist of non-recurring professional fees for legal, tax and accounting services not directly related to the IPO.
Depreciation and accretion
Depreciation expense is recognized using the straight-line method over the estimated useful lives of our solar power generation assets. Accretion expense represents the increase in asset retirement obligations over the remaining operational life of the associated solar power generation assets.
Interest expense
Interest expense is comprised of interest incurred under our fixed and variable rate financing arrangements and the amortization of deferred financing costs incurred in connection with obtaining construction and corporate financing.
Gain on extinguishment of debt, net
This net gain on the extinguishment of debt was a result of the early termination of multiple financing lease obligations and project-level financing.
111
Table of Contents
Loss on foreign currency exchange, net
The net loss of foreign currency exchange is a result of foreign currency exchange fluctuations of assets and liabilities denominated in foreign currencies.
Other, net
Net other expense consists of all other miscellaneous expenses incurred by us.
Income tax expense (benefit)
Income tax expense (benefit) consists of federal and state income taxes in the United States and certain foreign jurisdictions, and deferred income taxes and changes in related valuation allowance reflecting the net tax effects of temporary differences between the carrying amounts of assets and liabilities for financial reporting purposes and the amounts used for income tax purposes.
Combined Results of Operations of our Predecessor
Nine Months Ended September 30, 2014 Compared to Nine Months Ended September, 2013
The following table summarizes our historical Combined Consolidated Statements of Operations as a percentage of operating revenues for the periods shown:
| Nine Months Ended September 30, |
||||||||||||
| (In thousands) | 2014 | 2013 | $ Change | |||||||||
| Operating revenues |
$ | 83,298 | $ | 13,039 | $ | 70,259 | ||||||
| Operating costs and expenses: |
||||||||||||
| Cost of operations |
6,051 | 780 | 5,271 | |||||||||
| Cost of operations—affiliate |
3,911 | 478 | 3,433 | |||||||||
| General and administrative |
3,767 | 92 | 3,675 | |||||||||
| General and administrative—affiliate |
8,783 | 3,568 | 5,215 | |||||||||
| Acquisitions costs |
2,537 | — | 2,537 | |||||||||
| Acquisition costs—affiliate |
2,826 | — | 2,826 | |||||||||
| Formation and offering related fees and expenses |
3,399 | — | 3,399 | |||||||||
| Depreciation and accretion |
21,053 | 3,542 | 17,511 | |||||||||
|
|
|
|
|
|
|
|||||||
| Total operating costs and expenses |
52,327 | 8,460 | 43,867 | |||||||||
|
|
|
|
|
|
|
|||||||
| Operating income |
30,971 | 4,579 | 26,392 | |||||||||
| Other expense (income): |
||||||||||||
| Interest expense, net |
53,217 | 4,716 | 48,501 | |||||||||
| Gain on extinguishment of debt, net |
(7,635 | ) | — | (7,635 | ) | |||||||
| Loss on foreign currency exchange |
6,914 | — | 6,914 | |||||||||
| Other, net |
582 | (1 | ) | 583 | ||||||||
|
|
|
|
|
|
|
|||||||
| Total other expenses, net |
53,078 | 4,715 | 48,363 | |||||||||
|
|
|
|
|
|
|
|||||||
| Loss before income tax benefit |
(22,107 | ) | (136 | ) | (21,971 | ) | ||||||
| Income tax benefit |
(4,069 | ) | (60 | ) | (4009 | ) | ||||||
|
|
|
|
|
|
|
|||||||
| Net loss |
$ | (18,038 | ) | $ | (76 | ) | $ | (17,962 | ) | |||
|
|
|
|
|
|
|
|||||||
| Less: Predecessor loss prior to initial public offering on July 23, 2014 |
(10,357 | ) | ||||||||||
|
|
|
|||||||||||
| Net loss subsequent to initial public offering |
(7,681 | ) | ||||||||||
| Less: Net loss attributable to non-controlling interests |
(3,667 | ) | ||||||||||
|
|
|
|||||||||||
| Net loss attributable to TerraForm Power, Inc. Class A common stockholders |
$ | (4,014 | ) | |||||||||
|
|
|
|||||||||||
112
Table of Contents
Operating Revenues
Operating revenues for the nine months ended September 30, 2014 and 2013 were as follows:
| Nine Months Ended September 30, |
||||||||||||
| (in thousands, other than MW data) | 2014 | 2013 | Change | |||||||||
| Energy |
$ | 59,692 | $ | 6,884 | $ | 52,808 | ||||||
| Incentives |
23,606 | 6,155 | 17,451 | |||||||||
|
|
|
|
|
|
|
|||||||
| Total operating revenues |
$ | 83,298 | $ | 13,039 | $ | 70,259 | ||||||
|
|
|
|
|
|
|
|||||||
| MWh Sold |
439,683 | 42,250 | 397,433 | |||||||||
| Nameplate Megawatt Capacity (MW)(1) |
645.6 | 47.9 | 598 | |||||||||
| (1) | Operational at end of period. |
Energy revenues increased by $52.8 million during the nine months ended September 30, 2014, compared to the same period in 2013, due to:
| (In thousands) | ||||
| Increase in energy revenues as California Public Institutions, U.S. Projects 2014, CAP, Norrington, Stonehenge Q1, Says Court, and Crucis Farm achieved commercial operations |
$ | 20,718 | ||
| Increase in energy revenues from acquisitions of operating projects, which include Enfinity, Summit Solar (U.S. and Canada), Nellis, Atwell Island, CalRenew-1, Stonehenge Operating, and Mt. Signal |
35,372 | |||
| Amortization of acquired PPA intangible assets |
(3,558 | ) | ||
| Same project energy revenue |
276 | |||
|
|
|
|||
| Total |
$ | 52,808 | ||
|
|
|
|||
Incentive revenues increased by $17.5 million during the nine months ended September 30, 2014, compared to the same period in 2013, due to:
| (In thousands) | ||||
| Increase in incentive revenues as California Public Institutions, U.S. Projects 2014, Norrington, Stonehenge Q1, Says Court, and Crucis Farm achieved commercial operations |
$ | 5,048 | ||
| Increase in incentive revenues from acquisitions of operating projects, which include Enfinity, Summit Solar (U.S. and Canada), Nellis, and Stonehenge Operating |
12,311 | |||
| Same project incentive revenue |
92 | |||
|
|
|
|||
| $ | 17,541 | |||
|
|
|
|||
Costs of Operations
Costs of operations for the nine months ended September 30, 2014 and 2013 were as follows:
| Nine Months Ended September 30, |
||||||||||||
| (in thousands) | 2014 | 2013 | Change | |||||||||
| Cost of operations |
$ | 6,051 | $ | 780 | $ | 5,271 | ||||||
| Cost of operations-affiliate |
3,911 | 478 | 3,433 | |||||||||
|
|
|
|
|
|
|
|||||||
| Total cost of operations |
$ | 9,962 | $ | 1,258 | $ | 8,704 | ||||||
|
|
|
|
|
|
|
|||||||
113
Table of Contents
Total costs of operations increased by $8.7 million to $10.0 million for the nine months ended September 30, 2014 compared to the same period in the prior year. This increase is driven by a $4.2 million increase in cost of operations related to new projects, including CAP, Norrington, Crucis Farms, Says Court, Stonehenge Q1, and California Public Institutions, which reached commercial operation in 2014, combined with a $4.2 million increase resulting from the acquisitions of Mt. Signal, Summit Solar U.S., Nellis, Atwell Island, CalRenew-1, and Stonehenge Operating projects. Cost of operations-affiliate increased $3.4 million during the nine months ended September 30, 2014, compared to the same period in 2013. The increase is due to additional operations and maintenance costs resulting from the completion of projects contributed by SunEdison and third party acquisitions.
General and Administrative
General and administrative-affiliate expense increased by $5.2 million to $8.8 million for the nine months ended September 30, 2014 compared to the nine months ended September 30, 2013. General and administrative expense increased to $3.8 million for the nine months ended September 30, 2014 compared to $0.1 million during the same period in the prior year. The increase is due to additional costs incurred as a result of an increase in operational projects and nameplate capacity resulting from additional projects that achieved commercial operations compared to the prior year period.
Immediately prior to the closing of the IPO on July 23, 2014, we entered into the Management Services Agreement with SunEdison. Pursuant to the Management Services Agreement, we will not pay any fees to SunEdison for general and administrative services provided to us for the remainder of 2014. The cash fees payable to SunEdison will be capped at $4.0 million in 2015, $7.0 million in 2016 and $9.0 million in 2017.
There was no cash consideration paid to SunEdison for these services for the period from July 24, 2014 through September 30, 2014. Total actual costs for these services during this period of $5.1 million is reflected in the Consolidated Statement of Operations and has been treated as an equity contribution from SunEdison.
Acquisition Costs
Acquisition costs, including amounts related to affiliates, were $5.4 million during the nine months ended September 30, 2014. These fees primarily consist of professional fees for legal and accounting services related to the acquisitions completed during the period, including $2.8 million paid by SunEdison pursuant to the Management Services Agreement.
Formation and Offering Related Fees and Expenses
Formation and offering related fees and expenses were $3.4 million during the nine months ended September 30, 2014. These fees primarily consist of non-recurring professional fees for legal, tax and accounting services not directly related to the IPO.
Depreciation and Accretion
Depreciation and accretion expense increased by $17.5 million to $21.1 million for the nine months ended September 30, 2014, compared to the nine months ended September 30, 2013, due primarily to $8.2 million of additional depreciation for solar energy systems that reached commercial operations in late 2013 and during 2014. In addition, third party acquisitions resulted in an additional $9.3 million of depreciation and accretion expense during the nine months ended September 30, 2014 compared to the same period in 2013.
114
Table of Contents
Interest Expense, Net
Interest expense, net increased by $48.5 million during the nine months ended September 30, 2014 compared to the same period in 2013 primarily due to increased indebtedness related to construction financings, financing lease arrangements and borrowings under the Term Loan and the bridge facility that we entered into to provide funding for certain acquisitions we undertook prior to our IPO, or the “IPO Bridge Credit Facility,” (repaid upon the closure of the IPO on July 23, 2014,) which resulted in higher interest expense compared to the same period in 2013. In addition, the amortization of deferred financing fees, included in interest expense, increased $16.8 million primarily due to deferred fees associated with the IPO Bridge Credit Facility.
Immediately prior to the closing of the IPO on July 23, 2014, we entered into the Interest Payment Agreement with SunEdison. During the period from July 24, 2014 to September 30, 2014, we received $1.5 million equity contribution from SunEdison pursuant to the Interest Payment Agreement.
Gain on Extinguishment of Debt
We incurred a gain on extinguishment of debt of $7.6 million for the nine months ended September 30, 2014 primarily due to the termination of our financing lease obligations upon acquiring the lessor interest in the SunE Solar Fund X solar generation assets. The net gain on extinguishment of project-level indebtedness for the nine months ended September 30, 2014 related to the following projects:
| (in thousands) | (Gain)/Loss for Nine Months Ended September 30, 2014 |
|||
| U.S. Projects 2009-2013 |
$ | 2,459 | ||
| Alamosa |
1,945 | |||
| Stonehenge Operating |
3,797 | |||
| SunE Solar Fund X |
(15,836 | ) | ||
|
|
|
|||
| Total |
$ | (7,635 | ) | |
|
|
|
|||
Loss on Foreign Currency Exchange, net
We incurred a net loss on foreign currency exchange of $6.9 million for the nine months ended September 30, 2014. This amount includes a $2.8 million realized loss on the payment of outstanding Chilean peso denominated payables related to the construction of the CAP project in Chile, which were paid subsequent to the project reaching commercial operations in March 2014. In addition, we recognized a $4.3 million unrealized loss on the remeasurement of intercompany receivables denominated in British pounds and a $0.1 million loss on foreign currency hedges. These amounts were offset by other inconsequential foreign currency fluctuations. There was no gain or loss on foreign currency exchange for the nine months ended September 30, 2013.
Income Tax Benefit
Income tax benefit was $4.1 million for the nine months ended September 30, 2014 compared to a income tax benefit of $0.1 million during the same period in 2013. For the nine months ended September 30, 2014, the overall effective tax rate was different than the statutory rate of 35% primarily due to the recognition of a valuation allowance on the tax benefit attributed to us post-IPO. The income tax benefit for losses realized before July 23, 2014, were recognized primarily because of existing deferred tax liabilities.
115
Table of Contents
Net Loss Attributable to Non-Controlling Interests
Net loss attributable to non-controlling interests increased to $3.7 million for the nine months ended September 30, 2014. This was the result of a $6.9 million increase due to SunEdison’s 63.9% interest and Riverstone’s 5.8% interest in our net loss during the period from July 23, 2014 through September 30, 2014 and an offsetting $3.3 million decrease in project level non-controlling interests. There were no non-controlling interests during the nine months ended September 30, 2013.
Year Ended December 31, 2013 Compared to Year Ended December 31, 2012
The following table summarizes our historical Combined Consolidated Statements of Operations as a percentage of operating revenues for the periods shown:
| (in thousands) | For the Year Ended December 31, |
|||||||||||||
| 2013 | 2012 | Change | ||||||||||||
| Operating revenues: |
||||||||||||||
| Energy |
$ | 8,928 | $ | 8,193 | $ | 735 | ||||||||
| Incentives |
7,608 | 5,930 | 1,678 | |||||||||||
| Incentives—affiliate |
933 | 1,571 | (638 | ) | ||||||||||
|
|
|
|
|
|
|
|||||||||
| Total operating revenues |
17,469 | 15,694 | 1,775 | |||||||||||
| Operating costs and expenses: |
||||||||||||||
| Cost of operations |
1,024 | 837 | 187 | |||||||||||
| Cost of operations—affiliate |
911 | 680 | 231 | |||||||||||
| Depreciation and accretion |
289 | 177 | 112 | |||||||||||
| General and administrative |
5,158 | 4,425 | 733 | |||||||||||
| General and administrative—affiliate |
4,961 | 4,267 | 694 | |||||||||||
|
|
|
|
|
|
|
|||||||||
| Total operating costs and expenses |
12,343 | 10,386 | 1,957 | |||||||||||
|
|
|
|
|
|
|
|||||||||
| Operating income |
5,126 | 5,308 | (182 | ) | ||||||||||
| Other (income) expense: |
||||||||||||||
| Interest expense, net |
6,267 | 5,702 | 565 | |||||||||||
| Gain on foreign currency exchange |
(771 | ) | — | (771 | ) | |||||||||
|
|
|
|
|
|
|
|||||||||
| Total other expense |
5,496 | 5,702 | (206 | ) | ||||||||||
|
|
|
|
|
|
|
|||||||||
| Loss before income tax expense (benefit) |
(370 | ) | (394 | ) | 24 | |||||||||
| Income tax expense (benefit) |
(88 | ) | (1,270 | ) | 1,182 | |||||||||
|
|
|
|
|
|
|
|||||||||
| Net (loss) income |
$ | (282 | ) | $ | 876 | $ | (1,158 | ) | ||||||
|
|
|
|
|
|
|
|||||||||
116
Table of Contents
Operating Revenues
Operating revenues for the years ended December 31, 2013 and 2012 were as follows:
| (in thousands, except MW data) | For the Year Ended December 31, |
|||||||||||
| 2013 | 2012 | Change | ||||||||||
| Energy |
$ | 8,928 | $ | 8,193 | $ | 735 | ||||||
| Incentives |
7,608 | 5,930 | 1,678 | |||||||||
| Incentives—affiliate |
933 | 1,571 | (638 | ) | ||||||||
|
|
|
|
|
|
|
|||||||
| Total operating revenues |
$ | 17,469 | $ | 15,694 | $ | 1,775 | ||||||
|
|
|
|
|
|
|
|||||||
| MWh sold |
60,176 | 52,325 | 7,851 | |||||||||
| Nameplate megawatt capacity (MW)(1) |
57.4 | 32.2 | 25 | |||||||||
| (1) | Operational at end of period. |
Operating revenues during the year ended December 31, 2013 increased by $1.8 million compared to the same period in 2012 primarily due to an increase in incentive revenue of $1.7 million, or 28%, due to the acquisition of the Enfinity projects (acquired by our Sponsor in July 2013), which were included in the results of operations for five months and contributed $1.8 million of incentive revenues during the year ended December 31, 2013. Total nameplate megawatt capacity increased 77% during the year ended December 31, 2013 compared to the same period in 2012 primarily due to the acquisition of the Enfinity projects, which have a total capacity of 15.7 MW, and the completion of solar energy systems with total capacity of 9.3 MW, which reached commercial operations in December 2013. MWh sold increased by 7.9 million, or 15%, due primarily to the acquisition of the Enfinity projects, which contributed sales of 8,009 MWh during the year ended December 31, 2013 and none during the same period in the prior year. At December 31, 2013, we had solar energy projects under construction that will result in an additional 310 MW of nameplate capacity when the projects achieve commercial operations in 2014.
Costs of Operations
| (in thousands) | For the Year Ended December 31, |
|||||||||||
| 2013 | 2012 | Change | ||||||||||
| Cost of operations |
$ | 1,024 | $ | 837 | $ | 187 | ||||||
| Cost of operations—affiliate |
911 | 680 | 231 | |||||||||
|
|
|
|
|
|
|
|||||||
| Total cost of operations |
$ | 1,935 | $ | 1,517 | $ | 418 | ||||||
|
|
|
|
|
|
|
|||||||
Costs of operations, non-affiliate, increased by $0.2 million, or 22%, during the year ended December 31, 2013 compared to the year ended December 31, 2012. This increase was primarily due to an increase in MWh sold as a result of the addition of the Enfinity projects. Cost of operations—affiliate increased $0.2 million during the year ended December 31, 2013 compared to the same period in 2012. The increase is primarily due to additional operations and maintenance expenses related to the Enfinity Projects and Other Project Completions of which 1.8 MW reached COD in December 2012, 0.6 MW that achieved COD in March 2013, and 1.3 MW that reached COD in September 2013.
117
Table of Contents
General and Administrative Expense
General and administrative—affiliate expense increased by $0.8 million to $5.2 million during 2013 compared to $4.4 million during the year ended December 31, 2012. The increase compared to the prior year is due to the overall increase in the nameplate capacity of our operational solar energy systems. General and administrative expense, non-affiliate, increased to $0.3 million for the year ended December 31, 2013 compared to $0.2 million in the year ended December 31, 2012.
Depreciation and Accretion
Depreciation and accretion expense increased by $0.7 million to $5.0 million for the year ended December 31, 2013 compared to the year ended December 31, 2012, due primarily to additional depreciation for solar energy systems that reached commercial operations in late 2012 and throughout 2013 and the acquisition of the Enfinity projects.
Interest Expense, Net
Interest expense, net increased by $0.6 million during the year ended December 31, 2013 compared to the same period in 2012 primarily due to the acquisition of the Enfinity projects, which incurred $0.7 million of interest expense related to term bond and financing leaseback arrangements.
Gain on Foreign Currency Exchange
Gain on foreign currency exchange was $0.8 million for the year ended December 31, 2013 due to transactional gains primarily related to construction in Chile. There was no gain or loss on foreign currency exchange for the year ended December 31, 2012.
Income Tax Benefit
Income tax benefit was $0.1 million for the year ended December 31, 2013 compared to an income tax benefit of $1.3 million during the same period in 2012. The decrease in the income tax benefit compared to the prior year is primarily due to grants received in lieu of tax credits in 2012 that were not received in 2013.
Liquidity and Capital Resources
Our principal liquidity requirements are to finance current operations, service our debt and fund cash dividends to our investors. We will also use capital in the future to finance expansion capital expenditures and acquisitions. Historically, our predecessor operations were financed as part of our Sponsor’s integrated operations and largely relied on internally generated cash flows as well as corporate and/or project-level borrowings to satisfy capital expenditure requirements. As a normal part of our business, depending on market conditions, we will from time to time consider opportunities to repay, redeem, repurchase or refinance our indebtedness. Changes in our operating plans, lower than anticipated electricity sales, increased expenses, acquisitions or other events may cause us to seek additional debt or equity financing in future periods. There can be no guarantee that financing will be available on acceptable terms or at all. Debt financing, if available, could impose additional cash payment obligations and additional covenants and operating restrictions. Equity financing, if any, could result in the dilution of our existing stockholders and make it more difficult for us to maintain our dividend policy. In addition, any of the items discussed in detail under “Risk Factors” in this prospectus may also significantly impact our liquidity.
118
Table of Contents
Liquidity Position
Total liquidity as of September 30, 2014 was approximately $474.2 million comprised of cash and restricted cash of $334.2 million and availability under the Revolver of $140.0 million. Total liquidity as of December 31, 2013 and 2012, was approximately $70.8 million and $8.8 million, respectively, comprised of cash and restricted cash.
On November 26, 2014, we completed the sale of a total of 11,666,667 shares of our Class A common stock in a private placement to certain eligible investors for net proceeds of $337.8 million. We intend to use the net proceeds from the Acquisition Private Placement to fund a portion of the consideration payable by us in the First Wind Acquisition.
With this offering, we intend to issue shares of our Class A common stock with an expected $337.8 million of net proceeds. Additionally, we intend to issue $800 million of senior unsecured notes. We intend to use the net proceeds of this offering and the senior unsecured notes to pay a portion of the purchase price payable by us in the First Wind Acquisition and to repay certain existing debt.
We believe that our liquidity position and cash flows from operations will be adequate to finance growth, operating and maintenance capital expenditures, and to fund dividends to holders of our Class A common stock and other liquidity commitments. Management continues to regularly monitor our ability to finance the needs of operating, financing and investing activities within the dictates of prudent balance sheet management.
Sources of Liquidity
Our principal sources of liquidity include cash on hand, cash generated from operations, borrowings under new and existing financing arrangements and the issuance of additional equity securities as appropriate given market conditions. We expect that these sources of funds will be adequate to provide for our short-term and long-term liquidity needs. Our ability to meet our debt service obligations and other capital requirements, including capital expenditures, as well as make acquisitions, will depend on our future operating performance which, in turn, will be subject to general economic, financial, business, competitive, legislative, regulatory and other conditions, many of which are beyond our control. As described in Note 7. Long-Term Debt our unaudited Consolidated Financial Statements, our financing arrangements as of September 30, 2014 consisted mainly of project-level financings and construction loans for our various assets.
Term Loan and Revolving Credit Facility
In connection with our IPO, Terra Operating LLC entered into the Revolver and the Term Loan, together, the “Credit Facilities.” The Revolver originally provided for up to a $140.0 million senior secured revolving credit facility and the Term Loan originally provided for up to a $300.0 million senior secured term loan. The Term Loan was fully drawn concurrently with our IPO and the proceeds used to refinance a portion of outstanding borrowings under the IPO Bridge Credit Facility. We have obtained a commitment to increase the Term Loan by $275.0 million and the Revolver by $75.0 million to increase liquidity and to fund the Capital Dynamics Acquisition. We have also obtained separate commitments to increase the Revolver to an aggregate size of $450.0 million upon completion of the First Wind Acquisition. See “Description of Certain Indebtedness” for additional information regarding the Credit Facilities.
New Tax Credit Residential Investment Fund
We are in the process of negotiating an investment fund that may include a commitment from a large financial services company to provide tax equity financing for residential projects in conjunction with the our investment of cash equity. We expect the fund could provide financing for residential solar
119
Table of Contents
projects in various locations in the U.S., with a solar lease or PPA, with terms of up to 20 years. If completed, we expect our equity commitment would be deployed, in conjunction with the tax equity financing, over the next twelve months.
We currently do not have commitments from lenders or investors with respect to this potential new investment fund. We are in the process of finalizing the terms relating to the new tax equity financing and, as a result, the final, definitive terms may differ from those described above, and any such differences may be significant. In addition, we may not complete such new investment fund.
Project-Level Financing Arrangements
We have outstanding project-specific non-recourse financing that is backed by certain of our solar energy system assets. The table below summarizes certain terms of our project-level financing arrangements for our portfolio as of September 30, 2014:
| Name of Project |
Aggregate Principal Amount |
Type of Financing |
Maturity Date(s) | |||||
| Distributed Generation: |
(in thousands) | |||||||
| California Public Institutions |
$ | 17,055 | Construction and Term Debt | 2024 - 2025 | ||||
| Enfinity(1) |
30,521 | Finance Lease Obligations | 2025 - 2032 | |||||
| 4,890 | Term Debt | 2032 | ||||||
| Summit Solar U.S.(2) |
24,178 | Term Debt and Finance Lease Obligations | 2020 - 2032 | |||||
| U.S. Projects 2009-2013 |
9,477 | Solar Program Loans | 2024 - 2026 | |||||
| U.S. Projects 2014 |
4,508 | Finance Lease Obligations | 2019 | |||||
|
|
|
|||||||
| Subtotal |
$ | 90,629 | ||||||
|
|
|
|||||||
| Utility: |
||||||||
| CAP(3) |
$ | 212,500 | Term Debt | 2032 | ||||
| 35,388 | VAT Facility | 2014 | ||||||
| Mt. Signal |
413,464 | Senior Notes | 2038 | |||||
| Nellis |
46,107 | Senior Notes | 2027 | |||||
| Regulus Solar(4) |
111,525 | Construction Debt | 2015 | |||||
| 37,935 | Development Loan | 2016 | ||||||
| 9,203 | Finance Lease | 2034 | ||||||
| SunE Perpetual Lindsay |
48,033 | Construction Debt |
2014 | |||||
|
|
|
|||||||
| Subtotal |
$ | 914,155 | ||||||
|
|
|
|||||||
| Total Project-Level Indebtedness |
$ | 1,004,784 | ||||||
|
|
|
|||||||
| (1) | Aggregate principal amount reflects fair value of debt. |
| (2) | On May 22, 2014, we signed a purchase and sale agreement to acquire the equity interests in 23 solar energy systems located in the U.S. from Nautilus Solar PV Holdings, Inc. Eleven of the 23 projects in the U.S. were financed in part by non-recourse project-level amortizing term loans, and seven of the 23 projects were financed in part by a series of sale-leaseback transactions between November 2007 and December 2013. As of September 30, 2014, approximately $24.2 million aggregate principal amount of the term loans and sale-leaseback financing arrangements were outstanding. Aggregate principal amount reflects fair value of debt. |
| (3) | The development and construction of CAP was financed with a $212.5 million term loan and a Chilean peso 22.8 billion VAT loan. The VAT loan was repaid in full on November 6, 2014. |
| (4) | In November 2014, the Construction Debt and Development Loan were refinanced. |
120
Table of Contents
The agreements governing our project-level financing contain financial and other restrictive covenants that limit our project subsidiaries’ ability to make distributions to us or otherwise engage in activities that may be in our long-term best interests. The project-level financing agreements generally prohibit distributions from the project entities to us unless certain specific conditions are met, including the satisfaction of certain financial ratios. For more information regarding the terms of our project-level financing, see “Description of Certain Indebtedness—Project-Level Financing Arrangements.”
Uses of Liquidity
Our principle requirements for liquidity and capital resources, other than for operating our business, can generally be categorized by the following: (i) debt service obligations; (ii) funding acquisitions, if any; and (iii) cash dividends to investors. Generally, once COD is reached, solar power generation assets do not require significant capital expenditures to maintain operating performance.
Debt Service Obligations
The aggregate amounts of payments on long-term debt, excluding amortization of debt discounts, due after September 30, 2014 are as follows:
| (in thousands) | 2014 | 2015 | 2016 | 2017 | 2018 | Thereafter | Total | |||||||||||||||||||||
| Maturities of long-term debt |
$ | 112,435 | $ | 142,924 | $ | 73,617 | $ | 32,972 | $ | 33,996 | $ | 909,615 | $ | 1,305,559 | ||||||||||||||
These amounts do not include any indebtedness we incurred or assumed since that date in connection with expanding our initial project portfolio. See “Unaudited Pro Forma Consolidated Financial Statements.”
Acquisitions
Following the completion of this offering, we expect to continue to acquire additional projects. Although we have no commitments to make any such acquisitions, we expect to acquire certain of the Call Right Projects and ROFO Projects. We do not expect to have sufficient amounts of cash on hand to fund the acquisition costs of all of such Call Right Projects and ROFO Projects. As a result, we will need to finance a portion of such acquisitions by either raising additional equity or issuing new debt. We believe that we will have the financing capacity to pursue such opportunities, but we are subject to business, operational and macroeconomic risks that could adversely affect our cash flows and ability to raise capital. A material decrease in our cash flows or downturn in the equity or debt capital markets would likely produce a corresponding adverse effect on our ability to finance such acquisitions.
Cash Dividends to Investors
We intend to cause Terra LLC to distribute to its unitholders in the form of a quarterly distribution a portion of the cash available for distribution that is generated each quarter. In turn, we intend to use the amount of cash available for distribution that TerraForm Power receives from such distribution to pay quarterly dividends to the holders of our Class A common stock. The cash available for distribution is likely to fluctuate from quarter to quarter and in some cases significantly if any projects experience higher than normal downtime as a result of equipment failures, electrical grid disruption or curtailment, weather disruptions or other events beyond our control. We expect our dividend payout ratio to vary as we intend to maintain or increase our dividend despite variations in our cash available for distribution from period to period.
See “Cash Dividend Policy.”
121
Table of Contents
Cash Flow Discussion
We use traditional measures of cash flow, including net cash provided by operating activities, net cash used in investing activities and net cash provided by financing activities, as well as cash available for distribution to evaluate our periodic cash flow results.
Nine Months Ended September 30, 2014 Compared to Nine Months Ended September 30, 2013
The following table reflects the changes in cash flows for the comparative periods:
| Nine Months Ended September 30, |
||||||||||||
| (In thousands) | 2014 | 2013 | Change | |||||||||
| Net cash provided by (used in) operating activities |
$ | 27,567 | $ | (44,111 | ) | $ | 71,678 | |||||
| Net cash used in investing activities |
(969,592 | ) | (5,534 | ) | (964,058 | ) | ||||||
| Net cash provided by financing activities |
1,200,686 | 50,047 | 1,150,639 | |||||||||
| Effect of exchange rate changes on cash and cash equivalents |
(342 | ) | — | (342 | ) | |||||||
|
|
|
|
|
|
|
|||||||
| Total |
$ | 258,319 | $ | 402 | $ | 257,917 | ||||||
|
|
|
|
|
|
|
|||||||
Net Cash Provided By Operating Activities
The change in net cash provided by operating activities is primarily driven by the timing of cash payments to SunEdison and affiliates for reimbursement of operating expenses paid by those entities and the impact of operating results for projects acquired during the nine months ended September, 30, 2014.
Net Cash Used in Investing Activities
The change in net cash used in investing activities includes $614.1 million of cash paid to SunEdison and third parties for the construction of solar energy systems, cash paid to third parties for acquisitions of solar systems, cash paid to third parties for the acquisition of PPA intangible assets, and changes in restricted cash in accordance with the restrictions in our debt agreements. When SunEdison contributes projects, we recast our cash flow statement to present construction costs incurred by SunEdison as if they were our construction costs. SunEdison continues to maintain the construction risk for all contributed projects.
Net Cash Provided By Financing Activities
The change in net cash provided by financing activities is primarily driven by $433.6 million of net proceeds from the IPO, proceeds from construction and term debt financing arrangements and contributions from SunEdison to fund capital expenditures.
Year Ended December 31, 2013 Compared to Year Ended December 31, 2012
The following table reflects the changes in cash flows for the comparative periods:
| For the Year Ended December 31, |
||||||||||||
| (in thousands) | 2013 | 2012 | $ Change | |||||||||
| Net cash (used in) provided by operating activities |
$ | (7,202 | ) | $ | 2,890 | $ | (10,092 | ) | ||||
| Net cash used in investing activities |
(264,239 | ) | (410 | ) | (263,829 | ) | ||||||
| Net cash provided by (used in) financing activities |
272,482 | (2,477 | ) | 274,959 | ||||||||
|
|
|
|
|
|
|
|||||||
| Total |
$ | 1,041 | $ | 3 | $ | 1,038 | ||||||
|
|
|
|
|
|
|
|||||||
122
Table of Contents
Net Cash (Used In) Provided By Operating Activities
The change to net cash provided by operating activities is primarily driven by the timing of cash payments to our Sponsor and affiliates for reimbursement of operating expenses paid by the same or other affiliates of our Sponsor. In addition, changes in current assets and liabilities used cash of $10.2 million during 2013 compared to $0.5 million during 2012 primarily due to an increase in VAT receivable related to the construction of the CAP project in Chile during fiscal 2013.
Net Cash Used By Investing Activities
The change to net cash used by investing activities is driven by capital expenditures related to the construction of solar energy systems and changes in restricted cash in accordance with the restrictions in our debt agreements.
Net Cash Provided By (Used In) Financing Activities
The change in net cash provided by financing activities is primarily driven by proceeds from system construction and term debt financing arrangements which were partially offset by distributions to our Sponsor.
Contractual Obligations and Commercial Commitments
We have a variety of contractual obligations and other commercial commitments that represent prospective cash requirements. The following table summarizes our outstanding contractual obligations and commercial commitments as of September 30, 2014.
| Payment due by Period | ||||||||||||||||||||
| Contractual Cash Obligations (in thousands) |
Under 1 Year |
1-3 Years | 3-5 Years |
Over 5 Years | Total | |||||||||||||||
| Long-term debt (principal) |
$ | 101,737 | $ | 140,441 | $ | 71,019 | $ | 948,130 | $ | 1,261,327 | ||||||||||
| Long-term debt (interest) |
72,543 | 116,456 | 101,808 | 391,079 | 681,886 | |||||||||||||||
| Financing lease obligations |
10,699 | 2,483 | 2,597 | 28,454 | 44,233 | |||||||||||||||
| Purchase obligations(1) |
10,691 | 20,571 | 25,599 | 113,724 | 170,585 | |||||||||||||||
| Asset retirement obligations |
— | — | — | 44,749 | 44,749 | |||||||||||||||
|
|
|
|
|
|
|
|
|
|
|
|||||||||||
| Total contractual obligations |
$ | 195,670 | $ | 279,951 | $ | 201,023 | $ | 1,526,136 | $ | 2,202,780 | ||||||||||
|
|
|
|
|
|
|
|
|
|
|
|||||||||||
| (1) | Consists primarily of contractual payments due for operation and maintenance services, asset management services, and site lease rent. Does not include payments under the Management Services Agreement. |
Off-Balance Sheet Arrangements
We are not a party to any off-balance sheet arrangements.
Critical Accounting Policies and Estimates
Our discussion and analysis of our financial condition and results of operations are based on our historical financial statements that are included elsewhere in this prospectus, which have been prepared in accordance with GAAP. In applying the critical accounting policies set forth below, our management uses its judgment to determine the appropriate assumptions to be used in making certain estimates. These estimates are based on management’s experience, the terms of existing contracts, management’s observance of trends in the power industry, information provided by our power purchasers and information available to management from other outside sources, as appropriate. These estimates are subject to an inherent degree of uncertainty.
123
Table of Contents
We use estimates, assumptions and judgments for certain items, including the depreciable lives of property and equipment, income tax, revenue recognition and certain components of cost of revenue. These estimates, assumptions and judgments are derived and continually evaluated based on available information, experience and various assumptions we believe to be reasonable under the circumstances. To the extent these estimates are materially incorrect and need to be revised, our operating results may be materially adversely affected.
Our significant accounting policies are summarized in Note 2. Summary of Significant Accounting Policies, to our audited consolidated financial statements included elsewhere in this prospectus. We identify our most critical accounting policies as those that are the most pervasive and important to the portrayal of our financial position and results of operations, and that require the most difficult, subjective and/or complex judgments by management regarding estimates about matters that are inherently uncertain.
Use of Estimates
In preparing our consolidated financial statements, we use estimates and assumptions that affect the reported amounts of assets and liabilities at the date of the financial statements. Such estimates also affect the reported amounts of revenues and expenses during the reporting period. Actual results may differ from estimates under different assumptions or conditions.
Asset Retirement Obligations
We operate under solar power services agreements with some customers that include a requirement for the removal of the solar energy systems at the end of the term of the agreement. Asset retirement obligations are recognized at fair value in the period in which they are incurred and the carrying amount of the related long-lived asset is correspondingly increased. Over time, the liability is accreted to its expected future value. The corresponding asset capitalized at inception is depreciated over the useful life of the asset.
Revenue Recognition
Power Purchase Agreements
A significant majority of our revenues are obtained through the sale of energy (based on MW) pursuant to terms of PPAs or other contractual arrangements which have a weighted-average remaining life of 20 years as of September 30, 2014. All PPAs are accounted for as operating leases, have no minimum lease payments and all of the rental income under these leases is recorded as income when the electricity is delivered.
Incentive Revenue
We also generate solar renewable energy certificates, or “RECs,” as we produce electricity. These RECs are currently sold pursuant to agreements with our parent, third parties and a certain debt holder, and revenue is recognized as the underlying electricity is produced.
We also receive PBIs from public utilities in connection with certain sponsored programs. We have a PBI arrangement with the State of California. PBI arrangements within the State of California are agreements whereby we will receive a set rate multiplied by the kWh production on a monthly basis for 60 months. The PBI revenue is recognized as energy is generated over the measurement period. We recognize revenue based on the rate applicable at the time the energy is created and adjusts the amount recognized when we meet the threshold that qualifies us for the higher rate. PBI in the state of
124
Table of Contents
Colorado has a 20-year term at a fixed price per kWh produced. The revenue is recognized as energy is generated over the term of the agreement.
Stock-Based Compensation
In April 2014, we adopted the 2014 Second Amended and Restated Long-Term Incentive Plan, or “2014 Plan,”, which permits us to issue an aggregate of 8,586,614 shares of Class A common stock pursuant to equity awards including incentive and nonqualified stock options, restricted stock awards, or “RSAs,” and restricted stock units, or “RSUs,” to employees and directors. RSAs provide the holder with immediate voting rights, but are restricted in all other respects until vested. Upon cessation of services to us, any unvested RSAs will be canceled. All unvested RSAs are paid dividends and distributions. We measure the fair value of RSAs and RSUs at the grant date fair value of Class A common stock and account for stock-based compensation expense by amortizing the fair value on a straight line basis over the related vesting period less estimated forfeitures.
In 2014, we made grants of 4,977,586 RSAs to certain executives and an affiliate of ours. In connection with our IPO and on several occasions since then, we granted approximately 830,000 RSUs to employees and persons providing services to us. In addition, we granted 150,000 stock options to new hires. As of September 30, 2014, an aggregate of 2,659,131 shares of Class A common stock were available for issuance under the 2014 Plan. The stock-based compensation expense related to issued stock options, RSAs, and RSUs is recorded as a component of general and administrative expenses in our consolidated statements of operations and totaled $1.3 million and $1.6 million for the three months and nine months ended September 30, 2014, respectively.
Restricted Class C Awards
On January 31, 2014 and February 20, 2014, we granted 27,647 and 14,118 shares of restricted Class C common stock, respectively (or 2,373,946 and 1,212,228 shares, respectively, of restricted Class A common stock after giving effect to conversion of restricted Class C common stock to restricted Class A common stock on an 85.8661-for-one basis immediately prior to the completion of our IPO), under the SunEdison Yieldco, Inc. 2014 Plan.
For the restricted Class C common stock converted to unvested, restricted Class A common stock in connection with our IPO, 25% of the unvested, restricted Class A common stock will vest on the first anniversary of the date of the grant, 25% will vest on the second anniversary of the date of the grant, and 50% will vest on the third anniversary of the date of grant, subject to accelerated vesting upon certain events. Under certain circumstances upon a termination of employment, any unvested shares of unvested, restricted Class A common stock held by the terminated executive will be forfeited.
Restricted Class A Awards
On January 29, 2014 and February 20, 2014, we granted 7,193 and 3,749 shares of restricted Class A common stock, respectively (or 914,680 and 476,732 shares, respectively, after giving effect to the 127.1624-for-one stock split), to certain individuals under the 2014 Incentive Plan.
125
Table of Contents
The following table summarizes restricted stock awards activity under the 2014 Plan for the nine months ended September 30, 2014, after giving effect to both the conversion of restricted Class C common stock to restricted Class A common stock on an 85.8661-for-one basis and the 127.1624-for-one Class A common stock split immediately prior to the completion of our IPO:
| Number of RSAs Outstanding |
Weighted-Average Grant Date Fair Value Per Share |
|||||||
| Balance at January 1, 2014 |
— | $ | — | |||||
| Granted |
4,977,586 | 0.57 | ||||||
|
|
|
|
|
|||||
| Balance at September 30, 2014 |
4,977,586 | $ | 0.57 | |||||
|
|
|
|
|
|||||
The amount of stock compensation expense related to the restricted Class C common stock awards, which were converted to restricted Class A awards in connection with our IPO, was $0.2 million and $0.4 million during the three and nine months ended September 30, 2014, respectively. As of September 30, 2014, $1.6 million of total unrecognized compensation cost related to these awards is expected to be recognized over a period of approximately 3 years. The fair value of restricted stock on the date of grant was $58.00 per share (or $0.68 per share after giving effect to conversion of Class C restricted common stock to Class A common stock on an 85.8661-for-one basis upon the closing of the IPO) or $2.4 million total.
The amount of stock compensation expense related to the Class A restricted common stock awards, which was recognized upon the completion of the IPO, was $0.4 million. The restriction of these awards expires over three years; however, the awards are not subject to forfeiture for any reason. There is no unrecognized stock compensation expense related to the restricted Class A common stock at September 30, 2014. The fair value of Class A common stock on the date of grant was $37.00 per share (or $0.29 per share after giving effect to the 127.1624-for-one stock split) or $0.4 million.
In estimating the fair value of our Class C restricted common stock and Class A restricted common stock, the primary valuation considerations were an enterprise value determined from an income-based approach using an enterprise value multiple applied to its forward revenue metric and a lack of marketability discount of 15%. The illiquidity discount model used the following assumptions: a time to liquidity event of 6 months; a risk free rate of 3.4%; and volatility of 60% over the time to a liquidity event. Estimates of the volatility of the our Class A common stock were based on available information on the volatility of Class A common stock of comparable publicly traded companies.
Restricted Stock Units
The following table presents information regarding outstanding RSUs as of September 30, 2014, and changes during the nine months ended September 30, 2014:
| Number of RSUs Outstanding |
Weighted-Average Grant Date Fair Value Per Share |
|||||||
| Balance at January 1, 2014 |
— | $ | — | |||||
| Granted |
799,897 | 27.43 | ||||||
|
|
|
|
|
|||||
| Balance at September 30, 2014 |
799,897 | $ | 27.43 | |||||
|
|
|
|
|
|||||
The amount of stock compensation expense related to RSUs was $0.7 million during the three and nine months ended September 30, 2014. As of September 30, 2014, $17.9 million of total unrecognized compensation cost related to RSUs is expected to be recognized over a period of approximately three years.
126
Table of Contents
Options
The following table presents information regarding outstanding options as of September 30, 2014, and changes during the nine months ended September 30, 2014:
| Number of Options Outstanding |
Weighted-Average Grant Date Fair Value Per Share |
Aggregate Intrinsic value |
||||||||||
| Balance at January 1, 2014 |
— | $ | — | $ | — | |||||||
| Granted |
150,000 | 29.31 | — | |||||||||
|
|
|
|
|
|
|
|||||||
| Balance at September 30, 2014 |
150,000 | $ | 29.31 | $ | — | |||||||
|
|
|
|
|
|
|
|||||||
The amount of stock compensation expense related to options was inconsequential during the three and nine months ended September 30, 2014. As of September 30, 2014, $2.1 million of total unrecognized compensation cost related to options is expected to be recognized over a period of approximately four years.
Common Stock Valuation
Prior to our IPO, we were required to estimate the fair value of the common stock when performing the fair value calculations. The fair value of the restricted shares was determined by our board of directors, with input from management and contemporaneous third-party valuations. We believe that our board of directors has the relevant experience and expertise to determine the fair value of our common stock. As described below, the fair value of the restricted shares was determined by our board of directors with reference to the most recent contemporaneous third-party valuation as of the grant date.
Given the absence of a public trading market of our common stock prior to our IPO, and in accordance with the American Institute of Certified Public Accountants Accounting and Valuation Guide: Valuation of Privately-Held-Company Equity Securities Issued as Compensation, our board of directors exercised reasonable judgment and considered numerous objective and subjective factors to determine the best estimate of the fair value of our common stock including:
| • | contemporaneous valuations performed by unrelated third-party specialists; |
| • | our operating and financial performance; |
| • | current business conditions and projections; |
| • | hiring of key personnel and the experience of our management; |
| • | our stage of development; |
| • | stage of project acquisitions, construction and revenue arrangements; |
| • | likelihood of achieving a liquidity event, such as an initial public offering or a sale of us; |
| • | lack of marketability of our common stock; |
| • | the market performance of comparable publicly traded companies; and |
| • | the U.S. and global capital market conditions. |
In valuing our common stock, our board of directors determined the equity value of our business using the income approach valuation method. The income approach estimates value based on the expectation of future cash flows that a company will generate. These future cash flows are discounted to their present values using a discount rate derived from an analysis of the cost of capital of comparable publicly traded companies in our industry or similar lines of business as of the valuation date and is adjusted to reflect the risks inherent in our cash flows.
127
Table of Contents
Once we determined an equity value, we used the Probability Weighted Expected Return Method, or “PWERM,” to allocate our equity value among the various outcomes. Under the PWERM, the value of equity is estimated based on analyses of future values for the enterprise assuming various possible outcomes. Share value is based on the probability-weighted present value of expected future returns to the equity investor, considering the likely future scenarios available to the enterprise and the rights and preferences of each share class.
After the equity value is determined, a discount for lack of marketability is applied to our common stock to arrive at the fair value of our common stock. The probability and timing of each scenario were based upon discussions between our board of directors and our management team. Under the PWERM, the value of our common stock was based upon two possible future events for our company:
| • | initial public offering; and |
| • | no initial public offering. |
We believe we applied a reasonable valuation method to determine the estimated fair value of our common stock on the respective grant dates.
Between December 31, 2013 and our IPO, we granted the following shares:
| Historical | As Converted(1) | |||||||||||||||
| Grant Date |
Number of Shares |
Fair Value Per Share on Date of Grant |
Number of Shares |
Fair Value Per Share on Date of Grant |
||||||||||||
| Restricted Class C Shares |
||||||||||||||||
| January 31, 2014 |
27,647 | $ | 58 | 2,373,946 | $ | 0.68 | ||||||||||
| February 20, 2014 |
14,118 | $ | 58 | 1,212,228 | $ | 0.68 | ||||||||||
| Class A Shares |
||||||||||||||||
| January 29, 2014 |
7,193 | $ | 37 | 897,452 | $ | 0.30 | ||||||||||
| February 20, 2014 |
3,749 | $ | 37 | 467,753 | $ | 0.30 | ||||||||||
| (1) | In connection with our IPO, we effected a 124.7674-for-one stock split of the outstanding shares of our Class A common stock and our Class C common stock was converted into shares of our Class A common stock on a 85.8661-for-one basis. |
The restricted stock are subject to time-based vesting conditions, whereby 25% of the Class A common stock will vest on the first anniversary of the date of the grant, 25% will vest on the second anniversary of the date of the grant, and 50% will vest on the third anniversary of the date of grant, subject to accelerated vesting upon certain events. Under certain circumstances upon a termination of employment, any unvested shares of Class A common stock held by the terminated employee will be forfeited. The restricted stock awards are subject to certain adjustments to prevent dilution at the time of conversion to Class A common stock.
The Class A shares are subject to time-based vesting conditions, with 34% vesting upon the six-month anniversary of our IPO, 33% vesting upon the one-year anniversary of our IPO and 33% vesting upon the 18-month anniversary of our IPO. These restricted shares will not be subject to forfeiture in the event of a termination of employment and vesting is not accelerated upon a change of control.
Valuation Inputs
In estimating the fair value of our common stock prior to our IPO, our board of directors considered a valuation analysis for our common stock dated as of January 31, 2014. The valuation
128
Table of Contents
analysis reflected a fair value for our common stock of $68.6 million. The primary valuation considerations were an enterprise value determined from the income-based approach using an enterprise value multiple applied to our forward revenue metric and a lack of marketability discount of 15%. The illiquidity discount model utilized the following assumptions: a time to liquidity event of six months; a risk free rate of 3.4%; and volatility of 60% over the time to a liquidity event. Estimates of the volatility of our common stock were based on available information on the volatility of common stock of comparable publicly traded companies. Our board of directors considered the proximity relative to the January 31, 2014 valuation and our financial performance in establishing the fair value of the common stock prior to our IPO.
Recent Accounting Pronouncements
On May 28, 2014, the Financial Accounting Standards Board, or “FASB,” issued Accounting Standards Update, or “ASU,” No. 2014-09, Revenue from Contracts with Customers, which requires an entity to recognize the amount of revenue to which it expects to be entitled for the transfer of promised goods or services to customers. This ASU will replace most existing revenue recognition guidance in GAAP when it becomes effective. The new standard is effective for us on January 1, 2017. Early application is not permitted. The standard permits the use of either the retrospective or cumulative effect transition method. We are currently evaluating the effect that ASU 2014-09 will have on its consolidated financial statements and related disclosures. We have not yet selected a transition method or determined the effect of the standard on its ongoing financial reporting.
In August 2014, the FASB issued Accounting Standards Update No. 2014-15, Presentation of Financial Statements-Going Concern. ASU 2014-15 is intended to define management’s responsibility to evaluate whether there is substantial doubt about an organization’s ability to continue as a going concern and to provide related footnote disclosures. This guidance is effective for the annual period ending December 31, 2016 and interim and annual periods thereafter. We do not expect the adoption of this standard to have a material impact on our consolidated financial position, results of operations and cash flows
Quantitative and Qualitative Disclosures About Market Risk
We are exposed to several market risks in our normal business activities. Market risk is the potential loss that may result from market changes associated with our business or with an existing or forecasted financial or commodity transaction. The types of market risks we are exposed to are interest rate risk, foreign currency risk, liquidity risk and credit risk.
Interest Rate Risk
As of September 30, 2014 our long-term debt was at both fixed and variable interest rates. A hypothetical increase or decrease in our variable interest rates by 1% would not have had a significant effect on our earnings for the three and nine months ended September 30, 2014. As of September 30, 2014, the estimated fair value of our debt was $1,366.2 million and the carrying value of our debt was $1,304.0 million. We estimate that a 1% decrease in market interest rates would have increased the fair value of our long-term debt by $71.8 million.
We entered into the Term Loan and the Revolver upon completion of our IPO. Borrowings under the Term Loan and Revolver are at variable rates. Under the agreement governing the Term Loan, we are required to hedge 50% of our notional amount for the first three years. Although we intend to use hedging strategies to mitigate our exposure to interest rate fluctuations, we may not hedge all of our interest rate risk and, to the extent we enter into interest rate hedges, our hedges may not necessarily have the same duration as the associated indebtedness. Our exposure to interest rate fluctuations will
129
Table of Contents
depend on the amount of indebtedness that bears interest at variable rates, the time at which the interest rate is adjusted, the amount of the adjustment, our ability to prepay or refinance variable rate indebtedness when fixed rate debt matures and needs to be refinanced and hedging strategies we may use to reduce the impact of any increases in rates.
Foreign Currency Risk
In 2013, all of our operating revenues were generated in the United States and Puerto Rico and were denominated in United States dollars. During the nine months ended September 30, 2014, we generated operating revenues in the US, Puerto Rico, Canada the United Kingdom, and Chile, and all of our revenues were denominated in US dollars, Canadian dollars, and British pounds. The PPAs, operating and maintenance agreements, financing arrangements and other contractual arrangements relating to our current project portfolio is US dollar, British pound and Canadian dollar denominated. We expect to use derivative financial instruments, such as forward exchange contracts and purchases of currency options to minimize our net exposure to currency fluctuations.
130
Table of Contents
Overview of the Clean Energy Industry
Clean power sources, including solar, wind, hydro-electricity and geothermal, as well as natural gas, are expected to account for 70% of the new power generation capacity added globally from 2013 to 2020, according to Bloomberg New Energy Finance. This represents a 5.6% compound annual growth rate, or “CAGR,” for clean power generation capacity during that time period, making it the fastest growing source of generation capacity. The following chart reflects the projected evolution of cumulative installed generation capacity from various power sources from 2010 to 2020:
Global Cumulative Installed Generation Capacity (GW), 2010-2020
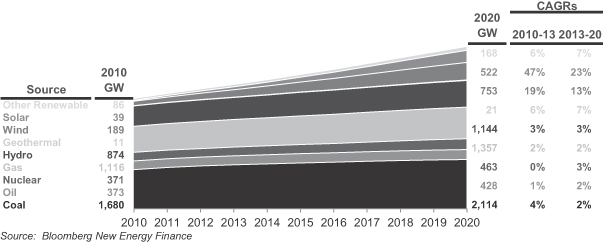
In the United States, renewable energy is expected to be the fastest growing form of electricity generation. Between 2010 and 2020, renewable energy sources are projected to grow from 10% to 15% of total market supply, representing nearly half the total growth in energy supply during that period, according to the U.S. Energy Information Administration (EIA). The following chart reflects the projected growth in renewable and conventional energy sources from 2010 to 2020:
US Energy Supply (Trillion kWh), 2010-2020
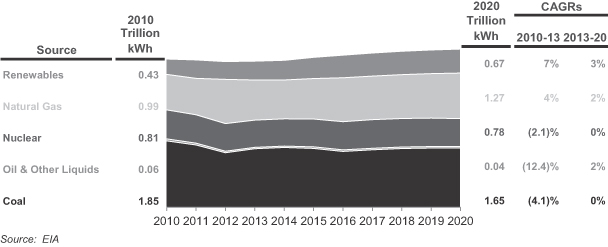
131
Table of Contents
Key Drivers of Clean Energy Industry Growth
We expect the renewable generation segment to continue to offer high growth opportunities driven by the following factors, among others:
| • | the significant reduction in the cost of solar, wind and other clean energy technologies, which will lead to grid parity in an increasing number of markets; |
| • | transmission and distribution charges and the effects of an aging transmission infrastructure, which enable renewable energy generation sources located at a customer’s site, or distributed generation, to be more competitive with, or cheaper than, grid-supplied electricity; |
| • | the replacement of aging and conventional power generation facilities in the face of increasing industry challenges, such as regulatory barriers, increasing costs of and difficulties in obtaining and maintaining applicable permits, and the decommissioning of certain types of conventional power generation facilities, such as coal and nuclear facilities; |
| • | the ability to couple renewable power generation with other forms of power generation, creating a hybrid energy solution capable of providing energy on a 24/7 basis while reducing the average cost of electricity obtained through the system; |
| • | the desire of energy consumers to lock in predictable rate long-term pricing of a reliable energy source; |
| • | renewable power generation’s ability to utilize freely available sources of fuel avoiding the risks of price volatility and market disruptions associated with many conventional fuel sources; |
| • | the desire to decrease the dependence on foreign energy sources while meeting future demand growth; |
| • | environmental concerns over conventional power generation; |
| • | increasing obstacles for developing new conventional power projects, including rising costs from environmental regulation; and |
| • | government policies that encourage development of renewable power, such as state or provincial renewable portfolio standard programs, which motivate utilities to procure electricity supply from renewable resources (See “Business—Government Incentives” for a discussion of government programs and incentives applicable to our business). |
In addition to renewable energy, we expect natural gas to grow as a source of electricity generation due to its relatively lower cost and lower environmental impact compared to other fossil fuel sources, such as coal and oil.
132
Table of Contents
Solar Energy
Solar energy is one of the fastest growing sources of new electricity generation. According to Bloomberg New Energy Finance, global solar photovoltaic, or “PV,” annual installations have grown from 17.0 GW in 2010 to approximately 30.0 GW in 2013, and are projected to grow to 68.0 GW by 2020. The following chart reflects the growth or expected growth, as applicable, for global solar annual PV installations from 2010 to 2020:
Global Solar Annual PV Installations (GW), 2010-2020
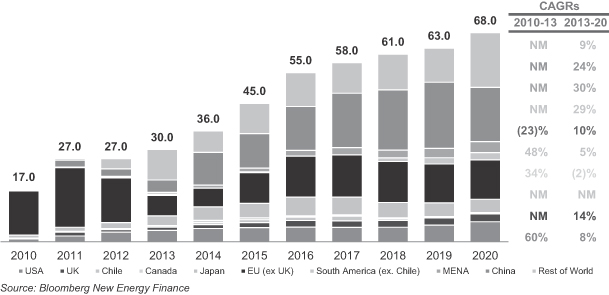
Solar Energy Segments
Solar energy systems can be classified into four segments: (i) utility-scale, (ii) commercial and industrial, or “C&I,” (iii) residential and (iv) off-grid. We are focused on the first three of these segments. The utility-scale segment represents projects where either the purchaser of the electricity or the owner of the system is an electric utility. The C&I segment represents commercial firms, industrial companies, academic institutions, government entities, hospitals, non-profits and all other entities that are neither a utility nor a residential customer that purchase solar power directly from a generation company or a solar power plant. The residential segment represents residential homeowners with solar generation capabilities.
While solar utility projects compete with other wholesale generation plants, solar energy in the C&I and residential markets competes with the retail price of electricity. The retail electricity price includes generation costs as well as transmission and distribution charges. Solar generating assets can be located at a customer’s site, which reduces the customer’s transmission and distribution charges and allows these distributed solar generation assets to compete favorably with the retail cost of electricity. By competing with the retail price of electricity, solar energy is able to reach grid parity and reduce customer electricity costs.
133
Table of Contents
Key Drivers of Solar Energy Growth
We believe the following factors have driven, and will continue to drive, the global growth of solar energy:
Grid parity. The price of solar energy has undergone, and is expected to continue to undergo, a decline in pricing. On a global basis, the average total installation cost of solar PV projects is expected to decline by more than 60% in the ten-year period ending in 2020. In 2010, the average installation cost per watt of capacity was $4.50 and fell to $2.17 in 2013. By 2020, this number is expected to fall to $1.77 according to Bloomberg New Energy Finance.
According to the EIA, total sales of retail electricity in the United States in 2012 were $364 billion. United States retail electricity prices have increased at an average annual rate of 3.6% and 2.7% from 2004 to 2012 for residential and commercial customers, respectively, with average residential prices rising from 8.95 cents to 11.88 cents per kilowatt hour, or “kWh,” and average commercial prices rising from 8.17 cents to 10.09 cents per kWh over this period, according to EIA.
Rising electricity rates are driven by the following factors: (i) increasing transmission and distribution charges, (ii) the replacement of aging fossil fuel plants with newer, but in some cases more expensive plants, and (iii) smart-grid architecture goals/investments. Rising retail electricity prices create a significant and growing market opportunity for lower-cost retail energy. Solar energy may be able to offer C&I and residential customers clean electricity at a price lower than their current utility rate. The following chart reflects the actual and projected average U.S. retail electricity prices across all sectors from 2011 to 2020:
Average U.S. Electricity Prices (Cents per KWh), 2011-2020
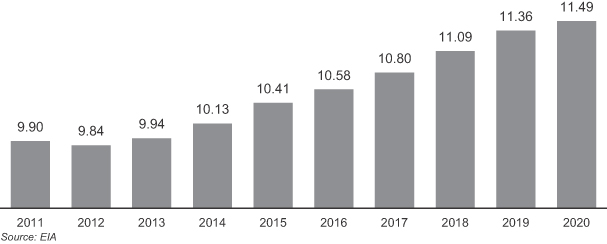
Movement to Distributed Generation. Although some locations are more suitable than others, solar energy systems can generate electricity nearly anywhere. By contrast, hydro-electricity power, wind or geothermal electricity generating systems are site specific and location is critical. This means power generated by solar PV systems can sometimes be delivered at a relatively low cost to areas that were previously difficult to service, have high transmission and distribution charges or have high load requirements. Solar power can, in some places where the cost of generation is very high, replace or significantly reduce the use of expensive and environmentally detrimental power generation technologies, such as diesel generators.
134
Table of Contents
Distributed solar energy systems provide customers with an alternative to traditional utility energy suppliers. Distributed resources are smaller in unit size and can be constructed at a customer’s site, removing the need for lengthy transmission and distribution lines. By bypassing the traditional utility suppliers, distributed energy systems delink the customer’s price of power from external factors such as volatile commodity prices, costs of the incumbent energy supplier and transmission and distribution charges. This makes it possible for distributed energy purchasers to buy energy at a predictable and stable price over a long period of time.
Solar Power Generation Typically Coincides with the Times of Peak Energy Demand and the Highest Cost of Energy. Solar energy systems generate most of their electricity during the afternoon hours, when the energy from the sun is strongest. This generally corresponds to peak demand hours and the most expensive energy prices. Certain markets offer pricing incentives for power produced during peak demand hours, which often benefits solar power.
Acceptance and Support for Solar Energy. Solar as an asset class for investment dollars continues to see increased acceptance because solar energy: (i) is a reliable and predictable energy output; (ii) has low and predictable operational and maintenance costs; (iii) is lower risk than other energy sources due to minimal asset complexity and use of proven technologies; and (iv) does not face commodity risk.
Solar Energy Markets
Set forth below is a summary of the key markets in which the projects in our initial portfolio operate.
135
Table of Contents
United States
In the United States, solar PV installations have grown at a CAGR of 59.9% from 2010 to 2013, and are projected to grow at an annualized rate of 8.3% from 2013 to 2020, according to Bloomberg New Energy Finance. The following chart reflects the actual and projected growth in annual solar PV installations by residential, commercial and utility segments from 2010 to 2020:
U.S. Solar Annual PV Installations (GW), 2010-2020
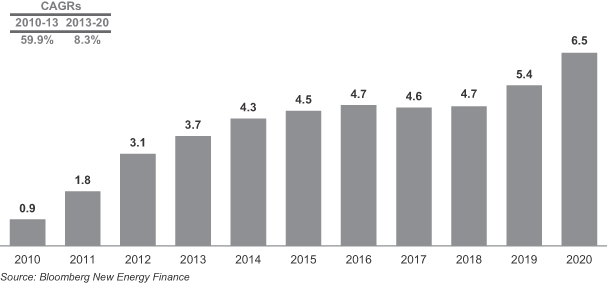
According to GTM Research and SEIA, solar represented the second-largest source of new electricity generating capacity in the United States in 2013, exceeded only by natural gas.
Solar Energy in Our Other Core Markets
In addition to the United States, we currently own and operate solar assets in Canada, the United Kingdom and Chile, all of which have favorable attributes for growth of solar generation.
Canada. In 2012, total electricity generation capacity in Canada reached 134 GW and is expected to grow to 164 GW in 2035, according to the National Energy Board of Canada. Driven by government support for renewable energy at both federal and provincial levels, Canada installed a total of 744 MW of solar generation in 2012 and 2013, representing an investment of $2.4 billion, according to Bloomberg New Energy Finance. Canada expects to install 3.3 GW of solar generation during the period from 2014 to 2020, requiring an aggregate investment of $6.4 billion, according to Bloomberg New Energy Finance.
United Kingdom. Currently, the U.K. government supports the development of renewable energy projects principally through ROCs and feed-in tariffs, or “FiTs.” The market continues to be active in utility PV under the ROC scheme, and commercial and residential PV markets have experienced steady and sustained growth in recent years. The Government launched the Contract for Differences program to replace the ROC regime and the first round of applications are currently being reviewed. The current proposal is that all solar and wind projects above 5 MW in size interconnected after March 30, 2015 may no longer benefit from ROCs. Final legislation confirming the end of the ROC regime is expected in January 2014.
136
Table of Contents
According to Bloomberg New Energy Finance, solar installations in the United Kingdom in 2012 and 2013 totaled 1.9 GW, representing a total investment of $7.4 billion. During the period from 2014 to 2020, 14.0 GW of solar installations are expected, requiring an aggregate investment of $25.9 billion.
Chile. In October 2013, Chile increased its clean energy generation target to 20% by 2025, from their prior target of 10% by 2024. The target applies to new capacity contracted starting from June 2013 in Chile’s Central and Greater Northern Interconnected System, the two largest power systems in the country. With Chile’s electricity demand expected to almost double by 2025 to 105 TWh of power consumption annually, the 20% target represents a net addition of up to 7.4 GW of renewable capacity, according to Bloomberg New Energy Finance.
Chile is well positioned for substantial growth in renewable capacity through solar generation, driven by favorable conditions such as having some of the highest rates of solar insolation in the world, the new 20% renewable target by 2025, and, in some cases, solar generation already being competitive with wholesale pricing. According to Bloomberg New Energy Finance, 4.7 GW of solar installations are expected in Chile during the period from 2014 to 2020, requiring an aggregate investment of $6.8 billion.
Wind Energy
Wind energy has been one of the fastest growing sources of electricity generation in North America and globally over the past decade. According to the Global Wind Energy Council (GWEC), global installed wind capacity at the end of 2013 was at 318.1 GW, and the GWEC forecasts that it will reach 415.4 GW by the end of 2015, representing a 23% CAGR since 2001.
Cumulative Installed Wind Capacity Globally (GW), 2001-2015
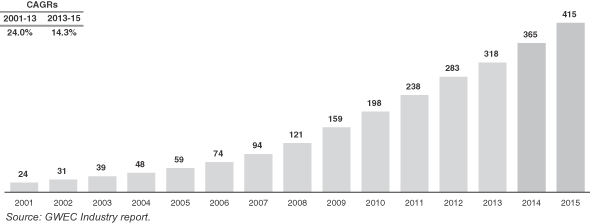
In the United States, according to the GWEC, from 2001 to 2012, net electricity generation from wind energy grew at a CAGR of 27%. The United States is the second largest market for wind energy in the world by electricity generating capacity. According to the Department of Energy (DoE), wind energy was the second largest source of new electricity generating capacity in the United States after natural gas for six of the seven years between 2005 and 2011. In 2012, according to the American Wind Energy Association (AWEA), wind was the number one source of new U.S. generating capacity, with a historic high of 13,124 MW of generating wind capacity installed, representing 43% of all new U.S. electric generation capacity.
137
Table of Contents
The success of wind energy is evidenced by approximately $125 billion in investments since 1980, according to the DoE. In 2013, wind energy generating capacity reached a total of 61 GW, equivalent to powering over 15 million homes every year. As of the end of 2013, 39 of the 50 U.S. states and Puerto Rico had utility-scale wind projects, and 16 states had more than 1,000 MW of wind energy generating capacity according to AWEA.
Despite the strong growth over the past decade, based on the DoE, wind energy equates to only 4.5% of electricity demand in the United States as of the end of 2013. This represents a small portion compared with other countries. Installed wind energy is estimated to supply the equivalent of 34% of Denmark’s electricity demand and approximately 20% of Spain, Portugal and Ireland’s demand, based on data from the DoE. Given the wind energy’s relatively small penetration in the U.S., we believe that substantial growth potential in wind energy development remains.
More recently, uncertainty related to the demand for new power projects in general and the potential expiration of U.S. federal incentives on December 31, 2012 resulted in a reduction in the build rate of wind energy in 2013. However, with the extension of the federal incentives, wind energy systems that began construction prior to the end of 2013 also became eligible for the tax benefit, which positioned the industry for a rebound in 2014 and 2015, based on EIA forecasts. According to the DoE, data from interconnection queues demonstrates that a substantial amount of wind energy capacity is currently under consideration. At the end of 2013, based on data analyzed by the DoE, there were 114 GW of wind energy capacity within transmission interconnection queues, which represents 36% of all generating capacity within such queues, the second highest generating source behind natural gas.
EIA forecasts that installed wind capacity in the United States will reach 74.6 GW by the end of 2015, representing a 23% CAGR since 2001. This growth rate has largely been due to wind energy’s increased cost competitiveness, advances in wind turbine technology, and growing support for renewable energy sources.
Cumulative Installed Wind Capacity in the United States (GW), 2001-2015
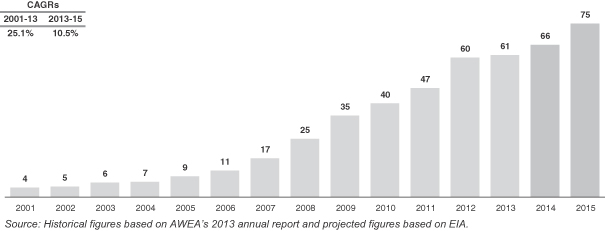
138
Table of Contents
Drivers of U.S. Wind Energy Growth
Wind energy is a key component of the renewable energy strategy of the United States. We believe the following factors are the main drivers of growth of wind energy in the United States:
Improvements in Wind Technologies. Wind turbine technology has evolved significantly over the last 20 years. According to DoE, the average size of installed wind turbines increased to 1.87 MW in 2013, a 162% increase since 1998–1999. In addition, the average hub height in 2013 was 80 meters, up 45% since 1998-1999, while the average rotor diameter was 97 meters, up 103% since 1998–1999.
According to AWEA, the main technological improvements include:
| • | advances in wind turbine blade aerodynamics and development of variable speed generators to improve conversion of wind energy to electricity over a range of wind speeds, resulting in higher capacity factors and increased capacity per turbine; |
| • | advances in turbine height resulting in the ability to benefit from greater wind speeds at higher elevations; |
| • | advances in remote operation and monitoring systems; |
| • | improved wind monitoring and forecasting tools, allowing more accurate prediction of wind energy output and availability and better system management and reliability; and |
| • | advances in turbine maintenance, resulting in longer turbine lives. |
Declining cost of producing wind energy. AWEA indicates that as a result of technologic advances, the cost of electricity generation from utility-scale wind systems has dropped more than 80% over the last 20 years. In its 2013 annual wind market analysis, the DoE reports that installed project costs for wind continued to trend lower. The early indications from more than 2 GW of projects with anticipated COD in 2014 suggest that capacity-weighted average installed costs would be close to $1,750/kW, down approximately $200/kW from the reported average cost in 2012 (and down approximately $500/kW from the peak in average reported costs in 2009 and 2010).
139
Table of Contents
About TerraForm Power, Inc.
We are a dividend growth-oriented company formed to own and operate contracted clean power generation assets acquired from SunEdison and third parties. Our business objective is to acquire high-quality contracted cash flows, primarily from owning solar and wind generation assets serving utility, commercial and residential customers. Over time, we intend to acquire other clean power generation assets, including natural gas and hydro-electricity facilities, as well as hybrid energy solutions that enable us to provide contracted power on a 24/7 basis. We believe the renewable power generation segment is growing more rapidly than other power generation segments due in part to the emergence in various energy markets of “grid parity,” which is the point at which renewable energy sources can generate electricity at a cost equal to or lower than prevailing electricity prices. We expect retail electricity prices to continue to rise due to the increasing cost of producing electricity from fossil fuels caused by required investments in generation plants and transmission and distribution infrastructure and increasing regulatory costs, among other factors.
Our current portfolio consists of solar projects located in the United States, Canada, the United Kingdom and Chile with an aggregate nameplate capacity of 887.1 MW. As of our IPO, our portfolio consisted of projects with an aggregate nameplate capacity of 807.7 MW. Since then, we acquired several Call Right Projects from our Sponsor with a total capacity of 54.6 MW and also completed the Hudson Energy Acquisition, in which we acquired 25.5 MW of operating solar power assets. In addition, we expect to complete the Capital Dynamics Acquisition in December 2014, which will add a further 77.6 MW of operating solar power assets to our portfolio. In November 2014, we agreed to acquire 521.1 MW of operating power assets, including 500.0 MW of wind power assets and 21.1 MW of solar power assets, in the First Wind Acquisition for a total consideration of $862.0 million. If the Capital Dynamics Acquisition and the First Wind Acquisition are consummated, our portfolio will include both solar and wind projects and will increase to a total nameplate capacity of 1,485.8 MW.
In addition to growing our current portfolio, our pipeline of call right projects has increased since the IPO. As of November 30, 2014, the Call Right Projects that are specifically identified pursuant to the Support Agreement have a total nameplate capacity of 1.7 GW. Additionally, in connection with the First Wind Acquisition, we entered into an Intercompany Agreement with our Sponsor, under which we will be granted additional call rights with respect to certain projects in the First Wind pipeline, which are expected to represent an additional 1.6 GW of wind and solar generation assets. If the First Wind Acquisition is consummated, the total nameplate capacity of the projects to which we have call rights under both the Intercompany Agreement and the Support Agreement will be over 3.3 GW. We anticipate the First Wind Acquisition will close in the first quarter of 2015. See “Summary–Recent Developments—Acquisition Transactions.”
We intend to further expand and diversify our current project portfolio by acquiring utility-scale, distributed and residential assets located in the United States, Canada, the United Kingdom, Chile and certain other jurisdictions, each of which we expect will have a long-term PPA with a creditworthy counterparty as do the projects we will acquire in the Capital Dynamics Acquisition and the First Wind Acquisition. Substantially all of the projects we will acquire in the Capital Dynamics Acquisition and First Wind Acquisition have a long-term PPA with a creditworthy counterparty, and the weighted average (based on MW) remaining life of our PPAs if both acquisitions are consummated would be approximately 16 years.
Further growth in our project portfolio will be driven by our relationship with our Sponsor, including access to its project pipeline, and by our access to third party developers and owners of clean generation assets in our core markets. As of September 30, 2014, our Sponsor had a 4.5 GW pipeline
140
Table of Contents
of development stage solar projects. An additional 1.6 GW pipeline of solar and wind development projects will be acquired by our Sponsor if the First Wind Acquisition is consummated. In addition, our Sponsor is a leading operator of solar power plants with approximately 3.0 GW of total nameplate capacity under management. Our Sponsor has provided us with a dedicated management team that has significant experience in clean power generation. We believe we are well-positioned for substantial growth due to the high quality, diversification and scale of our project portfolio, the PPAs we have with creditworthy counterparties, our dedicated management team and our Sponsor’s project origination and asset management capabilities.
We entered into the Support Agreement with our Sponsor in connection with our IPO, which requires our Sponsor to offer us additional qualifying projects from its development pipeline by the end of 2016 that are projected to generate an aggregate of at least $175.0 million of CAFD during the first 12 months following the qualifying projects’ respective COD, or “Projected FTM CAFD.” We refer to these projects as the “Call Right Projects.” Specifically, the Support Agreement requires our Sponsor to offer us:
| • | from the completion of our IPO through the end of 2015, projects that are projected to generate an aggregate of at least $75.0 million of cash available for distribution during the first 12 months following their respective COD; and |
| • | during calendar year 2016, projects that are projected to generate an aggregate of at least $100.0 million of cash available for distribution during the first 12 months following their respective COD. |
If the amount of Projected FTM CAFD of the projects we acquire under the Support Agreement through the end of 2015 is less than $75.0 million, or the amount of Projected FTM CAFD of the projects we acquire under the Support Agreement during 2016 is less than $100.0 million, our Sponsor has agreed that it will continue to offer us sufficient Call Right Projects until the total aggregate Projected FTM CAFD commitment has been satisfied. Since our IPO, our Sponsor has updated the list of Call Right Projects, with projects representing a further 1.7 GW of total nameplate capacity identified as Call Right Projects as of November 30, 2014. We believe the currently identified Call Right Projects, along with the 54.6 MW of Call Right Projects we have acquired from our Sponsor since our IPO, will be sufficient to satisfy a majority of the Projected FTM CAFD commitment for 2015 and between 45% and 70% of the Projected FTM CAFD commitment for 2016 (depending on the amount of debt financing we use for such projects).
In addition, the Support Agreement grants us a right of first offer with respect to any solar projects (other than Call Right Projects) located in the United States, Canada, the United Kingdom, Chile and certain other jurisdictions that our Sponsor decides to sell or otherwise transfer during the six-year period following the completion of our IPO. We refer to these projects as the “ROFO Projects.” The Support Agreement does not identify the ROFO Projects since our Sponsor will not be obligated to sell any project that would constitute a ROFO Project. As a result, we do not know when, if ever, any ROFO Projects or other assets will be offered to us. In addition, in the event that our Sponsor elects to sell such assets, it will not be required to accept any offer we make to acquire any ROFO Project and, following the completion of good faith negotiations with us, our Sponsor may choose to sell such assets to a third party or not to sell the assets at all.
In addition to the Call Right Projects under the Support Agreement, pursuant to the Intercompany Agreement we will have additional call rights with respect to certain projects in the First Wind pipeline, which are expected to represent an additional 1.6 GW of wind and solar generation assets from 2015 to 2017, subject to the consummation of the First Wind Acquisition. These additional call right projects will not count towards our Sponsor’s Projected FTM CAFD commitment under the Support Agreement.
141
Table of Contents
About our Sponsor
We believe our relationship with our Sponsor provides us with the opportunity to benefit from our Sponsor’s expertise in solar technology, project development, finance, management and operations. Our Sponsor is a solar industry leader based on its history of innovation in developing, financing and operating solar energy projects and its strong market share relative to other U.S. and global installers and integrators. As of September 30, 2014, our Sponsor had a development pipeline of approximately 4.5 GW and solar power generation assets under management of approximately 3.0 GW, comprised of approximately 1,200 solar generation facilities across 20 countries. These projects were managed by a dedicated team using four renewable energy operation centers globally. As of September 30, 2014, our Sponsor had approximately 2,400 employees. Our Sponsor owns 100.0% of our outstanding Class B units and holds all of the IDRs.
Purpose of TerraForm Power, Inc.
We intend to create value for the holders of our Class A common stock by achieving the following objectives:
| • | acquiring long-term contracted cash flows from clean power generation assets with creditworthy counterparties; |
| • | growing our business by acquiring contracted clean power generation assets from our Sponsor and third parties; |
| • | capitalizing on the expected high growth in the clean power generation market, which is projected to require over $2.9 trillion of investment over the period from 2013 through 2020, of which $802 billion is expected to be invested in solar PV generation assets; |
| • | creating an attractive investment opportunity for dividend growth-oriented investors; |
| • | creating a leading global clean power generation asset platform, with the capability to increase the cash flow and value of the assets over time; and |
| • | gaining access to a broad investor base with a more competitive source of equity capital that accelerates our long-term growth and acquisition strategy. |
Our Business Strategy
Our primary business strategy is to increase the cash dividends we pay to the holders of our Class A common stock over time. Our plan for executing this strategy includes the following:
Focus on long-term contracted clean power generation assets. Our portfolio and any projects that we acquire from our Sponsor or third parties we expect will have long-term PPAs with creditworthy counterparties. We intend to focus on owning and operating long-term contracted clean power generation assets with proven technologies, low operating risks and stable cash flows consistent with our portfolio. We believe industry trends will support significant growth opportunities for long-term contracted power in the clean power generation segment as various markets around the world reach grid parity.
Grow our business through acquisitions of contracted operating assets. We intend to acquire additional contracted clean power generation assets from our Sponsor and third parties to increase our cash available for distribution. The Support Agreement provides us with (i) the option to acquire the identified Call Right Projects, which currently represent an aggregate nameplate capacity of approximately 1.7 GW, and additional projects from our Sponsor’s development pipeline that will be designated as Call Right Projects under the Support Agreement to satisfy the aggregate Projected FTM CAFD commitment of $175.0 million and (ii) a right of first offer on the ROFO Projects. If the First Wind Acquisition is consummated, we will also be granted call rights with respect to projects in the First Wind
142
Table of Contents
pipeline expected to represent an additional 1.6 GW of wind and solar generation assets from 2015 to 2017. In addition, we expect to have significant opportunities to acquire other clean power generation assets from third-party developers, independent power producers and financial investors. We believe our knowledge of the market, third-party relationships, operating expertise and access to capital will provide us with a competitive advantage in acquiring new assets.
Attractive asset classes. Our current focus is on the solar and wind energy segments because we believe they are currently the fastest growing segments of the clean power generation industry and offer attractive opportunities to own assets and deploy long-term capital due to the predictability of their cash flows. In particular, we believe the solar and wind segments are attractive because there is no associated fuel cost risk and the relevant technologies have become highly reliable. We also believe the declining levelized costs of energy for solar and wind projects will enable these asset classes to continue to add additional MW of completed projects to our portfolio and enable us to gain market share. Solar and wind projects also have an expected life which can exceed 30 years. In addition, the solar and wind energy generation projects in or to be added to our portfolio generally operate under long-term PPAs with terms of up to 30 years.
Focus on core markets with favorable investment attributes. We intend to focus on growing our portfolio through investments in markets with (i) creditworthy PPA counterparties, (ii) high clean energy demand growth rates, (iii) low political risk, stable market structures and well-established legal systems, (iv) grid parity or the potential to reach grid parity in the near term and (v) favorable government policies to encourage renewable energy projects. We believe there will be ample opportunities to acquire high-quality contracted power generation assets in markets with these attributes. While our current focus is on solar and wind generation assets in the United States, Canada, the United Kingdom and Chile, we will selectively consider acquisitions of contracted clean generation sources in other countries.
Maintain sound financial practices. We intend to maintain our commitment to disciplined financial analysis and a balanced capital structure. Our financial practices include (i) a risk and credit policy focused on transacting with creditworthy counterparties, (ii) a financing policy focused on achieving an optimal capital structure through various capital formation alternatives to minimize interest rate and refinancing risks, and (iii) a dividend policy that is based on distributing the cash available for distribution generated by our project portfolio (after deducting appropriate reserves for our working capital needs and the prudent conduct of our business). Our initial dividend was established based on our targeted payout ratio of approximately 85% of projected cash available for distribution. See “Cash Dividend Policy.”
Our Competitive Strengths
We believe our key competitive strengths include:
Scale and diversity. Our portfolio provide us with significant diversification in terms of market segment, counterparty and geography. These operating projects, in the aggregate, represent 887.1 MW of nameplate capacity, which consist of 722.8 MW of nameplate capacity from utility projects and 164.3 MW of nameplate capacity of commercial, industrial, government and residential customers. If the Capital Dynamics Acquisition and the First Wind Acquisition are consummated, over portfolio will include both solar and wind projects and will increase to an aggregate of 1,485.8 MW of nameplate capacity, consisting of 1,222.8 MW of nameplate capacity from utility projects and 263.0 MW of nameplate capacity of commercial, industrial, government and residential customers. Of the projects in our portfolio, no single project accounts for more than 20% of our total MW nameplate capacity assuming the Capital Dynamics and First Wind Acquisition are consummated. Our diversification reduces our operating risk profile and our reliance on any single market or segment. We believe our
143
Table of Contents
scale and geographic diversity improve our business development opportunities through enhanced industry relationships, reputation and understanding of regional power market dynamics. Over time as we acquire projects from our Sponsor and third parties we expect to become further diversified.
Stable, high-quality cash flows. Our portfolio of projects, together with the Call Right Projects, the projects to which we expect to have call rights under the Intercompany Agreement and third-party projects that we acquire, provide us with a stable, predictable cash flow profile. We sell the electricity generated by our projects under long-term PPAs with creditworthy counterparties. The weighted average (based on MW) remaining life of our PPAs would be approximately 16 years, as of September 30, 2014, if the Capital Dynamics Acquisition and the First Wind Acquisition are consummated. The weighted average credit rating (based on nameplate capacity) of the counterparties to the PPAs for the projects in our portfolio would be A-/A3, which includes only those counterparties that are rated by S&P, Moody’s or both (representing approximately 90% of the total MW of our portfolio), if the Capital Dynamics Acquisition and the First Wind Acquisition is consummated. Based on our portfolio of projects, we do not expect to pay significant federal income taxes for at least the next several years.
Newly constructed solar portfolio. We benefit from a portfolio of relatively newly constructed solar assets, with most of the projects in our portfolio having achieved COD within the past three years. The projects in our portfolio and the Call Right Projects utilize proven and reliable technologies provided by leading equipment manufacturers and, as a result, we expect to achieve high generation availability and predictable maintenance capital expenditures.
Relationship with SunEdison. We believe our relationship with our Sponsor provides us with significant benefits, including the following:
| • | Strong asset development and acquisition track record. Over the last five calendar years, our Sponsor has constructed or acquired solar power generation assets with an aggregate nameplate capacity of 1.4 GW and, as of September 30, 2014, was constructing additional solar power generation assets expected to have an aggregate nameplate capacity of approximately 610 MW. Our Sponsor has been one of the top five developers and installers of solar energy facilities in the world in each of the past four years based on megawatts installed. In addition, our Sponsor had a 4.5 GW pipeline of development stage solar projects as of September 30, 2014. Our Sponsor’s operating history demonstrates its organic project development capabilities and its ability to work with third-party developers and asset owners in our target markets. We believe our Sponsor’s relationships, knowledge and employees will facilitate our ability to acquire operating projects from our Sponsor and unaffiliated third parties in our target markets. |
| • | Project financing experience. We believe our Sponsor has demonstrated a successful track record of sourcing long duration capital to fund project acquisitions, development and construction. Since 2005, our Sponsor has raised approximately $5 billion in long-term, non-recourse project and tax equity financing for hundreds of projects. We expect that we will realize significant benefits from our Sponsor’s financing and structuring expertise as well as its relationships with financial institutions and other providers of capital. |
| • | Management and operations expertise. We will have access to the significant resources of our Sponsor to support the growth strategy of our business. As of September 30, 2014, our Sponsor had over 3.0 GW of projects under management across 20 countries. In addition, our Sponsor maintains four renewable energy operation centers to service assets under management. Our Sponsor’s operational and management experience helps ensure that our facilities will be monitored and maintained to maximize their cash generation. If the First Wind Acquisition is consummated, we will also benefit from First Wind’s operational and management expertise as the First Wind team joins our Sponsor. To date, First Wind has |
144
Table of Contents
| constructed or acquired wind power generation assets with an aggregate nameplate capacity of 1.0 GW and, as of November 30, 2014, was constructing additional wind power generation assets expected to have an aggregate nameplate capacity of approximately 500 MW. |
Dedicated management team. Under the Management Services Agreement, our Sponsor has provided us with a dedicated team of professionals to serve as our executive officers and other key officers. Our officers have considerable experience in developing, acquiring and operating clean power generation assets, with an average of over nine years of experience in the sector. For example, our President and Chief Executive Officer served as the President of SunEdison’s solar energy business from November 2009 to March 2013. Our management team also has access to the other significant management resources of our Sponsor to support the operational, financial, legal and regulatory aspects of our business.
Our Portfolio
Our current portfolio consists of solar projects located in the United States and its unincorporated territories, Canada, the United Kingdom and Chile with total nameplate capacity of 887.1 MW. All of these projects have long-term PPAs with creditworthy counterparties. The PPAs have a weighted average (based on MW) remaining life of 20 years as of September 30, 2014. We will acquire an additional 500 MW of wind power assets and 21.1 MW of solar power assets if the First Wind Acquisition is consummated, all of which have PPAs with creditworthy counterparties. Substantially all of these PPAs are long-term, such that the weighted average (based on MW) remaining life of our PPAs if the First Wind Acquisition is consummated would be 16 years. We intend to further expand and diversify our current project portfolio by acquiring utility-scale, distributed and residential assets located in the United States, Canada, the United Kingdom, Chile and certain other jurisdictions, each of which we expect will also have a long-term PPA with a creditworthy counterparty. Growth in our project portfolio will be driven by our relationship with our Sponsor, including access to its project pipeline, and by our access to unaffiliated third party developers and owners of clean generation assets in our core markets.
We will have the right to acquire additional Call Right Projects set forth in the table below under the heading “Unpriced Call Right Projects” at prices that will be determined in the future. The price for each Unpriced Call Right Project will be the fair market value of such project. The Support Agreement provides that we will work with our Sponsor to mutually agree on the fair market value, but if we are unable to, we and our Sponsor will engage a third-party advisor to determine the fair market value, after which we have the right (but not the obligation) to acquire such Call Right Project. Until the price for a Call Right Asset is mutually agreed to by us and our Sponsor, in the event our Sponsor receives a bona fide offer for a Call Right Project from a third party, we will have the right to match any price offered by such third party and acquire such Call Right Project on the terms our Sponsor could obtain from the third party. After the price for a Call Right Asset has been agreed upon and until the total aggregate Projected FTM CAFD commitment has been satisfied, our Sponsor may not market, offer or sell that Call Right Asset to any third party without our consent. The Support Agreement further provides that our Sponsor is required to offer us additional qualifying Call Right Projects from its pipeline on a quarterly basis until we have acquired projects under the Support Agreement that have the specified minimum amount of Projected FTM CAFD for each of the periods covered by the Support Agreement. We cannot assure you that we will be offered these Call Right Projects on terms that are favorable to us. See “Certain Relationships and Related Party Transactions—Project Support Agreement” for additional information.
145
Table of Contents
Current Portfolio
The following table provides an overview of the assets that comprise our portfolio as of November 30, 2014:
| Offtake Agreements |
||||||||||||||||||||||
| Project Names |
Location | COD(1) | Nameplate Capacity (MW)(2) |
# of Sites |
Project Origin(3) |
Counterparty |
Counterparty Credit Rating(4) |
Remaining Duration of PPA (Years)(5) |
||||||||||||||
| Distributed Generation: |
||||||||||||||||||||||
| U.S. Projects 2014 |
U.S. | Q2 2014-Q4 2014 |
45.4 | 41 | C | Various utilities, municipalities and commercial entities | A+, A1 | 20 | ||||||||||||||
| Hudson Energy |
U.S. | 2011-2013 | 25.5 | 101 | A | Various commercial, residential and governmental entities | A+, A1 | 15 | ||||||||||||||
| Summit Solar Projects |
U.S. | 2007-2014 | 19.6 | 50 | A | Various commercial and governmental entities | A, A2 | 14 | ||||||||||||||
| Canada | 2011-2013 | 3.8 | 7 | A | Ontario Power Authority | A-, Aa1 | 18 | |||||||||||||||
| Enfinity |
U.S. | 2011-2013 | 15.7 | 16 | A | Various commercial, residential and governmental entities | A, A2 | 18 | ||||||||||||||
| U.S. Projects 2009-2013 |
U.S. | 2009-2013 | 15.2 | 73 | C | Various commercial and governmental entities | BBB+, Baa1 | 16 | ||||||||||||||
| California Public Institutions |
U.S. | Q4 2013-Q3 2014 |
13.5 | 5 | C | State of California Department of Corrections and Rehabilitation | A+, A3 | 19 | ||||||||||||||
| MA Operating |
U.S. | Q3 2013-Q4 2013 |
12.2 | 4 | A | Various municipalities | A+, A1 | 20 | ||||||||||||||
| SunE Solar Fund X |
U.S. | 2010-2011 | 8.8 | 12 | C | Various utilities, municipalities and commercial entities | AA, Aa2 | 17 | ||||||||||||||
| LPT II Fund |
U.S. | Q4 2014-Q2 2015 |
4.6 | 9 | S | Various commercial and governmental entities | A, A2 | 19 | ||||||||||||||
|
|
|
|
|
|||||||||||||||||||
| Subtotal |
164.3 | 318 | ||||||||||||||||||||
146
Table of Contents
| Offtake Agreements |
||||||||||||||||||||||
| Project Names |
Location | COD(1) | Nameplate Capacity (MW)(2) |
# of Sites |
Project Origin(3) |
Counterparty |
Counterparty Credit Rating(4) |
Remaining Duration of PPA (Years)(5) |
||||||||||||||
| Utility: |
||||||||||||||||||||||
| Mt. Signal |
U.S. | Q1 2014 |
265.9 | 1 | A | San Diego Gas & Electric | A, A1 | 24 | ||||||||||||||
| Regulus Solar |
U.S. | Q4 2014 |
81.6 | 1 | C | Southern California Edison | BBB+, A2 |
20 | ||||||||||||||
| North Carolina Portfolio |
U.S. | Q4 2014 - Q1 2015 |
26.0 | 4 | C | Duke Energy Progress | BBB+, A1 |
15 | ||||||||||||||
| Atwell Island |
U.S. | Q1 2013 |
23.5 | 1 | A | Pacific Gas & Electric Company | BBB, A3 |
23 | ||||||||||||||
| Nellis |
U.S. | Q4 2007 |
14.1 | 1 | A | U.S. Government (PPA); Nevada Power Company (RECs)(6) | AA+, Aaa, BBB+, Baa2 |
13 | ||||||||||||||
| Alamosa |
U.S. | Q4 2007 |
8.2 | 1 | C | Xcel Energy | A-, A3 | 13 | ||||||||||||||
| CalRENEW-1 |
U.S. | Q2 2010 |
6.3 | 1 | A | Pacific Gas & Electric Company | BBB, A3 |
16 | ||||||||||||||
| Marsh Hill |
Canada | Q2 2015 |
18.7 | 1 | A | Ontario Power Authority | A-, Aa1 |
20 | ||||||||||||||
| SunE Perpetual Lindsay |
Canada | Q4 2014 |
15.5 | 1 | C | Ontario Power Authority | A-, Aa1 |
20 | ||||||||||||||
| Stonehenge |
U.K. | Q2 2014 |
41.1 | 3 | A | Statkraft AS | A-, Baa1 |
15 | ||||||||||||||
| Crundale |
U.K. | Q4 2014 |
37.8 | 1 | S | Statkraft AS | A-, Baa1 |
15 | ||||||||||||||
| Stonehenge Operating |
U.K. | Q1 2013 - Q2 2013 |
23.6 | 3 | A | Total Gas & Power Limited | NR, NR |
14 | ||||||||||||||
| Says Court |
U.K. | Q2 2014 |
19.8 | 1 | C | Statkraft AS | A-, Baa1 |
15 | ||||||||||||||
| Crucis Farm |
U.K. | Q3 2014 |
16.1 | 1 | C | Statkraft AS | A-, Baa1 |
15 | ||||||||||||||
| Fairwinds |
U.K. | Q4 2014 |
12.2 | 1 | S | Statkraft AS | A-, Baa1 |
15 | ||||||||||||||
| Norrington |
U.K. | Q2 2014 |
11.2 | 1 | A | Statkraft AS | A-, Baa1 |
15 | ||||||||||||||
| CAP(7) |
Chile | Q1 2014 |
101.2 | 1 | C | Compañia Minera del Pacifico (CMP) | BBB-, NR |
19 | ||||||||||||||
|
|
|
|
|
|||||||||||||||||||
| Subtotal |
722.8 | 24 | ||||||||||||||||||||
|
|
|
|
|
|||||||||||||||||||
| Total Portfolio |
887.1 | 342 | ||||||||||||||||||||
|
|
|
|
|
|||||||||||||||||||
| (1) | Represents actual or anticipated COD, as applicable, unless otherwise indicated. |
147
Table of Contents
| (2) | Nameplate capacity for solar projects represents the maximum generating capacity at standard test conditions of a facility multiplied by our percentage ownership of that facility (disregarding any equity interests held by any tax equity investor or lessor under any sale-leaseback financing or of any non-controlling interests in a partnership). Generating capacity may vary based on a variety of factors discussed elsewhere in this prospectus. |
| (3) | Projects which were contributed by our Sponsor prior to our IPO, or “Contributed Projects,” are reflected in the Predecessor’s combined consolidated historical financial statements, and are identified with a “C” above. Projects which were acquired either contemporaneously with the completion of our IPO or in the period since our IPO are identified with an “A” above. Projects which have been sold to us by our Sponsor in the period since our IPO are identified with an “S” above. |
| (4) | For our distributed generation projects with one counterparty and for our utility-scale projects the counterparty credit rating reflects the counterparty’s or guarantor’s issuer credit ratings issued by S&P and Moody’s. For distributed generation projects with more than one counterparty the counterparty credit rating represents a weighted average (based on nameplate capacity) credit rating of the project’s counterparties that are rated by S&P, Moody’s or both. The percentage of counterparties that are rated by S&P, Moody’s or both (based on nameplate capacity) of each of our distributed generation projects is as follows: |
| • | U.S. Projects 2014: 82% |
| • | Hudson Energy: 54% |
| • | Summit Solar Projects (U.S.): 21% |
| • | Summit Solar Projects (Canada): 100% |
| • | Enfinity: 85% |
| • | U.S. Projects 2009-2013: 35% |
| • | California Public Institutions: 100% |
| • | MA Operating: 100% |
| • | SunE Solar Fund X: 89% |
| • | LPT II Fund: 68% |
| (5) | Calculated as of September 30, 2014. For distributed generation projects, the number represents a weighted average (based on nameplate capacity) remaining duration. For Nellis, the number represents the remaining duration of the REC contract. |
| (6) | The REC contract for the Nellis project, which represents over 90% of the expected revenues, has remaining duration of approximately 13 years. The PPA of the Nellis project has an indefinite term subject to one-year reauthorizations. |
| (7) | The PPA counterparty has the right, under certain circumstances, to purchase up to 40% of the project equity from us pursuant to a predetermined purchase price formula. See “Business—Our Portfolio—Current Portfolio—Utility Projects—CAP.” |
Distributed Generation Projects
Distributed generation solar energy systems provide customers with an alternative to traditional utility energy suppliers. Distributed resources are smaller in unit size and can be installed at a customer’s site, removing the need for lengthy transmission and distribution lines. By bypassing the traditional utility suppliers, distributed energy systems delink the customer’s price of power from external factors such as volatile commodity prices, costs of the incumbent energy supplier and some transmission and distribution charges. This makes it possible for distributed energy purchasers to buy energy at a predictable and stable price over a long period of time.
PPAs for certain of the U.S. distributed generation projects allow the offtake purchaser to purchase the applicable project from us at prices equal to the greater of a specified amount in the PPA or fair market value. In addition, certain PPAs allow the offtake purchaser to terminate the PPA in the
148
Table of Contents
event operating thresholds or performance measures are not achieved within specified time periods, and by the payment of an early termination fee, which requires us to remove the project from the off-taker’s site. These operating thresholds and performance measures noted above are readily achievable in the normal operation of the projects.
U.S. Projects 2014
Our U.S. Projects 2014 portfolio consists of approximately 41 canopy, groundmount and rooftop solar generation facilities currently under construction with an aggregate nameplate capacity of approximately 46.0 MW located in Arizona, California, Connecticut, Georgia, Massachusetts, New Jersey, New York and Puerto Rico, all of which have either reached COD or are expected to reach COD in 2014. The projects have been designed and engineered, and are being constructed pursuant to fixed-price turn-key EPC contracts with an affiliate of our Sponsor. An affiliate of our Sponsor provides day-to-day operations and maintenance services under 8-year Operation and Maintenance, or “O&M,” agreements, whose terms may be extended for additional 12-year periods upon the mutual agreement between us and our Sponsor. We have a 100% ownership interest in all of the U.S. Projects 2014. The projects sell power to corporate entities (comprising 18.4 MW), municipalities (comprising 24.6 MW) and school districts (comprising 3.0 MW).
The projects sell all of their energy output under separate 15-20 year PPAs with various creditworthy counterparties, except for one project that has a PPA with a term of 10 years (2.7 MW). In addition, many of the California projects receive incremental cash flows from five-year production based incentives from the California Solar Initiative. The projects also receive revenue from contracted and un-contracted RECs in the states of California, Connecticut, Massachusetts and New Jersey.
Summit Solar Projects
On May 22, 2014, we signed a purchase and sale agreement to acquire the equity interests in 23 solar energy systems located in the U.S. from Nautilus Solar PV Holdings, Inc. These 23 systems have a combined capacity of 19.6 MW. In addition, an affiliate of the seller owns certain interests in seven operating solar energy systems in Canada with a total capacity of 3.8 MW. In conjunction with the signing of the purchase and sale agreement to acquire the U.S. equity interests, we signed an asset purchase agreement to purchase the right and title to all of the assets of the Canadian facilities.
The Summit Solar Projects portfolio has an aggregate nameplate capacity of 23.4 MW and consists of 30 canopy, groundmount and rooftop solar generation facilities located in New Jersey, Florida, Maryland, Connecticut, California and Ontario. The projects commenced operations between October 2007 and June 2014. An affiliate of our Sponsor provides day-to-day operations and maintenance services under 5-year O&M agreements, whose terms may be extended for additional 5-year periods upon the mutual agreement between us and our Sponsor.
The projects sell all of their output under 23 separate 15-20 year PPAs in the U.S. and 7 feed-in-tariff contracts in Canada to school districts, municipalities, municipal and public utilities, businesses, a community center, a public non-profit institute, a university and private schools. The U.S. projects also generate RECs, the majority of which are contracted with investment grade buyers at a fixed price for a period of up to ten years.
Seven of the Summit Solar Projects are financed pursuant to sale-leaseback transactions that commenced between November 2007 and December 2013. Additionally, 11 of the Summit Solar Projects have non-recourse project-level debt financing totaling $24.2 million as of September 30, 2014.
149
Table of Contents
U.S. Projects 2009-2013
Our U.S. Projects 2009-2013 portfolio has an aggregate nameplate capacity of 15.2 MW and consists of: (i) a distributed generation portfolio consisting of 68 canopy, groundmount and rooftop solar generation facilities with an aggregate nameplate capacity of 13.2 MW located in California, Colorado, Connecticut, Massachusetts, New Jersey, and Oregon and (ii) a distributed generation portfolio consisting of 5 rooftop solar generation facilities with an aggregate nameplate capacity of 2.0 MW located in Puerto Rico. The projects in the United States commenced operations between 2009 and 2013. The projects in Puerto Rico commenced operations in the fourth quarter of 2012 through the fourth quarter of 2013. We have a 100% ownership interest in all of the U.S. Projects 2009-2013. The U.S. Projects 2009-2013 sell power to various corporate entities (comprising 8.3 MW), municipalities (comprising 3.7 MW), school districts (comprising 1.9 MW) and REIT/developer entities (comprising 1.3 MW). An affiliate of our Sponsor provides day-to-day operations and maintenance services under long-term O&M agreements.
The projects in the United States sell all of their energy under 68 separate 15-20 year PPAs with various creditworthy counterparties, except for a 121 KW project that has a PPA with a term of 10 years. In addition, many of the U.S. projects receive incremental cash flows from 5-20 year production-based incentives from the California Solar Initiative and Colorado’s Xcel Solar*Rewards, respectively. The projects in the United States also receive revenue from contracted and un-contracted RECs in California, Connecticut, Massachusetts and New Jersey. The projects in Puerto Rico sell all of their energy under separate PPAs with various creditworthy counterparties and have 15-20 year terms.
Certain of the projects in the United States were partially financed with loans and term bonds. See “Description of Certain Indebtedness—Project-Level Financing Arrangements.”
Enfinity
Our Enfinity portfolio consists of operational distributed generation projects across six host customers having an aggregate nameplate capacity of 15.7 MW. The projects reached commercial operation between 2011 and 2013, and are located in Arizona, California, Colorado and Ohio. An affiliate of our Sponsor provides day-to-day operations and maintenance services under 10-year O&M agreements, whose terms may be extended for additional 10-year periods upon the mutual agreement between us and our Sponsor.
Each of the projects sells all of its energy output under separate 15-20 year PPAs with various creditworthy counterparties. The PPA offtake agreements are with corporate entities (representing approximately 9.8 MW), municipalities/government entities (representing approximately 3.7 MW) and school districts (representing approximately 2.3 MW). The projects also receive revenues from contracted RECs in Arizona and Colorado, and the California project receives incremental cash flows from a five-year production based incentive from the California Solar Initiative. The Denver Housing Authority, or “DHA,” Projects (2.5 MW) are residential rooftop installations.
California Public Institutions
Our California Public Institutions projects consist of five separate groundmount solar generation facilities with an aggregate nameplate capacity of approximately 13.5 MW located in California. Three of the projects (representing approximately 9.3 MW) reached COD between December 2013 and March 2014 and the remaining two projects (representing approximately 4.2 MW) reached COD in July 2014. The projects were designed, engineered and constructed pursuant to fixed-price turn-key EPC contracts with an affiliate of our Sponsor. An affiliate of our Sponsor provides day-to-day operations and maintenance services under 20-year O&M agreements, whose terms may be extended upon the mutual agreement between us and our Sponsor.
150
Table of Contents
Four projects supply electricity to prisons in California and one project supplies electricity to a hospital in California. All electricity output is sold pursuant to a 20-year PPA with the State of California acting through the Department of Corrections and Rehabilitation and the Department of State Hospitals, as applicable. In addition, the three operational projects receive incremental cash flows from five-year production based incentives through the California Solar Initiative.
As of September 30, 2014 approximately $19.5 million of tax equity financing had been provided and approximately $17.7 million term loan term debt had been incurred with respect to the California Public Institutions projects. See “Description of Certain Indebtedness—Project-Level Financing Arrangements” for a summary of the non-recourse project level debt financing.
Under the tax-equity financing arrangement our subsidiaries lease the projects to a master tenant. Currently, we have a 1% and the tax equity investor has a 99% ownership interest in the master tenant. On the fifth anniversary of the tax equity financing, we will have a 67% and the tax equity investor will have a 33% ownership interest in the master tenant. Distributions from the master tenant are not subject to restrictive covenants. Additionally, we have a 51% ownership interest and the master tenant has a 49% ownership in the holding company for the project subsidiaries.
MA Operating
Our MA Operating portfolio consists of four groundmount solar generation facilities with an aggregate nameplate capacity of 12.2 MW located in Massachusetts. The projects commenced operations in 2013. The projects were designed, engineered and constructed under an EPC contract with Gehrlicher Solar America Corp., and Gehrlicher Solar America Corp. also provides day-to-day operations and maintenance services under a 10-year O&M Agreement.
All electricity output is sold pursuant to a 20-year PPA with investment grade municipal customers. The PPA customer is obligated to pay us a fixed percentage of each virtual net metering credit generated by the solar generation facility. The virtual net metering credit is derived from the National Grid G-1 electricity tariff. In addition, the projects generate RECs through the end of 2023, the majority of which will be contracted for a period of at least five years with an investment grade buyer. See “Business—Government Incentives—United States” for details regarding these incentives.
SunE Solar Fund X
The SunE Solar Fund X consists of 12 distributed generation solar facilities with an aggregate nameplate capacity of approximately 8.8 MW located in California, New Mexico and Maryland. The projects achieved COD between June 2010 and February 2011. The projects were designed, engineered and constructed pursuant to EPC contracts with an affiliate of our Sponsor. An affiliate of our Sponsor provides day-to-day operations and maintenance services under O&M agreements, whose terms will match those of the PPAs.
All electricity output is sold pursuant to 20-25 year PPAs to customers including the University of Maryland Eastern Shore (State of Maryland), City of Santa Fe, Sutter Auburn Faith Hospital, Pacific Bell Telephone Company and separate locations of California State University.
In addition, several of the projects receive incremental cash flows from production-based incentives through the California Solar Initiative. The projects also receive revenue from contracted RECs in the states of California, Maryland and New Mexico.
In 2010, our Sponsor entered into a sale-leaseback transaction with J.P. Morgan. A subsidiary of our Sponsor served as the lessee and a J.P. Morgan subsidiary as the lessor of the projects. On
151
Table of Contents
May 16, 2014, we executed a purchase and sale agreement pursuant to which we acquired J.P. Morgan’s equity interests in the project lessor under the sale-leaseback transaction and removed any interest J.P. Morgan had in the projects.
Hudson Energy
The Hudson Energy portfolio consists of 101 operational distributed generation projects having an aggregate nameplate capacity of 25.5 MW. The projects reached commercial operation between 2011 and 2013, and are located in Massachusetts, New Jersey and Pennsylvania. A third party provider provides day-to-day operations and maintenance services.
Each of the projects sells all of its energy output under separate 15-25 year PPAs with various creditworthy counterparties. The PPA offtake agreements are with corporate and other entities (representing approximately 10.1 MW), municipalities/government entities (representing approximately 2.1 MW), school districts (representing approximately 13.0 MW) and residential rooftop installations (representing approximately 0.2 MW). The projects also receive revenues from contracted RECs in New Jersey.
10.9 MW of the Hudson Energy portfolio is financed with non-recourse project-level indebtedness. See “Description of Certain Indebtedness—Project-Level Financing Arrangements.”
LPT II Fund
Our LPT II Fund portfolio currently consists of approximately 9 canopy, ground mount and rooftop solar generation facilities. We expect to acquire an additional 38 generation facilities currently on the Call Right List through this fund. All of these additional projects are currently under construction, or construction is expected to begin prior to the end of February 2015. The projects have an aggregate nameplate capacity of approximately 42 MW for the fund. All of the projects are expected to reach COD prior to June 30, 2015. The facilities are located in Arizona, California, Georgia, Hawaii, Massachusetts, Maryland, New Jersey, New York, Oregon, Puerto Rico, Texas and Vermont.
These projects have been designed and engineered, and are being constructed pursuant to fixed-price, turn-key EPC contracts with an affiliate of our Sponsor. An affiliate of our Sponsor will provide day-to-day operations and maintenance services under 10-year O&M agreements, whose terms may be extended for additional periods upon the mutual agreement between us and our Sponsor. We will have a 100% ownership interest in all of the LPT II Fund projects upon completion of the fund. The projects sell power to corporate entities (representing approximately 18.5 MW), municipalities (representing approximately 18.5 MW), and school districts (representing approximately 4.9 MW).
All but 2.9 MW of the aggregate nameplate capacity of the 47 projects is sold under separate 15-25 year PPAs with various creditworthy counterparties. The portfolio has a weighted average contract life of approximately 19.4 years. A number of the California projects in the portfolio receive incremental cash flows from five-year production based incentives from the California Solar Initiative. In addition, the projects in Massachusetts, Maryland, and New Jersey receive revenue from contracted and un-contracted RECs.
CD DG Portfolio
The CD DG portfolio consists of 39 distributed generation solar projects with an aggregate nameplate capacity of approximately 77.6 MW located in California, Massachusetts, New Jersey, New York and Pennsylvania. 36 of the projects (representing approximately 72.2 MW) achieved COD between August 2011 and August 2014. The remaining three projects (representing approximately 5.4 MW) are in the final stages of construction and are expected to achieve COD in December 2014.
152
Table of Contents
All 39 projects were designed, engineered and constructed pursuant to Dynamics’ various EPC contracts. The three projects currently under construction will only transfer to TerraForm once construction activity is complete. All electricity output is sold pursuant to 20-25 year PPAs or Net Metering Contracts to a mix of Commercial, Municipal, and Utility purchasers with an average credit rating that is investment grade. The projects located in Massachusetts, Pennsylvania and New Jersey also benefit from the sale of RECs, the majority of which will be contracted for a period of at least five years with investment grade buyers.
There are four project funds that were financed through a combination of the Section 1603 Grant (Pennsylvania projects), and Tax Equity (remainder of the portfolio). We do not expect to incur debt financing with respect to this portfolio and we intend to replace the approximate $338,000 letter of credit in accordance with the terms of the Long Island Power Authority PPAs.
The Capital Dynamics Acquisition, in which we expect to acquire the CD DG portfolio, is subject to customary closing conditions. We expect the Capital Dynamics Acquisition to close during the fourth quarter of 2014, but we may not be able to complete the Capital Dynamics Acquisition on a timely basis or at all.
Utility Projects
Mt. Signal
Mt. Signal is a groundmount solar generation project located in Imperial County, California with a nameplate capacity of approximately 265.9 MW. Mt. Signal reached COD in three phases from Q4 2013 through Q1 2014. The project was designed, engineered, constructed and commissioned pursuant to an EPC agreement with an unaffiliated third party. An affiliate of our Sponsor provides day-to-day operations and maintenance services under a five-year O&M agreement, which may be extended for additional five-year periods upon the mutual agreement between us and our Sponsor.
The project sells 100% of its electricity generation, including environmental attributes and ancillary products and services from the facility, to San Diego Gas & Electric, or “SDG&E,” pursuant to a 25-year PPA that expires in March 2039. The price under the PPA is a stated price per MWh. The PPA price is also adjusted by time-of-day factors resulting in higher payments during peak hours.
Mt. Signal is financed with $415.7 million in non-recourse project-level senior notes. See “Description of Certain Indebtedness—Project-Level Financing Arrangements.”
Regulus Solar
Regulus Solar is a groundmount solar generation project located in Kern County, California with a nameplate capacity of approximately 81.6 MW. The Regulus Solar project reached COD in November 2014. The project was designed, engineered, constructed and commissioned pursuant to an EPC agreement with an affiliate of our Sponsor. An affiliate of our Sponsor provides day-to-day operations and maintenance services under a 5-year O&M agreement, which may be extended for additional 5-year periods upon the mutual agreement between us and our Sponsor.
All energy, capacity, green attributes and ancillary products and services from the facility are sold to Southern California Edison pursuant to a PPA that expires in December 2034. Revenues consist of a fixed payment based on production, which is adjusted by time-of-day factors resulting in higher payments during peak hours.
The development and construction of the Regulus Solar project was financed with a combination of sponsor equity, a $44.4 million development loan and a $120.0 million non-recourse construction loan. In November 2014, these development and construction loans were repaid with a combination of senior debt, tax equity and sponsor equity. See “Description of Certain Indebtedness—Project-Level Financing Arrangements” for a description of the project-level financing of the Regulus Solar project.
153
Table of Contents
North Carolina Portfolio
The North Carolina Portfolio consists of four groundmount solar generation facilities with an aggregate nameplate capacity of approximately 26.0 MW. Two of these facilities are expected to reach COD by the end of 2014 and the other two facilities are expected to reach COD during the first quarter of 2015. The facilities are being designed, engineered, constructed and commissioned pursuant to an EPC agreement with an affiliate of our Sponsor. An affiliate of our Sponsor provides day-to-day operations and maintenance services under 10-year O&M agreements, whose terms may be extended for additional 10-year periods upon the mutual agreement between us and our Sponsor.
All energy and capacity generated by the North Carolina Portfolio will be sold to Progress Energy Carolinas pursuant to 15-year PPAs for fixed prices based on electricity production, which is adjusted by time-of-day factors resulting in higher payments during peak hours. The green attributes and ancillary products and services from the facilities are not subject to the PPAs and will be sold to various customers at market prices.
The construction of the North Carolina Portfolio will be financed through a $25 million construction debt facility. As of September 30, 2014, $17 million remained outstanding under the facility. We intend to repay the construction debt prior to COD with proceeds from tax equity financings as each facility achieves completion. We do not expect to incur permanent project level debt financing with respect to these projects.
Atwell Island
Atwell Island is a 23.5 MW solar generation facility located in Tulare County, California, which commenced operations in March 2013. The Atwell Island project was engineered, constructed and commissioned pursuant to an EPC agreement with Samsung Solar Construction Inc., who also subcontracted to a wholly owned subsidiary of Quanta Services Inc. This subsidiary provides day-to-day operations and maintenance services under a three-year O&M agreement that ends in March 2016. The term of the agreement may be extended based on mutual agreement between the parties.
The project sells 100% of its electricity generation, including environmental attributes and ancillary products and services from the facility, to Pacific Gas & Electric, or “PGE,” pursuant to a 25-year PPA that expires in March 2038. The price under the PPA is a stated price per MWh, which escalates annually for the remainder of the delivery term. The PPA price is also adjusted by time-of-day factors resulting in higher payments during peak hours.
We currently do not expect to incur debt financing with respect to this project. The project’s security obligations under the PPA were met by posting a letter of credit of approximately $6 million. The line of credit matures in May 2020.
Nellis
Nellis is a groundmount solar generation facility with a nameplate capacity of approximately 14.1 MW located on the Nellis Airforce Base, or “Nellis AFB,” near Las Vegas, Nevada. The facility reached COD in December 2007. The project company is structured as a limited liability company, in which we own the position of the investor member, while our Sponsor continues to hold the position of the managing member. An affiliate of our Sponsor provides day-to-day operations and maintenance services under a 5-year O&M agreement, whose terms may be extended for additional 5-year periods upon the mutual agreement between us and our Sponsor.
The project company has a ground lease with Nellis AFB until January 1, 2028. The project derives approximately 90% of its revenues from a Portfolio Energy Credit Purchase Agreement with the Nevada Power Company, or “NPC.” Under the agreement, NPC purchases all of the Portfolio
154
Table of Contents
Energy Credits produced by the facility at a fixed rate for 20 years from January 1, 2008 to help meet NPC’s renewable energy portfolio obligations under Nevada law. The remaining revenues of the project come from the sale of energy and capacity generated by the project to Nellis AFB pursuant to an indefinite life PPA subject to one-year reauthorizations at the option of the United States federal government.
The Nellis project is financed with non-recourse project-level senior notes. See “Description of Certain Indebtedness—Project-Level Financing Arrangements.”
Alamosa
Our Alamosa project is a groundmount solar generation facility in Alamosa, Colorado with a nameplate capacity of approximately 8.2 MW. The project reached COD in the second half of 2007. The project was designed, engineered, constructed and commissioned by an affiliate of our Sponsor. An affiliate of our Sponsor provides day-to-day operations and maintenance services under an O&M agreement, whose terms match those of the PPA.
All electricity and related environmental attributes produced by the Alamosa project are sold to the Public Service Company of Colorado through a long-term, fixed-price PPA. The payment is a fixed payment based on production and the agreement contracted period ends on December 31, 2027.
In 2007, our Sponsor entered into a sale-leaseback transaction with Union Bank, N.A., or “Union Bank.” A subsidiary of our Sponsor served as the lessee and a Union Bank subsidiary as the lessor of the project. In 2014, we acquired 100% of the interests of both the lessee and the lessor of the project and thus removed any interests that Union Bank had in the project.
CalRENEW-1
CalRENEW-1 is a groundmount solar generation facility located in Mendota, California with a nameplate capacity of approximately 6.3 MW. This facility reached COD in April 2010. The 50-acre site on which the facility is located is leased under a 40-year land lease. The facility was designed, engineered, constructed and commissioned pursuant to an EPC agreement with Golden State Utility Company. We intend for an affiliate of our Sponsor to provide day-to-day operation and maintenance services under a long-term O&M agreement.
All energy, capacity, green attributes and ancillary products and services from the facility are sold to PGE pursuant to a PPA that expires in April 2030. Revenues consist of a fixed payment based on production, which is adjusted based on time-of-day factors resulting in higher payments during peak hours.
We currently do not expect to incur debt financing with respect to this project. We intend to meet the project’s security obligations under the PPA by posting a letter of credit of approximately $1.7 million under the Revolver.
Marsh Hill
Our Marsh Hill project is a groundmount solar generation facility with a nameplate capacity of approximately 18.7 MW located in the municipality of Scugog in eastern Ontario, Canada. The project is expected to reach COD by June 2015. We own 72% of the project. The remaining 28% ownership interest is retained by the original developer of the project and will be transferred to us upon the project reaching COD. The project is being designed, engineered, constructed and commissioned pursuant to an EPC agreement with an affiliate of our Sponsor. An affiliate of our Sponsor will provide day-to-day operations and maintenance services under a 5-year O&M agreement, whose terms may be extended for additional 5-year periods upon the mutual agreement between us and our Sponsor.
155
Table of Contents
All energy, capacity, green attributes and ancillary products and services from the facility are sold to the Ontario Power Authority pursuant to a PPA that expires 20 years after COD (approximately June 2035). Revenues consist of a fixed payment based on production, with no annual escalation.
As of September 30, 2014, Marsh Hill has three security letters of credit totaling C$1 million issued and outstanding. Two letters of credit totaling C$750,000 are issued and outstanding as per the terms of its Ontario Power Authority feed-in tariff contract. One letter of credit for C$250,000 is issued and outstanding with the Township of Scugog per the terms of its Development Agreement with the Township of Scugog. All three letters of credit are fully refundable at COD.
SunE Perpetual Lindsay
Our SunE Perpetual Lindsay project is a groundmount solar generation facility with a nameplate capacity of approximately 15.5 MW located in Lindsay, Ontario, Canada. The project is expected to reach COD in December 2014. We own 75% of the project. The remaining 25% of the ownership interests is retained by the original developer of the project and will be transferred to us upon COD. The project is being designed, engineered, constructed and commissioned pursuant to an EPC agreement with an affiliate of our Sponsor. An affiliate of our Sponsor will provide day-to-day operations and maintenance services under a 5-year O&M agreement, whose terms may be extended for additional 5-year periods upon the mutual agreement between us and our Sponsor.
All energy, capacity, green attributes and ancillary products and services from the facility are sold to the Ontario Power Authority pursuant to a PPA that expires 20 years after COD (approximately December 2034). Revenues consist of a fixed payment based on production, with no annual escalation.
As of September 30, 2014, SunE Perpetual Lindsay has two security letters of credit totaling C$750,000 issued and outstanding as per the terms of its Ontario Power Authority feed-in tariff contract. Both letters of credit are fully refundable at COD.
Fairwinds and Crundale
Fairwinds and Crundale are two projects in the UK with an aggregate nameplate capacity of 50.0 MW. Both projects reached COD in September 2014. We successfully completed the drop down of these two projects from our Sponsor on November 4, 2014 following substantial completion of both projects.
The projects were constructed pursuant to an EPC contract with an affiliate of our Sponsor. An affiliate of our Sponsor will also provide operations and maintenance services under a 10-year O&M agreement, which may be extended for an additional 10-year terms at our election.
Both projects have entered into 15-year PPAs with an affiliate of Statkraft A/S under which they will sell all of their electricity, ROCs, embedded benefits and Climate Change Levy Exemption Certificates, or “LECs.” Pricing of electricity functions in an identical way to our existing portfolio of UK assets (U.K. 2014 Projects).
Pricing of the electricity sold under these PPAs, which is expected to constitute about 40% of the revenues under the PPAs, is fixed for the first four years of the PPAs, after which the price is subject to an adjustment based on current market prices (subject to a price floor). Pricing for ROCs, which is expected to constitute about 55% of the revenues under the PPAs, is fixed by U.K. laws or regulations for the entire PPA term. Pricing for LECs and embedded benefits, which jointly constitute about 5% of the revenues under the PPAs, is indexed to prices set by U.K. laws or regulations. See “Business—Government Incentives—United Kingdom” for details regarding these incentives.
156
Table of Contents
Fairwinds and Crundale were acquired with £39.8 million of construction loans that mature in July 2015 with the option to extend 12 months to July 2016. See “Description of Certain Indebtedness—Project-Level Financing Agreements.” We intend to repay the existing indebtedness in Q2 2015.
U.K. 2014 Projects
The U.K. 2014 Projects portfolio has an aggregate nameplate capacity of 88.2 MW and consists of the Stonehenge Q1 portfolio (the Fareham, Knowlton and Westwood projects) and the Norrington, Says Court and Crucis Farm projects. Our Stonehenge Q1 portfolio has a total nameplate capacity of approximately 41.1 MW. Our Norrington project has a nameplate capacity of approximately 11.2 MW, our Says Court project has a nameplate capacity of approximately 19.8 MW and our Crucis Farm project has a nameplate capacity of approximately 16.1 MW. Each of the projects reached COD in the second quarter of 2014. Crucis Farm reached COD in the third quarter of 2014. We have a 100% ownership interest in each of the projects.
Each of the projects were constructed pursuant to an EPC contract with an affiliate of our Sponsor. An affiliate of our Sponsor also provides operations and maintenance services under 10-year O&M agreements, which may be extended for additional 10-year terms at our election.
All of these projects sell all of their electricity, ROCs, embedded benefits and Climate Change Levy Exemption Certificates, or “LECs,” under 15-year PPAs with an affiliate of Statkraft A/S. Pricing of the electricity sold under these PPAs, which is expected to constitute about 40% of the revenues under the PPAs, is fixed for the first four years of the PPAs, after which the price is subject to an adjustment based on current market prices (subject to a price floor). Pricing for ROCs, which is expected to constitute about 55% of the revenues under the PPAs, is fixed by U.K. laws or regulations for the entire PPA term. Pricing for LECs and embedded benefits, which jointly constitute about 5% of the revenues under the PPAs, is indexed to prices set by U.K. laws or regulations. See “Business—Government Incentives—United Kingdom” for details regarding these incentives.
Stonehenge Operating
The Stonehenge Operating portfolio has an aggregate nameplate capacity of 23.6 MW and consists of the Boyton Solar Park, KS SPV 24 and Sunsave 6 projects. Our Boyton Solar Park project has a nameplate capacity of approximately 6.2 MW and achieved COD in May 2013. Our KS SPV 24 project has a nameplate capacity of approximately 7.6 MW and achieved COD in June 2013. Our Sunsave 6 project has a nameplate capacity of approximately 9.8 MW and achieved COD in May 2013. Vogt Solar Ltd. provides day-to day operations and maintenance services to the projects under 2-year O&M agreements, which will be automatically renewed for an additional 3-year period unless the O&M operator proposes a qualified replacement contractor and that replacement is accepted by the project.
All of these projects sell all of their electricity, ROCs, embedded benefits and LECs under 15-year PPAs to Total Gas & Power Limited. Pricing of the electricity sold under these PPAs, which constitutes about 45% of the revenues under the PPAs, is fixed for the first five years of the PPAs, after which the price is subject to an adjustment based on the current market price (subject to a price floor). Pricing for ROCs, which is expected to constitute about 54% of the revenues under the PPAs, is fixed by U.K. laws or regulations for the entire PPA term.
The previously disclosed financing related to the development and construction of the Stonehenge Operating projects (consisting of €27.7 million of term loans and £6.2 million of VAT loans) was repaid in full in September 2014.
157
Table of Contents
CAP
Our CAP project is a groundmount photovoltaic power plant with a nameplate capacity of 101.2 MW located near the city of Copiapó in north-central Chile. It is connected to the Chilean central grid system (Sistema Interconectado Central) and reached COD on March 26, 2014. The project was designed, engineered and constructed pursuant to a construction contract with an affiliate of our Sponsor. An affiliate of our Sponsor provides day-to-day operations and maintenance services under a 5-year O&M agreement, whose terms may be extended for up to three additional 5-year periods, at the discretion of the project.
All energy, capacity, green attributes and ancillary products and services from the facility are sold under a 20-year PPA with Compañía Minera del Pacífico, S.A., or “CMP,” an affiliate of CAP, S.A., a leading iron ore mining and steel company. The U.S. dollar denominated PPA serves as a contract for differences, pursuant to which CMP guarantees the payment of a fixed price per MWh of electricity produced, which price increases semiannually with inflation. In connection with the PPA, CAP and its affiliates were granted an option to acquire up to 40% of the shares of the project company from us pursuant to a predetermined purchase price formula. CAP can exercise this option during a period of two years from COD, which occurred in March 2014.
The project has been financed through a long term, non-recourse financing provided by the U.S. Government’s Overseas Private Investment Corporation and the International Finance Corporation, and through a VAT loan provided by Rabobank Chile. See “Description of Certain Indebtedness—Project-Level Financing Arrangements.”
158
Table of Contents
Call Right Projects
The following table provides an overview of the Call Right Projects that are identified pursuant to the Support Agreement as of November 30, 2014:
| Project Names(1) |
Country | Estimated Acquisition Date(2) |
Nameplate Capacity (MW)(3) |
# of Sites | ||||||||
| Priced Call Right Projects |
||||||||||||
| Ontario 2015 projects |
Canada | Q1 2015 - Q4 2015 | 8.5 | 30 | ||||||||
| U.K. projects #1-11 |
U.K. | Q1 2015 - Q2 2015 | 150.8 | 11 | ||||||||
| Chile project #1(4) |
Chile | Q1 2015 | 41.7 | 1 | ||||||||
| U.S. DG 2H2014 & 2015 projects |
U.S. | Q4 2014 - Q4 2015 | 83.7 | 59 | ||||||||
| Chile project #2 |
Chile | Q1 2016 | 94.0 | 1 | ||||||||
|
|
|
|
|
|||||||||
| Total Priced Call Right Projects |
378.6 | 102 | ||||||||||
| Unpriced Call Right Projects |
||||||||||||
| U.S. DG 2H2014 & 2015 projects |
U.S. | Q4 2014 - Q4 2015 | 58.4 | 69 | ||||||||
| U.S. AP North Lake I |
U.S. | Q2 2015 | 24.1 | 1 | ||||||||
| U.S. Bluebird |
U.S. | Q2 2015 | 7.8 | 1 | ||||||||
| U.S. River Mountains Solar |
U.S. | Q4 2015 | 18.0 | 1 | ||||||||
| U.S. Kingfisher |
U.S. | Q4 2015 | 6.5 | 1 | ||||||||
| U.S. Western project #1 |
U.S. | Q2 2016 | 156.0 | 1 | ||||||||
| U.S. Island project #1 |
U.S. | Q2 2016 | 65.0 | 1 | ||||||||
| U.S. Southwest project #1 |
U.S. | Q3 2016 | 100.0 | 1 | ||||||||
| Tenaska Imperial Solar Energy Center West(5) |
U.S. | Q4 2016 | 72.5 | 1 | ||||||||
| U.S. Utah project #1 |
U.S. | Q3 2016 | 163.0 | 2 | ||||||||
| U.S. California project #1 |
U.S. | Q3 2016 | 54.2 | 1 | ||||||||
| U.S. California project #2 |
U.S. | Q4 2016 | 44.8 | 1 | ||||||||
| U.S. DG 2016 projects |
U.S. | Q1 2016 - Q4 2016 | 54.1 | 12 | ||||||||
| U.S. California projects #3-4 |
U.S. | 2016-2019 | 513.0 | 2 | ||||||||
|
|
|
|
|
|||||||||
| Total Unpriced Call Right Projects |
1,337.5 | 95 | ||||||||||
| Total 2015 Projects |
399.5 | 174 | ||||||||||
| Total 2016 Projects |
1,316.7 | 23 | ||||||||||
|
|
|
|
|
|||||||||
| Total Call Right Projects |
1,716.1 | 197 | ||||||||||
| (1) | The overview above does not include the First Wind projects to which we will be granted call rights pursuant to the Intercompany Agreement if the First Wind Acquisition is consummated. See “Summary—Acquisition Portfolios.” Our Sponsor may remove a project from the Call Right Project list effective upon notice to us if, in its reasonable discretion, a project is unlikely to be successfully completed. In that case, the Sponsor will be required to replace such project with one or more additional reasonably equivalent projects that have a similar economic profile. |
| (2) | Represents date of anticipated acquisition. |
| (3) | Nameplate capacity for solar projects represents the maximum generating capacity at standard test conditions of a facility multiplied by our expected percentage ownership of such facility (disregarding equity interests of any tax equity investor or lessor under any sale-leaseback financing or any non-controlling interests in a partnership). Generating capacity may vary based on a variety of factors discussed elsewhere in this prospectus. |
| (4) | Represents an expected 60% interest in a 69.5 MW project. |
| (5) | Our Sponsor acquired an indirect 19.8% interest in the Tenaska Imperial Solar Energy Center West project in July 2014 and has entered into an agreement to acquire an additional 19.8% interest in such project from Silver Ridge upon the project achieving COD. This acquisition is in addition to the |
159
Table of Contents
| acquisition of the Mt. Signal project from Silver Ridge. The 72.5 MW nameplate capacity included in the table above reflects a 39.6% interest in the 183.1 MW Tenaska Imperial Solar Energy Center West project. We expect the project to achieve COD in the second half of 2016. Our Sponsor’s acquisitions of the interest in the Tenaska Imperial Solar Energy Center West project are subject to certain regulatory approvals, including FERC approval and third-party consents, as well as customary closing conditions. |
For a detailed description of the terms of the Support Agreement, see “Certain Relationships and Related Party Transactions—Project Support Agreement.”
Acquisition Portfolios
The following table provides an overview of the projects that will become part of our portfolio upon consummation of the Capital Dynamics Acquisition. We may not be able to complete the Capital Dynamics Acquisition on a timely basis or at all, and this offering is not conditioned upon the completion of the Capital Dynamics Acquisition. See “Summary—Recent Developments—Capital Dynamics Acquisition.”
| Project Name |
Location | COD | Nameplate Capacity (MW)(1) |
# of Sites |
Offtake Agreements |
|||||||||||||||||||||
| Counterparty |
Counterparty Credit Rating(2) |
Remaining Duration of PPA (Years)(3) |
||||||||||||||||||||||||
| CD DG Portfolio |
U.S. | 2011-2014 | 77.6 | 39 | Various utilities and commercial and governmental entities |
A-, A3 | 19 | |||||||||||||||||||
| (1) | Nameplate capacity for solar projects represents the maximum generating capacity at standard test conditions of a facility multiplied by our percentage ownership of that facility (disregarding any equity interests held by any tax equity investor or lessor under any sale-leaseback financing or of any non-controlling interests in a partnership). Generating capacity may vary based on a variety of factors discussed elsewhere in this prospectus. |
| (2) | The counterparty credit rating represents a weighted average (based on nameplate capacity) credit rating of the project’s counterparties that are rated by S&P, Moody’s or both. The percentage of counterparties that are rated by S&P, Moody’s or both (based on nameplate capacity) of this distributed generation project is 99%. |
| (3) | Calculated as of September 30, 2014. For distributed generation projects, the number represents a weighted average (based on nameplate capacity) remaining duration. |
160
Table of Contents
The following table provides an overview of the projects that will become part of our portfolio upon consummation of the First Wind Acquisition. We may not be able to complete the First Wind Acquisition on a timely basis or at all, and this offering is not conditioned upon the completion of the First Wind Acquisition. See “Summary—Recent Developments—First Wind Acquisition.”
| Offtake Agreements |
||||||||||||||||||||||||||||
| Project Names |
Location | COD(1) | Nameplate Capacity (MW)(2) |
# of Sites |
Project Origin(3) |
Counterparty |
Counterparty Credit Rating |
Remaining Duration of PPA (Years)(4) |
||||||||||||||||||||
| Wind: |
||||||||||||||||||||||||||||
| Cohocton |
U.S. | 2009 | 125.0 | 1 | A | Citigroup Energy | A-, Baa2 | 6 | ||||||||||||||||||||
| Rollins |
U.S. | 2011 | 60.0 | 1 | A | Central Maine Power; Bangor Hydro Electric | BBB+, A3; NR, NR |
17, 17 | ||||||||||||||||||||
| Stetson I |
U.S. | 2009 | 57.0 | 1 | A | Exelon Generation Company | BBB, Baa2 | 5 | ||||||||||||||||||||
| Mars Hill |
U.S. | 2007 | 42.0 | 1 | A | New Brunswick Power(5) | A+, Aa2 | <1 | ||||||||||||||||||||
| Sheffield |
U.S. | 2011 | 40.0 | 1 | A | City of Burlington; Vermont Electric Cooperative; Washington Electric Cooperative | NR, NR; NR, NR; NR, NR |
7, 17, 17 | ||||||||||||||||||||
| Bull Hill |
U.S. | 2012 | 34.5 | 1 | A | NSTAR | A-, Baa1 | 13 | ||||||||||||||||||||
| Kaheawa Wind Power I |
U.S. | 2006 | 30.0 | 1 | A | Maui Electric Company | BBB-, NR | 12 | ||||||||||||||||||||
| Kahuku |
U.S. | 2011 | 30.0 | 1 | A | Hawaiian Electric Company | BBB-, Baa1 | 16 | ||||||||||||||||||||
| Stetson II |
U.S. | 2010 | 25.5 | 1 | A | Exelon Generation Company; Harvard University | BBB, Baa2; NR, NR |
5, 11 | ||||||||||||||||||||
| Kaheawa Wind Power II |
U.S. | 2012 | 21.0 | 1 | A | Maui Electric Company | BBB-, NR | 18 | ||||||||||||||||||||
| Steel Winds I |
U.S. | 2007 | 20.0 | 1 | A | Morgan Stanley Capital Group | A-, Baa2 | 5 | ||||||||||||||||||||
| Steel Winds II |
U.S. | 2012 | 15.0 | 1 | A | Morgan Stanley Capital Group | A-, Baa2 | 5 | ||||||||||||||||||||
|
|
|
|
|
|||||||||||||||||||||||||
| Subtotal |
500.0 | 12 | ||||||||||||||||||||||||||
| Solar: |
||||||||||||||||||||||||||||
| MA Solar |
U.S. | 2014 | 21.1 | 4 | A | Various municipalities and universities | A+, A1(6) | 24 | ||||||||||||||||||||
|
|
|
|
|
|||||||||||||||||||||||||
| Subtotal |
21.1 | 4 | ||||||||||||||||||||||||||
|
|
|
|
|
|||||||||||||||||||||||||
| Total First Wind Portfolio |
521.1 | 16 | ||||||||||||||||||||||||||
|
|
|
|
|
|||||||||||||||||||||||||
| (1) | Represents actual or anticipated COD, as applicable, unless otherwise indicated. |
| (2) | Nameplate capacity for wind facilities represents the manufacturer’s maximum nameplate generating capacity of each turbine multiplied by the number of turbines at a facility multiplied by our anticipated percentage ownership of that facility (disregarding any equity interests held by any tax equity investor or lessor under any sale-leaseback financing or of any non-controlling interests in a partnership). Nameplate capacity for solar projects represents the maximum generating capacity at standard test conditions of a facility multiplied by our percentage ownership of that facility (disregarding any equity interests held by any tax equity investor or lessor under any sale-leaseback financing or any noncontrolling interests in a partnership). Generating capacity may vary based on a variety of factors discussed elsewhere in this prospectus. |
| (3) | Projects which will be acquired in connection with the First Wind Acquisition are identified with an “A” above. |
| (4) | Calculated as of September 30, 2014. For distributed generation projects, the number represents a weighted average (based on nameplate capacity) of remaining duration. |
| (5) | First Wind is currently in the process of negotiating an extension to the PPA with New Brunswick Power. |
| (6) | The counterparty credit rating represents a weighted average (based on nameplate capacity) credit rating of the project’s counterparties that are rated by S&P, Moody’s or both. The percentage of counterparties that are rated by S&P, Moody’s or both (based on nameplate capacity) of the MA Solar project is 39%. |
Cohocton
Cohocton is a 125.0 MW project in Steuben County, New York. Cohocton commenced commercial operations in January 2009. The project consists of fifty 2.5 MW Clipper turbines. Similar to Mars Hill (described below), Cohocton qualifies a portion of its energy for New England RECs. First Wind began self-performing turbine O&M work in the first quarter of 2013.
161
Table of Contents
First Wind sells energy from Cohocton to New York Independent System Operator, or “NYISO.” To stabilize Cohocton’s electricity revenue, First Wind entered into a swap with Citigroup Energy Inc., or “Citigroup,” for approximately 80% of expected generation through the end of 2020. 40% of Cohocton RECs are sold to the New York State Energy Research and Development Authority, or “NYSERDA,” under a long-term agreement and approximately 43% of Cohocton RECs are sold to an affiliate of Citigroup under a long-term contract as New England RECs since First Wind sells the related generation output in New England. The remaining RECs are sold to various other counterparties.
Cohocton was among the first recipients of an American Recovery and Reinvestment Act of 2009, or “ARRA,” grant, receiving approximately $75 million in September 2009.
Kaheawa Wind Power I
Kaheawa Wind Power I, or “KWP I,” is a 30.0 MW project in the West Maui Mountains of Maui, Hawaii, which commenced commercial operations in June 2006. The project consists of twenty 1.5 MW GE turbines. First Wind purchased the development rights to KWP I in June 2004. The project has turbine O&M and warranty agreements with GE through December 2019.
KWP I has a 20-year PPA for power with Maui Electric Company, or “MECO,” with a remaining term of approximately 12 years. The PPA is 100% fixed price. Prior to an amendment approved in 2012, 30% of the price of the PPA was linked to MECO’s avoided cost. The amendment delinked the PPA price from avoided cost and set a new fixed payment rate for 100% of the generation. KWP I qualified for and receives PTCs and MACRS depreciation, along with cash payments under its PPA.
Kahuku
Kahuku is a 30.0 MW project on land owned or leased by First Wind on the north shore of Oahu, Hawaii. This project commenced commercial operations on March 23, 2011. The project consists of twelve 2.5 MW Clipper turbines. Kahuku connects directly into the Hawaii Electric Company’s, or “HECO,” transmission system through a transmission line that transects the project area. A 20-year fixed-price PPA has been executed with HECO and approved by the Hawaiian Public Utilities Commission, or “Hawaiian PUC”. First Wind began self-performing turbine O&M work in the first quarter of 2013.
In August 2012, a fire struck Kahuku destroying the project’s BESS, and the associated BESS enclosure building. The project’s substation control room, which was housed in the BESS enclosure building, was also destroyed. Since the fire, First Wind has rebuilt Kahuku’s substation control room and equipment within a stand-alone enclosure, and installed a D-VAR. The D-VAR provides voltage regulation and stability to meet the interconnection requirements of HECO and replaces some critical functionality (overvoltage mitigation) that was once provided by the BESS. Kahuku received business interruption insurance and property damage insurance to minimize the financial result of the loss. The project is currently connected to the grid and has completed system testing with HECO. As part of the rebuilding process and in concert with HECO, the PPA was amended to include revised interconnection and performance standards to reflect the shift from the BESS to the D-VAR, as well as a change to the fixed energy price received by Kahuku based on the same and the amendment is pending regulatory approval.
In July 2010, First Wind entered into a $117.3 million construction and term loan facility guaranteed by the DOE under Section 1703 to help finance construction of the Kahuku project.
162
Table of Contents
Mars Hill
Mars Hill is a 42.0 MW project located in Mars Hill, Maine, which commenced commercial operations in March 2007. The project consists of twenty eight 1.5 MW GE turbines. The project has turbine O&M and warranty agreements with GE through December 2019.
First Wind has an agreement to sell electricity under a PPA with New Brunswick Power Generation Corporation, or “NB Power,” which expires at the end of February 2015 and provides for the purchase of the entire output of electricity and RECs from the project. First Wind is currently in the process of negotiating an extension to this PPA. Mars Hill qualified for and receives PTCs.
Steel Winds I & II
Steel Winds consists of two projects located on the shores of Lake Erie in Lackawanna, New York, just south of Buffalo. The initial phase, or “Steel Winds I,” commenced commercial operations in June 2007, and is a 20.0 MW project. Steel Winds II is a 15.0 MW expansion and reached commercial operation in January 2012. The projects consist of fourteen 2.5 MW Clipper turbines. First Wind began performing turbine O&M work in the first quarter of 2013.
First Wind receives floating power prices within NYISO Zone A for power at Steel Winds. To stabilize this revenue, First Wind entered into a swap for the two combined projects, with Morgan Stanley Capital Group, or “MSCG,” that expires in 2019. The volume of this swap is approximately 83% of Steel Winds’ expected output. Steel Winds II has a contract with NYSERDA for the sale of 95% of its REC output that expires in 2022. In addition, the projects share short-term REC contracts with several counter parties that expire on various dates through 2015.
Stetson I
Stetson I is a 57.0 MW project in Washington County, Maine located approximately 60 miles from First Wind’s Mars Hill project. Stetson I became operational in January 2009. The project consists of thirty eight 1.5 MW GE turbines. As part of the Stetson I project, First Wind also constructed a 38-mile, 200 MW, 115 kV generator lead to interconnect to the ISO-NE power grid. First Wind overbuilt the capacity of the transmission line by 140 MW to accommodate future expansions, 25.5 MW of which is now being used by First Wind’s Stetson II project and 60.0 MW by First Wind’s Rollins project. The project has turbine O&M and warranty agreements with GE through December 2019.
Because Stetson I connects directly into ISO-NE, all of its generation qualifies for New England RECs. First Wind sells those RECs to numerous counterparties, similar to Mars Hill and Cohocton. Power from Stetson I is sold separately directly into ISO-NE, where First Wind receives a floating price at the point of sale. Our point of sale has historically traded at a modest discount to Mass Hub, a liquid hub where electricity is traded. First Wind entered into a 10-year fixed-for-floating financial swap with an affiliate of Exelon Generation Company, or “Exelon, for” approximately 74% of the expected output of Stetson I and a portion of the expected output from Stetson II. Stetson I was among the first projects for which an ARRA grant was given. First Wind received approximately $40 million in September 2009.
Stetson II
Stetson II is a 25.5 MW expansion project in Washington County, Maine. Construction on Stetson II began in October 2009, and First Wind commenced commercial operations in March 2010. The project consists of seventeen 1.5 MW GE turbines. Stetson II uses First Wind’s existing infrastructure at Stetson I, including Stetson I’s generator lead, substation and interconnection equipment. The project has turbine O&M and warranty agreements with GE through December 2019.
163
Table of Contents
Half of Stetson II’s electricity and RECs is being sold to Harvard University under a long-term PPA. The other half of project electricity is being sold directly into ISO-NE. The revenue from the majority of the portion of the facility’s energy being sold into the market is hedged with a financial swap with an affiliate of Exelon. The majority of remaining REC volumes are sold to an affiliate of Citigroup under a 10-year contract. Approximately 79% of Stetson II’s expected electricity and REC output is covered by a PPA or otherwise hedged through 2019. First Wind received an ARRA grant of approximately $19 million for Stetson II in June 2010.
Kaheawa Wind Power II
Kaheawa Wind Power II, or “KWP II,” is a 21.0 MW expansion project adjacent to First Wind’s KWP I site on Maui. The project consists of fourteen 1.5 MW GE turbines and commenced operation in July 2012. KWP II connects to MECO’s 69 kV transmission system, which crosses the site. First Wind has executed a directed lease agreement with Hawaii’s Department of Land and Natural Resources. First Wind has signed a long-term PPA for 100% of the project’s electric power and RECs with MECO. The project has turbine O&M and warranty agreements with GE through December 2019.
KWP II uses a battery system to help mesh the output of the project with the grid. The battery system helps stabilize the amount of power available from the project and limit curtailment, which is important because Maui has a small electricity grid. The battery system commenced operation along with the wind energy project in July 2012.
Rollins
Rollins is a 60.0 MW expansion project in Penobscot County, Maine, which commenced operation in July 2011. Rollins consists of forty 1.5 MW GE turbines and includes an approximately 8-mile 115 kV generator lead that ties into First Wind’s existing 38-mile generator lead that serves the Stetson I and Stetson II projects. First Wind has leased the land on which Rollins is located from private landowners under lease agreements with 25 to 27-year terms and options to extend the leases for an additional 20 years. The project has turbine O&M and warranty agreements with GE through December 2019.
All of Rollins’ energy and capacity is sold to two utilities in Maine under 20-year PPAs. Approximately 72% of the project’s RECs are hedged under a separate 5-year contract with Vitol Group, or “Vitol,” an energy trading company, which expires in 2016.
Sheffield
Sheffield is a 40.0 MW project in Sheffield, Vermont, which commenced operation in October 2011. Sheffield consists of sixteen 2.5 MW Clipper turbines. First Wind has entered into lease agreements with private landowners with 23 to 27-year terms and options to extend the leases for an additional 20 years. For this project, First Wind obtained the first Certificate of Public Good granted by the Vermont Public Service Board for a utility-scale wind energy project since 1996. Sheffield sells its power through four PPAs with three Vermont utilities: two PPAs with Vermont Electric Cooperative, or “VEC,” one with Burlington Electric Department, or “BED,” and one with Washington Electric Cooperative, or “WEC”. The PPAs with VEC include a 10-year contract for 25% of the electricity and RECs generated by the project and a 20-year contract for 25% of the electricity generated during the first 10 years and 50% of the electricity generated during the last 10 years. The PPA with WEC includes a 20-year contract for 10% of the electricity and RECs generated by the project, and the PPA with BED includes a 10-year contract for 40% of the electricity and RECs generated. During the subsequent 10 years following the BED PPA, the remaining 40% of the electricity and RECs generated is not contracted.
First Wind began self-performing turbine O&M work in the first quarter of 2013.
164
Table of Contents
Bull Hill
Bull Hill is an approximately 34.5 MW project located on the Bull Hill and Heifer Hill ridges near Eastbrook, Maine. The project commenced commercial operation in October 2012. The project consists of nineteen 1.8 MW Vestas turbines. The project has a 15-year, fixed price PPA for 32.4 MW of the project’s electric power and RECs with NSTAR. Turbine maintenance and warranty coverage is provided by Vestas under a 10-year service, maintenance and warranty agreement commencing at final commissioning of the project.
MA Solar
MA Solar is a 16.9 MWac or 21.1 MWdc group of four projects located in the towns of Millbury and Warren, Massachusetts and commenced commercial operation May 2014. The projects utilize approximately 70,000 Yingli poly-silicon photovoltaic panels on land owned by the project companies. MA Solar consists of the first solar projects built and owned by First Wind.
MA Solar has contracts with four different municipal and state supported institutions of higher learning counterparties to sell 100% of the electrical output. The University of Massachusetts Medical School will purchase 100% of the output from Mass Midstate Solar 2, the University of Massachusetts Lowell will purchase 100% of the output from Mass Midstate Solar 1, 80% of the output from Mass Midstate Solar 3 and 53% of the output from Millbury Solar, the Town of Orange will purchase 20% of the output from Mass Midstate Solar 3, and the Town of Millbury will purchase 47% of the output from Millbury Solar.
The following table provides an overview as of November 30, 2014 of the projects in the First Wind pipeline to which we expect to be granted additional call rights pursuant to the Intercompany Agreement.
| Project Names |
Country | Estimated Acquisition Date(1) |
Nameplate Capacity (MW)(2) |
# of Sites |
||||||||||||
| Solar Projects | ||||||||||||||||
| Mililani Solar I |
U.S. | Q4 2015 | 26.0 | 1 | ||||||||||||
| Seven Sisters |
U.S. | Q4 2015 | 22.6 | 7 | ||||||||||||
| Kawailoa Solar |
U.S. | Q4 2016 | 65.0 | 1 | ||||||||||||
| Waiawa |
U.S. | Q4 2016 | 61.1 | 1 | ||||||||||||
| Mililani Solar II |
U.S. | Q4 2016 | 19.5 | 1 | ||||||||||||
| Four Brothers |
U.S. | Q4 2016 | 400.0 | 4 | ||||||||||||
|
|
|
|
|
|||||||||||||
| Total Intercompany Solar Projects |
594.2 | 15 | ||||||||||||||
| Wind Projects | ||||||||||||||||
| South Plains |
U.S. | Q4 2015 | 200.0 | 1 | ||||||||||||
| Oakfield |
U.S. | Q4 2015 | 147.6 | 1 | ||||||||||||
| South Plains II |
U.S. | Q4 2015 | 150.0 | 1 | ||||||||||||
| Bingham |
U.S. | Q4 2016 | 184.8 | 1 | ||||||||||||
| Hancock |
U.S. | Q4 2016 | 51.0 | 1 | ||||||||||||
| Weaver |
U.S. | 2017 | 73.6 | 1 | ||||||||||||
| Rattlesnake |
U.S. | 2017 | 62.0 | 1 | ||||||||||||
| Route 66 II |
U.S. | 2017 | 100.0 | 1 | ||||||||||||
| Bowers |
U.S. | 2017 | 48.0 | 1 | ||||||||||||
|
|
|
|
|
|||||||||||||
| Total Intercompany Wind Projects |
1,017.0 | 9 | ||||||||||||||
| Total 2015 Projects |
546.2 | 11 | ||||||||||||||
| Total 2016 Projects |
781.4 | 9 | ||||||||||||||
| Total 2017 Projects |
283.6 | 4 | ||||||||||||||
|
|
|
|
|
|||||||||||||
| Total Intercompany Projects |
1,611.2 | 24 | ||||||||||||||
165
Table of Contents
The following table shows the total projects to which we expect to have call rights under both the Intercompany Agreement and the Support Agreement, if the First Wind Acquisition is consummated:
| Sponsor/First Wind |
Nameplate Capacity (MW)(2) |
# of sites |
||||||||||
| Total 2015 Projects |
945.7 | 185 | ||||||||||
| Total 2016 Projects |
2,098.0 | 32 | ||||||||||
| Total 2017 Projects |
283.6 | 4 | ||||||||||
|
|
|
|
|
|||||||||
| Total |
3,327.3 | 221 | ||||||||||
| (1) | Represents date of anticipated acquisition. The acquisition date is subject to change, including to preserve the project’s eligibility for federal governmental incentives including Investment Tax Credits or Production Tax Credits. |
| (2) | Nameplate capacity for solar projects represents the maximum generating capacity at standard test conditions of a facility multiplied by our percentage ownership of that facility (disregarding any equity interests held by any tax equity investor or lessor under any sale-leaseback financing or of any non-controlling interests in a partnership). Nameplate capacity for wind facilities represents the manufacturer’s maximum nameplate generating capacity of each turbine multiplied by the number of turbines at a facility multiplied by our anticipated percentage ownership of that facility (disregarding any equity interests held by any tax equity investor or lessor under any sale-leaseback financing or of any noncontrolling interests in a partnership). Generating capacity may vary based on a variety of factors discussed elsewhere in this prospectus. |
Competition
Power generation is a capital-intensive business with numerous industry participants. We compete to acquire new projects with solar developers who retain solar power plant ownership, independent power producers, financial investors and certain utilities. We compete to supply energy to our potential customers with utilities and other providers of distributed generation. We believe that we compete favorably with our competitors based on these factors in the regions we service. We compete with other solar developers, independent power producers and financial investors based on our lower cost of capital, development expertise, pipeline, global footprint and brand reputation. To the extent we re-contract projects upon termination of a PPA or sell electricity into the merchant power market, we compete with traditional utilities primarily based on low cost of capital, generation located at customer sites, operations and management expertise, price (including predictability of price), green attributes of power, the ease by which customers can switch to electricity generated by our solar energy systems and our open architecture approach to working within the industry, which facilitates collaboration and project acquisitions.
Environmental Matters
We are subject to environmental laws and regulations in the jurisdictions in which we own and operate solar and other renewable energy projects. These laws and regulations generally require that governmental permits and approvals be obtained both before construction and during operation of power plants. While we incur costs in the ordinary course of business to comply with these laws, regulations and permit requirements, we do not expect that the costs of compliance will have a material impact on our business, financial condition or results of operations. We also do not anticipate material capital expenditures for environmental controls for our projects in the next several years. These laws and regulations frequently change and often become more stringent, or subject to more stringent interpretation or enforcement, and therefore future changes could require us to incur materially higher costs.
166
Table of Contents
Employees
Pursuant to the Management Services Agreement, we have a dedicated TerraForm Power management team, solely focused on managing and growing our business. We do not have any employees. The personnel that carry out these activities are employees of our Sponsor, and their services are provided to us or for our benefit under the Management Services Agreement. For a discussion of the individuals from our Sponsor’s management team that are expected to be involved in our business, see “Management” and “Executive Officer Compensation.”
Properties
See “Business—Our Portfolio” for a description of our principal properties.
Regulatory Matters
With the exception of the Regulus project and the Mt. Signal project, all of our currently owned U.S. projects in operation are solar Qualifying Facilities under PURPA having net power production capacities of 20 MW (AC) or less. As a result, these projects and their project company owners are exempt under PURPA from ratemaking and certain other regulatory provisions of the FPA, and from state organizational and financial regulation of electric utilities, and their parent companies are exempt, with respect to these subsidiaries, from the books and records access provisions of PUHCA.
All of the solar project companies that we own outside of the United States are Foreign Utility Companies, or “FUCOs,” as defined in PUHCA. They are exempt from state organizational and financial regulation of electric utilities and from most provisions of PUHCA and the FPA.
Each of the Mt. Signal ProjectCo, the Regulus ProjectCo and the EWG ProjectCos is an “Exempt Wholesale Generator” as defined in PUHCA which exempts it and us (for purposes of our ownership of each such company) from the federal books and access provisions of PUHCA. The projects owned by certain of the EWG ProjectCos are Qualifying Facilities and in one instance may receive exemptions from regulation as “public utilities” under certain provisions of the FPA. However, the Mt. Signal ProjectCo, the Regulus ProjectCo and the EWG ProjectCos are subject to regulation for most purposes as “public utilities” under the FPA, including regulation of their rates and their issuances of securities. Each of the Mt. Signal ProjectCo, the Regulus ProjectCo and the EWG ProjectCos has obtained “market-based rate authorization” and associated blanket authorizations and waivers from FERC under the FPA, which allows it to sell electric energy, capacity and ancillary services at wholesale at negotiated, market-based rates, instead of cost-of-service rates, as well as waivers of, and blanket authorizations under, certain FERC regulations that are commonly granted to market based rate sellers, including blanket authorizations to issue securities.
The project company owners of all U.S. solar or wind projects acquired by us that have a net power production capacity greater than 20 MW (AC) will similarly need to obtain market-based rate authorization prior to commencement of the sales of test energy from their projects. However, while still subject to the rate jurisdiction of FERC under the FPA, the project company owners of solar or wind projects having a net power production greater than 20 MW (AC) but no more than 30 MW (AC) will receive exemption from regulation under PUHCA and from state organizational and financial regulation of electric utilities. The project company owners of solar or wind projects having a net power production capacity greater than 30 MW (AC) will be treated as public utilities in the same way as the Mt. Signal ProjectCo and the Regulus ProjectCo.
Under Section 203 of the FPA, pre-approval by FERC is generally required for any direct or indirect acquisition of control over, or merger or consolidation with, a “public utility” or in certain circumstances an “electric utility company,” as such terms are used for purposes of FPA Section 203.
167
Table of Contents
FERC generally presumes that the acquisition of direct or indirect voting power of 10% or more in an entity results in a change in control of such entity. Violation of Section 203 can result in civil or criminal liability under the FPA, including civil penalties of up to $1 million per day per violation, and the possible imposition of other sanctions by FERC, including the potential voiding of an acquisition made without prior authorization under Section 203. Depending upon the circumstances, liability for violation of FPA Section 203 may attach to a public utility, the parent holding company of a public utility or an electric utility company, or to an acquiror of the voting securities of such holding company or its public utility or electric utility company subsidiaries.
Certain of our project companies, including Mt. Signal ProjectCo, the Regulus ProjectCo and the EWG Projects, are or will become subject to regulation under FPA Section 203. Accordingly, in order to ensure compliance with FPA Section 203, our amended and restated certificate of incorporation prohibits, in the absence of the prior written consent of our board of directors or prior authorization by FERC, any person from acquiring, through this offering or in subsequent purchases other than secondary market transactions, (i) an amount of our Class A common stock or Class B1 common stock that, after giving effect to such acquisition, would allow such purchaser together with its affiliates (as understood for purposes of FPA Section 203) to exercise 10% or more of the total voting power of the outstanding shares of our Class A common stock, Class B common stock and Class B1 common stock in the aggregate, or (ii) an amount of our Class A common stock or Class B1 common stock as otherwise determined by our board of directors sufficient to allow such purchaser together with its affiliates to exercise control over our company. Any acquisition of our Class A common stock or Class B1 common stock in violation of this prohibition shall not be effective to transfer record, beneficial, legal or any other ownership of such common stock, and the transferee shall not be entitled to any rights as a stockholder with respect to such common stock (including, without limitation, the right to vote or to receive dividends with respect thereto).
FERC has determined that an issuer and its subsidiaries will not be held liable under FPA Section 203 for secondary market transactions in the issuer’s voting securities (i.e., sales and purchases of the issuer’s voting securities in public markets of which the issuer has no knowledge). Accordingly, our amended and restated certificate of incorporation will not contain restrictions on the acquisition of our Class A common stock or Class B1 common stock in secondary market transactions. Nevertheless, an acquiror that is, or is an “affiliate” or an “associate company” of, a “holding company” (as defined in PUHCA) may have an obligation to file under FPA Section 203 to seek prior FERC approval for secondary market transactions. Such entities are advised to consult legal counsel concerning such acquisitions and prior to acquiring an amount of our Class A common stock or Class B1 common stock that would constitute 10% or more of the total voting power of the outstanding shares of our Class A common stock, Class B common stock and Class B1 common stock in the aggregate.
Our projects are also subject to compliance with the mandatory reliability standards developed by the North American Electric Reliability Corporation and approved by FERC under the FPA. In the United Kingdom, Canada and Chile, we are also generally subject to the regulations of the relevant energy regulatory agencies applicable to all producers of electricity under the relevant feed-in tariff regulations (including the feed-in tariff rates); however we are generally not subject to regulation as a traditional public utility, i.e., regulation of our financial organization and rates other than feed-in tariff rates.
Additionally, interconnection agreements are required for virtually all of our projects. Depending on the size of the system and state law requirements, interconnection agreements are between the local utility and either us or our customer in the United States, Canada, the United Kingdom or Chile. In almost all cases, interconnection agreements are standard form agreements that have been preapproved by FERC (in the United States), the local public utility commission, or “PUC,” or other regulatory body with jurisdiction over interconnection agreements.
168
Table of Contents
Government Incentives
Each of the United States, Canada, the United Kingdom and Chile has established various incentives and financial mechanisms to reduce the cost of solar energy and to accelerate the adoption of solar energy. These incentives, which include tax credits, cash grants, tax abatements, rebates and RECs or green certificates and net energy metering, or “net metering,” programs. These incentives help catalyze private sector investments in solar energy and efficiency measures. Set forth below is a summary of the various programs and incentives that we expect will apply to our business.
United States
Federal Government Support for Solar and Wind Energy
The federal government provides an uncapped investment tax credit, or “Federal ITC,” that allows a taxpayer to claim a credit of 30% of qualified expenditures for a residential or commercial solar energy system that is placed in service on or before December 31, 2016. This credit is scheduled to be reduced to 10% for assets placed in service on or after January 1, 2017. Wind energy systems that began construction prior to the end of 2013 are eligible for the 30% Federal ITC or, in lieu of the Federal ITC, a production tax credit, or “Federal PTC,” based upon the amount of electricity produced at the facility that is sold to an unrelated person. The Federal PTC rate for 2014 is $0.23/kWh. The federal government also provides accelerated depreciation for eligible solar and wind energy systems. Based on our portfolio of assets, we will benefit from Federal ITC, Federal PTC and an accelerated tax depreciation schedule, and we will rely on financing structures that monetize a substantial portion of these benefits and provide financing for our solar energy systems at the lowest cost of capital.
State Government Support for Solar Energy
Many states offer a personal and/or corporate investment or production tax credit for solar energy systems, which is additive to the Federal ITC. Further, more than half of the states, and many local jurisdictions, have established property tax incentives for renewable energy systems that include exemptions, exclusions, abatements and credits. We expect that certain of our solar and wind power projects will be financed with a tax equity financing structure, whereby the tax equity investor is a member holding equity in the limited liability company that directly or indirectly owns the solar or wind power project and receives the benefits of various tax credits.
Many state governments, utilities, municipal utilities and co-operative utilities offer a rebate or other cash incentive for the installation and operation of a solar energy system or energy efficiency measures. Capital costs or “up-front” rebates provide funds to solar customers based on the cost, size or expected production of a customer’s solar energy system. Performance-based incentives provide cash payments to a system owner based on the energy generated by their solar energy system during a pre-determined period, and they are paid over that time period. Some states also have established FiT programs that are a type of performance-based incentive where the system owner-producer is paid a set rate for the electricity their system generates over a set period of time.
Forty-three states have a regulatory policy known as net metering. Net metering typically allows our customers to interconnect their on-site solar energy systems to the utility grid and offset their utility electricity purchases by receiving a bill credit at the utility’s retail rate for energy generated by their solar energy system in excess of electric load that is exported to the grid. At the end of the billing period, the customer simply pays for the net energy used or receives a credit at the retail rate if more energy is produced than consumed. Some states require utilities to provide net metering to their customers until the total generating capacity of net metered systems exceeds a set percentage of the utilities’ aggregate customer peak demand.
169
Table of Contents
Some of our projects in Massachusetts participate in what is known as Virtual Net Metering, or “VNM.” VNM in Massachusetts enables solar systems to be sited remotely from the customer’s meter and still receive a credit against their monthly electricity bill. We bill the customer at a fixed rate or for a percentage of the credit they received which is derived from the G-1 electricity tariff. In addition, multiple customers may be designated as credit recipients from a project, provided they are all within the same Local Distribution Company, or “LDC,” service territory and load zone. The VNM structure provides a material electricity offtaker credit enhancement for our projects by creating the ability to sell to hundreds of entities that are located remotely from the project location within the required area. The authority for VNM in Massachusetts was established by the Green Communities Act of 2007 and would require a change in law to repeal the program.
Many states also have adopted procurement requirements for renewable energy production. Twenty-nine states have adopted a renewable portfolio standard that requires regulated utilities to procure a specified percentage of total electricity delivered to customers in the state from eligible renewable energy sources, such as solar and wind energy systems, by a specified date. To prove compliance with such mandates, utilities must surrender renewable energy certificates, or RECs. System owners often are able to sell RECs to utilities directly or in REC markets.
United States state RPS and targets have been a key driver of the expansion of solar and wind power and will continue to drive solar and wind power installations in many areas of the United States. As of March 2013, 29 states and the District of Columbia had RPS in place, and ten other states had non-binding goals supporting renewable energy. The following chart represents renewable portfolio programs, standards and targets by state as of March 2013:
Overview of U.S. State RPS and Targets
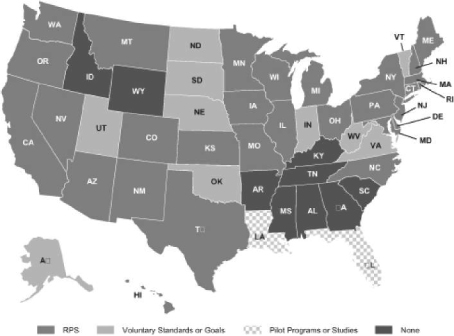
Source: Database of State Incentives for Renewables & Efficiency, U.S. Department of Energy
170
Table of Contents
Canada
Federal Government Support for Renewable Energy
While provincial governments have jurisdiction over their respective intra-provincial electricity markets, from 2007 to 2011, the Canadian federal government supported the development of renewable energy through its ecoENERGY for Renewable Power program, or “ecoEnergy federal incentive,” which resulted in a total of 104 projects qualifying for funds, and will represent cash incentives of approximately C$1.4 billion over 14 years and encouraged an aggregate of approximately 4,500 MW of new renewable energy generating capacity. The program is now fully subscribed, and the Canadian federal government has not signaled an intention to renew it.
Provincial Government Support for Renewable Energy
Provincial governments have been active in promoting renewable energy in general and solar power in particular through RPS as well as through RFPs and FiT programs for renewable energy. Several provinces are currently preparing new RFPs for renewable energy. Current provincial targets for renewable energy in those provinces with stated targets are outlined below.
Ontario. In 2009, the Green Energy and Green Economy Act, 2009 was passed into law and the Ontario Power Authority launched its FiT program, which offers stable prices under long-term contracts for electricity generation from renewable energy. In November 2010, the Ontario Ministry of Energy, or “MoE,” released the draft Supply Mix Directive and Long Term Energy Plan, or “LTEP.” Ontario, one of our markets, has been a leader in supporting the development of renewable energy through the LTEP, which calls for 10,700 MW of renewable energy generating capacity (excluding small-scale hydroelectricity power) by 2018. Ontario was also the first jurisdiction in North America to introduce a FiT program, which has resulted in contracts being executed for approximately 4,546 MW of electricity generating capacity as of January 31, 2013. These new contract awards under the FiT program, along with previously-awarded PPAs, suggests Ontario is close to meeting its current RPS by 2015, provided that all of the currently-contracted projects are successfully developed, financed and constructed.
In April and July of 2012, the MoE implemented version 2.0 of the FiT program, which, among other things, reduced contract prices for new solar power projects, limited the acceptance of applications to specific application windows, and prioritized projects based upon project type (community participation, Aboriginal participation, public infrastructure participation), municipal and Aboriginal support, project readiness and electricity system benefit. The revisions to the FiT program do not affect FiT contracts issued prior to October 31, 2011. Prices under the FiT program will be reviewed annually, with prices established in November that will take effect January 1 of the following year. Such price changes do not affect previously issued FiT contracts but, rather, only FiT contracts to be entered into subsequent to the price change. The revisions may, however, make project economics less attractive (because of the PPA price reduction) and by granting priority points or status to certain types of projects, may make it more difficult to obtain PPAs in the future.
The FiT program was further renewed by the MoE for FiT 3 (123 MW) awarded in summer 2014 and FIT 3 Extension (100 MW) to be awarded in December 2014. The FIT program is committed to three further rounds of contracts including 200 MW in 2015, 150 MW in 2016 and another 150 MW in 2017. Post 2017 the MoE has expressed their intention to transition the FIT program to a net-metering program. For 2014-2017 the program is specifically “SmallFIT” meaning projects from 10 kW to 500 kWac. There is also a “microFIT” program for projects under 10 kW. The SmallFIT program still offers 20 year Power Purchase Agreements with the Government of Ontario’s energy authority (the Ontario Power Authority, which is merging with the Independent Electricity System Operator in January 2015). SmallFIT contracted rates ($/kWh) are set for the 20 year period. There are different prices for different project sizes and technologies (ex. ground mounted solar and rooftop solar have different rates, and
171
Table of Contents
within those two technologies projects under 100 kWac have a higher rate than projects from 100-500kWac). FIT rate reductions and any modification to program rules are transparent and occur after stakeholder consultation.
On June 12, 2013, December 16, 2013, March 31, 2014, and November 7, 2014, the MoE directed the Ontario Power Authority to develop a new competitive process for the procurement of renewable energy projects larger than 500 kW. On November 17, 2014 (as amended on December 5, 2014), the Ontario Power Authority issued a draft Request for Proposals for Procurement of up to 565 MW of New Large Renewable Energy Projects, or “LRP I RFP”. The LRP I RFP, seeks proposals for up to 300 MW of On-Shore Wind, 140 MW of Solar, 50 MW of Bioenergy and 75 MW of Waterpower. As of December 2014, the proposed timing of the LRP I RFP calls for proposal submissions to occur in June 2015. Following the LRP I RFP, the Ontario Power Authority plans to issue a further Request for Proposals (LRP II RFP) in Spring/Summer 2016.
Other Provinces. Provincial support for renewable energy in other provinces includes the following objectives:
| • | British Columbia: To achieve energy self-sufficiency by 2016 with at least 93% of net electricity generation from clean or renewable sources. |
| • | New Brunswick: To generate 10% of net electricity generation from new renewable sources by 2016. |
| • | Nova Scotia: To generate 25% and 40% of net electricity generation from new (post-2001) sources of renewable energy by 2015 and 2020, respectively. |
United Kingdom
Renewables Obligation
In the United Kingdom, a RPS based on the Renewables Obligation Order 2009, or “RO,” supports renewable electricity generation by placing an obligation on licensed electricity suppliers to submit ROCs each year or else pay a buy-out price. Suppliers source ROCs from generators of electricity from renewable sources. The aggregate number of ROCs required to be retired by the electricity companies each year is set by the government prior to such year based on the predicted generation (supply of ROCs) plus a “headroom” of 10%. This minimizes the risk of supply of ROCs exceeding the obligation in any year and provides for stable prices, as some market participants will generally have to pay the buy-out price, which is set by law and increases by inflation every year. The total buy-out prices received by the government are redistributed, net of the costs of the Office for Gas and Electricity Markets, or “OFGEM,” pro rata among all electricity companies that have submitted ROCs (the so-called “ROC recycle value”). OFGEM, the regulator of electricity and gas markets in Great Britain, administers the process for granting these green energy certificates. OFGEM awards ROCs according to the generating station’s metered output, provided that generator is awarded different amounts of ROCs for each MWh of generation depending on the technology used and the date the relevant facility is connected to the relevant distribution or transmission network and commissioned (the “ROC banding levels”). Accredited renewable energy generators must submit the monthly electricity output data from their projects to OFGEM based on a meter installed at the project site. OFGEM will register the relevant number of ROCs under the generator’s account based on such output on the Renewables and CHP Register, at which time the renewable energy generator is free to sell or transfer such ROCs to third parties. ROCs are then tradable commodities whose price is agreed by selling ROCs through online auctions or by the generator and its offtaker in the relevant PPA or offtake agreement.
The U.K. government has a policy intent not to modify the ROC banding levels for projects after they are accredited for the RO, subject to limited exceptions which are not relevant to solar PV
172
Table of Contents
generating stations, which is referred to as grandfathering. In December 2012, the United Kingdom Department of Energy and Climate Change, or “DECC,” announced the banding levels for ground-mounted solar PV for the period April 2013 to March 2017. The ground-mounted solar PV banding level applicable for projects connected during the fiscal year that ended in March 2013 was 2.0 ROCs per MWh, while under the current legislation the ground-mounted solar PV banding level applicable for projects connected during the fiscal year ending March 2014, 2015, 2016 and 2017 is 1.6 ROCs per MWh, 1.4 ROCs per MWh, 1.3 ROCs per MWh and 1.2 ROCs per MWh, respectively.
However, the U.K. government is proposing to close the RO across Great Britain to new solar PV capacity above 5 MW. This would apply from April 1, 2015, both to new stations and to additional capacity added to existing accredited stations after that date, where the station is, or would become, above 5 MW. DECC proposes to provide a “grace period” designed to protect solar developers that have made a significant financial commitment to projects on or before May 13, 2014 or where a solar developer can demonstrate that connection is delayed beyond March 31, 2015 due to actions of a local network operator. Solar PV installations above 5 MW in size will still be eligible to apply for support under the new Contracts for Difference scheme and projects of 5 MW or below will continue to be eligible for support under either the RO or small-scale FIT scheme as discussed below.
Subject to the proposal in relation to future solar PV installations as described above, the U.K. government has indicated that new renewable energy projects may continue to gain accreditation under the RO until the scheme closes on March 31, 2017. The March 31, 2017 closure date for accreditation under the RO is subject to certain grace period provisions which are designed to help avoid an investment hiatus by protecting projects against certain risks of delay. These provisions and other transition arrangements are currently before Parliament as part of the RO Closure Order 2014. After the closure date, the U.K. government intends to close the ROCs to new accreditation, and the pool of ROCs-supported electricity capacity will decrease over time until the program ends on March 31, 2037. The U.K. government has confirmed that it will continue to calculate the RO annually by headroom until March 31, 2027, and ROCs issued on or after April 1, 2027 will be replaced with “fixed price certificates,” which is a new form of certificate, fixed at the 2027 buyout price plus 10%. The DECC has indicated that the intention is to maintain levels and length of support for existing participants.
Contract for Differences
On October 2014, the DECC published the final budget notice in relation to the first allocation round for Contract for Differences, the new regulatory regime for supporting low carbon generation in Great Britain, a part of the UK government’s Electricity Market Reform (EMR) program. Projects will be considered for a Contract for Difference against those projects and technology types within the same budgetary group. According to the applicable DECC regulation published in July 2014, solar PV and onshore wind projects above 5 MW in size are both classified as established technologies (Group 1). For established technologies, the October 2014 budget notice allocated £50 million for projects commissioning in 2015/16, and £65 million from 2016/17 onwards. The first allocation round is due to start in December 2014, and the pre-qualification process closed in October 2014.
Feed-in Tariffs
FiTs support renewable electricity generation by requiring certain licensed electricity suppliers to make generation and export payments in respect of certain kinds of renewable electricity generation up to 5 MW. New, small-scale electricity generating stations, including solar, above 50 kW and up to 5 MW in size have the one-off option of choosing support from either the ROCs or the FiT scheme. Generation payments are a fixed payment by the relevant electricity supplier to the FiT generator for every kWh generation by the installation. Export payments are a fixed payment by the relevant electricity supplier to the FiT generator for every kWh exported to the national grid (although electricity
173
Table of Contents
can alternatively be sold into the market). FiTs for solar generating stations are granted for either 20 or 25 years. The policy of “grandfathering” ensures that solar generating stations should continue to receive the FiT for which they were first accredited for the duration of their FiT support.
The FiT generation payment is subject to degression, which is a mechanism to control FiTs costs. There are currently three separate “degression bands” for solar PV with associated triggers based on quarterly deployment. In addition, solar PV is subject to automatic degression, which means that there is a minimum of 3.5% degression for every solar PV tariff every nine months. DECC is currently proposing to split the current FiT degression band for over 50 kW and stand-alone PV installations into two separate bands, which are essentially two distinct building-mounted and ground-mounted solar bands, to assist in realizing the U.K. government’s ambition towards favoring/increasing the deployment of building-mounted solar PV ahead of ground-mounted PV.
Levy Exemption Certificates
Certain renewable generators, including solar plants, are also eligible to receive levy exemptions certificates, or “LECs,” in respect of the Climate Change Levy, a tax on U.K. business energy use. A LEC is only transferable together with the electricity to which it relates.
Long-Term Visibility of Support
While the ROCs and FiT support levels decrease over time for new projects due to anticipated reductions in the cost of installations, an objective from DECC has been to seek to create stability in the market for investors and to create a long-term sustainable regulatory framework. This is illustrated by the policy of grandfathering, the long duration of ROCs and FiT support levels and mechanisms such as banding reviews, degression and the Levy Control Framework which are designed to ensure that levels of support for renewables are sustainable.
Chile
Chile has two major electricity grids, the Central Interconnected System, or the “SIC,” and the Greater Northern Interconnected System, or the “SING.” Each of these two main grids has its own independent system operator and market administrator, a Centro de Despacho Económico de Carga, or “CDEC,” and is subject to the oversight of the Comisión Nacional de Energía, or “CNE.” The main functions of the CDEC include ensuring an adequate supply of electricity into the system, providing efficient and economical dispatch of power projects and ensuring that the most efficient electricity generation available to meet demand is dispatched to customers.
In 2008, the Chilean government enacted law No. 20257, the Renewable and Non-Conventional Energy Law, which promotes the use of non-conventional renewable energy, or “NCRE,” sources and defines the different types of technologies qualified as NCRE sources. For the period from 2010 to 2014, that law requires generation companies to supply 5% of their total contractual obligations entered into after August 31, 2007 with NCRE sources. The requirement to supply electricity with NCRE sources will increase by 0.5% annually until 2024, when the requirement will reach 10% of total contractual obligations. A generation company can meet this requirement by developing its own NCRE generation capacity (such as wind, solar, biomass, geothermal or small hydroelectric technology), purchasing from other generators generating NCREs in excess of their legal requirements during the preceding year or paying the applicable fines for non-compliance. A modification of law No. 20257 was enacted by law No. 20698 in October 2013 establishing new goals of NCRE for all supply contracts signed after July 2013. The new goals, which are expressed as a percentage of contracted energy supply, will be 5% by 2013, with annual increases of 1%, to reach 12% in 2020, and later that year, more substantial annual increases to reach 20% in 2025.
174
Table of Contents
The current penalty for non-compliance is approximately (i) $30 per MWh of deficit with respect to such generator’s NCRE generation obligation, as the same shall be certified as of March 1 of the following year, and (ii) $46 per MWh of deficit with respect to such generator’s NCRE generation obligation, if within the following three year period after the non-compliance referred in (i) above, such generator still does not comply with its NCRE generation obligations under the law.
As of the end of 2011, renewable energy accounted for approximately 3% of total electricity generation in Chile.
In early 2012, the Chilean government approved net-metering regulations that would allow systems of up to 100 kW to connect to the grid. Residential customers in the SIC already pay approximately U.S. $0.20 per kWh, and with generation from PV systems not subject to the country’s VAT, project economics are favorable for early adopters.
Legal Proceedings
We are not a party to any legal proceeding other than legal proceedings arising in the ordinary course of our business. We are also a party to various administrative and regulatory proceedings that have arisen in the ordinary course of our business. Although it is not possible to predict the outcome of any of these matters, we believe the ultimate outcome of these matters, individually and in the aggregate, will not have a material adverse effect on our business, financial condition or results of operations.
175
Table of Contents
Below is a list of names, ages (as of November 30, 2014) and a brief account of the business experience of persons who serve as our executive officers, other key officers and directors. Each of our executive officers and other key officers listed below were appointed to their respective position with us in January 2014, with the exception of Alejandro “Alex” Hernandez, who was appointed in September 2014.
| Name |
Age | Position | ||||
| Carlos Domenech Zornoza |
44 | Director, President and Chief Executive Officer | ||||
| Francisco “Pancho” Perez Gundin |
43 | Director, Executive Vice President and Chief Operating Officer | ||||
| Alejandro “Alex” Hernandez |
37 | Executive Vice President and Chief Financial Officer | ||||
| Kevin Lapidus |
44 | Senior Vice President, Corporate Development and M&A | ||||
| Sebastian Deschler |
43 | Senior Vice President, General Counsel and Secretary | ||||
| Ahmad Chatila |
47 | Director and Chairman | ||||
| Brian Wuebbels |
42 | Director | ||||
| Steven Tesoriere |
36 | Director | ||||
| Martin Truong |
37 | Director | ||||
| Mark Lerdal |
55 | Director | ||||
| Mark Florian |
56 | Director | ||||
| Hanif “Wally” Dahya |
58 | Director | ||||
Carlos Domenech Zornoza, Director, President and Chief Executive Officer
Carlos Domenech Zornoza serves as our President and Chief Executive Officer. Previously, Mr. Domenech served as the Executive Vice President & President of SunEdison Capital from March 2013 to January 2014. After the acquisition of SunEdison by MEMC Electronic Materials, Inc. in November 2009, Mr. Domenech served as the Executive Vice President & President of SunEdison. Before that, Mr. Domenech served as the Chief Financial Officer of SunEdison beginning in September 2007 until he became its Chief Operating Officer in November 2008. Prior to joining SunEdison, Mr. Domenech spent 14 years with General Electric, where he served in a variety of leadership roles, including serving as the Chief Financial Officer of Universal Pictures International Entertainment, then a division of General Electric. We believe Mr. Domenech’s extensive energy industry and leadership experience enables him to provide essential guidance to our board of directors.
Francisco “Pancho” Perez Gundin, Director, Executive Vice President and Chief Operating Officer
Pancho Perez Gundin serves as our Chief Operating Officer. Previously, Mr. Perez Gundin served as the President of SunEdison Europe, EMEA and Latin America from June 2009 to January 2014. Mr. Perez Gundin began with SunEdison in operations in November 2008. Prior to joining SunEdison, Mr. Perez Gundin spent 14 years with Universal Pictures International Entertainment, where he served in a variety of financial roles, including most recently serving as Financial Director for that company. We believe Mr. Perez Gundin’s extensive leadership and financial and energy industry experience enables him to contribute significant managerial and financial oversight skills to our board of directors.
Alejandro “Alex” Hernandez, Executive Vice President and Chief Financial Officer
Alex Hernandez was appointed as our Chief Financial Officer in September 2014. Prior to joining us, Mr. Hernandez spent nine years with Goldman, Sachs & Co., where he served as a Managing Director in the Investment Banking Division. In that role, Mr. Hernandez was responsible for primary coverage of North American energy companies in the power, utility, and renewable energy sectors, and provided strategic and capital markets advice to management teams and Boards of Directors.
176
Table of Contents
Kevin Lapidus, Senior Vice President, Corporate Development and M&A
Kevin Lapidus serves as our Senior Vice President, Corporate Development and M&A. Mr. Lapidus also serves as the Senior Vice President, Corporate Development and M&A for SunEdison, a position he has held since January 2013. In that role, Mr. Lapidus manages SunEdison’s Global Corporate Development group and is responsible for company and project acquisitions, joint ventures and partnerships, and other capital raising and strategy initiatives. Previously, Mr. Lapidus served as SunEdison’s General Counsel from February 2007 until joining the Global Corporate Development group. Mr. Lapidus previously also managed SunEdison’s Government Affairs group. Prior to that, Mr. Lapidus served as the Senior Vice President and General Counsel of two other technology companies, and for six years served on the board of directors of the Washington Metropolitan Area Corporate Counsel Association (WMACCA), including serving as its president for one year. Mr. Lapidus was also an attorney at both Hale and Dorr LLP and Hogan & Hartson L.L.P.
Sebastian Deschler, Senior Vice President, General Counsel and Secretary
Sebastian Deschler serves as our Senior Vice President, General Counsel and Secretary. Previously, Mr. Deschler served as SunEdison’s Vice President and Head of Legal, EMEA and Latin America, from July 2010 to January 2014. Mr. Deschler previously served as Director, International Legal and Head of Legal, Europe, of SunEdison from December 2007 to June 2010. Prior to joining SunEdison, Mr. Deschler was an attorney at Milbank, Tweed, Hadley & McCloy LLP and Orrick, Herrington & Sutcliffe LLP in Washington, D.C., handling project finance, regulatory and corporate matters.
Ahmad Chatila, Director and Chairman
Ahmad Chatila serves as Chairman of our board of directors and as a director. Mr. Chatila serves as the President, Chief Executive Officer and as a member of the board of directors for SunEdison, positions he has held since March 2009. Prior to SunEdison, Mr. Chatila served as Executive Vice President of the Memory and Imaging Division, and head of global manufacturing for Cypress Semiconductor. Previously, Mr. Chatila served as managing director of Cypress’ Low Power Memory Business Unit. Prior to these roles at Cypress, Mr. Chatila served in sales at Taiwan Semiconductor Manufacturing Co. We believe Mr. Chatila’s extensive leadership experience enables him to play a key role in all matters involving our board of directors and contribute an additional perspective from the energy industry.
Brian Wuebbels, Director
Brian Wuebbels is a member of our board of directors. Mr. Wuebbels serves as the Executive Vice President and Chief Financial Officer of SunEdison, positions he has held since May 2012. Mr. Wuebbels has been with SunEdison/MEMC Electronic Materials, Inc. since 2007 and previously held various positions, including Vice President and General Manager—Balance of System Products, Vice President, Solar Wafer Manufacturing, Vice President of Financial Planning and Analysis and Vice President Operations Finance. Before joining MEMC, Mr. Wuebbels served as Vice President and Chief Financial Officer of Honeywell’s Sensing and Controls Business. Prior to that, Mr. Wuebbels spent 10 years at General Electric in various senior finance and operations roles in multiple businesses around the world. We believe Mr. Wuebbels’ extensive leadership and financial expertise enables him to contribute significant managerial, strategic and financial oversight skills to our board of directors.
Steven Tesoriere, Director
Steven Tesoriere is a member of our board of directors. Mr. Tesoriere is a Managing Principal and Portfolio Manager of Altai Capital Management, L.P. Prior to founding Altai Capital in 2009, Mr. Tesoriere was an analyst at Anchorage Capital Group, L.L.C. from 2003 to 2009, and prior to that, he was an
177
Table of Contents
Associate at Goldman, Sachs & Co. and an Analyst at The Blackstone Group, L.P. Mr. Tesoriere is a member of the board of directors of SunEdison. Mr. Tesoriere brings extensive financial management experience and financial expertise to our board of directors which allows him to bring valuable contributions in finance development.
Martin Truong, Director
Martin Truong was appointed to our board of directors in connection with the completion of our IPO. Mr. Truong has served as SunEdison’s Vice President, General Counsel and Secretary since April of 2013 and was promoted to Senior Vice President in May of 2014. Mr. Truong joined SunEdison in February 2008 and has held various roles of increasing responsibility, most recently serving as SunEdison’s Assistant General Counsel with legal responsibilities for Emerging Markets, Solar Materials and intellectual property licensing and monetization. Mr. Truong’s extensive energy industry and leadership experience enables him to provide valuable guidance to our board of directors.
Mark Lerdal, Director
Mark Lerdal was appointed to our board of directors in connection with the completion of our IPO. Mr. Lerdal has served as the Executive Chairman of Leaf Clean Energy, a closed end fund focused on renewable energy investments since April 1, 2014. He has also been a Managing Director of MP2 Capital, LLC, a developer, owner and operator of solar generation assets since 2009. From September of 2011 to February of 2013 Mr. Lerdal served as President of Hydrogen Energy California, a developer of a carbon capture and sequestration facility. Prior to that time Mr. Lerdal was a Managing Director at KKR Finance in its debt securities division. He has been active in the renewable energy business for 30 years as an investor, operating executive and attorney. Mr. Lerdal also serves as a non-executive board member at Trading Emissions and Onsite Energy Corporation. Mr. Lerdal’s extensive energy industry and leadership experience enables him to provide valuable guidance to our board of directors.
Mark Florian, Director
Mark Florian was appointed to our board of directors in connection with the completion of our IPO. Mr. Florian has served as a Managing Director and the Head of Infrastructure Funds at First Reserve, a premier global energy-focused investment firm, since 2008. The energy infrastructure investment business of First Reserve currently has over $4 billion of assets under management. Prior to joining First Reserve, Mr. Florian had a 23-year career at Goldman Sachs, where he served in several senior roles, including Chief Operating Officer of Goldman Sachs’ Public Sector and Infrastructure Department. During his time at Goldman Sachs, Mr. Florian’s work spanned various areas of the firm, including the corporate investment banking, mergers & acquisitions and public finance areas. Mr. Florian’s experience in investment banking for infrastructure companies and his extensive experience in the energy industry enables him to provide essential guidance to our board of directors and management team.
Hanif “Wally” Dahya, Director
Hanif “Wally” Dahya was appointed to our board of directors in connection with the completion of our IPO. Mr. Dahya has served as the Chief Executive Officer of the Y Company LLC, a private investment firm that specializes in restructuring distressed assets in the emerging markets, focusing on Telecommunications, Energy, and Environmental Industries since 2007. Before founding the Y Company LLC, Mr. Dahya was a Partner at Sandler O’Neill & Partners LP, a full service investment banking firm specializing in serving financing institutions, from 1991 to 1997. Prior to that, Mr. Dahya worked at EF Hutton & Company, Inc. in the Corporate Finance group, served as a Managing Director
178
Table of Contents
at LF Rothschild & Company, Inc., and was a Managing Director at UBS Securities Inc. Mr. Dahya is currently a member of the Board of Directors of New York Community Bancorp, Inc., for which he chairs the Investment Committee and the New York Commercial Bank Credit Committee and is a member of the Audit Committee, Nominating and Corporate Governance Committee, Risk Assessment Committee, Capital Adequacy Committee and the Asset Liability Committee. Mr. Dahya brings valuable energy industry and public company board experience to our board of directors.
Controlled Company
For purposes of the applicable stock exchange rules, we are a “controlled company.” Controlled companies under those rules are companies of which more than 50% of the voting power for the election of directors is held by an individual, a group or another company. Our Sponsor controls, and upon completion of this offering will continue to control, more than 50% of the combined voting power of our common stock and, as a result, has and will continue to have the right to designate a majority of the members of our board of directors for nomination for election and the voting power to elect such directors. Accordingly, we are and will continue to be eligible to, and we intend to, take advantage of certain exemptions from corporate governance requirements provided in the applicable stock exchange rules. Specifically, as a controlled company, we are not required to have (i) a majority of independent directors, (ii) a nominating and corporate governance committee composed entirely of independent directors, (iii) a compensation committee composed entirely of independent directors or (iv) an annual performance evaluation of the nominating and corporate governance and compensation committee. We currently rely on the exceptions with respect to having a majority of independent directors, establishing a compensation committee or nominating committee and annual performance evaluations of such committees. Accordingly, you will not have the same protections afforded to stockholders of companies that are subject to all of the applicable stock exchange rules. The controlled company exemption does not modify the independence requirements for the audit committee, and we comply with the requirements of the Sarbanes-Oxley Act and the applicable NASDAQ Global Select Market rules, which require that our audit committee be composed of at least three members, each of whom is independent. In addition, we maintain a Corporate Governance and Conflicts Committee comprised of at least three independent directors.
Board Composition
Our board of directors consists of nine members.
Our board of directors is responsible for, among other things, overseeing the conduct of our business, reviewing and, where appropriate, approving our long-term strategic, financial and organizational goals and plans, and reviewing the performance of our chief executive officer and other members of senior management. Following the end of each year, our board of directors will conduct an annual self-evaluation, which includes a review of any areas in which the board of directors or management believes the board of directors can make a better contribution to our corporate governance, as well as a review of the committee structure and an assessment of the board of directors’ compliance with corporate governance principles. In fulfilling the board of directors’ responsibilities, directors have full access to our management and independent advisors.
Our board of directors, as a whole and through its committees, has responsibility for the oversight of risk management. Our senior management is responsible for assessing and managing our risks on a day-to-day basis. Our audit committee oversees and reviews with management our policies with respect to risk assessment and risk management and our significant financial risk exposures and the actions management has taken to limit, monitor or control such exposures. Our board of directors oversees risk related to compensation policies. Our audit committee reports to the full board of directors with respect to these matters, among others.
179
Table of Contents
Committees of the Board of Directors
The standing committees of our board of directors consists of an Audit Committee and a Corporate Governance and Conflicts Committee. Each of the committees reports to the board of directors as they deem appropriate and as the board may request. The composition, duties and responsibilities of these committees are set forth below. As a controlled company, we are not required to establish a compensation or nominating committee under the listing rules of the NASDAQ Global Select Market and we do not intend to establish such committees.
Audit Committee
The Audit Committee is responsible for, among other matters: (1) appointing, retaining and evaluating our independent registered public accounting firm and approving all services to be performed by them; (2) overseeing our independent registered public accounting firm’s qualifications, independence and performance; (3) overseeing the financial reporting process and discussing with management and our independent registered public accounting firm the interim and annual financial statements that we file with the SEC; (4) reviewing and monitoring our accounting principles, accounting policies, financial and accounting controls and compliance with legal and regulatory requirements; (5) establishing procedures for the confidential anonymous submission of concerns regarding questionable accounting, internal controls or auditing matters; and (6) reviewing and approving related person transactions.
Our Audit Committee consists of Messrs. Tesoriere, Lerdal and Dahya. We believe that Messrs. Tesoriere, Lerdal and Dahya qualify as independent directors according to the rules and regulations of the SEC and the NASDAQ Global Select Market with respect to audit committee membership. We also believe that Mr. Dahya qualifies as our “audit committee financial expert,” as such term is defined in Item 401(h) of Regulation S-K. Mr. Dahya has been designated as the chairperson of the Audit Committee. Our board of directors has adopted a written charter for the Audit Committee which is available on our corporate website. The information on our website is not part of this prospectus.
Corporate Governance and Conflicts Committee
Our Corporate Governance and Conflicts Committee is responsible for, among other matters: (1) overseeing the organization of our board of directors to discharge the board’s duties and responsibilities properly and efficiently; (2) identifying best practices and recommending corporate governance principles; (3) developing and recommending to our board of directors a set of corporate governance guidelines and principles applicable to us; and (4) reviewing and approving proposed conflicted transactions between us and an affiliated party (including with respect to the purchase and sale of the Call Right Projects, any ROFO Projects and any other material transaction between us and our Sponsor).
Our Corporate Governance and Conflicts Committee consists of Messers. Lerdal, Florian and Dahya. We believe Messers. Lerdal, Florian and Dahya qualify as independent directors according to the rules and regulations of the SEC and the NASDAQ Global Select Market. Mr. Florian has been designated as the chairperson of the Corporate Governance and Conflicts Committee. Our board of directors has adopted a written charter for the Corporate Governance and Conflicts Committee which is available on our corporate website. The information on our website is not part of this prospectus.
Other Committees
Our board of directors may establish other committees as it deems necessary or appropriate from time to time.
180
Table of Contents
Family Relationships
There are no family relationships among any of our executive officers.
Code of Business Conduct
Our board of directors has adopted a Code of Business Conduct that applies to all of our employees, including our Chief Executive Officer, Chief Financial Officer and principal accounting officer. Our Code of Business Conduct is available on our website. If we amend or grant a waiver of one or more of the provisions of our Code of Business Conduct, we intend to satisfy the requirements under Item 5.05 of Form 8-K regarding the disclosure of amendments to or waivers from provisions of our Code of Business Conduct that apply to our principal executive officer, financial and accounting officers by posting the required information on our website. Our website is not part of this prospectus.
181
Table of Contents
EXECUTIVE OFFICER COMPENSATION
Compensation of our Executive Officers
We are a recently formed subsidiary of SunEdison consisting of portions of various parts of SunEdison’s business that were contributed to us in connection with our IPO. We have not incurred any cost or liability with respect to compensation of our executive officers prior to our formation. We do not and will not directly employ any of the persons responsible for managing our business and we currently do not have a compensation committee.
Our officers manage the day-to-day affairs of our business. Each of our executive officers is an employee of SunEdison. However, other than Mr. Lapidus, who has responsibilities to both us and SunEdison, our executive officers are dedicated to the operations and management of our business. Mr. Lapidus devotes part of his business time to our business and part of his business time to SunEdison’s business.
Because our executive officers will remain employees of SunEdison, their compensation will be determined and paid by SunEdison. The ultimate responsibility and authority for compensation-related decisions for our executive officers will reside with the SunEdison compensation committee or the chief executive officer of SunEdison, as applicable, and any such compensation decisions will not be subject to any approvals by our board of directors or any committees thereof. Our executive officers, as well as other employees of SunEdison who provide services to us, may participate in employee benefit plans and arrangements sponsored by SunEdison, including plans that may be established in the future. In addition, certain of our officers and certain employees of SunEdison who provide services to us currently hold grants under SunEdison’s equity incentive plans and will retain these grants after the completion of this offering. We will not reimburse SunEdison for compensation related expenses attributable to any executive’s or employee’s time dedicated to providing services to us. For details on the amounts we pay SunEdison for management services, see “Certain Relationships and Related Party Transactions—Management Services Agreement.”
Except as set forth below, we do not currently expect to have any long-term incentive or equity compensation plan in which our executive officers may participate.
Equity Incentive Awards
Pre-IPO Stock Grants
In connection with the formation of TerraForm Power, certain of our executive officers were granted restricted shares under the 2014 Incentive Plan which converted into shares of Class A common stock upon the completion of our IPO. The table below sets forth the number of shares issued to such executive officers following the conversion.
| Name |
Number of Shares of Class A Common Stock |
|||
| Carlos Domenech Zornoza |
1,688,960 | |||
| Francisco “Pancho” Perez Gundin |
808,152 | |||
| Kevin Lapidus |
328,312 | |||
| Sebastian Deschler |
138,901 | |||
|
|
|
|||
| Total |
2,964,325 | |||
|
|
|
|||
182
Table of Contents
For each executive, other than in respect of the additional shares granted to Mr. Domenech described in the paragraph below, 25% of the Class A common stock granted under the plan will vest on the first anniversary of the date of the grant, 25% will vest on the second anniversary of the date of the grant and 50% will vest on the third anniversary of the date of grant, subject to accelerated vesting upon certain events. Under certain circumstances upon a termination of employment, any unvested shares of Class A common stock held by the terminated executive will be forfeited.
In addition, 467,753 of the restricted shares of Class A common stock issued to Mr. Domenech are subject to different time-based vesting conditions, with 34% vesting upon the 6-month anniversary of our IPO, 33% vesting upon the one-year anniversary of our IPO and 33% vesting upon the 18-month anniversary of our IPO. These restricted shares will not be subject to forfeiture in the event of a termination of employment.
Effective September 29, 2014, Mr. Sanjeev Kumar resigned as our Chief Financial Officer. Mr. Kumar continues to hold 101,019 of the restricted shares of Class A common stock previously granted to him.
RSU Grants
In connection with the completion of our IPO, and on several occasions since then, our board of directors approved a grant of restricted stock units to several persons who have provided or are providing services to us. These grants consist of approximately 830,000 restricted stock units, or “RSUs,” which will vest in increments of 25% on the first anniversary of their respective grant date, 25% on the second anniversary of their respective grant date and 50% on the third anniversary of their respective grant date . These RSUs include 250,000 RSUs granted to Mr. Hernandez in September 2014. The RSUs will not entitle the holders to voting rights with respect to matters presented to our stockholders, and, except for Mr. Hernandez, holders of the RSUs will not have any right to receive dividends. The RSUs granted to Mr. Hernandez accrue cash dividend equivalent payments which are deferred and paid upon vesting.
Stock Option Grants
In connection with his appointment as Chief Financial Officer, Mr. Hernandez was granted 150,000 non-qualified stock options. 75,000 of the stock options will vest in increments of 25% on the first anniversary of the grant date, 25% on the second anniversary of the grant date, 25% on the third anniversary of the grant date and 25% on the fourth anniversary of the grant date. With respect to the remaining 75,000 stock options, 25% will vest upon a 15% increase of the Company’s quarterly dividend per common share paid out to its Class A shareholders from $0.2257. Thereafter, additional 25% tranches will vest upon further 15% increases from the relevant prior threshold.
TerraForm Power, Inc. 2014 Second Amended and Restated Long-Term Incentive Plan
The 2014 Incentive Plan became effective as of April 11, 2014. The material terms of the 2014 Incentive Plan are summarized below. Certain awards which have been made under the 2014 Incentive Plan are summarized above.
The purpose of the 2014 Incentive Plan is to enhance the profitability and value of our company for the benefit of our stockholders by enabling us to offer eligible individuals cash and stock-based incentives in order to attract, retain and reward such individuals and strengthen the mutuality of interests between such individuals and our stockholders. Eligibility to participate in the 2014 Incentive Plan is limited to our and our affiliates’ employees (including officers and directors who are employees) and consultants who are designated by our board or a committee of our board which is authorized to
183
Table of Contents
administer the plan, in its discretion, as eligible to receive awards under the 2014 Incentive Plan. The 2014 Incentive Plan provides for the grant of non-qualified stock options, incentive stock options (within the meaning of Section 422 of the Code), stock appreciation rights, restricted stock, performance shares, restricted stock units or any other cash or stock based award. The material terms of the 2014 Incentive Plan are as follows:
| • | Shares Subject to the Plan. The maximum aggregate number of shares that may be issued under the 2014 Incentive Plan shall not exceed a number of shares of common stock that represent an aggregate 8.5% economic interest in Terra LLC, or 8,586,614 shares, based on the assumptions set forth in “The Offering—Certain Assumptions,” subject to certain adjustments to prevent dilution, of which 3,710,048 shares remain available for future issuances. This limitation does not apply to any awards settled in cash. To the extent any stock option or other stock-based award granted under the 2014 Incentive Plan is forfeited, cancelled, terminated, expires or lapses without having been exercised or paid in full, the shares subject to such awards will become available for future grant or sale under the 2014 Incentive Plan. The Class C common stock issued, subject to outstanding awards or reserved under the 2014 Incentive Plan, were converted at the time of our IPO into shares of Class A common stock. As used herein and in the 2014 Incentive Plan, references to “common stock” mean, prior to the completion of our IPO, our Class C common stock and, following the completion of our IPO, our Class A common stock. |
| • | Award Limitations. During the course of any fiscal year, the maximum number of shares subject to any award of stock options, stock appreciation rights, shares of restricted stock or other stock-based awards for which the grant of such award or the lapse of the relevant restricted period is subject to the attainment of performance goals, in each case, granted to any participant shall be equal to 50% of the total share reserve under the 2014 Incentive Plan, provided that the maximum number of shares for all types of awards granted to any participant does not exceed 50% of the share reserve during any fiscal year. The maximum value of a cash payment to an individual made under an award with respect to a fiscal year shall be $10,000,000. |
| • | Plan Administration. The 2014 Incentive Plan provides that the plan will be administered by our board of directors. Our board of directors has the authority to amend and modify the plan, subject to any shareholder approval required by law or exchange rules. Subject to the terms of our 2014 Incentive Plan, our board of directors will have the authority to determine the terms, conditions and restrictions, including vesting terms, the number of shares of common stock subject to an award and the performance measures applicable to awards granted under the 2014 Incentive Plan, amend any outstanding awards and construe and interpret the 2014 Incentive Plan and the awards granted thereunder. Our board of directors also has the ability to delegate its authority to grant awards and/or to execute agreements or other documents on behalf of the board of directors to one or more of our officers (to the extent permitted by applicable law and applicable exchange rules), and has granted a limited authority to do so to our Chief Executive Officer. |
| • | Stock Options and Stock Appreciation Rights. Our board of directors may grant incentive stock options, non-qualified stock options and stock appreciation rights under our 2014 Incentive Plan, provided that incentive stock options can only be granted to eligible employees. Generally, the exercise price of stock options and stock appreciation rights will be fixed by the board of directors and set forth in the award agreement, but in no event will the exercise price be less than 100% of the grant date fair market value of shares of our common stock. The term of a stock option or stock appreciation right may not exceed ten years; provided, however, than an incentive stock option held by an employee who owns more than 10% of all of our classes of stock, or of certain of our affiliates, may not have a term in excess of five years and must have an exercise price of at least 110% of the grant date fair market |
184
Table of Contents
| value of shares of our common stock. Upon a participant’s termination of service for any reason other than cause, death or disability, the participant may exercise his or her option during the time period ending on the earlier of three (3) months after such termination date or the term of the option. Upon a participant’s termination of service for death or disability, the participant (or his or her estate as applicable) may exercise his or her option during the time period ending on the earlier of 12 months after such termination date or the term of option. If a participant is terminated for cause, then all outstanding options (whether or not vested) shall immediately terminate and cease to be exercisable. Subject to the provisions of our 2014 Incentive Plan, our board of directors will determine the remaining terms of the stock options and stock appreciation rights. |
| • | Restricted Stock and Restricted Stock Units. Our board of directors will decide at the time of grant whether an award will be in restricted stock or restricted stock units. The board of directors will also determine the number of shares subject to the award, vesting and the nature of any performance targets. Subject to the terms of the award agreement, (i) recipients of restricted stock will have voting rights and be entitled to receive dividends with respect to their respective shares of restricted stock and (ii) the recipients of restricted stock units will have no voting rights or rights to receive dividends with respect to their respective restricted stock units. The award agreements with respect to the restricted stock granted to our executive officers as described above include voting and dividend rights. |
| • | Performance-Based Awards. Our board of directors will determine the value of any performance-based award, the vesting and nature of the performance measures and whether the performance award is denominated or settled in cash, in common stock or in a combination of both. The performance goals applicable to a particular award will be determined by our board of directors in writing prior to the beginning of the applicable performance period or at such later date as permitted under Section 162(m) of the Code and while the outcome of the performance goals are substantially uncertain. The performance goals will be objective and will include one or more of the following company-wide, parent, affiliate subsidiary, division, other operational unit, administrative department or product category of the company measures: revenue or revenue growth, diversity, economic value added, index comparisons, earnings or net income (before or after taxes), operating margin, peer company comparisons, productivity, profit margin, return on revenue, return on investment, return on capital, sales growth, return on assets, stock price, earnings per share, cash flow, free cash flow, working capital levels, working capital as a percentage of sales, days sales outstanding, months on hand, days payables outstanding, production levels or services levels, market share, costs, debt to equity ratio, net revenue or net revenue growth, gross revenue, base-business net sales, total segment profit, EBITDA, adjusted diluted earnings per share, earnings per share, gross profit, gross profit growth, adjusted gross profit, net profit margin, operating profit margin, adjusted operating profit, earnings or earnings per share before income tax (profit before taxes), net earnings or net earnings per share (profit after tax), compound annual growth in earnings per share, pretax income, expenses, capitalization, liquidity, results of customer satisfaction surveys, quality, safety, cost management, process improvement, inventory, total or net operating asset turnover, operating income, total shareholder return, compound shareholder return, return on equity, return on invested capital, pretax and pre-interest expense return on average invested capital, which may be expressed on a current value basis, or sales growth, marketing, operating or workplan goals. The applicable award agreement may provide for acceleration or adjustments to the performance targets. |
| • | Vesting. Subject to the limitations set forth in the 2014 Incentive Plan, our board of directors will determine the vesting terms (including any performance targets) governing each award at the time of the grant. |
185
Table of Contents
| • | Transferability of Awards. Except as otherwise permitted by the board of directors or the 2014 Incentive Plan, the 2014 Incentive Plan does not allow awards to be transferred; provided, however, that (i) certain awards may be transferable by will or by the laws of descent and distribution; (ii) the board of directors may determine, in its sole discretion, at the time of grant or thereafter that a non-qualified stock option that is otherwise not transferable is transferable to a family member in whole or in part and in such circumstances, and under such conditions, as specified by the board of directors; and (iii) shares subject to awards made pursuant to other stock-based or cash-based awards may not be transferred prior to the date on which the shares are issued, or, if later, the date on which any applicable restriction, performance or deferral period lapses. |
| • | Adjustment for Changes in Capitalization. In the event of a dissolution or liquidation of the Company, a sale of substantially all of the assets of the Company (in one or a series of transactions), a merger or consolidation of the Company with or into any other corporation (regardless of whether the Company is the surviving corporation), or a statutory share exchange involving capital stock of the Company, a divestiture, distribution of assets to shareholders (other than ordinary cash dividends), reorganization, recapitalization, reclassification, stock dividend, stock split, reverse stock split, stock combination or exchange, rights offering, spin-off or other relevant change, appropriate adjustments will be made in the number and price of shares subject to each outstanding award, as well as to the share limitations contained in the 2014 Incentive Plan. |
| • | Change in Control. Unless otherwise provided in an award agreement, in the event of a participant’s termination without cause or good reason during the 12-month period following a “change in control” (as defined in the 2014 Incentive Plan), all options and stock appreciation rights shall become immediately exercisable, and/or the period of restriction shall expire and the award shall vest immediately with respect to 100% of the shares of restricted stock, restricted stock units, and any other award, and/or all performance goals or other vesting criteria will be deemed achieved at 100% target levels and all other terms and conditions will be deemed met as of the date of the participant’s termination. In addition, in the event of a change in control, an award may be treated, to the extent determined by our board of directors to be permitted under Section 409A of the Code, in accordance with one of the following methods as determined by our board of directors in its sole discretion: (i) upon at least 10 days’ advance notice to the affected persons, cancel any outstanding awards and pay to the holders thereof, in cash or stock, or any combination thereof, the value of such awards based upon the price per share received or to be received by other shareholders of the Company in the event; or (ii) provide for the assumption of or the issuance of substitute awards that will substantially preserve the otherwise applicable terms of any affected awards previously granted under the 2014 Incentive Plan, as determined by the board of directors in its sole discretion. In the case of any option or stock appreciation right with an exercise price that equals or exceeds the price paid for a share in connection with the change in control, the board of directors may cancel the option or stock appreciation right without the payment of consideration therefor. Except as noted above, the award agreements with respect to the restricted stock granted to our executive officers as described above provides for acceleration of all unvested shares of restricted stock upon a change in control. |
| • | Acceleration. Notwithstanding the terms of the applicable award agreement, our board of directors has the power to accelerate the time at which an award may first be exercised or the time during which an award, or any part thereof, will vest in accordance with the 2014 Incentive Plan. |
| • | Amendment, Modification or Termination of the 2014 Incentive Plan. Our board of directors has the authority to amend, modify, terminate or suspend this 2014 Incentive Plan or amend any or all of the applicable award agreements made pursuant to the 2014 Incentive Plan to |
186
Table of Contents
| the extent permitted by law, subject to any stockholder approval required by law or exchange rules for certain amendments; provided that no termination, suspension or modification of the 2014 Incentive Plan may materially or adversely affect any right acquired by any award recipient prior to such termination, suspension or modification without the consent of the award recipient. Our 2014 Incentive Plan will terminate on the ten-year anniversary of its approval by our board of directors, unless terminated earlier pursuant to the terms of the 2014 Incentive Plan. |
Compensation of our Directors
The officers of SunEdison who also serve as our directors will not receive additional compensation for their service as one of our directors. Our directors who are not officers or employees of SunEdison will receive compensation as “non-employee directors” as set by our board of directors.
Our directors who are not employees of us or our Sponsor will receive the following fees for their service on our board of directors and its committees:
| • | $50,000 annual board of directors cash retainer; |
| • | $20,000 additional cash retainer for the chairman of the Audit Committee and $7,500 additional cash retainer for each member of the Audit Committee; and |
| • | $12,500 additional cash retainer for chairman of the Corporate Governance and Conflicts Committee and $5,000 additional cash retainer for each member of the Corporate Governance and Conflicts Committee. |
In addition, our directors who are not employees of us or our Sponsor will be awarded restricted stock units, or “RSUs,” for shares of common stock on an annual basis (as of the date of the annual stockholder meeting each year) in connection with their board service. Each year, RSUs are to be awarded in an amount such that the number of underlying shares of common stock has a total value of $150,000 on the date the award is granted (rounded to the nearest 100 shares), which vest on the first anniversary of the grant date. For newly elected or appointed outside directors that become directors on a date other than the date of the annual stockholder meeting, such directors would receive RSUs for a pro rata portion of the $150,000 total value.
Each member of our board of directors will be indemnified for their actions associated with being a director to the fullest extent permitted under Delaware law.
187
Table of Contents
SECURITY OWNERSHIP OF CERTAIN BENEFICIAL OWNERS AND MANAGEMENT
The following table sets forth the beneficial ownership of our Class A common stock that will be issued and outstanding upon the completion of this offering and held by:
| • | beneficial owners of 5% or more of our common stock; |
| • | each of our directors, director nominees and named executive officers; and |
| • | all of our directors, director nominees and executive officers, as a group. |
The number of shares of our Class A common stock and percentage of combined voting power before and after completion of this offering is presented after giving effect to the Acquisition Transactions. The number of shares of our Class A common stock and percentage of combined voting power after this offering set forth below are based on the shares of our Class A common stock, Class B common stock and Class B1 common stock outstanding immediately after the completion of this offering based on the assumptions set forth in “The Offering—Certain Assumptions.”
Beneficial ownership for the purposes of the following table is determined in accordance with the rules and regulations of the SEC. These rules generally provide that a person is the beneficial owner of securities if such person has or shares the power to vote or direct the voting thereof, or to dispose or direct the disposition thereof, or has the right to acquire such powers within 60 days. Common stock subject to options that are currently exercisable or exercisable within 60 days of the date of this prospectus and restricted stock units that vest within 60 days of the date of this prospectus are deemed to be outstanding and beneficially owned by the person holding the options and restricted stock units for the purposes of computing the percentage ownership of that person and any group of which that person is a member. These shares, however, are not deemed outstanding for the purposes of computing the percentage ownership of any other person. Percentage of combined voting power is based on shares of Class A common stock, 64,526,654 shares of Class B common stock and 5,840,000 shares of Class B1 common stock outstanding for stockholders other than our executive officers and directors. Percentage of beneficial ownership of our executive officers and directors is based on shares of Class A common stock, 64,526,654 shares of Class B common stock and 5,840,000 shares of Class B1 common stock outstanding plus any options exercisable within 60 days and restricted stock units that vest within 60 days of the date of this prospectus by any executive officer or director included in the group for which percentage ownership has been calculated. Except as disclosed in the footnotes to this table and subject to applicable community property laws, we believe that each stockholder identified in the table possesses sole voting and investment power over all shares of common stock shown as beneficially owned by the stockholder.
188
Table of Contents
Unless otherwise indicated in the table or footnotes below, the address for each beneficial owner is c/o TerraForm Power, Inc., 12500 Baltimore Avenue, Beltsville, Maryland 20705. For further information regarding material transactions between us and certain of our stockholders, see “Certain Relationships and Related Party Transactions.”
| Class A Common Stock, Class B Common Stock, or Class B1 Common Stock(1) |
Combined Voting Power | |||||||||||||
| Shares Beneficially Owned Prior to Offering |
Shares Beneficially Owned After the Offering |
% of Combined Voting Power Prior to the Offering |
% of Combined Voting Power After the Offering | |||||||||||
| Number | % | Number | % | |||||||||||
| 5% Stockholders: |
||||||||||||||
| SunEdison(2) |
64,526,654 | |||||||||||||
| Riverstone(3) |
5,840,000 | |||||||||||||
| ACMF(4) |
1,800,000 | |||||||||||||
| Directors and Executive Officers: |
||||||||||||||
| Carlos Domenech Zornoza(5) |
1,738,860 | |||||||||||||
| Franciso “Pancho” Perez Gundin |
808,152 | |||||||||||||
| Alejandro “Alex” Hernandez |
— | |||||||||||||
| Kevin Lapidus |
341,312 | |||||||||||||
| Sebastian Deschler |
140,901 | |||||||||||||
| Ahmad Chatila |
— | |||||||||||||
| Brian Wuebbels |
5,000 | |||||||||||||
| Steven Tesoriere(6) |
1,800,000 | |||||||||||||
| Martin Truong |
7,500 | |||||||||||||
| Mark Lerdal |
10,000 | |||||||||||||
| Mark Florian |
— | |||||||||||||
| Hanif “Wally” Dahya |
— | |||||||||||||
| Sanjeev Kumar(7) |
102,519 | |||||||||||||
| Directors and executive officers as a group (13 persons) |
4,916,744 | |||||||||||||
| * | Indicates less than 1%. |
| (1) | Represents shares of Class A common stock or shares of Class B common stock and class B1 common stock that are exchangeable at any time for shares of Class A common stock on a 1:1 basis. Each share of our Class B common stock is entitled to 10 votes per share. |
| (2) | Represents shares of Class B common stock held directly by SunEdison Holdings Corporation, a wholly owned subsidiary of SunEdison. SunEdison Holdings Corporation does not own any shares of Class A common stock. However, SunEdison Holdings Corporation owns 64,526,654 Class B units of Terra LLC, which are exchangeable (together with shares of our Class B common stock) for shares of our Class A common stock at any time. As a result, SunEdison Holdings Corporation may be deemed to beneficially own the shares of Class A common stock for which such Class B units are exchangeable. If SunEdison Holdings Corporation exchanged all of its Class B units for shares of our Class A common stock, it would own no shares of Class B common stock, it would own 64,526,654 shares, or %, of our Class A common stock and it would hold % of our combined voting power. The principal place of business for these entities is 13736 Riverport Drive, Suite 1000, Maryland Heights, Missouri 63043. |
| (3) | Represents shares of Class B1 common stock received by Riverstone in connection with our acquisition of the Mt. Signal project from Silver Ridge. Riverstone does not own any shares of Class A common stock. However, Riverstone owns 5,840,000 Class B1 units of Terra LLC, which are exchangeable (together with shares of our Class B1 common stock) for shares of our Class A |
189
Table of Contents
| common stock at any time. As a result, Riverstone may be deemed to beneficially own the shares of Class A common stock for which such Class B units are exchangeable, in each case as of the completion of this offering (but assuming no exercise of the underwriters’ option to sell additional shares). The principal place of business for this entity is 4301 N. Fairfax Drive, Suite 360, Arlington, Virginia 22203 |
| (4) | Represents shares of Class A common stock purchased by ACMF in the IPO Private Placements. Altai Capital Management, L.P., or the “Altai Investment Manager,” serves as investment manager to ACMF. Altai Capital Management, LLC, or “IMGP,” serves as general partner of Altai Investment Manager. Mr. Rishi Bajaj serves as managing principal of Altai Investment Manager and member of IMGP. Mr. Toby E. Symonds serves as president and managing principal of Altai Investment Manager and member of IMGP. Mr. Steven V. Tesoriere serves as managing principal of Altai Investment Manager and member of IMGP. In such capacities, each of Altai Investment Manager, IMGP, Mr. Bajaj, Mr. Symonds and Mr. Tesoriere may be deemed to beneficially own the shares held by ACMF. Each of Altai Investment Manager, IMGP, Mr. Bajaj, Mr. Symonds and Mr. Tesoriere disclaims beneficial ownership of the securities held by ACMF except to the extent of its or his respective pecuniary interest therein. These shares are also reported for Mr. Tesoriere in the above table as he may be deemed the beneficial owner of the shares held by ACMF. The principal place of business of each of ACMF, Altai Investment Manager, IMGP, Mr. Bajaj, Mr. Symonds and Mr. Tesoriere is 152 West 57th Street, 10th Floor, New York, New York 10019. |
| (5) | Does not include shares of Class A common stock indirectly owned based on Mr. Domenech’s 38.4% limited partnership interest in Everstream Incentive LP. |
| (6) | Mr. Tesoriere serves as managing principal of Altai Investment Manager and member of IMGP. In such capacity, Mr. Tesoriere may be deemed to beneficially own the shares held by ACMF. Mr. Tesoriere disclaims beneficial ownership of the securities held by ACMF except to the extent of his pecuniary interest therein. Such shares are also reported above in the holdings of ACMF. The principal place of business of Mr. Tesoriere is 152 West 57th Street, 10th Floor, New York, New York. 10019. |
| (7) | Effective September 29, 2014, Mr. Sanjeev Kumar resigned as Chief Financial Officer of the Company. |
190
Table of Contents
CERTAIN RELATIONSHIPS AND RELATED PARTY TRANSACTIONS
The following are summaries of certain provisions of our related party agreements and are qualified in their entirety by reference to all of the provisions of such agreements. Because these descriptions are only summaries of the applicable agreements, they do not necessarily contain all of the information that you may find useful. We therefore urge you to review the agreements in their entirety. Copies of the forms of the agreements have been filed as exhibits to the registration statement of which this prospectus is a part, and are available electronically on the website of the Securities and Exchange Commission at www.sec.gov.
IPO Private Placements
On July 3, 2014, the purchasers in the IPO Private Placements entered into stock purchase agreements with us pursuant to which they purchased an aggregate of $65.0 million of our Class A common stock at a price per share equal to the IPO Price in separate private placement transactions. Mr. Steven Tesoriere, a member of our board of directors, is a managing principal of Altai Capital Management, L.P., which is the investment adviser of ACMF, the associated investment fund which purchased Class A common stock in the IPO Private Placements. In addition, Mr. Carlos Domenech Zornoza, our President and Chief Executive Officer, holds a 38.4% limited partnership interest in Everstream Incentive LP, which is associated with Everstream Opportunities, the investment fund which purchased Class A common stock in the IPO Private Placements.
In addition, the stock purchase agreements provided for registration rights pursuant to which the IPO Private Placement Purchasers will be entitled to up to two long form registrations on Form S-1 and five short-form registrations on Form S-3 (in each case, so long as the aggregate market value of the shares to be registered equals at least $20.0 million, or at least $10.0 million if the shares to be registered constitute all of the registrable securities held by such IPO Private Placement Purchasers), the right to demand a shelf registration statement be filed, and “piggyback” registration rights for shares of Class A common stock acquired pursuant to the IPO Private Placements. All such demands are subject to an initial “Holdback Period” of 180 days following our IPO, during which the IPO Private Placement Purchasers may not request that we register the shares of Class A common stock. A demand registration may take any form, including an underwritten offering and a shelf registration, provided that the investors are only entitled to two long form registrations and five short-form registrations (including takedowns from a resale shelf registration statement).
Project Support Agreement
Immediately prior to the completion of our IPO, Terra LLC entered into the Support Agreement with our Sponsor, pursuant to which our Sponsor provides Terra LLC the opportunity to acquire the Call Right Projects and a right of first offer with respect to the ROFO Projects, as described below.
Call Right Projects
Pursuant to the Support Agreement, our Sponsor provides us and our subsidiaries with the right, but not the obligation, to purchase for cash certain solar projects from its project pipeline. We refer to these projects as the Call Right Projects. The Call Right Projects consist of (i) a list of identified projects and (ii) other projects to be identified in the future that are both (a) located in the United States, Canada, the United Kingdom, Chile or any other country on which we and our Sponsor mutually agree and (b) subject to a fully executed PPA (or expected to be subject to a fully executed PPA prior to the commencement of COD for such project) with a creditworthy counterparty, as determined in our reasonable discretion. The Call Right Projects include both Priced Call Right Projects
191
Table of Contents
and Unpriced Call Right Projects. A letter agreement related to the Support Agreement between Terra LLC and our Sponsor provides that the aggregate purchase price that, when taken together with applicable project-level debt, equals $846.5 million subject to such adjustments as the parties may mutually agree for the Priced Call Right Projects. This aggregate purchase price was determined by good faith negotiations between us and our Sponsor. The price for any Unpriced Call Right Project that we determine to purchase will be the fair market value. The Support Agreement provides that we will work with our Sponsor to mutually agree on the fair market value, but if we are unable to agree, we and our Sponsor will engage a third-party advisor to determine the fair market value as described in more detail below.
The Support Agreement requires our Sponsor to add qualifying projects from its development pipeline to the Call Right Project list on a quarterly basis until we have been offered Call Right Projects that have the specified minimum amount of Projected FTM CAFD for each of the periods covered by the Support Agreement. In addition, our Sponsor will be permitted to remove a project from the list of Call Right Projects if, in its reasonable discretion, the project is unlikely to be successfully completed, effective upon notice to us. In that case, the Sponsor will be required to replace such project with one or more additional reasonably equivalent projects that have a similar economic profile.
Our Sponsor’s commitment is to offer us Call Right Projects with aggregate Projected FTM CAFD of $175.0 million by the end of 2016. The Support Agreement requires our Sponsor to offer us solar projects from the completion of our IPO through the end of 2015 that have Projected FTM CAFD of at least $75.0 million, and to offer us solar projects during 2016 that have Projected FTM CAFD of at least $100.0 million. If the amount of Projected FTM CAFD provided from the completion of our IPO through 2015 is less than $75.0 million or the amount of Projected FTM CAFD provided during 2016 is less than $100.0 million, our Sponsor has agreed that it will continue to offer sufficient Call Right Projects until the total aggregate Projected FTM CAFD commitment has been satisfied.
The Support Agreement provides that we will work with our Sponsor to mutually agree on the fair market value and Projected FTM CAFD of each Call Right Project. In the case of the Call Right Projects that are added to the list in the future, this process, with respect to the price, will occur within a reasonable time after the new Call Right Project is added to the list of identified Call Right Projects. If we are unable to agree on a price or Projected FTM CAFD for a project within 90 calendar days after it is added to the list (or with respect to Projected FTM CAFD such shorter period as will still allow Terra LLC to timely complete the relevant call right exercise process), we and our Sponsor, upon written notice from either party, will engage a third-party advisor to determine the price or Projected FTM CAFD of such project. We and our Sponsor will each pay 50% of the fees and expenses of any third-party advisor that is retained pursuant to the Support Agreement; provided that if we do not agree to purchase the project in question, we will be responsible for 100% of such fees and expenses. We have agreed to pay cash for each Call Right Project that we acquire, unless we and our Sponsor otherwise mutually agree. In the event our Sponsor receives a bona fide offer for a Call Right Project from a third party prior to the time we provide our Sponsor written notice of our exercise of our right to purchase a Call Right Project, our Sponsor must give us notice of such offer in reasonable detail and we will have the right to acquire such Call Right Project on terms substantially similar to those our Sponsor could have obtained from such third party and at a price no less than the price specified in the third-party offer. If we decline to exercise our purchase right, our Sponsor will be permitted to sell the applicable project to a third party. Notwithstanding the foregoing, after the price for a Call Right Project has been agreed or determined and until the total aggregate Projected FTM CAFD commitment has been satisfied, our Sponsor may not market, offer or sell that Call Right Project to any third party without our consent.
We will be permitted to exercise our call right with respect to any Call Right Project identified in the Support Agreement at any time during the applicable call right period for that Call Right Project, which
192
Table of Contents
generally will begin on the date of the agreement with respect to identified projects or the date a project is added to the Call Right Project list and will end 30 days prior to the project’s COD. If we exercise our option to purchase a Call Right Project under the Support Agreement, our Sponsor will be required to sell us that project on or about the date of its COD unless we otherwise agree to a different date.
ROFO Projects
The Support Agreement provides that our Sponsor will grant us a right of first offer with respect to any proposed sale or other transfer of any solar project or portfolio of projects developed by our Sponsor during the six-year period following the completion of our IPO (other than Call Right Projects) located in the United States, Canada, the United Kingdom, Chile and other jurisdictions we and our Sponsor may agree on. We refer to these projects as the ROFO Projects. Our Sponsor agrees to negotiate with us in good faith, for a period of 30 days, to reach an agreement with respect to any proposed sale of a ROFO Project for which we have exercised our right of first offer before it may sell or otherwise transfer such ROFO Project to a third party. If we and our Sponsor are unable to agree upon terms with respect to a ROFO Project, our Sponsor will have the right to sell such project to a third party on terms generally no less favorable to our Sponsor than those offered to us.
Our Sponsor will not be obligated to sell any of the ROFO Projects and, therefore, we do not know when, if ever, any ROFO Projects will be offered to, or acquired by, us. In addition, in the event that our Sponsor elects to sell ROFO Projects, our Sponsor will not be required to accept any offer we make and may choose to sell the projects to a third party (provided that the terms are no less favorable to our Sponsor than those offered to us) or not to sell the projects at all.
Corporate Governance and Conflicts Committee
For as long as our Sponsor has voting control over us, any material action taken by us under the Support Agreement, including any termination or amendment thereof, the exercise or waiver of any of our rights thereunder and the terms and conditions of any definitive agreement for the purchase and sale of a Call Right Project will require the approval of our Corporate Governance and Conflicts Committee.
Termination
We or our Sponsor will have the right to terminate the Support Agreement upon written notice if the other party materially breaches or defaults in the performance of its obligations under the Support Agreement or under any transaction agreement entered into by the parties in connection with any of the Call Right Projects or the ROFO Projects, and such breach or default is continuing for 30 days after the breaching party has been given a written notice specifying such default or breach.
Project-Level Management and Administration Agreements
While projects are under construction and after they reach COD, affiliates of our Sponsor will provide certain services to our project-level entities.
Under the EPC contracts for projects developed by our Sponsor, the relevant Sponsor affiliates provide liquidated damages to cover delays in project completions, as well as market standard warranties, including performance ratio guaranties for periods that generally range between two and five years depending on the relevant market. The O&M contracts cover preventive and corrective maintenance services for a fee as defined in such agreement. The relevant Sponsor affiliates also provide generation availability guarantees of 99% for a majority of the projects covered by such O&M agreements (on a MW basis), and related liquidated damage obligations. In certain cases, asset
193
Table of Contents
management contracts cover the provision of asset management services to the relevant project-level entity. For the year ended December 31, 2013, our Sponsor received a total of approximately $346.8 million in compensation under the related EPC contracts and $0.9 million in compensation under the related O&M contracts. See “Management’s Discussion and Analysis of Financial Condition and Results of Operations—Key Metrics—Operating Metrics—Generation Availability” for a description of “generation availability.”
Management Services Agreement
Immediately prior to the completion of our IPO, we, Terra LLC, Terra Operating LLC and our Sponsor entered into the Management Services Agreement pursuant to which our Sponsor agreed to provide or arrange for other service providers to provide management and administration services to us and our subsidiaries.
Services Rendered
Under the Management Services Agreement, our Sponsor or certain of its affiliates provides or arranges for the provision by an appropriate service provider of the following services:
| • | causing or supervising the carrying out of all day-to-day management, secretarial, accounting, banking, treasury, administrative, liaison, representative, regulatory and reporting functions and obligations; |
| • | identifying, evaluating and recommending to us acquisitions or dispositions from time-to-time and, where requested to do so, assisting in negotiating the terms of such acquisitions or dispositions; |
| • | recommending and implementing our business strategy, including potential new markets to enter; |
| • | establishing and maintaining or supervising the establishment and maintenance of books and records; |
| • | recommending and, where requested to do so, assisting in the raising of funds whether by way of debt, equity or otherwise, including the preparation, review or distribution of any prospectus or offering memorandum in respect thereof and assisting with communications support in connection therewith; |
| • | recommending to us suitable candidates to serve on the boards of directors or their equivalents of our subsidiaries; |
| • | making recommendations with respect to the exercise of any voting rights to which we are entitled in respect of our subsidiaries; |
| • | making recommendations with respect to the payment of dividends by us or any other distributions by us, including distributions to holders of our Class A common stock; |
| • | monitoring and/or oversight of the applicable accountants, legal counsel and other accounting, financial or legal advisors and technical, commercial, marketing and other independent experts, and managing litigation in which we are sued or commencing litigation after consulting with, and subject to the approval of, the relevant board of directors or its equivalent; |
| • | attending to all matters necessary for any reorganization, bankruptcy proceedings, dissolution or winding up of us, subject to approval by the relevant board of directors or its equivalent; |
| • | supervising the timely calculation and payment of taxes payable, and the filing of all tax returns; |
194
Table of Contents
| • | causing our annual consolidated financial statements and quarterly interim financial statements and, as applicable, local statutory accounts to be: (i) prepared in accordance with generally accepted accounting principles or other applicable accounting principles for review and audit at least to such extent and with such frequency as may be required by law or regulation; and (ii) submitted to the relevant board of directors or its equivalent for its prior approval; |
| • | making recommendations in relation to and effecting the entry into insurance policies covering our assets, together with other insurances against other risks, including directors and officers insurance as the relevant service provider and the relevant board of directors or its equivalent may from time to time agree; |
| • | arranging for individuals to carry out the functions of principal executive, accounting and financial officers for purposes of applicable securities laws; |
| • | providing individuals to act as senior officers as agreed from time-to-time, subject to the approval of the relevant board of directors or its equivalent; |
| • | advising us regarding the maintenance of compliance with applicable laws and other obligations; and |
| • | providing all such other services as may from time-to-time be agreed with us that are reasonably related to our day-to-day operations. |
In the event we are able to, or otherwise elect to, provide any or all of the services ourselves then our Sponsor will not provide such services. The services provided by our Sponsor are subject to the supervision of our Corporate Governance and Conflicts Committee and our Sponsor will only provide the services requested by the Corporate Governance and Conflicts Committee and will at all times comply with our conflicts of interest policy.
In addition, pursuant to the Management Services Agreement, we are required to, and to cause our subsidiaries to, use commercially reasonably efforts to have our Sponsor or an affiliate of our Sponsor act as the primary operating and maintenance and asset management counterparty for the projects in our portfolio on terms and conditions that are market standard and otherwise reasonably acceptable to our Corporate Governance and Conflicts Committee. The amounts paid by us in respect of such services will not exceed the fair market value of such services (determined as the price that would be applicable between an unrelated service provider and recipient). Notwithstanding the foregoing, (i) if, in the good-faith determination of one of our senior executive officers, it would be commercially unreasonable to engage our Sponsor to provide operating and maintenance or asset management services or (ii) with respect to projects located in markets where our Sponsor does not provide operating and maintenance or asset management services, we may engage third parties for such services.
Non-Compete
Each of TerraForm Power, Terra LLC and Terra Operating LLC have agreed that it and its affiliates will not, and will not agree to, directly or indirectly in each case without the consent of our Sponsor, engage in certain activities competitive with SunEdison’s power project development and construction business. These activities include:
| • | engaging in, providing financing for or arranging any power project development activity; |
| • | acquiring, purchasing, obtaining or investing in any equity or other ownership interest of any other person engaged in the business of developing or constructing power projects, or the “Power Development or Construction Business,” except to the extent (i) in connection with such acquisition, purchase or investment our Sponsor is permitted to acquire, purchase or |
195
Table of Contents
| invest in, as applicable, at fair market value, all or the relevant part of such Power Development or Construction Business, or (ii) TerraForm Power, Terra LLC, Terra Operating LLC and the relevant service recipient agree, prior to such acquisition, purchase or investment, to divest and transfer to an unrelated third party such Power Development or Construction Business within six months after the completion of such acquisition, purchase or investment; |
| • | except as permitted in the Management Services Agreement, engaging in any commercial activities, negotiations, planning, exploratory or strategic discussions or other similar activities that relate to, or are otherwise designed to facilitate, finance, induce or otherwise assist any person in the development or construction of any power project; |
| • | prior to the date on which (i) control over the relevant power project site has been obtained by the relevant party, including through the execution of appropriate purchase option, lease option or similar agreements; (ii) a PPA or other energy offtake agreement has been secured for such project by the relevant party; and (iii) such project has reached mechanical completion, which is prior to the project being placed into service, such date, the “Construction Completion Date,” making any payment to any person to facilitate, finance, induce or otherwise assist the construction of a power project; or |
| • | other than with respect to asset management services for power generation projects in which TerraForm Power or any of TerraForm Power’s subsidiaries or affiliates has a material ownership interest (but subject to the provisions of the Management Services Agreement regarding the assumption of O&M and asset management contracts), engaging in the business of providing operating and maintenance services or asset management services for power generation projects or assets. |
Notwithstanding anything to the contrary in the Management Services Agreement, we will be able to negotiate, structure and sign definitive legal agreements, make milestone payments and finance the acquisition of power development projects provided we do not make any payments in connection with such project before the Construction Completion Date.
If the Management Services Agreement is terminated, the non-competition provisions will continue to survive indefinitely.
In addition, until the later of the seventh anniversary of the date of the agreement or six months after the date our Sponsor ceases to beneficially own capital stock representing more than 50% of the voting power of all of the capital stock issued by us on such date, each of the parties to the Management Services Agreement agrees that it will not, and each will cause its affiliates not to, solicit or induce (or attempt to solicit or induce) any employees of another party to the Management Services Agreement to terminate his or her employment with such other party. Notwithstanding the foregoing, we may freely employ any of the dedicated personnel, and (i) general advertisements in newspapers and similar media of general circulation and (ii) use of recruiting firms that are not instructed to target a party’s employees, shall not be a violation of the solicitation or inducement provision of the preceding sentence.
Management Fee
As consideration for the services provided or arranged for by our Sponsor pursuant to the Management Services Agreement, we are required to pay our Sponsor a base management fee as follows: (i) no fee for the remainder of 2014, (ii) 2.5% of Terra LLC’s CAFD in 2015, 2016 and 2017 (not to exceed $4.0 million in 2015, $7.0 million in 2016 or $9.0 million in 2017), and (iii) an amount equal to our Sponsor’s or other service provider’s actual cost for providing services pursuant to the
196
Table of Contents
terms of the Management Services Agreement in 2018 and thereafter. We and our Sponsor may agree to adjust the management fee as a result of a change in the scope of services provided under the Management Services Agreement. In addition, in the event that TerraForm Power, Terra LLC, Terra Operating LLC or any of our subsidiaries refers a solar power development project to our Sponsor prior to our Sponsor’s independent identification of such opportunity, and our Sponsor thereafter develops such solar power project, our Sponsor will pay us an amount equal to the $40,000 per MW multiplied by the nameplate megawatt capacity of such solar project, determined as of the COD, of such solar power project (not to exceed $30.0 million in the aggregate in any calendar year), provided that, before such referral fee is paid to us in cash, it will be offset first against any due but unpaid base management fee and then against any costs and expenses incurred by our Sponsor to fund operating expenses in connection with the provision of services under the Management Services Agreement.
We may amend the scope of the services to be provided by our Sponsor under the Management Services Agreement, including reducing the number of our subsidiaries that receive services or otherwise, by providing 180 days prior written notice to our Sponsor, provided that the scope of services to be provided by our Sponsor under the Management Services Agreement cannot be increased without our Sponsor’s prior written consent. If the parties are unable to agree on a revised base management fee, we may terminate the agreement after the end of such 180-day period by providing 30 days prior written notice to our Sponsor, provided that any decision by us to terminate the Management Services Agreement in such an event must be approved by our Corporate Governance and Conflicts Committee.
Reimbursement of Expenses and Certain Taxes
We are required to pay or reimburse our Sponsor or other service provider for all sales, use, value added, withholding or other similar taxes or customs duties or other governmental charges levied or imposed by reason of the Management Services Agreement or any agreement it contemplates, other than income taxes, corporation taxes, capital gains taxes or other similar taxes payable by our Sponsor or other service provider, which are personal to our Sponsor or other service provider, or to the extent any taxes or other governmental charges relate to the provision of services by our Sponsor or other service provider pursuant to the Management Services Agreement. We are not required to reimburse our Sponsor or other service provider for any third-party out-of-pocket fees, costs and expenses incurred in the provision of the management and administration services nor are we required to reimburse our Sponsor for the salaries and other remuneration of its management, personnel or support staff who carry out any services or functions for us or overhead for such persons.
Amendment
Any amendment, supplement to or waiver of the Management Services Agreement (including any proposed change to the scope of services to be provided by our Sponsor thereunder and any related change in our Sponsor’s management fee) must be approved by our Corporate Governance and Conflicts Committee.
Termination
The Management Services Agreement does not have a fixed term. However, we are able to terminate the Management Services Agreement upon 30 days prior written notice of termination from us to our Sponsor if any of the following occurs:
| • | our Sponsor defaults in the performance or observance of any material term, condition or covenant contained in the agreement in a manner that results in material harm to us and the default continues unremedied for a period of 30 days after written notice of the breach is given to our Sponsor; |
197
Table of Contents
| • | our Sponsor engages in any act of fraud, misappropriation of funds or embezzlement against us that results in material harm to us; |
| • | our Sponsor is grossly negligent in the performance of its duties under the agreement and such negligence results in material harm to us; |
| • | certain events relating to the bankruptcy or insolvency of our Sponsor, us, Terra LLC or Terra Operating LLC; |
| • | upon the earlier to occur of (i) the fifth-year anniversary of the date of the agreement and (ii) the end of any 12-month period ending on the last day of a calendar quarter during which we generated cash available for distribution in excess of $350 million; |
| • | on such date as our Sponsor and its affiliates no longer beneficially hold more than 50% of the voting power of our capital stock; or |
| • | certain events leading to a change of control of our Sponsor. |
Except as set forth in this section and above in “—Management Fee,” we do not have a right to terminate the Management Services Agreement for any other reason. We are only able to terminate the Management Services Agreement with the approval of our Corporate Governance and Conflicts Committee.
Our Management Services Agreement expressly provides that the agreement may not be terminated by us due solely to the poor performance or the underperformance of any of our operations or any of our or our subsidiaries investments made upon the recommendation of our Sponsor or other service provider. Nothing in the Management Services Agreement limits our right to terminate project-level EPC, O&M or asset management agreements in case of under-performance.
Our Sponsor is able to terminate the Management Services Agreement upon 180 days’ prior written notice of termination to us if we default in the performance or observance of any material term, condition or covenant contained in the agreement in a manner that results in material harm and the default continues unremedied for a period of 30 days after written notice of the breach is given to us. Our Sponsor is also able terminate the Management Services Agreement upon the occurrence of certain events relating to our bankruptcy or insolvency.
Indemnification and Limitations on Liability
Under the Management Services Agreement, our Sponsor does not assume any responsibility other than to provide or arrange for the provision of the services called for thereunder in good faith and is not responsible for any action that we take in following or declining to follow the advice or recommendations of our Sponsor. The maximum amount of the aggregate liability of our Sponsor or any of its affiliates, or of any director, officer, employee, contractor, agent, advisor or other representative of our Sponsor or any of its affiliates, is equal to (i) until the end of 2016, an amount of $11 million, and (ii) thereafter, the base management fee previously paid by us in the two most recent calendar years pursuant to the Management Services Agreement. We have also agreed to indemnify each of our Sponsor and other service recipients and their respective affiliates, directors, officers, agents, members, partners, stockholders and employees to the fullest extent permitted by law from and against any claims, liabilities, losses, damages, costs or expenses (including legal fees) incurred by an indemnified person or threatened in connection with our respective businesses, investments and activities or in respect of or arising from the Management Services Agreement or the services provided by our Sponsor, except to the extent that the claims, liabilities, losses, damages, costs or expenses have resulted from the indemnified person’s bad faith, fraud, willful misconduct or gross negligence, or in the case of a criminal matter, action that the indemnified person knew to have been unlawful. In addition, under the Management Services Agreement, the indemnified persons are not liable to us to
198
Table of Contents
the fullest extent permitted by law, except for conduct that involved bad faith, fraud, willful misconduct, gross negligence or in the case of a criminal matter, action that the indemnified person knew to have been unlawful.
Repowering Services ROFR Agreement
Immediately prior to the completion of our IPO, TerraForm Power, Terra LLC and Terra Operating LLC, collectively, the “Service Recipients,” entered into a Repowering Services ROFR Agreement with our Sponsor, pursuant to which our Sponsor was granted a right of first refusal to provide certain services, including (i) repowering solar generation projects and related services provided to analyze, design and replace or improve any of the solar power generation projects through the modification of the relevant solar energy system or the installation of new solar components, but excluding any maintenance and (ii) providing such other services as may from time to time reasonably requested by the Service Recipients related to any such repowerings, collectively, the “Repowering Services.” The Service Recipients must provide written notice to our Sponsor stating their intent to engage a person to provide one or more of the Repowering Services and specify the material terms and conditions, including a fair market value fee to be paid for the Repowering Services to be provided. Upon request of the Sponsor, the Service Recipients must provide a breakdown of the fair market value fee for relevant parts of the Repowering Services and the supply of relevant components as would be standard in the relevant market. Our Sponsor has 15 business days, or the “ROFR Notice Period,” to respond to such written notice and agree to provide all or a portion of the requested Repowering Services or to supply the relevant components required for the Repowering Services.
If our Sponsor fails to respond to the notice from the Service Recipient within the ROFR Notice Period it will be deemed to have waived its rights to provide, or arrange for the provision of, the Repowering Services. The Service Recipient may then, during the 90-day period following the expiration of the ROFR Notice Period, engage another person to perform the Repowering Services on terms and conditions not more favorable than those specified in the notice provided to our Sponsor. If the Service Recipient does not engage a third party to perform the Repowering Services within such 90-day period, or if the Repowering Services are not commenced within six months from the expiration of the ROFR Notice Period, our Sponsor’s right of first refusal will be deemed to be revived and the provisions of such Repowering Services may not be offered to any third party unless first re-offered to our Sponsor.
Investment Agreement
On March 28, 2014, Terra LLC and Terra Operating LLC entered into the Investment Agreement with our Sponsor pursuant to which our Sponsor agreed to make investments in Terra LLC to be used to repay certain construction indebtedness, which we refer to as the “Construction Debt,” and/or to pay for components of solar energy systems being constructed and/or developed by our SunE Perpetual Lindsay, North Carolina Portfolio and U.S. Projects 2014 project.
Subject to the limitations discussed below, our Sponsor agreed to make cash equity investments in Terra LLC in a minimum amount necessary to repay the Construction Debt of those projects so that as of the date of the investment, the outstanding amount of Construction Debt, taking into account the aggregate amount of term project indebtedness actually incurred by the project and/or tax equity investments actually received by such project, equals zero. The obligations of our Sponsor to make an investment with respect to any project are subject to the following conditions:
| • | the Credit Agreement, dated as of February 28, 2014, by and among Sponsor, as borrower, the lenders from time to time party thereto, and Wells Fargo Bank, National Association, as administrative agent, Goldman Sachs Bank USA and Deutsche Bank Securities Inc., as joint lead arrangers and joint syndication agents, Goldman Sachs Bank USA, Deutsche Bank |
199
Table of Contents
| Securities Inc., Wells Fargo Securities, LLC and Macquarie Capital (USA) Inc., as joint bookrunners, which we refer to as the “Sponsor Credit Agreement,” shall have been amended to permit the making of such investment; |
| • | the project in question has achieved COD or the equivalent under its PPA; |
| • | the project company which owns the project shall have incurred the Construction Debt and the Construction Debt is still outstanding as of the earliest of (i) 90 days after COD or the equivalent or (ii) the date of the refinancing of such Construction Debt with permanent financing or (iii) the “date certain” or equivalent as required under such Construction Debt or tax equity investment documentation. |
The Sponsor obtained the required amendment to the Sponsor Credit Agreement on May 28, 2014.
The Sponsor further agreed to make cash investments in Terra LLC with respect to certain projects to pay for certain components of solar energy systems pursuant to EPC contracts as necessary to achieve COD, the “Component Costs” identified on a schedule to the Investment Agreement.
Notwithstanding any other provision of the Investment Agreement, under no circumstances will our Sponsor be required to contribute an aggregate amount in excess of (i) the Maximum Component Costs identified on the schedule to the Investment Agreement with respect to any individual identified project or (ii) $85.0 million in the aggregate.
Interest Payment Agreement
Immediately prior to the completion of our IPO, Terra LLC and Terra Operating LLC entered into the Interest Payment Agreement with our Sponsor and SunEdison Holdings Corporation, pursuant to which our Sponsor agreed to pay all of the scheduled interest on our Term Loan through the third anniversary of our entering into the Term Loan, up to an aggregate of $48 million over such period (plus any interest due on any payment not remitted when due). Our Sponsor will not be obligated to pay any amounts payable under the Term Loan in connection with an acceleration of the indebtedness thereunder. The Interest Payment Agreement provides that at least three business days prior to each interest payment date under the Term Loan, our Sponsor will deposit into an account of Terra Operating LLC an amount equal to the interest payment amount and Terra Operating LLC will use such funds solely to pay the interest payment amount in accordance with the terms of the Term Loan. In connection with the First Wind Acquisition, our Sponsor and SunEdison Holdings Corporation agreed pursuant to the Intercompany Agreement to amend the Interest Payment Agreement so that SunEdison will provide the same level of support under the financing agreements that will replace the Term Loan as currently provided pursuant to the Interest Payment Agreement.
Any amounts payable by our Sponsor under the Interest Payment Agreement that are not remitted when due will remain due (whether on demand or otherwise) and interest will accrue on such overdue amounts at a rate per annum equal to the interest rate then applicable under the Term Loan. In addition, Terra LLC will be entitled to set off any amounts owing by SunEdison pursuant to the Interest Payment Agreement against any and all sums owed by Terra LLC to SunEdison under the distribution provisions of the amended and restated operating agreement of Terra LLC, and Terra LLC may pay such amounts to Terra Operating LLC.
The Interest Payment Agreement may be terminated prior to the third anniversary of the date of the Term Loan credit agreement (but not earlier than the final third year interest payment), by mutual written agreement of our Sponsor and Terra Operating LLC and will, except as set forth in the Intercompany Agreement with respect to a refinancing of the Term Loan in connection with the First
200
Table of Contents
Wind Acquisition, automatically terminate upon the repayment in full of all outstanding indebtedness under the Term Loan or a change of control of us, Terra LLC or Terra Operating LLC. The agreement may also be terminated at the election of our Sponsor, Terra LLC or Terra Operating LLC if any of them experiences certain events relating to bankruptcy or insolvency. Any decision by Terra LLC or Terra Operating LLC to terminate the Interest Payment Agreement must have the prior approval of a majority of the members of our Corporate Governance and Conflicts Committee.
During the period from July 24, 2014 to September 30, 2014, we received a $1.5 million equity contribution from SunEdison pursuant to the Interest Payment Agreement.
Intercompany Agreement
On November 17, 2014, we entered into the Intercompany Agreement with SunEdison and SunEdison Holdings Corporation. The Intercompany Agreement sets forth the agreement among the parties with respect to, among other things, (i) contributions between, and allocations among, the parties and their respective affiliates of certain costs, expenses, indemnity payments and purchase price adjustments under the First Wind Acquisition Agreement and certain excess capital expenditures and operation and maintenance costs for operating projects following the closing of the First Wind Acquisition, (ii) the grant by SunEdison to us of certain additional call rights and (iii) the modification of the Interest Payment Agreement to provide that SunEdison’s interest payment obligations thereunder will apply to any replacement financing for the Term Loan up to the same maximum aggregate amount and over the same period originally specified in the Interest Payment Agreement.
Amended and Restated Operating Agreement of Terra LLC
Immediately prior to the completion of our IPO, the operating agreement of Terra LLC was amended and restated to authorize three classes of units, the Class A units, the Class B units and the Class B1 units, and to appoint us as the sole managing member of Terra LLC. The following is a description of the material terms of Terra LLC’s amended and restated operating agreement, as amended.
Governance
TerraForm Power serves as the sole managing member of Terra LLC. As such, TerraForm Power, and effectively our board of directors, controls the business and affairs of Terra LLC and are responsible for the management of its business. No other member of Terra LLC, in its capacity as such, has any authority or right to control the management of Terra LLC or to bind it in connection with any matter. Any amendment, supplement or waiver of the Terra LLC operating agreement must be approved by a majority of our independent directors.
Amendments
The operating agreement of Terra LLC may be amended, supplemented, waived or modified by our written consent, in our sole discretion without the approval of any other person, however, no amendment may (i) modify the limited liability of any member, or increase the liabilities or obligations of any member, in each case, without the consent of each such affected member or (ii) materially and adversely affect the rights of a holder of Class A units, Class B units or Class B1 units, in their capacity as holders of Class A units, Class B units or Class B1 units, in relation to other classes of equity securities of Terra LLC, without the consent of the holders of a majority of such classes of units. So long as we are the managing member, any such amendment, supplement or waiver must be approved by a majority of our independent directors (as determined in accordance with the applicable listing rules of the NASDAQ Global Select Market). Notwithstanding the foregoing, we may, without the written consent of any other member or any other person, amend, supplement, waive or modify any
201
Table of Contents
provision of Terra LLC’s operating agreement and execute, swear to, acknowledge, deliver, file and record whatever documents may be required in connection therewith, to:
| • | reflect any amendment, supplement, waiver or modification that we determine is necessary or appropriate in connection with the creation, authorization or issuance of any class of units or other equity securities in Terra LLC or other Terra LLC securities in accordance with the Terra LLC operating agreement; |
| • | reflect the admission, substitution, withdrawal or removal of members in accordance with the Terra LLC operating agreement; |
| • | reflect a change in Terra LLC’s name, the location of its principal place of business, its registered agent or its registered office; |
| • | reflect a change in Terra LLC’s fiscal or taxable year and any other changes that we determine to be necessary or appropriate as a result of a change in Terra LLC’s fiscal or taxable, including a change in the dates on which Terra LLC is to make distributions; or |
| • | cure any ambiguity, mistake, defect or inconsistency. |
Voting Rights
The Class A units, Class B units and Class B1 units do not have any voting rights.
Exchange Rights of Members; Automatic Conversion
Terra LLC has issued Class A units, which may only be issued to TerraForm Power, as the sole managing member, and Class B units, which may only be issued and held by our Sponsor or its controlled affiliates. Additionally, we have establish the Class B1 units which may be issued in connection with a reset of incentive distribution levels (see “—Distributions—IDRs—IDR Holders’ Right to Reset Incentive Distribution Levels”), or in connection with acquisitions from our Sponsor or third parties. We issued Class B1 units to Riverstone in connection with our acquisition of the Mt. Signal project.
Each Class B unit and each Class B1 unit of Terra LLC, together with a corresponding number of shares of Class B common stock or Class B1 common stock, as applicable, is exchangeable for a share of our Class A common stock, subject to equitable adjustments for stock splits, stock dividends and reclassifications in accordance with the terms of the amended and restated operating agreement of Terra LLC and any applicable exchange agreement. When a holder surrenders Class B units or Class B1 units of Terra LLC and a corresponding number of shares of Class B common stock or Class B1 common stock for shares of our Class A common stock, (i) Terra LLC will cancel the Class B units or Class B1 units as applicable, (ii) Terra LLC or will issue additional Class A units to us, (iii) we will redeem and cancel a corresponding number of shares of our Class B common stock or Class B1 common stock, as applicable, and (iv) we will issue a corresponding number of shares of Class A common stock to such holder. See “—Exchange Agreements.”
Additionally, the amended and restated operating agreement of Tierra LLC provides that no member may directly or indirectly, sell or transfer (including any transfer of the equity interests of a direct or indirect holder of units that is classified as a partnership or disregarded entity for U.S. federal income tax purposes) any units so as to cause those units to be owned, directly or indirectly, by a “disqualified person” purposes of Section 1603 of the American Recovery and Reinvestment Tax Act, but also including persons whose ownership would result in disallowance or recapture of investment tax credit. Any such transfer, if attempted, shall be void and ineffectual and shall not operate to transfer any interest or title and shall be void ab initio. Moreover, the amended and restated operating agreement of Terra LLC and the Exchange Agreements provide that if a holder of Class B1 units does
202
Table of Contents
become such a “disqualified person” generally defined to include persons who would be disqualified persons for all Class B1 units and all shares of Class B1 common stock held by such person shall be automatically converted without any action on the part of such owner.
Distributions
Subordination
General
Terra LLC’s amended and restated operating agreement provides that, during the Subordination Period (as described below), the Class A units and Class B1 units (if any) will have the right to receive quarterly distributions in an amount equal to $0.2257 per unit, which amount is defined as the “Minimum Quarterly Distribution,” plus any arrearages in the payment of the Minimum Quarterly Distribution on the Class A units and Class B1 units from prior quarters, before any distributions may be made on the Class B units. The Class B units are deemed “subordinated” because for a period of time, referred to as the Subordination Period, the Class B units will not be entitled to receive any distributions from Terra LLC until the Class A units and Class B1 units have received the Minimum Quarterly Distribution plus any arrearages in the payment of the Minimum Quarterly Distribution from prior quarters. Furthermore, no arrearages will be paid on the Class B units. The practical effect of the subordinated Class B units is to increase the likelihood that during the Subordination Period there will be sufficient CAFD to pay the Minimum Quarterly Distribution on the Class A units and Class B1 units.
The subordination of the Class B units is in addition to the Distribution Forbearance Provisions (as defined below) applicable to the Class B units described below under the caption “—Distribution Forbearance Provisions.”
Subordination Period
The “Subordination Period” means the period beginning on the closing date of our IPO and extending until each of the following tests has been met, which will be a minimum three-year period ending no earlier than the beginning of the period for which a distribution is paid for the third quarter of 2017:
| • | distributions of CAFD on each of the outstanding Class A units, Class B units and Class B1 units equaled or exceeded $0.9028 per unit (the annualized Minimum Quarterly Distribution) for each of three non-overlapping, four-quarter periods immediately preceding that date; |
| • | the CAFD generated during each of three non-overlapping, four-quarter periods immediately preceding that date equaled or exceeded the sum of $0.9028 per unit (the annualized Minimum Quarterly Distribution) on all of the outstanding Class A units, Class B units and Class B1 units during those periods on a fully diluted basis; and |
| • | there are no arrearages in payment of the Minimum Quarterly Distribution on the Class A units or Class B1 units. |
Early Termination of Subordination Period
Notwithstanding the foregoing, the Subordination Period will automatically terminate when each of the following tests has been met:
| • | distributions of CAFD on each of the outstanding Class A units, Class B units and Class B1 units equaled or exceeded $1.8056 per unit (200.0% of the annualized Minimum Quarterly Distribution) for the four-quarter period immediately preceding that date; |
203
Table of Contents
| • | the CAFD generated during the four-quarter period immediately preceding that date equaled or exceeded the sum of (i) $1.8056 per unit (200.0% of the annualized Minimum Quarterly Distribution) on all of the outstanding Class A units, Class B units and Class B1 units during such four-quarter period on a fully diluted basis, and (ii) the corresponding distributions on the IDRs during such four-quarter period; and |
| • | there are no arrearages in payment of the Minimum Quarterly Distributions on the Class A units or Class B1 units. |
Distributions During the Subordination Period
If Terra LLC makes a distribution of cash for any quarter ending before the end of the Subordination Period, its amended and restated operating agreement will require that it make the distribution in the following manner:
| • | first, to the holders of Class A units and Class B1 units, pro rata, until Terra LLC distributes for each Class A unit and Class B1 unit an amount equal to the Minimum Quarterly Distribution for that quarter and any arrearages in payment of the Minimum Quarterly Distribution on such units for any prior quarters; |
| • | second, subject to the Distribution Forbearance Provisions applicable to the Class B units, to the holders of Class B units, pro rata, until Terra LLC distributes for each Class B unit an amount equal to the Minimum Quarterly Distribution for that quarter; and |
| • | thereafter, in the manner described in “—IDRs” below. |
Distributions After the Subordination Period
When the Subordination Period ends, each outstanding Class B unit will then participate pro rata with the Class A units and Class B1 units in distributions, subject to the Distribution Forbearance Provisions applicable to the Class B units. Once the Subordination Period ends, it does not recommence under any circumstances.
If Terra LLC makes distributions of cash for any quarter ending after the expiration of the Subordination Period, its amended and restated operating agreement will require that it make the distribution in the following manner:
| • | first, to all holders of Class A units, Class B1 units and Class B units, pro rata, until Terra LLC distributes for each unit an amount equal to the Minimum Quarterly Distribution for that quarter, subject to the Distribution Forbearance Provisions applicable to the Class B units; and |
| • | thereafter, in the manner described in “—IDRs” below. |
IDRs
General
IDRs represent the right to receive increasing percentages (15.0%, 25.0% and 50.0%) of Terra LLC’s quarterly distributions after the Minimum Quarterly Distribution and the target distribution levels have been achieved. Our Sponsor holds the IDRs and will only be able to transfer the IDRs as described in the “Transferability of IDRs” section below.
Initial IDR Structure If for any quarter:
| • | Terra LLC has made cash distributions to the holders of its Class A units, Class B1 units and, subject to the Distribution Forbearance Provisions, Class B units in an amount equal to the Minimum Quarterly Distribution; and |
204
Table of Contents
| • | Terra LLC has distributed cash to holders of Class A units and holders of Class B1 units in an amount necessary to eliminate any arrearages in payment of the Minimum Quarterly Distribution; |
then Terra LLC will make additional cash distributions for that quarter among holders of its Class A units, Class B units, Class B1 units and the IDRs in the following manner:
| • | first, to all holders of Class A units, Class B1 units and, subject to the Distribution Forbearance Provisions, Class B units, pro rata, until each holder receives a total of $0.3386 per unit for that quarter (the “First Target Distribution”) (150.0% of the Minimum Quarterly Distribution); |
| • | second, 85.0% to all holders of Class A units, Class B1 units and, subject to the Distribution Forbearance Provisions, Class B units, pro rata, and 15.0% to the holders of the IDRs, until each holder of Class A units, Class B1 units and, subject to the Distribution Forbearance Provisions, Class B units receives a total of $0.3950 per unit for that quarter (the “Second Target Distribution”) (175.0% of the Minimum Quarterly Distribution); |
| • | third, 75.0% to all holders of Class A units, Class B1 units and, subject to the Distribution Forbearance Provisions, Class B units, pro rata, and 25.0% to the holders of the IDRs, until each holder of Class A units, Class B1 units and, subject to the Distribution Forbearance Provisions, Class B units receives a total of $0.4514 per unit for that quarter (the “Third Target Distribution”) (200.0% of the Minimum Quarterly Distribution); and |
| • | thereafter, 50.0% to all holders of Class A units, Class B1 units and, subject to the Distribution Forbearance Provisions, Class B units, pro rata, and 50.0% to the holders of the IDRs. |
The Terra LLC amended and restated operating agreement prohibits distributions on the IDRs unless CAFD since the closing of our IPO exceeds the amount of CAFD distributed as of the date of the determination.
The following table illustrates the percentage allocations of distributions between the holders of Class A units, Class B units, Class B1 units and the IDRs based on the specified target distribution levels. The amounts set forth under the column heading “Marginal Percentage Interest in Distributions” are the percentage interests of the holders of Class A units, Class B units, Class B1 units and the IDRs in any distributions Terra LLC makes up to and including the corresponding amount in the column “Total Quarterly Distribution Per Unit.” The percentage interests set forth below assume there are no arrearages on Class A units or Class B1 units and the Distribution Forbearance Provisions applicable to the Class B units have terminated or otherwise do not apply.
| Marginal Percentage Interest in Distributions |
||||||||||||||||
| Total Quarterly Distribution Per Unit | Unitholders | IDR Holders | ||||||||||||||
| Minimum Quarterly Distribution |
up to $ | 0.2257 | (1) | 100.0 | % | 0.0 | % | |||||||||
| First Target Distribution |
above $ | 0.2257 | up to $ | 0.3386 | (2) | 100.0 | % | 0.0 | % | |||||||
| Second Target Distribution |
above $ | 0.3386 | up to $ | 0.3950 | (3) | 85.0 | % | 15.0 | % | |||||||
| Third Target Distribution |
above $ | 0.3950 | up to $ | 0.4514 | (4) | 75.0 | % | 25.0 | % | |||||||
| Thereafter |
above $ | 0.4514 | 50.0 | % | 50.0 | % | ||||||||||
| (1) | This amount is equal to the Minimum Quarterly Distribution. |
| (2) | This amount is equal to 150.0% of the Minimum Quarterly Distribution. |
| (3) | This amount is equal to 175.0% of the Minimum Quarterly Distribution. |
| (4) | This amount is equal to 200.0% of the Minimum Quarterly Distribution. |
205
Table of Contents
IDR Holders’ Right to Reset Incentive Distribution Levels
Our Sponsor, as the holder of the IDRs, has the right after Terra LLC has made cash distributions in excess of the Third Target Distribution level (i.e., 50% to holders of units and 50% to the holder of the IDRs) for four consecutive quarters, to elect to relinquish the right to receive incentive distribution payments based on the initial target distribution levels and to reset, at higher levels, the target distribution levels upon which the incentive distribution payments would be set. See “—Post-Reset IDRs” below.
The right to reset the target distribution levels upon which the incentive distributions are based may be exercised at any time after the expiration or termination of the Subordination Period, when Terra LLC has made cash distributions in excess of the then-applicable Third Target Distribution level for the prior four consecutive fiscal quarters. At the sole discretion of the holder of the IDRs, the right to reset may be exercised without the approval of the holders of Terra LLC units, TerraForm Power, as manager of Terra LLC, or the board of directors (or any committee thereof) of TerraForm Power.
The reset target distribution levels will be higher than the most recent per unit distribution level and the target distribution levels prior to the reset such that there will be no incentive distributions paid under the reset target distribution levels until cash distributions per Class A unit, Class B unit and Class B1 unit following the reset event increase as described below. Because the reset target distribution levels will be higher than the most recent per unit distribution level prior to the reset, if Terra LLC were to issue additional units after the reset and maintain the per unit distribution level, no additional incentive distributions would be payable. By contrast, if there were no such reset and Terra LLC were to issue additional units and maintain the per unit distribution level, additional incentive distributions would have to be paid based on the additional number of outstanding units and the percentage interest of the IDRs above the target distribution levels. Thus, the exercise of the reset right would lower our cost of equity capital. Our Sponsor could exercise this reset right in order to facilitate acquisitions or internal growth projects that would otherwise not be sufficiently accretive to cash distributions per unit, taking into account the existing levels of incentive distribution payments being made.
The holders of IDRs will be entitled to cause the target distribution levels to be reset on more than one occasion. There are no restrictions on the ability to exercise their reset right multiple times, but the requirements for exercise must be met each time. Because one of the requirements is that Terra LLC make cash distributions in excess of the then-applicable Third Target Distribution for the prior two consecutive fiscal quarters, a minimum of two quarters must elapse between each reset.
In connection with the resetting of the target distribution levels and the corresponding relinquishment by our Sponsor of incentive distribution payments based on the target distribution levels prior to the reset, our Sponsor will be entitled to receive a number of newly-issued Terra LLC Class B1 units and shares of Class B1 common stock based on the formula described below that takes into account the “cash parity” value of the cash distributions related to the IDRs for the two consecutive quarters immediately prior to the reset event as compared to the cash distribution per unit in such quarters.
The number of Class B1 units and shares of Class B1 common stock to be issued in connection with a resetting of the Minimum Quarterly Distribution amount and the target distribution levels then in effect would equal the quotient determined by dividing (x) the average aggregate amount of cash distributions received in respect of the IDRs during the two consecutive fiscal quarters ended immediately prior to the date of such reset election by (y) the average of the aggregate amount of cash distributed per Class A unit, Class B1 unit and Class B unit during each of these two quarters.
206
Table of Contents
Post-Reset IDRs
Following a reset election, a baseline Minimum Quarterly Distribution amount will be calculated as an amount equal to the average cash distribution amount per Class A unit, Class B1 unit and Class B unit for the two consecutive fiscal quarters immediately preceding the reset election (which amount we refer to as the “Reset Minimum Quarterly Distribution”) and the target distribution levels will be reset to be correspondingly higher than the Reset Minimum Quarterly Distribution. Following a resetting of the Minimum Quarterly Distribution amount, such that Terra LLC would make distributions for each quarter ending after the reset date as follows:
| • | first, to all holders of Class A units, Class B1 units and, subject to the Distribution Forbearance Provisions, Class B units, pro rata, until each holder receives an amount per unit for that quarter equal to 115.0% of the Reset Minimum Quarterly Distribution; |
| • | second, 85.0% to all holders of Class A units, Class B1 units and, subject to the Distribution Forbearance Provisions, Class B units, pro rata, and 15.0% to the holders of the IDRs, until each holder of Class A units, Class B1 units and, subject to the Distribution Forbearance Provisions, Class B units receives an amount per unit for that quarter equal to 125.0% of the Reset Minimum Quarterly Distribution; |
| • | third, 75.0% to all holders of Class A units, Class B1 units and, subject to the Distribution Forbearance Provisions, Class B units, pro rata, and 25.0% to the holders of the IDRs, until each holder of Class A units, Class B1 units and, subject to the Distribution Forbearance Provisions, Class B units receives an amount per unit for that quarter equal to 150.0% of the Reset Minimum Quarterly Distribution; and |
| • | thereafter, 50.0% to all holders of Class A units, Class B1 units and, subject to the Distribution Forbearance Provisions, Class B units, pro rata, and 50.0% to the holders of the IDRs. |
Because a reset election can only occur after the Subordination Period expires, the Reset Minimum Quarterly Distribution will have no significance except as a baseline for the target distribution levels after our Sponsor effectuates an IDR reset.
The following table illustrates the percentage allocation of Terra LLC distributions between the holders of Class A units, Class B units, Class B1 units and the IDRs at various distribution levels (i) pursuant to the distribution provisions of Terra LLC’s amended and restated operating agreement, as well as (ii) following a hypothetical reset of the target distribution levels based on the assumption that the average distribution amount per common unit during the two quarters immediately preceding the reset election was $0.5000. This illustration assumes the Distribution Forbearance Provisions applicable to the Class B units have terminated or otherwise do not apply.
| Quarterly Distribution Per Class A Unit Prior to Reset |
Holders of Class A Units |
IDRs Holders | Quarterly Distribution Per Class A Unit Following Hypothetical Reset |
|||||||||||||||||||||
| Minimum Quarterly Distribution |
up to $ | 0.2257 | (1) | 100.0 | % | — | up to $ | 0.5000 | (5) | |||||||||||||||
| First Target Distribution |
above $ | 0.2257 | up to $ | 0.3386 | (2) | 100.0 | % | — | above $ | 0.5000 | up to $ | 0.5750 | (6) | |||||||||||
| Second Target Distribution |
above $ | 0.3386 | up to $ | 0.3950 | (3) | 85.0 | % | 15.0 | % | above $ | 0.5750 | up to $ | 0.6250 | (7) | ||||||||||
| Third Target Distribution |
above $ | 0.3950 | up to $ | 0.4514 | (4) | 75.0 | % | 25.0 | % | above $ | 0.6250 | up to $ | 0.7500 | (8) | ||||||||||
| Thereafter |
above $ | 0.4514 | 50.0 | % | 50.0 | % | above $ | 0.7500 | ||||||||||||||||
| (1) | This amount is equal to the Minimum Quarterly Distribution. |
| (2) | This amount is equal to 150% of the Minimum Quarterly Distribution. |
| (3) | This amount is equal to 175% of the Minimum Quarterly Distribution. |
| (4) | This amount is equal to 200% of the Minimum Quarterly Distribution. |
| (5) | This amount is equal to the hypothetical Reset Minimum Quarterly Distribution. |
| (6) | This amount is 115.0% of the hypothetical Reset Minimum Quarterly Distribution. |
| (7) | This amount is 125.0% of the hypothetical Reset Minimum Quarterly Distribution. |
| (8) | This amount is 150.0% of the hypothetical Reset Minimum Quarterly Distribution. |
207
Table of Contents
The following table illustrates the total amount of Terra LLC distributions that would be distributed to holders of Class A units, Class B units, Class B1 units and the IDRs, based on the amount distributed for the quarter immediately prior to the reset. The table assumes that immediately prior to the reset there would be Class A units outstanding, 64,526,654 Class B units outstanding and 5,840,000 Class B1 units outstanding and the average distribution to each common unit would be $0.5000 for the two quarters prior to the reset. This illustration assumes the Distribution Forbearance Provisions applicable to the Class B units have terminated or otherwise do not apply.
| Prior to Reset | ||||||||||||||||||||
| Quarterly Distribution Per Unit | Distributions to Holders of Units |
Distributions to Holders of IDRs |
Total Distributions |
|||||||||||||||||
| Minimum Quarterly Distribution |
up to $ | 0.2257 | $ | $ | $ | |||||||||||||||
| First Target Distribution |
above 0.2257 | up to $ | 0.3386 | |||||||||||||||||
| Second Target Distribution |
above 0.3386 | up to $ | 0.3950 | |||||||||||||||||
| Third Target Distribution |
above 0.3950 | up to $ | 0.4514 | |||||||||||||||||
| Thereafter |
above 0.4514 | |||||||||||||||||||
|
|
|
|
|
|
|
|||||||||||||||
| $ | $ | $ | ||||||||||||||||||
|
|
|
|
|
|
|
|||||||||||||||
The following table illustrates the total amount of Terra LLC distributions that would be distributed to holders of units and the IDRs, with respect to the quarter after the reset occurs. The table reflects that as a result of the reset there would be Class A units outstanding, 64,526,654 Class B units outstanding and Class B1 units outstanding and the average distribution to each unit would be $0.5000. The number of Class B1 units to be issued upon the reset was calculated by dividing (i) the amount received in respect of the IDRs for the quarter prior to the reset as shown in the table above, or $ by (ii) the cash distributed on each unit for the quarter prior to the reset as shown in the table above, or $ . This illustration assumes the Distribution Forbearance Provisions applicable to the Class B units have terminated or otherwise do not apply.
| After Hypothetical Reset | ||||||||||||||||||||||||
| Quarterly Distribution Per Unit |
Distributions to Holders of Units Existing Prior to Reset |
Distributions to Holders of New Class B1 Units(1) |
Distributions to Holders of IDRs |
Total Distributions |
||||||||||||||||||||
| Minimum Quarterly Distribution |
up to $ | 0.5000 | $ | $ | $ | $ | ||||||||||||||||||
| First Target Distribution |
above $ | 0.5000 | up to $ | 0.5750 | — | — | — | — | ||||||||||||||||
| Second Target Distribution |
above $ | 0.5750 | up to $ | 0.6250 | — | — | — | — | ||||||||||||||||
| Third Target Distribution |
above $ | 0.6250 | up to $ | 0.7500 | — | — | — | — | ||||||||||||||||
| Thereafter |
above $ | 0.7500 | — | — | — | — | ||||||||||||||||||
|
|
|
|
|
|
|
|
|
|||||||||||||||||
| $ | $ | $ | $ | |||||||||||||||||||||
|
|
|
|
|
|
|
|
|
|||||||||||||||||
| (1) | Represents distributions in respect of the Class B1 units issued upon the reset. |
Transferability of IDRs
Our Sponsor may not sell, transfer, exchange, pledge (other than as collateral under its credit facilities) or otherwise dispose of the IDRs to any third party (other than its controlled affiliates) until after it has satisfied its $175.0 million aggregate Projected FTM CAFD commitment to us in accordance with the Support Agreement. Our Sponsor has pledged the IDRs as collateral under its existing credit agreement, but the IDRs may not be transferred upon foreclosure until after our Sponsor has satisfied its Projected FTM CAFD commitment to us. Our Sponsor has granted us a right of first refusal with respect to any proposed sale of IDRs to a third party (other than its controlled affiliates), which we may exercise to purchase the IDRs proposed to be sold on the same terms offered to such third party at any time within 30 days after we receive written notice of the proposed sale and its terms.
208
Table of Contents
Adjustment to the Minimum Quarterly Distribution and Target Distribution Levels
If Terra LLC combines its common units into fewer common units or subdivides its common units into a greater number of common units, its amended and restated operating agreement will specify that the Minimum Quarterly Distribution and the target distribution levels will be proportionately adjusted.
For example, if a two-for-one split of the common units should occur, the Minimum Quarterly Distribution and the target distribution levels would each be reduced to 50.0% of its initial level. Terra LLC will not make any adjustment by reason of the issuance of additional units for cash or property.
In addition, if as a result of a change in law or interpretation thereof, Terra LLC or any of its subsidiaries is treated as an association taxable as a corporation or is otherwise subject to additional taxation as an entity for U.S. federal, state, local or non-U.S. income or withholding tax purposes, TerraForm Power, as manager of Terra LLC, may, in its sole discretion, reduce the Minimum Quarterly Distribution and the target distribution levels for each quarter by multiplying (i) each distribution level times (ii) the quotient obtained by dividing (a) CAFD for that quarter by (b) the sum of CAFD for that quarter, plus our estimate of our additional aggregate liability for the quarter for such income and withholding taxes payable by reason of such change in law or interpretation thereof. To the extent that the actual tax liability differs from the estimated tax liability for any quarter, the difference will be accounted for in distributions with respect to subsequent quarters.
Stock Lock-Up
Terra LLC’s amended and restated operating agreement provides that our Sponsor (together with its controlled affiliates) must continue to own a number of Class B units equal to 25% of the number of Class B units held by the Sponsor upon completion of our IPO until the earlier of: (i) three years from the completion of our IPO or (ii) the date Terra LLC has made cash distributions in excess of the Third Target Distribution (as defined above) for four quarters (which need not be consecutive). The number of shares of Class B common stock corresponding to such number of Class B units would represent a majority of the combined voting power of all shares of Class A common stock, Class B common stock and Class B1 common stock outstanding upon completion of our IPO. However, our Sponsor may pledge all of the Class B units they hold to lenders as security under credit facilities or other borrowing or debt arrangements, but no transfer upon foreclosure on such units may occur in violation of this provision. Any Class B units transferred by our Sponsor (including in connection with foreclosure on units pledged as collateral) would be exchanged (along with a corresponding number of shares of Class B common stock) into shares of our Class A common stock in connection with such transfer. See “—Issuances and Transfer of Units” and “—Exchange Agreements.”
Distribution Forbearance Provisions
During the Distribution Forbearance Period (as described below) Terra LLC’s amended and restated operating agreement limits distributions in respect of the Class B units as follows:
| • | the Class B units will not, under any circumstances, be entitled to receive any distributions with respect to the third and fourth quarter of 2014 (i.e., distributions declared on or prior to March 31, 2015); and |
| • | thereafter, when any distribution is made to the holders of Class A units and Class B1 units, holders of Class B units will be entitled to receive, on a per unit basis, an amount equal to the product of: |
| • | the per unit amount of the distribution in respect of the Class A units and Class B1 units; multiplied by |
209
Table of Contents
| • | the ratio of (i) the As Delivered CAFD (as defined below) with respect to the Contributed Construction Projects and any substitute projects contributed by our Sponsor to Terra LLC in the event any of the identified projects fails to achieve COD, or the “Completed CAFD Contribution Amount,” to (ii) a CAFD threshold of $38.84 million, or the “CAFD Forbearance Threshold,” which is the currently anticipated CAFD to be generated by the Contributed Construction Projects. |
We refer to the forgoing provisions as the “Distribution Forbearance Provisions.”
For purposes of the amended and restated operating agreement, “As Delivered CAFD” means, with respect to any of the projects described in the preceding paragraph, the CAFD projected, as of such project’s COD, to be generated by such project in the 12 months after such project’s COD taking into account, among other things, the project finance structure, the as-built system size and the production level and will be determined by mutual agreement between us and our Sponsor.
The “Distribution Forbearance Period” begins on the date of the closing of this offering and ends on the later of March 31, 2015 or the date that the Completed CAFD Contribution amount exceeds the CAFD Forbearance Threshold.
Any distributions forgone by the holders of Class B units pursuant to the Distribution Forbearance Provisions will not be distributed to holders of other classes of units and will not constitute an arrearage on the Class B units. After the date on which the Distribution Forbearance Period ends, distributions will be made to holders of Class B units in accordance with the respective number of units as described above under “—Distributions During the Subordination Period,” “—Distribution After the Subordination Period” and “—IDRs.”
Coordination of TerraForm Power and Terra LLC
At any time TerraForm Power issues shares of its Class A common stock for cash, the net proceeds therefrom will promptly be transferred to Terra LLC and Terra LLC will either:
| • | transfer newly-issued Class A units of Terra LLC to TerraForm Power; or |
| • | use such net proceeds to purchase Class B units of Terra LLC from our Sponsor, which Class B units will automatically convert into Class A units of Terra LLC when transferred to TerraForm Power. |
In the event TerraForm Power issues shares of Class A common stock that are subject to forfeiture or cancellation (e.g. restricted stock), the corresponding Class A units will be issued subject to similar forfeiture or cancellation provisions.
In the event Terra LLC purchases a Class B unit or a Class B1 unit of Terra LLC from the holder thereof, TerraForm Power will automatically redeem and cancel the corresponding share of its Class B common stock or Class B1 common stock, as applicable.
If TerraForm Power issues other classes or series of equity securities, Terra LLC will issue, and TerraForm Power will use the net proceeds from such issuance of other classes or services of equity security to purchase, an equal amount of units with designations, preferences and other rights and terms that are substantially the same as TerraForm Power’s newly-issued equity securities. If TerraForm Power elects to redeem or purchase any shares of its Class A common stock (or its equity securities of other classes or series other than shares of its Class B common stock or Class B1 common stock), Terra LLC will, immediately prior to such redemption, redeem or purchase an equal number of Class A units (or its units of the corresponding classes or series) held by TerraForm Power, upon the same terms and for the same price, as the shares of Class A common stock (or equity securities of such other classes or series) so redeemed.
210
Table of Contents
Issuances and Transfer of Units
Class A units may only be issued to TerraForm Power, as the sole managing member of Terra LLC, and are non-transferable except upon redemption by Terra LLC. Class B units may only be issued to our Sponsor and its controlled affiliates. Class B units may not be transferred, except to our Sponsor or to a controlled affiliate of our Sponsor. Our Sponsor may not transfer any Class B units to any person, including a controlled affiliate, unless our Sponsor transfers an equivalent number of shares of our Class B common stock to the same transferee. Class B1 units may not be transferred without our consent, which may be subject to such conditions as we may specify, and any such attempted transfer without our consent will be void ab initio, except our Sponsor may transfer Class B1 units to a controlled affiliate without our consent. Our holders of Class B1 units may not transfer any Class B1 units to any person, including to a controlled affiliate of our Sponsor or with our consent, unless the transferor transfers an equivalent number of shares of our Class B1 common stock to the same transferee. TerraForm Power may impose additional restrictions on exchange that it determines necessary or advisable so that Terra LLC is not treated as a “publicly traded partnership” for United States federal income tax purposes.
Exchange Agreements
We have entered into an exchange agreement pursuant to which our Sponsor (and its controlled affiliates who acquire Class B units or Class B1 units of Terra LLC), or any permitted successor holder, may from time to time cause Terra LLC to exchange its Class B units or Class B1 units, together with a corresponding number of shares of Class B common stock or Class B1 common stock, as applicable, for shares of our Class A common stock on a one-for-one basis, subject to adjustments for stock splits, stock dividends and reclassifications. The exchange agreement also provides that, subject to certain exceptions, the holder will not have the right to cause Terra LLC to exchange Class B units or Class B1 units, together with a corresponding number of shares of Class B common stock or Class B1 common stock, as applicable, if Terra LLC determines that such exchange would be prohibited by law or regulation or would violate other agreements to which TerraForm Power may be subject, and TerraForm Power may impose additional restrictions on exchange that it determines necessary or advisable so that Terra LLC is not treated as a “publicly traded partnership” for United States federal income tax purposes.
When a holder exchanges a Class B unit or Class B1 unit of Terra LLC for a share of our Class A common stock, (i) such holder will surrender such Class B unit or Class B1 unit, as applicable, and a corresponding share of our Class B common stock or Class B1 common stock, as applicable, to Terra LLC, (ii) we will issue and contribute a share of Class A common stock to Terra LLC for delivery of such share by Terra LLC to the exchanging holder, (iii) Terra LLC will issue a Class A unit to us, (iv) Terra LLC will cancel the Class B unit or Class B1 unit, as applicable, and we will cancel the corresponding share of our Class B common stock or Class B1 common stock, as applicable, and (v) Terra LLC will deliver the share of Class A common stock it receives to the exchanging holder. As result, when a holder exchanges its Class B units or Class B1 units for shares of our Class A common stock, our interest in Terra LLC will be correspondingly increased. We have reserved for issuance 73,294,277 shares of our Class A common stock, which is the aggregate number of shares of Class A common stock expected to be issued over time upon the exchange of all Class B units and Class B1 units of Terra LLC, together with a corresponding number of shares of Class B common stock or Class B1 common stock, as applicable, outstanding immediately after our IPO.
We have also entered into an exchange agreement with Riverstone on substantially similar terms as the agreement with our Sponsor, provided it will apply only with respect to the exchange of Class B1 units, together with a corresponding number of shares of Class B1 common stock.
211
Table of Contents
Indemnification and Exculpation
To the extent permitted by applicable law, Terra LLC will indemnify its managing member, our authorized officers and our other employees and agents from and against any losses, liabilities, damages, costs, expenses, fees or penalties incurred in connection with serving in such capacities, provided that the acts or omissions of these indemnified persons are not the result of fraud, willful misconduct or, in the case of a criminal matter, such indemnified person acted with knowledge that its conduct was unlawful.
Such authorized officers and other employees and agents will not be liable to Terra LLC, its members or their affiliates for damages incurred as a result of any acts or omissions of these persons, except if the acts or omissions of these exculpated persons are not the result of fraud, willful misconduct or, in the case of a criminal matter, such indemnified person acted with knowledge that its conduct was unlawful.
Allocation of Taxable Income, Gain, Loss and Deduction
Each member’s share of taxable income, gains, losses, and deductions will be determined under Terra LLC’s amended and restated operating agreement. In the event a member contributes appreciated or depreciated property to Terra LLC, the items of income, gain, loss, and deduction attributable to that property will be allocated among the members under Section 704(c) of the Code, using the remedial method (as defined in United States Treasury regulations Section 1.704-3(d)), to account for the difference between the tax basis and fair market value of such property. Terra LLC’s amended and restated operating agreement provides that the managing member cannot elect to use a method other than the remedial method to eliminate these book-tax disparities without the consent of our Corporate Governance and Conflicts Committee.
Registration Rights Agreements
We have entered into a registration rights agreement with SunEdison (the SunEdison Registration Rights Agreement) pursuant to which our Sponsor and its affiliates are entitled to an unlimited number of demand registration rights, the right to demand that a shelf registration statement be filed, and “piggyback” registration rights, for shares of our Class A common stock that are issuable upon exchange of Class B units and Class B1 units of Terra LLC that it owns. The right to sell shares of our Class A common stock pursuant to the SunEdison Registration Rights Agreement is subject to a lock-up agreement between our Sponsor and the underwriters in our IPO which, unless waived, will prevent our Sponsor from exercising this right until 180 days after the date of the IPO.
We also entered into a registration rights agreement with Riverstone pursuant to which Riverstone and its affiliates are entitled to two long-form demand registrations on Form S-1 and an unlimited number of short-form demand registration on Form S-3 (in each case, so long as the aggregate market value of the shares to be registered equals at least $100 million, or at least $50 million if the shares to be registered constitute all of the registrable securities held by Riverstone), the right to demand that a shelf registration statement be filed, and “piggyback” registration rights, for shares of our Class A common stock that are issuable upon exchange of Class B1 units of Terra LLC that it owns. The right to sell shares of our Class A common stock pursuant to this registration rights agreement is subject to a lock-up agreement between Riverstone and the underwriters in our IPO which, unless waived, will prevent Riverstone from exercising this right until 180 days after the date of the IPO.
212
Table of Contents
Procedures for Review, Approval and Ratification of Related-Person Transactions; Conflicts of Interest
Our board of directors has adopted a code of business conduct that provides that our board of directors or its authorized committee will periodically review all related-person transactions that are required to be disclosed under SEC rules and, when appropriate, initially authorize or ratify all such transactions. See “Management—Committees of the Board of Directors—Corporate Governance and Conflicts Committee.” In the event that our board of directors or its authorized committee considers ratification of a related-person transaction and determines not to so ratify, the code of business conduct provide that our management will make all reasonable efforts to cancel or annul the transaction.
The code of business conduct provides that, in determining whether to recommend the initial approval or ratification of a related-person transaction, our board of directors or its authorized committee should consider all of the relevant facts and circumstances available, including (if applicable) but not limited to: (i) whether there is an appropriate business justification for the transaction; (ii) the benefits that accrue to us as a result of the transaction; (iii) the terms available to unrelated third parties entering into similar transactions; (iv) the impact of the transaction on director independence (in the event the related person is a director, an immediate family member of a director or an entity in which a director or an immediate family member of a director is a partner, stockholder, member or executive officer); (v) the availability of other sources for comparable products or services; (vi) whether it is a single transaction or a series of ongoing, related transactions; and (vii) whether entering into the transaction would be consistent with the code of business conduct.
Our organizational and ownership structure and strategy involve a number of relationships that may give rise to conflicts of interest between us and our stockholders on the one hand, and SunEdison, on the other hand. In particular, conflicts of interest could arise, among other reasons, because:
| • | in originating and recommending acquisition opportunities (except with respect to the Call Right Projects and the ROFO Projects), our Sponsor has significant discretion to determine the suitability of opportunities for us and to allocate such opportunities to us or to itself or third parties; |
| • | there may be circumstances where our Sponsor will determine that an acquisition opportunity is not suitable for us because of the fit with our acquisition strategy or limits arising due to regulatory or tax considerations or limits on our financial capacity or because our Sponsor is entitled to pursue the acquisition on its own behalf rather than offering us the opportunity to make the acquisition; |
| • | where our Sponsor has made an acquisition, it may transfer the asset to us at a later date after such asset has been developed or we have obtained sufficient financing; |
| • | our relationship with our Sponsor involves a number of arrangements pursuant to which our Sponsor provides various services, access to financing arrangements and originates acquisition opportunities, and circumstances may arise in which these arrangements will need to be amended or new arrangements will need to be entered into; |
| • | subject to the call right described in “—Project Support Agreement—Call Right Projects” and the right of first offer described in “—Project Support Agreement—ROFO Projects,” our Sponsor is permitted to pursue other business activities and provide services to third parties that compete directly with our business and activities without providing us with an opportunity to participate, which could result in the allocation of our Sponsor’s resources, personnel and acquisition opportunities to others who compete with us; |
213
Table of Contents
| • | our Sponsor does not owe TerraForm Power or our stockholders any fiduciary duties, which may limit our recourse against it; |
| • | the liability of our Sponsor is limited under our arrangements with them, and we have agreed to indemnify our Sponsor against claims, liabilities, losses, damages, costs or expenses which they may face in connection with those arrangements, which may lead them to assume greater risks when making decisions than they otherwise would if such decisions were being made solely for their own account, or may give rise to legal claims for indemnification that are adverse to the interests of our stockholders; |
| • | our Sponsor or a SunEdison sponsored consortium may want to acquire or dispose of the same asset as us; |
| • | we may be, directly or indirectly, purchasing an asset from, or selling an asset to, our Sponsor; |
| • | there may be circumstances where we are acquiring different assets as part of the same transaction with our Sponsor; |
| • | our Sponsor will have the ability to designate a majority of the board of directors of TerraForm Power and, therefore, it will continue to control TerraForm Power and could cause TerraForm Power to cause Terra LLC to make distributions to its members, including our Sponsor, based on our Sponsor’s interests; and |
| • | other conflicting transactions involving us and our Sponsor. |
214
Table of Contents
DESCRIPTION OF CERTAIN INDEBTEDNESS
Term Loan and Revolving Credit Facility
In connection with our IPO, Terra Operating LLC entered into the Credit Facilities with Goldman Sachs Bank USA, as Administrative Agent, Goldman Sachs Bank USA, Barclays Bank PLC, Citigroup Global Markets Inc. and JPMorgan Chase Bank, N.A., as Joint Lead Arrangers, Joint Bookrunners and Co-Syndication Agents, Santander Bank, N.A., as Documentation Agent, and certain lenders. The Revolver originally provided for a $140.0 million senior secured revolving credit facility and the Term Loan originally provided for a $300.0 million senior secured term loan, which has been fully drawn.
We have obtained commitments to increase the Term Loan by $275.0 million and the Revolver by $75.0 million to increase liquidity and to fund the Capital Dynamics Acquisition, which increases are expected to close together with the Capital Dynamics Acquisition. We have also obtained separate commitments to increase the Revolver to an aggregate size of $450.0 million upon completion of the First Wind Acquisition.
Each of Terra Operating LLC’s existing and subsequently acquired or organized domestic restricted subsidiaries (excluding non-recourse subsidiaries) and Terra LLC are guarantors under the Credit Facilities.
The material terms of the Credit Facilities are summarized below.
Maturity and Amortization
The Term Loan will mature on July 23, 2019 and the Revolver will mature on July 23, 2017. The outstanding principal amount of the Term Loan is payable in equal quarterly amounts of 1.00% per annum, with the remaining balance payable on the maturity date. The Revolver does not require amortization with respect to outstanding borrowings.
Interest Rate
All outstanding amounts under the Credit Facilities bear interest at a rate per annum equal to, at Terra Operating LLC’s option, either (i) a base rate plus 2.75% or (ii) a reserve adjusted Eurodollar rate plus 3.75%. For the Term Loan, the base rate is subject to a “floor” of 2.00% and the reserve adjusted Eurodollar rate is subject to a “floor” of 1.00%.
Prepayments
The Credit Facilities provide for voluntary prepayments, in whole or in part, subject to notice periods and payment of repayment premiums with respect to the Term Loans. The Credit Facilities require Terra Operating LLC to prepay outstanding borrowings in certain circumstances, including, subject to certain exceptions:
| • | an amount equal to 100% of the net cash proceeds of the sale or other disposition of any of Terra Operating LLC’s or its restricted subsidiaries’ (other than nonrecourse subsidiaries’) property or assets; |
| • | an amount equal to 100% of the net cash proceeds of insurance paid on account of any loss of any of Terra Operating LLC’s or its restricted subsidiaries’ (other than nonrecourse subsidiaries’) property or assets; and |
| • | an amount equal to 100% of the net cash proceeds received by Terra LLC or its restricted subsidiaries from the incurrence of indebtedness not permitted by the Credit Facilities by Terra Operating LLC or its restricted subsidiaries. |
215
Table of Contents
Representations and Warranties
The Credit Facilities contain customary and appropriate representations and warranties by Terra LLC, Terra Operating LLC and certain of Terra Operating LLC’s subsidiaries, including, without limitation, representations and warranties related to: organization; requisite power and authority; qualification; equity interests and ownership; due authorization; no conflict; governmental consents; binding obligation; historical financial statements; projections; no material adverse effect; no restricted junior payments; adverse proceedings; payment of taxes; properties; environmental matters; no defaults; material contracts; governmental regulation; federal reserve regulations; Exchange Act; employee matters; employee benefit plans; certain fees; solvency; compliance with statutes; disclosure; anti-terrorism laws; anti-money laundering; embargoed persons; and energy regulatory matters.
Covenants
The Credit Facilities contain customary affirmative covenants, subject to exceptions, by Terra LLC, Terra Operating LLC and certain of Terra Operating LLC’s subsidiaries, including, without limitation, covenants related to: financial statements and other reports (including notices of default and annual budgets); existence; payment of taxes and claims; maintenance of properties; insurance; books and records; inspections; lenders meetings; compliance with laws; environmental; subsidiaries; additional material real estate assets; interest rate protection; further assurances; cash management systems; ratings; and energy regulatory status. The Credit Facilities also contain customary negative covenants, subject to exceptions, applicable to Terra LLC, Terra Operating LLC and certain of their subsidiaries, including, without limitation, covenants related to: indebtedness; liens; no further negative pledges; restricted junior payments; restrictions on subsidiary distributions; investments; fundamental changes; disposition of assets; acquisitions; sales and leasebacks; transactions with shareholders and affiliates; conduct of business; permitted activities of certain credit parties; amendments or waivers of organizational documents; and fiscal year.
The Credit Facilities contain a maximum leverage ratio and minimum debt service coverage ratio that will be tested quarterly.
Collateral
The Credit Facilities, each guarantee and any interest rate, currency hedging or hedging of RECs obligations of Terra Operating LLC or any guarantor owed to the administrative agent, any arranger or any lender under the Credit Facilities are secured by first priority security interests in (i) all of Terra Operating LLC’s and each guarantor’s assets, (ii) 100% of the capital stock of each of Terra Operating LLC and its domestic restricted subsidiaries and 65% of the capital stock of Terra Operating LLC’s foreign restricted subsidiaries and (iii) all intercompany debt. Notwithstanding the foregoing, the Credit Facilities Collateral exclude the capital stock of non-recourse subsidiaries.
Project-Level Financing Arrangements
As summarized below, we have outstanding project-specific non-recourse financing that is backed by certain of our solar energy system assets, including liens on such assets in favor of the applicable lenders. The shares or other equity interests of the project-level entities have also generally been pledged as security under such financing arrangements. These financing arrangements generally include customary covenants, including restrictive covenants that limit the ability of the project-level entities to make cash distributions to their parent companies and ultimately to us including if certain financial ratios are not met.
216
Table of Contents
Mt. Signal
In November 2012, the Mt. Signal project company issued $415.7 million of senior secured notes in a private placement and entered into a cash grant bridge loan and a $79.6 million letter of credit facility in connection with the financing of the project. The remaining project development and construction costs were funded by equity.
The senior secured notes will mature in 2038. The subordinated cash grant bridge loan was repaid in full in April 2014. The letter of credit facility will terminate in 2019. As of September 30, 2014, the outstanding balance under the senior secured notes was $413.3 million and $63.5 million of letters of credit were issued and outstanding.
The Mt. Signal project also secured a commitment by a tax equity investor to make an investment of approximately $103.0 million, subject to the satisfaction of customary closing conditions. The tax equity investor made an initial investment of approximately $9.0 million in October 2013, a second investment of $89.7 million in June 2014, and a final investment is expected to be made upon all conditions precedent being met in or around December 2014. The full amount of the tax equity investment is expected to be distributed to the original equity investors in the project and we will not retain any proceeds from the tax equity financing.
U.S. Projects 2014
On June 3, 2014, certain projects within our U.S. Projects 2014 portfolio entered into an inverted lease structure to finance approximately 45 MW of distributed generation solar energy systems that will be constructed and placed into operation through the end of 2014. The lease term is eight years and the total purchase price was $22.5 million.
U.S. Projects 2009-2013 Solar Program Loans
Nineteen of the projects in the U.S. Projects 2009-2013 portfolio that are located in New Jersey, with an aggregate nameplate capacity of approximately 3.6 MW, are financed with REC-based term loans through the Public Service Electric and Gas Company, or “PSE&G”. The loans were issued between the third quarter of 2009 and the fourth quarter of 2011, when each applicable project reached COD, and mature between 2024 and 2026. Loan payments are made by transferring the RECs generated by the projects to PSE&G and, as a result, the loans are not repaid in cash. As of September 30, 2014, the aggregate outstanding indebtedness under the loans was approximately $9.5 million. The term loans contain customary covenants related to business operations, maintenance of projects, insurance coverage and a debt service calculation requirement. As of September 30, 2014, the U.S. Projects 2009-2013 were in compliance with all covenants under the term loans.
Summit Solar Projects
Eleven of the twenty-three projects located in the U.S. were financed in part by non-recourse project-level amortizing term loans provided by four lenders. The term loans mature between August 2020 and July 2028. Pursuant to the term loan agreements, the project entities and the holding company for project entities are permitted to make distributions if the applicable debt service coverage ratios are met. As of September 30, 2014, approximately $24.2 million aggregate principal amount of the term loans was outstanding.
Seven of the twenty-three projects located in the U.S. were financed in part by a series of sale-leaseback transactions between November 2007 and December 2013.
217
Table of Contents
Enfinity
Certain of the Enfinity projects (representing 13.2 MW of the 15.7 MW total nameplate capacity of the portfolio) were financed through a series of non-recourse, sale-leaseback transactions between December 2011 and December 2013. As of September 30, 2014, the sale-leasebacks had an aggregate principal value of $30.5 million. The sale-leaseback transactions are collateralized by the related solar energy system assets.
The remaining portion of the portfolio (the 2.5 MW DHA project) was financed with a non-recourse, 20-year Qualified Energy Conservation, or “QEC,” bond. The QEC bond matures on April 20, 2032. As of September 30, 2014, the QEC bond had a principal balance of $4.9 million.
California Public Institutions Term Loan
The California Public Institutions projects are financed in part by a $17.2 million non-recourse, project-level amortizing term loan provided by National Bank of Arizona. The term loan matures in December 2023. All of the membership interests of the project-level entity that owns the projects have been pledged as security under the term loan. Pursuant to the term-loan agreement, the project entities and the holding company for project entities are permitted to make distributions if the applicable debt service coverage ratios are met. As of September 30, 2014, the outstanding indebtedness under the term loan was approximately $17.7 million.
Regulus Solar
The development and construction of the Regulus Solar project was financed with a combination of sponsor equity, a $44.4 million development loan and a $120.0 million non-recourse construction loan, all of which were outstanding as of September 30, 2014. In November 2014, these loans were repaid with the proceeds of permanent financing, which was a combination of sponsor equity, tax equity proceeds and a $135 million amortizing term loan and fixed rate note. The term loan and fixed rate note mature in 2024 and 2034, respectively. All of the membership interests of the project-level entity that owns the project have been pledged as security under the credit agreement. Pursuant to the credit agreement, the project entity is permitted to make distributions if the applicable distribution tests are satisfied. The project’s PPA security obligation and debt service reserve are being met through $23.3 million and $7.4 million non-recourse letters of credit, respectively, maturing in 2021.
North Carolina Portfolio
The development and construction of the North Carolina Portfolio will be financed with a $25 million construction loan. As of September 30, 2014, $17 million of this loan remained outstanding. We intend to refinance the construction debt prior to COD with proceeds from tax equity financings.
Atwell Island
Atwell Island’s security obligations under its PPA are met by posting a letter of credit issued under a $6.0 million non-recourse project-level letter of credit facility. The facility matures in May 2020.
Nellis
The Nellis project was financed with $55.0 million non-recourse, project-level senior notes, which are fully amortizing and mature in 2027. As of September 30, 2014, approximately $46.1 million aggregate principal amount of the senior notes was outstanding. Pursuant to the senior note agreement, the project is permitted to pay quarterly dividends if a debt service coverage ratio is met.
218
Table of Contents
SunE Perpetual Lindsay
The development and construction of the SunE Perpetual Lindsay was financed with a C$49.3 million construction loan, which is expected to be repaid prior to COD. As of September 30, 2014, SunE Perpetual Lindsay had two security letters of credit totaling C$0.75 million issued and outstanding as per the terms of its Ontario Power Authority feed-in tariff contract. Both letters of credit are fully refundable at COD.
Fairwinds and Crundale
The development and construction of Fairwinds and Crundale was financed with a cumulative £39.8 million of short-term bridge facility indebtedness. The bridge facility matures in July 2015 with the option to extend 12 months to July 2016. Pursuant to the bridge loan agreement, the project entities and holding company for the project entities are permitted to begin making distributions upon first and final repayment in July 2015. If the extension option is exercised, distributions can be made semi-annually if the applicable debt service coverage ratios are met. As of September 30, 2014, the outstanding indebtedness under the bridge facility was approximately £32.0 million. We intend to repay all outstanding indebtedness under the bridge facility in the second quarter of 2015.
Stonehenge Operating
The development and construction of the Stonehenge Operating projects was financed with three term loans totaling €27.7 million, three VAT loans totaling £6.2 million, and, three cross-currency swaps from pounds to euros for the term loan debt service. The VAT loans were repaid in full in May 2014. On September 30, 2014, all outstanding amounts due under the term facilities were repaid and all cross-currency swaps were terminated.
CAP
In August 2013, a Chilean legal entity related to our CAP project received $212.5 million in non-recourse debt financing from the Overseas Private Investment Corporation, or “OPIC,” the U.S. government’s development finance institution, and the International Financial Corporation, or “IFC,” a member of the World Bank Group, that matures in December 2032. As of September 30, 2014, the outstanding balance under the debt financing was $212.5 million. This debt is secured by the assets of our CAP project. In addition to the debt financing provided by OPIC and IFC, the project entity received a 22.8 billion Chilean peso VAT credit facility from Rabobank Chile. As of September 30, 2014, the outstanding balance under the VAT credit facility was the Chilean peso equivalent of approximately $35.4 million, and was repaid in full on November 6, 2014.
Hudson Energy
Six of the projects in the Hudson Energy portfolio that are located in New Jersey, with an aggregate nameplate capacity of 3.6 MW, are financed with tax equity and a levered tax equity structure with REC-based term loans through PSE&G. The term loans mature in 2028. As of November 4, 2014 approximately $8.5 million aggregate principal amount of the term loans was outstanding.
Twenty of the projects in the Hudson Energy portfolio, with an aggregate nameplate capacity of 7.3 MW, are financed with term loans maturing in 2019. As of November 4, 2014 approximately $12.2 million aggregate principal amount of the term loans was outstanding.
219
Table of Contents
The following is a description of the material terms of our amended and restated certificate of incorporation and our amended and restated bylaws, as each will be in effect upon completion of the offering. The following description may not contain all of the information that is important to you. To understand them fully, you should read our amended and restated certificate of incorporation and our amended and restated bylaws, forms of which have been or will be filed with the SEC as exhibits to our registration statement of which this prospectus is a part.
Authorized Capitalization
Upon completion of this offering our authorized capital stock will consist of 850,000,000 shares of Class A common stock, par value $0.01 per share, of which shares will be issued and outstanding, 140,000,000 shares of Class B common stock, par value $0.01 per share, of which 64,526,654 shares will be issued and outstanding, 260,000,000 shares of Class B1 common stock, par value $0.01 per share, of which 5,840,000 shares will be issued and outstanding, and 50,000,000 shares of preferred stock, par value $0.01 per share, none of which will be issued and outstanding. In addition, (i) an aggregate of 2,659,131 shares of our Class A common stock have been reserved for future issuance under the 2014 Incentive Plan, as described in “Executive Officer Compensation—Equity Incentive Awards—TerraForm Power, Inc. 2014 Second Amended and Restated Long-Term Incentive Plan,” and (ii) an aggregate of 70,366,654 shares of our Class A common stock have been reserved for issuance upon the exchange of Class B units and Class B1 units. Unless our board of directors determines otherwise, we will issue all shares of our capital stock in uncertificated form.
Class A Common Stock
Voting Rights
Each share of Class A common stock and Class B1 common stock entitles the holder to one vote with respect to each matter presented to our stockholders on which the holders of Class A common stock or Class B1 common stock, as applicable, are entitled to vote. Holders of shares of our Class A common stock, Class B common stock and Class B1 common stock vote together as a single class on all matters presented to our stockholders for their vote or approval, except as otherwise required by applicable law. Holders of our Class A common stock and Class B1 common stock do not have cumulative voting rights. Except in respect of matters relating to the election and removal of directors on our board of directors and as otherwise provided in our amended and restated certificate of incorporation or required by law, all matters to be voted on by holders of our Class A common stock, Class B common stock and Class B1 common stock must be approved by a majority, on a combined basis, of the votes cast by holders of such shares present in person or by proxy at the meeting and entitled to vote on the subject matter. In the case of election of directors, all matters to be voted on by our stockholders must be approved by a plurality of the votes entitled to be cast by all shares of our common stock on a combined basis.
Dividend Rights
Subject to preferences that may be applicable to any then outstanding preferred stock, the holders of our outstanding shares of Class A common stock are entitled to receive dividends, if any, as may be declared from time to time by our board of directors out of legally available funds. Dividends upon our Class A common stock may be declared by our board of directors at any regular or special meeting, and may be paid in cash, in property or in shares of capital stock. Before payment of any dividend, there may be set aside out of any of our funds available for dividends, such sums as the Board of Directors deems proper as reserves to meet contingencies, or for equalizing dividends, or for repairing or maintaining any of our property or for any proper purpose, and the Board of Directors may modify or
220
Table of Contents
abolish any such reserve. Furthermore because we are a holding company, our ability to pay dividends on our Class A common stock is limited by restrictions on the ability of our subsidiaries to pay dividends or make other distributions to us, including restrictions under the terms of the agreements governing our indebtedness. See “Description of Certain Indebtedness” and “Cash Dividend Policy.”
Liquidation Rights
In the event of any voluntary or involuntary liquidation, dissolution or winding up of our affairs, holders of our Class A common stock would be entitled to share ratably in our assets that are legally available for distribution to stockholders after payment of our debts and other liabilities and the liquidation preference of any of our outstanding shares of preferred stock, subject only to the right of the holders of shares of our Class B common stock and Class B1 common stock to receive payment for the par value of their shares in connection with our liquidation.
Other Rights
Holders of our Class A common stock have no preemptive, conversion or other rights to subscribe for additional shares. All outstanding shares are, and all shares offered by this prospectus will be, when sold, validly issued, fully paid and non-assessable. The rights, preferences and privileges of the holders of our Class A common stock are subject to, and may be adversely affected by, the rights of the holders of shares of any series of our preferred stock that we may designate and issue in the future.
Listing
Our Class A common stock is listed on the NASDAQ Global Select Market under the symbol “TERP.”
Transfer Agent and Registrar
The transfer agent and registrar for our Class A common stock is Computershare Trust Company, N.A. The transfer agent’s address is 250 Royall Street, Canton, Massachusetts 02021.
Class B Common Stock
Voting Rights
Each share of Class B common stock entitles the holder to ten votes on matters presented to our stockholders generally. Holders of shares of our Class A common stock, Class B common stock and Class B1 common stock vote together as a single class on all matters presented to our stockholders for their vote or approval, except as otherwise required by applicable law. Holders of our Class B common stock will not have cumulative voting rights. Except in respect of matters relating to the election and removal of directors on our board of directors and as otherwise provided in our amended and restated certificate of incorporation or required by law, all matters to be voted on by holders of our Class A common stock, Class B common stock and Class B1 common stock must be approved by a majority, on a combined basis, of such shares present in person or by proxy at the meeting and entitled to vote on the subject matter representing a majority, on a combined basis of votes. In the case of election of directors, all matters to be voted on by our stockholders must be approved by a plurality of the votes entitled to be cast by all shares of our common stock on a combined basis.
221
Table of Contents
Dividend and Liquidation Rights
Holders of our Class B common stock do not have any right to receive dividends other than dividends payable solely in shares of Class B common stock in the event of payment of a dividend in shares of common stock payable to holders of our Class A common stock, or to receive a distribution upon our liquidation or winding up except for their right to receive payment for the par value of their shares of Class B common stock in connection with our liquidation.
Mandatory Redemption
Shares of Class B common stock are subject to redemption at a price per share equal to par value upon the exchange of Class B units of Terra LLC for shares of our Class A common stock. Shares of Class B common stock so redeemed are automatically cancelled and are not available to be reissued. See “Certain Relationships and Related Party Transactions—Amended and Restated Operating Agreement of Terra LLC—Exchange Agreements.”
Transfer Restrictions
Shares of Class B common stock may not be transferred, except to our Sponsor or to a controlled affiliate of our Sponsor so long as an equivalent number of Class B units are transferred to the same person.
Director Designation Rights
Our amended and restated certificate of incorporation provide that our Sponsor, as the holder of our Class B common stock, will be entitled to elect up to two directors to our board of directors. See “Antitakeover Effects of Delaware Law and our Certificate of Incorporation and Bylaws—Meetings and Elections of Directors—Director Designation Rights.”
Class B1 Common Stock
Voting Rights
Each share of Class B1 common stock entitles the holder to one vote on matters presented to our stockholders generally. Holders of shares of our Class A common stock, Class B common stock and Class B1 common stock vote together as a single class on all matters presented to our stockholders for their vote or approval, except as otherwise required by applicable law. Holders of our Class B1 common stock will not have cumulative voting rights. Except in respect of matters relating to the election and removal of directors on our board of directors and as otherwise provided in our amended and restated certificate of incorporation or as required by law, all matters to be voted on by holders of our Class A common stock, Class B common stock and Class B1 common must be approved by a majority, on a combined basis, of votes by holders of such shares present in person or by proxy at the meeting and entitled to vote on the subject matter representing a majority, on a combined basis of votes. In the case of election of directors, all matters to be voted on by our stockholders must be approved by a plurality of the votes entitled to be cast by all shares of our common stock on a combined basis.
Dividend and Liquidation Rights
Holders of our Class B1 common stock do not have any right to receive dividends other than dividends payable solely in shares of Class B1 common stock in the event of payment of a dividend in shares of common stock payable to holders of our Class A common stock, or to receive a distribution upon our liquidation or winding up except for their right to receive payment for the par value of their shares of Class B1 common stock in connection with our liquidation.
222
Table of Contents
Mandatory Redemption
Shares of Class B1 common stock are subject to redemption at a price per share equal to par value upon the exchange of Class B1 units of Terra LLC for shares of our Class A common stock. Shares of Class B1 common stock so redeemed are automatically cancelled and are available to be reissued. See “Certain Relationships and Related Party Transactions—Amended and Restated Operating Agreement of Terra LLC—Exchange Agreements.”
Transfer Restrictions
Shares of Class B1 common stock may not be transferred without our consent. Additionally, shares of Class B1 common stock may only be transferred if an equivalent number of Class B1 units, which generally may not be transferred without our consent, are transferred to the same transferee. See “Certain Relationships and Related Party Transactions—Amended and Restated LLC Agreement of Terra LLC—Issuance and Transfer of Units.”
Authorized but Unissued Capital Stock
Delaware law does not require stockholder approval for any issuance of authorized shares. However, the listing requirements of the NASDAQ Global Select Market, which would apply so long as the shares of Class A common stock remain listed on the NASDAQ Global Select Market, require stockholder approval of certain issuances equal to or exceeding 20% of the then outstanding voting power or the then outstanding number of shares of Class A common stock. These additional shares may be used for a variety of corporate purposes, including future public offerings, to raise additional capital or to facilitate acquisitions.
One of the effects of the existence of unissued and unreserved common stock or preferred stock may be to enable our board of directors to issue shares to persons friendly to current management, which issuance could render more difficult or discourage an attempt to obtain control of our company by means of a merger, tender offer, proxy contest or otherwise, and thereby protect the continuity of our management and possibly deprive the stockholders of opportunities to sell their shares at prices higher than prevailing market prices.
Preferred Stock
Our amended and restated certificate of incorporation authorizes our board of directors to provide for the issuance of shares of preferred stock in one or more series and to fix the preferences, powers and relative, participating, optional or other special rights, and qualifications, limitations or restrictions thereof, including the dividend rate, conversion rights, voting rights, redemption rights and liquidation preference and to fix the number of shares to be included in any such series without any further vote or action by our stockholders. Any preferred stock so issued may rank senior to our common stock with respect to the payment of dividends or amounts upon liquidation, dissolution or winding up, or both. The issuance of preferred stock may have the effect of delaying, deferring or preventing a change in control of our company without further action by the stockholders and may adversely affect the voting and other rights of the holders of common stock. The issuance of preferred stock with voting and conversion rights may adversely affect the voting power of the holders of common stock, including the loss of voting control to others. At present, we have no plans to issue any preferred stock.
Corporate Opportunity
As permitted under the DGCL, in our amended and restated certificate of incorporation, we renounce any interest or expectancy in, or any offer of an opportunity to participate in, specified business opportunities that are presented to us or one or more of our officers, directors or stockholders. In recognition that our directors and officers may serve as (i) directors and/or officers of
223
Table of Contents
SunEdison and its affiliates or (ii) as directors, officers and/or employees of other businesses engaged in designing, developing, providing services to, managing, owning or investing in power generation facilities, or “Dual Role Persons,” our amended and restated certificate of incorporation provide for the allocation of certain corporate opportunities between us and the Dual Role Persons. Specifically, none of the Dual Role Persons will have any duty to refrain from engaging directly or indirectly in the same or similar business activities or lines of business that we do. In the event that a Dual Role Person acquires knowledge of a potential transaction or matter outside of his or her capacity as a director of TerraForm Power which may be a corporate opportunity, we will not have any expectancy in such corporate opportunity, and the Dual Role Person will not have any duty to present such corporate opportunity to us and may pursue or acquire such corporate opportunity for himself/herself or direct such opportunity to another person. A corporate opportunity that a Dual Role Person acquires knowledge of will not belong to us unless the corporate opportunity at issue is expressly offered in writing to such person solely in his or her capacity as a director or officer of ours. In addition, even if a business opportunity is presented to a Dual Role Person, the following corporate opportunities will not belong to us: (1) those we are not financially able, contractually permitted or legally able to undertake; (2) those not in our line of business; (3) those of no practical advantage to us; and (4) those in which we have no interest or reasonable expectancy. Except with respect to Dual Role Persons, the corporate opportunity doctrine applies as construed pursuant to applicable Delaware laws, without limitation.
Antitakeover Effects of Delaware Law and our Certificate of Incorporation and Bylaws
In addition to the disproportionate voting rights that SunEdison has as a result of its ownership of our Class B common stock, some provisions of Delaware law contain, and our amended and restated certificate of incorporation and our amended and restated bylaws described below contains, a number of provisions which may have the effect of encouraging persons considering unsolicited tender offers or other unilateral takeover proposals to negotiate with our board of directors rather than pursue non-negotiated takeover attempts, which we believe may result in an improvement of the terms of any such acquisition in favor of our stockholders. However, they will also give our board of directors the power to discourage acquisitions that some stockholders may favor.
Undesignated Preferred Stock
The ability to authorize undesignated preferred stock will make it possible for our board of directors to issue preferred stock with superior voting, special approval, dividend or other rights or preferences on a discriminatory basis that could impede the success of any attempt to acquire us. These and other provisions may have the effect of deferring, delaying or discouraging hostile takeovers, or changes in control or management of our company.
Meetings and Elections of Directors
Special Meetings of Stockholders. Our amended and restated certificate of incorporation provides that a special meeting of stockholders may be called only by our board of directors by a resolution adopted by the affirmative vote of a majority of the total number of directors then in office.
Stockholder Action by Written Consent. Pursuant to Section 228 of the DGCL, any action required to be taken at any annual or special meeting of our stockholders may be taken without a meeting, without prior notice and without a vote if a consent or consents in writing, setting forth the action so taken, is signed by the holders of outstanding stock having not less than the minimum number of votes that would be necessary to authorize or take such action at a meeting at which all shares of our stock entitled to vote thereon were present and voted, unless our amended and restated certificate of incorporation provides otherwise. Our amended and restated certificate of incorporation provides that
224
Table of Contents
any action required or permitted to be taken by our stockholders may be effected by written consent by such stockholders until such time as our Sponsor ceases to directly or indirectly beneficially own 50% or more of the combined voting power of our common stock. Upon our Sponsor ceasing to directly or indirectly beneficially own 50% or more of the combined voting power of our common stock, our stockholders will not be permitted to take action by written consent.
Election and Powers of Chairman; Board Meetings. Our amended and restated certificate of incorporation provides that the Chairman of our board of directors will be elected by our stockholders. Pursuant to our amended and restated bylaws, the Chairman (or his or her designee) has the right to call special meetings of our board of directors, establish the agenda for meetings of our board of directors and adjourn meetings of our board of directors. In addition, matters to be addressed or voted upon at any meeting of our board of directors shall be set forth in a notice of meeting delivered to each director in accordance with our amended and restated bylaws (unless such notice is waived) or brought before our board at such meeting by the Chairman. The provisions regarding election of our Chairman by our stockholders and our Chairman’s right to call special meetings of the board, establish the agenda and adjourn meetings of the board of directors will remain in effect until such time as our Sponsor ceases to directly or indirectly beneficially own 50% or more of the combined voting power of our common stock.
Director Designation Rights. Our amended and restated certificate of incorporation provides that our Sponsor, as the holder of our Class B common stock, is entitled to elect up to two directors to our board of directors, which directors will be in addition to any other directors, officers or other affiliates of our Sponsor who (i) may be serving as directors, (ii) are subsequently appointed by our board to fill any vacancies or (iii) are elected by our stockholders. We refer to directors elected to our board by our Sponsor pursuant to the foregoing provision as “Sponsor Designated Directors.” A director will be deemed to be a Sponsor Designated Director only if specifically identified as such in writing by our Sponsor at the time of his or her appointment to our board or at any time thereafter. Our Sponsor will have the right to remove and replace any Sponsor Designated Director at any time and for any reason, and to fill any vacancies otherwise resulting in such director positions. The provisions regarding the designation of directors by our Sponsor will terminate as of the date that our Sponsor ceases to directly or indirectly beneficially own shares representing 50% or more of the combined voting power of our common stock, unless required to be terminated earlier pursuant to applicable law or the rules of the national securities exchange on which any of our securities are listed. Any Sponsor Designated Director in office at the time of termination of the director designation provisions in our amended and restated certificate of incorporation will continue to hold office until the next annual meeting of stockholders and until his or her successor is duly elected and qualified or until his or her earlier death, resignation or removal.
Vacancies. Any vacancy occurring on our board of directors and any newly created directorship may be filled only by a majority of the directors remaining in office (even if less than a quorum), subject to the rights of holders of any series of preferred stock and the director designation rights of our Sponsor.
Amendments
Amendments of Certificate of Incorporation. The provisions described above under “—Meetings and Elections of Directors—Special Meetings of Stockholders,” “—Meetings and Elections of Directors—Elimination of Stockholder Action by Written Consent” and “—Meetings and Elections of Directors—Vacancies” may be amended only by the affirmative vote of holders of at least two-thirds of the combined voting power of outstanding shares of our capital stock entitled to vote in the election of directors, voting together as a single class.
225
Table of Contents
Amendment of Bylaws. Our board of directors will have the power to make, alter, amend, change or repeal our bylaws or adopt new bylaws by the affirmative vote of a majority of the total number of directors then in office.
Notice Provisions Relating to Stockholder Proposals and Nominees
Our amended and restated bylaws also impose some procedural requirements on stockholders who wish to make nominations in the election of directors or propose any other business to be brought before an annual or special meeting of stockholders.
Specifically, a stockholder may (i) bring a proposal before an annual meeting of stockholders, (ii) nominate a candidate for election to our board of directors at an annual meeting of stockholders, or (iii) nominate a candidate for election to our board of directors at a special meeting of stockholders that has been called for the purpose of electing directors, only if such stockholder delivers timely notice to our corporate secretary. The notice must be in writing and must include certain information and comply with the delivery requirements as set forth in the bylaws.
To be timely, a stockholder’s notice must be received at our principal executive offices:
| • | in the case of a nomination or other business in connection with an annual meeting of stockholders, not later than the close of business on the 90th day nor earlier than the close of business on the 120th day prior to the first anniversary of the previous year’s annual meeting of stockholders; provided, however, that if the date of the annual meeting is advanced more than 30 days before or delayed more than 70 days after the first anniversary of the preceding year’s annual meeting, notice by the stockholder must be delivered not earlier than the close of business on the 120th day prior to such annual meeting and not later than the close of business on the later of the 90th day prior to such annual meeting or the 10th day following the day on which public announcement of the date of such meeting is first made by us; |
| • | in the case of a nomination in connection with a special meeting of stockholders, not earlier than the 120th day prior to such special meeting and not later than the close of business on the later of the 90th day before such special meeting or the 10th day following the day on which public announcement of the date of such meeting is first made by us. |
With respect to special meetings of stockholders, our amended and restated bylaws provide that only such business shall be conducted as shall have been stated in the notice of the meeting.
Delaware Antitakeover Law
We have opted out of Section 203 of the DGCL. However, our amended and restated certificate of incorporation provides that in the event our Sponsor and its affiliates cease to beneficially own at least 5% of the total voting power of all the then outstanding shares of our capital stock, we will automatically become subject to Section 203 of the DGCL. Section 203 provides that, subject to certain exceptions specified in the law, a Delaware corporation shall not engage in certain “business combinations” with any “interested stockholder” for a three-year period following the time that the stockholder became an interested stockholder unless:
| • | prior to such time, our board of directors approved either the business combination or the transaction that resulted in the stockholder becoming an interested stockholder; |
| • | upon consummation of the transaction that resulted in the stockholder becoming an interested stockholder, the interested stockholder owned at least 85% of the voting stock outstanding at the time the transaction commenced, excluding certain shares; or |
226
Table of Contents
| • | at or subsequent to that time, the business combination is approved by our board of directors and by the affirmative vote of holders of at least 66 2⁄3% of the outstanding voting stock that is not owned by the interested stockholder. |
Generally, a “business combination” includes a merger, asset or stock sale or other transaction resulting in a financial benefit to the interested stockholder. Subject to certain exceptions, an “interested stockholder” is a person who, together with that person’s affiliates and associates, owns, or within the previous three years did own, 15% or more of our voting stock.
Under certain circumstances, Section 203 makes it more difficult for a person who would be an “interested stockholder” to effect various business combinations with a corporation for a three-year period. The provisions of Section 203 may encourage companies interested in acquiring us to negotiate in advance with our board of directors because the stockholder approval requirement would be avoided if our board of directors approves either the business combination or the transaction that results in the stockholder becoming an interested stockholder. These provisions also may make it more difficult to accomplish transactions that stockholders may otherwise deem to be in their best interests.
Removal of Directors
Our amended and restated certificate of incorporation provides that, if any director (other than a Sponsor Designated Director) who, at the time of his or her most recent election or appointment to a term on our board of directors was an employee of our company or our Sponsor or any of our or its subsidiaries, ceases to be employed by us or our Sponsor or any of our or its subsidiaries during such term as director, such director shall no longer be qualified to be a director and shall immediately cease to be a director without any further action unless otherwise determined by our board of directors. In addition, our amended and restated certificate of incorporation provides, in accordance with the DGCL and subject to our Sponsor’s director designation rights and any special voting rights of any series of preferred stock that we may issue in the future, that stockholders may remove directors, with or without cause, by a majority vote.
Amendments
Any amendments to our amended and restated certificate of incorporation, subject to the rights of holders of our preferred stock, regarding the provisions thereof summarized under “—Corporate Opportunity” or “—Antitakeover Effects of Delaware Law and our Certificate of Incorporation and Bylaws” will require the affirmative vote of at least 66 2/3% of the voting power of all shares of our common stock then outstanding.
227
Table of Contents
SHARES ELIGIBLE FOR FUTURE SALE
Future sales of substantial amounts of our Class A common stock in the public market, or the perception that such sales may occur, could adversely affect the prevailing market price of our Class A common stock. No prediction can be made as to the effect, if any, future sales of shares, or the availability of shares for future sales, will have on the market price of our Class A common stock prevailing from time to time. The number of shares available for future sale in the public market is subject to legal and contractual restrictions, some of which are described below. The expiration of these restrictions will permit sales of substantial amounts of our Class A common stock in the public market, or could create the perception that these sales may occur, which could adversely affect the prevailing market price of our Class A common stock. These factors could also make it more difficult for us to raise funds through future offerings of our Class A common stock.
Sale of Restricted Shares
Future sales of our Class A common stock in the public market, or the availability of such shares for sale in the public market, could adversely affect market prices prevailing from time to time. As described below, only a limited number of shares, along with the shares sold in this offering, will be available for sale shortly after this offering due to contractual and legal restrictions on resale. Nevertheless, sales of a substantial number of shares of our Class A common stock in the public market after such restrictions lapse, or the perception that those sales may occur, could adversely affect the prevailing market price at such time and our ability to raise equity-related capital at a time and price we deem appropriate.
Upon the completion of this offering, we will have issued and outstanding an aggregate of shares of Class A common stock (or shares of Class A common stock if the underwriters exercise in full their option to purchase additional shares of Class A common stock). Our Sponsor and Riverstone may exchange Class B units or Class B1 units, as applicable, of Terra LLC, together with a corresponding number of shares of Class B common stock or Class B1 common stock, as applicable, for shares of our Class A common stock on a one-for-one basis, subject to adjustments for stock splits, stock dividends and reclassifications. Our Sponsor holds 64,526,654 Class B units of Terra LLC and Riverstone holds 5,840,000 Class B1 units of Terra LLC, all of which are exchangeable, if exchanged together with a corresponding number of shares of Class B common stock or Class B1 common stock, as applicable, for shares of our Class A common stock. See “Certain Relationships and Related Party Transactions—Amended and Restated Operating Agreement of Terra LLC—Exchange Agreements.” The shares of Class A common stock we issue upon such exchanges would be “restricted securities” as defined in Rule 144 described below. However, upon the completion of our IPO, we entered into a registration rights agreement with our Sponsor that requires us to register under the Securities Act shares of our Class A common stock issued in such an exchange. See “—Registration Rights.” In connection with the First Wind Acquisition, our Sponsor is expected to issue $340.0 million of seller notes that, pursuant to their terms, may be exchanged for shares of our Class A common stock that are issued in exchange for Class B units and Class B common stock currently held by our Sponsor. The seller notes do not become exchangeable for Class A Common Stock until one year after the issuance date.
Rule 144
The shares of our Class A common stock being sold in this offering will generally be freely tradable without restriction or further registration under the Securities Act, except that any shares of our Class A common stock held by an “affiliate” of ours may not be resold publicly except in compliance with the registration requirements of the Securities Act or under an exemption under Rule 144 or otherwise. Rule 144 permits our Class A common stock that has been acquired by a person who is an
228
Table of Contents
affiliate of ours, or has been an affiliate of ours within the past three months, to be sold into the market in an amount that does not exceed, during any three-month period, the greater of:
| • | 1% of the total number of shares of our Class A common stock outstanding which will equal approximately shares after this offering; or |
| • | the average weekly reported trading volume of our Class A common stock on the NASDAQ Global Select Market for the four calendar weeks prior to the sale. |
Such sales are also subject to specific manner-of-sale provisions, a six-month holding period requirement for restricted securities, notice requirements and the availability of current public information about us.
Rule 144 also provides that a person who is not deemed to have been an affiliate of ours at any time during the three months preceding a sale, and who has for at least six months beneficially owned shares of our Class A common stock that are restricted securities, will be entitled to freely sell such shares of our Class A common stock subject only to the availability of current public information about us. A person who is not deemed to have been an affiliate of ours at any time during the three months preceding a sale, and who has for at least one year beneficially owned shares of our Class A common stock that are restricted securities, will be entitled to freely sell such shares of Class A common stock under Rule 144 without regard to the public information requirements of Rule 144.
Lock-Up Agreements
We and each of our officers and directors and our Sponsor have agreed with the underwriters, subject to certain exceptions, not to dispose of or hedge any of the shares of our Class A common stock or securities (including Terra LLC units) convertible into or exchangeable for, or that represent the right to receive, shares of our Class A common stock during the period from the date of this prospectus continuing through the date that is 90 days after the date of this prospectus, except in connection with this offering or with the prior written consent of Barclays Capital Inc. and Goldman, Sachs & Co. as representatives of the underwriters in this offering. See “Underwriting”.
The restrictions in the immediately preceding paragraph do not apply to:
| • | our entry into any agreement providing for the issuance of shares of our Class A common stock or securities convertible into or exchangeable for shares of our Class A common stock to any seller (or its affiliates) in connection with our acquisition of energy projects (or equity interests therein), or the issuance of any such securities to the seller (or its affiliates) pursuant to any such agreement, in an aggregate number of shares not to exceed 15% of the total number of shares of our Class A common stock issued and outstanding following the completion of this offering (including any additional shares if the underwriters exercise their 30-day option to purchase additional shares), so long as any recipient of such securities is subject to the same lock-up restrictions described above; conversions of Riverstone’s Class B1 common stock and Class B1 units into Class A common stock, and sales of the Class A common stock received upon conversion, but only to the extent of the taxable income or gain (if any) realized by Riverstone during the lock-up period in connection with the Mt. Signal transaction; |
| • | Riverstone’s disposal of Class B1 common stock and Class B1 units, but only to the extent Riverstone is required by law, regulation or government order to dispose of such securities, or where the failure to dispose of such securities would result in Riverstone or its affiliates (i) being required to hold separate, divest or refrain from acquiring, investing in or otherwise dealing in any property, assets, facility, business, or equity, or being required to commit on |
229
Table of Contents
| behalf of itself or any of its affiliates to any conduct or remedy, or the entry into, amendment, modification or termination of any contract or agreement with a third party or (ii) having to defend against any lawsuit, action or proceeding; |
| • | our Sponsor’s pledge of our or Terra LLC’s equity securities as collateral under the Sponsor Credit Agreement, or the transferring of such pledged shares or other securities in the event the lenders under the Sponsor Credit Agreement exercise their right to foreclose on such pledged securities, so long as any recipient of such securities is subject to the same lock-up restrictions described above; and |
| • | certain other transfers, including, but not limited to, transfers of shares of our Class A common stock or securities convertible into or exchangeable for shares of our Class A common stock (i) acquired in open market transactions after the completion of this offering, (ii) pursuant to a bona fide third party tender offer, merger, consolidation or other similar transaction, (iii) pursuant to our equity incentive or employee benefit plans and (iv) in certain other transactions not involving a disposition for value. |
In addition, if the lock-up restrictions applicable to SunEdison Holdings Corporation are waived with respect to a number of the shares of Class B common stock or other securities it holds, then Riverstone will receive a waiver with respect to the same number of shares.
Registration Rights
Our Sponsor, Riverstone, the purchasers in the IPO Private Placements and the Acquisition Private Placement and certain of their respective affiliates are entitled to various rights with respect to the registration of shares under the Securities Act. We have filed a registration statement relating to the resale of the shares of our Class A common stock issued in the Acquisition Private Placement and such shares will be freely tradable without restriction by the Acquisition Private Placement Purchasers prior to the completion of this offering. Registration of these shares under the Securities Act would result in these shares becoming fully tradable under the Securities Act, except for shares held by affiliates and subject to the lock-up agreements referred to above. See “Certain Relationships and Related Party Transactions—Registration Rights Agreements” and “—IPO Private Placement” and See “Summary—Recent Developments—Acquisition Private Placement.”
230
Table of Contents
UNITED STATES FEDERAL INCOME TAX CONSEQUENCES TO NON-U.S. HOLDERS
The following is a general summary of United States federal income and estate tax consequences to non-U.S. holders, as defined below, of the purchase, ownership and disposition of shares of our Class A common stock as of the date of this prospectus. This summary deals only with shares of common stock purchased in this offering that are held as capital assets (generally, property held for investment) by a non-U.S. holder.
For purposes of this discussion, a “non-U.S. holder” means a beneficial owner of shares of our Class A common stock that is, for United States federal income tax purposes, an individual, corporation, estate or trust, but is not any of the following:
| • | an individual who is a citizen or resident of the United States; |
| • | a corporation (or any other entity treated as a corporation for United States federal income tax purposes) created or organized under the laws of the United States, any state thereof or the District of Columbia; |
| • | an estate the income of which is subject to United States federal income taxation regardless of its source; or |
| • | a trust if it (1) is subject to the primary supervision of a court within the United States and one or more United States persons have the authority to control all substantial decisions of the trust or (2) has a valid election in effect under applicable United States Treasury regulations to be treated as a United States person for United States federal income tax purposes. |
If any entity or arrangement treated as a partnership for United States federal income tax purposes holds shares of our Class A common stock, the tax treatment of a partner in such partnership generally will depend upon the status of the partner and the activities of the partner and the partnership. If you are a partner of a partnership considering an investment in shares of our Class A common stock, you should consult your own tax advisors.
This summary is based upon the Code, applicable United States Treasury regulations, rulings and other administrative pronouncements, and judicial decisions, all as of the date of this prospectus. Those authorities are subject to different interpretations and may be changed, perhaps retroactively, so as to result in United States federal income tax consequences different from those summarized below. We cannot assure you that a change in law will not alter significantly the tax considerations described in this summary.
This summary does not address all aspects of United States federal income and estate taxes and does not deal with foreign, state, local, alternative minimum or other tax considerations that may be relevant to non-U.S. holders in light of their particular circumstances. In addition, this summary does not represent a detailed description of the United States federal income and estate tax consequences applicable to you if you are subject to special treatment under the United States federal income tax laws (including if you are a United States expatriate, financial institution, insurance company, tax-exempt organization, dealer in securities, broker, “controlled foreign corporation,” “passive foreign investment company,” a partnership or other pass-through entity for United States federal income tax purposes (or an investor in such a pass-through entity), a person who acquired shares of our Class A common stock as compensation or otherwise in connection with the performance of services, or a person who has acquired shares of our Class A common stock as part of a straddle, hedge, conversion transaction or other integrated investment).
We have not sought and will not seek any rulings from the United States Internal Revenue Service, or the IRS, regarding the matters discussed below. There can be no assurance that the IRS will not take positions concerning the tax consequences of the ownership or disposition of shares of our Class A common stock that differ from those discussed below.
231
Table of Contents
If you are considering the purchase of shares of our Class A common stock, you should consult your own tax advisors concerning the particular United States federal income and estate tax consequences to you of the ownership and disposition of shares of our Class A common stock, as well as the consequences to you arising under other United States federal tax laws and the laws of any other applicable taxing jurisdiction and any applicable tax treaty in light of your particular circumstances.
Distributions
We intend to pay cash distributions on shares of our Class A common stock for the foreseeable future, as outlined above under “Cash Dividend Policy.” Subject to the discussion below on backup withholding and FATCA withholding, in general, distributions of cash or other property in respect of shares of our Class A common stock will constitute dividends for United States federal income tax purposes to the extent paid from our current or accumulated earnings and profits, as determined under United States federal income tax principles. To the extent any such distributions exceed both our current and accumulated earnings and profits, they will first be treated as a return of capital reducing your tax basis in our Class A common stock (determined on a share-byshare basis), but not below zero, and then will be treated as gain from the sale of stock as described below under “Gain on Disposition of Shares of Class A Common Stock.”
Dividends paid to a non-U.S. holder generally will be subject to a United States federal withholding tax at a 30% rate, or such lower rate as may be specified by an applicable income tax treaty. United States federal withholding tax may be imposed on the gross amount of a distribution, due to the difficulty of determining whether we have sufficient earnings and profits to cause the distribution to be a dividend for United States federal income tax purposes.
However, dividends that are effectively connected with the conduct of a trade or business within the United States by a non-U.S. holder generally will not be subject to such withholding tax, provided certain certification and disclosure requirements are satisfied (including the provision of a properly completed IRS Form W-8 ECI or other applicable form). Instead, unless an applicable income tax treaty provides otherwise, such dividends will generally be subject to United States federal income tax on a net income basis in the same manner as if the non-U.S. holder were a United States person as defined under the Code. A corporate non-U.S. holder may be subject to an additional “branch profits tax” at a rate of 30% on its earnings and profits (subject to adjustments) that are effectively connected with its conduct of a United States trade or business (unless an applicable income tax treaty provides otherwise).
A non-U.S. holder of shares of our Class A common stock who wishes to claim the benefit of an applicable treaty rate for dividends will be required (i) to complete IRS Form W-8BEN (or other applicable form) and certify under penalty of perjury that such holder is not a United States person as defined under the Code and is eligible for treaty benefits or (ii) if shares of our Class A common stock are held through certain foreign intermediaries, satisfy the relevant certification requirements of applicable United States Treasury regulations. A non-U.S. holder who provides us, our paying agent or other applicable withholding agent with an IRS Form W-8BEN, Form W-8ECI or other form must update the form or submit a new form, as applicable, if there is a change in circumstances that makes any information on such form incorrect. Special certification and other requirements apply to certain non-U.S. holders that are pass-through entities rather than corporations or individuals.
It is possible that a distribution made to a non-U.S. holder may be subject to over-withholding because, for example, at the time of the distribution we or the relevant withholding agent may not be able to determine how much of the distribution constitutes dividends or the proper documentation establishing the benefits of any applicable treaty has not been properly supplied. If there is any over-withholding on distributions made to a non-U.S. holder, such non-U.S. holder may obtain a refund of
232
Table of Contents
the over-withheld amount by timely filing an appropriate claim for refund with the IRS. Non-U.S. holders should consult their tax advisors regarding the applicable withholding tax rules and the possibility of obtaining a refund of any over-withheld amounts.
Gain on Disposition of Shares of Class A Common Stock
Subject to the discussion below on backup withholding and FATCA withholding, any gain realized by a non-U.S. holder on the sale, exchange or other disposition of shares of our Class A common stock generally will not be subject to United States federal income tax unless:
| • | the gain is effectively connected with a trade or business of the non-U.S. holder in the United States (and, if required by an applicable income tax treaty, is attributable to a United States permanent establishment); |
| • | the non-U.S. holder is an individual who is present in the United States for 183 days or more in the taxable year of that disposition, and certain other conditions are met; or |
| • | we are or have been a United States Real Property Holding Corporation, or “USRPHC,” for United States federal income tax purposes at any time during the shorter of the five-year period ending on the date of the disposition or the period that the non-U.S. holder held shares of our Class A common stock, or “the applicable period.” |
In the case of a non-U.S. holder described in the first bullet point above, any gain generally will be subject to United States federal income tax on a net income basis in the same manner as if the non-U.S. holder were a United States person as defined under the Code (unless an applicable income tax treaty provides otherwise), and a non-U.S. holder that is a foreign corporation may also be subject to the branch profits tax at a rate of 30% on its effectively connected earnings and profits (subject to adjustments), unless an applicable income tax treaty provides otherwise. Except as otherwise provided by an applicable income tax treaty, an individual non-U.S. holder described in the second bullet point above will be subject to a flat 30% tax on any gain derived from the disposition, which may be offset by certain United States source capital losses.
We believe we are not currently and will not become a USRPHC. However, because the determination of whether we are a USRPHC depends on the fair market value of our United States real property relative to the fair market value of our other business assets, and because the definition of United States real property is not entirely clear, there can be no assurance that we are not a USRPHC now or will not become one in the future. Even if we are or become a USRPHC, however, so long as our Class A common stock is regularly traded on an established securities market a non-U.S. holder will be subject to United States federal income tax on any gain in respect of our Class A common stock only if such non-U.S. holder actually or constructively owned more than 5% of our outstanding common stock at any time during the applicable period. You should consult your own tax advisor about the consequences that could result if we are, or become, a USRPHC.
Information Reporting and Backup Withholding
We must report annually to the IRS and to you the amount of dividends paid to you and the amount of tax, if any, withheld with respect to such dividends. The IRS may make this information available to the tax authorities in the country in which you are resident.
In addition, you may be subject to information reporting requirements and backup withholding with respect to dividends paid on, and the proceeds of disposition of, shares of our Class A common stock, unless, generally, you certify under penalties of perjury (usually on IRS Form W-8BEN) that you are not a United States person or you otherwise establish an exemption. Additional rules relating to information
233
Table of Contents
reporting requirements and backup withholding with respect to payments of the proceeds from the disposition of shares of our Class A common stock are as follows:
| • | If the proceeds are paid to or through the United States office of a broker, the proceeds generally will be subject to backup withholding and information reporting, unless you certify under penalties of perjury (usually on IRS Form W-8BEN) that you are not a United States person or you otherwise establish an exemption. |
| • | If the proceeds are paid to or through a non-U.S. office of a broker that is not a United States person and is not a foreign person with certain specified United States connections, a “U.S.-related person,” information reporting and backup withholding generally will not apply. |
| • | If the proceeds are paid to or through a non-U.S. office of a broker that is a United States person or a U.S.-related person, the proceeds generally will be subject to information reporting (but not to backup withholding), unless you certify under penalties of perjury (usually on IRS Form W-8BEN) that you are not a United States person or you otherwise establish an exemption. |
Backup withholding is not an additional tax. Any amounts withheld under the backup withholding rules may be allowed as a refund or a credit against your United States federal income tax liability, provided the required information is timely furnished by you to the IRS.
Legislation Affecting Taxation of Common Stock Held by or through Foreign Entities
Legislation enacted in 2010, known as the Foreign Account Tax Compliance Act, or “FATCA,” generally imposes a withholding tax of 30% on dividend income from our Class A common stock and on the gross proceeds of a sale or other disposition of our Class A common stock, if the payments are made to certain foreign entities, unless certain diligence, reporting, withholding and certification obligations and requirements are met.
Payments subject to withholding under FATCA include dividends and, after December 31, 2016, payments of gross proceeds. The withholding under FATCA described above generally applies to payments of dividends or gross proceeds made to (i) a “foreign financial institution” (as a beneficial owner or an intermediary), unless such institution enters into an agreement with the United States government to collect and provide to the United States tax authorities substantial information regarding United States account holders of such institution (which would include certain equity and debt holders of such institution, as well as certain account holders that are foreign entities with United States owners) and (ii) a foreign entity acting as a beneficial owner or an intermediary that is not a “foreign financial institution,” unless such entity makes a certification identifying its substantial United States owners (as defined for this purpose) or makes a certification that such foreign entity does not have any substantial United States owners. Foreign financial institutions located in jurisdictions that have an intergovernmental agreement with the United States governing FATCA may be subject to different rules. Under certain circumstances, a non-U.S. holder of our Class A common stock might be eligible for refunds or credits of such withholding taxes, and a non-U.S. holder might be required to file a United States federal income tax return to claim such refunds or credits.
Non-U.S. holders should consult their own tax advisors regarding the implications of this legislation on their investment in our Class A common stock.
United States Federal Estate Tax
Shares of our Class A common stock that are owned (or deemed to be owned) at the time of death by an individual who is not a citizen or resident of the United States (as specifically defined for
234
Table of Contents
United States federal estate tax purposes) will be includable in such non-U.S. holder’s gross estate for United States federal estate tax purposes, unless an applicable estate tax treaty provides otherwise, and therefore may be subject to United States federal estate tax.
POTENTIAL PURCHASERS OF OUR CLASS A COMMON STOCK ARE URGED TO CONSULT THEIR OWN TAX ADVISORS TO DETERMINE THE UNITED STATES FEDERAL, STATE, LOCAL AND NON-U.S. INCOME, ESTATE AND OTHER TAX AND TAX TREATY CONSIDERATIONS OF PURCHASING, OWNING AND DISPOSING OF OUR CLASS A COMMON STOCK.
235
Table of Contents
We and the underwriters named below have entered into an underwriting agreement with respect to the shares being offered. Subject to certain conditions, each underwriter has severally agreed to purchase the number of shares indicated in the following table. Barclays Capital Inc., and Goldman, Sachs & Co. are the representatives of the underwriters.
| Underwriters |
Number of Shares | |
| Barclays Capital Inc. |
||
| Goldman, Sachs & Co. |
||
| Morgan Stanley & Co. LLC |
||
| Merrill Lynch, Pierce, Fenner & Smith |
||
| Citigroup Global Markets Inc. |
||
| Macquarie Capital (USA) Inc. |
||
| Total |
||
|
|
The underwriters are committed to take and pay for all of the shares being offered, if any are taken, other than the shares covered by the option described below unless and until this option is exercised.
The underwriters have an option to buy up to an additional shares from us. They may exercise that option for 30 days. If any shares are purchased pursuant to this option, the underwriters will severally purchase shares in approximately the same proportion as set forth in the table above.
The following table shows the per share and total underwriting discounts and commissions to be paid to the underwriters by us. Such amounts are shown assuming both no exercise and full exercise of the underwriters’ option to purchase additional shares of our Class A common stock.
| No Exercise | Full Exercise | |||||||
| Per share |
$ | $ | ||||||
| Total |
$ | $ | ||||||
Shares sold by the underwriters to the public will initially be offered at the price to the public set forth on the cover of this prospectus. Any shares sold by the underwriters to securities dealers may be sold at a discount of up to $ per share from the price to the public. After the initial offering of the shares, the representatives may change the offering price and the other selling terms. The offering of the shares by the underwriters is subject to receipt and acceptance and subject to the underwriters’ right to reject any order in whole or in part.
We and each of our officers and directors and our Sponsor have agreed with the underwriters, subject to certain exceptions, not to dispose of or hedge any of their common stock or securities convertible into or exchangeable for shares of common stock during the period from the date of this prospectus continuing through the date 90 days after the date of this prospectus, except with the prior written consent of the representatives.
The restrictions in the immediately preceding paragraph do not apply to:
| • | our entry into any agreement providing for the issuance of shares of our Class A common stock or securities convertible into or exchangeable for shares of our Class A common stock to any seller (or its affiliates) in connection with our acquisition of energy projects (or equity interests therein), or the issuance of any such securities to the seller (or its affiliates) pursuant to any such agreement, in an aggregate number of shares not to exceed 15% of the total |
236
Table of Contents
| number of shares of our Class A common stock issued and outstanding following the completion of this offering (including any additional shares if the underwriters exercise their 30-day option to purchase additional shares), so long as any recipient of such securities is subject to the same lock-up restrictions described above; |
| • | conversions of Riverstone’s Class B1 common stock and Class B1 units into Class A common stock, and sales of the Class A common stock received upon conversion, but only to the extent of the taxable income or gain (if any) realized by Riverstone during the lock-up period in connection with the Mt. Signal transaction; |
| • | Riverstone’s disposal of Class B1 common stock and Class B1 units, but only to the extent Riverstone is required by law, regulation or government order to dispose of such securities, or where the failure to dispose of such securities would result in Riverstone or its affiliates (i) being required to hold separate, divest or refrain from acquiring, investing in or otherwise dealing in any property, assets, facility, business, or equity, or being required to commit on behalf of itself or any of its affiliates to any conduct or remedy, or the entry into, amendment, modification or termination of any contract or agreement with a third party or (ii) having to defend against any lawsuit, action or proceeding; |
| • | our Sponsor’s pledge of our or Terra LLC’s equity securities as collateral under the Sponsor Credit Agreement, or the transferring of such pledged shares or other securities in the event the lenders under the Sponsor Credit Agreement exercise their right to foreclose on such pledged securities, so long as any recipient of such securities is subject to the same lock-up restrictions described above; and |
| • | certain other transfers, including, but not limited to, transfers of shares of our Class A common stock or securities convertible into or exchangeable for shares of our Class A common stock (i) acquired in open market transactions after the completion of this offering, (ii) pursuant to a bona fide third party tender offer, merger, consolidation or other similar transaction, (iii) pursuant to our equity incentive or employee benefit plans and (iv) in certain other transactions not involving a disposition for value. |
In addition, if the lock-up restrictions applicable to SunEdison Holdings Corporation are waived with respect to a number of the shares of Class B common stock or other securities it holds, then Riverstone will receive a waiver with respect to the same number of shares.
Barclays Capital Inc. and Goldman, Sachs & Co., in their sole discretion, may release the common stock and other securities subject to the lock-up agreements described above in whole or in part at any time.
In connection with the offering, the underwriters may purchase and sell shares of common stock in the open market. These transactions may include short sales, stabilizing transactions and purchases to cover positions created by short sales. Short sales involve the sale by the underwriters of a greater number of shares than they are required to purchase in the offering, and a short position represents the amount of such sales that have not been covered by subsequent purchases. A “covered short position” is a short position that is not greater than the amount of additional shares for which the underwriters’ option described above may be exercised. The underwriters may cover any covered short position by either exercising their option to purchase additional shares or purchasing shares in the open market. In determining the source of shares to cover the covered short position, the underwriters will consider, among other things, the price of shares available for purchase in the open market as compared to the price at which they may purchase additional shares pursuant to the option described above. “Naked” short sales are any short sales that create a short position greater than the amount of additional shares for which the option described above may be exercised. The underwriters must cover any such naked short position by purchasing shares in the open market. A naked short
237
Table of Contents
position is more likely to be created if the underwriters are concerned that there may be downward pressure on the price of the common stock in the open market after pricing that could adversely affect investors who purchase in the offering. Stabilizing transactions consist of various bids for or purchases of common stock made by the underwriters in the open market prior to the completion of the offering.
The underwriters may also impose a penalty bid. This occurs when a particular underwriter repays to the underwriters a portion of the underwriting discount received by it because the representatives have repurchased shares sold by or for the account of such underwriter in stabilizing or short covering transactions.
Purchases to cover a short position and stabilizing transactions, as well as other purchases by the underwriters for their own accounts, may have the effect of preventing or retarding a decline in the market price of the our stock, and together with the imposition of the penalty bid, may stabilize, maintain or otherwise affect the market price of the common stock. As a result, the price of the common stock may be higher than the price that otherwise might exist in the open market. The underwriters are not required to engage in these activities and may end any of these activities at any time. These transactions may be effected on a securities exchange, in the over-the-counter market or otherwise.
The underwriters do not expect sales to discretionary accounts to exceed five percent of the total number of shares offered.
We estimate that our share of the total expenses of the offering, excluding underwriting discounts and commissions, will be approximately $ million.
We have agreed to indemnify the several underwriters against certain liabilities, including liabilities under the Securities Act.
The underwriters and their respective affiliates are full service financial institutions engaged in various activities, which may include sales and trading, commercial and investment banking, advisory, investment management, investment research, principal investment, hedging, market making, brokerage and other financial and non-financial activities and services.
In the ordinary course of their various business activities, the underwriters and their respective affiliates, officers, directors and employees may purchase, sell or hold a broad array of investments and actively trade securities, derivatives, loans, commodities, currencies, credit default swaps and other financial instruments for their own account and for the accounts of their customers, and such investment and trading activities may involve or relate to our assets, securities and/or instruments (directly, as collateral securing other obligations or otherwise) and/or the assets, securities and/or instruments of persons and entities with relationships with us. The underwriters and their respective affiliates may also communicate independent investment recommendations, market color or trading ideas and/or publish or express independent research views in respect of such assets, securities or instruments and may at any time hold, or recommend to clients that they should acquire, long and/or short positions in such assets, securities and instruments.
Certain of the underwriters or their respective affiliates are agents, arrangers, bookrunners or lenders under Terra Operating LLC’s Credit Facilities. In addition, the underwriters or their respective affiliates are parties to the bridge financing commitments entered into in connection with the First Wind Acquisition. Under the terms of the bridge financing commitments, the aggregate principal amount of the commitments will be reduced by the gross proceeds of this offering. The underwriters and/or their affiliates have received customary compensation and expenses for these commercial and investment banking transactions.
238
Table of Contents
Notice to Prospective Investors in Australia
No prospectus or other disclosure document (as defined in the Corporations Act 2001 (Cth) of Australia (‘‘Corporations Act’’)) in relation to the common stock has been or will be lodged with the Australian Securities & Investments Commission (‘‘ASIC’’). This document has not been lodged with ASIC and is only directed to certain categories of exempt persons. Accordingly, if you receive this document in Australia:
(a) you confirm and warrant that you are either:
(i) a ‘‘sophisticated investor’’ under section 708(8)(a) or (b) of the Corporations Act;
(ii) a ‘‘sophisticated investor’’ under section 708(8)(c) or (d) of the Corporations Act and that you have provided an accountant’s certificate to us which complies with the requirements of section 708(8)(c)(i) or (ii) of the Corporations Act and related regulations before the offer has been made;
(iii) a person associated with the company under section 708(12) of the Corporations Act; or
(iv) a ‘‘professional investor’’ within the meaning of section 708(11)(a) or (b) of the Corporations Act, and to the extent that you are unable to confirm or warrant that you are an exempt sophisticated investor, associated person or professional investor under the Corporations Act any offer made to you under this document is void and incapable of acceptance; and
(b) you warrant and agree that you will not offer any of the common stock for resale in Australia within 12 months of that common stock being issued unless any such resale offer is exempt from the requirement to issue a disclosure document under section 708 of the Corporations Act.
Notice to Prospective Investors in the Dubai International Financial Centre
This prospectus supplement relates to an Exempt Offer in accordance with the Offered Securities Rules of the Dubai Financial Services Authority, or “DFSA”. This prospectus supplement is intended for distribution only to persons of a type specified in the Offered Securities Rules of the DFSA. It must not be delivered to, or relied on by, any other person. The DFSA has no responsibility for reviewing or verifying any documents in connection with Exempt Offers. The DFSA has not approved this prospectus supplement nor taken steps to verify the information set forth herein and has no responsibility for the prospectus supplement. The shares to which this prospectus supplement relates may be illiquid and/or subject to restrictions on their resale. Prospective purchasers of the shares offered should conduct their own due diligence on the shares. If you do not understand the contents of this prospectus supplement you should consult an authorized financial advisor.
Notice to Prospective Investors in the European Economic Area
In relation to each Member State of the European Economic Area which has implemented the Prospectus Directive (each, a Relevant Member State), each underwriter has represented and agreed that with effect from and including the date on which the Prospectus Directive is implemented in that Relevant Member State (the Relevant Implementation Date) it has not made and will not make an offer of shares to the public in that Relevant Member State prior to the publication of a prospectus in relation to the shares which has been approved by the competent authority in that Relevant Member State or, where appropriate, approved in another Relevant Member State and notified to the competent authority in that Relevant Member State, all in accordance with the Prospectus Directive, except that it may, with effect from and including the Relevant Implementation Date, make an offer of shares to the public in that Relevant Member State at any time:
to legal entities which are authorized or regulated to operate in the financial markets or, if not so authorized or regulated, whose corporate purpose is solely to invest in securities;
to any legal entity which has two or more of (1) an average of at least 250 employees during the last financial year; (2) a total balance sheet of more than €43,000,000 and (3) an annual net turnover of more than €50,000,000, as shown in its last annual or consolidated accounts;
239
Table of Contents
to fewer than 100 natural or legal persons (other than qualified investors as defined in the Prospectus Directive) subject to obtaining the prior consent of the representatives for any such offer; or
in any other circumstances which do not require the publication by us of a prospectus pursuant to Article 3 of the Prospectus Directive.
For the purposes of this provision, the expression an “offer of shares to the public” in relation to any shares in any Relevant Member State means the communication in any form and by any means of sufficient information on the terms of the offer and the shares to be offered so as to enable an investor to decide to purchase or subscribe the shares, as the same may be varied in that Relevant Member State by any measure implementing the Prospectus Directive in that Relevant Member State and the expression Prospectus Directive means Directive 2003/71/EC and includes any relevant implementing measure in each Relevant Member State.
Notice to Prospective Investors in the United Kingdom
Each underwriter has represented and agreed that:
it has only communicated or caused to be communicated and will only communicate or cause to be communicated an invitation or inducement to engage in investment activity (within the meaning of Section 21 of the FSMA) received by it in connection with the issue or sale of the shares in circumstances in which Section 21(1) of the FSMA does not apply to us; and
it has complied and will comply with all applicable provisions of the FSMA with respect to anything done by it in relation to the shares in, from or otherwise involving the United Kingdom.
Notice to Prospective Investors in Hong Kong
The shares may not be offered or sold by means of any document other than (i) in circumstances which do not constitute an offer to the public within the meaning of the Companies Ordinance (Cap.32, Laws of Hong Kong), or (ii) to “professional investors” within the meaning of the Securities and Futures Ordinance (Cap.571, Laws of Hong Kong) and any rules made thereunder, or (iii) in other circumstances which do not result in the document being a “prospectus” within the meaning of the Companies Ordinance (Cap.32, Laws of Hong Kong), and no advertisement, invitation or document relating to the shares may be issued or may be in the possession of any person for the purpose of issue (in each case whether in Hong Kong or elsewhere), which is directed at, or the contents of which are likely to be accessed or read by, the public in Hong Kong (except if permitted to do so under the laws of Hong Kong) other than with respect to shares which are or are intended to be disposed of only to persons outside Hong Kong or only to “professional investors” within the meaning of the Securities and Futures Ordinance (Cap. 571, Laws of Hong Kong) and any rules made thereunder.
Notice to Prospective Investors in Singapore
This prospectus has not been registered as a prospectus with the Monetary Authority of Singapore. Accordingly, this prospectus and any other document or material in connection with the offer or sale, or invitation for subscription or purchase, of the shares may not be circulated or distributed, nor may the shares be offered or sold, or be made the subject of an invitation for subscription or purchase, whether directly or indirectly, to persons in Singapore other than (i) to an institutional investor under Section 274 of the Securities and Futures Act, Chapter 289 of Singapore, or the “SFA,” (ii) to a relevant person, or any person pursuant to Section 275(1A), and in accordance with the conditions, specified in Section 275 of the SFA or (iii) otherwise pursuant to, and in accordance with the conditions of, any other applicable provision of the SFA.
240
Table of Contents
Where the shares are subscribed or purchased under Section 275 by a relevant person which is: (a) a corporation (which is not an accredited investor) the sole business of which is to hold investments and the entire share capital of which is owned by one or more individuals, each of whom is an accredited investor; or (b) a trust (where the trustee is not an accredited investor) whose sole purpose is to hold investments and each beneficiary is an accredited investor, shares, debentures and units of shares and debentures of that corporation or the beneficiaries’ rights and interest in that trust shall not be transferable for 6 months after that corporation or that trust has acquired the shares under Section 275 except: (1) to an institutional investor under Section 274 of the SFA or to a relevant person, or any person pursuant to Section 275(1A), and in accordance with the conditions, specified in Section 275 of the SFA; (2) where no consideration is given for the transfer; or (3) by operation of law.
Notice to Prospective Investors in Switzerland
The shares may not be publicly offered in Switzerland and will not be listed on the SIX Swiss Exchange, or “SIX,” or on any other stock exchange or regulated trading facility in Switzerland. This document has been prepared without regard to the disclosure standards for issuance prospectuses under art. 652a or art. 1156 of the Swiss Code of Obligations or the disclosure standards for listing prospectuses under art. 27 ff. of the SIX Listing Rules or the listing rules of any other stock exchange or regulated trading facility in Switzerland. Neither this document nor any other offering or marketing material relating to the shares or the offering may be publicly distributed or otherwise made publicly available in Switzerland.
Neither this document nor any other offering or marketing material relating to the offering, the Company, the shares have been or will be filed with or approved by any Swiss regulatory authority. In particular, this document will not be filed with, and the offer of shares will not be supervised by, the Swiss Financial Market Supervisory Authority FINMA, or “FINMA,” and the offer of shares has not been and will not be authorized under the Swiss Federal Act on Collective Investment Schemes, or “CISA”. The investor protection afforded to acquirers of interests in collective investment schemes under the CISA does not extend to acquirers of shares.
Notice to Prospective Investors in Japan
The securities have not been and will not be registered under the Financial Instruments and Exchange Law of Japan (the Financial Instruments and Exchange Law) and each underwriter has agreed that it will not offer or sell any securities, directly or indirectly, in Japan or to, or for the benefit of, any resident of Japan (which term as used herein means any person resident in Japan, including any corporation or other entity organized under the laws of Japan), or to others for re-offering or resale, directly or indirectly, in Japan or to a resident of Japan, except pursuant to an exemption from the registration requirements of, and otherwise in compliance with, the Financial Instruments and Exchange Law and any other applicable laws, regulations and ministerial guidelines of Japan.
Notice to Prospective Investors in Chile
The shares are not registered in the Securities Registry (Registro de Valores) or subject to the control of the Chilean Securities and Exchange Commission (Superintendencia de Valores y Seguros de Chile). This prospectus and other offering materials relating to the offer of the shares do not constitute a public offer of, or an invitation to subscribe for or purchase, the shares in the Republic of Chile, other than to individually identified purchasers pursuant to a private offering within the meaning of Article 4 of the Chilean Securities Market Act (Ley de Mercado de Valores) (an offer that is not “addressed to the public at large or to a certain sector or specific group of the public”).
241
Table of Contents
LEGAL MATTERS
The validity of the Class A common stock offered hereby will be passed upon for us by Skadden, Arps, Slate, Meagher & Flom LLP, New York, New York. The underwriters have been represented by Latham & Watkins LLP, New York, New York.
EXPERTS
The balance sheet of SunEdison Yieldco, Inc. (renamed TerraForm Power, Inc.) as of January 15, 2014, and the combined consolidated financial statements of TerraForm Power (a solar energy generation asset business of SunEdison, Inc.) as of December 31, 2013 and 2012, and for each of the years in the two-year period ended December 31, 2013, have been included in the registration statement in reliance upon the reports of KPMG LLP, independent registered public accounting firm, appearing elsewhere herein, and upon the authority of said firm as experts in accounting and auditing.
The consolidated financial statements of MMA NAFB Power, LLC and Subsidary, as of December 31, 2013 and 2012, and for each of the years in the two-year period ended December 31, 2013, have been included in the registration statement in reliance upon the report of CohnReznick LLP, an independent public accounting firm, appearing elsewhere herein, and given on the authority of said firm as experts in accounting and auditing.
The financial statements of CalRENEW-1 LLC as of December 31, 2013 and for the year ended December 31, 2013, have been included in the registration statement in reliance upon the report of Moss Adams LLP, an independent public accounting firm, given on the authority of said firm as experts in accounting and auditing.
The financial statements of SPS Atwell Island, LLC, as of December 31, 2013 and 2012 and for each of the years in the two-year period ended December 31, 2013, have been included in the registration statement in reliance upon the report of Moss Adams LLP, an independent public accounting firm, given on the authority of said firm as experts in accounting and auditing.
The combined carve-out financial statements of Summit Solar, as of December 31, 2013 and 2012 and for each of the years in the two-year period ended December 31, 2013, have been included in the registration statement in reliance upon the report of CohnReznick LLP, an independent public accounting firm, given on the authority of said firm as experts in accounting and auditing.
The combined financial statements of Stonehenge Operating Group, as of and for the year ended December 31, 2013, have been included in the registration statement in reliance upon the report of KPMG LLP in the United Kingdom, an independent auditor, appearing elsewhere herein, and upon the authority of said firm as experts in accounting and auditing.
The consolidated financial statements of Imperial Valley Solar 1 Holdings II, LLC and Subsidiaries, as of December 31, 2013 and 2012, and for the year ended December 31, 2013 and the period from September 24, 2012 (Date of Inception) to December 31, 2012 appearing in this Prospectus and Registration Statement have been audited by Ernst & Young LLP, independent auditors, as set forth in their report thereon appearing elsewhere herein, and are included in reliance upon such report given on the authority of such firm as experts in accounting and auditing.
The combined financial statements of First Wind Operating Entities, as of December 31, 2013 and 2012 and for each of the years in the two-year period ended December 31, 2013, appearing in this Prospectus and Registration Statement have been audited by Ernst & Young LLP, independent auditors, as set forth in their report thereon appearing elsewhere herein, and are included in reliance upon such report given on the authority of such firm as experts in accounting and auditing.
242
Table of Contents
WHERE YOU CAN FIND MORE INFORMATION
We have filed with the SEC a registration statement on Form S-1 under the Securities Act that registers the shares of our Class A common stock to be sold in this offering. The registration statement, including the attached exhibits, contains additional relevant information about us and our Class A common stock. The rules and regulations of the SEC allow us to omit from this document certain information included in the registration statement.
You may read and copy the reports and other information we file with the SEC at the SEC’s Public Reference Room at 100 F Street, N.E., Room 1580, Washington, D.C. 20549. You may also obtain copies of this information by mail from the public reference section of the SEC, 100 F Street, N.E., Washington, D.C. 20549, at prescribed rates. You may obtain information regarding the operation of the public reference room by calling 1-800-SEC-0330. The SEC also maintains a website that contains reports, proxy statements and other information about issuers, like us, who file electronically with the SEC. The address of that website is http://www.sec.gov. This reference to the SEC’s website is an inactive textual reference only and is not a hyperlink.
We are subject to the reporting, proxy and information requirements of the Exchange Act, and as a result are required to file periodic reports, proxy statements and other information with the SEC. These periodic reports, proxy statements and other information are available for inspection and copying at the SEC’s public reference room and the website of the SEC referred to above, as well as on our website, www.terraform.com. This reference to our website is an inactive textual reference only and is not a hyperlink. The contents of our website are not part of this prospectus, and you should not consider the contents of our website in making an investment decision with respect to our Class A common stock.
243
Table of Contents
Index to Financial Statements
F-1
Table of Contents
F-2
Table of Contents
F-3
Table of Contents
TERRAFORM POWER, INC. AND SUBSIDIARIES
UNAUDITED CONDENSED CONSOLIDATED STATEMENTS OF OPERATIONS
(In thousands, except per share data)
| Nine Months Ended September 30, |
||||||||
| 2014 | 2013 | |||||||
| Operating revenues: |
||||||||
| Energy |
$ | 59,692 | $ | 6,884 | ||||
| Incentives |
22,832 | 5,409 | ||||||
| Incentives—affiliate |
774 | 746 | ||||||
|
|
|
|
|
|||||
| Total operating revenues |
83,298 | 13,039 | ||||||
| Operating costs and expenses: |
||||||||
| Cost of operations |
6,051 | 780 | ||||||
| Cost of operations—affiliate |
3,911 | 478 | ||||||
| General and administrative |
3,767 | 92 | ||||||
| General and administrative—affiliate |
8,783 | 3,568 | ||||||
| Acquisitions costs |
2,537 | — | ||||||
| Acquisition costs—affiliate |
2,826 | — | ||||||
| Formation and offering related fees and expenses |
3,399 | — | ||||||
| Depreciation and accretion |
21,053 | 3,542 | ||||||
|
|
|
|
|
|||||
| Total operating costs and expenses |
52,327 | 8,460 | ||||||
|
|
|
|
|
|||||
| Operating income |
30,971 | 4,579 | ||||||
| Other expense (income): |
||||||||
| Interest expense, net |
53,217 | 4,716 | ||||||
| Gain on extinguishment of debt, net |
(7,635 | ) | — | |||||
| Loss on foreign currency exchange |
6,914 | — | ||||||
| Other, net |
582 | (1 | ) | |||||
|
|
|
|
|
|||||
| Total other expenses, net |
53,078 | 4,715 | ||||||
|
|
|
|
|
|||||
| Loss before income tax benefit |
(22,107 | ) | (136 | ) | ||||
| Income tax benefit |
(4,069 | ) | (60 | ) | ||||
|
|
|
|
|
|||||
| Net loss |
$ | (18,038 | ) | $ | (76 | ) | ||
|
|
|
|
|
|||||
| Less: Predecessor loss prior to initial public offering on July 23, 2014 |
(10,357 | ) | ||||||
|
|
|
|||||||
| Net loss subsequent to initial public offering |
(7,681 | ) | ||||||
| Less: Net loss attributable to non-controlling interest |
(3,667 | ) | ||||||
|
|
|
|||||||
| Net loss attributable to TerraForm Power, Inc. Class A common stockholders |
$ | (4,014 | ) | |||||
|
|
|
|||||||
| Weighted-average number of shares: |
||||||||
| Class A common stock—Basic and Diluted |
27,066 | |||||||
| Loss per share: |
||||||||
| Class A common stock—Basic and Diluted |
$ | (0.15 | ) | |||||
|
|
|
|||||||
See accompanying notes to unaudited condensed consolidated financial statements.
F-4
Table of Contents
TERRAFORM POWER, INC. AND SUBSIDIARIES
UNAUDITED CONDENSED CONSOLIDATED STATEMENTS OF COMPREHENSIVE INCOME (LOSS)
(In thousands)
| Nine Months Ended September 30, |
||||||||
| 2014 | 2013 | |||||||
| Net loss |
$ | (18,038 | ) | $ | (76 | ) | ||
| Other comprehensive loss, net of tax: |
||||||||
| Translation adjustment |
(2,724 | ) | — | |||||
| Unrealized loss on hedging instruments |
(351 | ) | — | |||||
|
|
|
|
|
|||||
| Other comprehensive loss, net of tax |
(3,075 | ) | — | |||||
|
|
|
|
|
|||||
| Total comprehensive loss |
(21,113 | ) | (76 | ) | ||||
| Less: Predecessor comprehensive loss prior to initial public offering on July 23, 2014 |
(10,357 | ) | (76 | ) | ||||
|
|
|
|
|
|||||
| Comprehensive loss subsequent to initial public offering |
(10,756 | ) | $ | — | ||||
|
|
|
|
|
|||||
| Less: comprehensive loss attributable to non-controlling interests: |
||||||||
| Net loss |
(3,667 | ) | ||||||
| Translation adjustment |
(1,898 | ) | ||||||
| Unrealized loss on hedging instruments |
(244 | ) | ||||||
|
|
|
|||||||
| Comprehensive loss attributable to noncontrolling interests |
(5,809 | ) | ||||||
|
|
|
|||||||
| Comprehensive loss attributable to TerraForm Power, Inc. Class A stockholders |
$ | (4,947 | ) | |||||
|
|
|
|||||||
See accompanying notes to unaudited condensed consolidated financial statements.
F-5
Table of Contents
TERRAFORM POWER, INC. AND SUBSIDIARIES
UNAUDITED CONDENSED CONSOLIDATED BALANCE SHEETS
(In thousands, except per share data)
| September 30, 2014 |
December 31, 2013 |
|||||||
| ASSETS |
||||||||
| Current assets: |
||||||||
| Cash and cash equivalents |
$ | 259,363 | $ | 1,044 | ||||
| Restricted cash, including consolidated variable interest entities of $32,167 and $2,139 in 2014 and 2013, respectively |
67,567 | 62,321 | ||||||
| Accounts receivable, including consolidated variable interest entities of $31,120 and $0 in 2014 and 2013, respectively. |
50,028 | 1,505 | ||||||
| Deferred income taxes |
— | 128 | ||||||
| VAT receivable |
40,191 | 38,281 | ||||||
| Prepaid expenses and other current assets |
11,529 | 3,079 | ||||||
|
|
|
|
|
|||||
| Total current assets |
428,678 | 106,358 | ||||||
| Property and equipment, net, including consolidated variable interest entities of $681,782 and $26,006 in 2014 and 2013, respectively |
1,848,635 | 407,356 | ||||||
| Intangible assets, net, including consolidated variable interest entities of $120,432 and $0 in 2014 and 2013, respectively |
289,209 | 22,600 | ||||||
| Deferred financing costs, net |
36,081 | 12,397 | ||||||
| Restricted cash, including consolidated variable interest entities of $1,139 and $0 in 2014 and 2013, respectively |
7,272 | 7,401 | ||||||
| Other assets |
3,205 | 10,765 | ||||||
|
|
|
|
|
|||||
| Total assets |
$ | 2,613,080 | $ | 566,877 | ||||
|
|
|
|
|
|||||
See accompanying notes to unaudited condensed consolidated financial statements.
F-6
Table of Contents
TERRAFORM POWER, INC. AND SUBSIDIARIES
UNAUDITED CONDENSED CONSOLIDATED BALANCE SHEETS
(CONTINUED)
(In thousands, except per share data)
| September 30, 2014 |
December 31, 2013 |
|||||||
| LIABILITIES AND STOCKHOLDERS’ EQUITY |
||||||||
| Current liabilities: |
||||||||
| Current portion of long-term debt, including consolidated variable interest entities of $14,043 and $587 in 2014 and 2013, respectively. |
$ | 270,900 | $ | 36,682 | ||||
| Current portion of capital lease obligations |
— | 773 | ||||||
| Accounts payable, accrued expenses and other current liabilities |
60,360 | 1,974 | ||||||
| Accrued interest |
27,358 | 6,714 | ||||||
| Deferred revenue |
7,245 | 428 | ||||||
| Due to SunEdison and affiliates |
1,507 | 82,051 | ||||||
|
|
|
|
|
|||||
| Total current liabilities |
367,370 | 128,622 | ||||||
| Other liabilities: |
||||||||
| Long-term debt, less current portion, including consolidated variable interest entities of $416,475 and $8,683 in 2014 and 2013, respectively. |
1,033,134 | 371,427 | ||||||
| Long-term capital lease obligations, less current portion |
— | 28,398 | ||||||
| Deferred revenue |
35,840 | 5,376 | ||||||
| Deferred income taxes |
702 | 6,600 | ||||||
| Asset retirement obligations, including consolidated variable interest entities of $5,526 and $1,627 in 2014 and 2013, respectively. |
44,749 | 11,002 | ||||||
|
|
|
|
|
|||||
| Total liabilities |
$ | 1,481,795 | $ | 551,425 | ||||
|
|
|
|
|
|||||
| Stockholders’ equity: |
||||||||
| Net SunEdison investment |
— | 2,674 | ||||||
| Preferred stock, $0.01 par value, 100,000 shares authorized, none issued and outstanding in 2014 and 2013 |
— | — | ||||||
| Class A common stock, $0.01 par value per share, 63,581 shares authorized, 30,652 issued and outstanding as of September 30, 2014. No shares authorized, issued or outstanding in 2013. |
271 | — | ||||||
| Class B common stock, $0.01 par value per share, 65,709 shares authorized, 64,527 issued and outstanding as of September 30, 2014. No shares authorized, issued or outstanding in 2013. |
645 | — | ||||||
| Class B1 common stock, $0.01 par value per share: 260,000 shares authorized, 5,840 issued and outstanding as of September 30, 2014. No shares authorized, issued or outstanding in 2013. |
58 | — | ||||||
| Additional paid-in capital |
317,482 | — | ||||||
| Accumulated deficit |
(4,014 | ) | — | |||||
| Accumulated other comprehensive loss |
(931 | ) | — | |||||
|
|
|
|
|
|||||
| Total TerraForm Power stockholders’ equity |
313,511 | 2,674 | ||||||
| Non-controlling interests |
817,774 | 12,778 | ||||||
|
|
|
|
|
|||||
| Total stockholders’ equity |
1,131,285 | 15,452 | ||||||
|
|
|
|
|
|||||
| Total liabilities and stockholders’ equity |
$ | 2,613,080 | $ | 566,877 | ||||
|
|
|
|
|
|||||
See accompanying notes to unaudited condensed consolidated financial statements.
F-7
Table of Contents
TERRAFORM POWER, INC. AND SUBSIDIARIES
UNAUDITED CONDENSED CONSOLIDATED EQUITY STATEMENT
(In thousands, except per share data)
| Controlling Interest | Non-controlling Interests | Total Equity |
||||||||||||||||||||||||||||||||||||||||||||||||||||||||||||||||||||||
| Net SunEdison Investment |
Preferred Stock |
Class A Common Stock |
Class B Common Stock |
Class B1 Common Stock |
Additional Paid-in Capital |
Accumulated Deficit |
Accumulated Other Comprehensive Income (Loss) |
Total | Capital | Accumulated Deficit |
Accumulated Other Comprehensive Income (Loss) |
Total | ||||||||||||||||||||||||||||||||||||||||||||||||||||||||||||
| Shares | Amount | Shares | Amount | Shares | Amount | Shares | Amount | |||||||||||||||||||||||||||||||||||||||||||||||||||||||||||||||||
| Balance at January 1, 2013 |
$ | 30,029 | — | $ | — | — | $ | — | — | $ | — | — | $ | — | $ | — | $ | — | $ | — | $ | 30,029 | $ | — | $ | — | $ | — | $ | — | $ | 30,029 | ||||||||||||||||||||||||||||||||||||||||
| Net loss |
(282 | ) | — | — | — | — | — | — | — | — | — | — | — | (282 | ) | — | — | — | — | (282 | ) | |||||||||||||||||||||||||||||||||||||||||||||||||||
| Contributions from SunEdison |
53,417 | — | — | — | — | — | — | — | — | — | — | — | 53,417 | — | — | — | — | 53,417 | ||||||||||||||||||||||||||||||||||||||||||||||||||||||
| Distributions to SunEdison |
(80,490 | ) | — | — | — | — | — | — | — | — | — | — | — | (80,490 | ) | — | — | — | — | (80,490 | ) | |||||||||||||||||||||||||||||||||||||||||||||||||||
| Sale of membership interests in projects |
— | — | — | — | — | — | — | — | — | — | — | — | — | 12,778 | — | — | 12,778 | 12,778 | ||||||||||||||||||||||||||||||||||||||||||||||||||||||
|
|
|
|
|
|
|
|
|
|
|
|
|
|
|
|
|
|
|
|
|
|
|
|
|
|
|
|
|
|
|
|
|
|
|
|
|
|||||||||||||||||||||||||||||||||||||
| Balance at December 31, 2013 |
$ | 2,674 | — | $ | — | — | $ | — | — | $ | — | — | $ | — | $ | — | $ | — | $ | — | $ | 2,674 | $ | 12,778 | $ | — | $ | — | $ | 12,778 | $ | 15,452 | ||||||||||||||||||||||||||||||||||||||||
| Contributions from SunEdison, net |
417,590 | — | — | — | — | — | — | — | — | — | — | — | 417,590 | — | — | — | — | 417,590 | ||||||||||||||||||||||||||||||||||||||||||||||||||||||
| Issuance of Class B common stock to SunEdison at formation |
(657 | ) | — | — | — | — | 65,709 | 657 | — | — | — | — | — | — | — | — | — | — | — | |||||||||||||||||||||||||||||||||||||||||||||||||||||
| Other comprehensive loss |
— | — | — | — | — | — | — | — | — | — | — | — | — | — | — | — | — | — | ||||||||||||||||||||||||||||||||||||||||||||||||||||||
| Sale of membership interests in projects |
— | — | — | — | — | — | — | — | — | — | — | — | — | 1,928 | — | — | 1,928 | 1,928 | ||||||||||||||||||||||||||||||||||||||||||||||||||||||
| Consolidation of 50% non-controlling interest in Mt. Signal, net of cash |
— | — | — | — | — | — | — | — | — | — | — | — | — | 146,000 | — | — | 146,000 | 146,000 | ||||||||||||||||||||||||||||||||||||||||||||||||||||||
| Consolidation of non-controlling interests in acquired projects |
— | — | — | — | — | — | — | — | — | — | — | — | — | 74,460 | — | — | 74,460 | 74,460 | ||||||||||||||||||||||||||||||||||||||||||||||||||||||
| Issuance of restricted Class A common stock |
— | — | — | 4,977 | 14 | — | — | — | — | (14 | ) | — | — | — | — | — | — | — | — | |||||||||||||||||||||||||||||||||||||||||||||||||||||
| Stock-based compensation |
— | — | — | — | — | — | — | — | — | 566 | — | — | 566 | — | — | — | — | 566 | ||||||||||||||||||||||||||||||||||||||||||||||||||||||
| Net loss |
(10,357 | ) | — | — | — | — | — | — | — | — | — | — | — | (10,357 | ) | — | 643 | — | 643 | (9,714 | ) | |||||||||||||||||||||||||||||||||||||||||||||||||||
| Other comprehensive loss |
— | — | — | — | — | — | — | — | — | — | — | — | — | — | — | — | — | — | ||||||||||||||||||||||||||||||||||||||||||||||||||||||
| Balance at July 23, 2014 |
$ | 409,250 | — | $ | — | 4,977 | 14 | 65,709 | 657 | — | $ | — | $ | 552 | — | $ | — | $ | 410,473 | $ | 235,166 | $ | 643 | $ | — | $ | 235,809 | $ | 646,282 | |||||||||||||||||||||||||||||||||||||||||||
|
|
|
|
|
|
|
|
|
|
|
|
|
|
|
|
|
|
|
|
|
|
|
|
|
|
|
|
|
|
|
|
|
|
|
|
|
|||||||||||||||||||||||||||||||||||||
See accompanying notes to unaudited condensed consolidated financial statements.
F-8
Table of Contents
TERRAFORM POWER, INC. AND SUBSIDIARIES
UNAUDITED CONDENSED CONSOLIDATED EQUITY STATEMENT
(CONTINUED)
(In thousands, except per share data)
| Controlling Interest | Non-controlling Interests | Total Equity |
||||||||||||||||||||||||||||||||||||||||||||||||||||||||||||||||||||||
| Net SunEdison Investment |
Preferred Stock |
Class A Common Stock |
Class B Common Stock |
Class B1 Common Stock |
Additional Paid-in Capital |
Accumulated Deficit |
Accumulated Other Comprehensive Income (Loss) |
Total | Capital | Accumulated Deficit |
Accumulated Other Comprehensive Income (Loss) |
Total | ||||||||||||||||||||||||||||||||||||||||||||||||||||||||||||
| Shares | Amount | Shares | Amount | Shares | Amount | Shares | Amount | |||||||||||||||||||||||||||||||||||||||||||||||||||||||||||||||||
| Balance at July 23, 2014 |
$ | 409,250 | — | $ | — | 4,977 | 14 | 65,709 | 657 | — | $ | — | $ | 552 | — | $ | — | $ | 410,473 | $ | 235,166 | $ | 643 | $ | — | $ | 235,809 | $ | 646,282 | |||||||||||||||||||||||||||||||||||||||||||
| Write off U.S. deferred tax assets and liabilities at IPO |
3,616 | — | — | — | — | — | — | — | — | — | — | — | 3,616 | — | — | — | — | 3,616 | ||||||||||||||||||||||||||||||||||||||||||||||||||||||
| Issuance of Class B common stock to SunEdison at IPO |
(58 | ) | — | — | — | — | 5,840 | 58 | — | — | — | — | — | — | — | — | — | — | — | |||||||||||||||||||||||||||||||||||||||||||||||||||||
| Issuance of Class B membership units in TerraForm LLC to SunEdison at IPO |
(412,808 | ) | — | — | — | — | — | — | — | — | (222,155 | ) | — | — | (634,963 | ) | 634,963 | — | — | 634,963 | — | |||||||||||||||||||||||||||||||||||||||||||||||||||
| Issuance of class B1 common stock to Riverstone at IPO |
— | — | — | — | — | — | — | 5,840 | 58 | 145,942 | — | — | 146,000 | (146,000 | ) | — | — | (146,000 | ) | — | ||||||||||||||||||||||||||||||||||||||||||||||||||||
| Issuance of Class B1 membership units in TerraForm LLC to Riverstone at IPO |
— | — | — | — | — | — | — | — | — | (57,633 | ) | — | — | (57,633 | ) | 57,633 | — | — | 57,633 | — | ||||||||||||||||||||||||||||||||||||||||||||||||||||
| Issuance of Class A common stock related to the public offering, net of issuance costs |
— | — | — | 23,075 | 231 | (7,023 | ) | (70 | ) | — | — | 368,460 | — | — | 368,621 | — | — | — | — | 368,621 | ||||||||||||||||||||||||||||||||||||||||||||||||||||
| Issuance of Class A common stock related to the Private Placements |
— | — | — | 2,600 | 26 | — | — | — | — | 64,974 | — | — | 65,000 | — | — | — | — | 65,000 | ||||||||||||||||||||||||||||||||||||||||||||||||||||||
| Stock-based compensation |
— | — | — | — | — | — | — | — | — | 1,001 | — | — | 1,001 | — | — | — | — | 1,001 | ||||||||||||||||||||||||||||||||||||||||||||||||||||||
| Net loss |
— | — | — | — | — | — | — | — | — | — | (4,014 | ) | — | (4,014 | ) | — | (4,310 | ) | — | (4,310 | ) | (8,324 | ) | |||||||||||||||||||||||||||||||||||||||||||||||||
| Contributions from SunEdison |
— | — | — | — | — | — | — | — | — | 16,341 | — | — | 16,341 | 37,589 | — | — | 37,589 | 53,930 | ||||||||||||||||||||||||||||||||||||||||||||||||||||||
| Other comprehensive loss |
— | — | — | — | — | — | — | — | — | — | — | (931 | ) | (931 | ) | — | — | (2,143 | ) | (2,143 | ) | (3,074 | ) | |||||||||||||||||||||||||||||||||||||||||||||||||
| Sale of membership interests in projects |
— | — | — | — | — | — | — | — | — | — | — | — | — | 4,384 | — | — | 4,384 | 4,384 | ||||||||||||||||||||||||||||||||||||||||||||||||||||||
| Distributions to non-controlling interests |
— | — | — | — | — | — | — | — | — | — | — | — | — | (151 | ) | — | — | (151 | ) | (151 | ) | |||||||||||||||||||||||||||||||||||||||||||||||||||
|
|
|
|
|
|
|
|
|
|
|
|
|
|
|
|
|
|
|
|
|
|
|
|
|
|
|
|
|
|
|
|
|
|
|
|
|
|||||||||||||||||||||||||||||||||||||
| Balance at |
$ | — | — | $ | — | 30,652 | $ | 271 | 64,526 | $ | 645 | 5,840 | $ | 58 | $ | 317,482 | $ | (4,014 | ) | $ | (931 | ) | $ | 313,511 | $ | 823,735 | $ | (3,667 | ) | $ | (2,143 | ) | $ | 817,774 | $ | 1,131,285 | ||||||||||||||||||||||||||||||||||||
|
|
|
|
|
|
|
|
|
|
|
|
|
|
|
|
|
|
|
|
|
|
|
|
|
|
|
|
|
|
|
|
|
|
|
|
|
|||||||||||||||||||||||||||||||||||||
See accompanying notes to unaudited condensed consolidated financial statements.
F-9
Table of Contents
TERRAFORM POWER, INC. AND SUBSIDIARIES
UNAUDITED CONDENSED CONSOLIDATED STATEMENTS OF CASH FLOWS
(In thousands)
| (In thousands) | Nine Months Ended September 30, |
|||||||
| 2014 | 2013 | |||||||
| Cash flows from operating activities: |
||||||||
| Net loss |
$ | (18,038 | ) | $ | (76 | ) | ||
| Adjustments to reconcile net loss to net cash provided by (used in) operating activities: |
||||||||
| Non-cash incentive revenue |
(1,498 | ) | (1,333 | ) | ||||
| Non-cash interest expense |
770 | 725 | ||||||
| Stock compensation expense |
1,567 | — | ||||||
| Depreciation and accretion |
21,053 | 3,542 | ||||||
| Amortization of intangible assets |
3,558 | — | ||||||
| Amortization of deferred financing costs and debt discounts |
16,842 | 89 | ||||||
| Recognition of deferred revenue |
(192 | ) | (100 | ) | ||||
| Gain on extinguishment of debt, net |
(16,315 | ) | — | |||||
| Unrealized loss on foreign currency exchange |
5,037 | — | ||||||
| Deferred taxes |
(4,068 | ) | (2,374 | ) | ||||
| Changes in assets and liabilities, net of acquisitions: |
||||||||
| Accounts receivable |
(32,937 | ) | (2,137 | ) | ||||
| VAT receivable, prepaid expenses and other current assets |
(12,948 | ) | 926 | |||||
| Accounts payable, accrued interest, and other current liabilities |
28,738 | 4,014 | ||||||
| Deferred revenue |
37,473 | 430 | ||||||
| Due to SunEdison and affiliates |
(8,579 | ) | (47,979 | ) | ||||
| Other, net |
7,104 | 162 | ||||||
|
|
|
|
|
|||||
| Net cash provided by (used in) operating activities |
27,567 | (44,111 | ) | |||||
|
|
|
|
|
|||||
| Cash flows from investing activities: |
||||||||
| Cash paid to SunEdison and third parties for solar system construction |
(614,056 | ) | (4,388 | ) | ||||
| Acquisitions of solar systems from third parties, net of cash acquired |
(355,536 | ) | — | |||||
| Change in restricted cash |
— | (1,146 | ) | |||||
|
|
|
|
|
|||||
| Net cash used in investing activities |
(969,592 | ) | (5,534 | ) | ||||
|
|
|
|
|
|||||
| Cash flows from financing activities: |
||||||||
| Proceeds from issuance of Class A common stock |
433,621 | — | ||||||
| Change in restricted cash for debt service |
28,630 | 620 | ||||||
| Proceeds from term loan |
300,000 | — | ||||||
| Proceeds from bridge loan |
400,000 | — | ||||||
| Repayment of bridge loan |
(400,000 | ) | — | |||||
| Borrowings of long-term debt |
191,073 | 44,400 | ||||||
| Principal payments on long-term debt |
(117,051 | ) | (2,510 | ) | ||||
| Contribution from non-controlling interest |
6,312 | — | ||||||
| Distributions to non-controlling interest |
(151 | ) | — | |||||
| Net SunEdison investment |
401,132 | 8,992 | ||||||
| Payment of deferred financing costs |
(42,880 | ) | (1,455 | ) | ||||
|
|
|
|
|
|||||
| Net cash provided by financing activities |
1,200,686 | 50,047 | ||||||
|
|
|
|
|
|||||
| Net increase in cash and cash equivalents |
258,661 | 402 | ||||||
| Effect of exchange rate changes on cash and cash equivalents |
(342 | ) | — | |||||
| Cash and cash equivalents at beginning of period |
1,044 | 3 | ||||||
|
|
|
|
|
|||||
| Cash and cash equivalents at end of period |
$ | 259,363 | $ | 405 | ||||
|
|
|
|
|
|||||
See accompanying notes to unaudited condensed consolidated financial statements.
F-10
Table of Contents
TERRAFORM POWER, INC. AND SUBSIDIARIES
UNAUDITED CONDENSED CONSOLIDATED STATEMENTS OF CASH FLOWS
(CONTINUED)
(In thousands)
| (In thousands) | Nine Months Ended September 30, |
|||||||
| 2014 | 2013 | |||||||
| Supplemental Disclosures: |
||||||||
| Cash paid for interest, net of amounts capitalized of $8,592 and $464, respectively |
$ | 16,064 | $ | 4,549 | ||||
| Cash paid for income taxes |
— | — | ||||||
| Schedule of non-cash activities: |
||||||||
| Issuance of warrant |
$ | 6,494 | $ | — | ||||
| Additions of ARO assets and obligations |
15,302 | 2,322 | ||||||
| Amortization of deferred financing costs included as construction in progress |
11,892 | 342 | ||||||
| Decrease in due to SunEdison and affiliates in exchange for equity |
72,019 | — | ||||||
| Issuance of B1 common stock to Riverstone for Mt. Signal |
145,828 | — | ||||||
| Issuance of Class B common stock and Class B Terra LLC units to SunEdison for Mt. Signal acquisition |
146,000 | — | ||||||
| Non-controlling interest in Terra LLC (Class B units) issued in connection with the initial public offering |
632,652 | — | ||||||
| Write off of pre-IPO U.S. deferred tax assets and liabilities |
3,616 | — | ||||||
| Deferred purchase price for acquisitions |
9,278 | — | ||||||
| Assumed long-term debt in connection with acquisitions |
526,390 | — | ||||||
| Principal payments on long-term debt from solar renewable energy certificates |
728 | 608 | ||||||
| Acquired ARO assets and obligations |
17,932 | — | ||||||
See accompanying notes to unaudited condensed consolidated financial statements.
F-11
Table of Contents
TERRAFORM POWER, INC. AND SUBSIDIARIES
NOTES TO UNAUDITED CONDENSED CONSOLIDATED FINANCIAL STATEMENTS
(Dollar amounts in thousands)
1. NATURE OF OPERATIONS
TerraForm Power, Inc. (the “Company”) was formed under the name SunEdison Yieldco, Inc. on January 15, 2014, as a wholly owned indirect subsidiary of SunEdison, Inc. (“SunEdison”). The name change from SunEdison Yieldco, Inc. to TerraForm Power, Inc. became effective on May 22, 2014. Following the Company’s initial public offering (“IPO”) on July 23, 2014, the Company became a holding company and its sole asset is an equity interest in TerraForm Power, LLC (“Terra LLC” or “the Predecessor”) an owner of solar generation systems and long-term contractual arrangements to sell the electricity generated by such systems and the related green energy certificates and other environmental attributes to third parties. The Company is the managing member of Terra LLC, and operates, controls and consolidates the business affairs of Terra LLC.
Basis of Presentation
Certain assets in the Company’s current portfolio have been contributed from SunEdison and are reflected in the accompanying consolidated balance sheets at SunEdison’s historical cost. When projects are contributed or acquired from SunEdison, the Company is required to recast its historical financial statements to reflect the assets and liabilities of the acquired project for the period it was owned by SunEdison in accordance with rules applicable to transactions between entities under common control.
For all periods prior to the IPO, the accompanying unaudited consolidated financial statements represent the combination of the Company and Terra LLC, the accounting predecessor, and were prepared using SunEdison’s historical basis in assets and liabilities. For all periods subsequent to the IPO, the accompanying unaudited condensed consolidated financial statements represent the results of the Company, which consolidates Terra LLC through its controlling interest.
The historical financial statements of the Predecessor include allocations of certain SunEdison corporate expenses and income tax expense. Management believes the assumptions and methodology underlying the allocation of general corporate overhead expenses are reasonable. Subsequent to the IPO, corporate expenses represent those costs allocated to the Company under the management services agreement.
The following notes should be read in conjunction with the accounting policies and other disclosures as set forth in the notes to the Company’s annual financial statements for the years ended December 31, 2013 and 2012 contained in the Company’s Prospectus. Interim results are not necessarily indicative of results for a full year. In our opinion, the accompanying unaudited condensed consolidated financial statements of the Company include all adjustments (consisting of normal, recurring items) necessary to present fairly its financial position, results of operations and cash flows for the periods presented. The Company has presented the unaudited condensed consolidated financial statements in accordance with U.S. generally accepted accounting principles (“GAAP”) for interim financial information. Accordingly, they do not include all the information and disclosures required by GAAP for complete financial statements.
2. SUMMARY OF SIGNIFICANT ACCOUNTING POLICIES
Principles of Consolidation
The accompanying consolidated financial statements have been prepared in accordance with accounting principles generally accepted in the United States (U.S. GAAP). They include the results of
F-12
Table of Contents
wholly owned and partially owned subsidiaries in which the Company has a controlling interest with all significant intercompany accounts and transactions eliminated. When the Company is the primary beneficiary of a variable interest entity in solar energy projects, they are consolidated.
Use of Estimates
In preparing the unaudited consolidated financial statements, the Company used estimates and assumptions that affect the reported amounts of assets and liabilities at the date of the financial statements. Such estimates also affect the reported amounts of revenues and expenses during the reporting period. Actual results may differ from estimates under different assumptions or conditions.
Basic and Diluted Earnings (Loss) Per Share
Basic earnings (loss) per share is computed by dividing net income attributable to common stockholders by the number of weighted-average ordinary shares outstanding during the period. Diluted earnings (loss) per share is computed by adjusting basic earnings (loss) per share for the impact of weighted-average dilutive common equivalent shares outstanding during the period. Common equivalent shares represent the incremental shares issuable for unvested restricted Class A common stock and redeemable shares of Class B and Class B1 common stock.
Stock-Based Compensation
Stock-based compensation expense for all share-based payment awards is based on the estimated grant-date fair value and is accounted for in accordance with FASB ASC 718, Compensation—Stock Compensation. The Company recognizes these compensation costs net of an estimated forfeiture rate for only those shares expected to vest on a straight-line basis over the requisite service period of the award, which is generally the award vesting term. For ratable awards, the Company recognizes compensation costs for all grants on a straight-line basis over the requisite service period of the entire award.
Derivative Financial Instruments
The Company recognizes its derivative instruments as assets or liabilities at fair value in the consolidated balance sheets. Accounting for changes in the fair value (i.e., gains or losses) of a derivative instrument depends on whether it has been designated as part of a hedging relationship and on the type of hedging relationship.
The effective portion of changes in fair value of derivative instruments designated as cash flow hedges is reported as a component of other comprehensive income (loss) (“OCI”). Changes in the fair value of these derivatives are subsequently reclassified into earnings in the period that the hedged transaction affects earnings. The ineffective portion of changes in fair value is recorded as a component of net income (loss) on the consolidated statement of operations.
The change in fair value of undesignated derivative instruments is reported as a component of net income (loss) on the consolidated statement of operations.
Reclassification
Certain prior period balances have been reclassified to conform to current period presentation showing greater detail of certain current assets and liabilities in the Company’s consolidated financial statements and accompanying notes. Such reclassifications have no effect on previously reported balance sheet subtotals, results of operations, equity, or cash flows.
F-13
Table of Contents
Recent Accounting Pronouncements
On May 28, 2014, the Financial Accounting Standards Board (“FASB”) issued Accounting Standards Update (“ASU”) No. 2014-09, Revenue from Contracts with Customers, which requires an entity to recognize the amount of revenue to which it expects to be entitled for the transfer of promised goods or services to customers. This ASU will replace most existing revenue recognition guidance in GAAP when it becomes effective. The new standard is effective for us on January 1, 2017. Early application is not permitted. The standard permits the use of either the retrospective or cumulative effect transition method. The Company is currently evaluating the effect that ASU 2014-09 will have on its consolidated financial statements and related disclosures. The Company has not yet selected a transition method or determined the effect of the standard on its ongoing financial reporting.
In August 2014, the FASB issued Accounting Standards Update No. 2014-15, Presentation of Financial Statements-Going Concern. ASU 2014-15 is intended to define management’s responsibility to evaluate whether there is substantial doubt about an organization’s ability to continue as a going concern and to provide related footnote disclosures. This guidance is effective for the annual period ending December 31, 2016 and interim and annual periods thereafter. We do not expect the adoption of this standard to have a material impact on our consolidated financial position, results of operations and cash flows.
3. ACQUISITIONS
The initial accounting for acquisitions is not complete because the evaluation necessary to assess the fair values of assets acquired and liabilities assumed is still in process. The provisional amounts are subject to revision to the extent additional information is obtained about the facts and circumstances that existed as of the acquisition dates.
Nellis
On March 28, 2014, the Company acquired 100% of the controlling investor member interests in MMA NAFB Power, LLC (“Nellis”), which owns a 14.1 MW solar energy generation system located on Nellis Air Force Base in Clark County, Nevada. A wholly owned subsidiary of SunEdison holds the noncontrolling interest in Nellis. The purchase price for this acquisition was $14.2 million, net of acquired cash.
CalRenew-1
On May 15, 2014, the Company acquired 100% of the issued and outstanding membership interests of CalRenew-1, LLC (“CR-1”), which owns a 6.3 MW solar energy generation system located in Mendota, California. The purchase price for this acquisition was $14.3 million, net of acquired cash.
Atwell Island
On May 16, 2014, the Company acquired 100% of the membership interests in SPS Atwell Island, LLC (“Atwell Island”), a 23.5 MW solar energy generation system located in Tulare County, California. The purchase price for this acquisition was $67.2 million, net of acquired cash.
MA Operating
On June 26, 2014, the Company acquired four operating solar energy systems located in Massachusetts that achieved commercial operations during 2013. The total capacity for these projects is 12.2 MW. The purchase price for this acquisition was $39.5 million.
F-14
Table of Contents
Stonehenge Operating Projects
On May 21, 2014, the Company acquired 100% of the issued share capital of three operating solar energy systems located in the United Kingdom from ib Vogt GmbH. These acquisitions are collectively referred to as Stonehenge Operating Projects. The Stonehenge Operating Projects consists of Sunsave 6 (Manston) Limited, Boyton Solar Park Limited and KS SPV 24 Limited. The total combined capacity for the Stonehenge Operating Projects is 23.6 MW. The purchase price for the Stonehenge Operating Projects was $26,778, net of acquired cash.
Summit Solar Projects
On May 22, 2014, the Company acquired the equity interests in 23 solar energy systems located in the U.S. from Nautilus Solar PV Holdings, Inc. These 23 systems have a combined capacity of 19.6 MW. The purchase price for these systems was $29,097, net of acquired cash. In addition, an affiliate of the seller owns certain interests in seven operating solar energy systems in Canada with a total capacity of 3.8 MW. In conjunction with the signing of the purchase and sale agreement to acquire the U.S. equity interests, the Company signed an asset purchase agreement to purchase the right and title to all of the assets of the Canadian facilities. The purchase of the Canadian assets closed on July 23, 2014 and the purchase price was $20,238, net of acquired cash.
Mt. Signal
On July 23, 2014, the Company acquired a controlling interest in Imperial Valley Solar 1 Holdings II, LLC, which owns a 265.9 MW utility scale solar energy system located in Mt. Signal, California (“Mt. Signal”). The Company acquired Mt. Signal from an indirect wholly owned subsidiary of SRP in exchange for $292.0 million in total consideration consisting of (i) 5,840,000 Class B1 units (and a corresponding number of shares Class B1 common stock) equal in value to $146.0 million and (ii) 5,840,000 Class B units (and a corresponding number of shares Class B common stock) equal in value to $146.0 million. Prior to the IPO, SRP was owned 50% by Riverstone and 50% by SunEdison, who acquired all of AES Corporation’s equity ownership interest in SRP on July 2, 2014. In connection with its acquisition of AES Corporation’s interest in SRP, SunEdison entered into a Master Transaction Agreement with Riverstone pursuant to which the parties agreed to sell Mt. Signal to the Company and to distribute the Class B units (and shares of Class B common stock) to SunEdison and the Class B1 units (and shares of Class B1 common stock) to Riverstone.
Hudson Energy Solar Corp
On November 4, 2014, the Company acquired the operating portfolio of Hudson Energy Solar Corporation (“HES”), a solar project developer that owns and operates solar assets for schools, school districts, and commercial and industrial customers for $22.9 million.
Capital Dynamics
On October 30, 2014, the Company entered into an agreement to acquire 77.6 MW of distributed generation solar energy systems in the U.S. from Capital Dynamics U.S. Solar Energy Fund, L.P., a closed-end private equity fund, for $250 million in aggregate consideration. This acquisition is expected to close in the fourth quarter of 2014.
The acquisitions of HES and Capital Dynamics are not included in the preliminary allocation of assets and liabilities. The initial accounting for these acquisitions is not complete because the evaluation necessary to assess the fair values of certain net assets to be acquired is not complete.
F-15
Table of Contents
Fairwinds and Crundale
On November 4, 2014, the Company completed the acquisition of Fairwinds and Crundale, two utility scale power projects with a total capacity of 50 MW located in the United Kingdom that became operational in September 2014. The Company paid approximately $32.2 million in aggregate to acquire the projects from SunEdison and assumed approximately $63.7 million of project level debt. Fairwinds and Crundale were Call Right Projects and were the first acquisition from SunEdison since the IPO. This acquisition will be accounted for at SunEdison’s historical cost basis.
Changes in the allocation of acquired assets and liabilities from previously reported amounts reflect adjustments made to the preliminary allocation of assets and liabilities as a result of additional information available since that period. The provisional estimated allocation of assets and liabilities as of September 30, 2014, is as follows:
| (In thousands) | Mt. Signal | Other Acquisitions |
Total Estimated Allocation |
|||||||||
| Property and equipment |
$ | 643,084 | $ | 205,300 | $ | 848,384 | ||||||
| Accounts receivable |
9,951 | 5,856 | 15,807 | |||||||||
| Restricted cash |
22,165 | 11,700 | 33,865 | |||||||||
| Other assets |
14,087 | 3,137 | 17,224 | |||||||||
| Intangible assets |
121,456 | 119,241 | 240,697 | |||||||||
|
|
|
|
|
|
|
|||||||
| Total assets acquired |
810,743 | 345,234 | 1,155,977 | |||||||||
|
|
|
|
|
|
|
|||||||
| Long-term debt |
413,464 | 112,926 | 526,390 | |||||||||
| Accounts payable, accrued expenses and other current liabiliites |
29,565 | 4,310 | 33,875 | |||||||||
| Asset retirement obligations |
3,000 | 14,932 | 17,932 | |||||||||
| Deferred income taxes |
— | 1,956 | 1,956 | |||||||||
|
|
|
|
|
|
|
|||||||
| Total liabilities assumed |
446,029 | 134,124 | 580,153 | |||||||||
| Non-controlling interest |
73,060 | 1,400 | 74,460 | |||||||||
|
|
|
|
|
|
|
|||||||
| Purchase price, net of cash acquired |
$ | 291,654 | $ | 209,710 | $ | 501,364 | ||||||
|
|
|
|
|
|
|
|||||||
The acquired projects’ intangible assets represent preliminary estimates of the fair value of acquired PPAs. The estimated fair values were determined based on an income approach and the estimated useful lives of the intangible assets range from 15 to 25 years. See Note 5. for additional disclosures related to the acquired intangible assets. The operating revenues and net income of acquired projects reflected in the accompanying consolidated statement of operations for the nine months ended September 30, 2014 was $42.5 million and $14.3 million, respectively.
The following unaudited pro forma supplementary data gives effect to the acquisitions as if the transactions had occurred on January 1, 2013. The unaudited pro forma supplementary data is provided for informational purposes only and should not be construed to be indicative of the Company’s results of operations had the acquisitions been consummated on the date assumed or of the Company’s results of operations for any future date.
| Nine Months Ended September 30, |
||||||||
| (In thousands) | 2014 | 2013 | ||||||
| Operating revenues |
$ | 93,122 | $ | 33,899 | ||||
| Net loss |
(15,393 | ) | (7,425 | ) | ||||
Acquisition costs, including amounts for affiliates, related to the transactions above were $5.4 million for the nine months ended September 30, 2014 and are reflected as acquisition costs in the accompanying consolidated statements of operations.
F-16
Table of Contents
4. PROPERTY AND EQUIPMENT
Property and equipment consists of the following:
| September 30, 2014 |
December 31, 2013 |
|||||||
| (In thousands) | ||||||||
| Solar energy systems |
$ | 1,491,928 | $ | 163,698 | ||||
| Construction in progress—solar energy systems |
390,519 | 228,749 | ||||||
| Capitalized leases—solar energy systems |
— | 29,170 | ||||||
|
|
|
|
|
|||||
| Property and equipment, gross |
1,882,447 | 421,617 | ||||||
| Less accumulated depreciation—solar energy systems |
(33,812 | ) | (9,956 | ) | ||||
| Less accumulated depreciation—capitalized leases—solar energy systems |
— | (4,305 | ) | |||||
|
|
|
|
|
|||||
| Property and equipment, net |
$ | 1,848,635 | $ | 407,356 | ||||
|
|
|
|
|
|||||
The Company recorded depreciation expense related to property and equipment of $20.0 million and $3.3 million for the nine months ended September 30, 2014 and 2013, respectively.
Construction in progress represents $390.5 million of costs to complete the construction of the projects in our current portfolio that were contributed to the Company by SunEdison. Subsequent to the completion of these projects, the Company will continue to present construction in progress for projects that acquired from SunEdison but will not have the related construction risk. As projects are completed by SunEdison and contributed or sold to the Company, the Company will retroactively recast its historical financial statements to present the construction activity as if it consolidated the project at inception of the construction. Subsequent to the completion of the construction in progress projects in the Company’s current portfolio, the Company expects to acquire completed projects. All construction in progress costs are stated at SunEdison’s historical cost. These costs include capitalized interest costs and amortization of deferred financing costs incurred during the asset’s construction period, which totaled $20.5 million for the nine months ended September 30, 2014. No amounts were capitalized during the same period in the prior year.
5. INTANGIBLE ASSETS
The following table presents the gross carrying amount and accumulated amortization of other intangible assets at September 30, 2014:
| (In thousands, except weighted average amortization period) |
Gross carrying amount |
Weighted average amortization period |
Accumulated amortization |
Currency translation adjustment |
Net book value |
|||||||||||||||
| Power purchase agreements |
$ | 271,720 | 17 years | $ | (3,558 | ) | $ | (1,553 | ) | $ | 266,609 | |||||||||
| Development rights |
22,600 | Indefinite | — | — | 22,600 | |||||||||||||||
|
|
|
|
|
|
|
|
|
|||||||||||||
| $ | 294,320 | $ | (3,558 | ) | $ | (1,553 | ) | $ | 289,209 | |||||||||||
|
|
|
|
|
|
|
|
|
|||||||||||||
The following table presents the gross carrying amount and accumulated amortization of other intangible assets at December 31, 2013:
| (In thousands, except weighted average amortization period) |
Gross carrying amount |
Weighted average amortization period |
Accumulated amortization |
Currency translation adjustment |
Net book value |
|||||||||||||||
| Development rights |
$ | 22,600 | Indefinite | — | — | $ | 22,600 | |||||||||||||
F-17
Table of Contents
As of September 30, 2014, the Company had power purchase agreement (“PPA”) intangible assets representing long-term electricity sales agreements. PPA intangible assets are amortized on a straight-line basis over the life of the agreements, which typically range from 15 to 25 years. Amortization expense related to the PPA intangible assets is recorded on the consolidated statements of operations as a reduction of energy revenue. Amortization expense was $3.6 million during the nine months ended September 30, 2014. There was no amortization expense during the nine months ended September 30, 2013.
As of September 30, 2014 and December 31, 2013, the Company had an intangible asset with a carrying amount of $22.6 million related to power plant development rights. This intangible asset will be reclassified to the related solar energy system (property and equipment) upon completion and will be amortized to depreciation expense on a straight-line basis over the estimated life of the solar energy system. No amounts have been amortized during the nine months ended September 30, 2014 and 2013 as construction of the related solar energy system has not been completed.
6. VARIABLE INTEREST ENTITIES
The Company is the primary beneficiary and consolidates two variable interest entities (or “VIEs”) in solar energy projects as of September 30, 2014 and December 31, 2013. The carrying amounts and classification of the consolidated VIEs’ assets and liabilities included in the Company’s unaudited consolidated balance sheet are as follows:
| (In thousands) | September 30, 2014 |
December 31, 2013 |
||||||
| Current assets |
$ | 64,963 | $ | 2,139 | ||||
| Noncurrent assets |
804,855 | 27,076 | ||||||
|
|
|
|
|
|||||
| Total assets |
$ | 869,818 | $ | 29,215 | ||||
|
|
|
|
|
|||||
| Current liabilities |
$ | 34,739 | $ | 6,129 | ||||
| Noncurrent liabilities |
436,045 | 10,310 | ||||||
|
|
|
|
|
|||||
| Total liabilities |
$ | 470,784 | $ | 16,439 | ||||
|
|
|
|
|
|||||
All of the assets in the table above are restricted for settlement of the VIE obligations, and all of the liabilities in the table above can only be settled using VIE resources.
F-18
Table of Contents
7. LONG-TERM DEBT
Long-term debt consists of the following:
| (In thousands, except rates) | ||||||||||||||
| Description: |
September 30, 2014 |
December 31, 2013 |
Interest Type |
Current Interest Rate % (1) |
Financing Type | |||||||||
| Term loan—2019 |
$ | 299,250 | $ | — | Variable | 5.33(2) | Term debt | |||||||
| Mt. Signal, due 2038 |
413,464 | — | Fixed | 6.00 | Senior Notes | |||||||||
| CAP, due 2014 (VAT) & 2032 |
247,888 | 243,581 | Variable | 5.11—7.10 | VAT facility and term debt | |||||||||
| Regulus Solar: |
||||||||||||||
| Regulus Solar, due 2016 |
37,935 | 44,400 | PIK | 18.00 | Development loan | |||||||||
| Regulus Solar, due 2015 |
111,525 | — | Fixed | 4.00 | Construction debt | |||||||||
| Nellis, due 2027 |
46,107 | — | Imputed | 5.75 | Senior Notes | |||||||||
| SunE Perpetual Lindsay, due 2014 |
48,033 | — | Variable | 3.27 | Construction debt and HST Facility | |||||||||
| Summit Solar U.S., due 2020—2028 |
24,178 | — | Imputed | 5.75 | Term debt | |||||||||
| DGS Prisons, due 2024—2025 |
17,055 | 9,270 | Variable | 6.00 | Construction and term debt | |||||||||
| Enfinity, due 2032 |
4,890 | 4,904 | Imputed | 5.75 | Term debt | |||||||||
| US Projects 2009—2013: |
||||||||||||||
| Term bonds, due 2016—2031 |
— | 8,638 | Fixed | 5.0—5.75 | Term debt | |||||||||
| Solar program loans, due 2024—2026 |
9,477 | 10,206 | Fixed | 11.1—11.3 | Solar program loans | |||||||||
| Alamosa |
— | 29,171 | Fixed | 2.98 | Capital lease obligations | |||||||||
| Financing lease obligations: |
||||||||||||||
| Enfinity, due 2025—2032 |
30,521 | 31,494 | Fixed | 5.63—7.26 | Financing lease obligations | |||||||||
| SunE Solar Fund X, due 2030 |
— | 55,616 | Fixed | 3.91—5.11 | Financing lease obligations | |||||||||
| US Projects 2014, due 2019 |
4,508 | — | Fixed | 6.00 | Financing lease obligations | |||||||||
| Regulus land lease, due 2034 |
9,203 | — | Fixed | 5.75 | Financing lease obligations | |||||||||
|
|
|
|
|
|||||||||||
| Total long-term debt and capital lease obligations |
$ | 1,304,034 | $ | 437,280 | ||||||||||
|
|
|
|
|
|||||||||||
| Less current maturities |
(270,900 | ) | (37,455 | ) | ||||||||||
|
|
|
|
|
|||||||||||
| Long-term debt and capital lease obligations, less current portion |
$ | 1,033,134 | $ | 399,825 | ||||||||||
|
|
|
|
|
|||||||||||
| (1) | The weighted average effective interest rate for all debt outstanding during the period, excluding the amortization of deferred financing fees and debt discounts, was 5.5%. |
| (2) | The variable rate as of September 30, 2014 is 4.75%. The Company has entered into an interest rate swap agreement (see Note 9) fixing the interest rate at 5.33% for the next three years. |
Bridge Credit Facility
On March 28, 2014, the Company entered into a credit and guaranty agreement with Goldman Sachs Bank USA as administrative agent and the lenders party thereto (the “Bridge Credit Facility”). The Bridge Credit Facility originally provided for a senior secured term loan facility in an aggregate principal amount of $250.0 million. On May 15, 2014, the Bridge Credit Facility was amended to increase the aggregate principal amount to $400.0 million (the “Amended Bridge Credit Facility”).
The Company’s obligations under the Amended Bridge Credit Facility were guaranteed by certain of its domestic subsidiaries. The Company’s obligations and the guaranty obligations of its subsidiaries
F-19
Table of Contents
were secured by first priority liens on and security interests in substantially all present and future assets of the Company and the subsidiary guarantors.
Interest under the Amended Bridge Credit Facility had variable interest rate options based on Base Rate Loans or Eurodollar loans at the Company’s election.
The Amended Bridge Credit Facility was repaid following the closing of the IPO on July 23, 2014.
Term Loan and Revolving Credit Facility
In connection with the closing of the IPO on July 23, 2014, Terra Operating LLC (a wholly owned subsidiary of Terra LLC) entered into a revolving credit facility (the “Revolver”) and a term loan facility (the “Term Loan” and together with the Revolver, the “Credit Facilities”). The Revolver provides for up to a $140.0 million senior secured revolving credit facility and the Term Loan provides for up to a $300.0 million senior secured term loan. The Term Loan was used to repay a portion of outstanding borrowings under the Amended Bridge Credit Facility. Each of Terra Operating LLC’s existing and subsequently acquired or organized domestic restricted subsidiaries and Terra LLC are guarantors under the Credit Facilities.
The Term Loan will mature on July 23, 2019 and the Revolver will mature on July 23, 2017. All outstanding amounts under the Credit Facilities bear interest at a rate per annum equal to, at Terra Operating LLC’s option, either (i) a base rate plus 2.75% or (ii) a reserve adjusted eurodollar rate plus 3.75%. For the Term Loan, the base rate will be subject to a “floor” of 2.00% and the reserve adjusted eurodollar rate will be subject to a “floor” of 1.00%.
The Credit Facilities provide for voluntary prepayments, in whole or in part, subject to notice periods and payment of repayment premiums. The Credit Facilities require Terra Operating LLC to prepay outstanding borrowings in certain circumstances such as the sale of underlying collateral. The Credit Facilities contain customary and appropriate representations and warranties and affirmative and negative covenants (subject to exceptions) by the Company and its subsidiaries.
The Credit Facilities, each guaranty and any interest rate and currency hedging obligations of Terra Operating LLC or any guarantor owed to the administrative agent, any arranger or any lender under the Credit Facilities are secured by first priority security interests in (i) all of Terra Operating LLC’s assets and each guarantor’s assets, (ii) 100% of the capital stock of each of Terra Operating LLC’s domestic restricted subsidiaries and 65% of the capital stock of Terra Operating LLC’s foreign restricted subsidiaries and (iii) all intercompany debt, collectively, the “Credit Facilities Collateral.”
On October 30, 2014, the Company announced that it obtained a commitment to increase the Term Loan by $275.0 million and the Revolver by $75.0 million to increase liquidity and to fund the acquisitions of Hudson Energy Solar Corp and Capital Dynamics.
Project-level Financing Arrangements
The Company’s solar energy systems which have long-term debt obligations are included in separate legal entities. The Company typically finances its solar energy projects through project entity specific debt secured by the project entity’s assets (mainly the solar energy system) with no recourse to the Company. Typically, these financing arrangements provide for a construction loan, which upon completion may or may not be converted into a term loan. The following is a summary of construction and term debt entered into or assumed from January 1, 2013 to September 30, 2014.
F-20
Table of Contents
Mt. Signal
In connection with the acquisition of Mt. Signal, the Company assumed $415.7 million of additional long-term debt. The senior secured notes bear interest at 6% and mature in 2038. Interest on the notes is payable semi-annually on June 30 and December 31 of each year, commencing on June 30, 2013. A letter of credit facility was also extended to the project company to satisfy certain security obligations under the PPA, other project agreements and the senior secured notes. The letter of credit facility will terminate on the earlier of July 2, 2019 and the fifth anniversary of the Mt. Signal project’s completion date.
CAP
In August 2013, the CAP project entity obtained $212.5 million in non-recourse debt financing from the Overseas Private Investment Corporation (“OPIC”), the U.S. Government’s development finance institution, and International Finance Corporation (“IFC”), a member of the World Bank Group. In addition to the debt financing provided by OPIC and IFC, the project entity received a Chilean peso VAT credit facility from Rabobank. Under the VAT credit facility the project entity may borrow funds to pay for value added tax payments due from the project. The VAT credit facility has a variable interest rate that is tied to the Chilean Interbank Rate plus 1.40% and will mature in November 2014. As of September 30, 2014, the outstanding balance under the Chilean peso denominated VAT credit facility was $35.4 million. This debt is secured by the assets of CAP.
Regulus Solar
In March 2013, the Regulus Solar project entity entered into a financing agreement with a group of lenders for a $44.4 million development loan of which $37.9 and $44.4 was outstanding as of September 30, 2014 and December 31, 2013. The financing arrangement matures on March 31, 2016 and interest accrues from the date of borrowing until the maturity date at a rate of 18% per annum and is paid in kind (“PIK”) at each PIK interest date.
On March 28, 2014, the Regulus Solar project entity entered into an agreement for a construction loan facility for an amount up to $120.0 million, of which $111.5 million, net of a $1.5 million discount, was outstanding at September 30, 2014. The construction loan facility has a term ending in January 2015. Interest under the construction loan facility has variable interest rate options based on Base Rate Loans or LIBOR loans at the Company’s election. The interest rate payable under Base Rate Loans will be based upon an adjusted base rate (equal to the greater of (i) the Base Rate (Prime Rate) in effect on such day, (ii) the Federal Funds Effective Rate in effect on such day plus 0.50% and (iii) the LIBOR rate plus 1.00%.) The interest rate payable under LIBOR Loans will be based upon the published LIBOR rate plus 3.75% applicable margin. This debt is secured by the assets of the Regulus Solar project entity.
Nellis
On March 28, 2014, the Company assumed a term loan facility in conjunction with the acquisition of Nellis. The term loan is due in 2027, bears interest at a rate of 5.75% per annum, and is secured by the assets of Nellis.
Stonehenge Operating
On May 21, 2014, the Company assumed three euro denominated term loan facilities in conjunction with the acquisition of the Stonehenge Operating projects. These term loans were due in 2028, bear interest at a rate of 3.4% per annum, and were secured by the acquired assets of the
F-21
Table of Contents
Stonehenge Operating projects. The Company also assumed three cross-currency swaps to hedge the foreign currency risk posed by the term loan facilities, which were denominated in euros. See Note 7 for disclosures regarding the Company’s derivative financial instruments. These facilities were secured by the assets of the Stonehenge Operating project entities. On September 30, 2014, the Company repaid all outstanding amounts due under the term facilities. The Company recognized a $3.8 million loss on extinguishment of debt during the nine months ended September 30, 2014 as a result of this repayment.
Lindsay
On March 25, 2014, Lindsay, a Canadian project entity, obtained a construction term loan that matures in September 2015. Interest under the construction term loan facility has variable rate options based on Prime Rate Advances or CDOR (“Canadian Dealer Offered Rate”) Advances at the Company’s election. The interest rate payable under Prime Rate Advances will be the sum of the Prime Rate in effect on such day plus 1.00% and an applicable margin of 2.00%. The interest rate payable under CDOR Advances will be based on the published CDOR rate plus an applicable margin of 2.00%. This debt is secured by the assets of the Lindsay project entity.
Summit Solar U.S.
On May 22, 2014, the Company assumed seven term loan facilities in conjunction with the acquisition of Summit Solar U.S. The term loans are due from 2020 through 2028, bear interest at a rate of 5.75% per annum, and are secured by the assets of Summit Solar U.S..
DGS Prisons
The California Institution projects obtained permanent term loan financing upon completion of the projects. The term loans mature between 2023 and 2024 and bear interest at a rate of LIBOR plus 2.5%.
U.S. Projects 2009-2013
On September 8, 2014, the Company repaid all outstanding amounts due under its term bonds. The Company recognized a $2.5 million loss on extinguishment of debt during the nine months ended September 30, 2014 as a result of this repayment.
Capital Lease Obligations
Alamosa
On May 7, 2014, the Company purchased the lessor portion of the capital lease related to the project and there is no additional project level financing outstanding at September 30, 2014. The Company recognized a $1.9 million loss on extinguishment of debt during the nine months ended September 30, 2014 as a result of this transaction.
Financing Lease Obligations
In certain transactions the Company accounts for the proceeds of sale leasebacks as financings, which are typically secured by the energy system asset and its future cash flows from energy sales, and without recourse to the Company under the terms of the arrangement.
F-22
Table of Contents
Enfinity
The balance outstanding for sale leaseback transactions accounted for as financings as of September 30, 2014 for Enfinity was $30.5 million. The Enfinity sale leaseback accounted for as financings mature between 2025 and 2032 and are collateralized by the related solar energy system assets.
SunE Solar Fund X
On July 23, 2014, concurrent with the closing of the IPO, the Company purchased the lessor portion of the capital lease related to the SunE Solar Fund X project and there is no additional project level financing outstanding at September 30, 2014. The Company recognized a $15.8 million gain on extinguishment of debt during the nine months ended September 30, 2014 as a result of this transaction.
Regulus Solar
On April 11, 2014, Regulus Solar entered into a sale leaseback agreement for a sales price of $9.2 million, which was received at closing on April 14, 2014. The lease term is 20 years and Regulus Solar has two options to renew the term for 5 years each and then one option to renew for a total lease term not to exceed 34 years, 11 months. The total purchase price of $9.2 million was recorded as a financing obligation and is secured by the land and the solar energy system assets, which are under construction as of September 30, 2014.
US Projects 2014
On June 3, 2014, certain projects within the Company’s US Projects 2014 portfolio entered into an inverted lease structure to finance approximately 45 MW of distributed generation solar energy systems that will be constructed and placed into operation during the fourth quarter of 2014. The lease term is eight years and the total purchase price was $40.6 million, of which $4.5 million is reflected as a financing obligation and $36.1 million is recorded as deferred revenue in the accompanying consolidated balance sheet as of September 30, 2014.
Maturities
The aggregate amounts of payments on long-term debt, excluding amortization of debt discounts, due after September 30, 2014 are as follows:
| In millions | Balance of 2014 |
2015 | 2016 | 2017 | 2018 | Thereafter | Total | |||||||||||||||||||||
| Maturities of long-term debt at September 30, 2014 |
$ | 112,435 | $ | 142,924 | $ | 73,617 | $ | 32,972 | $ | 33,996 | $ | 909,615 | $ | 1,305,559 | ||||||||||||||
The amount of long-term debt due in 2014 includes $48.0 million of construction debt for SunE Perpetual Lindsay, which will be repaid by SunEdison upon completion, and a $35.4 million VAT facility for CAP, which the Company expects to repay upon collection of VAT receivable in the fourth quarter of 2014. The amounts of long-term debt due in 2015 includes $111.5 million of construction debt for Regulus, which will be repaid through the receipt of permanent tax equity and non-recourse term debt proceeds. Such proceeds are expected to be in excess of the Regulus development and senior construction loan.
F-23
Table of Contents
8. INCOME TAXES
Effective Tax Rate
The income tax provision consisted of the following:
| (In thousands, except effective tax rate) | Nine Months Ended September 30, |
|||||||
| 2014 | 2013 | |||||||
| Income (loss) before income tax provision (benefit) |
(22,107 | ) | (136 | ) | ||||
| Income tax provision (benefit) |
(4,069 | ) | (60 | ) | ||||
| Effective tax rate |
18 | % | 44 | % | ||||
On July 23, 2014, the Company acquired a controlling interest in Terra LLC and its subsidiary TerraForm Operating LLC. As a result, the Company owns 30.3% of Terra LLC and consolidates the results due to its controlling interest. The Company records SunEdison’s 63.9% and Riverstone’s 5.8% ownership as a non-controlling interests in the financial statements. Terra LLC is treated as a partnership for income tax purposes. As such, the Company records income tax on its 30.3% of Terra LLC’s taxable income. SunEdison records income tax on its 63.9% share of taxable income generated by Terra LLC.
The Company’s deferred tax balances reflect the change in tax basis of the Company’s assets as a result of the IPO, primarily due to the recognition of the tax basis of the Company’s investment in Terra LLC. For the nine months ended September 30, 2014, the overall effective tax rate was different than the statutory rate of 35% primarily due to the recognition of a valuation allowance on the tax benefit attributed to the Company post IPO. Tax benefits for losses realized before July 23, 2014, were recognized primarily because of existing deferred tax liabilities. These deferred tax amounts were eliminated with a charge to equity at the IPO date. A valuation allowance is recognized for the deferred tax assets resulting from the IPO transaction primarily because of the history of losses.
9. DERIVATIVES
As of September 30, 2014 and December 31, 2013, derivative activity consists of the following:
| Fair Value As of | ||||||||||
| (In thousands) | Balance Sheet Classification |
September 30, 2014 | December 31, 2013 | |||||||
| Derivatives designated as hedges: |
||||||||||
| Interest rate swaps |
Accounts payable and other current liabilities | $ | (351 | ) | $ | — | ||||
| Interest rate swaps |
Accumulated other comprehensive loss | $ | 351 | $ | — | |||||
| Derivatives not designated as hedges: |
||||||||||
| Interest rate swaps |
Accounts payable and other current liabilities | $ | (937 | ) | $ | — | ||||
| Foreign currency hedges |
Accounts payable and other current liabilities | $ | (143 | ) | $ | — | ||||
| Nine Months Ended September 30, |
||||||||||
| (In thousands) | Statement of Operations Classification |
2014 | 2013 | |||||||
| Derivatives not designated as hedges: |
||||||||||
| Interest rate swaps |
Interest expense, net | $ | 937 | $ | — | |||||
| Foreign currency hedges |
Loss on foreign currency exchange | $ | 143 | $ | — | |||||
F-24
Table of Contents
As part of the Company’s risk management strategy, the Company has entered into interest rate swaps and foreign currency hedges to mitigate interest rate and foreign currency exposure. Financial instruments are not utilized for speculative purposes. If the Company elects to do so and if the instrument meets the criteria specified in ASC 815, Derivatives and Hedging, management designates its derivative instruments as cash flow hedges. The Company enters into interest rate swap agreements in order to hedge the variability of expected future cash interest payments. Currency swaps are used to reduce risks arising from the change in fair value of certain foreign currency denominated assets and liabilities. The objective of these practices is to minimize the impact of foreign currency fluctuations on operating results.
In September 2014, the Company, entered into an interest rate swap agreement with its lenders to hedge floating rate debt under the Term Loan. The interest rate swap qualifies for hedge accounting and was designated as a cash flow hedge. Under the interest rate swap agreement, the Company pays the fixed rate and the financial institution counterparties to the agreements pay the Company a floating interest rate. The amount recorded in the consolidated balance sheet represents the estimated fair value of the net amount that the Company would settle on September 30, 2014, if the agreements were transferred to other third parties or canceled by the Company. The effective portion of the change in fair value of this cash flow hedge as of September 30, 2014 was a loss of $351. This was recorded to accumulated other comprehensive income (loss) and no amounts were reclassified into earnings for the nine months ended September 30, 2014. This amount is expected to be recognized in earnings over the next 12 months. There was no material ineffectiveness during the nine months ended September 30, 2014.
As of September 30, 2014, the project entities in the California Public Institution project portfolio are party to six interest rate swap instruments that are economic hedges. These instruments are used to hedge floating rate debt. Under the interest rate swap agreements, the project entities pay a fixed rate and the financial institution counterparties to the agreements pay the project entities a floating interest rate. The combined notional value of the six interest rate swap instruments at September 30, 2014 and December 31, 2013 was $17,055. The amounts recorded in the consolidated balance sheet, as provided in the table above, represent the estimated fair value of the net amount that would settle on the balance sheet date if the swaps were transferred to other third parties or canceled by us. Because these hedges are deemed economic hedges and not accounted for under hedge accounting, the changes in fair value are recorded in the consolidated statement of operations, as provided in the table above.
In September 2014, the Company, entered into a series of foreign currency hedges in order to hedge its exposure to foreign currency fluctuations. The combined notional value of the British pound and Canadian dollar hedges at September 30, 2014 was GBP 17.8 million and CAD 21.0 million, respectively. The settlement of these hedges occurs on a quarterly basis through July 2016. The amounts recorded in the consolidated balance sheet, as provided in the table above, represent the estimated fair value of the net amount that would settle on the balance sheet date if the swaps were transferred to other third parties or canceled by us. Because these hedges are deemed economic hedges and not accounted for under hedge accounting, the changes in fair value are recorded in the consolidated statement of operations, as provided in the table above.
10. FAIR VALUE OF FINANCIAL INSTRUMENTS
The Company performs fair value measurements in accordance with ASC 820. ASC 820 defines fair value as the price that would be received from selling an asset or paid to transfer a liability in an orderly transaction between market participants at the measurement date. When determining the fair value measurements for assets and liabilities required to be recorded at their fair values, the Company
F-25
Table of Contents
considers the principal or most advantageous market in which it would transact and consider assumptions that market participants would use when pricing the assets or liabilities, such as inherent risk, transfer restrictions and risk of nonperformance.
ASC 820 establishes a fair value hierarchy that requires an entity to maximize the use of observable inputs and minimize the use of unobservable inputs when measuring fair value. An asset’s or a liability’s categorization within the fair value hierarchy is based upon the lowest level of input that is significant to the fair value measurement. ASC 820 establishes three levels of inputs that may be used to measure fair value:
| • | Level 1: quoted prices in active markets for identical assets or liabilities; |
| • | Level 2: inputs other than Level 1 that are observable, either directly or indirectly, such as quoted prices in active markets for similar assets or liabilities, quoted prices for identical or similar assets or liabilities in markets that are not active, or other inputs that are observable or can be corroborated by observable market data for substantially the full term of the assets or liabilities; or |
| • | Level 3: unobservable inputs that are supported by little or no market activity and that are significant to the fair values of the assets or liabilities. |
For cash and cash equivalents, restricted cash, accounts receivable, VAT receivable, accounts payable and other current liabilities, the carrying amount approximates fair value because of the short-term maturity of those instruments. The fair value of the Company’s long-term debt is classified as Level 2 and was determined using a discounted cash flow approach using market rates for similar debt instruments. The carrying amount and estimated fair value of the Company’s long-term debt as of September 30, 2014 and December 31, 2013 are as follows:
| As of September 30, 2014 | As of December 31, 2013 | |||||||||||||||
| (In thousands) | Carrying Amount | Fair Value | Carrying Amount | Fair Value | ||||||||||||
| Liabilities: |
||||||||||||||||
| Long-term debt, including current portion |
$ | 1,304,034 | $ | 1,366,156 | $ | 437,280 | $ | 443,067 | ||||||||
Recurring Fair Value Measurements
The following table summarizes the financial instruments measured at fair value on a recurring basis classified in the fair value hierarchy (Level 1, 2 or 3) based on the inputs used for valuation in the accompanying consolidated balance sheet:
| (In thousands) | As of September 30, 2014 | As of December 31, 2013 | ||||||||||||||||||||||
| Level 1 | Level 2 | Level 3 | Level 1 | Level 2 | Level 3 | |||||||||||||||||||
| Assets (Liabilities) |
||||||||||||||||||||||||
| Interest rate swaps |
$ | — | $ | (1,288 | ) | $ | — | $ | — | $ | — | $ | — | |||||||||||
| Foreign currency hedges |
— | (143 | ) | — | — | — | — | |||||||||||||||||
| Regulus warrant |
— | — | (6,494 | ) | — | — | — | |||||||||||||||||
|
|
|
|
|
|
|
|
|
|
|
|
|
|||||||||||||
| Total |
$ | — | $ | (1,431 | ) | $ | (6,494 | ) | $ | — | $ | — | $ | — | ||||||||||
|
|
|
|
|
|
|
|
|
|
|
|
|
|||||||||||||
The Company’s interest rate swaps and foreign currency hedges are classified as Level 2 since all significant inputs are observable for similar instruments. The fair value is determined based on observable market prices for forward currencies and interest rates. The Regulus warrant is valued using Level 3 inputs. The fair value is based on unobservable inputs, including a cash flow forecast for the project and a market discount rate to determine the fair value of the asset as of the planned sale
F-26
Table of Contents
date. There were no transfers between Level 1, Level 2 and Level 3 financial instruments during the nine months ended September 30, 2014. The Company held no financial instruments measured at fair value during the nine months ended September 30, 2013.
11. STOCKHOLDER’S EQUITY
On January 15, 2014, at formation, the Company authorized 1,000 shares of common stock. On January 29, 2014, the Company amended and restated its certificate of incorporation to authorize 500,000 shares of Class A common stock, par value $0.01 per share, of which 250,000 shares were issued to SunEdison at par value and 10,942 restricted shares were issued to certain individuals, all of which were outstanding at September 30, 2014. In addition, the Company authorized 500,000 shares of Class B common stock, par value $0.01 per share, of which 250,000 shares were issued to SunEdison at par value and were outstanding at September 30, 2014. Further, the Company authorized 100,000 shares of Class C common stock, par value $0.01 per share, of which 41,765 shares were issued to certain members of management and executive officers.
Each share of Class A and Class C common stock entitles the holder to one vote per share on all matters. Each share of Class B common stock entitles the holder to ten votes per share. Holders of the Company’s Class B common stock do not have any right to receive dividends. Shares of Class B common stock can be redeemed at a price per share equal to par value upon the exchange of Class B Units of the Company for shares of the Company’s Class A common stock. Shares of Class B common stock may not be transferred, except to SunEdison or a controlled affiliate of SunEdison, so long as an equivalent number of Class B units are transferred to the same person.
The Company also authorized 100,000 shares of preferred stock, par value $0.01 per share. No shares of preferred stock have been issued.
Effective upon the filing of the Company’s amended and restated certificate of incorporation immediately prior to the completion of the IPO, the Company retired all of the outstanding shares of Class A common stock held by SunEdison, effected a 127.1624-for-one stock split of the remaining outstanding shares of the Company’s Class A common stock and a 262.8376-for-one stock split of the outstanding shares of its Class B common stock, and converted all outstanding shares of Class C common stock into shares of Class A common stock on a 85.8661-for-one basis.
The Company’s amended and restated certificate of incorporation also authorized 260,000,000 shares of Class B1 common stock, par value $0.01 per share. Each share of Class B1 common stock entitles the holder to one vote per share. Holders of the Company’s Class B1 common stock do not have any right to receive dividends. Shares of Class B1 common stock are can be redeemed at a price per share equal to par value upon the exchange of Class B1 Units of the Company for shares of the Company’s Class A common stock.
Initial Public Offering
On July 23, 2014, the Company completed its IPO by issuing 20,065,000 shares of its Class A common stock at a price of $25.00 per share (the “IPO Price”) for aggregate gross proceeds of $501.6 million. In addition, the underwriters exercised in full their option to purchase an additional 3,009,750 shares of Class A common stock at the IPO Price for aggregate gross proceeds of $75.2 million. Concurrently with the IPO, the Company sold an aggregate of 2,600,000 shares of its Class A common stock at the IPO Price to Altai Capital Master Fund, Ltd. (“Altai”) and Everstream Opportunities Fund I, LLC (“Everstream”) (the “Private Placements”), for aggregate gross proceeds of $65.0 million. In addition, on July 23, 2014, as consideration for the acquisition of the Mt. Signal project from Silver Ridge Partners, LLC (“SRP”) at an aggregate purchase price of $292.0 million, the Company issued to
F-27
Table of Contents
SRP 5,840,000 Class B units (and the Company issued a corresponding number of shares of Class B common stock) and 5,840,000 Class B1 units (and the Company issued a corresponding number of shares of Class B1 common stock). SRP distributed the Class B shares and units to SunEdison and the Class B1 shares and units to R/C US Solar Investment Partnership, L.P. (“Riverstone”), the owners of SRP. Following the IPO, the Company owns 30.3% of the Terra LLC and consolidates the results of the Terra LLC through its controlling interest, with SunEdison’s 63.9% interest and Riverstone’s 5.8% interest shown as non-controlling interests.
The Company received net proceeds of $463.9 million from the sale of the Class A common stock after deducting underwriting discounts, commissions, structuring fees, and offering expenses. The Company received net proceeds of $69.6 million from the underwriters’ exercise of their option to purchase an additional 3,009,750 shares of Class A common stock, after deducting underwriting discounts, commissions, and structuring fees, which was used to purchase Class B common stock from SunEdison. The Company also received net proceeds of $65.0 million from the Private Placements. The Company used $159.2 million of net proceeds to repurchase Class B common stock and Class B1 units from SunEdison.
Subsequent to the IPO, the following shares of the Company were outstanding:
| Shares: | Number Outstanding | Holders | ||||
| Class A common stock |
23,074,750 | Public | ||||
| Restricted Class A common stock |
1,800,000 | Altai | ||||
| Restricted Class A common stock |
800,000 | Everstream | ||||
| Restricted Class A common stock |
4,977,586 | Executive officers and management | ||||
| Class B common stock |
64,526,654 | SunEdison | ||||
| Class B1 common stock |
5,840,000 | Riverstone | ||||
|
|
|
|||||
| Total shares outstanding |
101,018,990 | |||||
|
|
|
|||||
12. STOCK-BASED COMPENSATION
In April 2014, the Company adopted the 2014 Second Amended and Restated Long-Term Incentive Plan (“2014 Plan”), which permits the Company to issue an aggregate of 8,586,614 shares of Class A common stock pursuant to equity awards including incentive and nonqualified stock options, restricted stock awards (“RSAs”) and restricted stock units (“RSUs”) to employees and directors. RSAs provide the holder with immediate voting rights, but are restricted in all other respects until vested. Upon cessation of services to the Company, any unvested RSAs will be canceled. All unvested RSAs are paid dividends and distributions. The Company measures the fair value of RSAs and RSUs at the grant date fair value of Class A common stock and accounts for stock-based compensation expense by amortizing the fair value on a straight line basis over the related vesting period less estimated forfeitures.
In 2014, the Company made grants of 4,977,586 RSAs to certain executives and an affiliate of the Company. In connection with the IPO, the Company granted 411,147 RSUs to employees. Subsequent to the IPO, the Company granted 388,750 RSUs and 150,000 stock options to new hires. The stock-based compensation expense related to issued stock options, RSAs, and RSUs is recorded as a component of general and administrative expenses in the Company’s consolidated statements of operations and totaled $1.6 million for the nine months ended September 30, 2014.
F-28
Table of Contents
Restricted Class C Awards
On January 31, 2014 and February 20, 2014, the Company granted 27,647 and 14,118 shares of restricted Class C common stock, respectively (or 2,373,946 and 1,212,228 shares, respectively, of restricted Class A common stock after giving effect to conversion of restricted Class C common stock to restricted Class A common stock on an 85.8661-for-one basis immediately prior to the completion of the IPO), under the SunEdison Yieldco, Inc. 2014 Plan.
For the restricted Class C common stock converted to unvested, restricted Class A common stock in connection with the IPO, 25% of the unvested, restricted Class A common stock will vest on the first anniversary of the date of the grant, 25% will vest on the second anniversary of the date of the grant, and 50% will vest on the third anniversary of the date of grant, subject to accelerated vesting upon certain events. Under certain circumstances upon a termination of employment, any unvested shares of unvested, restricted Class A common stock held by the terminated executive will be forfeited.
Restricted Class A Awards
On January 29, 2014 and February 20, 2014, the Company granted 7,193 and 3,749 shares of restricted Class A common stock, respectively (or 914,679 and 476,732 shares, respectively, after giving effect to the 127.1624-for-one stock split), to certain individuals under the 2014 Incentive Plan.
The following table summarizes restricted stock awards activity under the 2014 Plan for the nine months ended September 30, 2014, after giving effect to both the conversion of restricted Class C common stock to restricted Class A common stock on an 85.8661-for-one basis and the 127.1624-for-one Class A common stock split immediately prior to the completion of the IPO:
| Number of RSAs Outstanding |
Weighted Average Grant Date Fair Value Per Share |
|||||||
| Balance at January 1, 2014 |
— | $ | — | |||||
| Granted |
4,977,586 | $ | 0.57 | |||||
|
|
|
|||||||
| Balance at September 30, 2014 |
4,977,586 | $ | 0.57 | |||||
|
|
|
|||||||
The amount of stock compensation expense related to the restricted Class C common stock awards, which were converted to restricted Class A awards in connection with the IPO, was $0.4 million during the nine months ended September 30, 2014. As of September 30, 2014, $1.6 million of total unrecognized compensation cost related to these awards is expected to be recognized over a period of approximately 3 years. The fair value of restricted stock on the date of grant was $58.00 per share (or $0.68 per share after giving effect to conversion of Class C restricted common stock to Class A common stock on an 85.8661-for-one basis upon the closing of the IPO) or $2.4 million total.
The amount of stock compensation expense related to the Class A restricted common stock awards, which was recognized upon the completion of the IPO, was $0.4 million. The restriction of these awards expires over three years; however, the awards are not subject to forfeiture for any reason. There is no unrecognized stock compensation expense related to the restricted Class A common stock at September 30, 2014. The fair value of Class A common stock on the date of grant was $37.00 per share (or $0.29 per share after giving effect to the 127.1624-for-one stock split) or $0.4 million.
In estimating the fair value of the Company’s Class C restricted common stock and Class A restricted common stock, the primary valuation considerations were an enterprise value determined from an income-based approach using an enterprise value multiple applied to its forward revenue metric and a lack of marketability discount of 15%. The illiquidity discount model used the following
F-29
Table of Contents
assumptions: a time to liquidity event of 6 months; a risk free rate of 3.4%; and volatility of 60% over the time to a liquidity event. Estimates of the volatility of the Company’s Class A common stock were based on available information on the volatility of Class A common stock of comparable publicly traded companies.
Restricted Stock Units
The following table presents information regarding outstanding RSUs as of September 30, 2014, and changes during the nine months ended September 30, 2014:
| Number of RSUs Outstanding |
Weighted Average Grant Date Fair Value Per Share |
|||||||
| Balance at January 1, 2014 |
— | $ | — | |||||
| Granted |
799,897 | $ | 27.43 | |||||
|
|
|
|||||||
| Balance at September 30, 2014 |
799,897 | $ | 27.43 | |||||
|
|
|
|||||||
The amount of stock compensation expense related to RSUs was $0.7 million during the nine months ended September 30, 2014. As of September 30, 2014, $17.9 million of total unrecognized compensation cost related to RSUs is expected to be recognized over a period of approximately 3 years.
Options
The following table presents information regarding outstanding options as of September 30, 2014, and changes during the nine months ended September 30, 2014:
| Number of Options Outstanding |
Weighted Average Exercise Price Per Share |
Aggregate Intrinsic Value |
||||||||||
| Balance at January 1, 2014 |
— | $ | — | |||||||||
| Granted |
150,000 | $ | 29.31 | |||||||||
|
|
|
|||||||||||
| Balance at September 30, 2014 |
150,000 | $ | 29.31 | $ | — | |||||||
|
|
|
|||||||||||
The amount of stock compensation expense related to options was inconsequential during the nine months ended September 30, 2014. As of September 30, 2014, $2.1 million of total unrecognized compensation cost related to options is expected to be recognized over a period of approximately four years.
13. LOSS PER SHARE
Basic earnings (loss) per share is computed by dividing net income (loss) by the number of weighted-average Class A common shares outstanding during the period. Diluted earnings (loss) per share is computed using the weighted-average Class A common shares outstanding and, if dilutive, potential Class A common shares outstanding during the period. Potential Class A common shares represent the incremental Class A common shares issuable for restricted stock units and stock option exercises. The Company calculates the dilutive effect of outstanding restricted stock units and stock options on earnings (loss) per share by application of the treasury stock method. The computations of basic and diluted earnings (loss) per share assumes that the number of Class A common shares outstanding for all periods prior to the closing of the IPO on July 23, 2014 was equal to the historical number of shares outstanding during each period.
F-30
Table of Contents
Weighted Average Number of Shares
| Nine Months Ended September 30, 2014 |
||||
| Weighted average number of shares: |
||||
| Class A common stock—Basic and Diluted |
27,066 | |||
|
|
|
|||
Class A Common Stock
Basic and diluted loss per share for the nine months ended September 30, 2014 was calculated as follows:
| Nine Months Ended September 30, 2014 |
||||||||
| In thousands, except per share amounts | Basic | Diluted * | ||||||
| EPS Numerator: |
||||||||
| Net loss attributable to Class A Common stock shareholders |
$ | (4,014 | ) | $ | (4,014 | ) | ||
| Less: dividends declared on Class A Common stock |
— | — | ||||||
|
|
|
|
|
|||||
| Net loss available to Class A Common stock shareholders |
(4,014 | ) | (4,014 | ) | ||||
|
|
|
|
|
|||||
| EPS Denominator: |
||||||||
| Weighted-average shares outstanding |
27,066 | 27,066 | ||||||
|
|
|
|
|
|||||
| Earnings (loss) per share |
$ | (0.15 | ) | $ | (0.15 | ) | ||
|
|
|
|
|
|||||
| * | The computations for diluted loss per share for the nine months ended September 30, 2014 excludes approximately 64.5 million shares of convertible Class B common stock, 5.8 million shares of convertible Class B1 common stock, 3.6 million RSAs, 0.8 million RSUs and 0.2 million options to purchase the Company’s shares because the effect would have been anti-dilutive. |
14. COMMITMENTS AND CONTINGENCIES
From time to time, the Company is notified of possible claims or assessments arising in the normal course of business operations. Management continually evaluates such matters with legal counsel and believes that, although the ultimate outcome is not presently determinable, these matters will not result in a material adverse impact on the Company’s financial position or operations. Management is not currently aware of any matters that will have a material adverse effect on the financial position, results of operations, or cash flows of the Company.
15. RELATED PARTIES
Corporate Allocations
General and administrative affiliate costs include amounts allocated from SunEdison for general corporate overhead costs attributable to the operations of the Predecessor through the completion of the IPO on July 23, 2014. Subsequent to the completion of the IPO, general and administrative affiliate costs represent costs incurred by SunEdison for services provided pursuant to the management services agreement (the “MSA”). General and administrative affiliate costs were $8.8 million during the nine months ended September 30, 2014 and were $3.6 million during the nine months ended September 30, 2013. The general corporate overhead expenses incurred by SunEdison included costs from certain corporate and shared services functions provided by SunEdison. The amounts reflected included (i) charges that were incurred by SunEdison that were specifically identified as being attributable to the Predecessor and (ii) an allocation of applicable remaining general corporate overhead costs based on the proportional level of effort attributable to the operation of the Company’s
F-31
Table of Contents
solar energy systems. These costs include legal, accounting, tax, treasury, information technology, insurance, employee benefit costs, communications, human resources, and procurement. Corporate costs that were specifically identifiable to a particular operation of SunEdison were allocated to that operation, including the Predecessor. Where specific identification of charges to a particular operation of SunEdison was not practicable, an allocation was applied to all remaining general corporate overhead costs. The allocation methodology for all remaining corporate overhead costs was based on management’s estimate of the proportional level of effort devoted by corporate resources that is attributable to each of the Company’s operations. The cost allocations were determined on a basis considered to be a reasonable reflection of all costs of doing business by the Predecessor. The amounts that would have been or will be incurred on a stand-alone basis could differ from the amounts allocated due to economies of scale, management judgment, or other factors.
Management Services Agreement
Immediately prior to the completion of the IPO on July 23, 2014, Terra LLC and Terra Operating LLC entered into the MSA with SunEdison. Pursuant to the MSA, SunEdison agreed to provide or arrange for other service providers to provide management and administrative services including legal, accounting, tax, treasury, information technology, insurance, employee benefit costs, communications, human resources, and procurement to the Company and its subsidiaries. As consideration for the services provided, the Company will pay SunEdison a base management fee as follows: (1) no fee for the remainder of 2014, (ii) 2.5% of the Company’s cash available for distribution in 2015, 2016, and 2017 (not to exceed $4.0 million in 2015, $7.0 million in 2016 or $9.0 million in 2017), and (iii) an amount equal to SunEdison’s or other service provider’s actual cost in 2018 and thereafter.
There was no cash consideration paid to SunEdison for these services for the period from July 24, 2014 through September 30, 2014. Total actual costs for these services during the period from July 24, 2014 to September 30, 2014 of $5.1 million is reflected in the consolidated statement of operations as affiliate costs and have been treated as an equity contribution from SunEdison.
Interest Payment Agreement
Immediately prior to the completion of the IPO on July 23, 2014, Terra LLC and Terra Operating LLC entered into an interest payment agreement (the “Interest Payment Agreement”) with SunEdison and its wholly owned subsidiary, SunEdison Holdings Corporation, pursuant to which SunEdison has agreed to pay all of the scheduled interest on the Term Loan through the third anniversary of Terra LLC and Terra Operating LLC entering into the Term Loan, up to an aggregate of $48.0 million over such period (plus any interest due on any payment not remitted when due). SunEdison will not be obligated to pay any amounts payable under the Term Loan in connection with an acceleration of the indebtedness thereunder. Any amounts payable by SunEdison under the Interest Payment Agreement that are not remitted when due will remain due (whether on demand or otherwise) and interest will accrue on such overdue amounts at a rate per annum equal to the interest rate then applicable under the Term Loan. In addition, Terra LLC will be entitled to set off any amounts owing by SunEdison pursuant to the Interest Payment Agreement against any and all sums owed by Terra LLC to SunEdison under the distribution provisions of the amended and restated operating agreement of Terra LLC, and Terra LLC may pay such amounts to Terra Operating LLC. Interest expense incurred under the term loan will be reflected in the consolidated statement of operations and the reimbursement for such costs will be treated as an equity contribution in additional paid-in capital from SunEdison. During the period from July 24, 2014 to September 30, 2014, the Company received $1.5 million equity contribution from SunEdison pursuant to the Interest Payment Agreement. There were no amounts outstanding as of September 30, 2014.
F-32
Table of Contents
Incentive Revenue
Certain Solar Renewable Energy Certificates (SRECs) are sold to SunEdison under contractual arrangements at fixed prices. Revenue from the sale of SRECs to affiliates was $774 during the nine months ended September 30, 2014 and $746 during the same period in 2013.
Operations and Maintenance
Operations and maintenance services are provided to the Company by affiliates of SunEdison pursuant to contractual agreements. Costs incurred for these services were $3,911 for the nine months ended September 30, 2014 and $478 during the same period in 2013, and are reported as cost of operations-affiliates in the consolidated statements of operations.
SunEdison and Affiliates
Certain of the Company’s expenses and capital expenditures related to construction in process are paid by affiliates of SunEdison and are reimbursed by the Company to the same, or other affiliates of SunEdison. As of September 30, 2014 and December 31, 2013, the Company owed SunEdison and affiliates $1,507 and $82,051, respectively.
Incentive Distribution Rights
Incentive Distribution Rights (“IDRs”) represent the right to receive increasing percentages (15.0%, 25.0% and 50.0%) of Terra LLC’s quarterly distributions after the Class A Units, Class B Units, and Class B1 Units of Terra LLC have received quarterly distributions in an amount equal to $0.2257 per unit (the “Minimum Quarterly Distribution”) and the target distribution levels have been achieved. Upon the completion of the IPO, SunEdison holds 100% of the IDRs.
Initial IDR Structure
If for any quarter:
| • | Terra LLC has made cash distributions to the holders of its Class A units, Class B1 units and, subject to the Distribution Forbearance Provisions, Class B units in an amount equal to the Minimum Quarterly Distribution; and |
| • | Terra LLC has distributed cash to holders of Class A units and holders of Class B1 units in an amount necessary to eliminate any arrearages in payment of the Minimum Quarterly Distribution; |
then Terra LLC will make additional cash distributions for that quarter among holders of its Class A units, Class B units, Class B1 units and the IDRs in the following manner:
| • | first, to all holders of Class A units, Class B1 units and, subject to the Distribution Forbearance Provisions, Class B units, pro rata, until each holder receives a total of $0.3386 per unit for that quarter (the “First Target Distribution”) (150.0% of the Minimum Quarterly Distribution); |
| • | second, 85.0% to all holders of Class A units, Class B1 units and, subject to the Distribution Forbearance Provisions, Class B units, pro rata, and 15.0% to the holders of the IDRs, until each holder of Class A units, Class B1 units and, subject to the Distribution Forbearance Provisions, Class B units receives a total of $0.3950 per unit for that quarter (the “Second Target Distribution”) (175.0% of the Minimum Quarterly Distribution); |
| • | third, 75.0% to all holders of Class A units, Class B1 units and, subject to the Distribution Forbearance Provisions, Class B units, pro rata, and 25.0% to the holders of the IDRs, until |
F-33
Table of Contents
| each holder of Class A units, Class B1 units and, subject to the Distribution Forbearance Provisions, Class B units receives a total of $0.4514 per unit for that quarter (the “Third Target Distribution”) (200.0% of the Minimum Quarterly Distribution); and |
| • | thereafter, 50.0% to all holders of Class A units, Class B1 units and, subject to the Distribution Forbearance Provisions, Class B units, pro rata, and 50.0% to the holders of the IDRs. |
16. SEGMENT REPORTING
The Company has one reportable segment that operates a portfolio of solar energy generation assets. The Company operates as a single reportable segment based on a “management” approach. This approach designates the internal reporting used by management for making decisions and assessing performance as the source of the reportable segments. Corporate expenses include general and administrative expenses, acquisition costs, formation and offering related fees and expenses, interest expense on corporate indebtedness and stock based compensation. All operating revenues for 2014 and 2013 were from customers in the United States (“US”) and its unincorporated territories, Canada, the United Kingdom (“UK”) and Chile.
The following table reflect summarized financial information concerning the Company’s reportable segment for the nine months ended September 30, 2014 and 2013:
| Nine Months Ended September 30, 2014 |
Nine Months Ended September 30, 2013 |
|||||||||||||||||||||||
| Solar Energy | Corporate | Total | Solar Energy | Corporate | Total | |||||||||||||||||||
| Operating revenues |
$ | 83,298 | $ | — | $ | 83,298 | $ | 13,039 | $ | — | $ | 13,039 | ||||||||||||
| Depreciation and accretion |
21,053 | — | 21,053 | 3,542 | — | 3,542 | ||||||||||||||||||
| Interest expense, net |
31,175 | 22,042 | 53,217 | 4,716 | — | 4,716 | ||||||||||||||||||
| Income tax provision (benefit) |
— | (4,069 | ) | (4,069 | ) | — | (60 | ) | (60 | ) | ||||||||||||||
| Net (loss) income |
23,059 | (41,097 | ) | (18,038 | ) | 3,286 | (3,362 | ) | (76 | ) | ||||||||||||||
Long-lived Assets, Net
Long-lived assets consist of net property, plant and equipment and net intangible assets. The following table is a summary of long-lived assets by geographic area as of September 30, 2014 and December 31, 2013:
| As of September 30, 2014 |
As of December 31, 2013 |
|||||||
| United States and Puerto Rico |
$ | 1,604,644 | $ | 250,927 | ||||
| Chile |
185,047 | 167,313 | ||||||
| United Kingdom |
226,638 | 10,804 | ||||||
| Canada |
120,622 | 912 | ||||||
|
|
|
|
|
|||||
| Total long-lived assets |
2,136,951 | 429,956 | ||||||
|
|
|
|
|
|||||
| Current assets |
428,678 | 106,358 | ||||||
| Other long-term assets |
46,558 | 30,563 | ||||||
|
|
|
|
|
|||||
| Total assets |
$ | 2,612,187 | $ | 566,877 | ||||
|
|
|
|
|
|||||
F-34
Table of Contents
MMA NAFB Power, LLC and Subsidiary
Consolidated Balance Sheets
| March 31, 2014 (Unaudited) |
December 31, 2013 |
|||||||
| Assets |
||||||||
| CURRENT ASSETS |
||||||||
| Restricted cash (Note 2) |
$ | 1,749,218 | $ | 1,948,840 | ||||
| Accounts receivable (Note 4) |
759,233 | 520,316 | ||||||
| Prepaid asset management fees and expenses |
52,177 | 20,082 | ||||||
|
|
|
|
|
|||||
| Total current assets |
2,560,628 | 2,489,238 | ||||||
| RESTRICTED CASH (Note 2) |
3,068,685 | 3,219,201 | ||||||
| PROPERTY AND EQUIPMENT—NET (Note 5) |
97,583,894 | 98,613,326 | ||||||
| DEFERRED FINANCING COSTS—NET (Note 2) |
755,466 | 769,291 | ||||||
|
|
|
|
|
|||||
| TOTAL |
$ | 103,968,673 | $ | 105,091,056 | ||||
|
|
|
|
|
|||||
| Liabilities and Members’ Equity |
||||||||
| CURRENT LIABILITIES |
||||||||
| Accounts payable and accrued liabilities |
$ | 39,000 | $ | 1,910 | ||||
| Interest payable |
736,472 | 740,239 | ||||||
| Due to members (Note 3) |
— | 644,649 | ||||||
| Current portion of long-term debt (Note 7) |
2,043,880 | 2,011,347 | ||||||
|
|
|
|
|
|||||
| Total current liabilities |
2,819,352 | 3,398,145 | ||||||
| ASSET RETIREMENT OBLIGATION (Note 8) |
1,933,573 | 1,901,591 | ||||||
| LONG-TERM DEBT (Note 7) |
41,990,341 | 42,248,078 | ||||||
|
|
|
|
|
|||||
| Total liabilities |
46,743,266 | 47,547,814 | ||||||
| Commitments and contingencies |
||||||||
| MEMBERS’ EQUITY |
57,225,407 | 57,543,242 | ||||||
|
|
|
|
|
|||||
| TOTAL |
$ | 103,968,673 | $ | 105,091,056 | ||||
|
|
|
|
|
|||||
See Notes to Unaudited Consolidated Financial Statements.
F-35
Table of Contents
MMA NAFB Power, LLC and Subsidiary
Consolidated Statements of Operations
(Unaudited)
| For the three months ended March 31, |
||||||||
| 2014 | 2013 | |||||||
| Revenues |
||||||||
| Solar electricity sales (Note 2) |
$ | 154,137 | $ | 162,126 | ||||
| Renewable energy credits (Note 2) |
1,524,038 | 1,669,315 | ||||||
|
|
|
|
|
|||||
| Total revenues |
1,678,175 | 1,831,441 | ||||||
|
|
|
|
|
|||||
| Operating expenses |
||||||||
| Taxes, licenses and fees |
20,543 | 23,870 | ||||||
| Insurance expenses |
25,920 | 20,422 | ||||||
| Professional fees |
39,000 | 521 | ||||||
| Asset management fees (Note 3) |
20,384 | 20,082 | ||||||
| Bank fees |
3,750 | 4,243 | ||||||
| Depreciation (Note 5) |
1,029,432 | 1,029,431 | ||||||
| Accretion expense (Note 8) |
31,982 | 29,918 | ||||||
| Repairs and maintenance |
74,790 | 55,595 | ||||||
|
|
|
|
|
|||||
| Total operating expenses |
1,245,801 | 1,184,082 | ||||||
|
|
|
|
|
|||||
| Income from operations |
432,374 | 647,359 | ||||||
|
|
|
|
|
|||||
| Other (income) expenses |
||||||||
| Interest income |
(88 | ) | (110 | ) | ||||
| Interest expense |
736,472 | 768,503 | ||||||
| Amortization of deferred financing costs (Note 2) |
13,825 | 13,823 | ||||||
|
|
|
|
|
|||||
| Total other (income) expenses |
750,209 | 782,216 | ||||||
|
|
|
|
|
|||||
| Net loss |
$ | (317,835 | ) | $ | (134,857 | ) | ||
|
|
|
|
|
|||||
See Notes to Unaudited Consolidated Financial Statements.
F-36
Table of Contents
MMA NAFB Power, LLC and Subsidiary
Consolidated Statements of Cash Flows
(Unaudited)
| For the three months ended March 31, | ||||||||
| 2014 | 2013 | |||||||
| Operating activities |
||||||||
| Net loss |
$ | (317,835 | ) | $ | (134,857 | ) | ||
| Adjustments to reconcile net loss to net cash provided by operating activities: |
||||||||
| Depreciation and amortization |
1,043,257 | 1,043,254 | ||||||
| Accretion expense |
31,982 | 29,918 | ||||||
| Changes in operating assets and liabilities: |
||||||||
| Increase in accounts receivable |
(238,917 | ) | (309,522 | ) | ||||
| Increase in prepaid asset management fees and expenses |
(32,095 | ) | (15,483 | ) | ||||
| Increase (decrease) in accounts payable and accrued liabilities |
37,090 | (56,193 | ) | |||||
| Decrease in interest payable |
(3,767 | ) | (3,257 | ) | ||||
|
|
|
|
|
|||||
| Net cash provided by operating activities |
519,715 | 553,860 | ||||||
|
|
|
|
|
|||||
| Investing activities |
||||||||
| Decrease in restricted cash |
350,138 | 41,469 | ||||||
|
|
|
|
|
|||||
| Net cash provided by investing activities |
350,138 | 41,469 | ||||||
|
|
|
|
|
|||||
| Financing activities |
||||||||
| Distribution to members |
(644,649 | ) | (400,606 | ) | ||||
| Repayments of long-term debt |
(225,204 | ) | (194,723 | ) | ||||
|
|
|
|
|
|||||
| Net cash used in financing activities |
(869,853 | ) | (595,329 | ) | ||||
|
|
|
|
|
|||||
| Change in cash and cash equivalents |
— | — | ||||||
| Cash and cash equivalents—beginning of period |
— | — | ||||||
|
|
|
|
|
|||||
| Cash and cash equivalents—end of period |
$ | — | $ | — | ||||
|
|
|
|
|
|||||
| Supplementary disclosure of cash flow activities |
||||||||
| Cash paid during the period for interest |
$ | 740,239 | $ | 771,760 | ||||
|
|
|
|
|
|||||
| Distributions due to members |
$ | — | $ | 394,989 | ||||
|
|
|
|
|
|||||
See Notes to Unaudited Consolidated Financial Statements.
F-37
Table of Contents
MMA NAFB Power, LLC and Subsidiary
Notes to Consolidated Financial Statements
(Unaudited)
Note 1—Organization
MMA NAFB Power, LLC (the “Fund”), a Delaware limited liability company, was formed on February 20, 2007. The purpose of the Fund is to invest in a single Project Company, Solar Star NAFB, LLC (“Solar Star”) which built, owns and operates a 14-megawatt solar electric facility (“SEF”) located on the property of Nellis Air Force Base (“Nellis”), Nevada, and placed in service during 2007.
The Fund consists of 50 Class A Investor Member Interests and 50 Class B Managing Member Interests (collectively, the “Members”) as defined within the Amended and Restated Limited Liability Company Operating Agreement (the “LLC Agreement”). Citicorp North America, Inc., Allstate Life Insurance Company and Allstate Insurance Company (collectively the “Investor Members”) purchased the Class A Investor Member Interests, with MMA Solar Fund IV GP, Inc., a wholly-owned subsidiary of SunEdison, Inc., (the “Managing Member” or “SunEd”) owning the Class B Managing Member Interests. On March 28, 2014, all of the Class A Investor Member Interests of the Fund were acquired by the Managing Member for a purchase price of $14,211,392.
Distributions of income, gains, and losses will be allocated 99.99% to the Class A Investor Member Interests and 0.01% to the Class B Managing Member Interests. Cash distributions will be allocated 95% to the Class A Investor Member Interests and 5% to the Class B Managing Member Interests each quarter. In the event the distributable cash exceeds the projected amount in the final base cash forecast for each quarter, the excess distributable cash shall be allocated 70% to the Class A Investor Member Interests and 30% to the Class B Managing Member Interests. The Fund will continue in operation until the earlier of February 20, 2057, or at the dissolution and termination of the Fund in accordance with the provisions of the LLC Agreement.
Note 2—Summary of significant accounting policies
Unaudited interim financial information
The consolidated financial statements as of March 31, 2014 and for the three months ended March 31, 2014 and 2013 included herein have been prepared by the Fund without audit, pursuant to the rules and regulations of the Securities and Exchange Commission (the “SEC”). Certain information and footnote disclosures normally included in financial statements prepared in accordance with U.S. generally accepted accounting principles have been condensed or omitted pursuant to such rules and regulations. However, the Company believes that the disclosures contained herein comply with the requirements of the Securities Exchange Act of 1934, as amended, and are adequate to make the information presented not misleading. The financial statements included herein reflect all adjustments (consisting of normal recurring adjustments) which are, in the opinion of management, necessary for a fair presentation of the financial position, results of operations and cash flows for the interim periods presented. The results of operations for the three months ended March 31, 2014 and 2013 are not necessarily indicative of the results to be anticipated for the entire year ending December 31, 2014. All references to March 31, 2014 or to the three months ended March 31, 2014 and 2013 in the notes to these consolidated financial statements are unaudited.
Basis of presentation
The accompanying consolidated financial statements include the accounts of the Fund and Solar Star. All inter-company accounts, transactions, profits and losses have been eliminated upon consolidation.
F-38
Table of Contents
Use of estimates
The preparation of consolidated financial statements in conformity with accounting principles generally accepted in the United States of America requires management to make estimates and assumptions that affect the reported amounts of assets and liabilities, and disclosure of contingent assets and liabilities at the balance sheet date, and reported amounts of revenues and expenses for the period presented. Actual results could differ from these estimates. The Fund’s significant accounting judgments and estimates include the depreciable lives of property and equipment, the assumptions used in the impairment of long-lived assets, the assumptions used in the calculation of the contractor guarantees, and the amortization of deferred financing costs.
Concentration of credit risk
The Fund maintains its restricted cash balances in bank deposit accounts, which at times, may exceed federally insured limits. The Fund has not experienced any losses in such accounts. The Fund believes it is not exposed to any significant credit risk on its restricted cash accounts.
Solar Star has only two customers: (i) Nellis for sales of electric output, and (ii) Nevada Power for sales of Renewable Energy Credits or Certificates (“RECs”). The Fund believes it is not exposed to any significant credit risk on its accounts receivable from these two customers.
Restricted cash
Restricted cash consists of cash used as collateral for a letter of credit issued to Nevada Power and cash held on deposit in a financial institution that is restricted for use in the day-to-day operations of Solar Star, for payments of principal and interest on the long-term debt, and for distributions to the Fund’s members. Distributions to the Fund’s members are based upon the excess amount of cash available after the payments described above, less cash restricted for the Fund’s debt reserve. Restricted cash includes amounts from the sale of solar power and RECs. A portion of restricted cash classified as long-term represents the minimum debt reserve required to be held by Solar Star (see Note 7).
The short-term restricted cash balance at March 31, 2014 and December 31, 2013 is $1,749,218 and $1,948,840, respectively. The long-term restricted cash balance at March 31, 2014 and 2013 is $3,068,685 and $3,219,201, respectively.
Accounts receivable
Accounts receivable represents amounts due from customers under revenue agreements. The Fund evaluates the collectability of its accounts receivable taking into consideration such factors as the aging of a customer’s account, credit worthiness and historical trends. As of March 31, 2014 and December 31, 2013, the Fund considers accounts receivable to be fully collectible.
Property and equipment
Property and equipment includes the amounts related to the construction of the SEF and are stated at cost, less accumulated depreciation. Depreciation is calculated using the straight-line method over the estimated useful lives of the related assets, which were determined by the Fund to be 30 years.
Impairment of long-lived assets
The Fund regularly monitors the carrying value of property and equipment and tests for impairment whenever events and circumstances indicate that the carrying value of an asset may not
F-39
Table of Contents
be recoverable from the estimated future cash flows expected to result from its use and eventual disposition. In cases where the undiscounted expected future cash flow is less than the carrying value, an impairment loss is recognized equal to an amount by which the carrying value exceeds the fair value of assets. The Fund determines fair value generally by using a discounted cash flow model. The factors considered by the Fund in performing this assessment include current operating results, trends and prospects, the manner in which the property is used, and the effects of obsolescence, demand, competition, and other economic factors. Based on this assessment, no impairment existed at March 31, 2014 and December 31, 2013.
Deferred financing costs
Financing fees are amortized over the term of the loan using the straight-line method. Accounting principles generally accepted in the United States of America require that the effective yield method be used to amortize financing costs; however, the effect of using the straight-line method is not materially different from the results that would have been obtained under the effective yield method. Amortization expense for the three months ended March 31, 2014 and 2013 was $13,825 and $13,823, respectively.
Revenue recognition
Solar electricity sales
Solar Star has entered into a power purchase agreement (“PPA”) whereby the entire electric output of the SEF is sold to Nellis for a period of 20 years. Solar Star recognizes revenue from the sale of electricity in the period that the electricity is generated and delivered to Nellis.
Renewable energy credits
Various state governmental jurisdictions have incentives and subsidies in the form of Environmental Attributes or RECs whereby each megawatt hour of energy produced by a renewable energy source, such as solar photovoltaic modules, equals one REC.
Similar to the PPA, Solar Star has entered into an agreement to sell all RECs generated by this facility for a period of 20 years to Nevada Power. Solar Star has determined that the REC agreement is a performance-based contract and the revenue will be recorded as the RECs are sold to Nevada Power.
Asset retirement obligation
The Fund’s asset retirement obligation relates to leased land upon which the SEF was constructed. The lease requires that, upon lease termination, the leased land be restored to an agreed-upon condition, effectively retiring the energy property. The Fund is required to record the present value of the estimated obligation when the SEF is placed in service. Upon initial recognition of the Fund’s asset retirement obligation, the carrying amount of the SEF was also increased. The asset retirement obligation will be accreted to its future value over a period of 20 years, while the amount capitalized at the COD will be depreciated over its estimated useful life of 30 years. For the three months ended March 31, 2014 and 2013, accretion expense was $31,982 and $29,918, respectively.
Income taxes
The Fund is not a taxable entity for U.S. Federal income tax purposes or for the State of Nevada where it operates. Taxes on the Fund’s operations are borne by its members through the allocation of
F-40
Table of Contents
taxable income or losses. Income tax returns filed by the Company are subject to examination by the Internal Revenue Service for a period of three years. While no income tax returns are currently being examined by the Internal Revenue Service, tax years since 2010 remain open.
Fair value of financial instruments
The Fund maintains various financial instruments recorded at cost in the March 31, 2014 and December 31, 2013 consolidated balance sheets that are not required to be recorded at fair value. For these instruments, the Fund used the following methods and assumptions to estimate the fair value:
| • | Restricted cash, accounts receivable, prepaid asset management fees and expenses, current portion of long-term debt, due to members and accounts payable and accrued liabilities cost approximates fair value because of the short-maturity period; and |
| • | Long-term debt fair value is based on the amount of future cash flows associated with each debt instrument discounted at the current borrowing rate for similar debt instruments of comparable terms. As of both March 31, 2014 and December 31, 2013, the fair value of the Fund’s long-term debt with unrelated parties is approximately 8% greater than its carrying value. |
Subsequent events
The Company evaluated subsequent events through May 23, 2014, the date these unaudited consolidated financial statements were available to be issued. The Company determined that there were no subsequent events that required recognition or disclosure in these unaudited consolidated financial statements.
Note 3—Related-party transactions
Guarantees/indemnifications
The REC agreement required that the Fund maintain a letter of credit or a cash deposit of $1,500,000 which could be drawn on by Nevada Power if Solar Star does not produce the minimum amount of RECs per the agreement. The required amount is reduced by $150,000 on each anniversary of the REC agreement over the 10-year life of the letter of credit. The outstanding balance on the letter of credit was $600,000 as of both March 31, 2014 and December 31, 2013. Cash collateral for securing the letter of credit provided by the Fund as of March 31, 2014 and December 31, 2013 was $600,000 and is included in restricted cash in the accompanying consolidated balance sheets.
Asset management fees
The Managing Member manages the day-to-day operations of the Fund for an annual asset management fee. The asset management fee is adjusted annually for changes to the Consumer Price Index. The Fund incurred $20,384 and $20,082 in asset management fees during the three months ended March 31, 2014 and 2013, respectively. As of March 31, 2014 and December 31, 2013, $20,383 and $20,082 was prepaid to the Managing Member, respectively.
F-41
Table of Contents
Due to members
As of March 31, 2014 and December 31, 2013, amounts due to the Fund’s members were as follows:
| 2014 | 2013 | |||||||
| Due to Managing Member |
$ | — | $ | 130,064 | ||||
| Due to Investor Members |
— | 514,585 | ||||||
|
|
|
|
|
|||||
| Total |
$ | — | $ | 644,649 | ||||
|
|
|
|
|
|||||
Amounts due to members include distributions of $644,649 related to the fourth quarter of 2013 that were paid during the first quarter of 2014.
Note 4—Accounts receivable
As of March 31, 2014 and December 31, 2013, accounts receivable consisted of the following:
| 2014 | 2013 | |||||||
| Renewable energy credits |
$ | 650,235 | $ | 432,902 | ||||
| Solar electricity |
108,998 | 87,414 | ||||||
|
|
|
|
|
|||||
| Total |
$ | 759,233 | $ | 520,316 | ||||
|
|
|
|
|
|||||
Note 5—Property and equipment—net
As of March 31, 2014 and December 31, 2013, property and equipment at cost, less accumulated depreciation consisted of the following:
| 2014 | 2013 | |||||||
| Solar energy facility |
$ | 123,895,312 | $ | 123,895,312 | ||||
| Accumulated depreciation |
(26,311,418 | ) | (25,281,986 | ) | ||||
|
|
|
|
|
|||||
| Total net book value |
$ | 97,583,894 | $ | 98,613,326 | ||||
|
|
|
|
|
|||||
Depreciation expense for the three months ended March 31, 2014 and 2013 was $1,029,432 and $1,029,431, respectively.
Note 6—Performance guaranty liability
The Fund entered into a five-year performance guaranty agreement with the contractor who constructed the SEF. The agreement commenced on January 1, 2008, and was intended to guarantee the performance of the SEF based on specified performance standards. If the aggregate amount of actual kilowatt-hours (“kWh”) generated was less than the aggregate expected amount, then the contractor shall pay the Fund an amount as defined within the agreement. If the aggregate of the actual kWh generated was at least 5% greater than the aggregate of the expected amount, then the Fund shall pay the contractor an amount equal to 50% of the over-performance based on a guaranteed energy price, as defined within the performance guaranty agreement. On August 28, 2013, the Fund entered into a Settlement Agreement and Mutual General Release with the contractor, whereby the Fund paid a total of $642,311 to the contractor, which included a $150,000 consideration to discharge all claims relating to payment or calculation of the over-performance amount.
F-42
Table of Contents
Note 7—Debt
As of March 31, 2014 and December 31, 2013, long-term debt consisted of the following:
| 2014 | 2013 | |||||||
| Term loan paying interest at 6.69%, due in 2027, secured by SEF |
$ | 44,034,221 | $ | 44,259,425 | ||||
| Less current portion of long-term loan |
(2,043,880 | ) | (2,011,347 | ) | ||||
|
|
|
|
|
|||||
| Total long-term debt |
$ | 41,990,341 | $ | 42,248,078 | ||||
|
|
|
|
|
|||||
The Fund’s future annual debt maturities as of March 31, 2014 are as follows:
| 2014 remaining |
$ | 1,786,143 | ||
| 2015 |
2,146,443 | |||
| 2016 |
2,290,535 | |||
| 2017 |
2,444,231 | |||
| 2018 |
2,724,196 | |||
| Thereafter |
32,642,673 | |||
|
|
|
|||
| $ | 44,034,221 | |||
|
|
|
Note 8—Asset retirement obligation
The Fund’s asset retirement obligation relates to leased land upon which the Solar Energy Facility was built.
The following table reflects the changes in the asset retirement obligation for the three months ended March 31, 2014 and 2013:
| 2014 | 2013 | |||||||
| Beginning balance |
$ | 1,901,591 | $ | 1,778,867 | ||||
| Liabilities incurred |
— | — | ||||||
| Liabilities settled during the year |
— | — | ||||||
| Accretion expense |
31,982 | 29,918 | ||||||
|
|
|
|
|
|||||
| Ending balance |
$ | 1,933,573 | $ | 1,808,785 | ||||
|
|
|
|
|
|||||
Note 9—Commitments
Lease agreements
The Fund leases the ground space at Nellis for 20 years under a long-term non-cancelable operating lease agreement. The lease expires on January 1, 2028, and does not provide for any renewal option. The total rent for the entire lease term is $10.
Renewable energy credit agreement
Solar Star entered into an agreement with Nevada Power to sell RECs generated from the facility for 20 years at a rate of $83.10 per 1,000 delivered RECs for the first year, and increasing by 1% annually.
The agreement requires Solar Star to deliver a minimum amount of RECs each contract year. If this requirement is not met and an arrangement for replacement of the RECs is not entered into, Solar Star is required to pay for the replacement costs of the RECs not delivered.
F-43
Table of Contents
Note 10—Contingencies
From time to time, the Fund is notified of possible claims or assessments arising in the normal course of business operations. Management continually evaluates such matters with legal counsel and believes that, although the ultimate outcome is not presently determinable, these matters will not result in a material adverse impact on the Fund’s consolidated financial position or operations.
F-44
Table of Contents
BALANCE SHEETS
(UNAUDITED)
| March 31, 2014 |
December 31, 2013 |
|||||||
| CURRENT ASSETS |
||||||||
| Cash and cash equivalents |
$ | 1,467,286 | $ | 1,157,231 | ||||
| Accounts receivable |
179,084 | 140,860 | ||||||
| Prepaid and other current assets |
89,427 | 58,807 | ||||||
|
|
|
|
|
|||||
| Total current assets |
1,735,797 | 1,356,898 | ||||||
|
|
|
|
|
|||||
| PROPERTY AND EQUIPMENT, net |
16,503,836 | 16,636,832 | ||||||
|
|
|
|
|
|||||
| OTHER ASSETS |
||||||||
| Intercompany receivable |
— | 1,000 | ||||||
| Other |
225,437 | 327,234 | ||||||
|
|
|
|
|
|||||
| Total other assets |
225,437 | 328,234 | ||||||
|
|
|
|
|
|||||
| Total assets |
$ | 18,465,070 | $ | 18,321,964 | ||||
|
|
|
|
|
|||||
| CURRENT LIABILITIES |
||||||||
| Accounts payable |
$ | 69,182 | $ | 24,192 | ||||
| Accrued liabilities |
4,853 | 3,772 | ||||||
| Note payable |
8,000 | 8,000 | ||||||
| Note payable to related party |
— | 10,638,391 | ||||||
| Accrued interest on note payable to related party |
— | 8,652,982 | ||||||
|
|
|
|
|
|||||
| Total current liabilities |
82,035 | 19,327,337 | ||||||
|
|
|
|
|
|||||
| OTHER LIABILITIES |
||||||||
| Asset retirement obligation |
219,773 | 216,595 | ||||||
|
|
|
|
|
|||||
| Total other liabilities |
219,773 | 216,595 | ||||||
|
|
|
|
|
|||||
| Total liabilities |
301,808 | 19,543,932 | ||||||
|
|
|
|
|
|||||
| COMMITMENTS AND CONTINGENCIES (NOTE 6) |
||||||||
| EQUITY |
||||||||
| Member’s equity |
21,307,148 | 1,681,010 | ||||||
| Retained deficit |
(3,143,886 | ) | (2,902,978 | ) | ||||
|
|
|
|
|
|||||
| Total equity (deficit) |
18,163,262 | (1,221,968 | ) | |||||
|
|
|
|
|
|||||
| Total liabilities and equity |
$ | 18,465,070 | $ | 18,321,964 | ||||
|
|
|
|
|
|||||
See accompanying notes.
F-45
Table of Contents
STATEMENTS OF OPERATIONS
(UNAUDITED)
| Three Months Ended March 31, |
||||||||
| 2014 | 2013 | |||||||
| POWER SALES |
$ | 470,352 | $ | 489,810 | ||||
| OPERATING EXPENSES |
||||||||
| Project operating expenses |
99,858 | 60,115 | ||||||
| Depreciation |
132,996 | 132,690 | ||||||
| Accretion |
3,178 | — | ||||||
|
|
|
|
|
|||||
| Total operating expenses |
236,032 | 192,805 | ||||||
|
|
|
|
|
|||||
| OPERATING INCOME |
234,320 | 297,005 | ||||||
|
|
|
|
|
|||||
| NON-OPERATING INCOME (EXPENSES) |
||||||||
| Related party interest expense |
(335,765 | ) | (382,932 | ) | ||||
| Interest income |
863 | 871 | ||||||
| Financing costs |
(138,493 | ) | — | |||||
| Interest expense |
(1,833 | ) | (200 | ) | ||||
|
|
|
|
|
|||||
| Total non-operating expenses |
(475,228 | ) | (382,261 | ) | ||||
|
|
|
|
|
|||||
| NET LOSS |
$ | (240,908 | ) | $ | (85,256 | ) | ||
|
|
|
|
|
|||||
See accompanying notes.
F-46
Table of Contents
STATEMENTS OF CHANGES IN MEMBER’S EQUITY
(UNAUDITED)
| Member’s Equity |
Retained Deficit |
Total | ||||||||||
| Balances, January 1, 2013 |
$ | 1,681,010 | $ | (3,174,540 | ) | $ | (1,493,530 | ) | ||||
| Net loss |
— | (85,256 | ) | (85,256 | ) | |||||||
|
|
|
|
|
|
|
|||||||
| Balances, March 31, 2013 |
$ | 1,681,010 | $ | (3,259,796 | ) | $ | (1,578,786 | ) | ||||
|
|
|
|
|
|
|
|||||||
| Balances, January 1, 2014 |
$ | 1,681,010 | $ | (2,902,978 | ) | $ | (1,221,968 | ) | ||||
| Net loss |
— | (240,908 | ) | (240,908 | ) | |||||||
| Conversion of intercompany loan and related accrued interest |
19,626,138 | — | 19,626,138 | |||||||||
|
|
|
|
|
|
|
|||||||
| Balances, March 31, 2014 |
$ | 21,307,148 | $ | (3,143,886 | ) | $ | 18,163,262 | |||||
|
|
|
|
|
|
|
|||||||
See accompanying notes.
F-47
Table of Contents
STATEMENTS OF CASH FLOWS
(UNAUDITED)
| Three Months Ended March 31, |
||||||||
| 2014 | 2013 | |||||||
| CASH FLOWS FROM OPERATING ACTIVITIES |
||||||||
| Net loss |
$ | (240,908 | ) | $ | (85,256 | ) | ||
| Adjustment to reconcile net income to net cash from operating activities: |
||||||||
| Interest expense on related party note payable |
335,765 | 382,932 | ||||||
| Write off of financing costs |
138,493 | — | ||||||
| Depreciation |
132,996 | 132,996 | ||||||
| Accretion |
3,178 | — | ||||||
| Amortization |
1,692 | 1,692 | ||||||
| Changes in: |
||||||||
| Accounts receivable |
(38,224 | ) | (83,091 | ) | ||||
| Prepaid assets |
(30,620 | ) | (31,479 | ) | ||||
| Accounts payable |
44,990 | 6,185 | ||||||
| Accrued liabilities |
1,081 | (7,116 | ) | |||||
|
|
|
|
|
|||||
| Net cash from operating activities |
348,443 | 316,863 | ||||||
|
|
|
|
|
|||||
| CASH FLOWS FROM INVESTING ACTIVITIES |
||||||||
| Purchase of property and equipment |
— | (306 | ) | |||||
| Payments on long-term receivables |
11,844 | — | ||||||
|
|
|
|
|
|||||
| Net cash from investing activities |
11,844 | (306 | ) | |||||
|
|
|
|
|
|||||
| CASH FLOWS FROM FINANCING ACTIVITIES |
||||||||
| Payments on related party note payable |
— | (999,979 | ) | |||||
| Financing costs |
(50,232 | ) | — | |||||
|
|
|
|
|
|||||
| Net cash from financing activities |
(50,232 | ) | (999,979 | ) | ||||
|
|
|
|
|
|||||
| NET INCREASE IN CASH AND CASH EQUIVALENTS |
310,055 | (683,422 | ) | |||||
| CASH AND CASH EQUIVALENTS, beginning of year |
1,157,231 | 1,076,335 | ||||||
|
|
|
|
|
|||||
| CASH AND CASH EQUIVALENTS, end of year |
$ | 1,467,286 | $ | 392,913 | ||||
|
|
|
|
|
|||||
| SUPPLEMENTAL DISCLOSURE OF CASH FLOW INFORMATION |
||||||||
| Cash paid during the period for interest |
$ | 1,500 | $ | — | ||||
|
|
|
|
|
|||||
| NON-CASH INVESTING AND FINANCING ACTIVITIES |
||||||||
| Conversion of intercompany loan and related accrued interest to equity |
$ | 19,626,138 | $ | — | ||||
|
|
|
|
|
|||||
See accompanying notes.
F-48
Table of Contents
NOTES TO FINANCIAL STATEMENTS
(UNAUDITED)
Note 1—Summary of Significant Accounting Policies
Nature of business—CalRENEW-1 LLC (the Company or CR-1) was established on April 7, 2007, as a limited liability company under the Delaware Limited Liability Company Act. The Company owns and operates a 5 megawatt (MW) photovoltaic (PV) solar facility located in Mendota, California. CR-1 sells the electricity to Pacific Gas & Electric Company (PG&E) under a 20-year power purchase and sales agreement, which terminates on April 30, 2030. CR-1 was wholly owned by Meridian Energy USA, Inc. (MEUSA). In August 2009, MEL Solar Holdings Limited (MSHL), a New Zealand limited liability company, purchased 100% of the stock of MEUSA. MSHL is a wholly-owned subsidiary of Meridian Energy Limited, a New Zealand limited liability company and a mixed ownership model company under the Public Finance Act of 1989. On May 15, 2014, the Company was purchased from MEUSA by an affiliate of SunEdison, Inc, as described in Note 7.
Basis of presentation—The unaudited financial statements have been prepared in accordance with accounting principles generally accepted in the United States of America for interim financial information. They do not include all information and footnotes necessary for a fair presentation of the Company’s financial position and the results of operations and cash flows in conformity with U.S. GAAP for complete financial statements. These financial statements should be read in conjunction with the Company’s financial statements and related notes as of December 31, 2013 and 2012, and for the years then ended. In the opinion of management, all adjustments (consisting of normal recurring adjustments and accruals) considered necessary for a fair presentation of the results of operations for the period presented have been included in the interim period. Operating results for the interim periods ended March 31, 2014 and 2013 presented herein are not necessarily indicative of the results that may be expected for the year ending December 31, 2014.
Use of estimates—The preparation of financial statements in conformity with accounting principles generally accepted in the United States of America requires the Company to make estimates and assumptions affecting the reported amounts of assets, liabilities, revenues and expenses, and the disclosure of contingent assets and liabilities. The amounts estimated could differ from actual results.
Cash and cash equivalents—For purposes of the statement of cash flows, the Company defines cash equivalents as all highly liquid instruments purchased with an original maturity of three months or less. From time to time, certain bank accounts that are subject to limited FDIC coverage exceed their insured limits.
Accounts receivable—Accounts receivable are uncollateralized customer obligations due under normal trade terms requiring payment within 30 days from the invoice date. Customer account balances with invoices dated over 30 days are considered delinquent.
Trade accounts receivable are stated at the amount management expects to collect from balances outstanding at year-end. Management establishes an allowance for doubtful customer accounts through a review of historical losses, specific customer balances, and industry economic conditions. Customer accounts are charged off against the allowance for doubtful accounts when management determines that the likelihood of eventual collection is remote. At March 31, 2014 and December 31, 2013, management determined that no allowance for doubtful accounts was considered necessary.
Asset retirement obligations—Accounting standards require the recognition of an Asset Retirement Obligation (ARO), measured at estimated fair value, for legal obligations related to
F-49
Table of Contents
decommissioning and restoration costs associated with the retirement of tangible long-lived assets in the period in which the liability is incurred. The initial capitalized asset retirement costs are depreciated over the life of the related asset, with accretion of the ARO liability classified as an operating expense.
Revenue recognition—The Company recognizes revenue from power sales to PG&E based on the megawatt hours (MWh) provided to PG&E each month at the contracted rates, pursuant to the Power Purchase and Sale Agreement (the Agreement) between PG&E and the CalRENEW-1 LLC.
Concentrations of credit risk—The Company grants credit to PG&E during the normal course of business. The Company performs ongoing credit evaluations of PG&E’s financial condition and generally requires no collateral.
Depreciation lives and methods—Depreciation has been determined by use of the straight-line method over the estimated useful lives of the related assets ranging from 9 to 35 years.
The Company generally capitalizes assets with costs of $1,000 or more as purchases or construction outlays occur.
Income taxes—The Company is taxed as a partnership; accordingly, federal and state taxes related to its income are the responsibility of the members. The Company applies applicable authoritative accounting guidance related to the accounting for uncertain tax positions. The impact of uncertain tax positions would be recorded in the Company’s financial statements only after determining a more-likely-than-not probability that the uncertain tax positions would withstand challenge, if any, from taxing authorities. As facts and circumstances change, the Company would reassess these probabilities and would record any changes in the financial statements as appropriate. Under this guidance, the Company adopted a policy to record accrued interest and penalties associated with uncertain tax positions in income tax expense in the statement of income as necessary. As of March 31, 2014 and December 31, 2013, the Company recognized no accrued interest and penalties associated with uncertain tax positions.
Note 2—Property and Equipment
Property and equipment consists of the following:
| March 31, 2014 |
December 31, 2013 |
|||||||
| Land rights |
$ | 50,000 | $ | 50,000 | ||||
| Solar farm generation assets |
18,464,054 | 18,464,054 | ||||||
| Asset retirement obligation asset |
209,631 | 209,631 | ||||||
|
|
|
|
|
|||||
| Total |
18,723,685 | 18,723,685 | ||||||
| Less: accumulated depreciation |
(2,219,849 | ) | (2,086,853 | ) | ||||
|
|
|
|
|
|||||
| Property and equipment, net |
$ | 16,503,836 | $ | 16,636,832 | ||||
|
|
|
|
|
|||||
F-50
Table of Contents
Note 3—Other Assets
Other assets consist of the following:
| March 31, 2014 |
December 31, 2013 |
|||||||
| Prepaid interconnection costs |
$ | 199,175 | $ | 200,830 | ||||
| Capitalized financing costs |
— | 88,261 | ||||||
| Network upgrade receivable |
11,843 | 23,688 | ||||||
| Security deposit |
10,000 | 10,000 | ||||||
| Prepaid metering fees |
4,419 | 4,455 | ||||||
|
|
|
|
|
|||||
| Total |
$ | 225,437 | $ | 327,234 | ||||
|
|
|
|
|
|||||
Note 4—Notes Payable
Notes payable are summarized as follows:
| March 31, 2014 |
December 31, 2013 |
|||||||
| Note payable to River Ranch LLC, annual installments of $8,000, interest at 5%, matures November 2014, secured by Deed of Trust |
$ | 8,000 | $ | 8,000 | ||||
|
|
|
|
|
|||||
| Related party note payable to Meridian Energy USA, Inc., due on demand, interest at 12.8%, unsecured |
$ | — | $ | 10,638,391 | ||||
|
|
|
|
|
|||||
On March 31, 2014 the Company converted the related party note payable and related accrued interest into equity due to the pending sales transaction discussed in Note 7.
Note 5—Asset Retirement Obligations
The Company completed an asset retirement obligation (ARO) calculation using a layered approach with the assumption that the assets will be in service through the year 2049. The useful life expectations used in the calculations of the ARO are based on the assumption that operations will continue without deviation from historical trends.
As of the balance sheet dates, the ARO capitalized asset and the offsetting ARO liability were established at present value. The ARO asset will be depreciated through 2049 on a straight line basis and the ARO liability will be accreted through 2049 using a discount rate and effective interest method.
The asset retirement obligation consists of the following:
| March 31, 2014 |
December 31, 2013 |
|||||||
| Liability at beginning of period |
$ | 216,595 | $ | 59,721 | ||||
| Accretion expense |
3,178 | 3,584 | ||||||
| Liabilities incurred |
— | 153,290 | ||||||
|
|
|
|
|
|||||
| Liability at end of period |
$ | 219,773 | $ | 216,595 | ||||
|
|
|
|
|
|||||
F-51
Table of Contents
Note 6—Commitments, Contingencies and Concentrations
The Company may be involved from time to time in legal and arbitration proceedings arising in the ordinary course of business. Although the outcomes of legal proceedings are difficult to predict, none of these proceedings is expected to lead to material loss or expenditure in the context of the Company’s results.
The Company operates in the Western United States, particularly California. Should California decide to change the regulatory focus away from renewable energy, the impact could be substantial for the Company.
The Company sells 100% of the electrical output of the CR-1 solar facility to PG&E under a 20-year power purchase and sale agreement which terminates April 30, 2030. This contract is the sole source of the Company’s revenues until further solar projects are developed, constructed and brought into operations.
The Company is engaged in the operation of solar facilities to generate electricity for sale to utilities, municipalities and other customers. Development of such solar facilities is a capital intensive, multi-year effort which includes obtaining land or land rights, interconnection agreements, permits from local authorities, and long-term power sales contracts.
Note 7—Subsequent Events
Subsequent events are events or transactions that occur after the date of the balance sheet but before financial statements are available to be issued. The Company recognizes in the financial statements the effects of all subsequent events that provide additional evidence about conditions that existed at the date of the balance sheet, including the estimates inherent in the process of preparing the financial statements. The Company’s financial statements do not recognize subsequent events that provide evidence about conditions that did not exist at the date of the balance sheet, but arose after such date and before the financial statements are available to be issued. The Company has evaluated subsequent events through May 21, 2014, which is the date the financial statements were available to be issued.
On May 15, 2014 the Company was sold to an affiliate of SunEdison, Inc.
F-52
Table of Contents
CONDENSED BALANCE SHEETS
(IN THOUSANDS, UNAUDITED)
| March 31, 2014 |
December 31, 2013 |
|||||||
| ASSETS |
||||||||
| Current Assets: |
||||||||
| Restricted cash |
$ | 1,867 | $ | 1,540 | ||||
| Prepaid expenses and other current assets |
40 | 84 | ||||||
|
|
|
|
|
|||||
| Total current assets |
1,907 | 1,624 | ||||||
| Property and Equipment, net |
87,600 | 88,356 | ||||||
| Other Assets |
1,840 | 1,840 | ||||||
|
|
|
|
|
|||||
| Total assets |
$ | 91,347 | $ | 91,820 | ||||
|
|
|
|
|
|||||
| LIABILITIES AND MEMBER’S EQUITY |
||||||||
| Current Liabilities: |
||||||||
| Accounts payable and accrued liabilities |
$ | 51 | $ | 4,453 | ||||
| Financing obligation |
1,945 | 1,945 | ||||||
|
|
|
|
|
|||||
| Total current liabilities |
1,996 | 6,398 | ||||||
| Financing Obligation |
73,373 | 73,319 | ||||||
| Commitments and Contingencies (Note 7) |
||||||||
| Member’s Equity |
15,978 | 12,103 | ||||||
|
|
|
|
|
|||||
| Total liabilities and member’s equity |
$ | 91,347 | $ | 91,820 | ||||
|
|
|
|
|
|||||
See accompanying notes.
F-53
Table of Contents
CONDENSED STATEMENTS OF OPERATIONS
(IN THOUSANDS, UNAUDITED)
| Three Months Ended March 31, |
||||||||
| 2014 | 2013 | |||||||
| REVENUES |
||||||||
| Revenue from sale of electricity |
$ | 864 | $ | 67 | ||||
| OPERATING EXPENSES |
||||||||
| Cost of electricity sold |
775 | 76 | ||||||
| Other operating expenses |
268 | 137 | ||||||
|
|
|
|
|
|||||
| Total operating expenses |
1,043 | 213 | ||||||
|
|
|
|
|
|||||
| OPERATING LOSS |
(179 | ) | (146 | ) | ||||
|
|
|
|
|
|||||
| OTHER EXPENSE |
||||||||
| Interest expense |
(348 | ) | (37 | ) | ||||
|
|
|
|
|
|||||
| Total other expense |
(348 | ) | (37 | ) | ||||
|
|
|
|
|
|||||
| NET LOSS |
$ | (527 | ) | $ | (183 | ) | ||
|
|
|
|
|
|||||
See accompanying notes.
F-54
Table of Contents
CONDENSED STATEMENTS OF MEMBER’S EQUITY
(IN THOUSANDS, UNAUDITED)
| TOTAL MEMBER’S EQUITY |
||||
| MEMBER’S EQUITY, JANUARY 1, 2013 |
$ | 23,863 | ||
| Member distributions |
(12,267 | ) | ||
| Net loss |
(183 | ) | ||
|
|
|
|||
| MEMBER’S EQUITY, MARCH 31, 2013 |
$ | 11,413 | ||
|
|
|
|||
| MEMBER’S EQUITY, JANUARY 1, 2014 |
$ | 12,103 | ||
| Member contribution |
4,402 | |||
| Net loss |
(527 | ) | ||
|
|
|
|||
| MEMBER’S EQUITY, MARCH 31, 2014 |
$ | 15,978 | ||
|
|
|
|||
See accompanying notes.
F-55
Table of Contents
CONDENSED STATEMENTS OF CASH FLOWS
(IN THOUSANDS, UNAUDITED)
| Three Months Ended March 31, |
||||||||
| 2014 | 2013 | |||||||
| CASH FLOWS FROM OPERATING ACTIVITIES |
||||||||
| Net loss |
$ | (527 | ) | $ | (183 | ) | ||
| Adjustments: |
||||||||
| Non-cash interest expense |
54 | — | ||||||
| Depreciation |
756 | 76 | ||||||
| Changes in assets and liabilities from operations: |
||||||||
| Prepaid expenses |
44 | (387 | ) | |||||
| Other assets |
— | 127 | ||||||
| Accounts payable and accrued liabilities |
— | (1,896 | ) | |||||
|
|
|
|
|
|||||
| Net cash flow provided by (used in) operating activities |
327 | (2,263 | ) | |||||
|
|
|
|
|
|||||
| CASH FLOWS FROM INVESTING ACTIVITIES |
||||||||
| Purchase of property and equipment |
— | (797 | ) | |||||
|
|
|
|
|
|||||
| Net cash flow (used in) investing activities |
— | (797 | ) | |||||
|
|
|
|
|
|||||
| CASH FLOWS FROM FINANCING ACTIVITIES |
||||||||
| Proceeds from construction loan |
— | 1,654 | ||||||
| Repayment of construction loan |
— | (67,714 | ) | |||||
| Proceeds from sale-leaseback transaction |
— | 90,055 | ||||||
| Payments on financing obligation |
— | (8,804 | ) | |||||
| Member contributions |
4,402 | — | ||||||
| Member distributions |
— | (12,168 | ) | |||||
| Payment of indemnification accrual |
(4,402 | ) | — | |||||
|
|
|
|
|
|||||
| Net cash flow provided by financing activities |
— | 3,023 | ||||||
|
|
|
|
|
|||||
| NET CHANGE IN CASH AND CASH EQUIVALENTS |
327 | (37 | ) | |||||
| CASH AND CASH EQUIVALENTS |
||||||||
| Beginning of period |
1,540 | 104 | ||||||
|
|
|
|
|
|||||
| End of period |
$ | 1,867 | $ | 67 | ||||
|
|
|
|
|
|||||
| SUPPLEMENTAL DISCLOSURE OF CASH FLOW INFORMATION |
||||||||
| Cash paid for interest |
$ | 294 | $ | 37 | ||||
|
|
|
|
|
|||||
| SUPPLEMENTAL DISCLOSURE OF NON-CASH FINANCING ACTIVITY |
||||||||
| Indemnification accrual recorded as discount on financing obligation |
$ | — | $ | (4,402 | ) | |||
|
|
|
|
|
|||||
| Reclassification of intangible asset to property and equipment |
$ | — | $ | 5,508 | ||||
|
|
|
|
|
|||||
See accompanying notes.
F-56
Table of Contents
NOTES TO CONDENSED FINANCIAL STATEMENTS
(IN THOUSANDS, UNAUDITED)
Note 1—Summary of Organization and Significant Accounting Policies
Organization—SPS Atwell Island, LLC (the “Company”) was a wholly-owned subsidiary of Samsung Green Repower, LLC (“SGR”), under Samsung C&T America, Inc. (the “Administrator”). The Company is organized as a limited liability company (LLC) formed to develop and operate a 23.5 megawatt (“MW”) solar photovoltaic facility (the “Solar Facility”) located in Tulare County, CA. On May 16, 2014, the Company was purchased from SGR by an affiliate of SunEdison, Inc., as described in Note 9.
The Solar Facility was in development throughout 2012 and into March 2013. On March 22, 2013, pursuant to a Participation Agreement dated June 28, 2012, the Solar Facility was sold to Atwell Solar Trust 2012 (“Trust/Lessor”) in a sale-leaseback transaction (the “Sale-Leaseback Transaction”) designed to transfer to the Trust/Lessor ownership of the Solar Facility, including certain related tax elements. Under the Sale-Leaseback Transaction, concurrently on March 22, 2013 and in accordance with the Participation Agreement, the Facility Site and Facility Lease Agreement (collectively, the “Facility Lease” and “Facility Lease Agreements”) were executed between Trust/Lessor and the Company.
Under the Facility Lease Agreements, the Company has the duty to operate the Solar Facility in exchange for contractual lease payments owed to the Trust/Lessor and the obligation to perform under a 25-year Power Purchase Agreement (“PPA”) with Pacific Gas and Electric Company (“PG&E”). As discussed in further detail herein, these financial statements present this Facility Lease as a financing event with the Company retaining the Solar Facility asset, recording a financing obligation, recording revenue as it is generated from energy sold to PG&E under the PPA, and recording payments under the Facility Lease as payments allocated between interest and principal. The 25-year term of the PPA commenced in March 2013.
Basis of presentation—The unaudited financial statements have been prepared in accordance with accounting principles generally accepted in the United States of America for interim financial information. They do not include all information and footnotes necessary for a fair presentation of the Company’s financial position and the results of operations and cash flows in conformity with U.S. GAAP for complete financial statements. These financial statements should be read in conjunction with the Company’s financial statements and related notes as of December 31, 2013 and 2012, and for the years then ended. In the opinion of management, all adjustments (consisting of normal recurring adjustments and accruals) considered necessary for a fair presentation of the results of operations for the period presented have been included in the interim period. Operating results for the interim periods ended March 31, 2014 and 2013 presented herein are not necessarily indicative of the results that may be expected for the year ending December 31, 2014. The year 2013 was the first year during which the Company is considered an operating company and is no longer in the development stage.
Use of estimates—The preparation of financial statements in conformity with accounting principles generally accepted in the United States of America requires management to make estimates and assumptions that affect the reported amounts of assets and liabilities and disclosure of contingent assets and liabilities at the date of the balance sheet. Actual results could differ from those estimates.
Project administration agreement—A Project Administration Agreement (the “PAA”) is in place between the Company and the Administrator, which is an affiliate of the Company. The PAA provides for certain administrative services from Administrator to the Company. The PAA covers support services spanning both construction and operating phases of the Project such as bookkeeping, compliance reporting, administration of insurance, and the maintenance of corporate functions for the Company and Trust/Lessor.
F-57
Table of Contents
Concentrations—The Company’s restricted cash balances are placed with high-credit-quality and federally-insured institutions. From time to time, the Company’s restricted cash balances with any one institution may exceed federally-insured limits or may be invested in a non-federally-insured money market account. The Company has not experienced any losses in such accounts and believes it is not exposed to significant credit risk as a result of its restricted cash investment policies.
The Company has a significant concentration of credit risk as the PPA and the related accounts receivable are with one utility, PG&E, in the state of California.
Restricted cash—Pursuant to the terms of the Amended and Restated Depository Agreement entered between the parties to the Facility Lease, all cash owned by the Company is held in restricted accounts that consist of amounts held in trust by a bank to support the Company’s operations and obligations.
Accounts receivable—Accounts receivable consist of amounts owed on revenues generated from operating the Solar Facility.
Property and equipment—At March 31, 2014, property and equipment consists of the Solar Facility. Prior to the COD in March 2013, the Solar Facility was recorded as construction in process. While construction was in process, the Company recorded all costs and expenses related to the development and construction of the facility, including interest cost but excluding administrative expenses, as part of the Solar Facility cost. Upon the COD in March 2013, the Solar Facility asset was placed in service and depreciation commenced using the straight-line method and a 30-year useful life.
Sale-leaseback transaction—The Sale-Leaseback Transaction was executed in March 2013. As the Solar Facility is considered integral property, and based on the continuing involvement provided in the Facility Lease agreements, the Company determined the transaction did not meet accounting qualifications for a sale and that the transaction should be recorded using the finance method. Under the finance method, the Company did not recognize any upfront profit because a sale was not recognized. Rather, the Solar Facility assets remained on the Company books and the full amount of the financing proceeds of $90,055 was recorded as a financing obligation (Note 5).
Indemnification liability—Based on the cash grant the Trust/Lessor received from Treasury, and in accordance with terms defined in Facility Lease agreements, as of March 31, 2013, the Company accrued an indemnification obligation to the Trust/Lessor of $4,402. The Company offset the indemnification liability as a discount on the financing obligation that will increase interest expense as it amortizes. The obligation was paid by the Company in early 2014.
Valuation of long-lived and intangibles—The Company evaluates the carrying value of long-lived assets for possible impairment whenever events or changes in circumstances indicate that the carrying value of an asset may not be recoverable. In general, the Company would recognize an impairment loss when the sum of undiscounted expected cash flows from the asset is less than the carrying amount of such asset. No impairment was evidenced or recorded as of March 31, 2014 or 2013.
Asset retirement obligations—The Company has considered the terms and conditions of the various agreements under which it operates and has concluded that it does not have any legally imposed asset retirement obligation. The Facility Lease agreements require a decommissioning reserve of $60 and the Company designates a portion of restricted cash to fund this decommissioning reserve.
Operating leases—Rents payable under a site lease are charged to operations over the lease term based on the lease payment calculation, which is deemed a methodical and systematic basis.
F-58
Table of Contents
Revenue recognition—The Company earns revenue from the sale of electricity under the 25-year PPA with PG&E. The Company is required to sell all energy and related energy attributes generated by the Solar Facility at specific rates as determined by the PPA. The Company recognizes revenue from the sale of electricity and related energy attributes when the electricity is generated and delivered. The PPA expires in March 2038.
Income taxes—The Company is a limited liability company for federal and state income tax purposes, and is disregarded from its member. The taxable income of the Company is generally included in the income tax returns of the holder of its member interest.
Note 2—Property and Equipment
At March 31, 2014 and December 31, 2013, property and equipment are stated at book value, less accumulated depreciation, and consist of the following:
| March 31, 2014 |
December 31, 2013 |
|||||||
| Solar facility |
$ | 90,621 | $ | 90,621 | ||||
| Construction-in-progress |
— | — | ||||||
|
|
|
|
|
|||||
| Less accumulated depreciation |
(3,021 | ) | (2,265 | ) | ||||
|
|
|
|
|
|||||
| Total |
$ | 87,600 | $ | 88,356 | ||||
|
|
|
|
|
|||||
Depreciation expense for the three month period ended March 31, 2014 and 2013 was $756 and $76, respectively.
Note 3—Solar Facility Rights
The Company was originally a joint venture between SGR and a 50 percent partner. In October 2011, SGR acquired the 50 percent interest and all related assets and rights for $6,000. The Company concluded this was an asset purchase and recorded a Solar Facility Rights intangible asset. In the October 2011 transaction, the Company obtained full interest in rights necessary for the development, financing, installation, construction, operation and ownership of a solar project, including the PPA, interconnection agreement, land lease rights and permits to develop the solar plant. The Solar Facility Rights were not amortized while the Solar Facility was under construction. Upon the March 2013 COD of the Solar Facility, the Solar Facility Rights asset was reclassified to the Solar Facility fixed asset.
Note 4—Construction Loan
In December 2011, the Company entered into a $74,520 construction loan to fund construction of the Solar Facility. The loan incurred interest at specific rates as determined by the loan agreement, was collateralized by all the Company’s assets, and was settled in full, with interest, in March 2013. The construction loan balance was $66,060 at December 31, 2012 and the amount paid off, including accrued interest, in March 2013 was $67,714. Interest accrued on this loan of $1,730 during the construction period, was capitalized as part of the construction-in-progress asset.
Note 5—Financing Obligation
As a result of the Sale-Leaseback Transaction (Note 1), the Company reported the transaction proceeds of $90,055 as a financing obligation relating to the Facility Lease. The payments on the financing obligation are allocated between interest and principal based on a rate determined by reference to the Company’s estimated incremental borrowing rate adjusted to eliminate substantially all
F-59
Table of Contents
negative amortization and to eliminate any estimated built-in gain or loss. As a result of the indemnification liability (Note 1), the Company subsequently recorded a discount on the financing obligation which will be amortized as interest expense. The net balance outstanding for the financing obligation as of March 31, 2014 was $75,318. The net balance outstanding for the financing obligation as of December 31, 2013 was $75,264.
The financing obligation is secured by the PPA and certain guarantees by SGR. The Facility Lease requires the Company to pay customary operating and repair expenses and to observe certain operating restrictions and covenants. The Facility Lease agreements contain renewal options at lease termination and purchase options at amounts approximating fair market value or termination value (greater of the two) as of dates specified in the those agreements.
Following is disclosure, as of March 31, 2014, of payment required on financing obligation over the next five years:
| Years ending December 31: |
||||
| 2014 |
$ | 3,256 | ||
| 2015 |
3,640 | |||
| 2016 |
3,653 | |||
| 2017 |
3,677 | |||
| 2018 |
3,597 |
For the three month periods ending March 31, 2014 and 2013, interest expense of $348 and $37, respectively, was recorded relating to the financing obligation.
Note 6—Member’s Equity
Refer to Note 9 for a subsequent event related to a change to the ownership of the Company.
Capitalized terms used in this footnote are used as defined in the Company’s LLC operating agreement (the “Operating Agreement”).
Structure—According to the Operating Agreement, as of March 31, 2014, SGR is the manager of the Company and also its sole member.
Taxable income and loss allocations—The Operating Agreement provides that each item of income, gain, loss, deduction, and credit of the Company will be allocated 100 percent to the member.
Member distributions—The Operating Agreement calls for distributable cash to be distributed to the member at the discretion of the manager.
Member liability—The member has no liability for the debts, obligations, or liabilities of the Company, whether arising in contract, tort, or otherwise solely by reason of being a member.
Note 7—Commitments and Contingencies
Real property agreements—The Solar Facility assets are located on property that the Company sub-leases from the Trust/Lessor, located in the County of Tulare, State of California. The original lease was between the Company and the Atwell Island Water District (“AIWD”). The lease was assigned to the Trust/Lessor at sale and subleased back to the Company simultaneously. The sublease term is co-terminus with the term of the Facility Lease. The Company pays $20 directly to AIWD each quarter for the land lease for the duration of its lease term.
F-60
Table of Contents
As of March 31, 2014, future minimum rental payments are as follows:
| Years ending December 31: |
||||
| 2014 |
$ | 60 | ||
| 2015 |
80 | |||
| 2016 |
80 | |||
| 2017 |
80 | |||
| 2018 |
80 | |||
| Thereafter |
1,140 | |||
|
|
|
|||
| $ | 1,520 | |||
|
|
|
Project administration agreement—The Company has entered into a project administration agreement (the “PAA”) with Administrator to provide administrative services relating to the day-to-day operations of the Company. The PAA is co-terminus with the term of the Facility Lease and establishes an annual base fee, due in equal installments on a monthly basis that was initially $300 and is subject to an annual escalator based on inflation. For the three month period ended March 31, 2014 and 2013, the Company incurred $75 and $0, respectively, of expense under the PAA.
Maintenance and service agreements—The Company has entered into an integrated service package contract with The Ryan Company, Inc. (“Provider”), which provides for certain maintenance, service, and administrative responsibilities for the Facility. For the three month period ending March 31, 2014 and 2013, the Company incurred fixed fees under this contract totaling $88 and $42, respectively. Under a Performance Ratio Guarantee, the Provider guarantees performance ratio at average rate of 74.36 percent for the agreement term of three years.
Interconnection Agreement—The Company has entered into an interconnection agreement with a utility and California Independent Operator (“CAISO”), Participating Transmission Owner that allows the Company to interconnect its generating facility with the utility’s transmission or distribution grid. The interconnection agreement has a term of 25 years and can be renewed for successive one-year periods after its expiration. The agreement can only be terminated after the Company ceases operation and has complied with all laws and regulations applicable to such termination. The Company’s long-term other assets balances at March 31, 2014 and 2013 consist of amounts contractually due to the Company from the utility as reimbursement for costs incurred relating to network upgrades on interconnection facilities.
Letters of credit—At March 31, 2014, the Company had the following letters of credit:
The Trust/Lessor issued a letter of credit totaling $6,000 benefiting the Company, as the Borrower, pursuant to the terms of the Participation Agreement. Issuance of this letter of credit is related to the performance under the PPA. The letter of credit expires on the 7th anniversary of the Sale and Leaseback closing date. The Borrower may request an extension of the LC during the one year prior to the expiration date.
Legal proceedings and claims—From time to time, the Company is subject to various legal proceedings and claims arising in the normal course of its business.
Note 8—Related-party Transactions and Balances
Activity under the PAA agreement described in Note 7 is a related-party activity. At March 31, 2014 and December 31, 2013, the Company had no payables to any of its affiliates.
F-61
Table of Contents
Note 9—Subsequent Events
Subsequent events are events or transactions that occur after the balance sheet date but before financial statements are issued. The Company recognizes in the financial statements the effects of all subsequent events that provide additional evidence about conditions that existed at the date of the balance sheet, including the estimates inherent in the process of preparing the financial statements. The Company’s financial statements do not recognize subsequent events that provide evidence about conditions that did not exist at the date of the balance sheet but arose after the balance sheet date and before financial statements are issued.
The Company has evaluated subsequent events through May 16, 2014, which is the date the financial statements were available to be issued.
On May 16, 2014, the Company purchased the Solar Facility from Trust/Lessor and terminated the associated Sale-Leaseback Transaction. Immediately following the purchase of the Solar Facility from the Trust/Lessor, all of the issued and outstanding membership interests of the Company was sold to an affiliate of SunEdison, Inc.
F-62
Table of Contents
Combined Carve-Out Balance Sheets
| March 31, 2014 (unaudited) |
December 31, 2013 |
|||||||
| Assets |
||||||||
| Current assets |
||||||||
| Cash and cash equivalents |
$ | 1,038,492 | $ | 1,790,570 | ||||
| Accounts receivable |
1,068,415 | 686,514 | ||||||
| Deferred rent under sale-leaseback, current portion |
226,475 | 226,475 | ||||||
| Prepaid expenses and other current assets |
126,206 | 201,404 | ||||||
|
|
|
|
|
|||||
| Total current assets |
2,459,588 | 2,904,963 | ||||||
|
|
|
|
|
|||||
| Investment in energy property, net |
103,003,244 | 103,829,927 | ||||||
|
|
|
|
|
|||||
| Other assets |
||||||||
| Restricted cash |
4,309,492 | 4,087,467 | ||||||
| Deferred rent under sale-leaseback, net of current portion |
308,376 | 364,995 | ||||||
| Deferred financing costs, net |
1,523,431 | 1,579,394 | ||||||
| Other non-current assets |
100,000 | 100,000 | ||||||
|
|
|
|
|
|||||
| Total other assets |
6,241,299 | 6,131,856 | ||||||
|
|
|
|
|
|||||
| Total assets |
$ | 111,704,131 | $ | 112,866,746 | ||||
|
|
|
|
|
|||||
F-63
Table of Contents
Summit Solar
Combined Carve-Out Balance Sheets
| March 31, 2014 (unaudited) |
December 31, 2013 |
|||||||
| Liabilities and Members’ Capital | ||||||||
| Current liabilities |
||||||||
| Accounts payable and accrued expenses |
$ | 1,358,888 | $ | 532,925 | ||||
| Financing obligations, current maturities |
233,656 | 222,474 | ||||||
| Long-term debt, current maturities |
2,472,306 | 2,493,919 | ||||||
| Deferred grants and rebates, current portion |
981,496 | 981,496 | ||||||
| Deferred gains on sale, current portion |
32,087 | 32,087 | ||||||
|
|
|
|
|
|||||
| Total current liabilities |
5,078,433 | 4,262,901 | ||||||
|
|
|
|
|
|||||
| Long-term liabilities |
||||||||
| Asset retirement obligation |
2,468,186 | 2,431,531 | ||||||
| Financing obligations, net of current maturities |
9,657,148 | 9,657,148 | ||||||
| Long-term debt, net of current maturities |
18,502,697 | 18,867,431 | ||||||
| Deferred grants and rebates, net of current portion |
24,510,339 | 24,755,711 | ||||||
| Deferred gains on sale, net of current portion |
366,362 | 374,384 | ||||||
|
|
|
|
|
|||||
| Total long-term liabilities |
55,504,732 | 56,086,205 | ||||||
|
|
|
|
|
|||||
| Commitments and contingencies |
||||||||
| Members’ capital |
||||||||
| Members’ capital |
54,151,894 | 54,773,423 | ||||||
| Accumulated other comprehensive loss |
(3,422,337 | ) | (2,648,839 | ) | ||||
| Non-controlling interests |
391,409 | 393,056 | ||||||
|
|
|
|
|
|||||
| Total members’ capital |
51,120,966 | 52,517,640 | ||||||
|
|
|
|
|
|||||
| Total liabilities and members’ capital |
$ | 111,704,131 | $ | 112,866,746 | ||||
|
|
|
|
|
|||||
See Notes to Unaudited Combined Carve-out Financial Statements.
F-64
Table of Contents
Unaudited Combined Carve-Out
Statements of Operations and Comprehensive Loss
| For the three months ended March 31, |
||||||||
| 2014 | 2013 | |||||||
| Revenues |
||||||||
| Energy generation revenue |
$ | 724,446 | $ | 767,276 | ||||
| Solar Renewable Energy Certificate (SREC) revenue |
682,499 | 281,040 | ||||||
| Performance Based Incentive (PBI) revenue |
59,678 | 66,091 | ||||||
|
|
|
|
|
|||||
| Total revenues |
1,466,623 | 1,114,407 | ||||||
|
|
|
|
|
|||||
| Operating expenses |
||||||||
| Cost of operations |
281,771 | 209,455 | ||||||
| Selling, general and administrative expenses |
12,477 | 27,324 | ||||||
| Project administration fee |
68,400 | 49,223 | ||||||
| Depreciation and accretion |
706,153 | 648,183 | ||||||
|
|
|
|
|
|||||
| Total operating expenses |
1,068,801 | 934,185 | ||||||
|
|
|
|
|
|||||
| Net operating income |
397,822 | 180,222 | ||||||
|
|
|
|
|
|||||
| Other income (expenses) |
||||||||
| Amortization expense—deferred financing costs |
(55,963 | ) | (51,061 | ) | ||||
| Interest income |
2,470 | 2,153 | ||||||
| Interest expense—financing obligations |
(147,942 | ) | (82,514 | ) | ||||
| Interest expense—long-term debt |
(241,818 | ) | (151,580 | ) | ||||
|
|
|
|
|
|||||
| Total other expenses |
(443,253 | ) | (283,002 | ) | ||||
|
|
|
|
|
|||||
| Combined net loss |
(45,431 | ) | (102,780 | ) | ||||
| Net loss attributable to non-controlling interest |
1,647 | 13,806 | ||||||
|
|
|
|
|
|||||
| Net loss attributable to the members |
$ | (43,784 | ) | $ | (88,974 | ) | ||
|
|
|
|
|
|||||
| Comprehensive loss |
||||||||
| Combined net loss |
$ | (45,431 | ) | $ | (102,780 | ) | ||
| Other comprehensive loss |
||||||||
| Foreign currency translation adjustments |
(773,498 | ) | (507,789 | ) | ||||
|
|
|
|
|
|||||
| Total comprehensive loss |
(818,929 | ) | (610,569 | ) | ||||
| Comprehensive loss attributable to non-controlling interests |
1,647 | 13,806 | ||||||
|
|
|
|
|
|||||
| Comprehensive loss attributable to the members |
$ | (817,282 | ) | $ | (596,763 | ) | ||
|
|
|
|
|
|||||
See Notes to Unaudited Combined Carve-out Financial Statements.
F-65
Table of Contents
Unaudited Combined Carve-Out Statements of Cash Flows
| For the three months ended March 31, |
||||||||
| 2014 | 2013 | |||||||
| Cash flows from operating activities |
||||||||
| Combined net loss |
$ | (45,431 | ) | $ | (102,780 | ) | ||
| Adjustments to reconcile combined net loss to net cash provided by operating activities |
||||||||
| Depreciation and accretion |
706,153 | 648,183 | ||||||
| Amortization expense—deferred financing costs |
55,963 | 51,061 | ||||||
| Amortization of gain on sale |
(8,022 | ) | (8,021 | ) | ||||
| Changes in operating assets and liabilities: |
||||||||
| Accounts receivable |
(384,291 | ) | (351,425 | ) | ||||
| Prepaid expenses and other current assets |
73,122 | 115,493 | ||||||
| Deferred rent under sale-leaseback |
56,619 | 56,618 | ||||||
| Accounts payable and accrued expenses |
224,323 | (162,650 | ) | |||||
|
|
|
|
|
|||||
| Net cash provided by operating activities |
678,436 | 246,479 | ||||||
|
|
|
|
|
|||||
| Cash flows from investing activities |
||||||||
| Expenditures on energy property |
(8,623 | ) | (2,616,222 | ) | ||||
|
|
|
|
|
|||||
| Net cash used in investing activities |
(8,623 | ) | (2,616,222 | ) | ||||
|
|
|
|
|
|||||
| Cash flows from financing activities |
||||||||
| Net deposits to restricted cash |
(222,025 | ) | 396,170 | |||||
| Proceeds from long-term debt |
— | 2,400,000 | ||||||
| Repayments of long-term debt |
(386,347 | ) | (423,442 | ) | ||||
| Deferred financing fees paid |
— | 8,535 | ||||||
| Net distributions |
(577,745 | ) | (79,095 | ) | ||||
|
|
|
|
|
|||||
| Net cash (used in) provided by financing activities |
(1,186,117 | ) | 2,302,168 | |||||
|
|
|
|
|
|||||
| Effects of exchange rate changes on cash and cash equivalents |
(235,774 | ) | (145,865 | ) | ||||
|
|
|
|
|
|||||
| Net decrease in cash and cash equivalents |
(752,078 | ) | (213,440 | ) | ||||
| Cash and cash equivalents, beginning of the period |
1,790,570 | 418,329 | ||||||
|
|
|
|
|
|||||
| Cash and cash equivalents, end of the period |
$ | 1,038,492 | $ | 204,889 | ||||
|
|
|
|
|
|||||
| Cash paid for interest, net of amount capitalized |
$ | 109,997 | $ | 18,657 | ||||
|
|
|
|
|
|||||
| Supplemental schedule of non-cash investing and financing activities |
||||||||
| Expenditures on energy property are adjusted by the following: |
||||||||
| Accounts payable—construction |
$ | (616,367 | ) | $ | (587,704 | ) | ||
|
|
|
|
|
|||||
| Increase in financing obligation |
$ | 11,182 | $ | — | ||||
|
|
|
|
|
|||||
See Notes to Unaudited Combined Carve-out Financial Statements.
F-66
Table of Contents
Notes to Unaudited Combined Carve-Out Financial Statements
Note 1—Nature of operations and basis of presentation
Basis of presentation
Summit Solar (the “Group”) as used in the accompanying combined carve-out financial statements comprises the entities and solar energy facilities listed below, which are the subject of a purchase and sale agreement and which have historically operated as a part of Nautilus Solar Energy, LLC (“NSE”). The Group is not a stand-alone entity, but is a combination of entities and solar energy facilities that are 100% owned by NSE unless otherwise noted below.
| Entities: |
||
| Solar I |
SWBOE | |
| St. Joseph’s |
Green Cove Management | |
| Liberty |
Lindenwold | |
| Ocean City One |
Dev Co | |
| Solar Services |
Power III | |
| Silvermine |
Solar PPA Partnership One | |
| Funding II (1%)* |
Waldo Solar Energy Park of Gainesville | |
| Power II (1%)* |
Cresskill | |
| Medford BOE (1%)* |
WPU | |
| Medford Lakes (1%)* |
KMBS | |
| Wayne (1%)* |
Power I | |
| Hazlet (1%)* |
Sequoia | |
| Talbot (1%)* |
Ocean City Two | |
| Frederick (1%)* |
Funding IV | |
| Gibbstown (51%)* |
San Antonio West | |
| Solar energy facilities: |
||
| Solomon |
1000 Wye Valley | |
| 460 Industrial |
252 Power | |
| 80 Norwich |
510 Main | |
| 215 Gilbert |
7360 Bramalae | |
| * | Subsequent to March 31, 2014, affiliates of NSE purchased the remaining interests in these entities (see Note 13). |
Throughout the periods presented in the combined carve-out financial statements, the Group did not exist as a separate, legally constituted entity. The combined carve-out financial statements have therefore been derived from the consolidated financial statements of NSE and its subsidiaries to represent the financial position and performance of the Group on a stand-alone basis throughout those periods in accordance with accounting principles generally accepted in the United States of America.
Management of NSE believes the assumptions underlying the combined carve-out financial statements are reasonable based on the scope of the purchase and sale agreement and the entities forming the Group being under common control and management throughout the periods covered by the combined carve-out financial statements.
Outstanding inter-entity balances, transactions, and cash flows between entities comprising the Group have been eliminated.
F-67
Table of Contents
The combined carve-out financial statements included herein may not necessarily represent what the Group’s results, financial position and cash flows would have been had it been a stand-alone entity during the periods presented, or what the Group’s results, financial position and cash flows may be in the future.
Management of NSE specifically identified expenses as being attributable to the Group which includes all material expenses incurred by NSE on the Group’s behalf. The expenses do not include allocations of general corporate overhead expenses from NSE as these costs were not considered material to the Group. The costs identified as specifically attributable to the Group are considered to be a reasonable reflection of all costs of doing business by the Group. For the years ended December 31, 2013 and 2012, Funding II incurred a project administration fee in the amount of $504,327 and $888,611, respectively. Management of NSE determined that it was not practicable to determine an estimate of this fee that would have been incurred had the Group operated as an unaffiliated entity. The combined carve-out financial statements included herein may not necessarily represent what the Group’s results, financial position and cash flows would have been had it been a stand-alone entity during the periods presented, or what the Group’s results, financial position and cash flows may be in the future.
Nature of operations
The Group engages in the development, construction, financing, ownership, and operation of distributed generation solar energy facilities in the United States and Canada. Solar Services provides operating and maintenance services for certain assets and/or entities included in the Group.
Note 2—Summary of significant accounting policies
Unaudited interim financial information
The combined carve-out financial statements as of March 31, 2014 and for the three months ended March 31, 2014 and 2013 included herein have been prepared by the Group without audit, pursuant to the rules and regulations of the Securities and Exchange Commission. Certain information and footnote disclosures normally included in financial statements prepared in accordance with U.S. generally accepted accounting principles have been condensed or omitted pursuant to such rules and regulations. However, the Group believes that the disclosures contained herein comply with the requirements of the Securities Exchange Act of 1934, as amended, and are adequate to make the information presented not misleading. The financial statements included herein, reflect all adjustments (consisting of normal recurring adjustments) which are, in the opinion of management, necessary for a fair presentation of the financial position, results of operations and cash flows for the interim periods presented. The results of operations for the three months ended March 31, 2014 and 2013 are not necessarily indicative of the results to be anticipated for the entire year ending December 31, 2014. All references to March 31, 2014 or to the three months ended March 31, 2014 and 2013 in the notes to these combined carve-out financial statements are unaudited.
Use of estimates
The preparation of combined carve-out financial statements in conformity with accounting principles generally accepted in the United States of America requires management to make estimates and assumptions that affect the reported amounts of assets and liabilities and disclosure of contingent assets and liabilities at the date of the combined carve-out financial statements and reported amounts of revenues and expenses for the periods presented. Actual results could differ from these estimates.
Cash and cash equivalents
Cash and cash equivalents include deposit and money market accounts.
F-68
Table of Contents
Restricted cash
Restricted cash consists of cash on deposit with various financial institutions for reserves required under certain loan and lease agreements. The use of these reserves is restricted based on the terms of the respective loan and lease agreements. Cash received during the term of a sale-leaseback transaction is subject to control agreements and collateral agency agreements under various financing facilities. As of March 31, 2014 and December 31, 2013, restricted cash is $4,309,492 and $4,087,467, respectively.
Accounts receivable
Accounts receivable is stated at the amount billed to customers less any allowance for doubtful accounts. The Group evaluates the collectability of its accounts receivable taking into consideration such factors as the aging of a customer’s account, credit worthiness and historical trends. As of March 31, 2014 and December 31, 2013, the Group considers accounts receivable to be fully collectible.
Energy property
Energy property is stated at cost. Depreciation is provided using the straight-line method by charges to operations over estimated useful lives of 30 years for solar energy facilities. Expenditures during the construction of new solar energy facilities are capitalized to solar energy facilities under construction as incurred until achievement of the COD expenditures for maintenance and repairs are charged to expense as incurred. Upon retirement, sale or other disposition of the solar energy facility, the cost and accumulated depreciation are removed from the accounts and the related gain or loss, if any, is reflected in the period of disposal.
Depreciation expense for the three months ended March 31, 2014 and 2013 was $914,870 and $842,603, respectively.
Impairment of long-lived assets
The Group reviews its energy property for impairment whenever events or changes in circumstances indicate that the carrying value of an asset may not be recoverable. When recovery is reviewed, if the undiscounted cash flows estimated to be generated by the energy property are less than its carrying amount, the Group compares the carrying amount of the energy property to its fair value in order to determine whether an impairment loss has occurred. The amount of the impairment loss is equal to the excess of the asset’s carrying value over its estimated fair value. No impairment loss was recognized during the three months ended March 31, 2014 or 2013.
Intangible assets and amortization
Deferred financing costs in connection with long-term debt are amortized over the term of the loan agreement using the effective interest method. Accumulated amortization as of March 31, 2014 and December 31, 2013 is $478,109 and $422,146, respectively. Amortization expense for the three months ended March 31, 2014 and 2013 was $55,963 and $51,061, respectively.
Asset retirement obligation
The Group is required to record asset retirement obligations when it has the legal obligation to retire long-lived assets. Upon the expiration of the power purchase agreements (the “PPAs”) or lease
F-69
Table of Contents
agreements, the solar energy facility is required to be removed if the agreement is not extended or the solar energy facility is not purchased by the customer. Where asset retirement obligations exist, the Group is required to record the present value of the estimated obligation and increase the carrying amount of the solar energy facility. The asset retirement obligations are accreted to their future value over the term of the PPA or lease and the capitalized amount is depreciated over the estimated useful life of 30 years.
Members’ capital
In the combined carve-out balance sheets, members’ capital represents NSE and its affiliates’ historical investment in the carve-out entities and solar energy facilities, their accumulated net earnings, including accumulated other comprehensive loss, and the net effect of transactions with NSE and its affiliates.
Comprehensive loss
Comprehensive loss consists of two components, combined net loss and other comprehensive loss. Other comprehensive loss refers to revenue, expenses, gains and losses that, under accounting principles generally accepted in the United States of America, are recorded as an element of members’ capital but are excluded from combined net loss.
Cost of operations
Cost of operations includes expenses related to operations and maintenance, insurance and rent.
Revenue recognition
The Group derives revenues from the following sources: sales of energy generation, sales of Solar Renewable Energy Certificates (“SRECs”), and Performance Based Incentive (“PBI”) programs.
Energy generation
Energy generation revenue is recognized as electricity is generated by the solar energy facility and delivered to the customers. Revenues are based on actual output and contractual prices set forth in long-term PPAs.
SRECs
SRECs are accounted for as governmental incentives and are not considered an output of the solar energy facilities. Revenue from the sale of SRECs to third parties is recognized upon the transfer of title and delivery of the SRECs to third parties and is derived from contractual prices set forth in SREC sale agreements or at spot market prices.
PBI programs
Revenue from PBI programs is recognized on eligible solar energy facilities as delivery of the generation occurs. The Group is entitled to receive PBI revenues over a five-year term, expiring February 1, 2015, based on statutory rates as energy is delivered.
Grants and rebates
The costs of the facilities built in the United States of America qualify for energy investment tax credits as provided under Section 48 of the Internal Revenue Code (“IRC”) (“Section 48 Tax Credit”) or
F-70
Table of Contents
alternatively, upon election, may be eligible for the United States Department of the Treasury (“Treasury”) grant payment for specified energy property in lieu of tax credits pursuant to Section 1603 of the American Recovery and Reinvestment Act of 2009 (“Section 1603 Grant”).
The Group receives Section 1603 Grants, rebates and other grants from various renewable energy programs. Upon receipt of the grants and rebates, deferred revenue is recorded and amortized using the straight-line method over the shorter of the useful life of the related solar energy facility or term of the leaseback, where applicable. Amortization of deferred grants and rebates is recorded as an offset to depreciation expense. As of March 31, 2014 and December 31, 2013, deferred grants and rebates are $25,491,835 and $25,737,207, respectively. During the three months ended March 31, 2014 and 2013, deferred grant and rebate amortization was $245,372 and $225,101, respectively.
Income taxes
The entities included in the accompanying combined carve-out financial statements have elected to be treated as pass-through entities or are disregarded entities for income tax purposes and as such, are not subject to income taxes. Rather, all items of taxable income, deductions and tax credits are passed through to and are reported by the entities’ members on their respective income tax returns. The Group’s Federal tax status as pass-through entities is based on their legal status as limited liability companies. Accordingly, the Group is not required to take any tax positions in order to qualify as pass-through entities. The consolidated income tax returns that report the activity of the Group are subject to examination by the Internal Revenue Service for a period of three years. While no income tax returns are currently being examined by the Internal Revenue Service, tax years since 2010 remain open.
Sales tax
The Group collects Harmonized Sales Taxes from its customers in Canada and remits these amounts to the Canadian government. Revenue is recorded net of Harmonized Sales Taxes.
Derivative instruments
The Group is required to evaluate contracts to determine whether the contracts are derivative instruments. Certain contracts that meet the definition of a derivative may be exempted from derivative accounting guidance under the normal purchases and normal sales exemption. Normal purchases and normal sales are contracts that provide for the purchase or sale of something other than a financial instrument or derivative instrument that will be delivered in quantities expected to be used or sold over a reasonable period in the normal course of business. SREC sale agreements that meet these requirements are designated as normal purchase or normal sale contracts and are exempted from the derivative accounting and reporting requirements. As of March 31, 2014 and December 31, 2013, all contracts for the sale of SRECs have been designated as exempt from the derivative accounting and reporting requirements.
Fair value of financial instruments
The Group maintains various financial instruments recorded at cost in the accompanying combined carve-out balance sheets that are not required to be recorded at fair value. For these instruments, management uses the following methods and assumptions to estimate fair value: (1) cash and cash equivalents, restricted cash, accounts receivable, deferred rent, prepaid expenses and other current assets, and accounts payable and accrued expenses approximate fair value because of the short-term nature of these instruments; and (2) long-term debt is deemed to approximate fair value based on borrowing rates available to the Group for long-term debt with similar terms and average maturities.
F-71
Table of Contents
Foreign currency transactions
The Group determines the functional currency of each entity based on a number of factors, including the predominant currency for the entity’s expenditures and borrowings. When the entity’s local currency is considered its functional currency, management translates its assets and liabilities into U.S. dollars at the exchange rates in effect at the balance sheet dates. Revenue and expense items are translated at the average exchange rates for the reporting period. Adjustments from the translation process are presented as a component of accumulated other comprehensive loss in the accompanying combined carve-out balance sheets.
The carrying amounts and classification of the Group’s foreign operations’ assets and liabilities as of March 31, 2014 and December 31, 2013 included in the accompanying combined carve-out balance sheets are as follows:
| March 31, 2014 |
December 31, 2013 |
|||||||
| Current assets |
$ | 1,245,568 | $ | 1,181,874 | ||||
| Investment in energy property, net |
17,083,254 | 17,816,141 | ||||||
|
|
|
|
|
|||||
| Total assets |
$ | 18,328,822 | $ | 18,998,015 | ||||
|
|
|
|
|
|||||
| Current liabilities |
$ | 68,476 | $ | 111,536 | ||||
| Non-current liabilities |
343,629 | 338,526 | ||||||
|
|
|
|
|
|||||
| Total liabilities |
$ | 412,105 | $ | 450,062 | ||||
|
|
|
|
|
|||||
Master lease agreements
The Group has entered into master lease agreements with financial institutions under which the financial institutions agreed to purchase solar energy facilities constructed by the Group and then simultaneously lease back the solar energy facilities to the Group. Under the terms of the master lease agreements, each solar energy facility is assigned a lease schedule that sets forth the terms of that particular solar energy facility lease such as minimum lease payments, basic lease term and renewal options, buyout or repurchase options, and end of lease repurchase options. Several of the leases have required rental prepayments.
The financial institutions owning the solar energy facilities retain all tax benefits of ownership, including any Section 48 Tax Credit or Section 1603 Grant.
The Group analyzes the terms of each solar energy facility lease schedule to determine the appropriate classification of the sale-leaseback transaction because the terms of the solar energy facility lease schedule may differ from the terms applicable to other solar energy facilities. In addition, the Group must determine if the solar energy facility is considered integral equipment to the real estate upon which it resides. The terms of the lease schedule and whether the solar energy facility is considered integral equipment may result in either one of the following sale-leaseback classifications:
Operating lease
The sale-leaseback classification for non-real estate transactions is accounted for as an operating lease when management determines that a sale of the solar energy facility has occurred and the terms of the solar energy facility lease schedule meet the requirements of an operating lease. Typically, the classification as an operating lease occurs when the term of the lease is less than 75% of the estimated economic life of the solar energy facility and the present value of the minimum lease payments does not exceed 90% of the fair value of the solar energy facility. The classification of a sale-
F-72
Table of Contents
leaseback transaction as an operating lease results in the deferral of any profit on the sale of the solar energy facility. The profit is recognized over the term of the lease as a reduction of rent expense. Rent paid for the lease of the solar facility is recognized on a straight-line basis over the term of the lease.
Financing arrangement
The sale-leaseback transaction is accounted for as a financing arrangement when the Group determines that a sale of the solar energy facility has not occurred. Typically, this occurs when the solar energy facilities are determined to be integral property and the Group has a prohibited form of continuing involvement, such as an option to repurchase the solar energy facilities under the master lease agreements. The classification of a sale-leaseback transaction as a financing arrangement results in no profit being recognized because a sale has not been recognized, and the financing proceeds are recorded as a liability.
The Group uses its incremental borrowing rate to determine the principal and interest component of each lease payment. However, to the extent that the incremental borrowing rate will result in either negative amortization of the financing obligation over the entire term of the lease or a built-in loss at the end of the lease (i.e. net book value exceeds the financing obligation), the rate is adjusted to eliminate such results. The Group has not been required to adjust its incremental borrowing rate for any of its financing arrangements. As a result, the financing arrangements amortize over the term of the respective lease and the Group expects to recognize a gain at the end of the lease term equal to the remaining financing obligation less the solar energy facility’s net book value.
Variable interest entity
The Group determines when it should include the assets, liabilities, and activities of a variable interest entity (“VIE”) in its combined carve-out financial statements and when it should disclose information about its relationship with a VIE when it is determined to be the primary beneficiary of the VIE. The determination of whether the Group is the primary beneficiary of a VIE is made upon initial involvement with the VIE and on an ongoing basis based on changes in facts and circumstances. The primary beneficiary of a VIE is the entity that has (1) the power to direct the activities of the VIE that most significantly impact the VIE’s economic performance and (2) the obligation to absorb losses or receive benefits that could potentially be significant to the VIE. If multiple unrelated parties share such power, as defined, no party is required to consolidate a VIE.
Non-controlling interests
Non-controlling interests are presented in the accompanying combined carve-out balance sheets as a component of members’ capital, unless these interests are considered redeemable. Combined net loss includes the total loss of the Group and the attribution of that loss between controlling and non-controlling interests is disclosed in the accompanying combined carve-out statements of operations and comprehensive loss.
Commitments and contingencies
Liabilities for loss contingencies arising from claims, assessments, litigation, fines and penalties and other sources are recorded when it is probable that a liability has been incurred and the amount of the assessment and/or remediation can be reasonably estimated. Legal costs incurred in connection with loss contingencies are expensed as incurred.
Subsequent events
Material subsequent events have been considered for disclosure and recognition in these combined carve-out financial statements through May 27, 2014 (the date the financial statements were available to be issued).
F-73
Table of Contents
Note 3—Energy property
Energy property consists of the following as of:
| March 31, 2014 |
December 31, 2013 |
|||||||
| Asset retirement cost |
$ | 2,125,065 | $ | 2,125,065 | ||||
| Solar energy facilities—operating |
109,228,085 | 109,844,632 | ||||||
| Solar energy facilities under construction |
925,171 | 251,132 | ||||||
|
|
|
|
|
|||||
| 112,278,321 | 112,220,829 | |||||||
| Accumulated depreciation |
(9,275,077 | ) | (8,390,902 | ) | ||||
|
|
|
|
|
|||||
| $ | 103,003,244 | $ | 103,829,927 | |||||
|
|
|
|
|
|||||
Note 4—Long-term debt and financing obligations
Long-term debt consists of the following as of:
| March 31, 2014 |
December 31, 2013 |
|||||||
| Term loans paying interest at 0% - 6.75%, due in 2020-2028, secured by the solar energy facilities |
$ | 20,975,003 | $ | 21,361,350 | ||||
| Less current portion of long-term debt |
(2,472,306 | ) | (2,493,919 | ) | ||||
|
|
|
|
|
|||||
| Total long-term debt |
$ | 18,502,697 | $ | 18,867,431 | ||||
|
|
|
|
|
|||||
During 2013 and 2012, certain entities of the Group completed construction and installation of four solar energy facilities, which were sold to a third party, and concurrently entered into a lease of the solar energy facilities for periods ranging from 15 to 20 years. These certain entities of the Group pledged membership interests in certain entities to the third party as security. The Group has classified the transactions as financing arrangements because the solar energy facilities were determined to be integral equipment and the purchase option available under the master lease agreement represents a prohibited form of continuing involvement.
Note 5—Operating leases
Certain entities of the Group have entered into various lease agreements for the sites where solar energy facilities have been constructed. Minimum lease payments are recognized in the accompanying combined carve-out statements of operations and comprehensive loss on a straight-line basis over the lease terms. Rent expense during the three months ended March 31, 2014 and 2013 was $83,913 and $76,927, respectively.
In prior years, certain entities of the Group completed construction and installation of three solar energy facilities, which were sold to a third party, and concurrently entered into a leaseback of the solar energy facilities for periods of 15 to 20 years. These certain entities of the Group are leasing, operating and maintaining the solar energy facilities under arrangements that qualify as operating leases. The membership interests in these entities were pledged to the third party as security. The Group records lease expense under its operating leases on a straight line basis over the term of the lease. Aggregate gains on the sale of the solar energy facilities to this third party amounted to $591,458, the amortization of which is recognized as an offset to the corresponding lease expense ratably over the term of the lease. As of March 31, 2014 and December 31, 2013, the Group has deferred rent of $534,851 and $591,470, respectively, which represents the difference between the amount paid by the Group and the rent expense recorded using the straight-line basis in the aforementioned transaction. For both the three months ended March 31, 2014 and 2013, the Group recorded lease expenses of $56,619, net of offsets from the recognition of the gains on sale of $8,022.
F-74
Table of Contents
Note 6—SREC inventory
The Group generates SRECs for each 1,000 kWh of solar energy produced. To monetize the SRECs in certain states with mandatory renewable energy portfolio standards, the Group enters into third party contracts to sell their generated SRECs at fixed prices and in designated quantities over periods ranging from 1 to 12 years. The timing of delivery to customers is dictated by the terms of the underlying contracts. In the event energy production does not generate sufficient SRECs to fulfill a contract, the Group may be required to utilize its supply of uncontracted SRECs, purchase SRECs on the spot market, or pay specified contractual damages. Additionally, the Group also sells generated SRECs on the spot market.
As of March 31, 2014 and December 31, 2013, the Group holds 88 and 797 SREC, respectively, that are committed through forward contracts with prices ranging from $50 to $370.
Management accounts for its SREC inventory under the incremental cost method and has recorded no value to these SRECs in the accompanying combined carve-out balance sheets as of March 31, 2014 and December 31, 2013.
Note 7—Variable interest entity
A certain entity of the Group is the primary beneficiary of a VIE, which was formed in 2012 and is consolidated as of March 31, 2014 and December 31, 2013. The carrying amounts and classification of the consolidated VIE’s assets and liabilities as of March 31, 2014 and December 31, 2013 included in the accompanying combined carve-out balance sheets are as follows:
| March 31, 2014 |
December 31, 2013 |
|||||||
| Current assets |
$ | 68,913 | $ | 115,622 | ||||
| Non-current assets |
4,531,528 | 4,676,686 | ||||||
|
|
|
|
|
|||||
| Total assets |
$ | 4,600,441 | $ | 4,792,308 | ||||
|
|
|
|
|
|||||
| Current liabilities |
$ | 338,633 | $ | 351,259 | ||||
| Non-current liabilities |
3,455,741 | 3,538,350 | ||||||
|
|
|
|
|
|||||
| Total liabilities |
$ | 3,794,374 | $ | 3,889,609 | ||||
|
|
|
|
|
|||||
The amounts shown above exclude inter-entity balances that were eliminated for purposes of presenting these combined carve-out financial statements. All of the assets above are restricted for settlement of the VIE obligations, and all of the liabilities above can only be settled using VIE resources; however, NSE has guaranteed the long-term debt.
Note 8—Related-party transactions
Project administration fee
An affiliate of the Group provides administrative and project management services to Funding II and earns an annual, noncumulative fee. The fee is equal to 15% of gross revenues, as defined, and specifically excludes deferred grant amortization, and is to be paid from cash flows as prioritized in the Operating Agreement. The fee is only incurred to the extent of available cash flow. During the three months ended March 31, 2014 and 2013, project administration fees were $68,400 and $49,223, respectively.
F-75
Table of Contents
Note 9—Commitments and contingencies
An entity within the Group was involved in arbitration with a vendor in pursuit of liquidated damages relating to completed work under a contractual arrangement. The vendor filed a counterclaim for payment of amounts outside of the provisions of the contract. In September 2013, the Group reached a settlement with the vendor, whereby the Group received liquidated damages of $175,000.
An entity within the Group is currently involved in a dispute with a vendor who has filed a claim in the amount of $447,725 regarding the completion of certain milestones under a contractual agreement. Management disagrees with the claim based on the position that one of the milestones was not met under the terms of the contract. The Group has not accrued for any amounts for this matter as NSE has executed an indemnification and is entitled to control and defend any claims related to this matter.
Operations and maintenance agreements
The Group has entered into Operations and Maintenance Agreements (“O&M Agreements”) with unrelated third parties for operating and maintaining solar energy facilities. In general, the third parties are entitled to a quarterly fee, escalated annually, based on the size of the respective solar energy facility. The terms are generally concurrent with the term of the respective PPAs of the specific solar energy facilities unless terminated earlier in accordance with the O&M Agreements.
During the three months ended March 31, 2014 and 2013, the Group incurred expenses relating to these O&M Agreements of $94,035 and $12,837, respectively, all of which is included in cost of operations in the accompanying combined carve-out statements of operations and comprehensive loss.
Power purchase agreements
The Group has entered into 15- to 20-year PPAs with one customer for each solar energy facility. The PPAs provide for the receipt of payments in exchange for the sale of all solar-powered electric energy. The electricity payments are calculated based on the amount of electricity delivered at a designated delivery point at a fixed price. Certain PPAs have minimum production guarantee provisions that require the Group to pay the customer for any production shortfalls.
SREC sale agreements
The Group has entered into 1- to 12-year SREC agreements with various third parties. The agreements provide for the receipt of fixed payments in exchange for the transfer of either a contractually fixed quantity or all of the SRECs generated by the solar energy facilities. Certain agreements require the Group to establish collateral accounts, which are released as the Group meets its obligations under the SREC agreements.
Sublease agreement
A certain entity of the Group entered into a sublease agreement with a third party to sublease the roof of a building to install a solar energy facility. The entity was required to pay a security deposit of $100,000 at the execution of the lease, which remains receivable as of March 31, 2014. The sublease agreement requires annual payments of $85,000 through the termination of the respective PPA on May 4, 2032.
Grant compliance
As a condition to claiming Section 1603 Grants, the Group is required to maintain compliance with the terms of the Section 1603 program for a period of 5 years. Failure to maintain compliance with the requirements of Section 1603 could result in recapture of the amounts received, plus interest.
F-76
Table of Contents
The Group is required to maintain compliance with various state renewable energy programs that provided other rebates or grants. The compliance periods range from 5 to 15 years. Failure to comply with these requirements could result in recapture of the amounts received.
Note 10—Asset retirement obligation
The Group determined that, based on contractual obligations under the various PPA and lease agreements, there is a requirement to record an asset retirement obligation. The following table reflects the changes in the asset retirement obligation for the three months ended March 31, 2014 and 2013:
| 2014 | 2013 | |||||||
| Asset retirement obligation, January 1 |
$ | 2,431,531 | $ | 2,035,249 | ||||
| Liabilities incurred |
— | — | ||||||
| Liabilities settled |
— | — | ||||||
| Accretion expense |
36,655 | 30,681 | ||||||
|
|
|
|
|
|||||
| Asset retirement obligation, March 31 |
$ | 2,468,186 | $ | 2,065,930 | ||||
|
|
|
|
|
|||||
Note 11—Major customers
During the three months ended March 31, 2014, the Group derived 21% of its energy generation revenue from one customer and 77% of its SREC revenue from five customers.
During the three months ended March 31, 2013, the Group derived 17% of its energy generation revenue from one customer and 93% of its SREC revenue from six customers.
Note 12—Concentrations
The Group maintains cash with financial institutions. At times, these balances may exceed Federally insured limits; however, the Group has not experienced any losses with respect to its bank balances in excess of Federally insured limits. Management believes that no significant concentration of credit risk exists with respect to these cash balances as of March 31, 2014 and December 31, 2013.
The Group sells solar-powered electric energy to customers under 15- to 20-year arrangements and sells SRECs under contracts with third parties. The Group is dependent on these customers.
Note 13—Subsequent events
On May 22, 2014, an affiliate of NSE entered into a purchase and sale agreement to sell its ownership interests in the Group to an affiliate of SunEdison, Inc.
On May 22, 2014, the Class B Member of Funding II, an affiliate of NSE, purchased the ownership interests of the Class A Member. As a result of the transaction, the affiliate acquired the remaining 99% interest in Funding II (see Note 1).
On May 22, 2014, Funding IV, an affiliate of NSE, purchased the non-controlling interests of Gibbstown. As a result of the transaction, the affiliate acquired the remaining 49% interest in Gibbstown (see Note 1).
On May 22, 2014, the Group repaid the noninterest bearing loan with a principal balance of $2,489,538 as of March 31, 2014.
F-77
Table of Contents
Combined Balance Sheets
(Unaudited)
| In thousands | March 31, 2014 |
December 31, 2013 |
||||||
| Assets |
||||||||
| Current assets: |
||||||||
| Cash and cash equivalents |
£ | 476 | £ | 301 | ||||
| Restricted cash |
1,685 | 1,430 | ||||||
| Accounts receivable |
363 | 561 | ||||||
| Notes receivable—related parties |
3,718 | 4,120 | ||||||
| Prepaid expenses and other current assets |
1,318 | 2,020 | ||||||
|
|
|
|
|
|||||
| Total current assets |
7,560 | 8,432 | ||||||
| Property and equipment, net |
28,775 | 29,154 | ||||||
| Deferred financing costs, net |
1,472 | 1,587 | ||||||
| Other assets |
203 | 203 | ||||||
|
|
|
|
|
|||||
| Total assets |
£ | 38,010 | £ | 39,376 | ||||
|
|
|
|
|
|||||
| Liabilities and Shareholders’ Deficit |
||||||||
| Current liabilities: |
||||||||
| Current portion of long-term debt |
£ | 7,944 | £ | 7,754 | ||||
| Notes payable—related parties |
9,761 | 9,761 | ||||||
| Accounts payable and other current liabilities |
486 | 756 | ||||||
| Due to related parties |
— | 961 | ||||||
|
|
|
|
|
|||||
| Total current liabilities |
18,191 | 19,232 | ||||||
| Other liabilities: |
||||||||
| Long-term debt, less current portion |
20,720 | 20,771 | ||||||
| Deferred income taxes |
14 | 34 | ||||||
| Asset retirement obligations |
209 | 208 | ||||||
|
|
|
|
|
|||||
| Total liabilities |
39,134 | 40,245 | ||||||
| Shareholders’ deficit: |
||||||||
| Shareholders’ deficit |
(1,124 | ) | (869 | ) | ||||
|
|
|
|
|
|||||
| Total liabilities and shareholders’ deficit |
£ | 38,010 | £ | 39,376 | ||||
|
|
|
|
|
|||||
See accompanying notes to combined financial statements.
F-78
Table of Contents
Combined Statements of Operations
(Unaudited)
| Three months ended March 31, |
||||||||
| In thousands | 2014 | 2013 | ||||||
| Operating revenues: |
||||||||
| Energy |
£ | 206 | £ | 4 | ||||
| Incentives |
340 | 6 | ||||||
|
|
|
|
|
|||||
| Total operating revenues |
546 | 10 | ||||||
| Operating costs and expenses: |
||||||||
| Cost of operations |
29 | 1 | ||||||
| Cost of operations—affiliate |
40 | 22 | ||||||
| General and administrative |
95 | 38 | ||||||
| Depreciation and accretion |
380 | 23 | ||||||
|
|
|
|
|
|||||
| Total operating costs and expenses |
544 | 84 | ||||||
|
|
|
|
|
|||||
| Operating income |
2 | (74 | ) | |||||
| Other expense: |
||||||||
| Interest expense |
413 | 379 | ||||||
| Other, net |
(136 | ) | (92 | ) | ||||
|
|
|
|
|
|||||
| Total other expenses |
277 | 287 | ||||||
|
|
|
|
|
|||||
| Loss before income tax benefit |
(275 | ) | (361 | ) | ||||
| Income tax benefit |
(20 | ) | — | |||||
|
|
|
|
|
|||||
| Net loss |
£ | (255 | ) | £ | (361 | ) | ||
|
|
|
|
|
|||||
See accompanying notes to combined financial statements.
F-79
Table of Contents
Combined Statements of Cash Flows
(Unaudited)
| Three months ended March 31, | ||||||||
| In thousands | 2014 | 2013 | ||||||
| Cash flows from operating activities: |
||||||||
| Net loss |
£ | (255 | ) | £ | (361 | ) | ||
| Adjustments to reconcile net loss to net cash provided by operating activities: |
||||||||
| Depreciation and accretion |
380 | 23 | ||||||
| Amortization of deferred financing costs |
115 | — | ||||||
| Deferred taxes |
(20 | ) | — | |||||
| (Gain) loss on foreign currency exchange |
(136 | ) | (92 | ) | ||||
| Changes in assets and liabilities: |
||||||||
| Accounts receivable |
198 | (1 | ) | |||||
| Prepaid expenses and other current assets |
643 | (1,461 | ) | |||||
| Accounts payable and other current liabilities |
(423 | ) | (1,593 | ) | ||||
| Other assets |
— | (20 | ) | |||||
| Due to parent and affiliates |
(559 | ) | (399 | ) | ||||
|
|
|
|
|
|||||
| Net cash used in operating activities |
66 | (3,904 | ) | |||||
|
|
|
|
|
|||||
| Cash flows from investing activities: |
||||||||
| Capital expenditures |
— | (14,303 | ) | |||||
|
|
|
|
|
|||||
| Net cash used in investing activities |
— | (14,303 | ) | |||||
|
|
|
|
|
|||||
| Cash flows from financing activities: |
||||||||
| Change in restricted cash |
(255 | ) | — | |||||
| Proceeds from long-term debt |
764 | — | ||||||
| Proceeds from notes payable—related parties |
— | 18,657 | ||||||
| Principal payments on long-term debt |
(400 | ) | — | |||||
|
|
|
|
|
|||||
| Net cash provided by financing activities |
109 | 18,657 | ||||||
|
|
|
|
|
|||||
| Net increase in cash and cash equivalents |
175 | 450 | ||||||
| Cash and cash equivalents at beginning of period |
301 | 6 | ||||||
|
|
|
|
|
|||||
| Cash and cash equivalents at end of period |
476 | £ | 456 | |||||
|
|
|
|
|
|||||
| Supplemental Cash Flow Information: |
||||||||
| Cash payments for interest |
£ | 303 | £ | 44 | ||||
| Cash payments for taxes |
£ | — | £ | — | ||||
See accompanying notes to combined financial statements.
F-80
Table of Contents
Notes to Combined Financial Statements
(Amounts in thousands)
(Unaudited)
1. NATURE OF OPERATIONS
The Stonehenge Operating Group (the “Group”), as used in the accompanying combined financial statements, comprises the entities and solar energy facilities listed below:
| • | Sunsave 6 (Manston) Ltd (“Sunsave 6”) |
| • | KS SPV 24 Limited (“SPV 24”) |
| • | Boyton Solar Park Limited (“Boyton”) |
The Group is not a stand-alone entity but is a combination of entities and solar energy systems that are under the common management of ib Vogt GmbH (“ib Vogt”). The Group’s operating solar energy systems are located in the United Kingdom (“UK”) and operate under long-term contractual arrangements to sell 100% of the solar energy generated by the systems to one third party customer. The total combined capacity for the solar energy systems comprising the Group is 23.6 MW.
Basis of Presentation
The Group has presented combined financial statements as of March 31, 2014 and for the three month periods ended March 31, 2014 and 2013. The Group’s combined financial statements have been prepared in accordance with U.S. generally accepted accounting principles (“U.S. GAAP”). The Financial Accounting Standards Board (“FASB”) Accounting Standards Codification (“ASC”) is the source of authoritative U.S. GAAP to be applied by non-governmental entities. During the three month periods ended March 31, 2014 and 2013, there were no transactions among the combined entities that required elimination. The Group’s functional currency is the British pound (“GBP”).
2. SUMMARY OF SIGNIFICANT ACCOUNTING POLICIES
Use of Estimates
In preparing our combined financial statements, we use estimates and assumptions that may affect reported amounts and disclosures. Estimates are used when accounting for depreciation, amortization, asset retirement obligations, accrued liabilities, and income taxes. These estimates and assumptions are based on current facts, historical experience, and various other factors that we believe to be reasonable under the circumstances, the results of which form the basis for making judgments about the carrying values of assets and liabilities and the recording of revenue, costs and expenses that are not readily apparent from other sources. To the extent there are material differences between the estimates and actual results, our future results of operations would be affected.
Cash and Cash Equivalents
Cash and cash equivalents include all cash balances with original maturity periods of three months or less when purchased.
Restricted Cash
Restricted cash consists of cash on deposit in financial institutions that is restricted from use in operations pursuant to requirements of certain debt agreements. These funds are reserved for current debt service payments in accordance with the restrictions in the debt agreements.
F-81
Table of Contents
Accounts Receivable
Accounts receivable are reported on the combined balance sheet at the invoiced amounts adjusted for any write-offs and the allowance for doubtful accounts. We establish an allowance for doubtful accounts to adjust our receivables to amounts considered to be ultimately collectible. Our allowance is based on a variety of factors, including the length of time receivables are past due, significant one-time events, the financial health of our customers, and historical experience. There was no allowance for doubtful accounts or write-off of accounts receivable as of March 31, 2014.
Property and Equipment
Property and equipment consists of solar energy systems and is stated at cost. Expenditures for major additions and improvements are capitalized, and maintenance, and repairs are charged to expense as incurred. When property and equipment is retired or otherwise disposed of, the cost and accumulated depreciation is removed from the accounts, and any resulting gain or loss is included in the results of operations for the respective period. Depreciation of property and equipment is recognized using the straight-line method over the estimated useful lives of the solar energy systems of twenty years.
Capitalized Interest
Interest incurred on funds borrowed to finance construction of solar energy systems is capitalized until the system is ready for its intended use. The amount of interest capitalized during the three month period ended March 31, 2013 was £88. No amounts were capitalized during the three month period ended March 31, 2014. Interest costs charged to interest expense, including amortization of deferred financing costs, was £413 and £379 during the three month periods ended March 31, 2014 and 2013, respectively.
Deferred Financing Costs
Financing costs incurred in connection with obtaining construction and term financing are deferred and amortized over the maturities of the respective financing arrangements using the effective-interest method. Amortization of deferred financing costs recorded in interest expense was £115 during the three month period ended March 31, 2014. There was no amortization of deferred financing costs during the three month period ended March 31, 2013.
Impairment of Long-lived Assets
Long-lived assets that are held and used are reviewed for impairment whenever events or changes in circumstances indicate carrying values may not be recoverable. An impairment loss is recognized if the total future estimate of undiscounted cash flows expected from an asset are less than its carrying value. An impairment charge is measured as the difference between an asset’s carrying amount and fair value with the difference recorded in operating costs and expenses in the statement of operations. Fair values are determined by a variety of valuation methods including appraisals, sales prices of similar assets, and present value techniques. There were no impairments recognized during the three month period ended March 31, 2014 and the year ended December 31, 2013.
Operating Lease Agreements
Rentals applicable to operating leases where substantially all of the benefits and risks of ownership remain with the lessor are charged against profits on a straight-line basis over the period of the lease.
F-82
Table of Contents
Asset Retirement Obligations
The Group’s asset retirement obligations relate to leased land upon which the solar energy systems were constructed. The leases require that, upon lease termination, the leased land be restored to an agreed-upon condition. The Group is required to record the present value of the estimated obligations when the solar energy system are placed in service. Upon initial recognition of the Group’s asset retirement obligations, the carrying amount of the solar energy systems were also increased. The asset retirement obligations will be accreted to their future value over the terms of the land leases, while the amount capitalized at the COD will be depreciated over its estimated useful life of 20 years. Accretion expense recognized during the three month period ended March 31, 2014 was £1. There was no accretion expense during the three month period ended March 31, 2013.
Revenue Recognition
Power Purchase Agreements
A significant majority of the Group’s revenues are obtained through the sale of energy pursuant to terms of power purchase agreements (“PPAs”) or other contractual arrangements. All PPAs are accounted for as operating leases, have no minimum lease payments, and all of the rental income under these leases is recorded as income when the electricity is delivered. The contingent rental income recognized during the three month periods ended March 31, 2014 and 2013 was £206 and £4, respectively, exclusive of Value Added Tax (“VAT”).
Incentive Revenue
We receive incentives in the form of renewable obligation certificates (“ROCs”) and Levy Exemption Certificates (“LECs”) in respect to the production of electricity, which we sell to third parties. ROCs and LECs are accounted for as governmental incentives and are not considered an output of our solar energy systems. ROCs and LECs revenue is recognized at the time the Group has transferred ROCs or LECs pursuant to an executed contract relating to the sale to a third party. Incentive revenue was £340 and £6 during the three month periods ended March 31, 2014 and 2013, respectively.
Recently Issued Accounting Pronouncements
In May 2014, the FASB issued ASU No. 2014-09, Revenue from Contracts with Customers (Topic 606) (“ASU 2014-09”). The Group does not currently expect the adoption of ASU 2014-09 to have a significant effect on its combined financial statements and related disclosures.
Income Taxes
Our income tax balances are determined and reported in accordance with FASB ASC 740 (“ASC 740”), Income Taxes. Deferred tax assets and liabilities are recognized for the future tax consequences attributable to differences between the financial statement carrying amounts of existing assets and liabilities and their respective tax bases and operating loss carryforwards.
Deferred tax assets and liabilities are measured using enacted tax rates expected to apply to taxable income in the years in which those temporary differences are expected to be recovered or settled. The effect on deferred tax assets and liabilities of a change in tax rate is recognized in operations in the period that includes the enactment date. Valuation allowances are established when management determines that it is more likely than not that some portion, or all of the deferred tax asset, will not be realized.
F-83
Table of Contents
Deferred income taxes arise primarily because of differences in the bases of assets or liabilities between financial statement accounting and tax accounting which are known as temporary differences. We record the tax effect of these temporary differences as deferred tax assets (generally items that can be used as a tax deduction or credit in future periods) and deferred tax liabilities (generally items for which we receive a tax deduction but have not yet been recorded in the combined statement of operations).
We regularly review our deferred tax assets for realizability, taking into consideration all available evidence, both positive and negative, including historical pre-tax and taxable income, projected future pre-tax and taxable income, and the expected timing of the reversals of existing temporary differences. In arriving at these judgments, the weight given to the potential effect of all positive and negative evidence is commensurate with the extent to which it can be objectively verified.
We have made our best estimates of certain income tax amounts included in the combined financial statements. Application of our accounting policies and estimates, however, involves the exercise of judgment and use of assumptions as to future uncertainties and, as a result, actual results could differ from these estimates. In arriving at our estimates, factors we consider include how accurate the estimate or assumptions have been in the past, how much the estimate or assumptions have changed, and how reasonably likely such change may have a material impact.
Contingencies
We are involved in conditions, situations, or circumstances in the ordinary course of business with possible gain or loss contingencies that will ultimately be resolved when one or more future events occur or fail to occur. If some amount within a range of loss appears at the time to be a better estimate than any other amount within the range, that amount will be accrued. When no amount within the range is a better estimate than any other amount, however, the minimum amount in the range will be accrued. We continually evaluate uncertainties associated with loss contingencies and record a charge equal to at least the minimum estimated liability for a loss contingency when both of the following conditions are met: (i) information available prior to issuance of the financial statements indicates that it is probable that an asset had been impaired or a liability had been incurred at the date of the financial statements; and (ii) the loss or range of loss can be reasonably estimated. Legal costs are expensed when incurred. Gain contingencies are not recorded until realized or realizable.
Derivative Financial Instruments
All derivative instruments are recorded on the combined balance sheet at fair value. Derivatives not designated as hedge accounting are reported directly in earnings along with offsetting transaction gains and losses on the items being hedged. The group held no derivatives designated as hedges during the three month periods ended March 31, 2014 and 2013. See note 5 for disclosures regarding our derivative financial instruments.
Fair Value Measurements
For cash and cash equivalents, restricted cash, accounts receivable, accounts payable, and accrued liabilities, the carrying amount approximates fair value because of the short-term maturity of the instruments. See note 4 for disclosures related to the fair value of our long-term debt.
We apply the provisions of ASC 820, Fair Value Measurement (ASC 820), to our assets and liabilities that we are required to measure at fair value pursuant to other accounting standards, including our derivative financial instruments. See note 9 for disclosures regarding our fair value measurements.
F-84
Table of Contents
Foreign Currency Transactions
Transaction gains and losses that arise from exchange rate fluctuations on transactions and balances denominated in a currency other than the functional currency are generally included in the results of operations as incurred. Foreign currency transaction gains were £136 and £92 during the three month periods ended March 31, 2014 and 2013, respectively.
Comprehensive Income
The Group did not have other comprehensive income during the three month periods ended March 31, 2013 and 2013 or accumulated other comprehensive income as of December 31, 2013 and March 31, 2014. As such, no statement of comprehensive income has been presented herein.
3. PROPERTY AND EQUIPMENT
Property and equipment consists of the following:
| March 31, 2014 |
December 31, 2013 |
|||||||
| Solar energy systems |
£ | 30,299 | £ | 30,299 | ||||
| Less accumulated depreciation—solar energy systems |
(1,524 | ) | (1,145 | ) | ||||
|
|
|
|
|
|||||
| Property and equipment, net |
£ | 28,775 | £ | 29,154 | ||||
|
|
|
|
|
|||||
Depreciation expense was £379 and £23 during the three month periods ended March 31, 2014 and 2013, respectively.
4. DEBT
Debt consists of the following as of March 31, 2014 and December 31, 2013:
| March 31, 2014 | December 31, 2013 | |||||||||||||||||||||||
| In thousands | Total Principal |
Current | Long- Term |
Total Principal |
Current | Long- Term |
||||||||||||||||||
| Term loan facilities |
£ | 22,506 | £ | 1,786 | £ | 20,720 | £ | 22,367 | £ | 1,596 | £ | 20,771 | ||||||||||||
| VAT facilities |
6,158 | 6,158 | — | 6,158 | 6,158 | — | ||||||||||||||||||
|
|
|
|
|
|
|
|
|
|
|
|
|
|||||||||||||
| Total debt outstanding |
£ | 28,664 | £ | 7,944 | £ | 20,720 | £ | 28,525 | £ | 7,754 | £ | 20,771 | ||||||||||||
|
|
|
|
|
|
|
|
|
|
|
|
|
|||||||||||||
On August 7, 2013, Boyton entered into a credit agreement with Bayerische Landesbank (“Bayern LB”), which provided for a term loan facility with a limit of €7,869 and a VAT facility with a limit of £1,800. The term loan facility bears interest at a rate of 3.4% per annum and matures in 2028. At March 31, 2014, the balance outstanding under the term loan facility was €7,734, or £6,390 (€1 = £0.8263). At December 31, 2013, the balance outstanding under the term loan facility was €7,778, or £6,493 (€1 = £0.8348). The VAT facility bears interest at a variable rate of LIBOR plus an applicable margin of 2% and matures on June 30, 2014. At March 31, 2014 and December 31, 2013, the variable rate on the VAT facility was 2.5% and the amount outstanding was £1,800.
On October 4, 2013, SPV 24 entered into a facility agreement with Bayern LB, which provided for a term loan facility with a limit of €8,333 and a VAT facility with a limit of £2,056. The term loan facility bears interest at a rate of 3.4% per annum and matures in 2028. At March 31, 2014, the balance outstanding under the term loan facility was €8,190, or £6,765 (€1 = £0.8263). At December 31, 2013, the balance outstanding under the term loan facility was €7,500, or £6,261 (€1 = £0.8348). The VAT facility bears interest at a variable rate of LIBOR plus an applicable margin of 2% and matures on June 30, 2014. At March 31, 2014 and December 31, 2013, the variable rate on the VAT facility was 2.5% and the amount outstanding was £2,057.
F-85
Table of Contents
On December 5, 2013, Sunsave 6 entered into a facility agreement with Bayern LB, which provided for a term loan facility with a limit of €11,515 and a VAT facility with a limit of £2,301. The term loan facility bears interest at a rate of 3.4% per annum and matures in 2028. At March 31, 2014, the balance outstanding under the term loan facility was €11,316, or £9,351 (€1 = £0.8263). At December 31, 2013, the balance outstanding under the term loan facility was €11,515, or £9,613 (€1 = £0.8348). The VAT facility bears interest at a variable rate of LIBOR plus an applicable margin of 2% and matures on June 30, 2014. At March 31, 2014 and December 31, 2013, the variable rate on the VAT facility was 2.5% and the amount outstanding was £2,301.
The Group entered into three cross-currency swap agreements with Bayern LB to hedge the foreign currency risk posed by the term loan facilities, which are denominated in euros (€). See note 5 for disclosures regarding our derivative financial instruments.
The estimated fair value of our outstanding debt obligations was £27,560 and £27,818 at March 31, 2014 and December 31, 2013, respectively. The fair value of our debt is calculated based on expected future cash flows discounted at market interest rates with consideration for non-performance risk or current interest rates for similar instruments.
5. DERIVATIVES
At March 31, 2014, the Group’s hedging activity consists of the following:
| Derivatives not designated as hedging: |
Balance Sheet Classification |
Assets (Liabilities) Fair Value |
||||
| Cross currency swaps |
Prepaid expenses and other current assets | £ | 36 | |||
| Cross currency swaps |
Accounts payable and other current liabilities | (331 | ) | |||
| Derivatives not designated as hedging: |
Statement of Operations Classification |
Losses | ||||
| Cross currency swaps |
Other, net | £ | 97 | |||
There was no hedging activity during the three month period ended March 31, 2013.
At December 31, 2013, the Group’s hedging activity consists of the following:
| Derivatives not designated as hedging: |
Balance Sheet Classification |
Assets (Liabilities) Fair Value |
||||
| Cross currency swaps |
Prepaid expenses and other current assets | £ | 59 | |||
| Cross currency swaps |
Accounts payable and other current liabilities | (257 | ) | |||
As of March 31, 2014 and December 31, 2013, we were party to three cross-currency swap instruments that are accounted for as economic hedges to the foreign currency risk posed by the term loan facilities, which are denominated in euros (€). The combined notional value of the three instruments at March 31, 2014 and December 31, 2013 was £23,190 and £23,598, respectively. The amounts recorded to the combined balance sheet, as provided in the table above, represent the fair value of the net amount that would settle on the balance sheet date if the swaps were transferred to other third parties or canceled by the Group. Because these hedges are deemed economic hedges and not accounted for under hedge accounting, the changes in fair value are recorded to other, net within the combined statement of operations. There were no cash inflows or outflows during the three month periods ended March 31, 2014 and 2013 related to these hedges. The losses above are reflected within gain on foreign currency exchange as an adjustment to reconcile net loss to net cash used in operating activities in the combined statement of cash flows.
F-86
Table of Contents
6. INCOME TAXES
Income tax benefit during the three month period ended March 31, 2014 consists of the following:
| Current | Deferred | Total | ||||||||||
| Three month period ended March 31, 2014 |
||||||||||||
| Income tax benefit |
£ | — | £ | (20 | ) | £ | (20 | ) | ||||
Effective Tax Rate
The income tax benefit for the three month periods ended March 31, 2014 differed from the amounts computed by applying the standard rate of corporation tax in the UK of 23.0% as identified in the following table
| March 31, 2014 | ||||
| Income tax at Corporation rate |
23.0 | % | ||
| Increase (reduction) in income taxes: |
||||
| Capital allowances in excess of depreciation |
3.1 | |||
| Unrelieved losses |
(3.2 | ) | ||
| Change in valuation allowance |
(15.6 | ) | ||
|
|
|
|||
| Effective tax rate |
7.3 | % | ||
|
|
|
|||
Deferred Taxes
Deferred income taxes for the Group’s taxable project entities reflect the tax effects of temporary differences between the carrying amounts of assets and liabilities for financial reporting purposes and the amounts used for income tax purposes. Significant components of the Group’s deferred tax assets and liabilities at March 31, 2014 and December 31, 2013 are as follows:
| As of | ||||||||
| March 31, 2014 | December 31, 2013 | |||||||
| Deferred tax liabilities: |
||||||||
| Solar energy systems |
£ | 305 | £ | 207 | ||||
| Deferred tax assets: |
||||||||
| Net operating loss carryforwards |
415 | 254 | ||||||
| Valuation allowance |
(124 | ) | (81 | ) | ||||
|
|
|
|
|
|||||
| Total deferred tax assets |
291 | 173 | ||||||
|
|
|
|
|
|||||
| Net long-term deferred tax liabilities |
£ | 14 | £ | 34 | ||||
|
|
|
|
|
|||||
In assessing the realization of deferred tax assets, management considers whether it is more likely than not that some portion or all of the deferred tax assets will not be realized. The ultimate realization of deferred tax assets is dependent upon the scheduled reversal of deferred tax liabilities and generation of future taxable income during the periods in which the deferred tax assets become deductible. During the three month period ended March 31, 2014 and the year ended December 31, 2013, a valuation allowance was recognized on net operating losses for project entities that have current year losses and no history of earnings, as there is insufficient evidence to suggest there will be sufficient taxable income during the periods in which certain of the temporary differences become deductible. The operating loss carryforward period is indefinite, subject to certain conditions. The change during the three month period ended March 31, 2014, in the total valuation allowance was £43. The change during the year ended December 31, 2013 in the total valuation allowance was £81.
F-87
Table of Contents
As of March 31, 2014 and December 31, 2013, the Group did not have any unrecognized tax benefits or uncertain tax positions.
7. RELATED PARTIES
Shareholder Loans
ibVogt
ib Vogt is a related party as it holds 50% of the ordinary share capital of each of the project entities comprising the Group. At both March 31, 2014 and December 31, 2013, the Group had outstanding shareholder loans payable to ib Vogt totaling £4,881. The loans from ib Vogt have no fixed repayment date, are unsecured, and bear no interest.
At March 31, 2014 and December 31, 2013, the Group had outstanding shareholder loans receivable from ib Vogt totaling £3,718 and £4,120, respectively. These loans mature on March 31, 2015.
ViMAP
ViMAP GmbH (“ViMAP”) is a related party as it holds 50% of the ordinary share capital of two of the project entities comprising the Group (Boyton and SPV 24). At both March 31, 2014 and December 31, 2013, the Group had outstanding shareholder loans payable to ViMAP totaling £3,311. The loans from ViMAP have no fixed repayment date, are unsecured, and bear no interest.
St. Nicholas Court
St. Nicholas Court Farms Limited (“St. Nicholas Court”) is a related party as it holds 50% of the ordinary share capital of one of the project entities comprising the Group (Sunsave 6). At both March 31, 2014 and December 31, 2013, the Group had an outstanding shareholder loan payable to St. Nicholas Court totaling £1,569. The loan from St. Nicholas Court has no fixed repayment date, is unsecured, and bears no interest.
Purchases
During the year ended December 31, 2013, the Group purchased a total of £26,685 and £1,078 in respect of project rights, services, solar panels, grid connection and other associated plant and machinery pursuant to Engineering, Procurement and Construction (“EPC”) contracts with ib Vogt and St. Nicholas Court, respectively, for the construction of the Group’s solar energy facilities. At December 31, 2013, a balance of £961 remained outstanding and is reflected in due to related parties in the combined balance sheets.
During the three month period ended March 31, 2014, the Group repaid the outstanding balance from December 31, 2013, did not make any additional purchases, and no amounts were outstanding as of March 31, 2014.
Operations and Maintenance
Operations and maintenance services are solely provided to the Group by an affiliate of ib Vogt pursuant to contractual agreements. Costs incurred for these services were £40 and £22 during the three month periods ended March 31, 2014 and 2013, respectively, and were reported as cost of operations—affiliates in the combined statement of operations. No balance remains outstanding as of March 31, 2014 and December 31, 2013.
F-88
Table of Contents
8. FAIR VALUE MEASUREMENTS
We perform fair value measurements in accordance with ASC 820. ASC 820 defines fair value as the price that would be received from selling an asset or paid to transfer a liability in an orderly transaction between market participants at the measurement date. When determining the fair value measurements for assets and liabilities required to be recorded at their fair values, we consider the principal or most advantageous market in which we would transact and consider assumptions that market participants would use when pricing the assets or liabilities, such as inherent risk, transfer restrictions and risk of nonperformance.
ASC 820 establishes a fair value hierarchy that requires an entity to maximize the use of observable inputs and minimize the use of unobservable inputs when measuring fair value. An asset’s or a liability’s categorization within the fair value hierarchy is based upon the lowest level of input that is significant to the fair value measurement. ASC 820 establishes three levels of inputs that may be used to measure fair value:
| • | Level 1: quoted prices in active markets for identical assets or liabilities; |
| • | Level 2: inputs other than Level 1 that are observable, either directly or indirectly, such as quoted prices in active markets for similar assets or liabilities, quoted prices for identical or similar assets or liabilities in markets that are not active, or other inputs that are observable or can be corroborated by observable market data for substantially the full term of the assets or liabilities; or |
| • | Level 3: unobservable inputs that are supported by little or no market activity and that are significant to the fair values of the assets or liabilities. |
The following table summarizes the financial instruments measured at fair value on a recurring basis classified in the fair value hierarchy (Level 1, 2 or 3) based on the inputs used for valuation in the accompanying combined balance sheet:
| As of March 31, 2014 | As of December 31, 2013 | |||||||||||||||||||||||
| Assets (Liabilities) | Level 1 | Level 2 | Level 3 | Level 1 | Level 2 | Level 3 | ||||||||||||||||||
| Cross-currency swaps |
£ | — | £ | 36 | £ | — | £ | — | £ | 59 | £ | — | ||||||||||||
| Cross-currency swaps |
— | (331 | ) | — | — | (257 | ) | — | ||||||||||||||||
|
|
|
|
|
|
|
|
|
|
|
|
|
|||||||||||||
| Total |
£ | — | £ | (295 | ) | £ | — | £ | — | £ | (198 | ) | £ | — | ||||||||||
|
|
|
|
|
|
|
|
|
|
|
|
|
|||||||||||||
The Group’s cross-currency swaps are classified as Level 2 since all significant inputs are observable and do not require management judgment. There were no transfers between Level 1, Level 2 and Level 3 financial instruments during the three month period ended March 31, 2014 or the year ended December 31, 2013. The Group held no financial instruments measured at fair value during the three months period ended March 31, 2013.
9. COMMITMENTS AND CONTINGENCIES
From time to time, we are notified of possible claims or assessments arising in the normal course of business operations. Management continually evaluates such matters with legal counsel and believes that, although the ultimate outcome is not presently determinable, these matters will not result in a material adverse impact on our financial position or operations.
F-89
Table of Contents
Operating Leases
The Group is obligated under certain long-term noncancelable operating leases related to land for its solar energy systems. Certain of these lease agreements contain renewal options. Below is a summary of the Group’s future minimum lease commitments as of March 31, 2014:
| Balance of | ||||||||||||||||||||||||||||
| 2014 | 2015 | 2016 | 2017 | 2018 | Thereafter | Total | ||||||||||||||||||||||
| Land leases |
£ | 95 | £ | 127 | £ | 127 | £ | 127 | £ | 127 | £ | 2,239 | £ | 2,842 | ||||||||||||||
10. SUBSEQUENT EVENTS
On May 21, 2014, 100% of the ordinary share capital of the project entities that comprise the Group, were sold to an affiliate of TerraForm Power, Inc.
For our combined financial statements as of March 31, 2014 and 2013 and for the three month periods ended March 31, 2014 and 2013, we have evaluated subsequent events through July 3, 2014, the date the combined financial statements were available to be issued.
F-90
Table of Contents
Imperial Valley Solar 1 Holdings II, LLC and Subsidiaries
Consolidated Balance Sheets
(In Thousands of U.S. Dollars)
(Unaudited)
| June 30, | December 31, | |||||||
| 2014 | 2013 | |||||||
| Assets |
||||||||
| Current assets: |
||||||||
| Cash and cash equivalents |
$ | 3,246 | $ | 2,481 | ||||
| Accounts receivable |
9,512 | 2,871 | ||||||
| Cash grant receivable |
5,675 | 111,933 | ||||||
| Prepaid expenses |
880 | 802 | ||||||
| Other current assets |
237 | 1,638 | ||||||
|
|
|
|
|
|||||
| Total current assets |
19,550 | 119,725 | ||||||
|
|
|
|
|
|||||
| Noncurrent assets: |
||||||||
| Restricted cash |
19,426 | 510 | ||||||
| Property, plant and equipment, net of accumulated depreciation of $12,666 and $1,943, respectively |
564,659 | 522,015 | ||||||
| Construction in progress |
— | 126,073 | ||||||
| Intangible assets, net of amortization of $723 and $82, respectively |
33,905 | 34,547 | ||||||
| Deferred financing costs, net of accumulated amortization of $1,960 and $1,826, respectively |
1,699 | 1,375 | ||||||
| Long-term prepaid |
2,676 | 2,929 | ||||||
|
|
|
|
|
|||||
| Total noncurrent assets |
622,365 | 687,449 | ||||||
|
|
|
|
|
|||||
| Total assets |
$ | 641,915 | $ | 807,174 | ||||
|
|
|
|
|
|||||
| Liabilities and member’s equity |
||||||||
| Liabilities: |
||||||||
| Current liabilities: |
||||||||
| Accounts payable |
$ | 1,869 | $ | 1,081 | ||||
| Accounts payable – related parties |
1,362 | 8,586 | ||||||
| Accrued expenses |
14,669 | 81,790 | ||||||
| Current portion of long-term debt, net of unamortized discount of $90 and $5,861, respectively |
12,792 | 98,699 | ||||||
|
|
|
|
|
|||||
| Total current liabilities |
30,692 | 190,156 | ||||||
|
|
|
|
|
|||||
| Noncurrent liabilities: |
||||||||
| Long-term debt, net of unamortized discount of $1,407 and $1,134, respectively |
399,032 | 401,306 | ||||||
| Asset retirement obligation |
2,999 | 2,333 | ||||||
|
|
|
|
|
|||||
| Total noncurrent liabilities |
402,031 | 403,639 | ||||||
|
|
|
|
|
|||||
| Member’s equity: |
||||||||
| Contributed capital |
143,461 | 222,789 | ||||||
| Accumulated deficit |
(18,127 | ) | (17,209 | ) | ||||
| Noncontrolling interest |
83,858 | 7,799 | ||||||
|
|
|
|
|
|||||
| Total member’s equity |
209,192 | 213,379 | ||||||
|
|
|
|
|
|||||
| Total liabilities and member’s equity |
$ | 641,915 | $ | 807,174 | ||||
|
|
|
|
|
|||||
See accompanying notes.
F-91
Table of Contents
Imperial Valley Solar 1 Holdings II, LLC and Subsidiaries
Consolidated Statements of Operations
(In Thousands of U.S. Dollars)
(Unaudited)
| Three months ended June 30, |
Six months ended June 30, |
|||||||||||||||
| 2014 | 2013 | 2014 | 2013 | |||||||||||||
| Revenues |
$ | 14,088 | $ | — | $ | 23,032 | $ | — | ||||||||
| Cost of revenues |
9,463 | — | 16,223 | — | ||||||||||||
|
|
|
|
|
|
|
|
|
|||||||||
| Gross profit |
4,625 | — | 6,809 | — | ||||||||||||
|
|
|
|
|
|
|
|
|
|||||||||
| Operating expenses: |
||||||||||||||||
| General and administrative expenses |
402 | 228 | 714 | 655 | ||||||||||||
|
|
|
|
|
|
|
|
|
|||||||||
| Total operating expenses |
402 | 228 | 714 | 655 | ||||||||||||
|
|
|
|
|
|
|
|
|
|||||||||
| Profit (loss) from continued operations |
4,223 | (228 | ) | 6,095 | (655 | ) | ||||||||||
|
|
|
|
|
|
|
|
|
|||||||||
| Interest income |
4 | 83 | 5 | 133 | ||||||||||||
| Interest expense |
(11,670 | ) | (1,543 | ) | (19,636 | ) | (5,647 | ) | ||||||||
| Loss on sale of assets |
(189 | ) | — | (189 | ) | — | ||||||||||
|
|
|
|
|
|
|
|
|
|||||||||
| Net loss |
(7,632 | ) | (1,688 | ) | (13,725 | ) | (6,169 | ) | ||||||||
| (Loss) / gain attributable to noncontrolling interest |
(7,874 | ) | — | (12,807 | ) | — | ||||||||||
|
|
|
|
|
|
|
|
|
|||||||||
| Net loss attributable to Imperial Valley Solar 1 Holdings II, LLC (member) |
$ | 242 | $ | (1,688 | ) | $ | (918 | ) | $ | (6,169 | ) | |||||
|
|
|
|
|
|
|
|
|
|||||||||
See accompanying notes.
F-92
Table of Contents
Imperial Valley Solar 1 Holdings II, LLC and Subsidiaries
Consolidated Statements of Changes in Member’s Equity
(In Thousands of U.S. Dollars)
(Unaudited)
| Contributed Capital |
Accumulated Deficit |
Noncontrolling Interest |
Total Member’s Equity |
|||||||||||||
| Balance at December 31, 2013 |
$ | 222,789 | $ | (17,209 | ) | $ | 7,799 | $ | 213,379 | |||||||
| Net loss |
— | (918 | ) | (12,807 | ) | (13,725 | ) | |||||||||
| Contributions |
10,377 | — | 89,705 | 100,082 | ||||||||||||
| Distributions |
(89,705 | ) | — | — | (89,705 | ) | ||||||||||
| Financing fees paid on behalf of noncontrolling interest |
— | — | (839 | ) | (839 | ) | ||||||||||
|
|
|
|
|
|
|
|
|
|||||||||
| Balance at June 30, 2014 |
$ | 143,461 | $ | (18,127 | ) | $ | 83,858 | $ | 209,192 | |||||||
|
|
|
|
|
|
|
|
|
|||||||||
See accompanying notes.
F-93
Table of Contents
Imperial Valley Solar 1 Holdings II, LLC and Subsidiaries
Consolidated Statements of Cash Flows
(In Thousands of U.S. Dollars)
(Unaudited)
| Six Months Ended June 30, |
||||||||
| 2014 | 2013 | |||||||
| Operating activities |
||||||||
| Net loss |
$ | (918 | ) | $ | (6,169 | ) | ||
| Adjustments to reconcile net loss to net cash used in operating activities: |
||||||||
| Depreciation |
10,718 | — | ||||||
| Accretion on asset retirement obligation |
81 | — | ||||||
| Amortization of financing costs |
7,278 | 1,507 | ||||||
| Amortization of intangible assets |
641 | — | ||||||
| Noncontrolling interest |
(12,807 | ) | — | |||||
| Changes in operating assets and liabilities: |
||||||||
| Accounts receivable |
(6,641 | ) | — | |||||
| Prepaid expenses |
143 | (334 | ) | |||||
| Other current assets |
(450 | ) | (105 | ) | ||||
| Other noncurrent assets |
— | (778 | ) | |||||
| Accounts payable and accrued expenses |
570 | (57 | ) | |||||
| Accounts payable and accrued expenses – related parties |
137 | 600 | ||||||
|
|
|
|
|
|||||
| Net cash used in operating activities |
(1,248 | ) | (5,336 | ) | ||||
|
|
|
|
|
|||||
| Investing activities |
||||||||
| Increase in restricted cash |
(18,916 | ) | 301,969 | |||||
| Capital expenditures |
(64,862 | ) | (300,951 | ) | ||||
| Receipt of government grants |
197,594 | — | ||||||
|
|
|
|
|
|||||
| Net cash provided by investing activities |
113,816 | 1,018 | ||||||
|
|
|
|
|
|||||
| Financing activities |
||||||||
| Proceeds from project financing |
72,960 | — | ||||||
| Repayment of borrowings |
(166,638 | ) | — | |||||
| Financed capital expenditures |
(18,470 | ) | (450 | ) | ||||
| Financing fees |
345 | 4,712 | ||||||
|
|
|
|
|
|||||
| Net cash (used in) provided by financing activities |
(111,803 | ) | 4,262 | |||||
|
|
|
|
|
|||||
| Total change in cash and cash equivalents |
765 | (56 | ) | |||||
| Cash and cash equivalents, beginning of period |
2,481 | 927 | ||||||
|
|
|
|
|
|||||
| Cash and cash equivalents, end of period |
$ | 3,246 | $ | 871 | ||||
|
|
|
|
|
|||||
| Supplemental disclosures |
||||||||
| Interest paid, net of amount capitalized |
$ | 11,543 | $ | 4,408 | ||||
| Noncash increases (decreases) to property, plant and equipment and construction in progress: |
||||||||
| Amortization of prepaid expenses |
$ | 221 | $ | 834 | ||||
| Accounts payable and accrued expenses |
$ | 15,392 | $ | 2,414 | ||||
| Asset retirement obligation |
$ | 584 | $ | — | ||||
| Cash grant receivable |
$ | (91,336 | ) | $ | — | |||
| Other noncash investing and financing activities: |
||||||||
| Noncash contributions from member |
$ | 10,032 | $ | — | ||||
| Noncash distribution to member |
$ | (89,705 | ) | $ | — | |||
| Noncash contribution from noncontrolling interest |
$ | 89,705 | $ | — | ||||
See accompanying notes.
F-94
Table of Contents
Imperial Valley Solar 1 Holdings II, LLC and Subsidiaries
Notes to the Consolidated Financial Statements
(In Thousands of U.S. Dollars)
For the Six Months Ended June 30, 2014
(Unaudited)
1. Summary of Significant Accounting Policies
Nature of Business
Imperial Valley Solar 1 Holdings II, LLC (IVS 1 Holdings II) is a holding company that through its subsidiaries (collectively, the Company), was formed for the purpose of developing, constructing, owning and operating a utility-scale photovoltaic solar energy project with a capacity of 266 megawatts (MW) located in Calexico, California, United States, known as Mount Signal Solar (MSS).
IVS 1 Holdings II is wholly owned by SRP Power, LLC (Member), which is ultimately owned by Silver Ridge Power, LLC (SRP). As of June 30, 2014, SRP is a joint venture of The AES Corporation (AES Corp), and Riverstone/Carlyle Renewable Energy Partners II, LP (Riverstone). On July 2, 2014, SunEdison, Inc. purchased AES Corp interest in SRP, including the Company but excluding certain other assets. AES Corp and Riverstone as of June 30, 2014 and SunEdison and Riverstone as of July 2, 2014 are the ultimate controlling parties of the Company as they exercise joint control over SRP.
IVS 1 Holdings II was formed on September 24, 2012 at which point SRP Power, LLC contributed its existing equity interests in Imperial Valley Solar 1 Holdings, LLC (a subsidiary in which it held a controlling financial interest) to IVS 1 Holdings II, in exchange for equity interests in IVS 1 Holdings II. As a result, IVS 1 Holdings II became the owner of Imperial Valley Solar 1, LLC, an entity formed on April 9, 2012 for the purpose of developing, constructing, owning and operating the MSS project.
The commercial operation of MSS was recognized in three phases: the initial phase of 139 MW was placed into service on November 22, 2013 (Phase I), the second phase of 72.91 MW on December 20, 2013 (Phase II), and the last phase of 54 MW on March 4, 2014 (Phase III).
Interim Financial Presentation
The accompanying unaudited consolidated financial statements and footnotes of the Company have been prepared in accordance with generally accepted accounting principles in the United States of America (U.S. GAAP), as contained in the Financial Accounting Standards Board (FASB) Accounting Standards Codification, for interim financial information and Article 10 of Regulation S-X issued by the U.S. Securities and Exchange Commission (SEC). Adjustments of a normal recurring nature necessary for a fair presentation of the results of operations, financial position, and cash flows have been made. The results of operations for the three and six months ended June 30, 2014 are not necessarily indicative of results that may be expected for the year ending December 31, 2014.
The accompanying consolidated financial statements are unaudited and should be read in conjunction with the Imperial Valley Solar 1 Holdings II, LLC and Subsidiaries audited consolidated financial statements and notes thereto as of December 31, 2013 and 2012 and for the years ended December 31, 2013 and for the period from September 24, 2012 (Date of Inception) to December 31, 2012.
There have been no significant changes to our accounting policies, nor have we adopted any new pronouncements, since December 31, 2013.
F-95
Table of Contents
Imperial Valley Solar 1 Holdings II, LLC and Subsidiaries
Notes to the Consolidated Financial Statements—(Continued)
(In Thousands of U.S. Dollars)
(Unaudited)
The consolidated financial statements are presented in U.S. Dollars and all values are rounded to the nearest thousand ($000), except when otherwise indicated.
Principles of Consolidation
Subsidiaries are fully consolidated from the date of their acquisition, being the date on which the Company obtains control, and continue to be consolidated until the date when such control ceases. The financial statements of the subsidiaries are prepared for the same reporting period as the parent company, using consistent accounting policies. Investments in which the Company does not have control but has the ability to exercise significant influence are accounted for using the equity method of accounting. All intercompany balances, transactions, unrealized gains and losses resulting from intercompany transactions are eliminated in the accompanying consolidated financial statements.
The accompanying consolidated financial statements include the accounts and results of operations of IVS 1 Holdings II, its wholly owned subsidiaries and those entities in which the Company has a controlling financing interest and which are required to be consolidated under applicable accounting standards. The usual condition for a controlling financial interest is ownership of a majority of the voting interests of an entity; however, a controlling financial interest may also exist in entities such as variable interest entities (VIEs), through arrangements that do not involve controlling voting interests.
A VIE is an entity (a) that has a total equity investment at risk that is not sufficient to finance its activities without additional subordinated financial support or (b) where the group of equity holders does not have (i) the ability to make significant decisions about the entity’s activities, (ii) the obligation to absorb the entity’s expected losses or (iii) the right to receive the entity’s expected residual returns; or (c) where the voting rights of some equity holders are not proportional to their obligations to absorb expected losses, receive expected residual returns, or both, and substantially all of the entity’s activities either involve or are conducted on behalf of an investor that has disproportionately few voting rights.
The determination of which party has the power to direct the activities that most significantly impact the economic performance of the VIE could require significant judgment and assumptions. That determination considers the purpose and design of the business, the risks that the business was designed to create and pass along to other entities, the activities of the business that can be directed and which party can direct them, and the expected relative impact of the activities on the economic performance of the business throughout its life. The Company has no VIEs.
Use of Estimates
The preparation of financial statements in conformity with U.S. GAAP requires the Company to make estimates and assumptions that affect amounts reported in the accompanying consolidated financial statements and notes. Actual results could differ from those estimates. The Company’s significant estimates include the carrying amount and the estimated useful lives of its long-lived assets and the fair value of financial instruments.
Concentration of Credit Risk
The Company is exposed to concentrations of credit risk primarily related to cash and cash equivalents and restricted cash. The Company mitigates its exposure to credit risk by maintaining deposits at highly rated financial institutions and by monitoring the credit quality of the related financial institution and counterparties of the Company’s contracts.
F-96
Table of Contents
Imperial Valley Solar 1 Holdings II, LLC and Subsidiaries
Notes to the Consolidated Financial Statements—(Continued)
(In Thousands of U.S. Dollars)
(Unaudited)
The Company’s operations are concentrated within the United States, and any changes to government policies for renewable energy, including revisions or changes to renewable energy tax legislation, could have a negative effect on the Company’s activities, financial condition, and results of operations.
Cash and Cash Equivalents
The Company considers unrestricted cash on hand and deposits in banks to be cash and cash equivalents; such balances approximate fair value at June 30, 2014 and December 31, 2013. The Company had $3,246 and $2,481 cash and cash equivalents as of June 30, 2014 and December 31, 2013, respectively.
Restricted Cash
Restricted cash includes cash and cash equivalents that are restricted as to withdrawal or usage. The nature of restriction includes restrictions imposed by the financing agreement, power purchase agreement (PPA) and debt service reserve (see Note 5 – Cash and Cash Equivalents and Restricted Cash). The construction disbursement account receives the proceeds of all construction loans and makes disbursements for the payment of construction costs.
Accounts Receivable and Allowance for Doubtful Accounts
The Company reviews its accounts receivable for collectability and records an allowance for doubtful accounts for estimated uncollectible accounts receivable. Accounts receivable are written off when they are no longer deemed collectible. Write-offs would be deducted from the allowance and subsequent recoveries would be added. The allowance is based on the Company’s assessment of known delinquent accounts, historical experience and other currently available evidence of the collectability and the aging of accounts receivable. The underlying assumptions, estimates and assessments the Company uses to provide for losses are updated to reflect the Company’s view of current conditions. Changes in such estimates could significantly affect the allowance for losses. It is possible the Company will experience credit losses that are different from the Company’s current estimates. Based on the Company’s assessment performed at June 30, 2014 and December 31, 2013, no allowance for doubtful accounts was necessary.
Income Taxes
The Company and its subsidiaries are limited liability companies treated as partnerships and single-member disregarded entities for U.S. income tax purposes. As such, U.S. federal and state income taxes are generally not recognized at the entity level but instead, income is taxed at the owner-member level. Accordingly, the Company and its subsidiaries do not have liabilities for U.S. federal or state taxes and, therefore, no current income taxes or deferred income taxes are reflected in these financial statements.
Noncontrolling Interest
Mount Signal Tax Equity Financing
On August 15, 2013, Imperial Valley Solar 1 Holdings, LLC (IVS1 Holdings), a subsidiary of the Company, entered into an arrangement that admitted a noncontrolling shareholder as a partner (tax
F-97
Table of Contents
Imperial Valley Solar 1 Holdings II, LLC and Subsidiaries
Notes to the Consolidated Financial Statements—(Continued)
(In Thousands of U.S. Dollars)
(Unaudited)
equity investor) in the MSS Project, and received net proceeds of $9,000 on October 9, 2013 in return. IVS1 Holdings received an additional non-cash contribution of $89,705 (Cash Grant Capital Contribution) on June 27, 2014 upon satisfaction of a set of conditions precedent to this contribution where cash in the amount of $89,705 was received by SRP. Under the terms of the arrangement, the tax equity investor will receive disproportionate returns on its investment of the profit or loss, and will share in the cash distributions from MSS. The preferential return period continues until the tax equity investor recovers its investment and achieves a cumulative after-tax return of 20%.
IVSI Holdings currently estimates the preferential return period to end on December 31, 2023. The length of the preferential return period is dependent upon estimated future cash flows as well as projected tax benefits. At the end of the preferential return period, IVS1 Holdings will continue to share in the profit or loss and in the cash distributions at rates pursuant to the agreement with the tax equity investor. During and beyond the preferential return period, IVS1 Holdings retains a class of membership interests which provide it with day-to-day operational and management control of MSS. However, certain decisions require the approval of the tax equity investor.
Under the IVS1 Holdings tax equity structure, the Company is the managing member and responsible for the management of MSS. The tax equity member is viewed as a passive investor in MSS, although it is afforded certain rights related to major decisions. As the managing member, the Company is responsible for day-to-day operating decisions related to MSS and for preparing the annual operating and capital expenditure budgets. If a proposed operating budget exceeds the prior year’s budget by a certain percentage, the tax equity member has the right to veto the variation from budget. The tax equity member is also provided other customary protective rights.
Property, Plant and Equipment
Property, plant and equipment (PPE) is stated at cost, net of accumulated depreciation and/or accumulated impairment losses, if any. Such costs include the costs of replacing component parts of the PPE and borrowing costs for long-term construction projects if the recognition criteria are met.
Land option payments are reclassified to PPE once the option is exercised. All other pre-development project costs are expensed during the pre-development sub-phase. Once the pre-development sub-phase is completed, a solar project advances to the development sub-phase, financing, engineering and construction phases. Costs incurred in these phases are capitalized as incurred and presented as Construction in progress (CIP). Payments for engineering costs, insurance costs, salaries, interest and other costs directly relating to CIP are capitalized during the construction period provided the completion of the project is deemed probable, or expensed at the time the Company determines that development of a particular project is no longer probable. Project costs that are paid 90 days after they are incurred are considered to have been financed and are therefore classified as financed capital expenditures in the consolidated statement of cash flows.
The continued capitalization of such costs was subject to ongoing risks related to successful completion, including those related to government approvals, siting, financing, constructing, permitting and contract compliance. Revenues earned before a project is placed in service are recorded as a reduction to the related project’s cost. Once a project is placed in service, all accumulated costs are reclassified from CIP to PPE, and become subject to depreciation or amortization. For the six months ended June 30, 2014, the Company recorded $421 of revenues before Phase III was placed in service. For the six months ended June 30, 2013, the Company did not earn any revenue.
F-98
Table of Contents
Imperial Valley Solar 1 Holdings II, LLC and Subsidiaries
Notes to the Consolidated Financial Statements—(Continued)
(In Thousands of U.S. Dollars)
(Unaudited)
Many of the Company’s construction and equipment procurement agreements contain damage clauses relating to construction delays and contractually specified performance targets. These clauses are negotiated to cover lost margin or revenues from the Solar Projects in the event of nonperformance. Liquidated damages are those payments received from contractors that are related to a failure to meet contractually specified performance targets or completion dates prior to commercial operations and are recorded as a reduction to the cost of Solar Projects.
Assets related to the generation of energy are generally placed in service when the power plant is electrically and mechanically complete and is able to operate safely. The Company generally considers this milestone achieved when (a) the following items are completed: (i) inverters are calibrated and operating in accordance with manufacturing specifications, (ii) isolation testing has been successfully completed, (iii) generation equipment has been tested in accordance with manufacturer specifications, (iv) preliminary load testing has been successfully completed and (v) electrical protection checking has been successfully completed and (b) the plant is connected to the electrical grid. For large plants which may be commissioned in sections, a power plant may be placed in service in stages. Any shared assets will be placed in service when the first portion is placed in service.
Land owned by the Company is not depreciated. Land has an unlimited useful life. The Company’s depreciation of PPE is computed using the straight-line method over the estimated useful lives of the assets, which are accounted for on a component basis. At June 30, 2014, the useful lives of the Company’s components are as follows:
| Panels |
25 years | |
| Structures |
25 years | |
| Inverters |
25 years | |
| Transformer |
20-25 years | |
| Other items |
5 years | |
| Leasehold improvements |
Over the lesser of the useful life or the term of the land lease |
Upon Phase I and II of MSS being placed in service during 2013 and Phase III in March 2014, the depreciation of PPE commenced for each phase.
An item of PPE and any other significant part initially recognized is derecognized upon disposal or when no future economic benefits are expected from its use or disposal. Any gain or loss arising on de-recognition of the asset (calculated as the difference between the net disposal proceeds and the carrying amount of the asset) is included in the consolidated Statements of Operations when the asset is derecognized. For the periods presented, the Company did not recognize any gain or loss on the derecognition of assets.
All repair and maintenance costs that do not meet capitalization criteria are recognized in the Consolidated Statements of Operations as incurred.
The assets’ residual values, useful lives and methods of depreciation are reviewed at each financial year-end and adjusted prospectively, if appropriate.
F-99
Table of Contents
Imperial Valley Solar 1 Holdings II, LLC and Subsidiaries
Notes to the Consolidated Financial Statements—(Continued)
(In Thousands of U.S. Dollars)
(Unaudited)
Capitalized Interest
The Company capitalizes interest on borrowed funds used to finance capital projects. Capitalization is discontinued once a phase of the project is placed in service. The capitalized interest during construction is classified in CIP in the accompanying Consolidated Balance Sheets (see Note 3 – Construction in Progress). Once placed in service, the capitalized interest is classified in PPE in the accompanying Consolidated Balance Sheets (see Note 2 – Property, Plant and Equipment).
Asset Retirement Obligation
In accordance with the accounting standards for asset retirement obligations (AROs), the Company records the fair value of the liability for a legal obligation to retire an asset in the period in which the obligation is incurred if a reasonable estimate of fair value can be made.
When a new liability is recognized, the Company capitalizes the costs of the liability by increasing the carrying amount of the related long-lived asset. The liability is accreted to its present value each period and the capitalized cost is depreciated over the useful life of the related asset. Accretion expense is calculated by applying the effective interest rate to the carrying amount of the liability at the beginning of each period and is included in cost of revenues in the accompanying Consolidated Statements of Operations. The effective interest rate is the credit-adjusted risk-free rate applied when the liability (or portion of the liability) was initially measured and recognized. Changes resulting from revisions to the timing or amount of the original estimates of cash flows are recognized as an increase or a decrease in the asset retirement cost and AROs.
The Company recognized an ARO as of June 30, 2014 and December 31, 2013 related to the MSS project (see Note 12 – Asset Retirement Obligation).
Recoverability of Long-Lived Assets
The Company evaluates the recoverability of its long-lived assets whenever events or changes in circumstances indicate that their carrying amount may not be recoverable. The carrying amount of the Company’s long-lived assets is considered impaired when their anticipated undiscounted cash flows are less than their carrying value. Impairment is measured as the difference between the discounted expected future cash flows and the assets’ carrying amount.
The Company’s long-lived assets are primarily comprised of property, plant and equipment and intangibles.
For the three and six months ended June 30, 2014 and 2013, the Company has not recognized any impairment losses on its long-lived assets.
Financing Costs
Financing costs are deferred and amortized over the related financing period using the effective interest method. The initial fees paid directly to the lenders under the nonrecourse agreement have been classified as debt discount and included in long-term debt on the Consolidated Balance Sheets. The amortization of deferred financing costs and debt discount is included as interest expense in the accompanying Consolidated Statements of Operations unless capitalized as part of PPE (see Note 11 – Long-Term Debt).
F-100
Table of Contents
Imperial Valley Solar 1 Holdings II, LLC and Subsidiaries
Notes to the Consolidated Financial Statements—(Continued)
(In Thousands of U.S. Dollars)
(Unaudited)
Accounts Payable and Accrued Expenses
Accounts payable and accrued expenses consist of accounts due to vendors related to the Company’s operations and construction. The nature of these payables relates to costs for legal, maintenance, spare parts, administrative, and accrued construction and operation costs.
Leases
Leases that meet certain criteria are classified as capital leases, and assets and liabilities are recorded at amounts equal to the lesser of the present value of the minimum lease payments or the fair value of the leased properties at the beginning of the respective lease terms. Leases that do not meet such criteria are classified as operating leases. When the Company is the lessee, related rentals are charged to expense on a straight-line basis. As a lessee, the Company did not have any capital or operating leases as of June 30, 2014 or December 31, 2013.
The Company is a lessor under the terms of a long-term PPA for the sale of electricity and green credits. The term of the PPA is for 25 years. Under this agreement, the Company will recognize revenue as energy is delivered (see Note 1 – Summary of Significant Accounting Policies – Revenue Recognition).
Fair Value
Fair value, as defined in the fair value measurement accounting guidance, is the price that would be received to sell an asset or paid to transfer a liability in an orderly transaction between market participants at the measurement date, or exit price. The Company follows the fair value measurement accounting guidance for financial assets and liabilities and for nonfinancial assets and liabilities measured on a nonrecurring basis. The fair value measurement accounting guidance requires that the Company make assumptions market participants would use in pricing an asset or liability based on the best information available. Reporting entities are required to consider factors that were not previously measured when determining the fair value of financial instruments. These factors include nonperformance risk and credit risk. The fair value measurement guidance prohibits inclusion of transaction costs and any adjustments for blockage factors in determining the instruments’ fair value. The principal or most advantageous market should be considered from the perspective of the reporting entity.
Fair value, where available, is based on observable quoted market prices. Where observable prices or inputs are not available, several valuation models and techniques are applied. These models and techniques attempt to maximize the use of observable inputs and minimize the use of unobservable inputs. The process involves varying levels of management judgment, the degree of which is dependent on the price transparency of the instruments or market and the instruments’ complexity.
To increase consistency and enhance disclosure of the fair value, the fair value measurement accounting guidance creates a fair value hierarchy to prioritize the inputs used to measure fair value into three categories. An asset’s or liability’s level within the fair value hierarchy is based on the lowest level of input significant to the fair value measurement, where Level 1 is the highest and Level 3 is the lowest. The three levels are defined as follows:
| • | Level 1 – Quoted prices in active markets for identical assets or liabilities. |
F-101
Table of Contents
Imperial Valley Solar 1 Holdings II, LLC and Subsidiaries
Notes to the Consolidated Financial Statements—(Continued)
(In Thousands of U.S. Dollars)
(Unaudited)
| • | Level 2 – Observable inputs other than quoted prices included in Level 1, such as quoted prices for similar assets and liabilities in active markets, quoted prices for identical or similar assets and liabilities in markets that are not active, or other inputs that are observable or can be corroborated by observable market data. |
| • | Level 3 – Unobservable inputs that are supported by little or no market activity and that are significant to the fair value of the assets or liabilities. This includes certain pricing models, discounted cash flow methodologies and similar techniques that use significant unobservable inputs. |
Revenue Recognition
The Company is party to a PPA for the sale of electricity and green credits. The PPA has been evaluated and classified as an operating lease with a non-lease element. Thus, the Company recognizes revenue based upon rates specified in the PPA when the electricity is delivered. The Company commenced the recognition of revenue upon Phase I being placed into service on November 22, 2013.
Green credits are renewable energy certificates that are created based on the amount of renewable energy generated and are used to meet renewable energy portfolio standards of a jurisdiction. Pursuant to the accounting standards for revenue recognition, transfer is not considered to have occurred until the customer takes title to the product. The recognition of the sale of green credits is classified as Revenues in the accompanying Consolidated Statements of Operations. All revenue recognized for the three and six months ended June 30, 2014 was for electricity sales and green credits.
General and Administrative Expenses
General and administrative expenses include corporate and other expenses related to corporate staff functions and initiatives which include executive management, finance and accounting, legal, human resources and information systems.
Cash Grant
The Company recognizes government grants when there is reasonable assurance that both; the entity complied with all the conditions set forth by the respective government, and that the grant will be received. Government grants whose primary condition relates to the purchase, construction or acquisition of long-lived assets are recognized by reducing the asset by the grant amount. (See Note 6 – Cash Grant Receivable.)
Accounting Pronouncements Issued But Not Yet Effective
The following accounting standards have been issued but are not yet effective for nor have been adopted by the Company.
F-102
Table of Contents
Imperial Valley Solar 1 Holdings II, LLC and Subsidiaries
Notes to the Consolidated Financial Statements—(Continued)
(In Thousands of U.S. Dollars)
(Unaudited)
ASU No. 2014-09, Revenue from Contracts with Customers (Topic 606)
In May 2014, the FASB issued ASU No. 2014-09, Revenue from Contracts with Customers, which requires an entity to recognize the amount of revenue to which it expects to be entitled for the transfer of promised goods or services to customers. ASU 2014-09 will replace most existing revenue recognition guidance in U.S. GAAP when it becomes effective. ASU 2014-09 is effective for us on January 1, 2017. Early application is not permitted. The standard permits the use of either a retrospective or cumulative effect transition method. We have not determined which transition method we will adopt, and we are currently evaluating the impact that ASU 2014-09 will have on our consolidated financial statements and related disclosures upon adoption.
ASU No. 2014-15, Subtopic 205-40, Presentation of Financial Statements - Going Concern (Topic 718)
In August 2014, the FASB issued ASU No. 2014-15, Presentation of Financial Statements - Going Concern (Subtopic 205-40): Disclosure of Uncertainties about an Entity’s Ability to Continue as a Going Concern, which requires management to evaluate, at each annual and interim reporting period, whether there are conditions or events that raise substantial doubt about the entity’s ability to continue as a going concern within one year after the date the financial statements are issued and to provide related disclosures. ASU 2014-15 is effective for us for our fiscal year ending December 31, 2016 and for interim periods thereafter. We are currently evaluating the impact of this standard on our consolidated financial statements.
2. Property, Plant and Equipment
Upon Phases I and II of the MSS project being placed in service during 2013 and Phase III being placed in service on March 4, 2014, the total balance of Construction in Progress (CIP) balance related to the respective phase as well as the shared asset were reclassified to property, plant and equipment (PPE) and depreciation commenced.
| June 30, 2014 |
December 31, 2013 |
|||||||
| Land |
$ | 9,206 | $ | 9,206 | ||||
| Solar power generation equipment |
565,091 | 512,318 | ||||||
| Asset retirement costs |
2,907 | 2,322 | ||||||
| Office, furniture and equipment |
121 | 112 | ||||||
| Less: Accumulated depreciation |
(12,666 | ) | (1,943 | ) | ||||
|
|
|
|
|
|||||
| Total property, plant and equipment, net |
$ | 564,659 | $ | 522,015 | ||||
|
|
|
|
|
|||||
For the three and six months ended June 30, 2014, the depreciation expense was $5,478 and $10,718, respectively. There was no depreciation recorded for the three and six months ended June 30, 2013.
PPE was reduced by $91,336 for Phases II and III during the six months ended June 30, 2014 and by $111,933 for Phase I during the year ended December 31, 2013 for the amount of the Cash Grant Receivable that was recorded during these periods (refer to Note 6 – Cash Grant Receivable).
All of the PPE was pledged as a security for the Company’s debt as of June 30, 2014 and December 31, 2013.
F-103
Table of Contents
Imperial Valley Solar 1 Holdings II, LLC and Subsidiaries
Notes to the Consolidated Financial Statements—(Continued)
(In Thousands of U.S. Dollars)
(Unaudited)
3. Construction in Progress
The MSS project was fully placed in service on March 4, 2014, therefore, as of June 30, 2014, the Company no longer had a balance in CIP. As of December 31, 2013, the Company had CIP of $126,073 related to Phase III, while Phase I and Phase II of the MSS project were placed into service as of December 31, 2013. Capitalized costs in CIP included panels, compensation, insurance costs, capitalized interest and overhead costs related to persons directly involved in the development and/or construction of the MSS project.
Interest and certain fees deferred and amortized in connection with the Company’s debt have been capitalized during the period of construction. The Company capitalized interest in the amount of $3,625 during the three months ended March 31, 2014, $6,018 during the three months ended June 30, 2013 and $9,643 during the six months ended June 30, 2013. As all the phases of the MSS project were placed into service, there was no interest capitalized during the three month period ended June 30, 2014.
4. Intangible Assets
The Company has intangible assets of $33,905 and $34,547 as of June 30, 2014 and December 31, 2013, respectively. Intangible assets include land control rights, rights to an interconnection agreement, land permits and the PPA. For the three and six months ended June 30, 2014, amortization expense related to intangible assets subject to amortization was $391 and $641, respectively. There was no amortization expense recorded for the three and six months ended June 30, 2013.
The following summarizes the estimated amortization expense as of June 30, 2014:
| Years Ending December 31, | ||||||||||||||||||||||||||||
| 2014 | 2015 | 2016 | 2017 | 2018 | Thereafter | Total | ||||||||||||||||||||||
| Amortizable intangibles |
$ | 693 | $ | 1,385 | $ | 1,385 | $ | 1,385 | $ | 1,385 | $ | 27,672 | $ | 33,905 | ||||||||||||||
The average useful life of intangible assets subject to amortization is 25 years.
5. Cash and Cash Equivalents and Restricted Cash
As of June 30, 2014 and December 31, 2013, the Company had cash and cash equivalents of $3,246 and $2,481, respectively. As of June 30, 2014 and December 31, 2013, the Company had restricted cash of $19,426 and $510, respectively. As of June 30, 2014 restricted cash was held in a construction completion reserve account (expected to be released in the first half of 2015) and interconnection agreement account (expected to be released in 2016) administered by a financial institution on behalf of the Company for the payment of remaining construction costs and interconnection network upgrades. As of December 31, 2013, restricted cash was held in a construction disbursement bank account administered by a financial institution on behalf of the Company for the payment of construction costs. As of June 30, 2014 and December 31, 2013, there was no requirement and thus the Company had no cash restricted for debt service.
F-104
Table of Contents
Imperial Valley Solar 1 Holdings II, LLC and Subsidiaries
Notes to the Consolidated Financial Statements—(Continued)
(In Thousands of U.S. Dollars)
(Unaudited)
6. Cash Grant Receivable
On December 18, 2013, the Company applied for the cash grant under Section 1603, Payments for Specified Energy Property in Lieu of Tax Credits of the American Reinvestment and Recovery Act of 2009 for the Phase I of the MSS project (Phase I Cash Grant). The Company concluded that conditions were met on December 18, 2013 for the recognition of the Phase I Cash Grant and the Company recognized a Phase I Cash Grant receivable of $111,933 with a corresponding reduction of property, plant and equipment. On March 31, 2014, the Company received proceeds related to the Phase I Cash Grant receivable of $105,418.
On February 18, 2014 the Company applied for the cash grant under Section 1603, Payments for Specified Energy Property in Lieu of Tax Credits of the American Reinvestment and Recovery Act of 2009 for the Phase II of the MSS project (Phase II Cash Grant). The Company has concluded that conditions were met on February 18, 2014 for the recognition of the Phase II Cash Grant and the Company recognized a Phase II Cash Grant receivable of $59,089 with a corresponding reduction of property, plant and equipment. On April 21, 2014, the Company received proceeds related to the Phase II Cash Grant receivable of $55,380.
On March 31, 2014, the Company applied for the cash grant under Section 1603, Payments for Specified Energy Property in Lieu of Tax Credits of the American Reinvestment and Recovery Act of 2009 for the Phase III of the MSS project (Phase III Cash Grant). The Company has concluded that conditions were met on March 31, 2014 for the recognition of the Phase III Cash Grant and the Company recognized a Phase III Cash Grant receivable of $39,517 with a corresponding reduction of property, plant and equipment. On April 25, 2014, the Company received proceeds related to the Phase III Cash Grant receivable of $36,797.
The differences in payment for each phase from the amount applied for and the amount received where withheld from payment by the U.S. Treasury based on certain queries that the U.S. had with respect to the eligibility of certain costs for the cash grant. Following discussions with the U.S. Treasury, the Company has provided additional documentation supporting Management’s view that the costs are eligible; however, the U.S. Treasury may take a different view and therefore, during November 2014, the Company concluded that $7,269 may not be collectible. The outstanding Phase I, II, and III Cash Grant receivable balance of $12,944 was written down as of June 30, 2014 with a resulting increase in property, plant and equipment. The Company expects to be awarded and collect the remaining $5,675 in December 2014.
7. Prepayments
Prepayments as of June 30, 2014 and December 31, 2013 were $3,556 and $3,731, respectively. As of June 30, 2014 and December 31, 2013, $2,676 and $2,929 of the prepayments related to financing costs related to MSS financial close and insurance, which had been recognized as a long-term prepaid because the related debt for these facilities has not yet been drawn. The remaining prepayments related to prepaid plant insurance and other expenses.
8. Accounts Payable
Accounts payable as of June 30, 2014 and December 31, 2013 were $1,869 and $1,081, respectively, and related to amounts owed to third parties for construction, operation and maintenance, legal and environmental costs.
F-105
Table of Contents
Imperial Valley Solar 1 Holdings II, LLC and Subsidiaries
Notes to the Consolidated Financial Statements—(Continued)
(In Thousands of U.S. Dollars)
(Unaudited)
9. Accrued Expenses
Accrued expenses as of June 30, 2014 and December 31, 2013 were $14,669 and $81,790, respectively and are predominantly comprised of construction and operation costs not yet invoiced, consulting, audit fees and accrued interest.
10. Member’s Equity
The Company operates under the Operating Limited Liability Agreement (LLC Agreement) dated September 21, 2012. The authorized unit capital of the Company is 10 units.
At the closing of the financing for its MSS project in November 2012, the Company received an equity contribution of $108,955 in cash and an additional non-cash contribution for incurred project costs of $100,779. For the six months ended June 30, 2014, the Company received an additional cash contribution of $345, a non-cash contribution of $10,032 that included $8,199 related to the inception of noncontrolling interest for consultants, legal fees and environmental insurance (Refer to Note 14—Related Party Transactions) and provided a non-cash return of capital of $89,705 to Members from non-cash contribution by noncontrolling interests (refer to Note 1—Summary of Significant Accounting Policies).
The non-cash contribution to the Company included project rights and capitalized development and costs related to preparing the asset for its intended use. Project rights include land control rights, rights to an interconnection agreement, the PPA and land permits.
11. Long-Term Debt
In November 2012, the Company obtained financing for its MSS project. The financing arrangement included $415,700 in secured senior notes (Notes), a $220,000 cash grant bridge loan (CGBL) and a letter of credit facility (LC facility) of $79,640. The Company had fully drawn on the Notes as of December 31, 2012. The Notes are secured by a first priority security interest in the membership interests of the MSS project and all of its assets. The Notes bear interest at 6.00% and are due June 2038. Repayment of the Notes is scheduled to begin in the second half of 2014. The Notes are redeemable at the Company’s option, at par value plus accrued interest. Under the financing agreement for the notes, the Company is limited to the distribution of dividends until the project is in operation and all distribution requirements under the financing agreements are met. The distribution requirements were met once Phases I, II, and III were placed in service and loan covenants were met as of June 30, 2014. The first distribution took place in July 2014 (see Note 17—Subsequent Events).
The CGBL lenders had first priority on the proceeds from the cash grant. The CGBL was repaid with the cash grant. The Company has applied for the Cash Grant under Section 1603, Payments for Specified Energy Property in Lieu of Tax Credits of the American Reinvestment and Recovery Act of 2009 since commercial operation began on the first phase of the MSS project. During 2013, the Company started draws on the CGBL, as the proceeds from the Notes were fully utilized. As of December 31, 2013, the Company had an outstanding balance of $59,413 for CGBL. During the six months ended June 30, 2014, the Company drew an additional $72,960 under the CGBL facility. As of June 30, 2014, the loan was repaid in full.
F-106
Table of Contents
Imperial Valley Solar 1 Holdings II, LLC and Subsidiaries
Notes to the Consolidated Financial Statements—(Continued)
(In Thousands of U.S. Dollars)
(Unaudited)
Future maturities of the Notes are as follows as of June 30, 2014:
| Years ending December 31, |
||||
| 2014 |
$ | 10,882 | ||
| 2015 |
13,147 | |||
| 2016 |
18,022 | |||
| 2017 |
14,022 | |||
| 2018 |
14,324 | |||
| Thereafter |
342,925 | |||
|
|
|
|||
| Total |
$ | 413,322 | ||
|
|
|
The LC facility allows the MSS project to issue letters of credit to certain of its counterparties. The LC facility is secured by a security interest in the MSS project and by a second priority interest in proceeds from the Grant. Upon obtaining the financing in 2012, MSS issued $41,347 of letters of credit under the LC facility. A letter of credit issued in 2012 in relation to the procurement of modules for $6,500 was released and cancelled during 2013. During the six months ended June 30, 2014, the Company issued additional letters of credit of $38,499. As of June 30, 2014, the Company has $73,345 in letters of credit outstanding under the LC facility. The Company pays a commitment fee of 0.75% on the unused portion of the LC facility.
The outstanding indebtedness is as follows as of June 30, 2014:
| Current | Long-Term | Total Principal |
||||||||||
| Notes |
$ | 12,882 | $ | 400,440 | $ | 413,322 | ||||||
| Unamortized debt discount |
(90 | ) | (1,408 | ) | (1,498 | ) | ||||||
|
|
|
|
|
|
|
|||||||
| Total net debt outstanding |
$ | 12,792 | $ | 399,032 | $ | 411,824 | ||||||
|
|
|
|
|
|
|
|||||||
12. Asset Retirement Obligation
As of June 30, 2014, the Company had recorded an ARO of $2,999. The estimated liability is based on the future estimated costs associated with the dismantlement, demolition and removal of the solar power plant. The liability is calculated based on the following assumptions:
| Estimated useful life |
25 years | |||
| Inflation factor |
2.19 | |||
| Credit-adjusted risk-free discount rate |
6 | % |
The estimate of the ARO is based on projected future retirement costs and requires management to exercise significant judgment. Such costs could differ significantly when they are incurred.
For the three and six months ended June 30, 2014, the Company recognized accretion expense of $43 and $81, respectively. There was no accretion expense recognized for the three and six months ended June 30, 2013.
F-107
Table of Contents
Imperial Valley Solar 1 Holdings II, LLC and Subsidiaries
Notes to the Consolidated Financial Statements—(Continued)
(In Thousands of U.S. Dollars)
(Unaudited)
13. Fair Value
The fair value of current financial assets and liabilities and other deposits, approximates their reported carrying amounts due to their short maturities. The fair value of long-term debt is estimated differently based upon the type of loan.
| June 30, 2014 | December 31, 2013 | |||||||||||||||
| Carrying Amount |
Fair Value | Carrying Amount |
Fair Value | |||||||||||||
| Assets |
||||||||||||||||
| Cash and cash equivalents |
$ | 3,246 | $ | 3,246 | $ | 2,481 | $ | 2,481 | ||||||||
| Restricted cash |
19,426 | 19,426 | 510 | 510 | ||||||||||||
| Accounts receivable |
9,512 | 9,512 | 2,871 | 2,871 | ||||||||||||
|
|
|
|
|
|
|
|
|
|||||||||
| Total assets |
$ | 32,184 | $ | 32,184 | $ | 5,862 | $ | 5,862 | ||||||||
|
|
|
|
|
|
|
|
|
|||||||||
| Liabilities |
||||||||||||||||
| Accounts payable |
$ | 1,869 | $ | 1,869 | $ | 1,081 | $ | 1,081 | ||||||||
| Accounts payable – related parties |
1,362 | 1,362 | 8,586 | 8,586 | ||||||||||||
| Accrued expenses |
14,669 | 14,669 | 81,790 | 81,790 | ||||||||||||
| Debt |
411,824 | 421,738 | 500,005 | 488,864 | ||||||||||||
|
|
|
|
|
|
|
|
|
|||||||||
| Total liabilities |
$ | 429,724 | $ | 439,638 | $ | 591,462 | $ | 580,321 | ||||||||
|
|
|
|
|
|
|
|
|
|||||||||
Valuation Techniques
The fair value measurement accounting guidance describes three main approaches to measuring the fair value of assets and liabilities: (1) market approach; (2) income approach and (3) cost approach. The market approach would use prices and other relevant information generated from market transactions involving identical or comparable assets or liabilities. The income approach would use valuation techniques to convert future amounts to a single present value amount. The measurement is based on the value indicated by current market expectations about those future amounts. The cost approach is based on the amount that would currently be required to replace an asset. All financial assets and liabilities (other than debt) are classified as Level 1 in the fair value hierarchy for the purpose of determining and disclosing the fair value of financial instruments.
Debt
The fair value of debt is estimated differently based upon the type of loan. For variable rate loans and fixed rate loans with maturity of less than one year, carrying value approximates fair value. The fair value of fixed rate loans is estimated using a discounted cash flow analysis. In the discounted cash flow analysis, the discount rate is based on the credit rating of the individual debt instruments, if available, or the credit rating of the subsidiary. If the subsidiary’s credit rating is not available, a synthetic credit rating is determined using certain key metrics, including cash flow ratios and interest coverage, as well as other industry-specific factors. For the three months ended June 30, 2014 and for the year ended December 31, 2013, the Company classified the debt as Level 3 in the fair value hierarchy for the purpose of determining and disclosing the fair value of financial instruments. The fair value of recourse and non-recourse debt excludes accrued interest at the valuation date.
F-108
Table of Contents
Imperial Valley Solar 1 Holdings II, LLC and Subsidiaries
Notes to the Consolidated Financial Statements—(Continued)
(In Thousands of U.S. Dollars)
(Unaudited)
The Company does not have any assets and liabilities that are measured at fair value on a recurring basis.
14. Related-Party Transactions
For the purpose of the financial statements, parties are considered to be related to the Company if the Company has the ability, directly or indirectly, to control the party or exercise significant influence over the party in making financial and operating decisions, or vice versa, or where the Company and the party are subject to common control or common significant influence. Related parties may be individuals or other entities.
The Company has management and operations agreements with U.S. Solar Services (USSS), a wholly owned company of Member and ultimately SRP, which provides construction management and general and administrative services. During the three months ended June 30, 2014 and 2013, the Company recorded $1,749 and $182 of management expenses with USSS. During the six months ended June 30, 2014 and 2013, the Company recorded $2,874 and $491 of management expenses with USSS.
In addition, as of December 31, 2013, the Company had a related party transactions of $6,093 which related to expenses incurred on its behalf by AES Solar Power, LLC for payments related to the inception of the noncontrolling interest for consultants and legal fees and payments for environmental insurance required to be held by the IVS1 Holdings. AES Solar Power, LLC has incurred additional expense of $2,106 in the six month period ended June 30, 2014. As of June 30, 2014, the entire amount of $8,199 was contributed in to the Company as Member’s equity (refer to Note 10—Members Equity).
15. Commitments and Contingencies
Capital Commitments
Upon the MSS project achieving financial close in 2012, certain conditions precedent were met resulting in the MSS project’s engineering procurement and construction contract (EPC) and panel supply agreement becoming effective. The total estimated contract value of the EPC contract as of December 31, 2012 was $360,360. In 2013, due to an EPC settlement and change orders, the EPC contract increased an additional $4,677. As of June 30, 2014, $781 remains unpaid under the EPC agreement.
Operating Leases
The Company is obligated under certain long-term noncancelable operating leases related to land for its solar projects. Certain of these lease agreements contain renewal options and inflation-adjusted rent escalation clauses. Related to leases, for the three months ended June 30, 2013, the Company capitalized $105 in construction-period rent expense for the three months ended June 30, 2013. There was no rent expensed in the three and six months ended June 30, 2013 in the Consolidated Statements of Operations. There was no amount capitalized for the three month ended June 30, 2014. For the six months ended June 30, 2014 and 2013, the Company capitalized $14 and $210 respectively. Rent expense for the three and six months ended June 30, 2014 under the land agreements was $109 and $199, respectively. There was no rent expense recorded for the three and six months ended June 30 2013.
F-109
Table of Contents
Imperial Valley Solar 1 Holdings II, LLC and Subsidiaries
Notes to the Consolidated Financial Statements—(Continued)
(In Thousands of U.S. Dollars)
(Unaudited)
Below is a summary of the Company’s future minimum lease commitments as of June 30, 2014:
| Years Ending December 31, | ||||||||||||||||||||||||||||
| 2014 | 2015 | 2016 | 2017 | 2018 | Thereafter | Total | ||||||||||||||||||||||
| Land leases |
$ | 221 | $ | 436 | $ | 444 | $ | 453 | $ | 462 | $ | 12,189 | $ | 14,205 | ||||||||||||||
Letter of Credit
In the normal course of business, the Company may enter into various agreements providing performance assurance to third parties. Such agreements include letters of credit and are entered into primarily to support or enhance the creditworthiness of the Company by facilitating the availability of sufficient credit to accomplish the intended business purposes of the Company.
As discussed in Note 11- Long-Term Debt, the LC facility allows the MSS project to issue letters of credit to certain counterparties. The letters of credit are required under the MSS project financing agreement to be posted during construction and during operations. The Company issued letters of credit for PPA, interconnection studies and upgrades, debt service and operations and maintenance. The letters of credit are issued with a one-year maximum duration and extended for additional periods at the Company’s discretion or as required by the financing agreements. The others have expiration beyond June 30, 2014 and some will automatically renew unless the Company makes a notification.
Legal Proceedings
The Company does not have any legal proceedings that are currently pending. From time to time, the Company or its subsidiaries may be party to various lawsuits, claims and other legal and regulatory proceedings that arise in the ordinary course of business. These actions may seek, among other things, compensation, civil penalties, or injunctive or declaratory relief.
Environmental Contingencies
The Company reviews its obligations as they relate to compliance with environmental laws, including site restoration and remediation. For the six months ended June 30, 2014 and for the year ended December 31, 2013, there were no known environmental contingencies that required the Company to recognize a liability.
16. Revenues and Cost of Revenues
The Company commenced the recognition of revenue upon Phase I being placed into service on November 22, 2013, Phase II on December 20, 2013 and the last Phase III being placed into service on March 4, 2014. The Company is fully operational as of March 31, 2014.
Cost of revenues includes depreciation of $5,478 and $10,718, respectively, for three and six months ended June 30, 2014, amortization of $391 and $641, respectively, for three and six months ended June 30, 2014 and accretion of $43 and $81, respectively, for three and six months ended June 30, 2014, no depreciation, amortization or accretion was recognized for the these and six months ended June 30, 2014.
F-110
Table of Contents
Imperial Valley Solar 1 Holdings II, LLC and Subsidiaries
Notes to the Consolidated Financial Statements—(Continued)
(In Thousands of U.S. Dollars)
(Unaudited)
17. Subsequent Events
Subsequent events have been evaluated through December 1, 2014, the date these financial statements were available to be issued.
On June 16, 2014, AES Corp and Riverstone entered into an agreement to sell to SunEdison, Inc. their respective 50% interest in the Company. The sale was effective on July 2, 2014. Further on July 23, 2014, the Company was contributed by SunEdison, Inc. to TerraForm Power, Inc.
In July 2014, the Company paid dividends in the amount of $2,619 to the Member and $291 to the noncontrolling interest.
F-111
Table of Contents
Condensed Combined Balance Sheets
(Unaudited)
(in thousands)
| December 31, 2013 |
September 30, 2014 |
|||||||
| Assets | ||||||||
| Current assets: |
||||||||
| Cash and cash equivalents |
$ | 23,456 | $ | 15,699 | ||||
| Restricted cash |
32,810 | 35,803 | ||||||
| Accounts receivable |
9,434 | 10,572 | ||||||
| Prepaid expenses and other current assets |
6,074 | 7,093 | ||||||
| Derivative assets |
7,557 | 2,736 | ||||||
|
|
|
|
|
|||||
| Total current assets |
79,331 | 71,903 | ||||||
| Property, plant and equipment, net |
909,689 | 938,470 | ||||||
| Construction in progress |
43,346 | — | ||||||
| Long-term derivative assets |
43,150 | 22,893 | ||||||
| Other non-current assets, net |
34,646 | 34,873 | ||||||
| Deferred financing costs, net |
18,515 | 18,015 | ||||||
|
|
|
|
|
|||||
| Total assets |
$ | 1,128,677 | $ | 1,086,154 | ||||
|
|
|
|
|
|||||
| Liabilities and Capital | ||||||||
| Current liabilities: |
||||||||
| Accrued capital expenditures |
$ | 18,175 | $ | 1,257 | ||||
| Accounts payable and accrued expenses |
7,125 | 7,354 | ||||||
| Current portion of derivative liabilities |
644 | 655 | ||||||
| Current portion of long-term debt |
18,055 | 52,584 | ||||||
| Current portion of deferred revenue |
957 | 919 | ||||||
|
|
|
|
|
|||||
| Total current liabilities |
44,956 | 62,769 | ||||||
| Long-term derivative liabilities |
15 | 7,115 | ||||||
| Long-term debt, net of current portion |
498,012 | 494,265 | ||||||
| Deferred revenue |
3,800 | 3,671 | ||||||
| Other long-term liabilities |
2,209 | 4,509 | ||||||
| Asset retirement obligations |
11,302 | 12,081 | ||||||
|
|
|
|
|
|||||
| Total liabilities |
560,294 | 584,410 | ||||||
| Redeemable noncontrolling interest |
— | 17,852 | ||||||
| Capital: |
||||||||
| Parent’s contributions, net |
599,092 | 568,803 | ||||||
| Accumulated deficit |
(137,463 | ) | (184,779 | ) | ||||
|
|
|
|
|
|||||
| Total parent’s capital |
461,629 | 384,024 | ||||||
| Noncontrolling interests |
106,754 | 99,868 | ||||||
|
|
|
|
|
|||||
| Total capital |
568,383 | 483,892 | ||||||
|
|
|
|
|
|||||
| Total liabilities and capital |
$ | 1,128,677 | $ | 1,086,154 | ||||
|
|
|
|
|
|||||
See accompanying notes to condensed combined financial statements.
F-112
Table of Contents
Condensed Combined Statements of Operations
(Unaudited)
(in thousands)
| Nine Months Ended September 30, |
||||||||
| 2013 | 2014 | |||||||
| Revenues: |
||||||||
| Revenues |
$ | 75,707 | $ | 92,849 | ||||
| Cash settlements of derivatives |
3,673 | 900 | ||||||
| Fair value changes in derivatives |
(5,686 | ) | (23,087 | ) | ||||
|
|
|
|
|
|||||
| Total revenues |
73,694 | 70,662 | ||||||
| Cost of revenues: |
||||||||
| Project operating expenses |
34,664 | 40,216 | ||||||
| Depreciation and amortization |
32,620 | 33,947 | ||||||
|
|
|
|
|
|||||
| Total cost of revenues |
67,284 | 74,163 | ||||||
|
|
|
|
|
|||||
| Gross profit (loss) |
6,410 | (3,501 | ) | |||||
| Other operating expenses: |
||||||||
| Project development |
648 | 107 | ||||||
| General and administrative |
3,834 | 4,967 | ||||||
|
|
|
|
|
|||||
| Total other operating expenses |
4,482 | 5,074 | ||||||
|
|
|
|
|
|||||
| Income (loss) from operations |
1,928 | (8,575 | ) | |||||
| Fair value changes in derivatives |
6,728 | (9,602 | ) | |||||
| Other income (expenses) |
35,462 | (2,847 | ) | |||||
| Interest expense, net |
(25,268 | ) | (28,402 | ) | ||||
|
|
|
|
|
|||||
| Net income (loss) |
18,850 | (49,426 | ) | |||||
| Net gain attributable to noncontrolling interests |
(4,545 | ) | (1,279 | ) | ||||
| Net loss attributable to redeemable noncontrolling interest |
— | 3,389 | ||||||
|
|
|
|
|
|||||
| Net income (loss) attributable to the First Wind Operating Entities |
$ | 14,305 | $ | (47,316 | ) | |||
|
|
|
|
|
|||||
See accompanying notes to condensed combined financial statements.
F-113
Table of Contents
Condensed Combined Statements of Cash Flows
(Unaudited)
(in thousands)
| Nine Months Ended September 30, |
||||||||
| 2013 | 2014 | |||||||
| Cash flows from operating activities: |
||||||||
| Net income (loss) |
$ | 18,850 | $ | (49,426 | ) | |||
| Adjustments to reconcile net income (loss) to net cash provided by operating activities: |
||||||||
| Depreciation and amortization |
32,620 | 33,947 | ||||||
| Amortization of deferred financing costs |
2,087 | 2,402 | ||||||
| Unrealized (gain) loss on derivative instruments |
(1,042 | ) | 32,689 | |||||
| Loss on sale of assets |
1,148 | — | ||||||
| Loss on early extinguishment of debt |
70 | — | ||||||
| Changes in assets and liabilities: |
||||||||
| Accounts receivable |
937 | (1,138 | ) | |||||
| Prepaid expenses and other current assets |
(974 | ) | (1,019 | ) | ||||
| Other non-current assets |
(13,646 | ) | (628 | ) | ||||
| Other liabilities |
10 | 3,500 | ||||||
| Accounts payable and accrued expenses |
(1,926 | ) | 233 | |||||
| Deferred revenue |
(168 | ) | (168 | ) | ||||
|
|
|
|
|
|||||
| Net cash provided by operating activities |
37,966 | 20,392 | ||||||
|
|
|
|
|
|||||
| Cash flows from investing activities: |
||||||||
| Capital expenditures, net |
(12,006 | ) | (64,691 | ) | ||||
| Changes in restricted cash |
(16,206 | ) | (2,993 | ) | ||||
|
|
|
|
|
|||||
| Net cash used in investing activities |
(28,212 | ) | (67,684 | ) | ||||
|
|
|
|
|
|||||
| Cash flows from financing activities: |
||||||||
| Proceeds from borrowings, net of issuance costs |
18,531 | 70,918 | ||||||
| Proceeds from sale of non-controlling subsidiary company interests, net |
601 | 20,041 | ||||||
| Repurchase of subsidiary company interests |
(8,959 | ) | — | |||||
| Repayment of borrowings |
(34,665 | ) | (42,381 | ) | ||||
| Payment for interest rate cap agreement |
— | (500 | ) | |||||
| Distributions to tax equity investors |
(11,859 | ) | (8,222 | ) | ||||
| Net contribution from (distribution to) member |
13,618 | (321 | ) | |||||
|
|
|
|
|
|||||
| Net cash provided by (used in) financing activities |
(22,733 | ) | 39,535 | |||||
|
|
|
|
|
|||||
| Net change in cash and cash equivalents |
(12,979 | ) | (7,757 | ) | ||||
| Cash and cash equivalents, beginning of period |
32,704 | 23,456 | ||||||
|
|
|
|
|
|||||
| Cash and cash equivalents, end of period |
$ | 19,725 | $ | 15,699 | ||||
|
|
|
|
|
|||||
| Supplemental disclosures of cash flow information: |
||||||||
| Cash paid during the period for: |
||||||||
| Interest |
$ | 26,098 | $ | 22,450 | ||||
| Non-cash investing activities: |
||||||||
| Fair value of asset retirement obligations |
(533 | ) | 69 | |||||
| Non-cash financing activities: |
||||||||
| Assets contributed by (distributed to) parent |
9,074 | (29,968 | ) | |||||
See accompanying notes to condensed combined financial statements.
F-114
Table of Contents
Notes to Condensed Combined Financial Statements
(Unaudited)
NOTE 1—BUSINESS
The accompanying condensed combined financial statements include the historical accounts of selected operating entities (First Wind Operating Entities) of First Wind Holdings, LLC (First Wind), which are the subject of a purchase and sale agreement. The First Wind Operating Entities operate utility-scale wind and solar energy projects in the Northeastern region of the continental United States and Hawaii and rely on First Wind and certain of First Wind’s subsidiaries for management services related to administration, operations and maintenance.
At September 30, 2014, the First Wind Operating Entities operate the following renewable energy projects with a total of 517 megawatts (MW) in gross nameplate capacity:
| Project |
Capacity (MW) | Commercial Operation | ||||
| Wind |
||||||
| Northeast |
||||||
| Blue Sky East, LLC (Bull Hill) |
34 | October 2012 | ||||
| Canandaigua Power Partners, LLC and Canandaigua Power Partners II, LLC (together, Cohocton) |
125 | January 2009 | ||||
| Erie Wind, LLC (Steel Winds II) |
15 | January 2012 | ||||
| Evergreen Wind Power, LLC (Mars Hill)(1) |
42 | March 2007 | ||||
| Evergreen Wind Power III, LLC (Rollins) |
60 | July 2011 | ||||
| Niagara Wind Power, LLC (Steel Winds I) |
20 | June 2007 | ||||
| Stetson Holdings, LLC (Stetson I) |
57 | January 2009 | ||||
| Stetson Wind II, LLC (Stetson II) |
26 | March 2010 | ||||
| Vermont Wind, LLC (Sheffield) |
40 | October 2011 | ||||
| Hawaii |
||||||
| Kaheawa Wind Power, LLC (KWP I)(1) |
30 | June 2006 | ||||
| Kaheawa Wind Power II, LLC (KWP II)(2) |
21 | July 2012 | ||||
| Kahuku Wind Power, LLC (Kahuku)(2) |
30 | March 2011 | ||||
|
|
|
|||||
| 500 | ||||||
| Solar |
||||||
| Mass Solar 1, LLC (Mass Solar 1)(1) |
17 | (3) | May 2014 | |||
|
|
|
|||||
| 517 | ||||||
|
|
|
|||||
| (1) | Partially-owned (tax equity) |
| (2) | Partially-owned (percentage interest) |
| (3) | Solar capacity presented in Megawatts AC |
NOTE 2—LIQUIDITY
The First Wind Operating Entities have relied on parent contributions, unsecured debt, borrowings secured by certain of their assets, and grants under the American Recovery and Reinvestment Act of 2009 (ARRA) to fund project development spending, procurement of wind turbine generators and construction costs. The First Wind Operating Entities’ cash on hand at September 30, 2014, along with funds available for borrowing under existing debt facilities, expected operating cash flows and parent contributions will provide the First Wind Operating Entities with sufficient working capital to meet obligations as they become due through December 31, 2014.
F-115
Table of Contents
FIRST WIND OPERATING ENTITIES
Notes to Condensed Combined Financial Statements
(Unaudited)
NOTE 3—SUMMARY OF SIGNIFICANT ACCOUNTING POLICIES
Principles of Consolidation and Basis of Presentation
Overview. The accompanying condensed combined financial statements have been prepared in accordance with U.S. generally accepted accounting principles (U.S. GAAP) from the consolidated financial statements and accounting records of First Wind using the historical results of operations and historical cost basis of the assets and liabilities of First Wind that comprise the First Wind Operating Entities. These financial statements have been prepared solely to demonstrate the First Wind Operating Entities’ historical results of operations, financial position, and cash flows for the indicated periods under First Wind’s management. All intercompany balances and transactions within the First Wind Operating Entities have been eliminated. Transactions and balances between the First Wind Operating Entities and First Wind and its subsidiaries are reflected as related party transactions within these financial statements. Subsequent events potentially affecting the combined financial statements have been evaluated through December 9, 2014, the date these combined financial statements were issued.
The accompanying condensed combined financial statements include the assets, liabilities, revenues, and expenses that are specifically identifiable to the First Wind Operating Entities. In addition, certain general and administrative costs related to the First Wind Operating Entities have been allocated from First Wind. The First Wind Operating Entities receive service and support functions from First Wind and its subsidiaries under administrative services (ASA) and operations and maintenance (O&M) agreements. The First Wind Operating Entities’ operations are dependent upon First Wind and its subsidiaries’ ability to perform these services and support functions. The costs associated with these services and support functions have been allocated to the First Wind Operating Entities using First Wind’s historical cost allocation methodologies, and primarily reflect an allocation of employee and technology costs. Debt specific to the First Wind Operating Entities has been reflected in these condensed combined financial statements as described in Note 6.
Management believes the assumptions and allocations underlying the combined financial statements are reasonable and appropriate under the circumstances. The expenses and cost allocations have been determined on a basis considered by First Wind to be a reasonable reflection of the utilization of services provided to or the benefit received by the First Wind Operating Entities during the periods presented relative to the total costs incurred by First Wind. However, the amounts recorded for these transactions and allocations are not necessarily representative of the amount that would have been reflected in the financial statements had the First Wind Operating Entities been an entity that operated independently of First Wind.
The accompanying condensed combined financial statements have been prepared in accordance with U.S. GAAP as contained in the Financial Accounting Standards Board Accounting Standards Codification (ASC) for interim financial information and Article 10 of Regulation S-X issued by the SEC. Accordingly, they do not include all the information and footnotes required by U.S. GAAP for annual fiscal reporting periods. In the opinion of management, the interim financial information includes all adjustments of a normal recurring nature necessary for a fair presentation of the results of operations, financial position and cash flows. The results of operations for the nine months ended September 30, 2014 are not necessarily indicative of results that may be expected for the year ending December 31, 2014. The accompanying condensed combined financial statements are unaudited and should be read in conjunction with the 2013 audited combined financial statements and notes thereto.
F-116
Table of Contents
FIRST WIND OPERATING ENTITIES
Notes to Condensed Combined Financial Statements
(Unaudited)
Variable Interest Entities. The usual condition for a controlling financial interest is ownership of a majority of the voting interests of an entity; however, a controlling financial interest may also exist in entities such as variable interest entities (VIEs), through arrangements that do not involve controlling voting interests. A variable interest holder is required to consolidate a VIE as its primary beneficiary if that party has the power to direct the activities that would significantly impact the entity’s performance, if it has the obligation to absorb the losses of a VIE or receive benefits that could potentially be significant to the VIE, or both.
Noncontrolling Interests. The First Wind Operating Entities use a hypothetical liquidation at book value (HLBV) method to account for noncontrolling interests in projects where it has entered into tax equity capital transactions. HLBV uses a balance sheet methodology that considers the noncontrolling interest holder’s claim on the net assets of the entity assuming a liquidation event. Equity in income or loss under HLBV is determined by calculating the change in the amount of net worth the tax equity investors are legally able to claim based on an assumed liquidation at book value of the entity at the beginning of the reporting period compared to the end of that period. The periodic changes in noncontrolling interest in the combined balance sheets, excluding impact of cash distributions, are recognized by the First Wind Operating Entities as “Net (income) loss attributable to noncontrolling interests” or “Net (income) loss attributable to redeemable noncontrolling interests” in the combined statements of operations.
Concentrations of Credit Risk
The First Wind Operating Entities are subject to concentrations of credit risk primarily through cash and cash equivalents, accounts receivable, and derivative instruments. The First Wind Operating Entities mitigate risk with respect to cash and cash equivalents and derivative instruments by maintaining deposits and contracts at high-quality financial institutions and monitoring the credit ratings of those institutions.
The First Wind Operating Entities derive a large portion of their electricity and renewable energy certificate (REC) revenues from a small number of customers. The First Wind Operating Entities have experienced no credit losses to date on their electricity and REC sales, and do not anticipate material credit losses to occur in the future with respect to related accounts receivable; therefore, no allowance for doubtful accounts has been provided.
Cash and Cash Equivalents and Restricted Cash
Cash and cash equivalents consist of all cash balances and highly liquid investments with original maturity of three months or less. Cash balances that are restricted by various financing arrangements are classified as restricted cash in the accompanying condensed combined balance sheets.
Revenue Recognition
The First Wind Operating Entities earn revenue from the sale of electricity and RECs. The First Wind Operating Entities recognize revenues from the sale of electricity at market prices or under long-term PPAs based upon the output delivered at rates specified under the contracts. The First Wind Operating Entities recognize revenues from the sale of RECs based upon the certificates delivered at rates specified under the contracts. The First Wind Operating Entities defer recognition of revenue from sales of electricity and RECs in instances when criteria to recognize revenue have not been met.
F-117
Table of Contents
FIRST WIND OPERATING ENTITIES
Notes to Condensed Combined Financial Statements
(Unaudited)
Revenues by major customer were as follows (in thousands, except percentages):
| Nine Months Ended September 30, | ||||||||||||||||
| 2013 | 2014 | |||||||||||||||
| Hawaiian Electric Company(1) |
$ | 17,529 | 23 | % | $ | 8,667 | 9 | % | ||||||||
| ISO New England |
13,345 | 18 | 18,804 | 20 | ||||||||||||
| Maui Electric Company |
18,700 | 25 | 22,172 | 24 | ||||||||||||
|
|
|
|
|
|
|
|
|
|||||||||
| Total revenue by major customers |
49,574 | 66 | 49,643 | 53 | ||||||||||||
| Revenues from all other customers |
26,133 | 34 | 43,206 | 47 | ||||||||||||
|
|
|
|
|
|
|
|
|
|||||||||
| $ | 75,707 | 100 | % | $ | 92,849 | 100 | % | |||||||||
|
|
|
|
|
|
|
|
|
|||||||||
| (1) | Includes $8,568 of business interruption insurance proceeds Kahuku received in connection with its outages for the nine months ended September 30, 2013. The First Wind Operating Entities did not receive any business interruption insurance proceeds during the nine months ended September 30, 2014. |
Property, Plant and Equipment
Property, plant and equipment are stated at cost, less accumulated depreciation. Renewals and betterments that increase the useful lives of the assets are capitalized. Depreciation is recorded on a straight-line basis, and the First Wind Operating Entities review the estimated useful lives of property, plant and equipment on an ongoing basis. Renewable energy project equipment and related assets are depreciated over their estimated useful lives of 25 to 30 years on a straight-line basis. Non-renewable energy project-related assets are depreciated over their estimated useful lives, which range from 3 to 7 years.
Construction in progress expenditures, insurance, interest and other costs related to construction activities are capitalized. As each project begins commercial operations, construction in progress is reclassified to property, plant and equipment and is depreciated over the estimated useful lives of the underlying assets.
Other Income (Expenses)
Other income and expenses include gains on sale of subsidiary company interests, gains or losses on the sale of assets, losses on disposal and impairment of assets, losses on early extinguishments of debt, interest income, settlements, and immaterial miscellaneous income.
Included in other income for the nine months ended September 30, 2013, is $12 million in property and casualty insurance recoveries related to the outage at Kahuku.
Included in other income for the nine months ended September 30, 2013, is a gain of $25.9 million related to the settlement received as part of the Master Agreement entered into with respect to the turbines owned and operated by certain of the First Wind Operating Entities.
F-118
Table of Contents
FIRST WIND OPERATING ENTITIES
Notes to Condensed Combined Financial Statements
(Unaudited)
Fair Value of Financial Instruments
The carrying amounts of cash and cash equivalents, restricted cash, accounts receivable, accrued capital expenditures, accounts payable and accrued expenses approximates their fair value because of the short-term maturity of these instruments. The First Wind Operating Entities believe the carrying amounts of debt approximate fair value as the instruments generally bear interest at variable rates. The Kahuku Term Loan (as defined in Note 6) is at a fixed rate, but interest rates and risk premiums have not fluctuated significantly since the loan was made and therefore the First Wind Operating Entities believe the carrying amount approximates fair value. The estimated fair values of derivative instruments are calculated based on market rates. These values represent the estimated amounts the First Wind Operating Entities would receive or pay to terminate the agreements, taking into consideration market rates and the current creditworthiness of the First Wind Operating Entities and the counterparties.
Significant New Accounting Policies
In May 2014, the FASB issued Accounting Standards Update 2014-09, Revenue from Contracts with Customers (Topic 606) (ASU 2014-09), which provides that the amount of revenue recognized should be equal to the consideration that the entity expects to be entitled to for those promised goods or services. ASU 2014-09 provides for a five-step approach to recognizing and measuring revenue and supersedes most current revenue recognition guidance. ASU 2014-09 is effective for reporting periods beginning after December 15, 2017 for non-public entities, with early adoption permitted for reporting periods beginning after December 15, 2016. The standard permits the use of either a retrospective or a cumulative effect transition method. The First Wind Operating Entities have not determined when they will adopt ASU 2014-09 or which transition method they will use.
NOTE 4—NONCONTROLLING INTERESTS AND TAX EQUITY TRANSACTIONS
On August 22, 2013, the First Wind Operating Entities entered into a tax equity financing agreement with Firstar Development, LLC (Firstar) for the sale of equity interests in Mass Solar 1 Holdings, LLC. The initial capital contribution of $1.2 million was received in 2013 and was accounted for as a deposit in accordance with ASC 360-20 Property, Plant and Equipment—Real Estate Sales (ASC 360-20). The remaining contribution of $20 million was received on August 15, 2014. As of September 30, 2014, the tax equity investment in the amount of $17.9 million is classified as redeemable interest in subsidiaries on the condensed combined balance sheet.
Noncontrolling interests in subsidiaries are comprised of the following as of December 31, 2013 and September 30, 2014 (in thousands):
| December 31, 2013 |
September 30, 2014 |
|||||||
| Noncontrolling interest attributable to: |
||||||||
| Tax equity investors |
$ | 102,378 | $ | 95,885 | ||||
| Other subsidiary equity ownership interests |
4,376 | 3,983 | ||||||
|
|
|
|
|
|||||
| Total noncontrolling interest |
$ | 106,754 | $ | 99,868 | ||||
|
|
|
|
|
|||||
F-119
Table of Contents
FIRST WIND OPERATING ENTITIES
Notes to Condensed Combined Financial Statements
(Unaudited)
Changes in capital from December 31, 2013 to September 30, 2014 were as follows (in thousands):
| Parent’s Contributions, net |
Accumulated Deficit |
Subtotal | Noncontrolling Interests |
Total | ||||||||||||||||
| Balance at December 31, 2013 |
$ | 599,092 | $ | (137,463 | ) | $ | 461,629 | $ | 106,754 | $ | 568,383 | |||||||||
| Net distributions |
(30,289 | ) | — | (30,289 | ) | (8,165 | ) | (38,454 | ) | |||||||||||
| Net income |
— | (47,316 | ) | (47,316 | ) | 1,279 | (46,037 | ) | ||||||||||||
|
|
|
|
|
|
|
|
|
|
|
|||||||||||
| Balance at September 30, 2014 |
$ | 568,803 | $ | (184,779 | ) | $ | 384,024 | $ | 99,868 | $ | 483,892 | |||||||||
|
|
|
|
|
|
|
|
|
|
|
|||||||||||
NOTE 5—PROPERTY, PLANT AND EQUIPMENT, NET
Property, plant and equipment is comprised of the following as of December 31, 2013 and September 30, 2014 (in thousands):
| December 31, 2013 |
September 30, 2014 |
Estimated Useful Life | ||||||||
| Land |
$ | 12,354 | $ | 9,453 | ||||||
| Land and leasehold improvements |
73,371 | 73,574 | Economic life/ remaining lease term | |||||||
| Furniture, fixtures, vehicles and other |
11,015 | 12,769 | 3 - 7 years | |||||||
| Asset retirement obligations |
7,627 | 7,627 | 25 - 30 years | |||||||
| Power generation equipment |
990,906 | 1,053,486 | 3 - 30 years | |||||||
|
|
|
|
|
|||||||
| 1,095,273 | 1,156,909 | |||||||||
| Accumulated depreciation |
(185,584 | ) | (218,439 | ) | ||||||
|
|
|
|
|
|||||||
| $ | 909,689 | $ | 938,470 | |||||||
|
|
|
|
|
|||||||
F-120
Table of Contents
FIRST WIND OPERATING ENTITIES
Notes to Condensed Combined Financial Statements
(Unaudited)
NOTE 6—DEBT
The First Wind Operating Entities enter into loan agreements with financial institutions to finance the construction of renewable energy projects and the acquisition of turbines, solar panels and related equipment. The First Wind Operating Entities’ combined debt includes recourse and non-recourse borrowings entered into by the First Wind Operating Entities.
The First Wind Operating Entities had the following loans outstanding as of December 31, 2013 and September 30, 2014 (in thousands except percentages):
| Balance at | ||||||||||||||
| Interest Rate | Maturity | December 31, 2013 |
September 30, 2014 |
|||||||||||
| Construction Loans |
||||||||||||||
| Mass Solar Construction Loan |
L + 3.50%(1) | 2014 | $ | 7,615 | $ | — | ||||||||
| Bridge Loan |
||||||||||||||
| FWPV Capital Bridge Loan |
L + 5.50%(1) | 2015 | — | 40,000 | ||||||||||
| Term Loans |
||||||||||||||
| Kahuku Term Loan |
3.56% | 2028 | 73,935 | 66,366 | ||||||||||
| KWP II Term Loan |
L + 3.00%(2) | 2018 | 43,540 | 43,256 | ||||||||||
| Mass Solar Term Loan |
L + 3.50%(2) | 2024 | — | 26,939 | ||||||||||
| Hawaiian Island Holdings Loan |
L + 8.00%(2) | 2015 | 15,473 | 12,637 | ||||||||||
| Northeast Wind Capital II Term Loan B |
L + 4.00%(3) | 2020 | 316,600 | 299,764 | ||||||||||
| Other |
||||||||||||||
| Bull Hill Financing |
2.81% | 2032 | 62,055 | 60,331 | ||||||||||
| Mass Solar Working Capital Loan |
L + 3.50%(1) | 2024 | — | 400 | ||||||||||
|
|
|
|
|
|||||||||||
| Gross Indebtedness |
|
519,218 | 549,693 | |||||||||||
| Unamortized Discount |
|
(3,151 | ) | (2,844 | ) | |||||||||
|
|
|
|
|
|||||||||||
| Carrying Value |
|
516,067 | 546,849 | |||||||||||
| Debt with maturities less than one year |
|
18,055 | 52,584 | |||||||||||
|
|
|
|
|
|||||||||||
| Total long-term debt |
|
$ | 498,012 | $ | 494,265 | |||||||||
|
|
|
|
|
|||||||||||
| (1) | As of September 30, 2014, L + equals 1 month LIBOR plus x% |
| (2) | As of September 30, 2014, L + equals 3 month LIBOR plus x% |
| (3) | As long as LIBOR is under 1.00% interest is equal to 1.00% + 4.00% |
The First Wind Operating Entities completed the following significant debt transactions during the nine months ended September 30, 2014:
FWPV Capital Bridge Loan. On April 30, 2014, FWPV Capital, LLC (FWPV Capital), entered into a financing agreement for a $40 million bridge loan. The loan matures no later than April 30, 2015; however proceeds from the occurrence of certain earlier events are to be used to repay the loan. The loan is secured by the First Wind Operating Entities’ interest in FWPV Capital and by the assets of FWPV Capital.
F-121
Table of Contents
FIRST WIND OPERATING ENTITIES
Notes to Condensed Combined Financial Statements
(Unaudited)
Mass Solar Construction Loan, Mass Solar Term Loan. On August 22, 2013, Mass Solar 1, entered into a financing agreement for a $27 million construction and term loan facility (Mass Solar Construction Loan), a $20.2 million tax equity bridge loan (Mass Solar TE Bridge Loan), a $2 million working capital loan (Mass Solar Working Capital Loan), and a $3.4 million letter of credit facility (Mass Solar LC Facility). The loans are secured by the First Wind Operating Entities’ interest in Mass Solar 1 and by the assets of Mass Solar 1.
On August 15, 2014, the term conversion conditions were satisfied and the outstanding principal was converted to a term loan facility (Mass Solar Term Loan) in the amount of $27 million, which is the maximum term loan commitment. The Mass Solar Term Loan matures on August 15, 2024. In addition, the outstanding principal on the Mass Solar TE Bridge Loan was repaid in the amount of $13 million with tax equity transaction proceeds received on this date.
As of September 30, 2014, $0.4 million had been drawn on the Mass Solar Working Capital Loan. The Mass Solar Working Capital Loan is subject to a quarterly unutilized commitment fee of 0.75%.
NOTE 7—DERIVATIVE FINANCIAL INSTRUMENTS
As discussed in Note 3, in the normal course of business the First Wind Operating Entities employ a variety of financial instruments to manage exposure to fluctuations in interest rates and energy prices. The First Wind Operating Entities have not applied hedge accounting to these instruments and record changes in fair value related to derivative financial instruments in the condensed combined statements of operations. The following tables reflect the amounts that are recorded in the First Wind Operating Entities’ condensed combined balance sheets as of December 31, 2013 and September 30, 2014 (in thousands):
| December 31, 2013 | September 30, 2014 | |||||||||||||||||||||||
| Interest Rate Derivatives |
Commodity Derivatives |
Total | Interest Rate Derivatives |
Commodity Derivatives |
Total | |||||||||||||||||||
| Balance Sheet: |
||||||||||||||||||||||||
| Assets |
||||||||||||||||||||||||
| Derivative assets |
$ | — | $ | 7,557 | $ | 7,557 | $ | — | $ | 2,736 | $ | 2,736 | ||||||||||||
| Long-term derivative assets |
2,118 | 41,032 | 43,150 | 127 | 22,766 | 22,893 | ||||||||||||||||||
|
|
|
|
|
|
|
|
|
|
|
|
|
|||||||||||||
| Total assets |
$ | 2,118 | $ | 48,589 | $ | 50,707 | $ | 127 | $ | 25,502 | $ | 25,629 | ||||||||||||
|
|
|
|
|
|
|
|
|
|
|
|
|
|||||||||||||
| Liabilities |
||||||||||||||||||||||||
| Derivative liabilities |
$ | 644 | $ | — | $ | 644 | $ | 655 | $ | — | $ | 655 | ||||||||||||
| Long-term derivative liabilities |
15 | — | 15 | 7,115 | — | 7,115 | ||||||||||||||||||
|
|
|
|
|
|
|
|
|
|
|
|
|
|||||||||||||
| Total liabilities |
$ | 659 | $ | — | $ | 659 | $ | 7,770 | $ | — | $ | 7,770 | ||||||||||||
|
|
|
|
|
|
|
|
|
|
|
|
|
|||||||||||||
F-122
Table of Contents
FIRST WIND OPERATING ENTITIES
Notes to Condensed Combined Financial Statements
(Unaudited)
The following tables reflect the amounts that are recorded in the First Wind Operating Entities’ condensed combined consolidated statements of operations for the nine months ended September 30, 2013 and 2014 related to derivative financial instruments (in thousands):
| Nine Months Ended | ||||||||||||||||||||||||
| September 30, 2013 | September 30, 2014 | |||||||||||||||||||||||
| Interest Rate Derivatives |
Commodity Derivatives |
Total | Interest Rate Derivatives |
Commodity Derivatives |
Total | |||||||||||||||||||
| Statement of Operations: |
||||||||||||||||||||||||
| Revenue: |
||||||||||||||||||||||||
| Net cash settlements |
$ | — | $ | 3,673 | $ | 3,673 | $ | — | $ | 900 | $ | 900 | ||||||||||||
| Fair value changes |
— | (5,686 | ) | (5,686 | ) | — | (23,087 | ) | (23,087 | ) | ||||||||||||||
|
|
|
|
|
|
|
|
|
|
|
|
|
|||||||||||||
| — | (2,013 | ) | (2,013 | ) | — | (22,187 | ) | (22,187 | ) | |||||||||||||||
| Fair value changes |
6,728 | — | 6,728 | (9,602 | ) | — | (9,602 | ) | ||||||||||||||||
| Interest expense, net of capitalized interest: |
||||||||||||||||||||||||
| Net cash settlements |
(2,852 | ) | — | (2,852 | ) | (480 | ) | — | (480 | ) | ||||||||||||||
|
|
|
|
|
|
|
|
|
|
|
|
|
|||||||||||||
| Net income (loss) |
$ | 3,876 | $ | (2,013 | ) | $ | 1,863 | $ | (10,082 | ) | $ | (22,187 | ) | $ | (32,269 | ) | ||||||||
|
|
|
|
|
|
|
|
|
|
|
|
|
|||||||||||||
Interest Rate Swap and Cap Agreements
The First Wind Operating Entities are subject to market risks from changes in interest rates. The First Wind Operating Entities regularly assess these risks and have established business strategies regarding the use of derivative instruments to protect against adverse effects. Under interest rate swap agreements, the First Wind Operating Entities may agree to swap, at specified intervals, contractually stated fixed rates for the variable rates implicit in their debt financing agreements, based on agreed-upon notional amounts. Under interest rate cap agreements, the First Wind Operating Entities settle the difference, if positive or negative, between the underlying variable rates and contractually specified cap rates, based on agreed-upon notional amounts.
Commodity Swap Agreements
The First Wind Operating Entities enter into long-term cash-settled swap agreements to hedge commodity price variability inherent in electricity sales arrangements. If the First Wind Operating Entities sell electricity into an independent system operator (ISO) market and there is no PPA available, the First Wind Operating Entities may enter into a commodity swap to stabilize all or a portion of their estimated revenue stream. These price swap agreements involve periodic settlements for specified quantities of electricity based on a fixed price and are obligated to pay the counterparty market price for the same quantities of electricity.
F-123
Table of Contents
FIRST WIND OPERATING ENTITIES
Notes to Condensed Combined Financial Statements
(Unaudited)
As of December 31, 2013 and September 30, 2014, the First Wind Operating Entities were party to the following derivative contracts (in thousands, except notional amounts):
| Underlying | Current or Remaining Notional Amount |
Units | Periodic Settlement |
Expiration | December 31, 2013 | |||||||||||||||||||||||||||
| Derivative Assets |
Derivative Liabilities |
Long-term Derivative Assets |
Long-term Derivative Liabilities |
|||||||||||||||||||||||||||||
| Commodity Derivatives: |
||||||||||||||||||||||||||||||||
| Project: |
||||||||||||||||||||||||||||||||
| Cohocton |
NYISO Zone C Real-Time Power |
1,465,793 | MWH | Monthly | 2020 | $ | 4,288 | $ | — | $ | 14,786 | $ | — | |||||||||||||||||||
| Stetson I & II |
ISO-NE Mass Hub Real-Time Power |
738,852 | MWH | Monthly | 2019 | 2,593 | — | 22,909 | — | |||||||||||||||||||||||
| Steel Winds I & II |
NYISO Zone A Real-Time Power |
466,170 | MWH | Monthly | 2019 | 676 | — | 3,337 | — | |||||||||||||||||||||||
| Interest Rate Derivatives: |
||||||||||||||||||||||||||||||||
| Entity: |
||||||||||||||||||||||||||||||||
| KWP II |
3-Month LIBOR | 41,480,970 | USD | Quarterly | 2030 | — | 572 | 2,118 | — | |||||||||||||||||||||||
| Mass Solar 1 |
3-Month LIBOR | 13,503,028 | USD | Quarterly | 2023 | — | 72 | — | 15 | |||||||||||||||||||||||
|
|
|
|
|
|
|
|
|
|||||||||||||||||||||||||
| $ | 7,557 | $ | 644 | $ | 43,150 | $ | 15 | |||||||||||||||||||||||||
|
|
|
|
|
|
|
|
|
|||||||||||||||||||||||||
| Underlying | Current or Remaining Notional Amount |
Units | Periodic Settlement |
Expiration | September 30, 2014 | |||||||||||||||||||||||||||
| Derivative Assets |
Derivative Liabilities |
Long-term Derivative Assets |
Long-term Derivative Liabilities |
|||||||||||||||||||||||||||||
| Commodity Derivatives: |
||||||||||||||||||||||||||||||||
| Project: |
||||||||||||||||||||||||||||||||
| Cohocton |
NYISO Zone C Real-Time Power |
1,323,598 | MWH | Monthly | 2020 | $ | 1,174 | $ | — | $ | 8,132 | $ | — | |||||||||||||||||||
| Stetson I & II |
ISO-NE Mass Hub Real-Time Power |
644,621 | MWH | Monthly | 2019 | 1,359 | — | 13,097 | — | |||||||||||||||||||||||
| Steel Winds I & II |
NYISO Zone A Real-Time Power |
411,212 | MWH | Monthly | 2019 | 203 | — | 1,537 | — | |||||||||||||||||||||||
| Interest Rate Derivatives: |
||||||||||||||||||||||||||||||||
| Entity: |
||||||||||||||||||||||||||||||||
| Northeast Wind Capital II1 |
1-Month LIBOR | 252,726,268 | USD | Monthly | 2020 | — | — | — | 6,881 | |||||||||||||||||||||||
| Northeast Wind Capital II2 |
3-Month LIBOR | 284,409,751 | USD | Quarterly | 2015 | — | — | 127 | — | |||||||||||||||||||||||
| KWP II |
3-Month LIBOR | 41,270,849 | USD | Quarterly | 2030 | — | 520 | — | 14 | |||||||||||||||||||||||
| Mass Solar 1 |
3-Month LIBOR | 13,467,011 | USD | Quarterly | 2023 | — | 135 | — | 220 | |||||||||||||||||||||||
|
|
|
|
|
|
|
|
|
|||||||||||||||||||||||||
| $ | 2,736 | $ | 655 | $ | 22,893 | $ | 7,115 | |||||||||||||||||||||||||
|
|
|
|
|
|
|
|
|
|||||||||||||||||||||||||
| (1) | Interest rate swap with floor |
| (2) | Interest rate cap |
F-124
Table of Contents
FIRST WIND OPERATING ENTITIES
Notes to Condensed Combined Financial Statements
(Unaudited)
NOTE 9—FAIR VALUE MEASUREMENTS
The First Wind Operating Entities hold interest rate and commodity price swaps that are carried at fair value. The First Wind Operating Entities determine fair value based upon quoted prices when available or through the use of alternative approaches when market quotes are not readily accessible or available.
Valuation techniques for fair value are based upon observable and unobservable inputs. Observable inputs reflect market data obtained from independent sources, while unobservable inputs reflect the First Wind Operating Entities’ best estimate, considering all relevant information. These valuation techniques involve some level of management estimation and judgment. The valuation process to determine fair value also includes making appropriate adjustments to the valuation model outputs to consider risk factors. The fair value hierarchy of the First Wind Operating Entities’ inputs used to measure the fair value of assets and liabilities during the current period consists of three levels:
| • | Level 1—Quoted prices for identical instruments in active markets. |
| • | Level 2—Quoted prices for similar instruments in active markets; quoted prices for identical or similar instruments in markets that are not active; and model-derived valuations in which all significant inputs and significant value drivers are observable in active markets. |
| • | Level 3—Valuations derived from valuation techniques in which one or more significant inputs or significant value drivers are unobservable. |
If inputs used to measure an asset or liability fall within different levels of the hierarchy, the categorization is based on the least observable input that is significant to the fair value measurement of the asset or liability. The First Wind Operating Entities’ assessment of the significance of a particular input to the fair value measurement in its entirety requires judgment, and considers factors specific to the asset or liability.
In accordance with the fair value hierarchy described above, the following table shows the fair value of the First Wind Operating Entities’ financial assets and liabilities that are required to be measured at fair value as of December 31, 2013 and September 30, 2014 (in thousands):
| December 31, 2013 | September 30, 2014 | |||||||||||||||||||||||||||||||
| Fair Value Measurements Using |
Fair Value Measurements Using |
|||||||||||||||||||||||||||||||
| Level 1 | Level 2 | Level 3 | Total | Level 1 | Level 2 | Level 3 | Total | |||||||||||||||||||||||||
| Assets: |
||||||||||||||||||||||||||||||||
| Interest rate derivatives |
$ | — | $ | 2,118 | $ | — | $ | 2,118 | $ | — | $ | 127 | $ | — | $ | 127 | ||||||||||||||||
| Commodity price swap derivatives |
— | 29,515 | 19,074 | 48,589 | — | 16,197 | 9,305 | 25,502 | ||||||||||||||||||||||||
|
|
|
|
|
|
|
|
|
|
|
|
|
|
|
|
|
|||||||||||||||||
| $ | — | $ | 31,633 | $ | 19,074 | $ | 50,707 | $ | — | $ | 16,324 | $ | 9,305 | $ | 25,629 | |||||||||||||||||
|
|
|
|
|
|
|
|
|
|
|
|
|
|
|
|
|
|||||||||||||||||
| Liabilities: |
||||||||||||||||||||||||||||||||
| Interest rate derivatives |
$ | — | $ | 659 | $ | — | $ | 659 | $ | — | $ | 7,770 | $ | — | $ | 7,770 | ||||||||||||||||
|
|
|
|
|
|
|
|
|
|
|
|
|
|
|
|
|
|||||||||||||||||
F-125
Table of Contents
FIRST WIND OPERATING ENTITIES
Notes to Condensed Combined Financial Statements
(Unaudited)
The following table sets forth a reconciliation of changes in the fair value of derivative instruments classified as Level 3 in the fair value hierarchy for the nine months ended September 30, 2014 (in thousands):
| Balance as of January 1, 2014 |
$ | 19,074 | ||
| Net loss included in earnings |
(9,769 | ) | ||
|
|
|
|||
| Balance as of September 30, 2014 |
$ | 9,305 | ||
|
|
|
|||
| Changes in unrealized losses relating to derivatives still held as of September 30, 2014 |
$ | (9,769 | ) | |
|
|
|
For all derivatives, the First Wind Operating Entities have created internal valuation models to estimate the fair value, using observable data to the extent available. At each quarter-end, the models are generally prepared and reviewed by employees who manage the commodity and interest rate risks, and are then reviewed for reasonableness independently of those employees. The valuation models use the income approach, which consists of forecasting future cash flows based on contractual notional amounts and prices as well as applicable and available market data as of the valuation date. Those cash flows are then discounted using the relevant benchmark interest rate (such as LIBOR) and are further adjusted to reflect credit or nonperformance risk. This risk is estimated by the First Wind Operating Entities using credit spreads and risk premiums that are observable in the market, whenever possible. The First Wind Operating Entities’ methodology to fair value its derivatives is to start with any observable inputs; however, in certain instances the published forward rates or prices may not extend through the remaining term of the contract and management must make assumptions to extrapolate the curve, which necessitates the use of unobservable inputs. Assets and liabilities are classified as Level 3 when the use of unobservable inputs becomes significant.
The following table summarizes the significant unobservable inputs used for the Level 3 derivative assets at September 30, 2014 (in thousands, except range):
| Type of Derivative |
Fair Value | Unobservable Input | Range | |||||||||
| Commodity derivatives |
$ | 9,305 | Electricity forward price ($/MWh) | $ | 33.25 - 66.74 | |||||||
The First Wind Operating Entities measure the sensitivity of the fair value of their Level 3 commodity swaps to potential changes in commodity prices using a mark-to-market analysis based on the current forward commodity prices and estimates of the price volatility. The First Wind Operating Entities estimated that a one standard deviation move in the aggregate fair value of their Level 3 commodity swap positions from September 30, 2014 to December 31, 2014 would result in approximately $3.9 million of gain or loss, depending on the direction of the movement in the underlying commodity prices. An increase in power forward prices will produce a mark-to-market loss, while a decrease in prices will result in a mark-to-market gain.
NOTE 11—COMMITMENTS AND CONTINGENCIES
Letters of Credit
The First Wind Operating Entities’ customers and vendors and regulatory agencies often require the First Wind Operating Entities to post letters of credit in order to guarantee performance under relevant contracts and agreements. The First Wind Operating Entities’ are also required to post letters
F-126
Table of Contents
FIRST WIND OPERATING ENTITIES
Notes to Condensed Combined Financial Statements
(Unaudited)
of credit to secure obligations under various swap agreements and leases and may, from time to time, decide to post letters of credit in lieu of cash deposits in reserve accounts under certain financing arrangements. The amount that can be drawn under some of these letters of credit may be increased from time to time subject to the satisfaction of certain conditions. The First Wind Operating Entities were contingently liable for performance under letters of credit totaling $88.5 million as of December 31, 2013, of which $5.4 million were guaranteed by First Wind and the remaining $83.1 million were non-recourse liabilities of the First Wind Operating Entities. As of September 30, 2014, letters of credit totaled $98.7 million, all of which were non-recourse liabilities of the First Wind Operating Entities. As of September 30, 2014, the First Wind Operating Entities had total additional availability under committed letter of credit facilities of $9.7 million.
Legal Proceedings
The First Wind Operating Entities are involved from time to time in litigation and disputes arising in the normal course of business, including proceedings contesting their permits or the operation of their projects. Management does not believe these proceedings will, if determined adversely, have a material adverse effect on the financial condition, results of operations and liquidity of the First Wind Operating Entities.
NOTE 12—RELATED PARTY TRANSACTIONS
In the normal course of business the First Wind Operating Entities engage in transactions with related parties. Amounts related to the operations of the projects, as described below, are payable on demand.
Administrative Services Agreement
The First Wind Operating Entities have entered into an Administrative Services Agreement (ASA) with First Wind Energy, LLC (First Wind Energy), a subsidiary of First Wind, whereby First Wind Energy provides management services to the First Wind Operating Entities. As part of its management services, First Wind Energy provides legal, accounting, project management and other administrative services to the First Wind Operating Entities. Management fees incurred under the ASA for the nine months ended September 30, 2013 and 2014 of $1.6 million per year has been expensed and is included in project operating expenses in the accompanying condensed combined statements of operations.
Management Services Agreement
Certain of the First Wind Operating Entities entered into a Management Services Agreement (MSA) with First Wind Energy, whereby First Wind Energy provides day-to-day management of the administrative function of the First Wind Operating Entities. As part of its management services, First Wind Energy provides legal, accounting, project management and other administrative services to the First Wind Operating Entities. During the years ended September 30, 2013 and 2014, $2.8 million and $3.1 million, respectively, have been incurred under this agreement and the expense is included in general and administrative expenses on the accompanying condensed combined statements of operations.
F-127
Table of Contents
FIRST WIND OPERATING ENTITIES
Notes to Condensed Combined Financial Statements
(Unaudited)
Project O&M Agreement
The First Wind Operating Entities have entered into a Project Operation and Maintenance (O&M) Agreement with First Wind O&M, LLC (FWO&M), a subsidiary of First Wind, whereby FWO&M acts as operations manager of the project upon achieving commercial operation. The First Wind Operating Entities reimburse FWO&M for direct third party costs related to managing the operations of the projects at cost. For the nine months ended months ended September 30, 2013 and 2014, the First Wind Operating Entities incurred costs in the amount of $9 million and $11.2 million, respectively under these agreements. These costs are included in project operating expenses in the accompanying condensed combined statement of operations.
F-128
Table of Contents
Report of Independent Registered Public Accounting Firm
To SunEdison Yieldco, Inc.:
We have audited the accompanying balance sheet of SunEdison Yieldco, Inc. (the Company) as of January 15, 2014. The balance sheet is the responsibility of the Company’s management. Our responsibility is to express an opinion on the balance sheet based on our audit.
We conducted our audit in accordance with the standards of the Public Company Accounting Oversight Board (United States). Those standards require that we plan and perform the audit to obtain reasonable assurance about whether the balance sheet is free of material misstatement. An audit includes examining, on a test basis, evidence supporting the amounts and disclosures in the balance sheet. An audit also includes assessing the accounting principles used and significant estimates made by management, as well as evaluating the overall balance sheet presentation. We believe that our audit provides a reasonable basis for our opinion.
In our opinion, the balance sheet referred to above presents fairly, in all material respects, the financial position of the Company as of January 15, 2014, in conformity with U.S. generally accepted accounting principles.
/s/ KPMG LLP
McLean, Virginia
April 10, 2014
F-129
Table of Contents
Balance Sheet
| January 15, 2014 | ||||
| Stockholder’s Equity |
||||
| Common Stock |
$ | 10 | ||
| Receivable for issuance of common stock |
(10 | ) | ||
|
|
|
|||
| Total stockholder’s equity |
$ | — | ||
|
|
|
|||
See accompanying notes to balance sheet.
F-130
Table of Contents
Notes to Balance Sheet
1. NATURE OF OPERATIONS
SunEdison Yieldco, Inc. (the “Corporation”) is a Delaware corporation formed on January 15, 2014 by SunEdison, Inc. (“SunEdison” or “Parent”) as a wholly owned subsidiary of SunEdison. The Corporation intends to become a holding company with its sole assets expected to be an equity interest in SunEdison Yieldco, LLC. (“SunEdison Yieldco”). The Corporation intends to be the managing member of SunEdison Yieldco and will operate and control the business affairs of SunEdison Yieldco. As of December 31, 2013, the Corporation was not yet incorporated and had no operations.
2. SUMMARY OF SIGNIFICANT ACCOUNTING POLICIES
Basis of Presentation
The SunEdison Yieldco, Inc. balance sheet has been prepared in accordance with U.S. generally accepted accounting principles. Separate statements of income, changes in stockholder’s equity and cash flows have not been presented in the financial statements because there have been no activities of this entity other than those related to its formation.
3. STOCKHOLDER’S EQUITY
The Corporation is authorized to issue 1,000 shares of common stock, par value $0.01 per share. The Corporation has issued all 1,000 shares of common stock to SunEdison in exchange for the $10 par value.
F-131
Table of Contents
Report of Independent Registered Public Accounting Firm
To TerraForm Power:
We have audited the accompanying combined consolidated balance sheets of TerraForm Power (a solar energy generation asset business of SunEdison, Inc.) (the Company) as of December 31, 2013 and 2012, and the related combined consolidated statements of operations, equity, and cash flows for each of the years in the two-year period ended December 31, 2013. These combined consolidated financial statements are the responsibility of the Company’s management. Our responsibility is to express an opinion on these combined consolidated financial statements based on our audits.
We conducted our audits in accordance with the standards of the Public Company Accounting Oversight Board (United States). Those standards require that we plan and perform the audit to obtain reasonable assurance about whether the financial statements are free of material misstatement. An audit includes examining, on a test basis, evidence supporting the amounts and disclosures in the financial statements. An audit also includes assessing the accounting principles used and significant estimates made by management, as well as evaluating the overall financial statement presentation. We believe that our audits provide a reasonable basis for our opinion.
In our opinion, the combined consolidated financial statements referred to above present fairly, in all material respects, the financial position of TerraForm Power as of December 31, 2013 and 2012, and the results of their operations and their cash flows for each of the years in the two-year period ended December 31, 2013, in conformity with U.S. generally accepted accounting principles.
/s/ KPMG LLP
McLean, Virginia
May 27, 2014
F-132
Table of Contents
Combined Consolidated Statements of Operations
| For the year ended December 31, |
||||||||
| In thousands | 2013 | 2012 | ||||||
| Operating revenues: |
||||||||
| Energy |
$ | 8,928 | $ | 8,193 | ||||
| Incentives |
7,608 | 5,930 | ||||||
| Incentives-affiliate |
933 | 1,571 | ||||||
|
|
|
|
|
|||||
| Total operating revenues |
17,469 | 15,694 | ||||||
|
|
|
|
|
|||||
| Operating costs and expenses: |
||||||||
| Cost of operations |
1,024 | 837 | ||||||
| Cost of operations-affiliate |
911 | 680 | ||||||
| General and administrative |
289 | 177 | ||||||
| General and administrative-affiliate |
5,158 | 4,425 | ||||||
| Depreciation and accretion |
4,961 | 4,267 | ||||||
|
|
|
|
|
|||||
| Total operating costs and expenses |
12,343 | 10,386 | ||||||
|
|
|
|
|
|||||
| Operating income |
5,126 | 5,308 | ||||||
| Other (income) expense: |
||||||||
| Interest expense, net |
6,267 | 5,702 | ||||||
| Gain on foreign currency exchange |
(771 | ) | — | |||||
|
|
|
|
|
|||||
| Total other expenses, net |
5,496 | 5,702 | ||||||
|
|
|
|
|
|||||
| Loss before income tax benefit |
(370 | ) | (394 | ) | ||||
| Income tax benefit |
(88 | ) | (1,270 | ) | ||||
|
|
|
|
|
|||||
| Net (loss) income |
$ | (282 | ) | $ | 876 | |||
|
|
|
|
|
|||||
See accompanying notes to combined consolidated financial statements.
F-133
Table of Contents
Combined Consolidated Balance Sheets
| As of December 31, | ||||||||
| In thousands | 2013 | 2012 | ||||||
| Assets |
||||||||
| Current assets: |
||||||||
| Cash and cash equivalents |
$ | 1,044 | $ | 3 | ||||
| Restricted cash, including consolidated variable interest entities of $2,139 and $0 in 2013 and 2012, respectively |
62,321 | 4,538 | ||||||
| Accounts receivable |
1,505 | 613 | ||||||
| Deferred income taxes |
128 | 27 | ||||||
| VAT receivable and other current assets |
41,360 | 3,673 | ||||||
|
|
|
|
|
|||||
| Total current assets |
106,358 | 8,854 | ||||||
| Property and equipment, net, including consolidated variable interest entities of $26,006 and $0 in 2013 and 2012, respectively |
407,356 | 111,697 | ||||||
| Intangible assets |
22,600 | 22,600 | ||||||
| Deferred financing costs, net |
12,397 | 1,828 | ||||||
| Other assets |
18,166 | 13,976 | ||||||
|
|
|
|
|
|||||
| Total assets |
$ | 566,877 | $ | 158,955 | ||||
|
|
|
|
|
|||||
| Liabilities and Equity |
||||||||
| Current liabilities: |
||||||||
| Current portion of long-term debt and financing lease obligations, including consolidated variable interest entities of $587 and $0 in 2013 and 2012, respectively |
$ | 36,682 | $ | 1,191 | ||||
| Current portion of capital lease obligations |
773 | 1,802 | ||||||
| Accounts payable and other current liabilities |
8,688 | 575 | ||||||
| Deferred revenue |
428 | 205 | ||||||
| Due to parent and affiliates |
82,051 | 5,988 | ||||||
|
|
|
|
|
|||||
| Total current liabilities |
128,622 | 9,761 | ||||||
| Other liabilities: |
||||||||
| Long-term debt and financing lease obligations, less current portion, including consolidated variable interest entities of $8,683 and $0 in 2013 and 2012, respectively |
371,427 | 74,307 | ||||||
| Long-term capital lease obligations, less current portion |
28,398 | 29,172 | ||||||
| Deferred revenue |
5,376 | 5,012 | ||||||
| Deferred income taxes |
6,600 | 4,499 | ||||||
| Asset retirement obligations, including consolidated variable interest entities of $1,627 and $0 in 2013 and 2012, respectively |
11,002 | 6,175 | ||||||
|
|
|
|
|
|||||
| Total liabilities |
551,425 | 128,926 | ||||||
|
|
|
|
|
|||||
| Equity: |
||||||||
| Net parent investment |
2,674 | 30,029 | ||||||
| Non-controlling interests |
12,778 | — | ||||||
|
|
|
|
|
|||||
| Total equity |
15,452 | 30,029 | ||||||
|
|
|
|
|
|||||
| Total liabilities and equity |
$ | 566,877 | $ | 158,955 | ||||
|
|
|
|
|
|||||
See accompanying notes to combined consolidated financial statements.
F-134
Table of Contents
Combined Consolidated Statements of Cash Flows
| For the year ended December 31, |
||||||||
| In thousands | 2013 | 2012 | ||||||
| Cash flows from operating activities: |
||||||||
| Net (loss) income |
$ | (282 | ) | $ | 876 | |||
| Adjustments to reconcile net income to net cash (used in) provided by operating activities: |
||||||||
| Non-cash incentive revenue |
(1,761 | ) | (1,831 | ) | ||||
| Non-cash interest expense |
1,139 | 1,119 | ||||||
| Depreciation and accretion |
4,961 | 4,267 | ||||||
| Amortization of deferred financing costs and debt discounts |
119 | 161 | ||||||
| Recognition of deferred revenue |
(205 | ) | (190 | ) | ||||
| Deferred taxes |
(253 | ) | (1,270 | ) | ||||
| Gain on foreign currency exchange |
(771 | ) | — | |||||
| Other |
13 | 214 | ||||||
| Changes in assets and liabilities: |
||||||||
| Accounts receivable |
(892 | ) | 106 | |||||
| VAT receivable and other current assets |
(33,701 | ) | (786 | ) | ||||
| Accounts payable and other current liabilities |
4,774 | (613 | ) | |||||
| Deferred revenue |
792 | 173 | ||||||
| Due to parent and affiliates |
18,865 | 664 | ||||||
|
|
|
|
|
|||||
| Net cash (used in) provided by operating activities |
(7,202 | ) | 2,890 | |||||
|
|
|
|
|
|||||
| Cash flows from investing activities: |
||||||||
| Capital expenditures |
(205,361 | ) | (2,274 | ) | ||||
| Receipts of grants in lieu of tax credits |
— | 5,466 | ||||||
| Change in restricted cash |
(58,878 | ) | (3,602 | ) | ||||
|
|
|
|
|
|||||
| Net cash used in investing activities |
(264,239 | ) | (410 | ) | ||||
|
|
|
|
|
|||||
| Cash flows from financing activities: |
||||||||
| Principal payments on long-term debt |
(2,838 | ) | (529 | ) | ||||
| Change in restricted cash for principal payments on long-term debt |
2,834 | 475 | ||||||
| Repayments of solar energy system capital lease obligations |
(1,803 | ) | (1,762 | ) | ||||
| Proceeds from long-term debt |
304,729 | — | ||||||
| Contributions from non-controlling interest |
12,778 | — | ||||||
| Net parent investment |
(32,702 | ) | (648 | ) | ||||
| Payment of deferred financing costs |
(10,516 | ) | (13 | ) | ||||
|
|
|
|
|
|||||
| Net cash provided by (used in) financing activities |
272,482 | (2,477 | ) | |||||
|
|
|
|
|
|||||
| Net change in cash and cash equivalents |
1,041 | 3 | ||||||
| Cash and cash equivalents at beginning of period |
3 | — | ||||||
|
|
|
|
|
|||||
| Cash and cash equivalents at end of period |
$ | 1,044 | $ | 3 | ||||
|
|
|
|
|
|||||
See accompanying notes to combined consolidated financial statements.
F-135
Table of Contents
Combined Consolidated Statements of Equity
| In thousands | Net Parent Investment |
Non-controlling Interests |
Total Equity | |||||||||
| Balance at December 31, 2011 |
$ | 29,801 | $ | — | $ | 29,801 | ||||||
|
|
|
|
|
|
|
|||||||
| Net income |
876 | — | 876 | |||||||||
| Contributions from parent and affiliates—cash |
4,818 | — | 4,818 | |||||||||
| Distributions to parent and affiliates—cash |
(5,466 | ) | — | (5,466 | ) | |||||||
|
|
|
|
|
|
|
|||||||
| Balance at December 31, 2012 |
$ | 30,029 | $ | — | $ | 30,029 | ||||||
|
|
|
|
|
|
|
|||||||
| Net loss |
(282 | ) | — | (282 | ) | |||||||
| Contributions from parent and affiliates—cash |
47,788 | — | 47,788 | |||||||||
| Contributions from parent and affiliates—non-cash |
5,629 | — | 5,629 | |||||||||
| Distributions to parent and affiliates—cash |
(80,490 | ) | — | |
(80,490 |
) | ||||||
| Contributions from noncontrolling interests |
— | 12,778 | 12,778 | |||||||||
|
|
|
|
|
|
|
|||||||
| Balance at December 31, 2013 |
$ | 2,674 | $ | 12,778 | $ | 15,452 | ||||||
|
|
|
|
|
|
|
|||||||
See accompanying notes to combined consolidated financial statements.
F-136
Table of Contents
Notes to Combined Consolidated Financial Statements
(Amounts in thousands)
1. NATURE OF OPERATIONS
The accompanying combined consolidated financial statements of TerraForm Power (“TerraForm Power”, the “Predecessor”, or the “Company”) have been prepared in connection with the proposed initial public offering of Class A common stock of TerraForm Power, Inc. (“Offering”). TerraForm Power, Inc. was formed under the name SunEdison Yieldco, Inc. on January 15, 2014 as a wholly owned subsidiary of SunEdison, Inc. (“Parent”). TerraForm Power represents the assets that TerraForm Power, Inc. intends to acquire from the Parent concurrently with the closing of the Offering, and therefore, the combined consolidated financial statements of TerraForm Power are viewed as the Predecessor of TerraForm Power, Inc. The assets to be acquired include solar energy generation systems and the long-term contractual arrangements to sell the solar energy generated to third parties.
Basis of Presentation
TerraForm Power has presented combined consolidated financial statements as of and for the years ended December 31, 2013 and 2012. TerraForm Power’s combined consolidated financial statements have been prepared in accordance with U.S. generally accepted accounting principles (“U.S. GAAP”). The Financial Accounting Standards Board (“FASB”) Accounting Standards Codification (“ASC”) is the source of authoritative U.S. GAAP to be applied by nongovernmental entities. In addition, the rules and interpretative releases of the United States Securities and Exchange Commission (“SEC”) under authority of federal securities laws are also sources of authoritative U.S. GAAP for SEC registrants.
TerraForm Power currently operates as part of the Parent. The combined consolidated financial statements were prepared using the Parent’s historical basis in certain assets and liabilities, and include all revenues, expenses, assets, and liabilities attributed to the assets to be acquired. The historical combined consolidated financial statements also include allocations of certain corporate expenses of the Parent. Management believes the assumptions and methodology underlying the allocation of the Parent’s corporate expenses reasonably reflects all of the costs of doing business of the predecessor. However, such expenses may not be indicative of the actual level of expense that would have been incurred by the Predecessor if it had operated as an independent, publicly traded company during the periods prior to the Offering or of the costs expected to be incurred in the future.
The combined consolidated balance sheets do not separately present certain of the Parent’s assets or liabilities where management deemed it inappropriate due to the underlying nature of those assets and liabilities. The Parent performs financing, cash management, treasury and other services for us on a centralized basis. Changes in the net parent investment account in the combined balance sheets related to these activities have been considered cash receipts and payments for purposes of the combined statements of cash flows and are reflected in financing activities. Changes in the net parent investment account resulting from Parent contributions of assets and liabilities have been considered non-cash financing activities for purposes of the combined consolidated statements of cash flows.
These combined consolidated financial statements and related notes to the combined consolidated financial statements are presented on a consistent basis for all periods presented. All significant intercompany transactions and balances have been eliminated in the combined consolidated financial statements.
F-137
Table of Contents
2. SUMMARY OF SIGNIFICANT ACCOUNTING POLICIES
Use of Estimates
In preparing our combined consolidated financial statements, we use estimates and assumptions that may affect reported amounts and disclosures. Estimates are used when accounting for depreciation, amortization, leases, asset retirement obligations, the fair value of assets and liabilities recorded in connection with business combinations, accrued liabilities and income taxes, among others. Such estimates also affect the reported amounts of revenues and expenses during the reporting period. Actual results may differ from estimates under different assumptions or conditions.
Cash and Cash Equivalents
Cash and cash equivalents include all cash balances and money market funds with original maturity periods of three months or less when purchased.
Restricted Cash
Restricted cash consists of cash on deposit in financial institutions that is restricted from use in operations pursuant to requirements of certain debt agreements. These funds are used to pay for capital expenditures, current operating expenses and current debt service payments in accordance with the restrictions in the debt agreements. Restricted cash with maturity periods greater than one year are presented within other assets in the combined consolidated balance sheets. The amount of restricted cash included in other assets at December 31, 2013 and 2012 was $7,401 and $4,290, respectively.
Accounts Receivable
Accounts receivable are reported on the combined consolidated balance sheets at the invoiced amounts adjusted for any write-offs and the allowance for doubtful accounts. We establish an allowance for doubtful accounts to adjust our receivables to amounts considered to be ultimately collectible. Our allowance is based on a variety of factors, including the length of time receivables are past due, significant one-time events, the financial health of our customers and historical experience. There was no allowance for doubtful accounts or write-off of accounts receivable as of and for the years ended December 31, 2013 and 2012.
Property and Equipment
Property and equipment consists of solar energy systems and is stated at cost. Expenditures for major additions and improvements are capitalized, and minor replacements, maintenance, and repairs are charged to expense as incurred. When property and equipment is retired, or otherwise disposed of, the cost and accumulated depreciation is removed from the accounts and any resulting gain or loss is included in the results of operations for the respective period. Depreciation of property and equipment is recognized using the straight-line method over the estimated useful lives of the solar energy systems of twenty to thirty years.
The Company is entitled to receive investment tax credits or grants in lieu of tax credits from various government agencies, both state and federal, for the construction of certain eligible items of property and equipment. The carrying value of the property and equipment has been reduced by the amount of the construction credits or grants received.
Capitalized Interest
Interest incurred on funds borrowed to finance construction of solar energy systems is capitalized until the system is ready for its intended use. The amount of interest capitalized during the year ended
F-138
Table of Contents
December 31, 2013 was $3,599 and no amounts were capitalized during the year ended December 31, 2012. Interest costs charged to interest expense was $6,275 and $5,706 during the years ended December 31, 2013 and 2012, respectively.
Deferred Financing Costs
Financing costs incurred in connection with obtaining construction and term financing are deferred and amortized over the maturities of the respective financing arrangements using the effective-interest method. Amortization of deferred financing costs is capitalized during construction and recorded as interest expense in the consolidated statements of operations following commencement of commercial operation. Amortization of deferred financing costs capitalized during construction was $791 during the year ended December 31, 2013 and no amounts were capitalized during the year ended December 31, 2012. Amortization of deferred financing costs recorded as interest expense was $119 and $161 during the years ended December 31, 2013 and 2012, respectively.
Variable Interest Entities (“VIEs”)
The Company consolidates VIEs where the Company is the primary beneficiary. The primary beneficiary of a VIE is the party that has the power to direct the activities that most significantly impact the performance of the entity and the obligation to absorb loses or the right to receive benefits that could potentially be significant to the entity.
Non-controlling Interests
Non-controlling interests represents the portion of net assets in consolidated entities that are not owned by the Company. For certain partnership structures where income is not allocated based on legal ownership percentages, we measure the income (loss) allocable to the non-controlling interest holders using a hypothetical liquidation of book value method that considers the terms of the governing contractual arrangements. The non-controlling interests’ balance is reported as a component of equity in the combined consolidated balance sheets. No income was allocated to the non-controlling interest holders in 2012 or 2013 as the non-controlling interest originated in late December 2013
Impairment of Long-lived Assets
Long-lived assets that are held and used are reviewed for impairment whenever events or changes in circumstances indicate carrying values may not be recoverable. An impairment loss is recognized if the total future estimated undiscounted cash flows expected from an asset are less than its carrying value. An impairment charge is measured as the difference between an asset’s carrying amount and fair value with the difference recorded in operating costs and expenses in the statement of operations. Fair values are determined by a variety of valuation methods, including appraisals, sales prices of similar assets and present value techniques. There were no impairments recognized during the years ended December 31, 2013 and 2012.
Capital Leases
The Company is party to a lease agreement that provided for the sale and simultaneous leaseback of a solar energy system. We record a lease liability and the solar energy system asset on our balance sheet at the present value of minimum lease payments.
Financing Lease Obligations
Certain of our assets were financed with sale lease back arrangements. Proceeds received from a sale leaseback are treated using the deposit method when the sale of the solar energy system is not
F-139
Table of Contents
recognizable. A sale is not recognized when the leaseback arrangements include a prohibited form of continuing involvement, such as an option or obligation to repurchase the assets under our master lease agreements. Under these arrangements, we do not recognize any profit until the sale is recognizable, which we expect will be at the end of the arrangement when the contract is cancelled and the initial deposits received are forfeited by the financing party.
Over the course of the leaseback arrangements we are required to make rental payments. These payments are treated as a financing arrangement. Interest expense is recognized using an effective yield method.
Asset Retirement Obligations
The Company operates under solar power services agreements with some customers that include a requirement for the removal of the solar energy systems at the end of the term of the agreement. Asset retirement obligations are recognized at fair value in the period in which they are incurred and the carrying amount of the related long-lived asset is correspondingly increased. Over time, the liability is accreted to its expected future value. The corresponding asset capitalized at inception is depreciated over the useful life of the solar energy system.
Revenue Recognition
Power Purchase Agreements
A significant majority of the Company’s revenues are obtained through the sale of energy pursuant to terms of power purchase agreements (“PPAs”) or other contractual arrangements which have a weighted average (based on MWs) remaining life of 17 years as of December 31, 2013. All PPAs are accounted for as operating leases, have no minimum lease payments and all of the rental income under these leases is recorded as income when the electricity is delivered. The contingent rental income recognized in the years ended December 31, 2013 and 2012 was $8,928 and $8,193, respectively.
Incentive Revenue
The Company also generates solar renewable energy certificates (“SRECs”) as it produces electricity. SRECs are accounted for as governmental incentives and are not considered output of the underlying solar energy systems. These SRECs are currently sold pursuant to agreements with third parties, our parent and a certain debt holder, and SREC revenue is recognized when the electricity is generated and the SREC is sold. Under the terms of certain debt agreements with a creditor, SRECs are transferred directly to the creditor to reduce principal and interest payments due under solar program loans and are therefore presented in the combined consolidated statements of cash flows as a non-cash reconciling item in determining cash flows from operations. Additionally, we have contractual agreements with our Sponsor for the sale of 100% of the SRECs generated by certain systems included in the initial portfolio. These SRECs are transferred directly to our Sponsor when they are generated. Revenue from the sale of SRECs under the terms of the solar program loans was $1,761 and $1,831 during the years ended December 31, 2013 and 2012, respectively. Revenue from the sale of SRECs to affiliates was $933 and $1,571 during the years ended December 31, 2013 and 2012, respectively. Revenue from the sale of SRECs to third parties was $1,371 during the year ended December 31, 2013 with no corresponding revenue for the year ended December 31, 2012.
The Company also receives performance-based incentives, or “PBIs,” from public utilities in connection with certain sponsored programs. The Company has a PBI arrangement with the state of California. PBI arrangements within the state of California are agreements whereby the Company will receive a set rate multiplied by the kWh production on a monthly basis for 60 months. The PBI revenue
F-140
Table of Contents
is recognized as energy is generated over the measurement period. The Company recognizes revenue based on the rate applicable at the time the energy is created and adjusts the amount recognized when the Company meets the threshold that qualifies it for the higher rate. PBI in the state of Colorado has a 20-year term at a fixed price per kWh produced. The revenue is recognized as energy is generated over the term of the agreement. Revenue from PBIs was $4,271 and $3,909 during the years ended December 31, 2013 and 2012, respectively.
Deferred Revenue
Deferred revenue consists of upfront incentives or subsidies received from various state governmental jurisdictions for operating certain of our solar energy systems. The amounts deferred are recognized as revenue on a straight-line basis over the depreciable life of the solar energy system as the Company fulfills its obligation to operate these solar energy systems. Recognition of deferred revenue was $205 and $190 during the years ended December 31, 2013 and 2012, respectively.
Income Taxes
Our income tax balances are determined and reported using a “separate return” method, or as though we filed separate returns for jurisdictions in which TerraForm Power’s operations are included in consolidated returns filed by the Parent. Income taxes as presented herein allocate current and deferred income taxes of the Parent to us in a manner that is systematic, rational and consistent with the asset and liability method. The sum of the amounts allocated to TerraForm Power’s carve-out tax provisions may not equal the historical consolidated provision. Under the separate return method, deferred tax assets and liabilities are recognized for the future tax consequences attributable to differences between the financial statement carrying amounts of existing assets and liabilities and their respective tax bases and operating loss carry forwards.
Deferred tax assets and liabilities are measured using enacted tax rates expected to apply to taxable income in the years in which those temporary differences are expected to be recovered or settled. The effect on deferred tax assets and liabilities of a change in tax rate is recognized in operations in the period that includes the enactment date. Valuation allowances are established when management determines that it is more likely than not that some portion, or all of the deferred tax asset, will not be realized. The financial effect of changes in tax laws or rates is accounted for in the period of enactment.
Deferred income taxes arise primarily because of differences in the bases of assets or liabilities between financial statement accounting and tax accounting which are known as temporary differences. We record the tax effect of these temporary differences as deferred tax assets (generally items that can be used as a tax deduction or credit in future periods) and deferred tax liabilities (generally items for which we receive a tax deduction, but have not yet been recorded in the combined consolidated statement of operations).
We regularly review our deferred tax assets for realizability, taking into consideration all available evidence, both positive and negative, including historical pre-tax and taxable income, projected future pre-tax and taxable income and the expected timing of the reversals of existing temporary differences. In arriving at these judgments, the weight given to the potential effect of all positive and negative evidence is commensurate with the extent to which it can be objectively verified.
We believe our tax positions are in compliance with applicable tax laws and regulations. Tax benefits are recognized only for tax positions that are more likely than not to be sustained upon examination by tax authorities. The amount recognized is measured as the largest amount of benefit that is greater than 50 percent likely to be realized upon ultimate settlement. We believe that our
F-141
Table of Contents
income tax accrued liabilities, including related interest, are adequate in relation to the potential for additional tax assessments. There is a risk, however, that the amounts ultimately paid upon resolution of audits could be materially different from the amounts previously included in our income tax expense and, therefore, could have a material impact on our tax provision, net income and cash flows.
Contingencies
We are involved in conditions, situations or circumstances in the ordinary course of business with possible gain or loss contingencies that will ultimately be resolved when one or more future events occur or fail to occur. If some amount within a range of loss appears at the time to be a better estimate than any other amount within the range, that amount will be accrued. When no amount within the range is a better estimate than any other amount, however, the minimum amount in the range will be accrued. We continually evaluate uncertainties associated with loss contingencies and record a charge equal to at least the minimum estimated liability for a loss contingency when both of the following conditions are met: (i) information available prior to issuance of the financial statements indicates that it is probable that an asset had been impaired or a liability had been incurred at the date of the financial statements; and (ii) the loss or range of loss can be reasonably estimated. Legal costs are expensed when incurred. Gain contingencies are not recorded until realized or realizable.
Fair Value Measurements
We maintain various financial instruments recorded at cost in the December 31, 2013 and 2012 combined consolidated balance sheets that are not required to be recorded at fair value. For cash and cash equivalents, restricted cash, accounts receivable, accounts payable, and accrued liabilities, the carrying amount approximates fair value because of the short-term maturity of the instruments. See Note 8 for disclosures related to the fair value of our long-term debt.
Foreign Currency Transactions
Transaction gains and losses that arise from exchange rate fluctuations on transactions and balances denominated in a currency other than the functional currency are generally included in the results of operations as incurred. Foreign currency transaction gains included in other income were $771 during the year ended December 31, 2013. There were no transaction gains or losses arising from exchange rate fluctuations during the period ended December 31, 2012.
Business Combinations
The Company accounts for its business combinations by recognizing in the financial statements the identifiable assets acquired, the liabilities assumed, and any non-controlling interest in the acquiree at fair value at the acquisition date. The Company also recognizes and measures the goodwill acquired or a gain from a bargain purchase in the business combination and determines what information to disclose to enable users of an entity’s financial statements to evaluate the nature and financial effects of the business combination. In addition, transaction costs are expensed as incurred.
Earnings Per Share
During the periods presented, TerraForm Power was wholly owned by the Parent and accordingly, no earnings per share has been calculated.
F-142
Table of Contents
Supplemental Cash Flow Information
Following is information related to interest paid as well as certain non-cash investing and financing activities:
Comprehensive Income
TerraForm Power did not have other comprehensive income for the years ended December 31, 2013 and 2012 or accumulated other comprehensive income as of December 31, 2013 and 2012. As such, no statement of comprehensive income has been presented herein.
| For the year ended December 31, |
||||||||
| 2013 | 2012 | |||||||
| In thousands | ||||||||
| Supplemental Disclosure: |
||||||||
| Cash payments for interest |
$ | 8,564 | $ | 4,946 | ||||
| Schedule of non-cash investing and financing activities: |
||||||||
| Amortization of deferred financing costs—included as construction in progress |
791 | — | ||||||
| Additions to deferred financing costs included in due to parent and affiliates |
963 | — | ||||||
| Additions from a non-monetary transaction by the parent: |
||||||||
| Restricted cash |
4,850 | — | ||||||
| Property and equipment |
34,514 | — | ||||||
| Debt and financing lease obligations |
(31,482 | ) | — | |||||
| Deferred tax liability |
(2,253 | ) | — | |||||
|
|
|
|
|
|||||
| Total non-cash contribution from parent |
5,629 | — | ||||||
| Additions to property and equipment |
54,090 | 3,978 | ||||||
| Additions to ARO assets and obligations |
4,518 | 37 | ||||||
| Principal payments on long-term debt from solar renewable energy certificates |
622 | 712 | ||||||
No income taxes were paid by TerraForm Power in the years ended December 31, 2013 and 2012.
3. ACQUISITIONS
Subsequent to December 31, 2013, the Company completed the following acquisitions. The initial accounting for these business combinations is not complete because the evaluation necessary to assess the fair values of assets acquired and liabilities assumed is still in process. The provisional amounts are subject to revision to the extent additional information is obtained about the facts and circumstances that existed as of the acquisition dates.
Nellis
On March 28, 2014, the Company acquired 100% of the controlling investor member interests in MMA NAFB Power, LLC (“Nellis”), which owns a 14.1 MW solar energy generation system located on Nellis Air Force Base in Clark County, Nevada. A wholly owned subsidiary of our Parent holds the noncontrolling interest in Nellis.
CalRenew-1
On April 30, 2014, the Company signed a unit purchase agreement to acquire 100% of the issued and outstanding membership interests of CalRenew-1, LLC (“CR-1”), which owns a 6.3 MW solar energy generation system located in Mendota, California.
F-143
Table of Contents
Atwell Island
On May 16, 2014, the Company signed a membership interest purchase agreement to acquire all of the membership interests in SPS Atwell Island, LLC (“Atwell Island”), a 23.5 MW solar energy generation system located in Tulare County, California.
MA Operating
On May 16, 2014, the Company signed four asset purchase agreements to acquire four operating solar energy systems located in Massachusetts. These four projects achieved commercial operations during 2013 and have a total capacity of 12.2 MW.
Stonehenge Operating Projects
On May 21, 2014, the Company signed three purchase agreements to acquire 100% of the issued share capital of three operating solar energy systems located in the United Kingdom from ib Vogt GMBH. These acquisitions are collectively referred to as Stonehenge Operating Projects. The Stonehenge Operating Projects consists of Sunsave 6 (Manston) Limited, Boyton Solar Park Limited and KS SPV 24 Limited. The total combined capacity for the Stonehenge Operating Projects is 23.6 MW.
Summit Solar Projects
On May 22, 2014, the Company signed a purchase and sale agreement to acquire the equity interests in 23 solar energy systems located in the U.S. from Nautilus Solar PV Holdings, Inc. These 23 systems have a combined capacity of 19.6 MW. In addition, an affiliate of the seller owns certain interests in seven operating solar energy systems in Canada with a total capacity of 3.8 MW. In conjunction with the singing of the purchase and sale agreement to acquire the U.S. equity interests, the Company signed an asset purchase agreement to purchase the right and title to all of the assets of the Canadian facilities.
The provisional estimated allocation of assets and liabilities is as follows (in thousands):
| Cash and cash equivalents |
$ | 9,563 | ||
| Property and equipment |
190,169 | |||
| Other assets |
16,096 | |||
| Intangible assets (PPA) |
104,643 | |||
|
|
|
|||
| Total assets acquired |
320,471 | |||
|
|
|
|||
| Debt |
100,908 | |||
| Accounts payable |
2,336 | |||
| Asset retirement obligations |
4,909 | |||
|
|
|
|||
| Total liabilities assumed |
108,153 | |||
|
|
|
|||
| Purchase Price |
212,318 | |||
|
|
|
F-144
Table of Contents
The following unaudited pro forma supplementary data gives effect to the acquisitions as if the transactions had occurred on January 1, 2013. The unaudited pro forma supplementary data is provided for informational purposes only and should not be construed to be indicative of the Company’s results of operations had the acquisitions been consummated on the date assumed or of the Company’s results of operations for any future date.
| For the years ended December 31, (unaudited) |
||||||||
| 2013 | 2012 | |||||||
| Operating revenues |
$ | 45,125 | $ | 31,680 | ||||
| Net loss |
7,558 | 6,737 | ||||||
Acquisition costs related to the transactions above are de minimus and have not been adjusted for in the unaudited pro forma supplementary data.
4. PROPERTY AND EQUIPMENT
Property and equipment consists of the following:
| As of December 31, | ||||||||
| In thousands | 2013 | 2012 | ||||||
| Solar energy systems |
$ | 163,698 | $ | 87,093 | ||||
| Construction in progress-solar energy systems |
228,749 | 5,043 | ||||||
| Capital leases-solar energy systems |
29,170 | 29,170 | ||||||
|
|
|
|
|
|||||
| Property and equipment, gross |
421,617 | 121,306 | ||||||
| Less accumulated depreciation-solar energy systems |
(9,956 | ) | (6,355 | ) | ||||
| Less accumulated depreciation-capitalized leased solar energy system |
(4,305 | ) | (3,254 | ) | ||||
|
|
|
|
|
|||||
| Property and equipment, net |
$ | 407,356 | $ | 111,697 | ||||
|
|
|
|
|
|||||
Depreciation expense was $4,652 and $3,997 for the years ended December 31, 2013 and 2012, respectively, and includes depreciation expense for capital leases of $1,051 for each of the years ended December 31, 2013 and 2012.
The cost of constructing facilities, equipment and solar energy systems includes interest costs and amortization of deferred financing costs incurred during the asset’s construction period. These costs totaled $4,390 for the year ended December 31, 2013 and no amounts were capitalized during the year ended December 31, 2012.
5. ASSET RETIREMENT OBLIGATIONS
Activity in asset retirement obligations for the years ended December 31, 2013 and 2012 is as follows:
| As of December 31, | ||||||||
| In thousands | 2013 | 2012 | ||||||
| Balance at the beginning of the year |
$ | 6,175 | $ | 5,868 | ||||
| Additional obligation |
4,518 | 37 | ||||||
| Accretion expense |
309 | 270 | ||||||
|
|
|
|
|
|||||
| Balance at the end of the year |
$ | 11,002 | $ | 6,175 | ||||
|
|
|
|
|
|||||
F-145
Table of Contents
6. VARIABLE INTEREST ENTITIES
We are the primary beneficiary of one VIE in a solar energy project that we consolidated as of December 31, 2013. The carrying amounts and classification of our consolidated VIEs’ assets and liabilities included in our consolidated combined balance sheet are as follows:
| As of December 31, |
||||||||
| In thousands | 2013 | 2012 | ||||||
| Current assets |
$ | 2,139 | $ | — | ||||
| Noncurrent assets |
27,076 | — | ||||||
|
|
|
|
|
|||||
| Total assets |
$ | 29,215 | $ | — | ||||
|
|
|
|
|
|||||
| Current liabilities |
$ | 6,129 | $ | — | ||||
| Noncurrent liabilities |
10,310 | — | ||||||
|
|
|
|
|
|||||
| Total liabilities |
$ | 16,439 | $ | — | ||||
|
|
|
|
|
|||||
All of the assets in the table above are restricted for settlement of the VIE obligations, and all of the liabilities in the table above can only be settled using VIE resources.
7. INTANGIBLE ASSETS
As of December 31, 2013 and 2012, the Company had an intangible asset with a carrying amount of $22,600 related to a power plant development arrangement. Intangible assets related to power plant development arrangements are reclassified to the related solar energy system (property and equipment) upon completion of the solar energy system and are amortized to depreciation expense on a straight-line basis over the estimated life of the solar energy system. No amounts have been amortized during the years ended December 31, 2013 and 2012 as construction of the related solar energy system has not been completed.
8. DEBT AND CAPITAL LEASE OBLIGATIONS
Debt and capital lease obligations consist of the following:
| As of December 31, 2013 | As of December 31, 2012 | |||||||||||||||||||||||
| In thousands | Total Principal |
Current | Long- Term |
Total Principal |
Current | Long- Term |
||||||||||||||||||
| System construction and term debt |
$ | 310,793 | $ | 33,683 | $ | 277,110 | $ | 9,261 | $ | 620 | $ | 8,641 | ||||||||||||
| Solar program loans |
10,206 | 629 | 9,577 | 10,828 | 571 | 10,257 | ||||||||||||||||||
| Capital lease obligations |
29,171 | 773 | 28,398 | 30,974 | 1,802 | 29,172 | ||||||||||||||||||
| Financing lease obligations |
87,110 | 2,370 | 84,740 | 55,409 | — | 55,409 | ||||||||||||||||||
|
|
|
|
|
|
|
|
|
|
|
|
|
|||||||||||||
| Total debt outstanding |
$ | 437,280 | $ | 37,455 | $ | 399,825 | $ | 106,472 | $ | 2,993 | $ | 103,479 | ||||||||||||
|
|
|
|
|
|
|
|
|
|
|
|
|
|||||||||||||
Our solar energy systems for which we have long-term debt obligations are included in separate legal entities. We typically finance our solar energy projects through project entity specific debt secured by the project entity’s assets (mainly the solar energy system) with no recourse to the Company. Typically, these financing arrangements provide for a construction loan, which upon completion will be converted into a term loan. As of December 31, 2013, we had $320,999 project entity specific debt that is secured by the total assets of 25 project entities in the amount of $412,063.
The estimated fair value of our outstanding debt obligations was $443,067 and $77,410 at December 31, 2013 and 2012, respectively. The fair value of our debt is calculated based on expected future cash flows discounted at market interest rates with consideration for non-performance risk or current interest rates for similar instruments.
F-146
Table of Contents
System Construction and Term Debt
Term bonds consist of five fixed rate bonds maturing between January 2016 and April 2032 have fixed interest rates that range between 5.00% and 7.50%. Additionally, a portion of the total outstanding system and construction term debt also relates to variable rate debt with interest rates that are tied to the three-month London Interbank Offered Rate plus an applicable margin of 2.50%. The term debt agreements contain certain representations, covenants and warranties of the borrower including limitations on business activities, guarantees, environmental issues, project maintenance standards, and a minimum debt service coverage ratio requirement.
In August 2013, a Chilean legal entity received $212,500 in non-recourse debt financing from the Overseas Private Investment Corporation (“OPIC”), the U.S. Governments development finance institution, and International Finance Corporation (“IFC”), a member of the World Bank Group. In addition to the debt financing provided by OPIC and IFC, the project entity received a Chilean peso VAT credit facility from Rabobank. Under the VAT credit facility the project entity may borrow funds to pay for value added tax payments due from the project. The VAT credit facility has a variable interest rate that is tied to the Chilean Interbank Rate plus 1.40% and will mature in September 2014. As of December 31, 2013, the outstanding balance under the Chilean peso denominated VAT credit facility was $31,428.
In March 2013, a project entity entered into a financing agreement with a group of lenders for a $44,400 development loan that matures on March 31, 2016. Under the terms of this financing agreement, interest accrues from the date of borrowing until the maturity date at a rate of 18% per annum and is paid in kind (“PIK”) at each PIK interest date. On March 28, 2014 the project entity entered into an agreement for a construction loan facility for an amount up to $120,000. The construction loan facility has a term ending in January, 2015. Interest under the construction loan facility has variable interest rate options based on Base Rate Loans or LIBOR loans at the Company’s election. The interest rate payable under Base Rate Loans will be based upon an adjusted base rate (equal to the greater of (i) the Base Rate (Prime Rate) in effect on such day, (ii) the Federal Funds Effective Rate in effect on such day plus 0.50% and (iii) the LIBO rate plus 1.00%. The interest rate payable under LIBOR Loans will be based upon the published LIBOR rate; plus 3.75% applicable margin.
Solar Program Loans
The solar program loans consist of nineteen loans maturing between September 2024 and October 2026. The fixed interest rates range between 11.11% and 11.31%. We currently repay principal and interest due under loans with SRECs generated by the underlying solar energy systems at the greater of the floor price, as stated in the loan agreements, or market value. The lender performs an annual and biennial calculation to ensure that the SRECs have covered 90% of the payments per the original amortization schedule annually and 100% of the payments biennially. The loan agreements convey customary covenants related to business operations, maintenance of the projects, insurance coverage, and a debt service calculation requirement.
Capital Lease Obligations
The Company is party to a lease agreement that provides for the sale and simultaneous lease of a single solar energy system. Generally, this classification occurs when the term of the lease is greater than 75% of the estimated economic life of the solar energy system and the transaction is not subject to real estate accounting. As of December 31, 2013, the remaining lease term is fourteen years.
F-147
Table of Contents
Financing Lease Obligations
As more fully described in Note 2, in certain transactions we account for the proceeds of sale leasebacks as financings, which are typically secured by the solar energy system asset and its future cash flows from energy sales, but without recourse to us under the terms of the arrangement. The balance outstanding for sale leaseback transactions accounted for as financings as of December 31, 2013 is $87,110. The sale leasebacks accounted for as financings mature in 2025-2032 and are collateralized by the related solar energy system assets with a carrying amount of $69,598.
Maturities
The aggregate amounts of payments on long-term debt, excluding capital lease and financing lease obligations, due after December 31, 2013 are as follows:
| In thousands | 2014 | 2015 | 2016 | 2017 | 2018 | Thereafter | Total | |||||||||||||||||||||
| Maturities of long-term debt |
$ | 34,312 | $ | 8,222 | $ | 53,137 | $ | 9,155 | $ | 9,764 | $ | 206,409 | $ | 320,999 | ||||||||||||||
Capital Lease Obligations
The aggregate amounts of payments on capital lease obligations after December 31, 2013 are as follows:
| In thousands | ||||
| 2014 |
$ | 1,204 | ||
| 2015 |
2,682 | |||
| 2016 |
2,659 | |||
| 2017 |
2,636 | |||
| 2018 |
2,614 | |||
| Thereafter |
23,979 | |||
|
|
|
|||
| Total minimum lease payments |
35,774 | |||
| Less amounts representing interest |
(6,603 | ) | ||
|
|
|
|||
| Present value of minimum lease payments |
29,171 | |||
| Less current portion of obligations under capital leases |
(773 | ) | ||
|
|
|
|||
| Noncurrent portion of obligations under capital leases |
$ | 28,398 | ||
|
|
|
|||
Financing Lease Obligations
The aggregate amounts of minimum lease payments on our financing lease obligations are $68,654. Obligations for 2014 through 2018 are as follows:
| In thousands | 2014 | 2015 | 2016 | 2017 | 2018 | |||||||||||||||
| Minimum lease obligations |
$ | 7,432 | $ | 7,515 | $ | 6,361 | $ | 6,205 | $ | 5,784 | ||||||||||
9. INCOME TAXES
Income tax balances are determined and reported herein under the “separate return” method. Use of the separate return method may result in differences when the sum of the amounts allocated to TerraForm Power’s carve-out tax provisions are compared with amounts presented in the Parent’s consolidated financial statements. The related deferred tax assets and liabilities could be significantly different from those presented herein. Furthermore, certain tax attributes (for example, net operating loss carryforwards) that were reflected in the Parent’s consolidated financial statements may or may not be available to reduce future taxable income when TerraForm Power is separated from the Parent.
F-148
Table of Contents
Income tax expense (benefit) consists of the following:
| In thousands | Current | Deferred | Total | |||||||||
| Year ended December 31, 2013: |
||||||||||||
| U.S. federal |
$ | — | $ | (329 | ) | $ | (329 | ) | ||||
| State and local |
— | 42 | 42 | |||||||||
| Foreign |
165 | 34 | 199 | |||||||||
|
|
|
|
|
|
|
|||||||
| Total |
$ | 165 | $ | (253 | ) | $ | (88 | ) | ||||
|
|
|
|
|
|
|
|||||||
| Year ended December 31, 2012: |
||||||||||||
| U.S. federal |
$ | — | $ | (1,094 | ) | $ | (1,094 | ) | ||||
| State and local |
— | (176 | ) | (176 | ) | |||||||
|
|
|
|
|
|
|
|||||||
| Total |
$ | — | $ | (1,270 | ) | $ | (1,270 | ) | ||||
|
|
|
|
|
|
|
|||||||
Effective Tax Rate
Income tax expense (benefit) differed from the amounts computed by applying the statutory U.S. federal income tax rate of 35% to loss before income taxes.
| For the year ended December 31, |
||||||||
| 2013 | 2012 | |||||||
| Income tax at U.S. federal statutory rate |
(35.0 | )% | (35.0 | )% | ||||
| Increase (reduction) in income taxes: |
||||||||
| State income taxes, net of U.S. federal benefit |
11.2 | (6.7 | ) | |||||
| Grants in lieu of tax credits—U.S. federal |
— | (242.6 | ) | |||||
| Grants in lieu of tax credits—state, net of U.S. federal benefit |
— | (38.0 | ) | |||||
|
|
|
|
|
|||||
| Effective tax expense (benefit) rate |
(23.8 | )% | (322.3 | )% | ||||
|
|
|
|
|
|||||
When investment tax credits or grants in lieu of tax credits are received by TerraForm Power for its solar energy systems, the credits and grants are recognized as a reduction in the carrying value of the property and equipment. This also results in the recognition of a deferred tax asset and income tax benefit for the future tax depreciation of the property and equipment.
Deferred Taxes
The tax effects of the major items recorded as deferred tax assets and liabilities are:
| As of December 31, | ||||||||
| In thousands | 2013 | 2012 | ||||||
| Deferred tax assets: |
||||||||
| Net operating losses and tax credit carryforwards |
$ | 6,745 | $ | 2,733 | ||||
| Deferred revenue |
2,575 | 2,130 | ||||||
| Solar energy systems |
44,218 | 33,182 | ||||||
|
|
|
|
|
|||||
| Total deferred tax assets |
53,538 | 38,045 | ||||||
|
|
|
|
|
|||||
| Deferred tax liabilities: |
||||||||
| Property and equipment |
21,546 | 18,082 | ||||||
| Solar energy systems |
36,425 | 24,378 | ||||||
| Other |
2,039 | 57 | ||||||
|
|
|
|
|
|||||
| Total deferred tax liabilities |
60,010 | 42,517 | ||||||
|
|
|
|
|
|||||
| Net deferred tax liabilities |
$ | 6,472 | $ | 4,472 | ||||
|
|
|
|
|
|||||
F-149
Table of Contents
Net operating loss carryforwards represent tax benefits measured assuming that TerraForm Power had been a stand alone operating company since January 1, 2012, and may not be available if TerraForm Power is no longer part of the Parent’s consolidated return. We believe that it is more likely than not that we will generate sufficient taxable income to realize the deferred tax assets associated with net operating losses and tax credit carryforwards, including taxable income resulting from future reversals of existing taxable temporary differences.
10. RELATED PARTIES
Corporate Allocations
Amounts were allocated from our Parent for general corporate overhead costs attributable to the operations of the Predecessor. These amounts were $5,158 and $4,425 for the years ended December 31, 2013 and 2012, respectively. The general corporate overhead expenses incurred by the Parent include costs from certain corporate and shared services functions provided by the Parent. The amounts reflected include (i) charges that were incurred by the Parent that were specifically identified as being attributable to the Predecessor and (ii) an allocation of applicable remaining general corporate overhead costs based on the proportional level of effort attributable to the operation of TerraForm Power’s solar energy systems. These costs include legal, accounting, tax, treasury, information technology, insurance, employee benefit costs, communications, human resources, and procurement. Corporate costs that were specifically identifiable to a particular operation of the Parent have been allocated to that operation, including the Predecessor. Where specific identification of charges to a particular operation of the Parent was not practicable, an allocation was applied to all remaining general corporate overhead costs. The allocation methodology for all remaining corporate overhead costs is based on management’s estimate of the proportional level of effort devoted by corporate resources that is attributable to each of TerraForm Power’s operations. The cost allocations have been determined on a basis considered to be a reasonable reflection of all costs of doing business by the Predecessor. The amounts that would have been or will be incurred on a stand-alone basis could differ from the amounts allocated due to economies of scale, management judgment, or other factors.
Incentive Revenue
Certain SRECs are sold to our parent under contractual arrangements at fixed prices. Revenue from the sale of SRECs to affiliates was $933 and $1,571 during the years ended December 31, 2013 and 2012, respectively.
Operations and Maintenance
Operations and maintenance services are provided to TerraForm Power by affiliates of the Parent pursuant to contractual agreements. Costs incurred for these services were $911 and $680 for the years ended December 31, 2013 and 2012, respectively, and were reported as cost of operations in the combined consolidated statements of operations.
Parent and Affiliates
Certain of our expenses are paid by affiliates of the Parent and are reimbursed by the Company to the same, or other affiliates of the Parent. As of December 31, 2013 and 2012, the Company owed its Parent and affiliates $82,051 and $5,988, respectively.
11. COMMITMENTS AND CONTINGENCIES
From time to time, we are notified of possible claims or assessments arising in the normal course of business operations. Management continually evaluates such matters with legal counsel and believes that, although the ultimate outcome is not presently determinable, these matters will not result in a material adverse impact on our financial position or operations.
F-150
Table of Contents
12. SEGMENT INFORMATION
The Company is engaged in one reportable segment that operates a portfolio of solar energy generation assets. The Company operates as a single reportable segment based on “management” approach. This approach designates the internal reporting used by management for making decisions and assessing performance as the source of the reportable segments.
All operating revenue for the years ended December 31, 2013 and 2012 were from customers located in the United States and Puerto Rico. Customers include commercial and industrial entities, which principally include large, national retail chains located in the U.S. and Puerto Rico, and utility companies. Operating revenue to non-affiliate specific customers exceeding 10% of total operating revenue for the years ended December 31, 2013 and 2012 were as follows:
| For the Year Ended December 31, | ||||||||||||||||
| 2013 | 2012 | |||||||||||||||
| In thousands, except for percentages | Operating |
Percent | Operating |
Percent | ||||||||||||
| Customer A |
$ | 4,196 | 24.0 | % | $ | 4,207 | 26.8 | % | ||||||||
| Customer B |
$ | 1,761 | 10.1 | % | $ | 1,831 | 11.7 | % | ||||||||
| Customer C |
$ | 1,726 | 10.0 | % | $ | 1,760 | 11.2 | % | ||||||||
Long-lived Assets, Net
| As of December 31, | ||||||||
| In thousands | 2013 | 2012 | ||||||
| United States and Puerto Rico |
$ | 250,927 | $ | 133,185 | ||||
| Chile |
167,313 | 134 | ||||||
| United Kingdom |
10,804 | — | ||||||
| Canada |
912 | 978 | ||||||
|
|
|
|
|
|||||
| Total |
$ | 429,956 | $ | 134,297 | ||||
|
|
|
|
|
|||||
All long-lived assets located in Chile, the United kingdom, and Canada are assets currently under construction.
13. SUBSEQUENT EVENTS
For the combined consolidated financial statements as of and for the years ended December 31, 2013 and 2012, we have evaluated subsequent events through May 27, 2014, the date the combined consolidated financial statements were available to be issued.
Bridge Credit Facility
On March 28, 2014, TerraForm Power, LLC entered into a credit and guaranty agreement with Goldman Sachs Bank USA as administrative agent, (the “Bridge Credit Facility”). The Bridge Credit Facility originally provided for a senior secured term loan facility in an aggregate principal amount of $250,000. On May 15, 2014, the Bridge Credit Facility was amended to increase the aggregate principal amount to $400,000. The Bridge Credit Facility has a term ending in September 2015. The purpose of the Bridge Credit Facility is to fund the acquisition of projects from third party developers as well as projects developed by the Parent.
Our obligations under the Bridge Credit Facility were guaranteed by certain of our domestic subsidiaries. Our obligations and the guaranty obligations of our subsidiaries were secured by first priority liens on and security interests in substantially all present and future assets of the Company and the subsidiary guarantors.
F-151
Table of Contents
Interest under the Bridge Credit Facility has variable interest rate options based on Base Rate Loans or Eurodollar loans at the Company’s election. The interest rate payable under Base Rate Loans will be based upon an adjusted base rate (equal to the greater of (i) the Base Rate (Prime Rate) in effect on such day, (ii) the Federal Funds Effective Rate in effect on such day plus 0.50% and (iii) the Eurodollar Rate for a Eurodollar Loan with a one month interest period plus the difference between the applicable margin for Eurodollar Rate Loans and the applicable margin for Base Rate Loans. The interest rate payable under Eurodollar Loans will be based upon the published LIBOR rate; plus 6.0% applicable margin.
F-152
Table of Contents
To the Members of
MMA NAFB Power, LLC and Subsidiary
Report on the Financial Statements
We have audited the accompanying consolidated financial statements of MMA NAFB Power, LLC and Subsidiary (the “Fund”), which comprise the consolidated balance sheets as of December 31, 2013 and 2012, and the related consolidated statements of operations, changes in members’ equity and cash flows for the years then ended, and the related notes to the consolidated financial statements.
Management’s Responsibility for the Financial Statements
Management is responsible for the preparation and fair presentation of these consolidated financial statements in accordance with accounting principles generally accepted in the United States of America; this includes the design, implementation, and maintenance of internal control relevant to the preparation and fair presentation of consolidated financial statements that are free from material misstatement, whether due to fraud or error.
Auditor’s Responsibility
Our responsibility is to express an opinion on these consolidated financial statements based on our audits. We conducted our audits in accordance with auditing standards generally accepted in the United States of America. Those standards require that we plan and perform the audit to obtain reasonable assurance about whether the consolidated financial statements are free from material misstatement.
An audit involves performing procedures to obtain audit evidence about the amounts and disclosures in the consolidated financial statements. The procedures selected depend on the auditor’s judgment, including the assessment of the risks of material misstatement of the consolidated financial statements, whether due to fraud or error. In making those risk assessments, the auditor considers internal control relevant to the entity’s preparation and fair presentation of the consolidated financial statements in order to design audit procedures that are appropriate in the circumstances, but not for the purpose of expressing an opinion on the effectiveness of the entity’s internal control. Accordingly, we express no such opinion. An audit also includes evaluating the appropriateness of accounting policies used and the reasonableness of significant accounting estimates made by management, as well as evaluating the overall presentation of the consolidated financial statements.
We believe that the audit evidence we have obtained is sufficient and appropriate to provide a basis for our audit opinion.
Opinion
In our opinion, the consolidated financial statements referred to above present fairly, in all material respects, the consolidated financial position of the Fund as of December 31, 2013 and 2012, and the results of its operations and its cash flows for the years then ended in accordance with accounting principles generally accepted in the United States of America.
/s/ CohnReznick LLP
Vienna, Virginia
March 31, 2014
F-153
Table of Contents
MMA NAFB Power, LLC and Subsidiary
Consolidated Balance Sheets
December 31, 2013 and 2012
| 2013 | 2012 | |||||||
| Assets |
||||||||
| CURRENT ASSETS |
||||||||
| Restricted cash (Note 2) |
$ | 1,948,840 | $ | 1,953,869 | ||||
| Accounts receivable (Note 4) |
520,316 | 421,440 | ||||||
| Prepaid asset management fees and expenses |
20,082 | 100,985 | ||||||
|
|
|
|
|
|||||
| Total current assets |
2,489,238 | 2,476,294 | ||||||
| RESTRICTED CASH (Note 2) |
3,219,201 | 3,436,569 | ||||||
| PROPERTY AND EQUIPMENT—NET (Note 5) |
98,613,326 | 102,731,053 | ||||||
| DEFERRED FINANCING COSTS—NET (Note 2) |
769,291 | 824,586 | ||||||
|
|
|
|
|
|||||
| TOTAL |
$ | 105,091,056 | $ | 109,468,502 | ||||
|
|
|
|
|
|||||
| Liabilities and Member’s Equity |
||||||||
| CURRENT LIABILITIES |
||||||||
| Account payable and accrued liabilities |
$ | 1,910 | $ | 81,687 | ||||
| Interest payable |
740,239 | 771,761 | ||||||
| Due to affiliates (Note 3) |
644,649 | 400,606 | ||||||
| Current portion of long-term debt (Note 7) |
2,011,347 | 1,884,677 | ||||||
| Other liabilities (Note 6) |
— | 443,617 | ||||||
|
|
|
|
|
|||||
| Total current liabilities |
3,398,145 | 3,582,348 | ||||||
| ASSET RETIREMENT OBLIGATION (Note 8) |
1,901,591 | 1,778,867 | ||||||
| LONG-TERM DEBT (Note 7) |
42,248,078 | 44,259,425 | ||||||
|
|
|
|
|
|||||
| Total liabilities |
47,547,814 | 49,620,640 | ||||||
| Commitments and contingencies |
— | — | ||||||
| MEMBERS’ EQUITY |
57,543,242 | 59,847,862 | ||||||
|
|
|
|
|
|||||
| TOTAL |
$ | 105,091,056 | $ | 109,468,502 | ||||
|
|
|
|
|
|||||
See Notes to Consolidated Financial Statements.
F-154
Table of Contents
MMA NAFB Power, LLC and Subsidiary
Consolidated Statements of Operations
Years Ended December 31, 2013 and 2012
| 2013 | 2012 | |||||||
| Revenue |
||||||||
| Renewable energy credits (Note 2) |
$ | 6,920,484 | $ | 6,872,074 | ||||
| Solar electricity sales (Note 2) |
697,775 | 711,310 | ||||||
|
|
|
|
|
|||||
| Total revenues |
7,618,259 | 7,583,384 | ||||||
|
|
|
|
|
|||||
| Operating expenses |
||||||||
| Taxes, licenses and fees |
88,830 | 93,535 | ||||||
| Insurance expenses |
81,687 | 100,276 | ||||||
| Professional fees |
46,953 | 51,580 | ||||||
| Asset management fees (Note 3) |
80,328 | 77,192 | ||||||
| Bank fees |
15,825 | 15,535 | ||||||
| Over-performance guarantee (Note 6) |
198,694 | 137,956 | ||||||
| Depreciation (Note 5) |
4,117,727 | 4,128,893 | ||||||
| Accretion expense (Note 8) |
122,724 | 114,803 | ||||||
| Repairs and maintenance |
236,291 | 121,253 | ||||||
|
|
|
|
|
|||||
| Total operating expenses |
4,989,059 | 4,841,023 | ||||||
|
|
|
|
|
|||||
| Income from operations |
2,629,200 | 2,742,361 | ||||||
|
|
|
|
|
|||||
| Other (income) expenses |
||||||||
| Interest income |
(1,224 | ) | (409 | ) | ||||
| Interest expense |
3,025,014 | 3,155,106 | ||||||
| Amortization of deferred financing costs (Note 2) |
55,295 | 55,447 | ||||||
|
|
|
|
|
|||||
| Total other (income) expenses |
3,079,085 | 3,210,144 | ||||||
|
|
|
|
|
|||||
| Net loss |
$ | (449,885 | ) | $ | (467,783 | ) | ||
|
|
|
|
|
|||||
See Notes to Consolidated Financial Statements.
F-155
Table of Contents
MMA NAFB Power, LLC and Subsidiary
Consolidated Statements of Changes in Members’ Equity
Years Ended December 31, 2013 and 2012
| Managing Member |
Investor Members |
Total | ||||||||||
| Members’ equity—December 31, 2011 |
$ | 8,706,728 | $ | 53,530,998 | $ | 62,237,726 | ||||||
| Distribution to members |
(361,728 | ) | (1,560,353 | ) | (1,922,081 | ) | ||||||
| Net loss |
(47 | ) | (467,736 | ) | (467,783 | ) | ||||||
|
|
|
|
|
|
|
|||||||
| Members’ equity—December 31, 2012 |
8,344,953 | 51,502,909 | 59,847,862 | |||||||||
| Distribution to members |
(233,856 | ) | (1,620,879 | ) | (1,854,735 | ) | ||||||
| Net loss |
(45 | ) | (449,840 | ) | (449,885 | ) | ||||||
|
|
|
|
|
|
|
|||||||
| Members’ equity—December 31, 2013 |
$ | 8,111,052 | $ | 49,432,190 | $ | 57,543,242 | ||||||
|
|
|
|
|
|
|
|||||||
See Notes to Consolidated Financial Statements.
F-156
Table of Contents
MMA NAFB Power, LLC and Subsidiary
Consolidated Statements of Cash Flows
Years Ended December 31, 2013 and 2012
| 2013 | 2012 | |||||||
| Operating activities |
||||||||
| Net loss |
$ | (449,885 | ) | $ | (467,783 | ) | ||
| Adjustments to reconcile net loss to net cash provided by operating activities |
||||||||
| Depreciation and amortization |
4,173,022 | 4,184,340 | ||||||
| Accretion expense |
122,724 | 114,803 | ||||||
| Changes in operating assets and liabilities |
||||||||
| (Increase) decrease in accounts receivables |
(98,876 | ) | 92,730 | |||||
| Decrease (increase) in prepaid asset management fees and expenses |
80,903 | (82,249 | ) | |||||
| (Decrease) increase in accounts payable and accrued liabilities |
(79,777 | ) | 74,887 | |||||
| Decrease in interest payable |
(31,522 | ) | (34,171 | ) | ||||
| (Decrease) increase in other liabilities |
(443,617 | ) | 137,956 | |||||
|
|
|
|
|
|||||
| Net cash provided by operating activities |
3,272,972 | 4,020,513 | ||||||
|
|
|
|
|
|||||
| Investing activities |
||||||||
| Decrease in restricted cash |
222,397 | 354,049 | ||||||
|
|
|
|
|
|||||
| Net cash provided by investing activities |
222,397 | 354,049 | ||||||
|
|
|
|
|
|||||
| Financing activities |
||||||||
| Distribution to Members |
(1,610,692 | ) | (2,331,422 | ) | ||||
| Repayments of long-term debt |
(1,884,677 | ) | (2,043,140 | ) | ||||
|
|
|
|
|
|||||
| Net cash used in financing activities |
(3,495,369 | ) | (4,374,562 | ) | ||||
|
|
|
|
|
|||||
| Change in cash and cash equivalents |
— | — | ||||||
| Cash and cash equivalents—beginning of year |
— | — | ||||||
|
|
|
|
|
|||||
| Cash and cash equivalents—end of year |
$ | — | $ | — | ||||
|
|
|
|
|
|||||
| Supplementary disclosure of cash flow activities |
||||||||
| Cash paid during the year for interest |
$ | 3,056,536 | $ | 3,189,277 | ||||
|
|
|
|
|
|||||
| Distributions due to Members |
$ | 644,649 | $ | 400,606 | ||||
|
|
|
|
|
|||||
See Notes to Consolidated Financial Statements.
F-157
Table of Contents
MMA NAFB Power, LLC and Subsidiary
Notes to Consolidated Financial Statements
December 31, 2013 and 2012
Note 1—Organization
MMA NAFB Power, LLC (the “Fund”), a Delaware limited liability company, was formed on February 20, 2007. The purpose of the Fund is to invest in a single Project Company, Solar Star NAFB, LLC (“Solar Star”) that built, owns and operates a 14-megawatt solar electric facility (“SEF”) located on the property of Nellis Air Force Base (“Nellis”), Nevada, which was placed in service during 2007.
The Fund consists of 50 Class A Investor Member interests and 50 Class B Managing Member interests (collectively, the “Members”) as defined within the Amended and Restated Limited Liability Company Operating Agreement (the “LLC Agreement”). Citicorp North America, Inc., Allstate Life Insurance Company and Allstate Insurance Company (collectively the “Investor Members”) purchased the Class A Investor Member Interests, with MMA Solar Fund IV GP, Inc., a wholly-owned subsidiary of SunEdison, Inc., (the “Managing Member” or “SunEd”) owning the Class B Managing Member Interests.
Distributions of income, gains, and losses will be allocated 99.99% to the Investor Members and 0.01% to the Managing Member. Cash distributions will be allocated 95% to Investor Members and 5% to the Managing Member each quarter. In the event the distributable cash exceeds the projected amount in the final base cash forecast for each quarter, the excess distributable cash shall be allocated 70% to the Investor Members and 30% to the Managing Member. The Fund will continue in operation until the earlier of February 20, 2057, or at the dissolution and termination of the Fund in accordance with the provisions of the LLC Agreement.
Note 2—Summary of significant accounting policies
Basis of presentation
The accompanying consolidated financial statements include the accounts of the Fund and Solar Star. All inter-company accounts, transactions, profits and losses have been eliminated upon consolidation.
Reclassification
The Fund has reclassified depreciation expense and accretion expense from other (income) expenses to operating expenses to comply with the rules and regulations of the Securities and Exchange Commission.
Use of estimates
The preparation of consolidated financial statements in conformity with accounting principles generally accounted in the United States of America requires management to make estimates and assumptions that affect the reported amounts of assets and liabilities, and disclosure of contingent assets and liabilities at the balance sheet date, and reported amounts of revenues and expenses for the period presented. Actual results could differ from these estimates. The Fund’s significant accounting judgments and estimates include the depreciable lives of property and equipment, the assumptions used in the impairment of long-lived assets, the assumptions used in the calculation of the contractor guarantees, and the amortization of deferred financing costs.
F-158
Table of Contents
Concentration of credit risk
The Fund maintains its restricted cash balances in bank deposit accounts, which at times, may exceed federally insured limits. The Fund has not experienced any losses in such accounts. The Fund believes it is not exposed to any significant credit risk on its restricted cash accounts.
Solar Star has only two customers: (i) Nellis for sales of electric output, and (ii) Nevada Power for sales of Renewable Energy Credits or Certificates (“REC”). The Fund believes it is not exposed to any significant credit risk on its accounts receivable from these two customers.
Restricted cash
Restricted cash consists of cash used as collateral for a letter of credit issued to Nevada Power and cash held on deposit in a financial institution that is restricted for use in the day-to-day operations of Solar Star, for payments of principal and interest on the long-term debt, and distributions to the Fund’s members. Distributions to the Fund’s members are based upon the excess amount of cash available after the payments described above less cash restricted for the Fund’s debt reserve. Restricted cash includes amounts from the sale of solar power and renewable energy credits. A portion of restricted cash classified as long-term represents the minimum debt reserve required to be held by Solar Star as defined within the Security Deposit Agreement.
The short-term restricted cash balance at December 31, 2013 and 2012 is $1,948,840 and $1,953,869, respectively. The long-term restricted cash balance at December 31, 2013 and 2012 is $3,219,201 and $3,436,569, respectively.
Accounts receivable
Accounts receivable represents amounts due from customers under revenue agreements. The Fund evaluates the collectability of its accounts receivable taking into consideration such factors as the aging of a customer’s account, credit worthiness and historical trends. As of December 31, 2013 and 2012, the Fund considers accounts receivable to be fully collectible.
Property and equipment
Property and equipment includes the amounts related to the construction of the SEF and are stated at cost, less accumulated depreciation. Depreciation is calculated using the straight-line method over the estimated useful lives of the related assets, which was determined by the Fund to be 30 years.
Impairment of long-lived assets
The Fund regularly monitors the carrying value of property and equipment and tests for impairment whenever events and circumstances indicate that the carrying value of an asset may not be recoverable from the estimated future cash flows expected to result from its use and eventual disposition. In cases where the undiscounted expected future cash flow is less than the carrying value, an impairment loss is recognized equal to an amount by which the carrying value exceeds the fair value of assets. The Fund determines fair value generally by using a discounted cash flow model. The factors considered by the Fund in performing this assessment include current operating results, trends and prospects, the manner in which the property is used, and the effects of obsolescence, demand, competition, and other economic factors. Based on this assessment, no impairment existed at December 31, 2013 and 2012.
F-159
Table of Contents
Deferred financing costs
Financing fees are amortized over the term of the loan using the straight-line method. Accounting principles generally accepted in the United States of America require that the effective yield method be used to amortize financing costs; however, the effect of using the straight-line method is not materially different from the results that would have been obtained under the effective yield method. Amortization expense for the years ended December 31, 2013 and 2012 was $55,295 and $55,447, respectively. Estimated amortization expense for each of the ensuing years through September 30, 2027 is $56,872.
Revenue recognition
Solar electricity sales
Solar Star has entered into a power purchase agreement (“PPA”) whereby the entire electric output of the SEF is sold to Nellis for a period of 20 years. Solar Star recognizes revenue from the sale of electricity in the period that the electricity is generated and delivered to Nellis.
Renewable energy credits
Various state governmental jurisdictions have incentives and subsidies in the form of Environmental Attributes or Renewable Energy Credits (“RECs”) whereby, each megawatt hour of energy produced by a renewable energy source, such as solar photovoltaic modules, equals one REC.
Similar to the PPA, Solar Star has entered into an agreement to sell all RECs generated by this facility for a period of 20 years to Nevada Power. Solar Star has determined that the REC agreement is a performance-based contract and the revenue will be recorded as the RECs are sold to Nevada Power.
Asset retirement obligation
The Fund’s asset retirement obligation relates to leased land upon which the Solar Energy Facility was constructed. The lease requires that, upon lease termination, the leased land be restored to an agreed-upon condition, effectively retiring the energy property. The Fund is required to record the present value of the estimated obligation when the Solar Energy Facility is placed in service. Upon initial recognition of the Fund’s asset retirement obligation, the carrying amount of the Solar Energy Facility was also increased. The asset retirement obligation will be accreted to its future value over a period of 20 years, while the amount capitalized at COD will be depreciated over its estimated useful life of 30 years. For the years ended December 31, 2013 and 2012, accretion expense was $122,724 and $114,803, respectively.
Income taxes
The Fund is not a taxable entity for U.S. federal income tax purposes or for the State of Nevada where it operates. Taxes on the Fund’s operations are borne by its members through the allocation of taxable income or losses. Income tax returns filed by the Company are subject to examination by the Internal Revenue Service for a period of three years. While no income tax returns are currently being examined by the Internal Revenue Service, tax years since 2010 remain open.
F-160
Table of Contents
Fair value of financial instruments
The Fund maintains various financial instruments recorded at cost in the December 31, 2013 and 2012 consolidated balance sheets that are not required to be recorded at fair value. For these instruments, the Fund used the following methods and assumptions to estimate the fair value:
| • | Restricted cash, accounts receivable, due from affiliates, prepaid expenses, current portion of long-term debt, due to affiliates, current portion of deferred income and accrued liabilities cost approximates fair value because of the short-maturity period; and |
| • | Long-term debt fair value is based on the amount of future cash flows associated with each debt instrument discounted at current borrowing rate for similar debt instruments of comparable terms. As of December 31, 2013 and 2012, the fair value of the Fund’s long-term debt with unrelated parties is approximately 8% and 2% greater than its carrying value, respectively. |
Subsequent events
The Company evaluated subsequent events through March 31, 2014, the date these consolidated financial statements were available to be issued. Other than disclosed in note 11, the Company determined that there were no subsequent events that required recognition or disclosure in these consolidated financial statements.
Note 3—Related-party transactions
Guarantees/indemnifications
The REC agreement required that the Fund maintain a letter of credit or a cash deposit of $1,500,000 which could be drawn on by Nevada Power if Solar Star does not produce the minimum amount of RECs per the agreement. The required amount is reduced by $150,000 on each anniversary of the REC agreement over the 10-year life of the letter of credit. The outstanding balance on the letter of credit was $600,000 and $750,000 as of December 31, 2013 and 2012, respectively. Cash collateral for securing the letter of credit provided by the Fund as of December 31, 2013 and 2012 was $600,000 and $750,000, respectively, and is included in restricted cash in the accompanying consolidated balance sheets.
Asset management fees
The Managing Member manages the day-to-day operations of the Fund for an annual asset management fee. The asset management fee is adjusted annually for changes to the Consumer Price Index. The Fund incurred $80,328 and $77,192 in asset management fees during 2013 and 2012, respectively. As of December 31, 2013 and 2012, $20,082 and $19,298, was prepaid to the Managing Member, respectively.
Due to members
As of December 31, 2013 and 2012, amounts due to the Fund’s members were as follows:
| 2013 | 2012 | |||||||
| Due to Managing Member |
$ | 130,064 | $ | 55,973 | ||||
| Due to Investor Members |
514,585 | 344,633 | ||||||
|
|
|
|
|
|||||
| Total |
$ | 644,649 | $ | 400,606 | ||||
|
|
|
|
|
|||||
Amounts due to affiliates include distributions of $644,649 and $400,606 related to the fourth quarter of 2013 and 2012 that were paid during the first quarter of 2014 and 2013, respectively.
F-161
Table of Contents
Note 4—Accounts receivable
As of December 31, 2013 and 2012, accounts receivable consisted of the following:
| 2013 | 2012 | |||||||
| Renewable energy credits |
$ | 432,902 | $ | 341,622 | ||||
| Solar electricity |
87,414 | 79,818 | ||||||
|
|
|
|
|
|||||
| Total |
$ | 520,316 | $ | 421,440 | ||||
|
|
|
|
|
|||||
Note 5—Property and equipment—net
As of December 31, 2013 and 2012, property and equipment at cost, less accumulated depreciation consisted of the following:
| 2013 | 2012 | |||||||
| Solar energy facility |
$ | 123,895,312 | $ | 123,895,312 | ||||
| Accumulated depreciation |
(25,281,986 | ) | (21,164,259 | ) | ||||
|
|
|
|
|
|||||
| Total net book value |
$ | 98,613,326 | $ | 102,731,053 | ||||
|
|
|
|
|
|||||
Note 6—Performance guarantee liability
The Fund entered into a five-year performance guaranty agreement with the contractor who constructed the SEF. The agreement commenced on January 1, 2008, and was intended to guarantee the performance of the SEF based on specified performance standards. If the aggregate amount of actual kilowatt-hours (“kWh”) generated was less than the aggregate expected amount, then the contractor shall pay the Fund an amount as defined within the agreement. If the aggregate of the actual kWh generated was at least 5% greater than the aggregate of the expected amount, then the Fund shall pay the contractor an amount equal to 50% of the over-performance based on a guaranteed energy price, as defined within the performance guaranty agreement. As of December 31, 2012, the Fund recorded a liability of $443,462 which is included in other liabilities in the accompanying consolidated balance sheet at December 31, 2012. During the year ended December 31, 2013, the Fund entered into a Settlement Agreement and Mutual General Release with the contractor, whereby the Fund paid a total of $642,311 to the contractor, which included a $150,000 consideration to discharge all claims relating to payment or calculation of the over-performance amount.
Note 7—Debt
As of December 31, 2013 and 2012, long-term debt consisted of the following:
| 2013 | 2012 | |||||||
| Term loans paying interest at 6.69%, due in 2027, secured by solar energy facility |
$ | 44,259,425 | $ | 46,144,102 | ||||
| Less current portion of long-term loan |
(2,011,347 | ) | (1,884,677 | ) | ||||
|
|
|
|
|
|||||
| Total long-term debt |
$ | 42,248,078 | $ | 44,259,425 | ||||
|
|
|
|
|
|||||
F-162
Table of Contents
The Fund’s future debt maturities as of December 31, 2013, are as follows:
| Years ending December 31, 2014 |
$ | 2,011,347 | ||
| 2015 |
2,146,443 | |||
| 2016 |
2,290,535 | |||
| 2017 |
2,444,231 | |||
| 2018 |
2,724,196 | |||
| Thereafter |
32,642,673 | |||
|
|
|
|||
| $ | 44,259,425 | |||
|
|
|
Note 8—Asset retirement obligation
The Fund’s asset retirement obligation relates to leased land upon which the Solar Energy Facility was built.
The following table reflects the changes in the asset retirement obligation for the years ended December 31, 2013 and 2012:
| 2013 | 2012 | |||||||
| Beginning balance |
$ | 1,778,867 | $ | 1,664,064 | ||||
| Liabilities incurred |
— | — | ||||||
| Liabilities settled during the year |
— | — | ||||||
| Accretion expense |
122,724 | 114,803 | ||||||
|
|
|
|
|
|||||
| Ending balance |
$ | 1,901,591 | $ | 1,778,867 | ||||
|
|
|
|
|
|||||
Note 9—Commitments
Lease agreements
The Fund leases the ground space at Nellis for 20 years under a long-term non-cancelable operating lease agreement. The lease expires on January 1, 2028, and does not provide for any renewal option. The total rent for the entire lease term is $10.
Renewable energy credit agreement
Solar Star entered into an agreement with Nevada Power Company to sell RECs generated from the facility for 20 years at a rate of $83.10 per 1,000 delivered RECs for the first year, and increasing by 1% annually.
The agreement requires Solar Star to deliver a minimum amount of RECs each contract year. If this requirement is not met and an arrangement for replacement of the RECs is not entered into, Solar Star is required to pay for the replacement costs of the RECs not delivered. For the years ended December 31, 2013 and 2012, the facility met the minimum delivery requirements.
Note 10—Contingencies
From time to time, the Fund is notified of possible claims or assessments arising in the normal course of business operations. Management continually evaluates such matters with legal counsel and believes that, although the ultimate outcome is not presently determinable, these matters will not result in a material adverse impact on the Fund’s consolidated financial position or operations.
Note 11—Subsequent events
On March 28, 2014, all of the Class A Investor Member Interests of MMA NAFB Power, LLC were acquired by MMA Solar Fund IV GP, Inc for a purchase price of $14,211,392.
F-163
Table of Contents
Report of Independent Auditors
To the Member
CalRENEW-1 LLC
Report on Financial Statements
We have audited the accompanying financial statements of CalRENEW-1 LLC (the “Company”), which comprise the balance sheet as of December 31, 2013, and the related statements of income, changes in member’s deficit, and cash flows for the year then ended, and the related notes to the financial statements.
Management’s Responsibility for the Financial Statements
Management is responsible for the preparation and fair presentation of these financial statements in accordance with accounting principles generally accepted in the United States of America; this includes the design, implementation, and maintenance of internal control relevant to the preparation and fair presentation of financial statements that are free from material misstatement, whether due to fraud or error.
Auditor’s Responsibility
Our responsibility is to express an opinion on these financial statements based on our audit. We conducted our audit in accordance with auditing standards generally accepted in the United States of America. Those standards require that we plan and perform the audits to obtain reasonable assurance about whether the financial statements are free from material misstatement.
An audit involves performing procedures to obtain audit evidence about the amounts and disclosures in the financial statements. The procedures selected depend on the auditor’s judgment, including the assessment of the risks of material misstatement of the financial statements, whether due to fraud or error. In making those risk assessments, the auditor considers internal control relevant to the entity’s preparation and fair presentation of the financial statements in order to design audit procedures that are appropriate in the circumstances, but not for the purpose of expressing an opinion on the effectiveness of the entity’s internal control. Accordingly, we express no such opinion. An audit also includes evaluating the appropriateness of accounting policies used and the reasonableness of significant accounting estimates made by management, as well as evaluating the overall presentation of the financial statements.
We believe that the audit evidence obtained is sufficient and appropriate to provide a basis for our audit opinion.
Opinion
In our opinion, the financial statements referred to above present fairly, in all material respects, the financial position of CalRENEW-1 LLC as of December 31, 2013, and the results of its operations and its cash flows for the year then ended in accordance with accounting principles generally accepted in the United States of America.
/s/ Moss Adams LLP
Portland, Oregon
May 7, 2014
F-164
Table of Contents
Balance Sheet
As of December 31, 2013
| ASSETS | ||||
| CURRENT ASSETS |
||||
| Cash and cash equivalents |
$ | 1,157,231 | ||
| Accounts receivable |
140,860 | |||
| Prepaid and other current assets |
58,807 | |||
|
|
|
|||
| Total current assets |
1,356,898 | |||
|
|
|
|||
| PROPERTY AND EQUIPMENT, net |
16,636,832 | |||
|
|
|
|||
| OTHER ASSETS |
||||
| Intercompany receivable |
1,000 | |||
| Other |
327,234 | |||
|
|
|
|||
| Total other assets |
328,234 | |||
|
|
|
|||
| Total assets |
$ | 18,321,964 | ||
|
|
|
|||
| CURRENT LIABILITIES |
||||
| Accounts payable |
$ | 24,192 | ||
| Accrued liabilities |
3,772 | |||
| Note payable |
8,000 | |||
| Note payable to related party |
10,638,391 | |||
| Accrued interest on note payable to related party |
8,652,982 | |||
|
|
|
|||
| Total current liabilities |
19,327,337 | |||
|
|
|
|||
| OTHER LIABILITIES |
||||
| Asset retirement obligation |
216,595 | |||
|
|
|
|||
| Total other liabilities |
216,595 | |||
|
|
|
|||
| Total liabilities |
$ | 19,543,932 | ||
|
|
|
|||
| COMMITMENTS AND CONTINGENCIES |
||||
| EQUITY |
||||
| Member’s equity |
1,681,010 | |||
| Retained deficit |
(2,902,978 | ) | ||
|
|
|
|||
| Total deficit |
(1,221,968 | ) | ||
|
|
|
|||
| Total liabilities and deficit |
$ | 18,321,964 | ||
|
|
|
See accompanying notes.
F-165
Table of Contents
Statement of Income
For the Year Ended December 31, 2013
| POWER SALES |
$ | 2,628,118 | ||
| OPERATING EXPENSES |
||||
| Project operating expenses |
371,546 | |||
| Depreciation |
531,373 | |||
| Accretion |
6,964 | |||
|
|
|
|||
| Total operating expenses |
909,883 | |||
|
|
|
|||
| OPERATING INCOME |
1,718,235 | |||
|
|
|
|||
| NON-OPERATING INCOME (EXPENSES) |
||||
| Related party interest expense |
(1,448,509 | ) | ||
| Interest income |
2,503 | |||
| Interest expense |
(667 | ) | ||
|
|
|
|||
| Total non-operating expenses |
(1,446,673 | ) | ||
|
|
|
|||
| NET INCOME (LOSS) |
$ | 271,562 | ||
|
|
|
See accompanying notes.
F-166
Table of Contents
Statement of Changes in Member’s Deficit
| Member’s Equity |
Retained Deficit |
Total | ||||||||||
| Balances, January 1, 2013 |
1,681,010 | (3,174,540 | ) | (1,493,530 | ) | |||||||
| Net income |
— | 271,562 | 271,562 | |||||||||
|
|
|
|
|
|
|
|||||||
| Balances, December 31, 2013 |
$ | 1,681,010 | $ | (2,902,978 | ) | $ | (1,221,968 | ) | ||||
|
|
|
|
|
|
|
|||||||
See accompanying notes.
F-167
Table of Contents
Statement of Cash Flows
For the Year Ended December 31, 2013
| CASH FLOWS FROM OPERATING ACTIVITIES |
||||
| Net income |
$ | 271,562 | ||
| Adjustment to reconcile net income to net cash from operating activities: |
||||
| Interest expense on related party note payable |
1,448,509 | |||
| Depreciation |
531,373 | |||
| Accretion |
6,964 | |||
| Amortization |
6,768 | |||
| Changes in: |
||||
| Accounts receivable |
(89,144 | ) | ||
| Prepaid assets |
57,086 | |||
| Accounts payable |
23,758 | |||
| Accrued liabilities |
(9,086 | ) | ||
|
|
|
|||
| Net cash from operating activities |
2,247,790 | |||
|
|
|
|||
| CASH FLOWS FROM INVESTING ACTIVITIES |
||||
| Purchase of property and equipment |
(6,164 | ) | ||
| Payments on long-term receivables |
35,531 | |||
| Capitalized financing costs |
(88,261 | ) | ||
|
|
|
|||
| Net cash from investing activities |
(58,894 | ) | ||
|
|
|
|||
| CASH FLOWS FROM FINANCING ACTIVITIES |
||||
| Payments on related party note payable |
(2,100,000 | ) | ||
| Payments on notes payable |
(8,000 | ) | ||
|
|
|
|||
| Net cash from financing activities |
(2,108,000 | ) | ||
|
|
|
|||
| NET INCREASE (DECREASE) IN CASH AND CASH EQUIVALENTS |
80,896 | |||
| CASH AND CASH EQUIVALENTS, beginning of year |
1,076,335 | |||
|
|
|
|||
| CASH AND CASH EQUIVALENTS, end of year |
$ | 1,157,231 | ||
|
|
|
|||
| SUPPLEMENTAL DISCLOSURE OF CASH FLOW INFORMATION |
||||
| Cash paid during the year for interest |
$ | 667 | ||
|
|
|
See accompanying notes.
F-168
Table of Contents
Notes to Financial Statements
Note 1—Summary of Significant Accounting Policies
Nature of business—CalRENEW-1 LLC (the Company or CR-1) was established on April 7, 2007, as a limited liability company under the Delaware Limited Liability Company Act. The Company owns and operates a 5 megawatt (MW) photovoltaic (PV) solar facility located in Mendota, California. CR-1 sells the electricity to Pacific Gas & Electric Company (PG&E) under a 20-year power purchase and sales agreement, which terminates on April 30, 2030. CR-1 is wholly owned by Meridian Energy USA, Inc. (MEUSA). The CR-1 project construction started in 2009, and operations commenced April 2010.
MEUSA, a Delaware corporation, was incorporated on October 2, 2007 as Cleantech America, Inc. MEUSA and its subsidiaries were formed to develop utility-scale, environmentally clean solar farms and other renewable projects. MEUSA’s principal business is to provide renewable electricity for sale to utilities, municipalities and other customers within the western United States.
In August 2009, MEL Solar Holdings Limited (MSHL), a New Zealand limited liability company, purchased 100% of the stock of MEUSA. MSHL is a wholly-owned subsidiary of Meridian Energy Limited, a New Zealand limited liability company and a mixed ownership model company under the Public Finance Act of 1989. During 2010, MEUSA changed its name from Cleantech America, Inc. to Meridian Energy USA, Inc.
Basis of presentation—The accompanying financial statements are presented in accordance with accounting principles generally accepted in the United States of America (GAAP), as codified by the Financial Accounting Standards Board.
Use of estimates—The preparation of financial statements in conformity with accounting principles generally accepted in the United States of America requires the Company to make estimates and assumptions affecting the reported amounts of assets, liabilities, revenues and expenses, and the disclosure of contingent assets and liabilities. The amounts estimated could differ from actual results.
Cash and cash equivalents—For purposes of the statement of cash flows, the Company defines cash equivalents as all highly liquid instruments purchased with an original maturity of three months or less. From time to time, certain bank accounts that are subject to limited FDIC coverage exceed their insured limits.
Accounts receivable—Accounts receivable are uncollateralized customer obligations due under normal trade terms requiring payment within 30 days from the invoice date. Customer account balances with invoices dated over 30 days are considered delinquent.
Trade accounts receivable are stated at the amount management expects to collect from balances outstanding at year-end. Management establishes an allowance for doubtful customer accounts through a review of historical losses, specific customer balances, and industry economic conditions. Customer accounts are charged off against the allowance for doubtful accounts when management determines that the likelihood of eventual collection is remote. At December 31, 2013, management determined that no allowance for doubtful accounts was considered necessary.
Asset retirement obligations—Accounting standards require the recognition of an Asset Retirement Obligation (ARO), measured at estimated fair value, for legal obligations related to decommissioning and restoration costs associated with the retirement of tangible long-lived assets in the period in which the liability is incurred. The initial capitalized asset retirement costs are depreciated over the life of the related asset, with accretion of the ARO liability classified as an operating expense.
F-169
Table of Contents
Revenue recognition—The Company recognizes revenue from power sales to PG&E based on the megawatt hours (MWh) provided to PG&E each month at the contracted rates, pursuant to the Power Purchase and Sale Agreement (the Agreement) between PG&E and the CalRENEW-1 LLC.
Concentrations of credit risk—The Company grants credit to PG&E during the normal course of business. The Company performs ongoing credit evaluations of PG&E’s financial condition and generally requires no collateral.
Depreciation lives and methods—Depreciation has been determined by use of the straight-line method over the estimated useful lives of the related assets ranging from 9 to 35 years.
The Company generally capitalizes assets with costs of $1,000 or more as purchases or construction outlays occur.
Income taxes—The Company is taxed as a partnership; accordingly, federal and state taxes related to its income are the responsibility of the members. The Company applies applicable authoritative accounting guidance related to the accounting for uncertain tax positions. The impact of uncertain tax positions would be recorded in the Company’s financial statements only after determining a more-likely-than-not probability that the uncertain tax positions would withstand challenge, if any, from taxing authorities. As facts and circumstances change, the Company would reassess these probabilities and would record any changes in the financial statements as appropriate. Under this guidance, the Company adopted a policy to record accrued interest and penalties associated with uncertain tax positions in income tax expense in the statement of income as necessary. As of December 31, 2013, the Company recognized no accrued interest and penalties associated with uncertain tax positions.
Note 2—Property and Equipment
Property and equipment consists of the following at December 31, 2013:
| Land rights |
$ | 50,000 | ||
| Solar farm generation assets |
18,464,054 | |||
| Asset retirement obligation asset |
209,631 | |||
|
|
|
|||
| Total |
18,723,685 | |||
| Less: accumulated depreciation |
(2,086,853 | ) | ||
|
|
|
|||
| Property and equipment, net |
$ | 16,636,832 | ||
|
|
|
Depreciation expense for property and equipment was $531,373 for the year ended December 31, 2013.
Note 3—Other Assets
Other assets at December 31, 2013 consist of the following:
| Prepaid interconnection costs |
$ | 200,830 | ||
| Capitalized financing costs |
88,261 | |||
| Network upgrade receivable |
23,688 | |||
| Security deposit |
10,000 | |||
| Prepaid metering fees |
4,455 | |||
|
|
|
|||
| Total |
$ | 327,234 | ||
|
|
|
F-170
Table of Contents
Note 4—Notes Payable
Notes payable at December 31, 2013 are summarized as follows:
| Note payable to River Ranch LLC, annual installments of $8,000, interest at 5%, matures November 2014; secured by Deed of Trust |
$ | 8,000 | ||
|
|
|
|||
| Related party note payable to Meridian Energy USA, Inc., due on demand, interest at 12.8%, unsecured |
$ | 10,638,391 | ||
|
|
|
Accrued interest on the related party note payable of $8,652,982 has been recorded as a current liability on the balance sheet. This amount is due upon demand.
Note 5—Asset Retirement Obligations
For the year ending December 31, 2013, the Company completed an asset retirement obligation (ARO) calculation using a layered approach with the assumption that the assets will be in service through the year 2049. The useful life expectations used in the calculations of the ARO are based on the assumption that operations will continue without deviation from historical trends.
As of December 31, 2013, the ARO capitalized asset and the offsetting ARO liability were established at present value. The ARO asset will be depreciated through 2049 on a straight line basis and the ARO liability will be accredited through 2049 using a discount rate and effective interest method.
The asset retirement obligation at December 31, 2013 consists of the following:
| Liability at January 1 |
$ | 59,721 | ||
| Accretion expense |
3,584 | |||
| Liabilities incurred |
153,290 | |||
|
|
|
|||
| Liability at December 31 |
$ | 216,595 | ||
|
|
|
Note 6—Commitments, Contingencies and Concentrations
The Company may be involved from time to time in legal and arbitration proceedings arising in the ordinary course of business. Although the outcomes of legal proceedings are difficult to predict, none of these proceedings is expected to lead to material loss or expenditure in the context of the Company’s results.
The Company operates in the Western United States, particularly California. Should California decide to change the regulatory focus away from renewable energy, the impact could be substantial for the Company.
The Company sells 100% of the electrical output of the CR-1 solar facility to PG&E under a 20-year power purchase and sale agreement which terminates April 30, 2030. This contract is the sole source of the Company’s revenues until further solar projects are developed, constructed and brought into operations.
The Company is engaged in the operation of solar facilities to generate electricity for sale to utilities, municipalities and other customers. Development of such solar facilities is a capital intensive, multi-year effort which includes obtaining land or land rights, interconnection agreements, permits from local authorities, and long-term power sales contracts.
F-171
Table of Contents
Note 7—Subsequent Events
Subsequent events are events or transactions that occur after the date of the balance sheet but before financial statements are available to be issued. The Company recognizes in the financial statements the effects of all subsequent events that provide additional evidence about conditions that existed at the date of the balance sheet, including the estimates inherent in the process of preparing the financial statements. The Company’s financial statements do not recognize subsequent events that provide evidence about conditions that did not exist at the date of the balance sheet, but arose after such date and before the financial statements are available to be issued. The Company has evaluated subsequent events through May 7, 2014, which is the date the financial statements were available to be issued.
On March 6, 2014 the Company signed a letter of intent to sell all units to SunEdison with an anticipated closing during the second quarter of 2014.
On March 31, 2014 the Company converted the related party note payable and accrued interest into equity due to the pending sales transaction discussed above.
F-172
Table of Contents
Report of Independent Auditors
To the Member of SPS Atwell Island, LLC
Report on Financial Statements
We have audited the accompanying financial statements of SPS Atwell Island, LLC, which comprise the balance sheets as of December 31, 2013 and 2012, the related statements of operations, member’s equity, and cash flows for the years then ended, and the related notes to the financial statements.
Management’s Responsibility for the Financial Statements
Management is responsible for the preparation and fair presentation of these financial statements in accordance with accounting principles generally accepted in the United States of America; this includes the design, implementation, and maintenance of internal control relevant to the preparation and fair presentation of financial statements that are free from material misstatement, whether due to fraud or error.
Auditors’ Responsibility
Our responsibility is to express an opinion on these financial statements based on our audits. We conducted our audits in accordance with auditing standards generally accepted in the United States of America. Those standards require that we plan and perform the audits to obtain reasonable assurance about whether the financial statements are free from material misstatement.
An audit involves performing procedures to obtain audit evidence about the amounts and disclosures in the financial statements. The procedures selected depend on the auditor’s judgment, including the assessment of the risks of material misstatement of the financial statements, whether due to fraud or error. In making those risk assessments, the auditor considers internal control relevant to the entity’s preparation and fair presentation of the financial statements in order to design audit procedures that are appropriate in the circumstances, but not for the purpose of expressing an opinion on the effectiveness of the entity’s internal control. Accordingly, we express no such opinion. An audit also includes evaluating the appropriateness of accounting policies used and the reasonableness of significant accounting estimates made by management, as well as evaluating the overall presentation of the financial statements.
We believe that the audit evidence obtained is sufficient and appropriate to provide a basis for our audit opinion.
Opinion
In our opinion, the financial statements referred to above present fairly, in all material respects, the financial position of SPS Atwell Island, LLC as of December 31, 2013 and 2012, and the results of its operations and its cash flows for the years then ended in accordance with accounting principles generally accepted in the United States of America.
/s/ Moss Adams LLP
San Diego, California
May 14, 2014
F-173
Table of Contents
Balance Sheets
December 31, 2013 and 2012
(in thousands)
| December 31, | ||||||||
| 2013 | 2012 | |||||||
| ASSETS |
| |||||||
| Current Assets: |
||||||||
| Restricted cash |
$ | 1,540 | $ | 104 | ||||
| Accounts receivable |
— | — | ||||||
| Prepaid expenses and other current assets |
84 | — | ||||||
|
|
|
|
|
|||||
| Total current assets |
1,624 | 104 | ||||||
| Property and Equipment, net |
88,356 | 84,146 | ||||||
| Solar Facility Rights, net |
— | 5,678 | ||||||
| Other Assets |
1,840 | 1,967 | ||||||
|
|
|
|
|
|||||
| Total assets |
$ | 91,820 | $ | 91,895 | ||||
|
|
|
|
|
|||||
| LIABILITIES AND MEMBER’S EQUITY |
| |||||||
| Current Liabilities: |
||||||||
| Accounts payable and accrued liabilities |
$ | 4,453 | $ | 1,972 | ||||
| Construction loan payable |
— | 66,060 | ||||||
| Financing obligation, current portion |
1,945 | — | ||||||
|
|
|
|
|
|||||
| Total current liabilities |
6,398 | 68,032 | ||||||
| Financing Obligation |
73,319 | — | ||||||
| Commitments and Contingencies (Note 7) |
||||||||
| Member’s Equity |
12,103 | 23,863 | ||||||
|
|
|
|
|
|||||
| Total liabilities and member’s equity |
$ | 91,820 | $ | 91,895 | ||||
|
|
|
|
|
|||||
See accompanying notes.
F-174
Table of Contents
Statements of Operations
Years Ended December 31, 2013 and 2012
(in thousands)
| Years Ended December 31, | ||||||||
| 2013 | 2012 | |||||||
| REVENUES |
||||||||
| Revenue from sale of electricity |
$ | 5,371 | $ | — | ||||
| OPERATING EXPENSES |
||||||||
| Cost of electricity sold |
2,345 | — | ||||||
| Other operating expenses |
1,123 | 792 | ||||||
|
|
|
|
|
|||||
| Total operating expenses |
3,468 | 792 | ||||||
|
|
|
|
|
|||||
| OPERATING INCOME (LOSS) |
1,903 | (792 | ) | |||||
|
|
|
|
|
|||||
| OTHER EXPENSE |
||||||||
| Interest expense |
(1,393 | ) | — | |||||
| Other expense |
(3 | ) | — | |||||
|
|
|
|
|
|||||
| Total other expense |
(1,396 | ) | — | |||||
|
|
|
|
|
|||||
| NET INCOME (LOSS) |
$ | 507 | $ | (792 | ) | |||
|
|
|
|
|
|||||
See accompanying notes.
F-175
Table of Contents
Statements of Member’s Equity
Years Ended December 31, 2013 and 2012
(in thousands)
| Total Member’s Equity |
||||
| MEMBER’S EQUITY, JANUARY 1, 2012 |
$ | 31,282 | ||
| Member distributions |
(6,627 | ) | ||
| Net loss |
(792 | ) | ||
|
|
|
|||
| MEMBER’S EQUITY, DECEMBER 31, 2012 |
23,863 | |||
| Member distributions |
(12,267 | ) | ||
| Net income |
507 | |||
|
|
|
|||
| MEMBER’S EQUITY, DECEMBER 31, 2013 |
$ | 12,103 | ||
|
|
|
|||
See accompanying notes.
F-176
Table of Contents
Statements of Cash Flows
Years Ended December 31, 2013 and 2012
(in thousands)
| Years Ended December 31, | ||||||||
| 2013 | 2012 | |||||||
| CASH FLOWS FROM OPERATING ACTIVITIES |
||||||||
| Net income (loss) |
$ | 507 | $ | (792 | ) | |||
| Adjustments: |
||||||||
| Non-cash interest expense |
163 | — | ||||||
| Depreciation |
2,266 | — | ||||||
| Changes in assets and liabilities from operations: |
||||||||
| Accounts receivable |
— | — | ||||||
| Prepaid expenses |
(84 | ) | — | |||||
| Other assets |
127 | (1,667 | ) | |||||
| Accounts payable and accrued liabilities |
(1,922 | ) | 880 | |||||
|
|
|
|
|
|||||
| Net cash flow provided by (used in) operating activities |
1,057 | (1,579 | ) | |||||
|
|
|
|
|
|||||
| CASH FLOWS FROM INVESTING ACTIVITIES |
||||||||
| Purchase of property and equipment |
(798 | ) | (59,900 | ) | ||||
|
|
|
|
|
|||||
| Net cash flow (used in) investing activities |
(798 | ) | (59,900 | ) | ||||
|
|
|
|
|
|||||
| CASH FLOWS FROM FINANCING ACTIVITIES |
||||||||
| Proceeds from construction loan |
1,654 | 66,060 | ||||||
| Repayment of construction loan |
(67,714 | ) | — | |||||
| Proceeds from sale-leaseback transaction |
90,055 | — | ||||||
| Payments on financing obligation |
(10,551 | ) | — | |||||
| Member distributions |
(12,267 | ) | (6,627 | ) | ||||
|
|
|
|
|
|||||
| Net cash flow provided by financing activities |
1,177 | 59,433 | ||||||
|
|
|
|
|
|||||
| NET CHANGE IN CASH AND CASH EQUIVALENTS |
1,436 | (2,046 | ) | |||||
| CASH AND CASH EQUIVALENTS |
||||||||
| Beginning of year |
104 | 2,150 | ||||||
|
|
|
|
|
|||||
| End of year |
$ | 1,540 | $ | 104 | ||||
|
|
|
|
|
|||||
| SUPPLEMENTAL DISCLOSURE OF CASH FLOW INFORMATION |
| |||||||
| Cash paid for interest |
$ | 1,230 | $ | — | ||||
|
|
|
|
|
|||||
| SUPPLEMENTAL DISCLOSURE OF NON-CASH INVESTING AND FINANCING ACTIVITIES |
| |||||||
| Indemnification accrual recorded as discount on financing obligation |
$ | (4,403 | ) | $ | — | |||
|
|
|
|
|
|||||
| Reclassification of intangible asset to property and equipment |
$ | 5,508 | $ | — | ||||
|
|
|
|
|
|||||
See accompanying notes.
F-177
Table of Contents
Notes to Financial Statements
(in thousands)
Note 1—Summary of Organization and Significant Accounting Policies
Organization—SPS Atwell Island, LLC (the “Company”) is a wholly-owned subsidiary of Samsung Green Repower, LLC (“SGR”), under Samsung C&T America, Inc. (the “Administrator”). The Company is organized as a limited liability company (LLC) formed to develop and operate a 23.5 megawatt (“MW”) solar photovoltaic facility (the “Solar Facility”) located in Tulare County, CA.
In 2012 and continuing until March 2013, the solar facility was in development. On March 22, 2013, pursuant to a Participation Agreement dated June 28, 2012, the Solar Facility was sold to Atwell Solar Trust 2012 (“Trust/Lessor”) in a sale-leaseback transaction (the “Sale-Leaseback Transaction”) designed to transfer to the Trust/Lessor ownership of the Solar Facility, including certain related tax elements. Under the Sale-Leaseback Transaction, concurrently on March 22, 2013 and in accordance with the Participation Agreement, the Facility Site and Facility Lease Agreement (collectively, the “Facility Lease” and “Facility Lease Agreements”) were executed between Trust/Lessor and the Company.
Under the Facility Lease Agreements, the Company has the duty to operate the Solar Facility in exchange for contractual lease payments owed to the Trust/Lessor and the obligation to perform under a 25-year Power Purchase Agreement (“PPA”) with Pacific Gas and Electric Company (“PG&E”). As discussed in further detail herein, these financial statements present this Facility Lease as a financing event with the Company retaining the Solar Facility asset, recording a financing obligation, recording revenue as it is generated from energy sold to PG&E under the PPA, and recording payments under the Facility Lease as payments allocated between interest and principal. The 25-year term of the PPA commenced in March 2013.
Basis of presentation—The financial statements include the accounts of the Company and have been prepared in accordance with accounting principles generally accepted in the United States of America. The year 2013 is the first year during which the Company is considered an operating company and is no longer in the development stage.
Use of estimates—The preparation of financial statements in conformity with accounting principles generally accepted in the United States of America requires management to make estimates and assumptions that affect the reported amounts of assets and liabilities and disclosure of contingent assets and liabilities at the date of the balance sheet. Actual results could differ from those estimates.
Project administration agreement—A Project Administration Agreement (the “PAA”) is in place between the Company and the Administrator, which is an affiliate of the Company. The PAA provides for certain administrative services from Administrator to the Company. The PAA covers support services spanning both construction and operating phases of the Project such as bookkeeping, compliance reporting, administration of insurance, and the maintenance of corporate functions for the Company and Trust/Lessor.
Concentrations—The Company’s restricted cash balances are placed with high-credit-quality and federally-insured institutions. From time to time, the Company’s restricted cash balances with any one institution may exceed federally-insured limits or may be invested in a non-federally-insured money market account. The Company has not experienced any losses in such accounts and believes it is not exposed to significant credit risk as a result of its restricted cash investment policies.
F-178
Table of Contents
The Company has a significant concentration of credit risk as the PPA and the related accounts receivable are with one utility, PG&E, in the state of California.
Restricted cash—Pursuant to the terms of the Amended and Restated Depository Agreement entered between the parties to the Facility Lease, all cash owned by the Company is held in restricted accounts that consist of amounts held in trust by a bank to support the Company’s operations and obligations.
Accounts receivable—Accounts receivable consist of amounts owed on revenues generated from operating the Solar Facility.
Property and equipment—At December 31, 2013, property and equipment consists of the Solar Facility. Prior to the COD in March 2013, the Solar Facility was recorded as construction in process. While construction was in process, the Company recorded all costs and expenses related to the development and construction of the facility, including interest cost but excluding administrative expenses, as part of the Solar Facility cost. Upon the COD in March 2013, the Solar Facility asset was placed in service and depreciation commenced using the straight-line method and a 30-year useful life.
Sale-leaseback transaction—The Sale-Leaseback Transaction was executed in March 2013. As the Solar Facility is considered integral property, and based on the continuing involvement provided in the Facility Lease agreements, the Company determined the transaction did not meet accounting qualifications for a sale and that the transaction should be recorded using the financing method. Under the financing method, the Company did not recognize any upfront profit because a sale was not recognized. Rather, the Solar Facility assets remained on the Company books and the full amount of the financing proceeds of $90,055 was recorded as a financing obligation (Note 5).
Indemnification liability—Following the Sale-Leaseback Transaction, the Trust/Lessor applied for a cash grant from U.S. Treasury under the Program Guidance for the Payments for Specified Energy Property in Lieu of Tax Credit under the American Recovery and Reinvestment Act of 2009, issued July 2009/Revised March 2010 and April 2011. Based on the cash grant the Trust/Lessor received from Treasury, and in accordance with terms defined in Facility Lease agreements, as of December 31, 2013, the Company accrued an indemnification obligation to the Trust/Lessor of $4,403. The Company offset the indemnification liability as a discount on the financing obligation that will increase interest expense as it amortizes. The obligation was paid by the Company in early 2014.
Valuation of long-lived and intangibles—The Company evaluates the carrying value of long-lived assets for possible impairment whenever events or changes in circumstances indicate that the carrying value of an asset may not be recoverable. In general, the Company would recognize an impairment loss when the sum of undiscounted expected cash flows from the asset is less than the carrying amount of such asset. No impairment was evidenced or recorded as of December 31, 2013 or 2012.
Asset retirement obligations—The Company has considered the terms and conditions of the various agreements under which it operates and has concluded that it does not have any legally imposed asset retirement obligation. The Facility Lease agreements require a decommissioning reserve of $60 and the Company designates a portion of restricted cash to fund this decommissioning reserve.
Operating leases—Rents payable under a site lease are charged to operations over the lease term based on the lease payment calculation, which is deemed a methodical and systematic basis.
F-179
Table of Contents
Revenue recognition—The Company earns revenue from the sale of electricity under the 25-year PPA with PG&E. The Company is required to sell all energy and related energy attributes generated by the Solar Facility at specific rates as determined by the PPA. The Company recognizes revenue from the sale of electricity and related energy attributes when the electricity is generated and delivered. The PPA expires in March 2038.
Income taxes—The Company is a limited liability company for federal and state income tax purposes, and is disregarded from its member. The taxable income of the Company is generally included in the income tax returns of the owner.
Note 2—Property and Equipment
At December 31, 2013 and 2012, property and equipment are stated at book value, less accumulated depreciation, and consist of the following:
| 2013 | 2012 | |||||||
| Solar facility |
$ | 90,621 | $ | — | ||||
| Construction-in-progress |
— | 84,146 | ||||||
|
|
|
|
|
|||||
| Less accumulated depreciation |
(2,265 | ) | — | |||||
|
|
|
|
|
|||||
| Total |
$ | 88,356 | $ | 84,146 | ||||
|
|
|
|
|
|||||
Depreciation expense for the years ended December 31, 2013 and 2012 was $2,266 and $0, respectively.
Note 3—Solar Facility Rights
The Company was originally a joint venture between SGR and a 50 percent partner. In October 2011, SGR acquired the 50 percent interest and all related assets and rights for $6,000. The Company concluded this was an asset purchase and recorded a Solar Facility Rights intangible asset. In the October 2011 transaction, the Company obtained full interest in rights necessary for the development, financing, installation, construction, operation and ownership of a solar project, including the PPA, interconnection agreement, land lease rights and permits to develop the solar plant. The Solar Facility Rights were not amortized while the Solar Facility was under construction. Upon the March 2013 COD of the Solar Facility, the Solar Facility Rights asset was reclassified to the Solar Facility fixed asset.
Note 4—Construction Loan
In December 2011, the Company entered into a $74,520 construction loan to fund construction of the Solar Facility. The loan incurred interest at specific rates as determined by the loan agreement, was collateralized by all the Company’s assets, and was settled in full, with interest, in March 2013. The construction loan balance was $66,060 at December 31, 2012 and the amount paid off, including accrued interest, in March 2013 was $67,714. Interest accrued on this loan of $376 and $1,354 during the years ended December 31, 2013 and 2012, respectively, was capitalized as part of the construction-in-progress asset.
Note 5—Financing Obligation
As a result of the Sale-Leaseback Transaction (Note 1), the Company reported the transaction proceeds of $90,055 as a financing obligation relating to the Facility Lease. The payments on the financing obligation are allocated between interest and principal based on a rate determined by reference to the Company’s estimated incremental borrowing rate adjusted to eliminate substantially all
F-180
Table of Contents
negative amortization and to eliminate any estimated built-in gain or loss. As a result of the indemnification liability (Note 1), the Company subsequently recorded a discount on the financing obligation which will be amortized as interest expense. The balance outstanding for the financing obligation as of December 31, 2013 was $75,264.
The financing obligation is secured by the PPA and certain guarantees by SGR. The Facility Lease requires the Company to pay customary operating and repair expenses and to observe certain operating restrictions and covenants. The Facility Lease agreements contain renewal options at lease termination and purchase options at amounts approximating fair market value or termination value (greater of the two) as of dates specified in the those agreements.
Following is disclosure, as of December 31, 2013, of payment required on the financing obligation over the next five years:
| Years ending December 31: |
||||
| 2014 |
$ | 3,551 | ||
| 2015 |
3,639 | |||
| 2016 |
3,653 | |||
| 2017 |
3,676 | |||
| 2018 |
3,596 |
For the year ended December 31, 2013, interest expense of $1,393 was recorded relating to the financing obligation.
Note 6—Member’s Equity
Capitalized terms used in this footnote are used as defined in the Company’s LLC operating agreement (the “Operating Agreement”).
Structure—According to the Operating Agreement, as of December 31, 2013, SGR is the manager of the Company and also its sole member.
Taxable income and loss allocations—The Operating Agreement provides that each item of income, gain, loss, deduction, and credit of the Company will be allocated 100 percent to the member.
Member distributions—The Operating Agreement calls for distributable cash to be distributed to the member at the discretion of the manager.
Member liability—The member has no liability for the debts, obligations, or liabilities of the Company, whether arising in contract, tort, or otherwise solely by reason of being a member.
Note 7—Commitments and Contingencies
Real property agreements—The Solar Facility assets are located on property that the Company sub-leases from the Trust/Lessor, located in the County of Tulare, State of California. The original lease was between the Company and the Atwell Island Water District (“AIWD”). The lease was assigned to the Trust/Lessor at sale and subleased back to the Company simultaneously. The sublease term is co-terminus with the term of the Facility Lease. The Company pays $20 directly to AIWD each quarter for the land lease for the duration of its lease term.
F-181
Table of Contents
As of December 31, 2013, future minimum rental payments are as follows:
| Years ending December 31: |
| |||
| 2014 |
$ | 80 | ||
| 2015 |
80 | |||
| 2016 |
80 | |||
| 2017 |
80 | |||
| 2018 |
80 | |||
| Thereafter |
1,140 | |||
|
|
|
|||
| $ | 1,540 | |||
|
|
|
|||
Project administration agreement—The Company has entered into a project administration agreement (the “PAA”) with Administrator to provide administrative services relating to the day-to-day operations of the Company. The PAA is co-terminus with the term of the Facility Lease and establishes an annual base fee, due in equal installments on a monthly basis that was initially $300 and is subject to an annual escalator based on inflation. For the year ended December 31, 2013, the Company incurred $225 of expense under the PAA.
Maintenance and service agreements—The Company has entered into an integrated service package contract with The Ryan Company, Inc. (“Provider”), which provides for certain maintenance, service, and administrative responsibilities for the Facility. For the year ended December 31, 2013, the Company incurred fixed fees under this contract totaling $263. Under a Performance Ratio Guarantee, the Provider guarantees performance ratio at average rate of 74.36 percent for the agreement term of three years.
Interconnection agreement—The Company has entered into an interconnection agreement with a utility and California Independent Operator (“CAISO”), Participating Transmission Owner that allows the Company to interconnect its generating facility with the utility’s transmission or distribution grid. The interconnection agreement has a term of 25 years and can be renewed for successive one-year periods after its expiration. The agreement can only be terminated after the Company ceases operation and has complied with all laws and regulations applicable to such termination. The Company’s long-term other assets balances at December 31, 2013 and 2012 consist of amounts contractually due to the Company from the utility as reimbursement for costs incurred relating to network upgrades on interconnection facilities. Fees incurred for interconnection services other than those related to network upgrades are included in operating expenses in the statements of operations and totaled $275,000 and $0 for the years ended December 31, 2013 and 2012.
Letters of credit—At December 31, 2013, the Company had the following letters of credit:
The Trust/Lessor issued a letter of credit totaling $6,000 benefiting the Company, as the Borrower, pursuant to the terms of the Participation Agreement. Issuance of this letter of credit is related to the performance under the PPA. The letter of credit expires on the 7th anniversary of the Sale and Leaseback closing date. The Borrower may request an extension of the LC during the one year prior to the expiration date.
Legal proceedings and claims—From time to time, the Company is subject to various legal proceedings and claims arising in the normal course of its business.
Note 8—Related-party Transactions and Balances
Activity under the PAA agreement described in Note 7 is a related-party activity. At December 31, 2013 and 2012, the Company had no payables to any of its affiliates.
F-182
Table of Contents
Note 9—Subsequent Events
Subsequent events are events or transactions that occur after the balance sheet date but before financial statements are issued. The Company recognizes in the financial statements the effects of all subsequent events that provide additional evidence about conditions that existed at the date of the balance sheet, including the estimates inherent in the process of preparing the financial statements. The Company’s financial statements do not recognize subsequent events that provide evidence about conditions that did not exist at the date of the balance sheet but arose after the balance sheet date and before financial statements are issued.
The Company has evaluated subsequent events through May 14, 2014, which is the date the financial statements were available to be issued.
Subsequent to December 31, 2013, the Company has agreed that it will purchase the Solar Facility from Trust/Lessor and will terminate the associated Sale-Leaseback Transaction. Immediately following the purchase of the Solar Facility from the Trust/Lessor, all of the issued and outstanding membership interests of the Company will be sold to an affiliate of SunEdison, Inc. The Company expects to close these activities on May 16, 2014.
F-183
Table of Contents
To the Members
Nautilus Solar Energy, LLC
We have audited the accompanying combined carve-out financial statements of Summit Solar (a carve-out of Nautilus Solar Energy, LLC) (the “Group”), which comprise the combined carve-out balance sheets as of December 31, 2013 and 2012, and the related combined carve-out statements of income and comprehensive income, changes in members’ capital and cash flows for the years then ended, and the related notes to the combined carve-out financial statements.
Management’s Responsibility for the Financial Statements
Management of Nautilus Solar Energy, LLC is responsible for the preparation and fair presentation of the combined carve-out financial statements in accordance with accounting principles generally accepted in the United States of America; this includes the design, implementation, and maintenance of internal control relevant to the preparation and fair presentation of combined carve-out financial statements that are free from material misstatement, whether due to fraud or error.
Auditor’s Responsibility
Our responsibility is to express an opinion on these combined carve-out financial statements based on our audits. We conducted our audits in accordance with auditing standards generally accepted in the United States of America. Those standards require that we plan and perform the audit to obtain reasonable assurance about whether the combined carve-out financial statements are free from material misstatement.
An audit involves performing procedures to obtain audit evidence about the amounts and disclosures in the combined carve-out financial statements. The procedures selected depend on the auditor’s judgment, including the assessment of the risks of material misstatement of the combined carve-out financial statements, whether due to fraud or error. In making those risk assessments, the auditor considers internal control relevant to the entity’s preparation and fair presentation of the combined carve-out financial statements in order to design audit procedures that are appropriate in the circumstances, but not for the purpose of expressing an opinion on the effectiveness of the entity’s internal control. Accordingly, we express no such opinion. An audit also includes evaluating the appropriateness of accounting policies used and the reasonableness of significant accounting estimates made by management, as well as evaluating the overall presentation of the combined carve-out financial statements.
We believe that the audit evidence we have obtained is sufficient and appropriate to provide a basis for our audit opinion.
Opinion
In our opinion, the combined carve-out financial statements referred to above present fairly, in all material respects, the financial position of the Group as of December 31, 2013 and 2012, and the results of their operations and their cash flows for the years then ended, in accordance with accounting principles generally accepted in the United States of America.
Emphasis of Matters
Note 1 to the accompanying combined carve-out financial statements explains the basis of presentation of the combined carve-out financial statements, including the approach to and purpose for
F-184
Table of Contents
preparing them. Note 13 to the accompanying combined carve-out financial statements discloses a subsequent event related to the sale of the Group and the buyout of certain interests in the Group not controlled by Nautilus Solar Energy, LLC. Our opinion is not modified with respect to these matters.
/s/ CohnReznick LLP
Vienna, Virginia
May 23, 2014
F-185
Table of Contents
Combined Carve-out Balance Sheets
December 31, 2013 and 2012
| 2013 | 2012 | |||||||
| Assets |
||||||||
| Current assets |
||||||||
| Cash and cash equivalents |
$ | 1,790,570 | $ | 418,329 | ||||
| Accounts receivable |
686,514 | 312,166 | ||||||
| Deferred rent under sale-leaseback, current portion |
226,475 | 226,475 | ||||||
| Prepaid expenses and other current assets |
201,404 | 382,892 | ||||||
|
|
|
|
|
|||||
| Total current assets |
2,904,963 | 1,339,862 | ||||||
|
|
|
|
|
|||||
| Investment in energy property, net |
103,829,927 | 100,854,468 | ||||||
|
|
|
|
|
|||||
| Other assets |
||||||||
| Restricted cash |
4,087,467 | 4,000,135 | ||||||
| Deferred rent under sale-leaseback, net of current portion |
364,995 | 490,669 | ||||||
| Deferred financing costs, net |
1,579,394 | 1,751,531 | ||||||
| Other non-current assets |
100,000 | 100,000 | ||||||
|
|
|
|
|
|||||
| Total other assets |
6,131,856 | 6,342,335 | ||||||
|
|
|
|
|
|||||
| Total assets |
$ | 112,866,746 | $ | 108,536,665 | ||||
|
|
|
|
|
|||||
| Liabilities and Members’ Capital |
||||||||
| Current liabilities |
||||||||
| Accounts payable and accrued expenses |
$ | 532,925 | $ | 780,718 | ||||
| Accounts payable—construction |
— | 583,962 | ||||||
| Financing obligations, current maturities |
222,474 | 160,226 | ||||||
| Long-term debt, current maturities |
2,493,919 | 2,462,748 | ||||||
| Deferred grants and rebates, current portion |
981,496 | 900,403 | ||||||
| Deferred gain on sale, current portion |
32,087 | 32,087 | ||||||
|
|
|
|
|
|||||
| Total current liabilities |
4,262,901 | 4,920,144 | ||||||
|
|
|
|
|
|||||
| Long-term liabilities |
||||||||
| Asset retirement obligation |
2,431,531 | 2,035,249 | ||||||
| Financing obligations, net of current maturities |
9,657,148 | 5,740,560 | ||||||
| Long-term debt, net of current maturities |
18,867,431 | 19,050,921 | ||||||
| Deferred grants and rebates, net of current portion |
24,755,711 | 23,342,813 | ||||||
| Deferred gain on sale, net of current portion |
374,384 | 406,470 | ||||||
|
|
|
|
|
|||||
| Total long-term liabilities |
56,086,205 | 50,576,013 | ||||||
|
|
|
|
|
|||||
| Commitments and contingencies |
||||||||
| Members’ capital |
||||||||
| Members’ capital |
54,773,423 | 52,918,719 | ||||||
| Accumulated other comprehensive loss |
(2,648,839 | ) | (609,606 | ) | ||||
| Non-controlling interest |
393,056 | 731,395 | ||||||
|
|
|
|
|
|||||
| Total members’ capital |
52,517,640 | 53,040,508 | ||||||
|
|
|
|
|
|||||
| Total liabilities and members’ capital |
$ | 112,866,746 | $ | 108,536,665 | ||||
|
|
|
|
|
|||||
See Notes to Combined Carve-out Financial Statements.
F-186
Table of Contents
Combined Carve-out Statements of Income and Comprehensive Income
Years Ended December 31, 2013 and 2012
| 2013 | 2012 | |||||||
| Revenues |
||||||||
| Energy generation revenue |
$ | 5,326,919 | $ | 4,388,930 | ||||
| Solar Renewable Energy Certificate (SREC) revenue |
4,122,418 | 5,706,192 | ||||||
| Performance Based Incentive (PBI) revenue |
379,004 | 404,754 | ||||||
|
|
|
|
|
|||||
| Total revenues |
9,828,341 | 10,499,876 | ||||||
|
|
|
|
|
|||||
| Operating expenses |
||||||||
| Cost of operations |
1,201,564 | 912,268 | ||||||
| Selling, general and administrative expenses |
260,333 | 606,466 | ||||||
| Project adminstration fee |
504,327 | 888,611 | ||||||
| Depreciation and accretion |
2,726,354 | 2,311,419 | ||||||
|
|
|
|
|
|||||
| Total operating expenses |
4,692,578 | 4,718,764 | ||||||
|
|
|
|
|
|||||
| Net operating income |
5,135,763 | 5,781,112 | ||||||
|
|
|
|
|
|||||
| Other income (expenses) |
||||||||
| Amortization expense—deferred financing costs |
(224,875 | ) | (192,900 | ) | ||||
| Interest income |
11,937 | 13,053 | ||||||
| Interest expense—financing obligations |
(331,019 | ) | (347,619 | ) | ||||
| Interest expense—long-term debt |
(940,958 | ) | (668,720 | ) | ||||
| Other income |
— | 573,230 | ||||||
|
|
|
|
|
|||||
| Total other income (expenses) |
(1,484,915 | ) | (622,956 | ) | ||||
|
|
|
|
|
|||||
| Combined net income |
3,650,848 | 5,158,156 | ||||||
| Net income attributable to non-controlling interest |
(39,286 | ) | — | |||||
|
|
|
|
|
|||||
| Net income attributable to the members |
3,611,562 | 5,158,156 | ||||||
|
|
|
|
|
|||||
| Comprehensive income: |
||||||||
| Combined net income |
$ | 3,650,848 | $ | 5,158,156 | ||||
| Other comprehensive (loss) income |
(2,039,233 | ) | 96,740 | |||||
|
|
|
|
|
|||||
| Total comprehensive income |
1,611,615 | 5,254,896 | ||||||
|
|
|
|
|
|||||
| Comprehensive income attributable to non-controlling interests |
(39,286 | ) | — | |||||
|
|
|
|
|
|||||
| Comprehensive income attributable to the members |
$ | 1,572,329 | $ | 5,254,896 | ||||
|
|
|
|
|
|||||
See Notes to Combined Carve-out Financial Statements.
F-187
Table of Contents
Combined Carve-out Statements of Changes in Members’ Capital
Years Ended December 31, 2013 and 2012
| Members’ capital |
Accumulated other comprehensive income (loss) |
Non-controlling interest |
Total | |||||||||||||
| Balance, December 31, 2011 |
$ | 42,701,585 | $ | (706,346 | ) | $ | — | $ | 41,995,239 | |||||||
| Net contributions |
5,462,060 | — | 731,395 | 6,193,455 | ||||||||||||
| Foreign currency translation adjustments |
— | 96,740 | — | 96,740 | ||||||||||||
| Syndication costs |
(403,082 | ) | — | — | (403,082 | ) | ||||||||||
| Net income |
5,158,156 | — | — | 5,158,156 | ||||||||||||
|
|
|
|
|
|
|
|
|
|||||||||
| Balance, December 31, 2012 |
52,918,719 | (609,606 | ) | 731,395 | 53,040,508 | |||||||||||
| Net distributions |
(1,756,858 | ) | — | (377,625 | ) | (2,134,483 | ) | |||||||||
| Foreign currency translation adjustments |
— | (2,039,233 | ) | — | (2,039,233 | ) | ||||||||||
| Net income |
3,611,562 | — | 39,286 | 3,650,848 | ||||||||||||
|
|
|
|
|
|
|
|
|
|||||||||
| Balance, December 31, 2013 |
$ | 54,773,423 | $ | (2,648,839 | ) | $ | 393,056 | $ | 52,517,640 | |||||||
|
|
|
|
|
|
|
|
|
|||||||||
See Notes to Combined Carve-out Financial Statements.
F-188
Table of Contents
Combined Carve-out Statements of Cash Flows
Years Ended December 31, 2013 and 2012
| 2013 | 2012 | |||||||
| Cash flows from operating activities |
||||||||
| Combined net income |
$ | 3,650,848 | $ | 5,158,156 | ||||
| Adjustments to reconcile combined net income to net cash provided by operating activities |
||||||||
| Depreciation and accretion |
2,726,354 | 2,311,419 | ||||||
| Amortization expense—deferred financing costs |
224,875 | 192,900 | ||||||
| Amortization of deferred gain on sale |
(32,086 | ) | (32,087 | ) | ||||
| Write-off of accounts payable and accrued expenses |
— | (565,481 | ) | |||||
| Changes in operating assets and liabilities: |
||||||||
| Accounts receivable |
(380,696 | ) | 565,073 | |||||
| Prepaid expenses and other current assets |
174,507 | 376,405 | ||||||
| Deferred rent under sale-leaseback |
125,674 | 126,141 | ||||||
| Other non-current assets |
— | (100,000 | ) | |||||
| Accounts payable and accrued expenses |
(274,031 | ) | 73,832 | |||||
|
|
|
|
|
|||||
| Net cash provided by operating activities |
6,215,445 | 8,106,358 | ||||||
|
|
|
|
|
|||||
| Cash flows from investing activities |
||||||||
| Expenditures on energy property |
(8,070,939 | ) | (30,572,403 | ) | ||||
|
|
|
|
|
|||||
| Net cash used in investing activities |
(8,070,939 | ) | (30,572,403 | ) | ||||
|
|
|
|
|
|||||
| Cash flows from financing activities |
||||||||
| Net deposits to restricted cash |
(87,332 | ) | (1,485,578 | ) | ||||
| Proceeds from grants and rebates |
2,432,760 | 7,253,843 | ||||||
| Proceeds from financing obligations |
4,139,102 | 2,189,847 | ||||||
| Repayments of financing obligations |
(119,466 | ) | (397,116 | ) | ||||
| Proceeds from long-term debt |
2,400,000 | 16,147,762 | ||||||
| Repayments of long-term debt |
(2,552,319 | ) | (5,348,528 | ) | ||||
| Deferred financing costs paid |
(52,738 | ) | (645,061 | ) | ||||
| Net (distributions) contributions |
(2,134,483 | ) | 4,491,003 | |||||
|
|
|
|
|
|||||
| Net cash provided by financing activities |
4,025,524 | 22,206,172 | ||||||
|
|
|
|
|
|||||
| Effects of exchange rate changes on cash and cash equivalents |
(797,789 | ) | (136,360 | ) | ||||
| Net increase (decrease) in cash and cash equivalents |
1,372,241 | (396,233 | ) | |||||
|
|
|
|
|
|||||
| Cash and cash equivalents, beginning of the year |
418,329 | 814,562 | ||||||
|
|
|
|
|
|||||
| Cash and cash equivalents, end of the year |
$ | 1,790,570 | $ | 418,329 | ||||
|
|
|
|
|
|||||
| Cash paid for interest, net of amount capitalized |
$ | 1,163,180 | $ | 1,016,339 | ||||
|
|
|
|
|
|||||
| Supplemental schedule of non-cash investing and financing activities |
||||||||
| Expenditures on energy property are adjusted by the following: |
||||||||
| Asset retirement obligation |
$ | (285,363 | ) | $ | (459,832 | ) | ||
| Accounts payable—construction |
583,077 | 11,289,145 | ||||||
|
|
|
|
|
|||||
| $ | 297,714 | $ | 10,829,313 | |||||
|
|
|
|
|
|||||
| Increase (decrease) in financing obligations and decrease (increase) in accounts payable and accrued expenses |
$ | 40,800 | $ | (534,923 | ) | |||
|
|
|
|
|
|||||
| Non-cash contributions |
||||||||
| Syndication costs |
$ | — | $ | 403,082 | ||||
| Deferred financing fees |
— | 1,299,370 | ||||||
|
|
|
|
|
|||||
| $ | — | $ | 1,702,452 | |||||
|
|
|
|
|
|||||
See Notes to Combined Carve-out Financial Statements.
F-189
Table of Contents
Notes to Combined Carve-out Financial Statements
December 31, 2013 and 2012
Note 1—Basis of presentation and nature of operations
Basis of presentation
Summit Solar (the “Group”) as used in the accompanying combined carve-out financial statements comprises the entities and solar energy facilities listed below which are the subject of a purchase and sale agreement and which have historically operated as a part of Nautilus Solar Energy LLC (“NSE”). The Group is not a stand-alone entity, but is a combination of entities and solar energy facilities that are 100% owned by NSE unless otherwise noted below.
| Entities: |
||
| Solar I | SWBOE | |
| St. Joseph’s | Green Cove Management | |
| Liberty | Lindenwold | |
| Ocean City One | Dev Co | |
| Solar Services | Power III | |
| Silvermine | Solar PPA Partnership One | |
| Funding II (1%)* | Waldo Solar Energy Park of Gainesville | |
| Power II (1%)* | Cresskill | |
| Medford BOE (1%)* | WPU | |
| Medford Lakes (1%)* | KMBS | |
| Wayne (1%)* | Power I | |
| Hazlet (1%)* | Sequoia | |
| Talbot (1%)* | Ocean City Two | |
| Frederick (1%)* | Funding IV | |
| Gibbstown (51%)* | San Antonio West | |
| Solar energy facilities: |
||
| Solomon | 1000 Wye Valley | |
| 460 Industrial | 252 Power | |
| 80 Norwich | 510 Main | |
| 215 Gilbert | 7360 Bramalae | |
| * | Subsequent to year-end, affiliates of NSE purchased the remaining interests in these entities (see Note 13). |
Throughout the periods presented in the combined carve-out financial statements, the Group did not exist as a separate, legally constituted entity. The combined carve-out financial statements have therefore been derived from the consolidated financial statements of NSE and its subsidiaries to represent the financial position and performance of the Group on a stand-alone basis throughout those periods in accordance with accounting principles generally accepted in the United States of America.
Management of NSE believes the assumptions underlying the combined carve-out financial statements are reasonable based on the scope of the purchase and sale agreement and the entities forming the Group being under common control and management throughout the periods covered by the combined carve-out financial statements.
Outstanding inter-entity balances, transactions, and cash flows between entities comprising the Group have been eliminated.
F-190
Table of Contents
Management of NSE specifically identified expenses as being attributable to the Group which includes all material expenses incurred by NSE on the Group’s behalf. The expenses do not include allocations of general corporate overhead expenses from NSE as these costs were not considered material to the Group. The costs identified as specifically attributable to the Group are considered to be a reasonable reflection of all costs of doing business by the Group. For the years ended December 31, 2013 and 2012, Funding II incurred a project administration fee in the amount of $504,327 and $888,611, respectively. Management of NSE determined that it was not practicable to determine an estimate of this fee that would have been incurred had the Group operated as an unaffiliated entity. The combined carve-out financial statements included herein may not necessarily represent what the Group’s results, financial position and cash flows would have been had it been a stand-alone entity during the periods presented, or what the Group’s results, financial position and cash flows may be in the future.
Nature of operations
The Group engages in the development, construction, financing, ownership, and operation of distributed generation solar energy facilities in the United States and Canada. Solar Services provides operating and maintenance services for certain assets and/or entities included in the Group.
Note 2—Summary of significant accounting policies
Use of estimates
The preparation of combined carve-out financial statements in conformity with accounting principles generally accepted in the United States of America requires management to make estimates and assumptions that affect the reported amounts of assets and liabilities and disclosure of contingent assets and liabilities at the date of the combined carve-out financial statements and reported amounts of revenues and expenses for the periods presented. Actual results could differ from these estimates.
Cash and cash equivalents
Cash and cash equivalents include deposit and money market accounts.
Restricted cash
Restricted cash consists of cash on deposit with various financial institutions for reserves required under certain loan and lease agreements. The use of these reserves is restricted based on the terms of the respective loan and lease agreements. Cash received during the term of a sale-leaseback transaction is subject to control agreements and collateral agency agreements under various financing facilities. As of December 31, 2013 and 2012, restricted cash is $4,087,467 and $4,000,135, respectively.
Accounts receivable
Accounts receivable is stated at the amount billed to customers less any allowance for doubtful accounts. The Group evaluates the collectability of its accounts receivable taking into consideration such factors as the aging of a customer’s account, credit worthiness and historical trends. As of December 31, 2013 and 2012, the Group considers accounts receivable to be fully collectible.
Energy property
Energy property is stated at cost. Depreciation is provided using the straight-line method by charges to operations over estimated useful lives of 30 years for solar energy facilities. Expenditures during the construction of new solar energy facilities are capitalized to solar energy facilities under
F-191
Table of Contents
construction as incurred until achievement of the COD. Expenditures for maintenance and repairs are charged to expense as incurred. Upon retirement, sale or other disposition of the solar energy facility, the cost and accumulated depreciation are removed from the accounts and the related gain or loss, if any, is reflected in the year of disposal.
Depreciation for the years ended December 31, 2013 and 2012 was $3,532,376 and $2,992,624, respectively.
Impairment of long-lived assets
The Group reviews its energy property for impairment whenever events or changes in circumstances indicate that the carrying value of an asset may not be recoverable. When recovery is reviewed, if the undiscounted cash flows estimated to be generated by the energy property are less than its carrying amount, the Group compares the carrying amount of the energy property to its fair value in order to determine whether an impairment loss has occurred. The amount of the impairment loss is equal to the excess of the asset’s carrying value over its estimated fair value. No impairment loss was recognized during the years ended December 31, 2013 or 2012.
Intangible assets and amortization
Deferred financing costs of $2,001,540 in connection with long-term debt are amortized over the term of the loan agreement using the effective interest method. Accumulated amortization as of December 31, 2013 and 2012 is $422,146 and $197,127, respectively. Amortization expense for the years ended December 31, 2013 and 2012 was $224,875 and $192,900, respectively.
Estimated amortization expense for each of the ensuing years through December 31, 2018 and thereafter is as follows:
| 2014 |
$ | 230,563 | ||
| 2015 |
214,843 | |||
| 2016 |
205,128 | |||
| 2017 |
189,302 | |||
| 2018 |
172,590 | |||
| Thereafter |
566,968 | |||
|
|
|
|||
| $ | 1,579,394 | |||
|
|
|
Asset retirement obligation
The Group is required to record asset retirement obligations when it has the legal obligation to retire long-lived assets. Upon the expiration of the power purchase agreements (the “PPAs”) or lease agreements, the solar energy facility is required to be removed if the agreement is not extended or the solar energy facility is not purchased by the customer. Where asset retirement obligations exist, the Group is required to record the present value of the estimated obligation and increase the carrying amount of the solar energy facility. The asset retirement obligations are accreted to their future value over the term of the PPA or lease and the capitalized amount is depreciated over the estimated useful life of 30 years.
Members’ capital
In the combined carve-out balance sheets, members’ capital represents NSE and its affiliates’ historical investment in the carve-out entities and solar energy facilities, their accumulated net earnings, including accumulated other comprehensive loss, and the net effect of transactions with NSE and its affiliates.
F-192
Table of Contents
Comprehensive income
Comprehensive income consists of two components, combined net income and other comprehensive income (loss). Other comprehensive income (loss) refers to revenue, expenses, gains and losses that, under accounting principles generally accepted in the United States of America, are recorded as an element of members’ capital but are excluded from combined net income.
Cost of operations
Cost of operations includes expenses related to operations and maintenance, insurance, and rent.
Revenue recognition
The Group derives revenues from the following sources: sales of energy generation, sales of Solar Renewable Energy Certificates (“SRECs”,) and Performance Based Incentive (“PBI”) programs.
Energy generation
Energy generation revenue is recognized as electricity is generated by the solar energy facility and delivered to the customers. Revenues are based on actual output and contractual prices set forth in long-term PPAs.
SRECs
SRECs are accounted for as governmental incentives and are not considered an output of the solar energy facilities. Revenue from the sale of SRECs to third parties is recognized upon the transfer of title and delivery of the SRECs to third parties and is derived from contractual prices set forth in SREC sale agreements or at spot market prices.
PBI programs
Revenue from PBI programs is recognized on eligible solar energy facilities as delivery of the generation occurs. The Group is entitled to receive PBI revenues over a five-year term, expiring February 1, 2015, based on statutory rates as energy is delivered.
Grants and rebates
The costs of the facilities built in the United States of America qualify for energy investment tax credits as provided under Section 48 of the Internal Revenue Code (“IRC”) (“Section 48 Tax Credit”) or alternatively, upon election, may be eligible for the United States Department of the Treasury (“Treasury”) grant payment for specified energy property in lieu of tax credits pursuant to Section 1603 of the American Recovery and Reinvestment Act of 2009 (“Section 1603 Grant”).
The Group receives Section 1603 Grants, rebates and other grants from various renewable energy programs. Upon receipt of the grants and rebates, deferred revenue is recorded and amortized using the straight-line method over the shorter of the useful life of the related solar energy facility or term of the leaseback, where applicable. Amortization of deferred grants and rebates is recorded as an offset to depreciation expense. As of December 31, 2013 and 2012, deferred grants and rebates are $25,737,207 and $24,243,216, respectively. During the years ended December 31, 2013 and 2012, deferred grant and rebate amortization was $938,769 and $783,970, respectively.
Income taxes
The entities included in the accompanying combined carve-out financial statements have elected to be treated as pass-through entities or are disregarded entities for income tax purposes and as such,
F-193
Table of Contents
are not subject to income taxes. Rather, all items of taxable income, deductions and tax credits are passed through to and are reported by the entities’ members on their respective income tax returns. The Group’s Federal tax status as pass-through entities is based on their legal status as limited liability companies. Accordingly, the Group is not required to take any tax positions in order to qualify as pass-through entities. The consolidated income tax returns that report the activity of the Group are subject to examination by the Internal Revenue Service for a period of three years. While no income tax returns are currently being examined by the Internal Revenue Service, tax years since 2010 remain open.
Sales tax
The Group collects Harmonized Sales Taxes from its customers in Canada and remits these amounts to the Canadian government. Revenue is recorded net of Harmonized Sales Taxes.
Derivative instruments
The Group is required to evaluate contracts to determine whether the contracts are derivative instruments. Certain contracts that meet the definition of a derivative may be exempted from derivative accounting guidance under the normal purchases and normal sales exemption. Normal purchases and normal sales are contracts that provide for the purchase or sale of something other than a financial instrument or derivative instrument that will be delivered in quantities expected to be used or sold over a reasonable period in the normal course of business. SREC sale agreements that meet these requirements are designated as normal purchase or normal sale contracts and are exempted from the derivative accounting and reporting requirements. As of December 31, 2013 and 2012, all contracts for the sale of SRECs have been designated as exempt from the derivative accounting and reporting requirements.
Fair value of financial instruments
The Group maintains various financial instruments recorded at cost in the accompanying combined carve-out balance sheets that are not required to be recorded at fair value. For these instruments, management uses the following methods and assumptions to estimate fair value: (1) cash and cash equivalents, restricted cash, accounts receivable, deferred rent, prepaid expenses and other current assets, accounts payable and accrued expenses and accounts payable—construction approximate fair value because of the short-term nature of these instruments; and (2) long-term debt is deemed to approximate fair value based on borrowing rates available to the Group for long-term debt with similar terms and average maturities.
Foreign currency transactions
The Group determines the functional currency of each entity based on a number of factors, including the predominant currency for the entity’s expenditures and borrowings. When the entity’s local currency is considered its functional currency, management translates its assets and liabilities into U.S. dollars at the exchange rates in effect at the balance sheet dates. Revenue and expense items are translated at the average exchange rates for the reporting period. Adjustments from the translation process are presented as a component of accumulated other comprehensive loss in the accompanying combined carve-out statements of members’ capital.
The year-end and average exchange rates of the Canadian dollar to the U.S. dollar used in preparing these combined carve-out financial statements are as follows:
| Year end | Average | |||||||
| December 31, 2012 |
1.0031 | 1.0002 | ||||||
| December 31, 2013 |
.93485 | .9711 | ||||||
F-194
Table of Contents
The carrying amounts and classification of the Group’s foreign operations’ assets and liabilities as of December 31, 2013 and 2012 included in the accompanying combined carve-out balance sheets are as follows:
| 2013 | 2012 | |||||||
| Current assets |
$ | 1,181,874 | $ | 425,776 | ||||
| Investment in energy property, net |
17,816,141 | 17,382,868 | ||||||
|
|
|
|
|
|||||
| Total assets |
$ | 18,998,015 | $ | 17,808,644 | ||||
|
|
|
|
|
|||||
| Current liabilities |
$ | 111,536 | $ | 348,563 | ||||
| Non-current liabilities |
338,526 | 273,316 | ||||||
|
|
|
|
|
|||||
| Total liabilities |
$ | 450,062 | $ | 621,879 | ||||
|
|
|
|
|
|||||
Master lease agreements
The Group has entered into master lease agreements with financial institutions under which the financial institutions agreed to purchase solar energy facilities constructed by the Group and then simultaneously lease back the solar energy facilities to the Group. Under the terms of the master lease agreements, each solar energy facility is assigned a lease schedule that sets forth the terms of that particular solar energy facility lease such as minimum lease payments, basic lease term and renewal options, buyout or repurchase options, and end of lease repurchase options. Several of the leases have required rental prepayments.
The financial institutions owning the solar energy facilities retain all tax benefits of ownership, including any Section 48 Tax Credit or Section 1603 Grant.
The Group analyzes the terms of each solar energy facility lease schedule to determine the appropriate classification of the sale-leaseback transaction because the terms of the solar energy facility lease schedule may differ from the terms applicable to other solar energy facilities. In addition, the Group must determine if the solar energy facility is considered integral equipment to the real estate upon which it resides. The terms of the lease schedule and whether the solar energy facility is considered integral equipment may result in either one of the following sale leaseback classifications:
Operating lease
The sale-leaseback classification for non-real estate transactions is accounted for as an operating lease when management determines that a sale of the solar energy facility has occurred and the terms of the solar energy facility lease schedule meet the requirements of an operating lease. Typically, the classification as an operating lease occurs when the term of the lease is less than 75% of the estimated economic life of the solar energy facility and the present value of the minimum lease payments does not exceed 90% of the fair value of the solar energy facility. The classification of a sale-leaseback transaction as an operating lease results in the deferral of any profit on the sale of the solar energy facility. The profit is recognized over the term of the lease as a reduction of rent expense. Rent paid for the lease of the solar facility is recognized on a straight-line basis over the term of the lease.
Financing arrangement
The sale-leaseback transaction is accounted for as a financing arrangement when the Group determines that a sale of the solar energy facility has not occurred. Typically, this occurs when the solar energy facilities are determined to be integral property and the Group has a prohibited form
F-195
Table of Contents
of continuing involvement, such as an option to repurchase the solar energy facilities under the master lease agreements. The classification of a sale-leaseback transaction as a financing arrangement results in no profit being recognized because a sale has not been recognized and the financing proceeds are recorded as a liability.
The Group uses its incremental borrowing rate to determine the principal and interest component of each lease payment. However, to the extent that the incremental borrowing rate will result in either negative amortization of the financing obligation over the entire term of the lease or a built-in loss at the end of the lease (i.e. net book value exceeds the financing obligation), the rate is adjusted to eliminate such results. The Group has not been required to adjust its incremental borrowing rate for any of its financing arrangements. As a result, the financing arrangements amortize over the term of the respective lease and the Group expects to recognize a gain at the end of the lease term equal to the remaining financing obligation less the solar energy facility’s net book value.
Variable interest entity
The Group determines when it should include the assets, liabilities, and activities of a variable interest entity (“VIE”) in its combined carve-out financial statements and when it should disclose information about its relationship with a VIE when it is determined to be the primary beneficiary of the VIE. The determination of whether the Group is the primary beneficiary of a VIE is made upon initial involvement with the VIE and on an ongoing basis based on changes in facts and circumstances. The primary beneficiary of a VIE is the entity that has (1) the power to direct the activities of the VIE that most significantly impact the VIE’s economic performance and (2) the obligation to absorb losses or receive benefits that could potentially be significant to the VIE. If multiple unrelated parties share such power, as defined, no party is required to consolidate a VIE.
Non-controlling interests
Non-controlling interests are presented in the accompanying combined carve-out balance sheets as a component of Members’ capital, unless these interests are considered redeemable. Combined net income (loss) includes the total income (loss) of the Group and the attribution of that income (loss) between controlling and non-controlling interests is disclosed in the accompanying combined carve-out statements of income and comprehensive income.
Commitments and Contingencies
Liabilities for loss contingencies arising from claims, assessments, litigation, fines, and penalties and other sources are recorded when it is probable that a liability has been incurred and the amount of the assessment and/or remediation can be reasonably estimated. Legal costs incurred in connection with loss contingencies are expensed as incurred.
Subsequent events
Material subsequent events have been considered for disclosure and recognition in these combined carve-out financial statements through May 23, 2014 (the date the financial statements were available to be issued).
F-196
Table of Contents
Note 3—Energy property
Energy property consists of the following as of December 31, 2013 and 2012:
| 2013 | 2012 | |||||||
| Asset retirement obligation |
$ | 2,125,065 | $ | 1,861,530 | ||||
| Solar energy facilities—operating |
109,844,632 | 102,636,939 | ||||||
| Solar energy facilities under construction |
251,132 | 1,271,531 | ||||||
|
|
|
|
|
|||||
| 112,220,829 | 105,770,000 | |||||||
| Accumulated depreciation |
(8,390,902 | ) | (4,915,532 | ) | ||||
|
|
|
|
|
|||||
| $ | 103,829,927 | $ | 100,854,468 | |||||
|
|
|
|
|
|||||
Note 4—Long-term debt and financing obligations
On June 21, 2010, a certain entity of the Group entered into a loan agreement with a financial institution in the maximum amount of $5,000,000. The loan is non-interest bearing, matures July 21, 2020, and is secured by the assets of the entity. Payments of principal are payable in monthly installments of $40,833 plus additional quarterly payments equal to 32% of SREC proceeds, as defined, generated in the preceding quarter by the solar energy facilities owned by the entity. As of December 31, 2013 and 2012, outstanding principal is $2,675,609 and $3,329,263, respectively.
On August 4, 2010, a certain entity of the Group entered into a loan agreement with a financial institution in the original amount of $500,000. The loan bears interest at 6.75%, compounded annually, and is secured by the assets of the entity. Principal and interest are payable in monthly installments of $5,767 through maturity on August 4, 2020. The entity is required to maintain a specified debt service coverage ratio. As of December 31, 2013 and 2012, the outstanding principal is $365,686 and $408,314, respectively. Interest expense incurred during the years ended December 31, 2013 and 2012 was $26,572 and $29,472, respectively.
On June 21, 2011, certain entities of the Group entered into a loan agreement with a financial institution. The loan bears interest at a fixed rate per annum equal to the Interest Rate Index, as defined, plus 4.00% as of the date funds are distributed. Funds were distributed on November 3, 2011, February 1, 2012, and May 30, 2012, at effective interest rates of 5.24%, 5.06%, and 5.10%, respectively. The loan is secured by the assets of these entities. Payments of principal and interest are payable in semi-annual installments through the maturity date, 13 years after the date funds are disbursed. As of December 31, 2013 and 2012, the aggregate outstanding principal is $7,421,519 and $8,483,228, respectively. The aggregate interest expense during the years ended December 31, 2013 and 2012 was $426,565 and $480,855, respectively.
On June 21, 2011, a certain entity of the Group entered into a loan agreement with a financial institution in the original amount of $2,445,458. The loan bears interest at a fixed rate per annum equal to the Interest Rate Index, as defined, plus 4.00% as of the date funds were distributed, November 3, 2011 (5.24%), and is secured by the assets of the entity. Payments of principal and interest are payable in semi-annual installments through maturity on November 3, 2024. As of December 31, 2013 and 2012, outstanding principal is $1,714,869 and $2,061,188, respectively. Interest expense incurred during the years ended December 31, 2013 and 2012 was $105,770 and $123,693, respectively.
On August 10, 2012, a certain entity of the Group entered into a construction and permanent loan agreement with a financial institution in the original amount of $5,700,000. The loan is secured by the assets of the entity. During the construction term, the loan bore interest at a fixed rate per annum equal to the Prime Rate, plus 2.00% (5.25% at closing). During the construction term, payments of interest only were due monthly. On September 6, 2013, the conversion date, the entity met the required
F-197
Table of Contents
conditions and the loan converted to a permanent loan. During the first seven years of the permanent term, the loan bears interest at a fixed rate per annum equal to the interpolated yield for Treasury seven-year securities, plus 3.25%; provided, the interest rate shall not be less than 6.25% and not more than 8.25% (6.25% as of December 31, 2013). On the eighth anniversary of the conversion date, the interest rate shall reset to a fixed rate per annum equal to the interpolated yield for Treasury eight-year securities, plus 3.25%; provided, the interest rate shall not be less than 6.25% and not more than 8.25%. During the permanent term, payments of principal and interest are payable in equal quarterly installments through the maturity date, which is 15 years following the conversion date. As of December 31, 2013 and 2012, outstanding principal of the permanent and construction loan is $4,208,667 and $4,400,000, respectively. As of December 31, 2013 and 2012, accrued interest is $67,222 and $25,767, respectively. Interest expense incurred during the year ended December 31, 2013 was $238,195. Interest incurred during the year ended December 31, 2012 was $119,700, of which $85,000 was capitalized to the solar energy facility and $34,700 was expensed.
On November 26, 2012, a certain entity of the Group entered into a construction and permanent loan agreement with a financial institution in the original amount of $2,813,676. The loan is secured by the assets of the entity. During the construction term, the loan bore interest at a fixed rate per annum equal to the Prime Rate, plus 2.00% (5.25% at closing). During the construction term, payments of interest only were due monthly. On September 30, 2013 the conversion date, the entity met the required conditions and the loan converted to a permanent loan. During the first five years of the permanent term, the loan bears interest at a fixed rate per annum equal to the interpolated yield for Treasury five-year securities, plus 3.25%; provided, the interest rate shall not be less than 6.25% and not more than 8.25% (6.25% as of December 31, 2013). On the fifth anniversary of the conversion date, the interest rate shall reset to the interpolated yield for Treasury five-year securities, plus 3.25%; provided, the interest rate shall not be less than 6.25% and not more than 8.25%. During the permanent term, principal and interest are payable in equal quarterly installments through the maturity date, which is 10 years following the conversion date. As of December 31, 2013 and 2012, outstanding principal of the permanent and construction loan is $2,575,000 and $2,831,676, respectively. As of December 31, 2013 and 2012, accrued interest is $41,575 and $14,866, respectively. Interest expense incurred during the year ended December 31, 2013 was $102,255. Interest incurred and capitalized to the solar energy facility during the year ended December 31, 2012 was $61,943.
On January 29, 2013, a certain entity of the Group entered into a construction and permanent loan agreement with a financial institution in the original amount of $3,756,500. During the construction term, the loan bore interest at a fixed rate per annum equal to 10% and payments of interest only were due monthly. On September 27, 2013, the entity met the required conditions and the loan converted to a permanent loan. During the permanent term, the loan bears interest at a fixed rate per annum equal to 6.50% and is secured by the assets of the entity. Principal and interest are payable in quarterly installments through maturity on September 27, 2023. As of December 31, 2013, outstanding principal is $2,400,000. Interest incurred during the year ended December 31, 2013 was $188,279, of which $146,679 was capitalized to the solar energy facility and $41,600 was expensed.
The carrying amount of assets that serve as collateral for long-term debt as of December 31, 2013 and 2012 is $78,088,618 and $73,109,852, respectively.
F-198
Table of Contents
Aggregate annual maturities of long-term debt over each of the next five years and thereafter are as follows:
| 2014 |
$ | 2,493,919 | ||
| 2015 |
1,958,497 | |||
| 2016 |
2,004,608 | |||
| 2017 |
2,074,628 | |||
| 2018 |
2,147,575 | |||
| Thereafter |
10,682,123 | |||
|
|
|
|||
| $ | 21,361,350 | |||
|
|
|
During 2013 and 2012, certain entities of the Group completed construction and installation of four solar energy facilities which were sold to a third party and concurrently entered into a lease of the solar energy facilities for periods ranging from 15 to 20 years. These certain entities of the Group pledged membership interests in certain entities to the third party as security. The Group has classified the transactions as financing arrangements because the solar energy facilities were determined to be integral equipment and the purchase option available under the master lease agreement represents a prohibited form of continuing involvement.
The certain entities of the Group have indemnified the third party for any shortfalls between the applied-upon grant amount and the amount approved by Treasury. During the year ended December 31, 2012, the entities recorded a reduction in the sales proceeds received, which were recorded as financing obligations, for estimated amounts owed under the indemnity.
Aggregate annual maturities of financing obligations over each of the next five years and thereafter are as follows:
| 2014 |
$ | 222,474 | ||
| 2015 |
209,346 | |||
| 2016 |
222,327 | |||
| 2017 |
260,660 | |||
| 2018 |
265,733 | |||
| Thereafter |
8,699,082 | |||
|
|
|
|||
| $ | 9,879,622 | |||
|
|
|
Note 5—Operating leases
Certain entities of the Group have entered into various lease agreements for the sites where solar energy facilities have been constructed. Minimum lease payments are recognized in the accompanying combined carve-out statements of income and comprehensive income on a straight-line basis over the lease terms. Rent expense during the years ended December 31, 2013 and 2012 was $325,780 and $230,174, respectively.
In prior years, certain entities of the Group completed construction and installation of three solar energy facilities, which were sold to a third party, and concurrently entered into a leaseback of the solar energy facilities for periods of 15 to 20 years. These certain entities of the Group are leasing, operating and maintaining the solar energy facilities under arrangements that qualify as operating leases. The membership interests in these entities were pledged to the third party as security. The Group records lease expense under its operating leases on a straight line basis over the term of the lease. Aggregate gains on the sale of the solar energy facilities to this third party amounted to $591,458, the amortization of which is recognized as an offset to the corresponding lease expense ratably over the term of the
F-199
Table of Contents
lease. As of December 31, 2013 and 2012, the Group has deferred rent of $591,470 and $717,144, respectively, which represents the difference between the amount paid by the Group and the rent expense recorded using the straight-line basis in the aforementioned transaction. For both the years ended December 31, 2013 and 2012, the Group recorded lease expenses of $226,475, net of offsets from the recognition of the gains on sale of $32,087.
Future aggregate minimum operating lease payments as of December 31, 2013 are as follows:
| 2014 |
$ | 439,403 | ||
| 2015 |
421,152 | |||
| 2016 |
421,674 | |||
| 2017 |
422,219 | |||
| 2018 |
422,786 | |||
| Thereafter |
5,819,372 | |||
|
|
|
|||
| $ | 7,946,606 | |||
|
|
|
Note 6—SREC inventory
The Group generates SRECs for each 1,000 kWh of solar energy produced. To monetize the SRECs in certain states with mandatory renewable energy portfolio standards, the Group enters into third party contracts to sell generated SRECs at fixed prices and in designated quantities over periods ranging from 1 to 12 years. The timing of delivery to customers is dictated by the terms of the underlying contracts. In the event energy production does not generate sufficient SRECs to fulfill a contract, the Group may be required to utilize its supply of uncontracted SRECs, purchase SRECs on the spot market, or pay specified contractual damages. Additionally, the Group also sells generated SRECs on the spot market.
As of December 31, 2013 and 2012, the Group holds 797 and 2,421 SRECs, respectively, that are committed through forward contracts with prices ranging from $160 to $580 per SREC.
Management accounts for its SREC inventory under the incremental cost method and has recorded no value for these SRECs in the accompanying combined carve-out balance sheets as of December 31, 2013 and 2012.
Note 7—Variable interest entity
A certain entity of the Group is the primary beneficiary of a VIE, which was formed in 2012 and is consolidated as of December 31, 2013 and 2012. The carrying amounts and classification of the consolidated VIE’s assets and liabilities as of December 31, 2013 and 2012 included in the accompanying combined carve-out balance sheets are as follows:
| 2013 | 2012 | |||||||
| Current assets |
$ | 115,622 | $ | 26,983 | ||||
| Non-current assets |
4,676,686 | 4,805,776 | ||||||
|
|
|
|
|
|||||
| Total assets |
$ | 4,792,308 | $ | 4,832,759 | ||||
|
|
|
|
|
|||||
| Current liabilities |
$ | 351,259 | $ | 787,448 | ||||
| Non-current liabilities |
3,538,350 | 2,686,270 | ||||||
|
|
|
|
|
|||||
| Total liabilities |
$ | 3,889,609 | $ | 3,473,718 | ||||
|
|
|
|
|
|||||
F-200
Table of Contents
The amounts shown above exclude inter-entity balances that were eliminated for purposes of presenting these combined carve-out financial statements. All of the assets above are restricted for settlement of the VIE obligations and all of the liabilities above can only be settled using VIE resources; however, NSE has guaranteed the long-term debt.
Note 8—Related-party transactions
Development fees
Dev Co provides solar energy asset development services and has charged development fees to entities and assets within the Group. The development fees are generally due and payable upon the COD. Certain development fees may be deferred until the twelfth or thirteenth anniversary of the COD and accrue interest at a rate of 2.40%—4.05%. Payments are to be made from cash flow as prioritized in the respective Project Cash Management Agreement or Operating Agreement.
As of December 31, 2013, development fees payable and interest payable is $2,142,634 and $90,235, respectively. As of December 31, 2012, development fees payable and interest payable is $2,688,585 and $3,001, respectively. During the years ended December 31, 2013 and 2012, interest incurred was $87,234 and $143,240, respectively. These amounts have been eliminated for purposes of presenting these combined carve-out financial statements.
Project administration fee
An affiliate of the Group provides administrative and project management services to Funding II and earns an annual, noncumulative fee. The fee is equal to 15% of gross revenues, as defined, and specifically excludes deferred grant amortization, and is to be paid from cash flows as prioritized in the Operating Agreement. The fee is only incurred to the extent of available cash flow. During the years ended December 31, 2013 and 2012, project administration fees were $504,327 and $888,611, respectively.
Construction loans
Funding IV entered into a loan agreement with Gibbstown to provide funds for the construction of a solar energy facility in the amount of $2,913,794. The loan bore interest at a fixed rate of 10.00% per annum. Interest incurred and capitalized to investment in energy property during the year ended December 31, 2013 was $107,708. The outstanding principal balance and accrued interest was repaid upon closing of third-party financing. The interest incurred and capitalized to investment in energy property has been eliminated for purposes of presenting these combined carve-out financial statements.
Funding II entered into a loan agreement with an affiliate of the Group to provide funds for the construction of certain solar energy facilities. The loans bore interest at a fixed rate of 8.00% per annum. Total funding provided by the affiliate was $25,837,852. Interest incurred and capitalized to investment in energy property in prior years was $1,007,224. The aggregate outstanding principal balance and accrued interest of $20,089,585 was converted to equity in the entity in 2011.
Operations and maintenance agreements
Solar Services entered into Operations and Maintenance Agreements (“O&M Agreements”) with certain entities or assets that comprise the Group. In general, Solar Services is entitled to a quarterly fee, escalated annually, based on the size of the solar energy facility. The terms are generally concurrent with the term of the respective PPAs of the specific solar energy facilities unless terminated earlier in accordance with the O&M Agreements.
F-201
Table of Contents
The following is a schedule of minimum payments under cancellable O&M Agreements:
| 2014 |
$ | 199,289 | ||
| 2015 |
201,886 | |||
| 2016 |
204,519 | |||
| 2017 |
207,187 | |||
| 2018 |
209,891 | |||
| Thereafter |
1,842,388 | |||
|
|
|
|||
| Total |
$ | 2,865,160 | ||
|
|
|
The amounts incurred under the O&M Agreements have been eliminated for purposes of presenting these combined carve-out financial statements.
Note 9—Commitments and contingencies
An entity within the Group was involved in arbitration with a vendor in pursuit of liquidated damages relating to completed work under a contractual arrangement. The vendor filed a counterclaim for payment of amounts outside of the provisions of the contract. During the year ended December 31, 2012, a settlement was reached with the vendor, whereby the entity within the Group paid $7,453,711 of its outstanding obligation and recognized net settlement income of $565,481, which is included in other income in the accompanying combined carve-out statements of income and comprehensive income.
An entity within the Group was involved in arbitration with a vendor in pursuit of liquidated damages relating to completed work under a contractual arrangement. The vendor filed a counterclaim for payment of amounts outside of the provisions of the contract. During the year ended December 31, 2013, the Group reached a settlement with the vendor, whereby the Group received liquidated damages of $175,000.
An entity is currently involved in a dispute with a vendor who has filed a claim in the amount of $447,725 regarding the completion of certain milestones under a contractual agreement. Management disagrees with the claim based on the position that one of the milestones was not met under the terms of the contract. The Group has not accrued for any amounts for this matter as NSE has executed an indemnification and is entitled to control and defend any claims related to this matter.
Operations and maintenance agreements
The Group has entered into O&M Agreements with unrelated third parties for operating and maintaining solar energy facilities. In general, the third parties are entitled to a quarterly fee, escalated annually, based on the size of the respective solar energy facility. The terms are generally concurrent with the term of the respective PPAs of the specific solar energy facilities unless terminated earlier in accordance with the O&M Agreements.
During the years ended December 31, 2013 and 2012, the Group incurred expenses relating to these O&M Agreements of $118,832 and $136,536, respectively, all of which is included in cost of operations in the accompanying combined carve-out statements of income and comprehensive income.
F-202
Table of Contents
The following is a schedule of minimum payments under the cancellable O&M Agreements:
| 2014 |
$ | 319,599 | ||
| 2015 |
323,561 | |||
| 2016 |
327,577 | |||
| 2017 |
331,647 | |||
| 2018 |
335,772 | |||
| Thereafter |
3,136,094 | |||
|
|
|
|||
| $ | 4,774,250 | |||
|
|
|
Power purchase agreements
The Group has entered into 15- to 20-year PPAs with one customer for each solar energy facility. The PPAs provide for the receipt of payments in exchange for the sale of all solar-powered electric energy. The electricity payments are calculated based on the amount of electricity delivered at a designated delivery point at a fixed price. Certain PPAs have minimum production guarantee provisions that require the Group to pay the customer for any production shortfalls.
SREC sale agreements
The Group has entered into 1- to 12-year SREC agreements with various third parties. The agreements provide for the receipt of fixed payments in exchange for the transfer of either a contractually fixed quantity or all of the SRECs generated by the solar energy facilities. Certain agreements require the Group to establish collateral accounts, which are released as the Group meets its obligations under the SREC agreements.
Sublease agreement
A certain entity of the Group entered into a sublease agreement with a third party to sublease the roof of a building to install a solar energy facility. The entity was required to pay a security deposit of $100,000 at the execution of the lease, which remains receivable as of December 31, 2013. The sublease agreement requires annual payments of $85,000 through the termination of the respective PPA on May 4, 2032.
Grant compliance
As a condition to claiming Section 1603 Grants, the Group is required to maintain compliance with the terms of the Section 1603 program for a period of 5 years. Failure to maintain compliance with the requirements of Section 1603 could result in recapture of the amounts received, plus interest.
The Group is required to maintain compliance with various state renewable energy programs provided other rebates or grants. The compliance periods range from 5 to 15 years. Failure to comply with these requirements could result in recapture of the amounts received.
F-203
Table of Contents
Note 10—Asset retirement obligation
The Group determined that, based on contractual obligations under the various PPA and lease agreements, there is a requirement to record an asset retirement obligation. The following table reflects the changes in the asset retirement obligation for the years ended December 31, 2013 and 2012:
| 2013 | 2012 | |||||||
| Asset retirement obligation, January 1 |
$ | 2,035,249 | $ | 1,469,640 | ||||
| Liabilities incurred |
263,535 | 462,844 | ||||||
| Liabilities settled |
— | — | ||||||
| Accretion expense |
132,747 | 102,765 | ||||||
|
|
|
|
|
|||||
| Asset retirement obligation, December 31 |
$ | 2,431,531 | $ | 2,035,249 | ||||
|
|
|
|
|
|||||
Note 11—Major customers
During the year ended December 31, 2013, the Group derived 14% of its energy generation revenue from one customer and 39% of its SREC revenue from three customers.
During the year ended December 31, 2012, the Group derived 79% of its SREC revenue from five customers.
Note 12—Concentrations
The Group maintains cash with financial institutions. At times, these balances may exceed Federally insured limits; however, the Group has not experienced any losses with respect to its bank balances in excess of Federally insured limits. Management believes that no significant concentration of credit risk exists with respect to these cash balances as of December 31, 2013 and 2012.
The Group sells solar-powered electric energy to customers under 15- to 20-year arrangements and sells SRECs under contracts with third parties. The Group is dependent on these customers.
Note 13—Subsequent events
On May 22, 2014, an affiliate of NSE entered into a purchase and sale agreement to sell its ownership interests in the Group to an affiliate of SunEdison, Inc.
On May 22, 2014, the Class B Member of Funding II, an affiliate of NSE, purchased the ownership interests of the Class A Member. As a result of the transaction, the affiliate acquired the remaining 99% interest in Funding II (see Note 1).
On May 22, 2014, Funding IV, an affiliate of NSE, purchased the non-controlling interests of Gibbstown. As a result of the transaction, the affiliate acquired the remaining 49% interest in Gibbstown (see Note 1).
On May 22, 2014, the Group repaid the noninterest bearing loan with a principal balance of $2,675,609 as of December 31, 2013.
F-204
Table of Contents
The Board of Directors
TerraForm Power, Inc.:
We have audited the accompanying combined financial statements of TerraForm Power, Inc.’s UK affiliates KS SPV 24 Limited, Boyton Solar Park Limited, and Sunsave 6 (Manston) Limited (collectively the “Stonehenge Operating Group”), which comprise the combined balance sheet as of December 31, 2013, and the related combined statements of operations, changes in shareholders’ deficit, and cash flows for the year then ended, and the related notes to the combined financial statements.
Management’s Responsibility for the Financial Statements
Management is responsible for the preparation and fair presentation of these combined financial statements in accordance with U.S. generally accepted accounting principles; this includes the design, implementation, and maintenance of internal control relevant to the preparation and fair presentation of combined financial statements that are free from material misstatement, whether due to fraud or error.
Auditors’ Responsibility
Our responsibility is to express an opinion on these combined financial statements based on our audit. We conducted our audit in accordance with auditing standards generally accepted in the United States of America. Those standards require that we plan and perform the audit to obtain reasonable assurance about whether the combined financial statements are free from material misstatement.
An audit involves performing procedures to obtain audit evidence about the amounts and disclosures in the combined financial statements. The procedures selected depend on the auditors’ judgment, including the assessment of the risks of material misstatement of the combined financial statements, whether due to fraud or error. In making those risk assessments, the auditor considers internal control relevant to the entity’s preparation and fair presentation of the combined financial statements in order to design audit procedures that are appropriate in the circumstances, but not for the purpose of expressing an opinion on the effectiveness of the entity’s internal control. Accordingly, we express no such opinion. An audit also includes evaluating the appropriateness of accounting policies used and the reasonableness of significant accounting estimates made by management, as well as evaluating the overall presentation of the combined financial statements.
We believe that the audit evidence we have obtained is sufficient and appropriate to provide a basis for our audit opinion.
Opinion
In our opinion, the combined financial statements referred to above present fairly in all material respects, the financial position of the Stonehenge Operating Group as of December 31, 2013, and the results of its operations and its cash flows for the year then ended in accordance with U.S. generally accepted accounting principles.
/s/ KPMG LLP
Reading, United Kingdom
3 July 2014
F-205
Table of Contents
Combined Balance Sheet
As of December 31, 2013
| In thousands | 2013 | |||
| Assets |
||||
| Current assets: |
||||
| Cash and cash equivalents |
£ | 301 | ||
| Restricted cash |
1,430 | |||
| Accounts receivable |
561 | |||
| Notes receivable—related parties |
4,120 | |||
| Prepaid expenses and other current assets |
2,020 | |||
|
|
|
|||
| Total current assets |
8,432 | |||
| Property and equipment, net |
29,154 | |||
| Deferred financing costs, net |
1,587 | |||
| Other assets |
203 | |||
|
|
|
|||
| Total assets |
£ | 39,376 | ||
|
|
|
|||
| Liabilities and Shareholders’ Deficit |
||||
| Current liabilities: |
||||
| Current portion of long-term debt |
£ | 7,754 | ||
| Notes payable—related parties |
9,761 | |||
| Accounts payable and other current liabilities |
756 | |||
| Due to related parties |
961 | |||
|
|
|
|||
| Total current liabilities |
19,232 | |||
| Other liabilities: |
||||
| Long-term debt, less current portion |
20,771 | |||
| Deferred income taxes, net |
34 | |||
| Asset retirement obligations |
208 | |||
|
|
|
|||
| Total liabilities |
40,245 | |||
| Shareholders’ deficit: |
||||
| Shareholders’ deficit |
(869 | ) | ||
|
|
|
|||
| Total liabilities and shareholders’ deficit |
£ | 39,376 | ||
|
|
|
|||
See accompanying notes to combined financial statements.
F-206
Table of Contents
Combined Statement of Operations
For the Year Ended December 31, 2013
| In thousands | 2013 | |||
| Operating revenues: |
||||
| Energy |
£ | 938 | ||
| Incentives |
1,674 | |||
|
|
|
|||
| Total operating revenues |
2,612 | |||
| Operating costs and expenses: |
||||
| Cost of operations |
64 | |||
| Cost of operations—affiliate |
131 | |||
| General and administrative |
349 | |||
| Depreciation |
1,145 | |||
|
|
|
|||
| Total operating costs and expenses |
1,689 | |||
|
|
|
|||
| Operating income |
923 | |||
| Other expense: |
||||
| Interest expense |
1,804 | |||
| Other, net |
(69 | ) | ||
|
|
|
|||
| Total other expenses |
1,735 | |||
|
|
|
|||
| Loss before income taxes |
(812 | ) | ||
| Income tax expense |
34 | |||
|
|
|
|||
| Net loss |
£ | (846 | ) | |
|
|
|
|||
See accompanying notes to combined financial statements.
F-207
Table of Contents
Combined Statement of Changes in Shareholders’ Deficit
For the Year Ended December 31, 2013
| In thousands | Shareholders’ Deficit |
|||
| Balance at December 31, 2012 |
£ | (23 | ) | |
|
|
|
|||
| Net loss |
(846 | ) | ||
|
|
|
|||
| Balance at December 31, 2013 |
£ | (869 | ) | |
|
|
|
|||
See accompanying notes to combined financial statements.
F-208
Table of Contents
Combined Statement of Cash Flows
For the Year Ended December 31, 2013
| In thousands | 2013 | |||
| Cash flows from operating activities: |
||||
| Net loss |
£ | (846 | ) | |
| Adjustments to reconcile net loss to net cash used in operating activities: |
||||
| Depreciation |
1,145 | |||
| Amortization of deferred financing costs |
66 | |||
| Deferred taxes |
34 | |||
| Gain on foreign currency exchange |
(69 | ) | ||
| Changes in assets and liabilities: |
||||
| Accounts receivable |
(561 | ) | ||
| Prepaid expenses and other current assets |
(1,723 | ) | ||
| Accounts payable and other current liabilities |
(901 | ) | ||
| Other assets |
(20 | ) | ||
| Due to parent and affiliates |
(3,558 | ) | ||
|
|
|
|||
| Net cash used in operating activities |
(6,433 | ) | ||
|
|
|
|||
| Cash flows from investing activities: |
||||
| Capital expenditures |
(28,614 | ) | ||
|
|
|
|||
| Net cash used in investing activities |
(28,614 | ) | ||
|
|
|
|||
| Cash flows from financing activities: |
||||
| Change in restricted cash |
(1,430 | ) | ||
| Proceeds from long-term debt |
28,792 | |||
| Proceeds from notes payable—related parties |
17,761 | |||
| Principal payments—related parties |
(8,128 | ) | ||
| Payment of deferred financing costs |
(1,653 | ) | ||
|
|
|
|||
| Net cash provided by financing activities |
35,342 | |||
|
|
|
|||
| Net increase in cash and cash equivalents |
295 | |||
| Cash and cash equivalents at beginning of period |
6 | |||
|
|
|
|||
| Cash and cash equivalents at end of period |
£ | 301 | ||
|
|
|
|||
| Supplemental Cash Flow Information: |
||||
| Cash payments for interest |
£ | 1,616 | ||
| Cash payments for taxes |
£ | — | ||
See accompanying notes to combined financial statements.
F-209
Table of Contents
Notes to Combined Financial Statements
(Amounts in thousands)
1. NATURE OF OPERATIONS
The Stonehenge Operating Group (the “Group”), as used in the accompanying combined financial statements, comprises the entities and solar energy facilities listed below:
| • | Sunsave 6 (Manston) Ltd (“Sunsave 6”) |
| • | KS SPV 24 Limited (“SPV 24”) |
| • | Boyton Solar Park Limited (“Boyton”) |
The Group is not a stand-alone entity but is a combination of entities and solar energy systems that are under the common management of ib Vogt GmbH (“ib Vogt”). The Group’s operating solar energy systems are located in the United Kingdom (“UK”) and operate under long-term contractual arrangements to sell 100% of the solar energy generated by the systems to one third party customer. The total combined capacity for the solar energy systems comprising the Group is 23.6 MW.
Basis of Presentation
The Group has presented combined financial statements as of and for the year ended December 31, 2013. The Group’s combined financial statements have been prepared in accordance with U.S. generally accepted accounting principles (“U.S. GAAP”). The Financial Accounting Standards Board (“FASB”) Accounting Standards Codification (“ASC”) is the source of authoritative U.S. GAAP to be applied by non-governmental entities. During the year ended December 31, 2013, there were no transactions among the combined entities that required elimination. The Group’s functional currency is the British Pound (“GBP”).
2. SUMMARY OF SIGNIFICANT ACCOUNTING POLICIES
Use of Estimates
In preparing our combined financial statements, we use estimates and assumptions that may affect reported amounts and disclosures. Estimates are used when accounting for depreciation, amortization, asset retirement obligations, accrued liabilities and income taxes. These estimates and assumptions are based on current facts, historical experience and various other factors that we believe to be reasonable under the circumstances, the results of which form the basis for making judgments about the carrying values of assets and liabilities and the recording of revenue, costs and expenses that are not readily apparent from other sources. To the extent there are material differences between the estimates and actual results, our future results of operations would be affected.
Cash and Cash Equivalents
Cash and cash equivalents include all cash balances with original maturity periods of three months or less when purchased.
Restricted Cash
Restricted cash consists of cash on deposit in financial institutions that is restricted from use in operations pursuant to requirements of certain debt agreements. These funds are reserved for current debt service payments in accordance with the restrictions in the debt agreements.
F-210
Table of Contents
Accounts Receivable
Accounts receivable are reported on the combined balance sheet at the invoiced amounts adjusted for any write-offs and the allowance for doubtful accounts. We establish an allowance for doubtful accounts to adjust our receivables to amounts considered to be ultimately collectible. Our allowance is based on a variety of factors, including the length of time receivables are past due, significant one-time events, the financial health of our customers, and historical experience. There was no allowance for doubtful accounts or write-off of accounts receivable as of December 31, 2013.
Property and Equipment
Property and equipment consists of solar energy systems and is stated at cost. Expenditures for major additions and improvements are capitalized, and maintenance and repairs are charged to expense as incurred. When property and equipment is retired or otherwise disposed of, the cost and accumulated depreciation is removed from the accounts, and any resulting gain or loss is included in the results of operations for the respective period. Depreciation of property and equipment is recognized using the straight-line method over the estimated useful lives of the solar energy systems of twenty years.
Capitalized Interest
Interest incurred on funds borrowed to finance construction of solar energy systems is capitalized until the system is ready for its intended use. The amount of interest capitalized during the year ended December 31, 2013 was £88. Interest costs charged to interest expense, including amortization of deferred financing costs, was £1,804 during the year ended December 31, 2013.
Deferred Financing Costs
Financing costs incurred in connection with obtaining construction and term financing are deferred and amortized over the maturities of the respective financing arrangements using the effective-interest method. Amortization of deferred financing costs recorded in interest expense was £66 during the year ended December 31, 2013.
Impairment of Long-lived Assets
Long-lived assets that are held and used are reviewed for impairment whenever events or changes in circumstances indicate carrying values may not be recoverable. An impairment loss is recognized if the total future estimate of undiscounted cash flows expected from an asset are less than its carrying value. An impairment charge is measured as the difference between an asset’s carrying amount and fair value with the difference recorded in operating costs and expenses in the statement of operations. Fair values are determined by a variety of valuation methods including appraisals, sales prices of similar assets, and present value techniques. There were no impairments recognized during the year ended December 31, 2013.
Operating Lease Agreements
Rentals applicable to operating leases where substantially all of the benefits and risks of ownership remain with the lessor are charged against profits on a straight-line basis over the period of the lease.
Asset Retirement Obligations
The Group’s asset retirement obligations relate to leased land upon which the solar energy systems were constructed. The leases require that, upon lease termination, the leased land be
F-211
Table of Contents
restored to an agreed-upon condition. The Group is required to record the present value of the estimated obligations when the solar energy system are placed in service. Upon initial recognition of the Group’s asset retirement obligations, the carrying amounts of the solar energy systems were also increased. The asset retirement obligations will be accreted to their future value over the terms of the land leases, while the amount capitalized at the COD will be depreciated over its estimated useful life of 20 years. Accretion expense recognized during the year ended December 31, 2013 was insignificant.
Revenue Recognition
Power Purchase Agreements
A significant majority of the Group’s revenues are obtained through the sale of energy pursuant to terms of power purchase agreements (“PPAs”) or other contractual arrangements. All PPAs are accounted for as operating leases, have no minimum lease payments, and all of the rental income under these leases is recorded as income when the electricity is delivered. The contingent rental income recognized in the year ended December 31, 2013 was £938, exclusive of Value Added Tax (“VAT”).
Incentive Revenue
We receive incentives in the form of renewable obligation certificates (“ROCs”) and Levy Exemption Certificates (“LECs”) in respect to the production of electricity, which we sell to third parties. ROCs and LECs are accounted for as governmental incentives and are not considered an output of our solar energy systems. ROCs and LECs revenue is recognized at the time the Group has transferred ROCs or LECs pursuant to an executed contract relating to the sale to a third party. Incentive revenue was £1,674 for the year ended December 31, 2013.
Recently Issued Accounting Pronouncements
In May 2014, the FASB issued ASU No. 2014-09, Revenue from Contracts with Customers (Topic 606) (“ASU 2014-09”). The Group does not currently expect the adoption of ASU 2014-09 to have a significant effect on its combined financial statements and related disclosures.
Income Taxes
Our income tax balances are determined and reported in accordance with FASB ASC 740 (“ASC 740”), Income Taxes. Deferred tax assets and liabilities are recognized for the future tax consequences attributable to differences between the financial statement carrying amounts of existing assets and liabilities and their respective tax bases and operating loss carryforwards.
Deferred tax assets and liabilities are measured using enacted tax rates expected to apply to taxable income in the years in which those temporary differences are expected to be recovered or settled. The effect on deferred tax assets and liabilities of a change in tax rate is recognized in operations in the period that includes the enactment date. Valuation allowances are established when management determines that it is more likely than not that some portion, or all of the deferred tax asset, will not be realized.
Deferred income taxes arise primarily because of differences in the bases of assets or liabilities between financial statement accounting and tax accounting which are known as temporary differences. We record the tax effect of these temporary differences as deferred tax assets (generally items that can be used as a tax deduction or credit in future periods) and deferred tax liabilities (generally items for which we receive a tax deduction but have not yet been recorded in the combined statement of operations).
F-212
Table of Contents
We regularly review our deferred tax assets for realizability, taking into consideration all available evidence, both positive and negative, including historical pre-tax and taxable income, projected future pre-tax and taxable income, and the expected timing of the reversals of existing temporary differences. In arriving at these judgments, the weight given to the potential effect of all positive and negative evidence is commensurate with the extent to which it can be objectively verified.
We have made our best estimates of certain income tax amounts included in the combined financial statements. Application of our accounting policies and estimates, however, involves the exercise of judgment and use of assumptions as to future uncertainties and, as a result, actual results could differ from these estimates. In arriving at our estimates, factors we consider include how accurate the estimate or assumptions have been in the past, how much the estimate or assumptions have changed, and how reasonably likely such change may have a material impact.
Contingencies
We are involved in conditions, situations, or circumstances in the ordinary course of business with possible gain or loss contingencies that will ultimately be resolved when one or more future events occur or fail to occur. If some amount within a range of loss appears at the time to be a better estimate than any other amount within the range, that amount will be accrued. When no amount within the range is a better estimate than any other amount, however, the minimum amount in the range will be accrued. We continually evaluate uncertainties associated with loss contingencies and record a charge equal to at least the minimum estimated liability for a loss contingency when both of the following conditions are met: (i) information available prior to issuance of the financial statements indicates that it is probable that an asset had been impaired or a liability had been incurred at the date of the financial statements; and (ii) the loss or range of loss can be reasonably estimated. Legal costs are expensed when incurred. Gain contingencies are not recorded until realized or realizable.
Derivative Financial Instruments
All derivative instruments are recorded on the combined balance sheet at fair value. Derivatives not designated as hedge accounting are reported directly in earnings along with offsetting transaction gains and losses on the items being hedged. The Group held no derivatives designated as hedges during the year ended December 31, 2013. See note 6 for disclosures regarding our derivative financial instruments.
Fair Value Measurements
For cash and cash equivalents, restricted cash, accounts receivable, accounts payable, and accrued liabilities, the carrying amount approximates fair value because of the short-term maturity of the instruments. See note 5 for disclosures related to the fair value of our long-term debt. We apply the provisions of ASC 820, Fair Value Measurement (ASC 820), to our assets and liabilities that we are required to measure at fair value pursuant to other accounting standards, including our derivative financial instruments. See note 9 for disclosures regarding our fair value measurements.
Foreign Currency Transactions
Transaction gains and losses that arise from exchange rate fluctuations on transactions and balances denominated in a currency other than the functional currency are generally included in the results of operations as incurred. Foreign currency transaction losses were £69 during the year ended December 31, 2013.
F-213
Table of Contents
Comprehensive Income
The Group did not have other comprehensive income for the year ended December 31, 2013 or accumulated other comprehensive income as of December 31, 2013. As such, no statement of comprehensive income has been presented herein.
3. PROPERTY AND EQUIPMENT
Property and equipment consists of the following as of December 31, 2013:
| 2013 | ||||
| Solar energy systems |
£ | 30,299 | ||
| Less accumulated depreciation—solar energy systems |
(1,145 | ) | ||
|
|
|
|||
| Property and equipment, net |
£ | 29,154 | ||
|
|
|
|||
Depreciation expense was £1,145 for the year ended December 31, 2013.
The cost of constructing facilities, equipment, and solar energy systems includes interest costs incurred during the asset’s construction period. These costs totaled £88 for the year ended December 31, 2013.
4. ASSET RETIREMENT OBLIGATIONS
Activity in asset retirement obligations for the year ended December 31, 2013 is as follows:
| 2013 | ||||
| Balance at the beginning of the year |
£ | — | ||
| Additional obligation |
208 | |||
| Accretion expense |
— | |||
|
|
|
|||
| Balance at the end of the year |
£ | 208 | ||
|
|
|
|||
5. DEBT
Debt consists of the following as of December 31, 2013:
| Total Principal |
Current | Long- Term |
||||||||||
| Term loan facilities |
£ | 22,367 | £ | 1,596 | £ | 20,771 | ||||||
| VAT facilities |
6,158 | 6,158 | — | |||||||||
|
|
|
|
|
|
|
|||||||
| Total debt outstanding |
£ | 28,525 | £ | 7,754 | £ | 20,771 | ||||||
|
|
|
|
|
|
|
|||||||
On August 7, 2013, Boyton entered into a credit agreement with Bayerische Landesbank (“Bayern LB”), which provided for a term loan facility with a limit of €7,869 and a VAT facility with a limit of £1,800. The term loan facility bears interest at a rate of 3.4% per annum and matures in 2028. At December 31, 2013, the balance outstanding under the term loan facility was €7,778, or £6,493 (€1 = £0.8348). The VAT facility bears interest at a variable rate of LIBOR plus an applicable margin of 2% and matures on June 30, 2014. At December 31, 2013, the variable rate on the VAT facility was 2.5% and the amount outstanding was £1,800.
On October 4, 2013, SPV 24 entered into a facility agreement with Bayern LB, which provided for a term loan facility with a limit of €8,333 and a VAT facility with a limit of £2,056. The term loan facility bears interest at a rate of 3.4% per annum and matures in 2028. At December 31, 2013, the balance outstanding
F-214
Table of Contents
under the term loan facility was €7,500, or £6,261 (€1 = £0.8348). The VAT facility bears interest at a variable rate of LIBOR plus an applicable margin of 2% and matures on June 30, 2014. At December 31, 2013, the variable rate on the VAT facility was 2.5% and the amount outstanding was £2,057.
On December 5, 2013, Sunsave 6 entered into a facility agreement with Bayern LB, which provided for a term loan facility with a limit of €11,515 and a VAT facility with a limit of £2,301. The term loan facility bears interest at a rate of 3.4% per annum and matures in 2028. At December 31, 2013, the balance outstanding under the term loan facility was €11,515, or £9,613 (€1 = £0.8348). The VAT facility bears interest at a variable rate of LIBOR plus an applicable margin of 2% and matures on June 30, 2014. At December 31, 2013, the variable rate on the VAT facility was 2.5% and the amount outstanding was £2,301.
The facility agreements with Bayern LB, include certain financial covenants, including required minimum debt service reserve levels. At December 31, 2013, the Group was not in compliance with the required minimum debt service reserve levels in regards to the Boyton and Sunsave 6 entities. A waiver for non-compliance was obtained from the bank.
The Group entered into three cross-currency swap agreements with Bayern LB to hedge the foreign currency risk posed by the term loan facilities, which are denominated in euros (€). See note 6 for disclosures related to the accounting for these cross currency swap agreements.
The estimated fair value of our outstanding debt obligations was £27,818 at December 31, 2013. The fair value of our debt is calculated based on expected future cash flows discounted at market interest rates with consideration for non-performance risk or current interest rates for similar instruments.
Maturities
The aggregate amounts of payments on long-term debt due after December 31, 2013 are as follows:
| 2014 | 2015 | 2016 | 2017 | 2018 | Thereafter | Total | ||||||||||||||||||||||
| Maturities of long-term debt |
£ | 7,754 | £ | 1,596 | £ | 1,596 | £ | 1,596 | £ | 1,596 | £ | 14,387 | £ | 28,525 | ||||||||||||||
6. DERIVATIVES
At December 31, 2013, the Group’s hedging activity consists of the following:
| Derivatives not designated as hedging: |
Balance Sheet Classification |
Assets (Liabilities) Fair Value |
||||
| Cross-currency swaps |
Prepaid expenses and other current assets | £ | 59 | |||
| Cross-currency swaps |
Accounts payable and other current liabilities | (257 | ) | |||
| Derivatives not designated as hedging: |
Statement of Operations Classification |
Losses | ||||
| Cross-currency swaps |
Other, net | £ | 198 | |||
As of December 31, 2013, we are party to three cross-currency swap instruments that are accounted for as economic hedges to the foreign currency risk posed by the term loan facilities, which are denominated in euros (€). The combined notional value of the three instruments at December 31, 2013 was £23,598. The amounts recorded to the combined balance sheet, as provided in the table above, represent the fair value of the net amount that would settle on the balance sheet date if the swaps were transferred to other third parties or canceled by the Group. Because these hedges are deemed economic hedges and not accounted for under hedge accounting, the changes in fair value
F-215
Table of Contents
are recorded to other, net within the combined statement of operations. There were no cash inflows or outflows during the year ended December 31, 2013 related to these hedges. The losses above are reflected within gain on foreign currency exchange as an adjustment to reconcile net loss to net cash used in operating activities in the combined statement of cash flows.
7. INCOME TAXES
Income tax expense consists of the following:
| Current | Deferred | Total | ||||||||||
| Year ended December 31, 2013 |
||||||||||||
| Taxation |
£ | — | £ | 34 | £ | 34 | ||||||
Effective Tax Rate
The income tax provision for the year ended December 31, 2013 differed from the amounts computed by applying the standard rate of corporation tax in the UK of 23.25% as identified in the following table
| 2013 | ||||
| Income tax at Corporation rate |
23.25 | % | ||
| Increase (reduction) in income taxes: |
||||
| Capital allowances in excess of depreciation |
(32.2 | ) | ||
| Unrelieved losses |
2.3 | |||
| Other |
2.5 | |||
|
|
|
|||
| Effective tax rate |
(4.2 | )% | ||
|
|
|
|||
Deferred Taxes
Deferred income taxes for the Group’s taxable project entities reflect the tax effects of temporary differences between the carrying amounts of assets and liabilities for financial reporting purposes and the amounts used for income tax purposes. Significant components of the Group’s deferred tax assets and liabilities at December 31, 2013 are as follows:
| 2013 | ||||
| Deferred tax liabilities: |
||||
| Solar energy systems |
£ | 207 | ||
| Deferred tax assets: |
||||
| Net operating loss carryforwards |
254 | |||
| Valuation allowance |
(81 | ) | ||
|
|
|
|||
| Total deferred tax assets |
173 | |||
|
|
|
|||
| Net long-term deferred tax liabilities |
£ | 34 | ||
|
|
|
|||
In assessing the realization of deferred tax assets, management considers whether it is more likely than not that some portion or all of the deferred tax assets will not be realized. The ultimate realization of deferred tax assets is dependent upon the scheduled reversal of deferred tax liabilities and generation of future taxable income during the periods in which the deferred tax assets become deductible. During the year ended December 31, 2013, a valuation allowance was recognized on net operating losses for project entities that have current year losses and no history of earnings, as there is insufficient evidence to suggest there will be sufficient taxable income during the periods in which
F-216
Table of Contents
certain of the temporary differences become deductible. The operating loss carryforward period is indefinite, subject to certain conditions. The change during the year ended December 31, 2013 in the total valuation allowance was £81.
As of December 31, 2013, the Group did not have any unrecognized tax benefits or uncertain tax positions.
8. RELATED PARTIES
Shareholder Loans
ib Vogt
ib Vogt is a related party as it holds 50% of the ordinary share capital of each of the project entities comprising the Group. At December 31, 2013, the Group had outstanding shareholder loans payable to ib Vogt totaling £4,881. The loans from ib Vogt have no fixed repayment date, are unsecured, and bear no interest. The loans are classified as current liabilities in the combined balance sheet as they can be required to be repaid upon notification from ib Vogt.
At December 31, 2013, the Group had outstanding shareholder loans receivable from ib Vogt totaling £4,120. These loans mature on March 31, 2014 and can be extended thereafter for one year if they are not expressly terminated by either party.
ViMAP
ViMAP GmbH (“ViMAP”) is a related party as it holds 50% of the ordinary share capital of two of the project entities comprising the Group (Boyton and SPV 24). At December 31, 2013, the Group had outstanding shareholder loans payable to ViMAP totaling £3,311. The loans from ViMAP have no fixed repayment date, are unsecured, and bear no interest. The loans are classified as current liabilities in the combined balance sheet as they can be required to be repaid upon notification from ViMAP.
St. Nicholas Court
St. Nicholas Court Farms Limited (“St. Nicholas Court”) is a related party as it holds 50% of the ordinary share capital of one of the project entities comprising the Group (Sunsave 6). At December 31, 2013, the Group had an outstanding shareholder loan payable to St. Nicholas Court totaling £1,569. The loan from St. Nicholas Court has no fixed repayment date, is unsecured, and bears no interest. The loans are classified as current liabilities in the combined balance sheet as they can be required to be repaid upon notification from St. Nicholas Court.
Purchases
During the year ended December 31, 2013, the Group purchased a total of £21,687 and £1,078 in respect of project rights, services, solar panels, grid connection and other associated plant and machinery pursuant to Engineering, Procurement and Construction (“EPC”) contracts with ib Vogt and St. Nicholas Court, respectively, for the construction of the Group’s solar energy facilities. At December 31, 2013, a balance of £961 remained outstanding and is reflected in due to related parties in the combined balance sheet.
Operations and Maintenance
Operations and maintenance services are solely provided to the Group by an affiliate of ib Vogt pursuant to contractual agreements. Costs incurred for these services were £131 for the year ended December 31, 2013, and were reported as cost of operations—affiliates in the combined statement of operations. No balance remains outstanding at December 31, 2013.
F-217
Table of Contents
9. FAIR VALUE MEASUREMENTS
We perform fair value measurements in accordance with ASC 820. ASC 820 defines fair value as the price that would be received from selling an asset or paid to transfer a liability in an orderly transaction between market participants at the measurement date. When determining the fair value measurements for assets and liabilities required to be recorded at their fair values, we consider the principal or most advantageous market in which we would transact and consider assumptions that market participants would use when pricing the assets or liabilities, such as inherent risk, transfer restrictions and risk of nonperformance.
ASC 820 establishes a fair value hierarchy that requires an entity to maximize the use of observable inputs and minimize the use of unobservable inputs when measuring fair value. An asset’s or a liability’s categorization within the fair value hierarchy is based upon the lowest level of input that is significant to the fair value measurement. ASC 820 establishes three levels of inputs that may be used to measure fair value:
| • | Level 1: quoted prices in active markets for identical assets or liabilities; |
| • | Level 2: inputs other than Level 1 that are observable, either directly or indirectly, such as quoted prices in active markets for similar assets or liabilities, quoted prices for identical or similar assets or liabilities in markets that are not active, or other inputs that are observable or can be corroborated by observable market data for substantially the full term of the assets or liabilities; or |
| • | Level 3: unobservable inputs that are supported by little or no market activity and that are significant to the fair values of the assets or liabilities. |
The following table summarizes the financial instruments measured at fair value on a recurring basis classified in the fair value hierarchy (Level 1, 2 or 3) based on the inputs used for valuation in the accompanying combined balance sheet:
| As of December 31, 2013 | ||||||||||||
| Assets (Liabilities) | Level 1 | Level 2 | Level 3 | |||||||||
| Cross-currency swaps |
£ | — | £ | 59 | £ | — | ||||||
| Cross-currency swaps |
— | (257 | ) | — | ||||||||
|
|
|
|
|
|
|
|||||||
| Total |
£ | — | £ | (198 | ) | £ | — | |||||
|
|
|
|
|
|
|
|||||||
The Group’s cross-currency swaps are classified as Level 2 since all significant inputs are observable and do not require management judgment. There were no transfers between Level 1, Level 2 and Level 3 financial instruments during the year ended December 31, 2013.
10. COMMITMENTS AND CONTINGENCIES
From time to time, we are notified of possible claims or assessments arising in the normal course of business operations. Management continually evaluates such matters with legal counsel and believes that, although the ultimate outcome is not presently determinable, these matters will not result in a material adverse impact on our financial position or operations.
F-218
Table of Contents
Operating Leases
The Group is obligated under certain long-term noncancelable operating leases related to land for its solar energy systems. Certain of these lease agreements contain renewal options. Below is a summary of the Group’s future minimum lease commitments as of December 31, 2013:
| 2014 | 2015 | 2016 | 2017 | 2018 | Thereafter | Total | ||||||||||||||||||||||
| Land leases |
£ | 127 | £ | 127 | £ | 127 | £ | 127 | £ | 127 | $ | 2,239 | £ | 2,874 | ||||||||||||||
11. SUBSEQUENT EVENTS
On May 21, 2014, 100% of the ordinary share capital of the project entities that comprise the Group were sold to an affiliate of TerraForm Power, Inc.
For the combined financial statements as of and for the year ended December 31, 2013, we have evaluated subsequent events through July 3, 2014, the date the combined financial statements were available to be issued.
F-219
Table of Contents
Report of Independent Auditors
Member
Imperial Valley Solar 1 Holdings II, LLC
We have audited the accompanying financial statements of Imperial Valley Solar 1 Holdings II, LLC and Subsidiaries, which comprise the consolidated balance sheets as of December 31, 2013 and 2012, and the related consolidated statements of operations, changes in member’s equity, and cash flows for the year ended December 31, 2013 and the period from September 24, 2012 (Date of Inception) to December 31, 2012, and the related notes to the consolidated financial statements.
Management’s Responsibility for the Financial Statements
Management is responsible for the preparation and fair presentation of these financial statements in conformity with U.S. generally accepted accounting principles; this includes the design, implementation, and maintenance of internal control relevant to the preparation and fair presentation of financial statements that are free of material misstatement, whether due to fraud or error.
Auditor’s Responsibility
Our responsibility is to express an opinion on these financial statements based on our audits. We conducted our audits in accordance with auditing standards generally accepted in the United States. Those standards require that we plan and perform the audit to obtain reasonable assurance about whether the financial statements are free of material misstatement.
An audit involves performing procedures to obtain audit evidence about the amounts and disclosures in the financial statements. The procedures selected depend on the auditor’s judgment, including the assessment of the risks of material misstatement of the financial statements, whether due to fraud or error. In making those risk assessments, the auditor considers internal control relevant to the entity’s preparation and fair presentation of the financial statements in order to design audit procedures that are appropriate in the circumstances, but not for the purpose of expressing an opinion on the effectiveness of the entity’s internal control. Accordingly, we express no such opinion. An audit also includes evaluating the appropriateness of accounting policies used and the reasonableness of significant accounting estimates made by management, as well as evaluating the overall presentation of the financial statements.
We believe that the audit evidence we have obtained is sufficient and appropriate to provide a basis for our audit opinion.
Opinion
In our opinion, the financial statements referred to above present fairly, in all material respects, the consolidated financial position of Imperial Valley Solar 1 Holdings II, LLC and Subsidiaries at December 31, 2013 and 2012, and the results of its operations and its cash flows for the year ended December 31, 2013 and the period from September 24, 2012 (Date of Inception) to December 31, 2012 in conformity with U.S. generally accepted accounting principles.
/s/ Ernst & Young LLP
McLean, Virginia
June 13, 2014
F-220
Table of Contents
Imperial Valley Solar 1 Holdings II, LLC and Subsidiaries
Consolidated Balance Sheets
(In Thousands of U.S. Dollars)
| December 31, | ||||||||
| 2013 | 2012 | |||||||
| Assets |
||||||||
| Current assets: |
||||||||
| Cash and cash equivalents |
$ | 2,481 | $ | 927 | ||||
| Accounts receivable |
2,871 | — | ||||||
| Cash grant receivable |
111,933 | — | ||||||
| Prepaid expenses |
802 | 1,810 | ||||||
| Other current assets |
1,638 | 50 | ||||||
|
|
|
|
|
|||||
| Total current assets |
119,725 | 2,787 | ||||||
|
|
|
|
|
|||||
| Noncurrent assets: |
||||||||
| Restricted cash |
510 | 436,501 | ||||||
| Property, plant and equipment, net of accumulated depreciation of $1,943 and $0, respectively |
522,015 | 9,206 | ||||||
| Construction in progress |
126,073 | 140,633 | ||||||
| Intangible assets, net of amortization of $82 and $0, respectively |
34,547 | 34,464 | ||||||
| Deferred financing costs, net of accumulated amortization of $1,826 and $382, respectively |
1,375 | 1,471 | ||||||
| Long-term prepaid |
2,929 | 14,935 | ||||||
| Other noncurrent assets |
— | 186 | ||||||
|
|
|
|
|
|||||
| Total noncurrent assets |
687,449 | 637,396 | ||||||
|
|
|
|
|
|||||
| Total assets |
$ | 807,174 | $ | 640,183 | ||||
|
|
|
|
|
|||||
| Liabilities and member’s equity |
||||||||
| Liabilities: |
||||||||
| Current liabilities: |
||||||||
| Accounts payable |
$ | 1,081 | $ | 16,213 | ||||
| Accounts payable – related parties |
8,586 | 699 | ||||||
| Accrued expenses |
81,790 | 1,524 | ||||||
| Current portion of long-term debt, net of unamortized discount of $5,861 and $0, respectively |
98,699 | — | ||||||
|
|
|
|
|
|||||
| Total current liabilities |
190,156 | 18,436 | ||||||
|
|
|
|
|
|||||
| Noncurrent liabilities: |
||||||||
| Long-term debt, net of unamortized discount of $1,134 and $1,237, respectively |
401,306 | 414,463 | ||||||
| Asset retirement obligation |
2,333 | — | ||||||
|
|
|
|
|
|||||
| Total noncurrent liabilities |
403,639 | 414,463 | ||||||
|
|
|
|
|
|||||
| Member’s equity: |
||||||||
| Contributed capital |
222,789 | 209,734 | ||||||
| Accumulated deficit |
(17,209 | ) | (2,450 | ) | ||||
| Noncontrolling interest |
7,799 | — | ||||||
|
|
|
|
|
|||||
| Total member’s equity |
213,379 | 207,284 | ||||||
|
|
|
|
|
|||||
| Total liabilities and member’s equity |
$ | 807,174 | $ | 640,183 | ||||
|
|
|
|
|
|||||
See accompanying notes.
F-221
Table of Contents
Imperial Valley Solar 1 Holdings II, LLC and Subsidiaries
Consolidated Statements of Operations
(In Thousands of U.S. Dollars)
| Year Ended December 31, 2013 |
Period from September 24, 2012 (Date of Inception) to December 31, 2012 |
|||||||
| Revenues |
$ | 1,777 | $ | — | ||||
| Cost of revenues, including depreciation of $1,919 and $0, respectively, amortization of $82 and $0, respectively, and accretion of $11 and $0, respectively |
(2,548 | ) | — | |||||
|
|
|
|
|
|||||
| Gross loss |
(771 | ) | — | |||||
|
|
|
|
|
|||||
| Operating expenses: |
||||||||
| General and administrative expenses |
(1,209 | ) | (2,133 | ) | ||||
|
|
|
|
|
|||||
| Total operating expenses |
(1,209 | ) | (2,133 | ) | ||||
|
|
|
|
|
|||||
| Loss from continued operations |
(1,980 | ) | (2,133 | ) | ||||
|
|
|
|
|
|||||
| Interest income |
175 | 54 | ||||||
| Interest expense |
(8,526 | ) | (371 | ) | ||||
| Other non-operating loss |
(3 | ) | — | |||||
|
|
|
|
|
|||||
| Net loss |
$ | (10,334 | ) | $ | (2,450 | ) | ||
|
|
|
|
|
|||||
| Less: income attributable to noncontrolling interests |
4,425 | — | ||||||
|
|
|
|
|
|||||
| Net loss attributable to Imperial Valley Solar 1 Holdings II |
(14,759 | ) | (2,450 | ) | ||||
|
|
|
|
|
|||||
See accompanying notes.
F-222
Table of Contents
Imperial Valley Solar 1 Holdings II, LLC and Subsidiaries
Consolidated Statements of Changes in Member’s Equity
(In Thousands of U.S. Dollars)
| Contributed Capital |
Accumulated Deficit |
Noncontrolling Interest |
Total Member’s Equity |
|||||||||||||
| September 24, 2012 (Date of Inception) |
$ | — | $ | — | $ | — | $ | — | ||||||||
| Capital contributions from member, net of cost of $0 |
— | (2,450 | ) | — | (2,450 | ) | ||||||||||
| Net loss |
209,734 | — | — | 209,734 | ||||||||||||
|
|
|
|
|
|
|
|
|
|||||||||
| Balance at December 31, 2012 |
209,734 | (2,450 | ) | — | 207,284 | |||||||||||
| Net (loss) income |
— | (14,759 | ) | 4,425 | (10,334 | ) | ||||||||||
| Sales of subsidiary shares to noncontrolling interest, net of cost of $5,626 |
— | — | 3,374 | 3,374 | ||||||||||||
| Capital contributions from member, net of costs of $0 |
22,055 | — | — | 22,055 | ||||||||||||
| Return of capital to member |
(9,000 | ) | — | — | (9,000 | ) | ||||||||||
|
|
|
|
|
|
|
|
|
|||||||||
| Balance at December 31, 2013 |
$ | 222,789 | $ | (17,209 | ) | $ | 7,799 | $ | 213,379 | |||||||
|
|
|
|
|
|
|
|
|
|||||||||
See accompanying notes.
F-223
Table of Contents
Imperial Valley Solar 1 Holdings II, LLC and Subsidiaries
Consolidated Statements of Cash Flows
(In Thousands of U.S. Dollars)
| Year Ended December 31, 2013 |
Period from September 24 (Date of Inception) to December 31, 2012 |
|||||||
| Operating activities |
||||||||
| Net loss |
$ | (10,334 | ) | $ | (2,450 | ) | ||
| Adjustments to reconcile net loss to net cash used in operating activities: |
||||||||
| Depreciation |
1,919 | — | ||||||
| Accretion on asset retirement obligation |
11 | — | ||||||
| Amortization of financing costs |
4,975 | — | ||||||
| Amortization of intangible assets |
82 | — | ||||||
| Changes in operating assets and liabilities: |
||||||||
| Accounts receivable |
(1,777 | ) | — | |||||
| Prepaid expenses |
(206 | ) | 105 | |||||
| Other noncurrent assets |
(431 | ) | (66 | ) | ||||
| Accounts payable |
(2 | ) | 303 | |||||
| Accounts payable and accrued expenses – related parties |
2,296 | (1,702 | ) | |||||
| Accrued expenses |
(282 | ) | — | |||||
|
|
|
|
|
|||||
| Net cash used in operating activities |
(3,749 | ) | (3,810 | ) | ||||
|
|
|
|
|
|||||
| Investing activities |
||||||||
| Decrease (increase) in restricted cash |
435,991 | (436,501 | ) | |||||
| Capital expenditures |
(515,815 | ) | (54,197 | ) | ||||
| Purchase of other intangibles |
— | (12,000 | ) | |||||
|
|
|
|
|
|||||
| Net cash used in investing activities |
(79,824 | ) | (502,698 | ) | ||||
|
|
|
|
|
|||||
| Financing activities |
||||||||
| Proceeds from project financing |
91,300 | 415,700 | ||||||
| Proceeds from equity contributions |
4,712 | 108,956 | ||||||
| Financed capital expenditures |
(10,406 | ) | — | |||||
| Financing fees |
(479 | ) | (17,221 | ) | ||||
|
|
|
|
|
|||||
| Net cash provided by financing activities |
85,127 | 507,435 | ||||||
|
|
|
|
|
|||||
| Total change in cash and cash equivalents |
1,554 | 927 | ||||||
| Cash and cash equivalents, beginning of period |
927 | — | ||||||
|
|
|
|
|
|||||
| Cash and cash equivalents, end of period |
$ | 2,481 | $ | 927 | ||||
|
|
|
|
|
|||||
| Supplemental disclosures |
||||||||
| Interest paid, net of amount capitalized |
$ | 6,046 | $ | — | ||||
| Noncash increases (decreases) to property, plant and equipment and construction in progress: |
||||||||
| Amortization of prepaid expenses |
$ | 1,451 | $ | 1,334 | ||||
| Amortization of financing costs |
$ | 465 | $ | 733 | ||||
| Accounts payable and accrued expenses |
$ | 65,934 | $ | 14,096 | ||||
| Asset retirement obligation |
$ | 2,322 | $ | — | ||||
| Other non cash investing and financing activities: |
||||||||
| Cash grant receivable |
$ | (111,933 | ) | $ | — | |||
| Capital contribution of capitalized assets from Power |
$ | 17,343 | $ | 100,779 | ||||
| Capital contribution from noncontrolling interest |
$ | 9,000 | $ | — | ||||
| Return of capital to member |
$ | (9,000 | ) | $ | — | |||
| Financing fees paid by related party |
$ | (5,626 | ) | $ | — | |||
See accompanying notes.
F-224
Table of Contents
Imperial Valley Solar 1 Holdings II, LLC and Subsidiaries
Notes to the Consolidated Financial Statements
(In Thousands of U.S. Dollars)
December 31, 2013 and period from September 24, 2012 (Date of Inception) to December 31, 2012
1. Summary of Significant Accounting Policies
Nature of Business
Imperial Valley Solar 1 Holdings II, LLC (IVS 1 Holdings II) is a holding company that through its subsidiaries (collectively, the Company), was formed for the purpose of developing, constructing, owning and operating a utility-scale photovoltaic solar energy project with a capacity of 266 megawatts (MW) located in Calexico, California, United States, known as Mount Signal Solar (MSS).
IVS 1 Holdings II, is wholly owned by SRP Power, LLC (Member), which is ultimately owned by Silver Ridge Power, LLC (SRP). SRP is a joint venture of The AES Corporation (AES Corp), and Riverstone/Carlyle Renewable Energy Partners II, LP (Riverstone). AES Corp and Riverstone are the ultimate controlling parties of the Company as they exercise joint control over SRP.
IVS 1 Holdings II was formed on September 24, 2012 at which point SRP Power, LLC contributed its existing equity interests in Imperial Valley Solar 1 Holdings, LLC (a subsidiary in which it held a controlling financial interest) to IVS 1 Holdings II, in exchange for equity interests in IVS 1 Holdings II. As a result, IVS 1 Holdings II became the owner of Imperial Valley Solar 1, LLC, an entity formed on April 9, 2012 for the purpose of developing, constructing, owning and operating the Mount Signal Solar (MSS) project.
The commercial operation of MSS is recognized in three phases: initial phase of 139 MW (Phase I), the second phase of 72.91 MW (Phase II), and the last phase of 54 MW (Phase III). Phase I and II of MSS were placed into service on November 22, 2013 and December 20, 2013, respectively. Phase III was still in construction at December 31, 2013 and was placed in service on March 4, 2014.
Basis of Preparation
The consolidated financial statements of the Company have been prepared in accordance with U.S. generally accepted accounting principles (U.S. GAAP) as issued by the Financial Accounting Standards Board (FASB) and include all the accounts of the Company.
The consolidated financial statements are presented in U.S. Dollars and all values are rounded to the nearest thousand ($000), except when otherwise indicated.
Principles of Consolidation
Subsidiaries are fully consolidated from the date of their acquisition, being the date on which the Company obtains control, and continue to be consolidated until the date when such control ceases. The financial statements of the subsidiaries are prepared for the same reporting period as the parent company, using consistent accounting policies. Investments in which the Company does not have control but has the ability to exercise significant influence are accounted for using the equity method of accounting. All intercompany balances, transactions, unrealized gains and losses resulting from intercompany transactions are eliminated in the accompanying consolidated financial statements.
F-225
Table of Contents
Imperial Valley Solar 1 Holdings II, LLC and Subsidiaries
Notes to the Consolidated Financial Statements (continued)
(In Thousands of U.S. Dollars)
The accompanying consolidated financial statements include the accounts and results of operations of IVS 1 Holdings II, its wholly owned subsidiaries and those entities in which the company has a controlling financial interest and which are required to be consolidated under applicable accounting standards. The usual condition for a controlling financial interest is ownership of a majority of the voting interests of an entity; however, a controlling financial interest may also exist in entities such as variable interest entities (VIEs), through arrangements that do not involve controlling voting interests.
A VIE is an entity (i) that has a total equity investment at risk that is not sufficient to finance its activities without additional subordinated financial support or (ii) where the group of equity holders does not have (a) the ability to make significant decisions about the entity’s activities, (b) the obligation to absorb the entity’s expected losses or (c) the right to receive the entity’s expected residual returns; or (iii) where the voting rights of some equity holders are not proportional to their obligations to absorb expected losses, receive expected residual returns, or both, and substantially all of the entity’s activities either involve or are conducted on behalf of an investor that has disproportionately few voting rights.
The determination of which party has the power to direct the activities that most significantly impact the economic performance of the VIE could require significant judgment and assumptions. That determination considers the purpose and design of the business, the risks that the business was designed to create and pass along to other entities, the activities of the business that can be directed and which party can direct them, and the expected relative impact of the activities on the economic performance of the business throughout its life.
The company has no VIEs.
Use of Estimates
The preparation of financial statements in conformity with U.S. GAAP requires the Company to make estimates and assumptions that affect amounts reported in the accompanying consolidated financial statements and notes. Actual results could differ from those estimates. The Company’s significant estimates include the carrying amount and the estimated useful lives of its long-lived assets; the fair value of financial instruments.
Concentration of Credit Risk
The Company is exposed to concentrations of credit risk primarily related to cash and cash equivalents and restricted cash. The Company mitigates its exposure to credit risk by maintaining deposits at highly rated financial institutions and by monitoring the credit quality of the related financial institution and counterparties of the Company’s contracts.
The Company’s operations are concentrated within the United States, and any changes to government policies for renewable energy, including revisions or changes to renewable energy tax legislation, could have a negative effect on the Company’s activities, financial condition, and results of operations.
Cash and Cash Equivalents
The Company considers unrestricted cash on hand and deposits in banks to be cash and cash equivalents; such balances approximate fair value at December 31, 2013 and 2012. The Company has $2,481 and $927 cash and cash equivalents as of December 31, 2013 and 2012, respectively.
F-226
Table of Contents
Imperial Valley Solar 1 Holdings II, LLC and Subsidiaries
Notes to the Consolidated Financial Statements (continued)
(In Thousands of U.S. Dollars)
Restricted Cash
Restricted cash includes cash and cash equivalents that are restricted as to withdrawal or usage. The nature of restriction includes restrictions imposed by the financing agreement, power purchase agreement and debt service reserve. The construction disbursement account receives the proceeds of all construction loans and makes disbursements for the payment of construction costs.
Accounts Receivable and Allowance for Doubtful Accounts
The Company reviews its accounts receivable for collectibility and records an allowance for doubtful accounts for estimated uncollectible accounts receivable. Accounts receivable are written off when they are no longer deemed collectible. Write-offs would be deducted from the allowance and subsequent recoveries would be added. The allowance is based on the Company’s assessment of known delinquent accounts, historical experience and other currently available evidence of the collectibility and the aging of accounts receivable. The underlying assumptions, estimates and assessments the Company uses to provide for losses are updated to reflect the Company’s view of current conditions. Changes in such estimates could significantly affect the allowance for losses. It is possible the Company will experience credit losses that are different from the Company’s current estimates. Based on the Company’s assessment performed at December 31, 2013, no allowance for doubtful accounts was necessary. The Company had no accounts receivable at December 31, 2012.
Income Taxes
The Company and its subsidiaries are limited liability companies treated as partnerships and single-member disregarded entities for U.S. income tax purposes. As such, U.S. federal and state income taxes are generally not recognized at the entity level but instead, income is taxed at the owner-member level. Accordingly, the Company and its subsidiaries do not have liabilities for U.S. federal or state taxes and, therefore, no current income taxes or deferred income taxes are reflected in these financial statements.
Noncontrolling Interest
Mount Signal Tax Equity Financing
On August 15, 2013, Imperial Valley Solar 1 Holdings, LLC (IVS1 Holdings), a subsidiary of the Company, entered into an arrangement that admitted a noncontrolling shareholder as a partner (tax equity investor) in the MSS Project, and received net proceeds of $9,000 on October 9, 2013 in return. IVS1 Holdings will receive an additional estimated $94,000 (Cash Grant Capital Contribution) upon satisfaction of a set of conditions precedent to this contribution. Under the terms of the arrangement, the tax equity investor will receive disproportionate returns on its investment of the profit or loss, and will share in the cash distributions from MSS. The preferential return period continues until the tax equity investor recovers its investment and achieves a cumulative after-tax return of 20%.
IVS1 Holdings currently estimates the preferential return period to end on December 31, 2023. The length of the preferential return period is dependent upon estimated future cash flows as well as projected tax benefits. At the end of the preferential return period, IVS1 Holdings will continue to share in the profit or loss and in the cash distributions at rates pursuant to the agreement with the tax equity investor. During and beyond the preferential return period, IVS1 Holdings retains a class of membership interests which provide it with day-to-day operational and management control of MSS. However, certain decisions require the approval of the tax equity investor.
F-227
Table of Contents
Imperial Valley Solar 1 Holdings II, LLC and Subsidiaries
Notes to the Consolidated Financial Statements (continued)
(In Thousands of U.S. Dollars)
Under the IVS1 Holdings tax equity structure, the Company is the managing member and responsible for the management of MSS. The tax equity member is viewed as a passive investor in MSS, although it is afforded certain rights related to major decisions. As the managing member, the Company is responsible for day-to-day operating decisions related to MSS and for preparing the annual operating and capital expenditure budgets. If a proposed operating budget exceeds the prior year’s budget by a certain percentage, the tax equity member has the right to veto the variation from budget. The tax equity member is also provided other customary protective rights.
Noncontrolling interests are classified as a separate component of equity in the consolidated balance sheets and consolidated statements of changes in equity. Additionally, net income and comprehensive income attributable to noncontrolling interests are reflected separately from consolidated net income and comprehensive income in the consolidated statements of operations and consolidated statements of changes in equity. Any change in ownership of a subsidiary while the controlling financial interest is retained is accounted for as an equity transaction between the controlling and noncontrolling interests. Losses continue to be attributed to the noncontrolling interests, even when the noncontrolling interests’ basis has been reduced to zero.
We determine the net income (loss) attributable to the controlling partner by deducting from net income (loss) the amount of net income (loss) attributable to the noncontrolling interest. The net income (loss) attributable to the noncontrolling interest represents the tax equity investors’ allocable share in the results of the MSS project. We have determined that the provisions in the Tax Equity Finance Arrangement represent a substantive profit sharing arrangement. We have further determined that the appropriate methodology for calculating the noncontrolling interest balance that reflects the substantive profit sharing arrangement is a balance sheet approach using the Hypothetical Liquidation at Book Value method, or HLBV method. We therefore use the HLBV method to determine the share of the results of the MSS Project attributable to the tax equity investor, which we record in our consolidated balance sheets as noncontrolling interest. The HLBV method determines the tax equity investor’s allocable share of the results of the MSS Project by calculating the net change in the tax equity investor’s share in the consolidated net assets of the MSS Project at the beginning and end of the period after adjusting for any transactions between the MSS Project and the MSS Project investors, such as capital contributions or cash distributions.
Property, Plant and Equipment
Property, plant and equipment (PPE) is stated at cost, net of accumulated depreciation and/or accumulated impairment losses, if any. Such costs include the costs of replacing component parts of the PPE and borrowing costs for long-term construction projects if the recognition criteria are met.
Land option payments are reclassified to PPE once the option is exercised. All other pre-development project costs are expensed during the pre-development sub-phase. Once the pre-development sub-phase is completed, a solar project advances to the development sub-phase, financing, engineering and construction phases. Costs incurred in these phases are capitalized as incurred and presented as Construction in progress (CIP). Payments for engineering costs, insurance costs, salaries, interest and other costs directly relating to CIP are capitalized during the construction period provided the completion of the project is deemed probable, or expensed at the time the Company determines that development of a particular project is no longer probable.
F-228
Table of Contents
Imperial Valley Solar 1 Holdings II, LLC and Subsidiaries
Notes to the Consolidated Financial Statements (continued)
(In Thousands of U.S. Dollars)
The continued capitalization of such costs was subject to ongoing risks related to successful completion, including those related to government approvals, siting, financing, constructing, permitting and contract compliance. Revenues earned before a project is placed in service are recorded as a reduction to the related project’s cost. Once a project is placed in service, all accumulated costs are reclassified from CIP to PPE, and become subject to depreciation or amortization. For the year ended December 31, 2013, the Company recorded $3,147 of revenues before project phases were placed in service. For the period from September 24, 2012 (Date of Inception) to December 31, 2012, the Company did not earn any revenue.
Many of the Company’s construction and equipment procurement agreements contain damage clauses relating to construction delays and contractually specified performance targets. These clauses are negotiated to cover lost margin or revenues from the Solar Projects in the event of nonperformance. Liquidated damages are those payments received from contractors that are related to a failure to meet contractually specified performance targets or completion dates prior to commercial operations and are recorded as a reduction to the cost of Solar Projects.
Assets related to the generation of energy are generally placed in service when the power plant is electrically and mechanically complete and is able to operate safely. The Company generally considers this milestone achieved when (i) the following items are completed: (a) inverters are calibrated and operating in accordance with manufacturing specifications, (b) isolation testing has been successfully completed, (c) generation equipment has been tested in accordance with manufacturer specifications, (d) preliminary load testing has been successfully completed and (e) electrical protection checking has been successfully completed and (ii) the plant is connected to the electrical grid. For large plants which may be commissioned in sections, a power plant may be placed in service in stages. Any shared assets will be placed in service when the first portion is placed in service.
Land owned by the Company is not depreciated. Land has an unlimited useful life. The Company’s depreciation of PPE is computed using the straight-line method over the estimated useful lives of the assets, which are accounted for on a component basis. At December 31, 2013, the useful lives of the Company’s components are as follows:
| Panels |
25 years | |
| Structures |
25 years | |
| Inverters |
25 years | |
| Transformer |
20-25 years | |
| Other items |
5 years | |
| Leasehold improvements |
Over the lesser of the useful life or the term of the land lease |
Upon Phase I and II of MSS being placed in service during 2013, the depreciation of PPE commenced for each phase.
An item of PPE and any other significant part initially recognized is derecognized upon disposal or when no future economic benefits are expected from its use or disposal. Any gain or loss arising on de-recognition of the asset (calculated as the difference between the net disposal proceeds and the carrying amount of the asset) is included in the Consolidated Statements of Operations when the asset is derecognized. For the periods presented, the Company did not recognize any gain or loss on the derecognition of assets.
F-229
Table of Contents
Imperial Valley Solar 1 Holdings II, LLC and Subsidiaries
Notes to the Consolidated Financial Statements (continued)
(In Thousands of U.S. Dollars)
All repair and maintenance costs that do not meet capitalization criteria are recognized in the Consolidated Statements of Operations as incurred.
The assets’ residual values, useful lives and methods of depreciation are reviewed at each financial year-end and adjusted prospectively, if appropriate.
Capitalized Interest
The Company capitalizes interest on borrowed funds used to finance capital projects. Capitalization is discontinued once a phase of the project is placed in service. The capitalized interest during construction is classified in CIP in the accompanying Consolidated Balance Sheets (see Note 3 – Construction in Progress). Once placed in service, the capitalized interest is classified in PPE in the accompanying Consolidated Balance Sheets (see Note 2 – Property, Plant and Equipment).
Asset Retirement Obligation
In accordance with the accounting standards for asset retirement obligations (AROs), the Company records the fair value of the liability for a legal obligation to retire an asset in the period in which the obligation is incurred if a reasonable estimate of fair value can be made.
When a new liability is recognized, the Company capitalizes the costs of the liability by increasing the carrying amount of the related long-lived asset. The liability is accreted to its present value each period and the capitalized cost is depreciated over the useful life of the related asset. Accretion expense is calculated by applying the effective interest rate to the carrying amount of the liability at the beginning of each period and is included in cost of revenues in the accompanying Consolidated Statements of Operations. The effective interest rate is the credit-adjusted risk-free rate applied when the liability (or portion of the liability) was initially measured and recognized. Changes resulting from revisions to the timing or amount of the original estimates of cash flows are recognized as an increase or a decrease in the asset retirement cost and AROs.
The Company recognized an ARO as of December 31, 2013 related to the MSS project (see Note 12 – Asset Retirement Obligation).
Recoverability of Long-Lived Assets
The Company evaluates the recoverability of its long-lived assets whenever events or changes in circumstances indicate that their carrying amount may not be recoverable. The carrying amount of the Company’s long-lived assets is considered impaired when their anticipated undiscounted cash flows are less than their carrying value. Impairment is measured as the difference between the discounted expected future cash flows and the assets’ carrying amount.
The Company’s long-lived assets are primarily comprised of property, plant and equipment and intangibles.
The Company has not recognized any impairment losses on its long-lived assets for the years ended December 31, 2013 and period from September 24, 2012 (Date of Inception) to December 31, 2012.
F-230
Table of Contents
Imperial Valley Solar 1 Holdings II, LLC and Subsidiaries
Notes to the Consolidated Financial Statements (continued)
(In Thousands of U.S. Dollars)
Financing Costs
Financing costs are deferred and amortized over the related financing period using the effective interest method. The initial fees paid directly to the lenders under the nonrecourse agreement have been classified as debt discount and included in long-term debt on the Consolidated Balance Sheet. The amortization of deferred financing costs and debt discount is included as interest expense in the accompanying Consolidated Statements of Operations unless capitalized as part of PPE (see Note 11 – Long-Term Debt).
Accounts Payable and Accrued Expenses
Accounts payable and accrued expenses consist of accounts due to vendors related to the Company’s operations and construction. The nature of these payables relates to costs for legal, maintenance, spare parts, administrative, and accrued construction and operation costs.
Leases
Leases that meet certain criteria are classified as capital leases, and assets and liabilities are recorded at amounts equal to the lesser of the present value of the minimum lease payments or the fair value of the leased properties at the beginning of the respective lease terms. Leases that do not meet such criteria are classified as operating leases. When the Company is the lessee, related rentals are charged to expense on a straight-line basis. As a lessee, the Company did not have any capital or operating leases as of December 31, 2013 and period from September 24, 2012 (Date of Inception) to December 31, 2012.
The Company is a lessor under the terms of a long-term PPA for the sale of electricity and green credits. The term of the PPA is for 25 years. Under this agreement, the Company will recognize revenue as energy is delivered (see Note 1 – Summary of Significant Accounting Policies – Revenue Recognition).
Fair Value
Fair value, as defined in the fair value measurement accounting guidance, is the price that would be received to sell an asset or paid to transfer a liability in an orderly transaction between market participants at the measurement date, or exit price. The Company follows the fair value measurement accounting guidance for financial assets and liabilities and for nonfinancial assets and liabilities measured on a nonrecurring basis. The fair value measurement accounting guidance requires that the Company make assumptions market participants would use in pricing an asset or liability based on the best information available. Reporting entities are required to consider factors that were not previously measured when determining the fair value of financial instruments. These factors include nonperformance risk and credit risk. The fair value measurement guidance prohibits inclusion of transaction costs and any adjustments for blockage factors in determining the instruments’ fair value. The principal or most advantageous market should be considered from the perspective of the reporting entity.
Fair value, where available, is based on observable quoted market prices. Where observable prices or inputs are not available, several valuation models and techniques are applied. These models and techniques attempt to maximize the use of observable inputs and minimize the use of unobservable inputs. The process involves varying levels of management judgment, the degree of which is dependent on the price transparency of the instruments or market and the instruments’ complexity.
F-231
Table of Contents
Imperial Valley Solar 1 Holdings II, LLC and Subsidiaries
Notes to the Consolidated Financial Statements (continued)
(In Thousands of U.S. Dollars)
To increase consistency and enhance disclosure of the fair value, the fair value measurement accounting guidance creates a fair value hierarchy to prioritize the inputs used to measure fair value into three categories. An asset’s or liability’s level within the fair value hierarchy is based on the lowest level of input significant to the fair value measurement, where Level 1 is the highest and Level 3 is the lowest. The three levels are defined as follows:
| • | Level 1 – Quoted prices in active markets for identical assets or liabilities. |
| • | Level 2 – Observable inputs other than quoted prices included in Level 1, such as quoted prices for similar assets and liabilities in active markets, quoted prices for identical or similar assets and liabilities in markets that are not active, or other inputs that are observable or can be corroborated by observable market data. |
| • | Level 3 – Unobservable inputs that are supported by little or no market activity and that are significant to the fair value of the assets or liabilities. This includes certain pricing models, discounted cash flow methodologies and similar techniques that use significant unobservable inputs. |
Revenue Recognition
The Company is party to a PPA for the sale of electricity and green credits. The PPA has been evaluated and classified as an operating lease with a non-lease element. Thus, the Company recognizes revenue based upon rates specified in the PPA when the electricity is delivered. The Company commenced the recognition of revenue upon Phase I being placed into service on November 22, 2013.
Green credits are renewable energy certificates that are created based on the amount of renewable energy generated and are used to meet renewable energy portfolio standards of a jurisdiction. Pursuant to the accounting standards for revenue recognition, transfer is not considered to have occurred until the customer takes title to the product. The recognition of the sale of green credits is classified as Revenues in the accompanying Consolidated Statements of Operations. All the revenue recognized for the year ended December 31, 2013 was for electricity sales and green credits.
General and Administrative Expenses
General and administrative expenses include corporate and other expenses related to corporate staff functions and initiatives which include executive management, finance and accounting, legal, human resources and information systems.
Cash Grant
The Company recognizes government grants when there is reasonable assurance that both; the entity complied with all the conditions set forth by the respective government, and that the grant will be received. Government grants whose primary condition relates to the purchase, construction or acquisition of long-lived assets are recognized by reducing the asset by the grant amount. (See Note 6 – Cash Grant Receivable.)
F-232
Table of Contents
Imperial Valley Solar 1 Holdings II, LLC and Subsidiaries
Notes to the Consolidated Financial Statements (continued)
(In Thousands of U.S. Dollars)
2. Property, Plant and Equipment
Upon Phase I and II of MSS being placed in service during 2013, the total balance of CIP balance related to these phases as well as shared asset were reclassified to PPE and depreciation commenced.
| December 31, | ||||||||
| 2013 | 2012 | |||||||
| Land |
$ | 9,206 | $ | 9,206 | ||||
| Solar power generation equipment |
512,318 | — | ||||||
| Asset retirement costs |
2,322 | — | ||||||
| Office, furniture and equipment |
112 | — | ||||||
| Less: Accumulated depreciation |
(1,943 | ) | — | |||||
|
|
|
|
|
|||||
| Total property, plant and equipment, net |
$ | 522,015 | $ | 9,206 | ||||
|
|
|
|
|
|||||
Depreciation expense for the year ended December 31, 2013 and period from September 24, 2012 (Date of Inception) to December 31, 2012 was $1,919 and $0, respectively.
PPE reduced by $111,933 during the year ended December 31, 2013 for the amount of the Cash Grant Receivable (refer to Note 6 – Cash Grant Receivable).
All of the PPE was pledged as a security for the Company’s debt as of December 31, 2013 and 2012.
3. Construction in Progress
As of December 31, 2013, the Company had CIP of $126,073 related to the only remaining last phase of the MSS project (54 MW), while Phase I and Phase II of the Company’s solar project MSS were placed into service as of December 31, 2013. As of December 31, 2012, the Company had CIP of $140,633 related to all phases of MSS project. Capitalized costs in CIP included panels, compensation, insurance costs, capitalized interest and overhead costs related to persons directly involved in the development and/or construction of the MSS project.
Interest and certain fees deferred and amortized in connection with the Company’s debt have been capitalized during the period of construction. The Company capitalized interest in the amount of $25,336 and $1,653 during the year ended December 31, 2013 and the period from September 24, 2012 (Date of Inception) to December 31, 2012, respectively.
4. Intangible Assets
The Company has intangible assets of $34,547 and $34,484 as of December 31, 2013 and 2012, respectively. Intangible assets include land control rights, rights to an interconnection agreement, land permits and a power purchase agreement. Amortization expense related to intangible assets subject to amortization was $82 for the year ended December 31, 2013. There was no amortization expense for the year ended December 31, 2012. The following summarizes the estimated amortization expense for the years ended December 31, 2013 through December 31, 2018 and thereafter:
| 2014 | 2015 | 2016 | 2017 | 2018 | Thereafter | Total | ||||||||||||||||||||||
| Amortizable intangibles |
$ | 1,193 | $ | 1,247 | $ | 1,247 | $ | 1,247 | $ | 1,247 | $ | 28,366 | $ | 34,547 | ||||||||||||||
F-233
Table of Contents
Imperial Valley Solar 1 Holdings II, LLC and Subsidiaries
Notes to the Consolidated Financial Statements (continued)
(In Thousands of U.S. Dollars)
The average useful life of intangible assets subject to amortization is 28 years.
5. Cash and Cash Equivalents and Restricted Cash
As of December 31, 2013 and 2012, the Company had cash and cash equivalents of $2,481 and $927, respectively. As of December 31, 2013 and 2012, the Company had restricted cash of $510 and $436,501, respectively. As of December 31, 2013 and 2012, restricted cash was held in a construction disbursement bank account administered by a financial institution on behalf of the Company for the payment of construction costs.
6. Cash Grant Receivable
On December 18, 2013, the Company applied for the cash grant under Section 1603, Payments for Specified Energy Property in Lieu of Tax Credits of the American Reinvestment and Recovery Act of 2009 (Cash Grant) for the Phase I of the MSS project. The Company has concluded that conditions were met on December 18, 2013 for the recognition of the Cash Grant and the Company recognized a Cash Grant receivable of $111,933 with a corresponding reduction of property, plant and equipment. In March 2014, the Company received proceeds related to the Phase I Cash Grant receivable of $105,418. The Company expects to collect the remaining Phase I Cash Grant upon addressing US Treasury’s review questions.
7. Prepayments
Prepayments as of December 31, 2013 and 2012 were $3,731 and $16,745, respectively. As of December 31, 2013 and 2012, $2,929 and $14,935 of the prepayments related to financing costs related to MSS financial close and insurance, which had been recognized as a long-term prepaid because the related debt for these facilities has not yet been drawn. The remaining prepayments related to prepaid plant insurance and other expenses.
8. Accounts Payable
Accounts payable as of December 31, 2013 and 2012 were $1,081 and $16,213, respectively, and related to amounts owed to third parties for construction, operation and maintenance, legal and environmental costs.
9. Accrued Expenses
Accrued expenses as of December 31, 2013 and, 2012 were $81,790 and $1,524, respectively and are predominantly comprised of construction and operation costs not yet invoiced, consulting, audit fees and accrued interest.
10. Member’s Equity
The Company operates under the Operating Limited Liability Agreement (LLC Agreement) dated September 21, 2012. The authorized unit capital of the Company is 10 units.
At the closing of the financing for its MSS project in November 2012, the Company received an equity contribution of $108,955 in cash and an additional non-cash contribution for incurred project costs of $100,779.
F-234
Table of Contents
Imperial Valley Solar 1 Holdings II, LLC and Subsidiaries
Notes to the Consolidated Financial Statements (continued)
(In Thousands of U.S. Dollars)
Non-cash contribution to the Company included project rights and capitalized development and costs related to preparing the asset for its intended use. Project rights include land control rights, rights to an interconnection agreement, a power purchase agreement and land permits.
During 2013, the Company received additional capital contributions of $22,055, of which $4,712 was in cash and $17,343 was in a non-cash contribution for incurred project costs for MSS. In addition, the Company received a capital contribution $9,000 from its noncontrolling interest shareholder. For the year ended December 31, 2013, the Company has returned capital to Member of $9,000.
11. Long-Term Debt
In November 2012, the Company obtained financing for its MSS project. The financing arrangement included $415,700 in secured senior notes (Notes), a $220,000 cash grant bridge loan (CGBL) and a letter of credit facility (LC facility) of $79,640. The Company had fully drawn on the Notes as of December 31, 2012. The Notes are secured by a first priority security interest in the membership interests of the MSS project and all of its assets. The Notes bear interest at 6.00% and are due June 2038. Repayment of the Notes is scheduled to begin in the second half of 2014. The Notes are redeemable at the Company’s option, at par value plus accrued interest. Under the financing agreement for the notes, the Company is limited to the distribution of dividends until the project is in operation and all distribution requirements under the financing agreements are met.
The CGBL lenders have first priority on the proceeds from the cash grant. The CGBL will be repaid with the Cash Grant. The Company has applied for the cash grant under Section 1603, Payments for Specified Energy Property in Lieu of Tax Credits of the American Reinvestment and Recovery Act of 2009 since commercial operation began on the first phase of the MSS project. During 2013, the Company started draws on the CGBL, as the proceeds from the Notes were fully utilized. As of December 31, 2013, the Company had an outstanding balance of $91,300 for CGBL. The CGBL has a fixed interest rate for each specific draw and bears interest at 3.35% to 3.37%.
As of December 31, 2013, the future maturities of the Notes and CGBL are as follows:
| 2014 |
$ | 104,560 | ||
| 2015 |
13,147 | |||
| 2016 |
18,022 | |||
| 2017 |
14,022 | |||
| 2018 |
14,324 | |||
| Thereafter |
342,925 | |||
|
|
|
|||
| Total |
$ | 507,000 | ||
|
|
|
The LC facility allows the MSS project to issue letters of credit to certain of its counterparties. The LC facility is secured by a security interest in the MSS project and by a second priority interest in proceeds from the Grant. Upon obtaining the financing in 2012, MSS issued $41,347 of letters of credit from the LC facility, of which $34,847 is outstanding as of December 31, 2013. A Letter of Credit issued in 2012 in relation to the procurement of modules for $6,500 was released and cancelled during 2013. The company pays a commitment fee of 0.75% on the unused portion of the LC facility.
F-235
Table of Contents
Imperial Valley Solar 1 Holdings II, LLC and Subsidiaries
Notes to the Consolidated Financial Statements (continued)
(In Thousands of U.S. Dollars)
12. Asset Retirement Obligation
As of December 31, 2013, the Company has recorded an ARO in the amount of $2,333 related to Phase I and II of the MSS project. The estimated liability is based on the future estimated costs associated with the dismantlement, demolition and removal of the solar power plant. The liability is calculated based on the following assumptions:
| Estimated useful life |
25 years | |
| Inflation factor |
2.19 | |
| Credit-adjusted risk-free discount rate |
6% |
The estimate of the ARO is based on projected future retirement costs and requires management to exercise significant judgment. Such costs could differ significantly when they are incurred.
For the year ended December 31, 2013, the Company recognized accretion expense of $11.
13. Fair Value
The fair value of current financial assets and liabilities and other deposits, approximates their reported carrying amounts due to their short maturities. The fair value of long-term debt is estimated differently based upon the type of loan.
| December 31, | ||||||||||||||||
| 2013 | 2012 | |||||||||||||||
| Carrying Amount |
Fair Value | Carrying Amount |
Fair Value | |||||||||||||
| Assets |
||||||||||||||||
| Cash and cash equivalents |
$ | 2,481 | $ | 2,481 | $ | 927 | $ | 927 | ||||||||
| Restricted cash |
510 | 510 | 436,501 | 436,501 | ||||||||||||
| Accounts receivable |
2,871 | 2,871 | — | — | ||||||||||||
|
|
|
|
|
|
|
|
|
|||||||||
| Total assets |
$ | 5,862 | $ | 5,862 | $ | 437,428 | $ | 437,428 | ||||||||
|
|
|
|
|
|
|
|
|
|||||||||
| Liabilities |
||||||||||||||||
| Accounts payable |
$ | 1,081 | $ | 1,081 | $ | 16,213 | $ | 16,213 | ||||||||
| Accounts payable – related parties |
8,586 | 8,586 | 699 | 699 | ||||||||||||
| Accrued expenses |
81,790 | 81,790 | 1,524 | 1,525 | ||||||||||||
| Long-term debt |
500,005 | 488,864 | 414,463 | 415,700 | ||||||||||||
|
|
|
|
|
|
|
|
|
|||||||||
| Total liabilities |
$ | 585,185 | $ | 574,044 | $ | 432,899 | $ | 434,137 | ||||||||
|
|
|
|
|
|
|
|
|
|||||||||
Valuation Techniques
The fair value measurement accounting guidance describes three main approaches to measuring the fair value of assets and liabilities: (1) market approach; (2) income approach and (3) cost approach. The market approach would use prices and other relevant information generated from market transactions involving identical or comparable assets or liabilities. The income approach would use valuation techniques to convert future amounts to a single present value amount. The measurement is based on the value indicated by current market expectations about those future amounts. The cost approach is based on the amount that would currently be required to replace an asset. All financial assets and liabilities (other than debt) are classified as Level 1 in the fair value hierarchy for the purpose of determining and disclosing the fair value of financial instruments.
F-236
Table of Contents
Imperial Valley Solar 1 Holdings II, LLC and Subsidiaries
Notes to the Consolidated Financial Statements (continued)
(In Thousands of U.S. Dollars)
Debt
The fair value of debt is estimated differently based upon the type of loan. For variable rate loans and fixed rate loans with maturity of less than one year, carrying value approximates fair value. The fair value of fixed rate loans is estimated using a discounted cash flow analysis. In the discounted cash flow analysis, the discount rate is based on the credit rating of the individual debt instruments, if available, or the credit rating of the subsidiary. If the subsidiary’s credit rating is not available, a synthetic credit rating is determined using certain key metrics, including cash flow ratios and interest coverage, as well as other industry-specific factors. For the year ended December 31, 2013 and 2012, the Company classified the debt as Level 3 and Level 2, respectively, in the fair value hierarchy for the purpose of determining and disclosing the fair value of financial instruments. The fair value of recourse and non-recourse debt excludes accrued interest at the valuation date.
The Company does not have any assets and liabilities that are measured at fair value on a recurring basis.
14. Related-Party Transactions
For the purpose of the financial statements, parties are considered to be related to the Company if the Company has the ability, directly or indirectly, to control the party or exercise significant influence over the party in making financial and operating decisions, or vice versa, or where the Company and the party are subject to common control or common significant influence. Related parties may be individuals or other entities.
The Company entered into management and operations agreements with U.S. Solar Services (USSS), a wholly owned company of SRP, to provide construction management and general and administrative services. In addition, the Company entered into a management service agreement with a related party, AES Solar Management, Inc., to provide management, business development, and general and administrative services. The Company is required to make payments within 30 days after invoices are received. During the year ended December 31, 2013 and the period from September 24, 2012 (Date of Inception) to December 31, 2012, the Company recorded $5,887 and $1,915 of management expenses with AES Solar Management, Inc. and USSS.
In addition, the Company has an increase in the related party payables of $6,093 which related to payments on its behalf by AES Solar Power, LLC for payments related to the inception of the noncontrolling interest for consultants and legal fees and payments for environmental insurance required to be held by the IVS1 Holdings.
15. Commitments and Contingencies
Capital Commitments
Upon the MSS project achieving financial close in 2012, certain conditions precedent were met resulting in the MSS project’s engineering procurement and construction contract (EPC) and panel supply agreement becoming effective. The total estimated contract value of the EPC contract as of December 31, 2012 was $360,360. In 2013, due to an EPC Settlement and change orders, the EPC contract increased an additional $4,677. As of December 31, 2013, $55,387 remains unpaid under the EPC agreement.
F-237
Table of Contents
Imperial Valley Solar 1 Holdings II, LLC and Subsidiaries
Notes to the Consolidated Financial Statements (continued)
(In Thousands of U.S. Dollars)
Operating Leases
The Company is obligated under certain long-term noncancelable operating leases related to land for its solar projects. Certain of these lease agreements contain renewal options and inflation-adjusted rent escalation clauses. The Company capitalized $391 and $79 for the years ended December 31, 2013 and 2012, respectively, related to land leases. Rent expense for the years ended December 31, 2013 and 2012 under the land agreements was $28 and $0, respectively.
Below is a summary of the Company’s future minimum lease commitments as of December 31, 2013:
| 2014 | 2015 | 2016 | 2017 | 2018 | Thereafter | Total | ||||||||||||||||||||||
| Land leases |
$ | 427 | $ | 436 | $ | 444 | $ | 453 | $ | 462 | $ | 12,189 | $ | 14,411 | ||||||||||||||
Letter of Credit
In the normal course of business, the Company may enter into various agreements providing performance assurance to third parties. Such agreements include letters of credit and are entered into primarily to support or enhance the creditworthiness of the Company by facilitating the availability of sufficient credit to accomplish the intended business purposes of the Company.
As discussed in Note 11 – Long-Term Debt, the LC facility allows the MSS project to issue letters of credit to certain counterparties. On behalf of the Company, a third party has posted several LCs totaling $34,847 to multiple beneficiaries. The letters of credit are required under the MSS project financing agreement to be posted during construction. The Company issued letters of credit for PPA, and interconnection studies and upgrades. The letters of credit are issued with a one-year maximum duration and extended for additional periods at the Company’s discretion. The others have expiration beyond December 31, 2013 and some will automatically renew unless the Company makes a notification.
Legal Proceedings
The Company does not have any legal proceedings that are currently pending. From time to time, the Company or its subsidiaries may be party to various lawsuits, claims and other legal and regulatory proceedings that arise in the ordinary course of business. These actions may seek, among other things, compensation, civil penalties, or injunctive or declaratory relief.
Environmental Contingencies
The Company reviews its obligations as they relate to compliance with environmental laws, including site restoration and remediation. For the years ended December 31, 2013 and period from September 24, 2012 (Date of Inception) to December 31, 2012, there were no known environmental contingencies that required the Company to recognize a liability.
16. Subsequent Events
Subsequent events have been evaluated through June 13, 2014, the date these financial statements were available to be issued.
F-238
Table of Contents
Imperial Valley Solar 1 Holdings II, LLC and Subsidiaries
Notes to the Consolidated Financial Statements (continued)
(In Thousands of U.S. Dollars)
On February 18, 2014 the Company applied for the cash grant under Section 1603, Payments for Specified Energy Property in Lieu of Tax Credits of the American Reinvestment and Recovery Act of 2009 for the Phase II of the MSS project (Phase II Cash Grant). The Company has concluded that conditions were met on February 18, 2014 for the recognition of the Phase II Cash Grant and the Company recognized a Phase III Cash Grant receivable of $59,089 with a corresponding reduction of property, plant and equipment. On April 21, 2014, the Company received proceeds related to the Phase II Cash Grant receivable of $55,380. The Company expects to collect the remaining Phase II Cash Grant receivable upon addressing US Treasury’s review questions.
On March 31, 2014, the Company applied for the cash grant under Section 1603, Payments for Specified Energy Property in Lieu of Tax Credits of the American Reinvestment and Recovery Act of 2009 for the Phase III of the MSS project (Phase III Cash Grant). The Company has concluded that conditions were met on March 31, 2014 for the recognition of the Phase III Cash Grant and the Company recognized a Phase III Cash Grant receivable of $39,517 with a corresponding reduction of property, plant and equipment. On April 25, 2014, the Company received proceeds related to the Phase III Cash Grant receivable of $36,796. The Company expects to collect the remaining Phase III Cash Grant receivable upon addressing US Treasury’s review questions.
In 2014, the Company drew an additional $72,960 under the CGBL facility. On April 29, 2014, the CGBL facility was fully repaid with the Cash Grant proceeds. Additionally in 2014, the Company issued additional letter of credit of $12,747 under the LC Facility.
F-239
Table of Contents
Report of Independent Auditors
First Wind Holdings, LLC
Board of Managers
We have audited the accompanying combined financial statements of First Wind Operating Entities (the Company), which comprise the combined balance sheets as of December 31, 2013 and 2012, and the related combined statements of operations, cash flows and capital for each of the two years in the period ended December 31, 2013, and the related notes to the combined financial statements.
Management’s Responsibility for the Financial Statements
Management is responsible for the preparation and fair presentation of these financial statements in conformity with U.S. generally accepted accounting principles; this includes the design, implementation, and maintenance of internal control relevant to the preparation and fair presentation of financial statements that are free of material misstatement, whether due to fraud or error.
Auditor’s Responsibility
Our responsibility is to express an opinion on these financial statements based on our audits. We conducted our audits in accordance with auditing standards generally accepted in the United States. Those standards require that we plan and perform the audit to obtain reasonable assurance about whether the financial statements are free of material misstatement.
An audit involves performing procedures to obtain audit evidence about the amounts and disclosures in the financial statements. The procedures selected depend on the auditor’s judgment, including the assessment of the risks of material misstatement of the financial statements, whether due to fraud or error. In making those risk assessments, the auditor considers internal control relevant to the entity’s preparation and fair presentation of the financial statements in order to design audit procedures that are appropriate in the circumstances, but not for the purpose of expressing an opinion on the effectiveness of the entity’s internal control. Accordingly, we express no such opinion. An audit also includes evaluating the appropriateness of accounting policies used and the reasonableness of significant accounting estimates made by management, as well as evaluating the overall presentation of the financial statements.
We believe that the audit evidence we have obtained is sufficient and appropriate to provide a basis for our audit opinion.
Opinion
In our opinion, the financial statements referred to above present fairly, in all material respects, the combined financial position of First Wind Operating Entities at December 31, 2013 and 2012, and the combined results of their operations and their cash flows for each of the two years in the period ended December 31, 2013 in conformity with U.S. generally accepted accounting principles.
/s/ Ernst & Young LLP
Boston, Massachusetts
December 9, 2014
F-240
Table of Contents
Combined Balance Sheets
(in thousands)
| December 31, | ||||||||
| 2012 | 2013 | |||||||
| Assets | ||||||||
| Current assets: |
||||||||
| Cash and cash equivalents |
$ | 32,704 | $ | 23,456 | ||||
| Restricted cash |
25,939 | 32,810 | ||||||
| Accounts receivable |
11,678 | 9,434 | ||||||
| Prepaid expenses and other current assets |
5,509 | 6,074 | ||||||
| Derivative assets |
11,913 | 7,557 | ||||||
|
|
|
|
|
|||||
| Total current assets |
87,743 | 79,331 | ||||||
| Property, plant and equipment, net |
941,407 | 909,689 | ||||||
| Construction in progress |
3,209 | 43,346 | ||||||
| Long-term derivative assets |
52,643 | 43,150 | ||||||
| Other non-current assets, net |
19,946 | 34,646 | ||||||
| Deferred financing costs, net |
14,274 | 18,515 | ||||||
|
|
|
|
|
|||||
| Total assets |
$ | 1,119,222 | $ | 1,128,677 | ||||
|
|
|
|
|
|||||
| Liabilities and Capital | ||||||||
| Current liabilities: |
||||||||
| Accrued capital expenditures |
$ | 607 | $ | 18,175 | ||||
| Accounts payable and accrued expenses |
15,257 | 7,125 | ||||||
| Current portion of derivative liabilities |
8,355 | 644 | ||||||
| Current portion of long-term debt |
34,353 | 18,055 | ||||||
| Current portion of deferred revenue |
883 | 957 | ||||||
|
|
|
|
|
|||||
| Total current liabilities |
59,455 | 44,956 | ||||||
| Long-term derivative liabilities |
8,806 | 15 | ||||||
| Long-term debt, net of current portion |
479,435 | 498,012 | ||||||
| Deferred revenue |
3,969 | 3,800 | ||||||
| Other long-term liabilities |
407 | 2,209 | ||||||
| Asset retirement obligations |
10,938 | 11,302 | ||||||
|
|
|
|
|
|||||
| Total liabilities |
563,010 | 560,294 | ||||||
| Capital: |
||||||||
| Parent’s contributions, net |
566,973 | 599,092 | ||||||
| Accumulated deficit |
(138,123 | ) | (137,463 | ) | ||||
|
|
|
|
|
|||||
| Total parent’s capital |
428,850 | 461,629 | ||||||
| Noncontrolling interests |
127,362 | 106,754 | ||||||
|
|
|
|
|
|||||
| Total capital |
556,212 | 568,383 | ||||||
|
|
|
|
|
|||||
| Total liabilities and capital |
$ | 1,119,222 | $ | 1,128,677 | ||||
|
|
|
|
|
|||||
See accompanying notes to combined financial statements.
F-241
Table of Contents
Combined Statements of Operations
(in thousands)
| Years Ended December 31, |
||||||||
| 2012 | 2013 | |||||||
| Revenues: |
||||||||
| Revenues |
$ | 93,539 | $ | 102,042 | ||||
| Cash settlements of derivatives |
10,576 | 5,656 | ||||||
| Fair value changes in derivatives |
4,978 | (11,245 | ) | |||||
|
|
|
|
|
|||||
| Total revenues |
109,093 | 96,453 | ||||||
| Cost of revenues: |
||||||||
| Project operating expenses |
38,719 | 45,924 | ||||||
| Depreciation and amortization |
38,436 | 43,650 | ||||||
|
|
|
|
|
|||||
| Total cost of revenues |
77,155 | 89,574 | ||||||
|
|
|
|
|
|||||
| Gross profit |
31,938 | 6,879 | ||||||
| Other operating expenses: |
||||||||
| Project development |
1,611 | 823 | ||||||
| General and administrative |
4,648 | 5,103 | ||||||
|
|
|
|
|
|||||
| Total other operating expenses |
6,259 | 5,926 | ||||||
|
|
|
|
|
|||||
| Income from operations |
25,679 | 953 | ||||||
| Fair value changes in derivatives |
(3,459 | ) | 7,566 | |||||
| Other income (expenses) |
(72,537 | ) | 28,329 | |||||
| Interest expense, net |
(38,977 | ) | (33,496 | ) | ||||
|
|
|
|
|
|||||
| Net income (loss) |
(89,294 | ) | 3,352 | |||||
| Net (income) loss attributable to noncontrolling interests |
256 | (2,692 | ) | |||||
|
|
|
|
|
|||||
| Net income (loss) attributable to the First Wind Operating Entities |
$ | (89,038 | ) | $ | 660 | |||
|
|
|
|
|
|||||
See accompanying notes to combined financial statements.
F-242
Table of Contents
Combined Statements of Cash Flows
(in thousands)
| December 31, | ||||||||
| 2012 | 2013 | |||||||
| Cash flows from operating activities: |
||||||||
| Net income (loss) |
$ | (89,294 | ) | $ | 3,352 | |||
| Adjustments to reconcile net income (loss) to net cash provided by operating activities: |
||||||||
| Depreciation and amortization |
38,436 | 43,650 | ||||||
| Amortization of deferred financing costs |
5,561 | 2,773 | ||||||
| Unrealized (gain) loss on derivative instruments |
(1,519 | ) | 3,679 | |||||
| Loss on sale of assets |
— | 1,767 | ||||||
| Loss on impairment of assets |
29,624 | — | ||||||
| Assets received in settlement |
— | (3,392 | ) | |||||
| Property and casualty insurance proceeds |
— | (13,500 | ) | |||||
| Loss on early extinguishment of debt |
44,139 | 7,998 | ||||||
| Swap breakage fees paid upon early extinguishment of debt |
— | (7,565 | ) | |||||
| Changes in assets and liabilities: |
||||||||
| Accounts receivable |
996 | 2,803 | ||||||
| Prepaid expenses and other current assets |
(1,275 | ) | (565 | ) | ||||
| Other non-current assets |
10,053 | (2,769 | ) | |||||
| Other liabilities |
(141 | ) | 602 | |||||
| Accounts payable and accrued expenses |
10,783 | (8,133 | ) | |||||
| Deferred revenue |
1,110 | (94 | ) | |||||
|
|
|
|
|
|||||
| Net cash provided by operating activities |
48,473 | 30,606 | ||||||
|
|
|
|
|
|||||
| Cash flows from investing activities: |
||||||||
| Capital expenditures |
(2,160 | ) | (26,054 | ) | ||||
| Changes in restricted cash |
2,139 | (6,872 | ) | |||||
| Property and casualty insurance proceeds |
— | 13,500 | ||||||
| Proceeds from sale of assets, net |
— | 793 | ||||||
|
|
|
|
|
|||||
| Net cash used in investing activities |
(21 | ) | (18,633 | ) | ||||
|
|
|
|
|
|||||
| Cash flows from financing activities: |
||||||||
| Proceeds from borrowings, net of issuance costs |
249,059 | 332,528 | ||||||
| ARRA grant proceeds, net |
137,089 | — | ||||||
| Proceeds from sale of non-controlling subsidiary company interests, net |
— | 601 | ||||||
| Repurchase of subsidiary company interests |
(7,010 | ) | (8,942 | ) | ||||
| Repayment of borrowings |
(360,455 | ) | (344,325 | ) | ||||
| Payments related to early extinguishment of debt |
(23,268 | ) | — | |||||
| Net distributions to noncontrolling interests |
(43,879 | ) | (14,586 | ) | ||||
| Net contributions from parent |
15,361 | 13,503 | ||||||
|
|
|
|
|
|||||
| Net cash used in financing activities |
(33,103 | ) | (21,221 | ) | ||||
|
|
|
|
|
|||||
| Net change in cash and cash equivalents |
15,349 | (9,248 | ) | |||||
| Cash and cash equivalents, beginning of period |
17,355 | 32,704 | ||||||
|
|
|
|
|
|||||
| Cash and cash equivalents, end of period |
$ | 32,704 | $ | 23,456 | ||||
|
|
|
|
|
|||||
| Supplemental disclosures of cash flow information: |
||||||||
| Cash paid during the period for: |
||||||||
| Interest |
$ | 29,522 | $ | 36,648 | ||||
| Non-cash investing activities: |
||||||||
| Capital expenditures funded directly from borrowings |
101,971 | — | ||||||
| Fair value of asset retirement obligations |
328 | (533 | ) | |||||
| Non-cash financing activities: |
||||||||
| Assets contributed by parent |
31,345 | 18,795 | ||||||
See accompanying notes to combined financial statements.
F-243
Table of Contents
Combined Statements of Capital
(in thousands)
| Parent’s Contributions, net |
Accumulated Deficit |
Subtotal | Noncontrolling Interests |
Total | ||||||||||||||||
| Balance at December 31, 2011 |
$ | 540,159 | $ | (49,085 | ) | $ | 491,074 | $ | 158,527 | $ | 649,601 | |||||||||
| Net contribution (distribution) |
46,706 | — | 46,706 | (43,791 | ) | 2,915 | ||||||||||||||
| Repurchase of noncontrolling interests |
(19,892 | ) | — | (19,892 | ) | 12,882 | (7,010 | ) | ||||||||||||
| Net loss |
— | (89,038 | ) | (89,038 | ) | (256 | ) | (89,294 | ) | |||||||||||
|
|
|
|
|
|
|
|
|
|
|
|||||||||||
| Balance at December 31, 2012 |
$ | 566,973 | $ | (138,123 | ) | $ | 428,850 | $ | 127,362 | $ | 556,212 | |||||||||
| Net contribution (distribution) |
32,298 | — | 32,298 | (14,421 | ) | 17,877 | ||||||||||||||
| Repurchase of noncontrolling interests |
(63 | ) | — | (63 | ) | (8,879 | ) | (8,942 | ) | |||||||||||
| Transaction costs associated with tax equity financing |
(116 | ) | — | (116 | ) | — | (116 | ) | ||||||||||||
| Net income |
— | 660 | 660 | 2,692 | 3,352 | |||||||||||||||
|
|
|
|
|
|
|
|
|
|
|
|||||||||||
| Balance at December 31, 2013 |
$ | 599,092 | $ | (137,463 | ) | $ | 461,629 | $ | 106,754 | $ | 568,383 | |||||||||
|
|
|
|
|
|
|
|
|
|
|
|||||||||||
See accompanying notes to combined financial statements.
F-244
Table of Contents
Notes to Combined Financial Statements
NOTE 1—BUSINESS
The accompanying combined financial statements include the historical accounts of selected operating entities (First Wind Operating Entities) of First Wind Holdings, LLC (First Wind), which are the subject of a purchase and sale agreement. The First Wind Operating Entities operate utility-scale wind and solar energy projects in the Northeastern region of the continental United States and Hawaii and rely on First Wind and certain of First Wind’s subsidiaries for management services related to administration, operations and maintenance.
At December 31, 2013, the First Wind Operating Entities operate the following renewable energy projects with a total of 500 megawatts (MW) in gross nameplate capacity:
| Project |
Capacity (MW) |
Commercial Operation | ||||
| Wind |
||||||
| Northeast |
||||||
| Blue Sky East, LLC (Bull Hill) |
34 | October 2012 | ||||
| Canandaigua Power Partners, LLC and Canandaigua Power Partners II, LLC (together, Cohocton) |
125 | January 2009 | ||||
| Erie Wind, LLC (Steel Winds II) |
15 | January 2012 | ||||
| Evergreen Wind Power, LLC (Mars Hill)(1) |
42 | March 2007 | ||||
| Evergreen Wind Power III, LLC (Rollins) |
60 | July 2011 | ||||
| Niagara Wind Power, LLC (Steel Winds I) |
20 | June 2007 | ||||
| Stetson Holdings, LLC (Stetson I) |
57 | January 2009 | ||||
| Stetson Wind II, LLC (Stetson II) |
26 | March 2010 | ||||
| Vermont Wind, LLC (Sheffield) |
40 | October 2011 | ||||
| Hawaii |
||||||
| Kaheawa Wind Power, LLC (KWP I)(1) |
30 | June 2006 | ||||
| Kaheawa Wind Power II, LLC (KWP II)(2) |
21 | July 2012 | ||||
| Kahuku Wind Power, LLC (Kahuku)(2) |
30 | March 2011 | ||||
|
|
|
|||||
| 500 | ||||||
|
|
|
|||||
| (1) | Partially-owned (tax equity) |
| (2) | Partially-owned (percentage interest) |
At December 31, 2013, the First Wind Operating Entities have the following renewable energy project under construction with a total of 17 MW in gross nameplate capacity:
| Project |
Capacity (MW) |
Commercial Operation |
||||||
| Solar |
||||||||
| Mass Solar 1, LLC (Mass Solar)(1) |
17 | May 2014 | ||||||
|
|
|
|||||||
| 17 | ||||||||
|
|
|
|||||||
| (1) | Solar capacity presented in Megawatts AC |
NOTE 2—LIQUIDITY
The First Wind Operating Entities have relied on parent contributions, unsecured debt, borrowings secured by certain of their assets, and grants under the American Recovery and Reinvestment Act of
F-245
Table of Contents
FIRST WIND OPERATING ENTITIES
Notes to Combined Financial Statements
2009 (ARRA) to fund project development spending, procurement of wind turbine generators and construction costs. The First Wind Operating Entities’ cash on hand at December 31, 2013, along with funds available for borrowing under existing debt facilities, expected operating cash flows and parent contributions will provide the First Wind Operating Entities with sufficient working capital to fund operations and meet existing commitments through December 31, 2014.
NOTE 3—SUMMARY OF SIGNIFICANT ACCOUNTING POLICIES
Principles of Consolidation and Basis of Presentation
Overview. The accompanying combined financial statements have been prepared in accordance with U.S. generally accepted accounting principles (U.S. GAAP) from the consolidated financial statements and accounting records of First Wind using the historical results of operations and historical cost basis of the assets and liabilities of First Wind that comprise the First Wind Operating Entities. These financial statements have been prepared solely to demonstrate the First Wind Operating Entities’ historical results of operations, financial position, and cash flows for the indicated periods under First Wind’s management. All intercompany balances and transactions within the First Wind Operating Entities have been eliminated. Transactions and balances between the First Wind Operating Entities and First Wind and its subsidiaries are reflected as related party transactions within these financial statements. Subsequent events potentially affecting the combined financial statements have been evaluated through December 9, 2014, the date these combined financial statements were issued. The accompanying combined financial statements should be read in conjunction with the September 30, 2014 unaudited combined financial statements and notes thereto.
The accompanying combined financial statements include the assets, liabilities, revenues, and expenses that are specifically identifiable to the First Wind Operating Entities. In addition, certain general and administrative costs related to the First Wind Operating Entities have been allocated from First Wind. The First Wind Operating Entities receive service and support functions from First Wind and its subsidiaries under administrative services (ASA) and operations and maintenance (O&M) agreements. The First Wind Operating Entities’ operations are dependent upon First Wind and its subsidiaries’ ability to perform these services and support functions. The costs associated with these services and support functions have been allocated to the First Wind Operating Entities using First Wind’s historical cost allocation methodologies, and primarily reflect an allocation of employee and technology costs. Changes in the net parent contribution account in the combined balance sheets related to services performed under the ASA and O&M agreements have been considered cash receipts and payments for the purposes of the combined statements of cash flows and are reflected in financing activities. Changes in the net parent contribution account resulting from contributions of assets and liabilities from First Wind have been considered non-cash financing activities for purposes of the combined statements of cash flows. Debt specific to the First Wind Operating Entities has been reflected in these combined financial statements as described in Note 6.
Management believes the assumptions and allocations underlying the combined financial statements are reasonable and appropriate under the circumstances. The expenses and cost allocations have been determined on a basis considered by First Wind to be a reasonable reflection of the utilization of services provided to or the benefit received by the First Wind Operating Entities during the periods presented relative to the total costs incurred by First Wind. However, the amounts recorded for these transactions and allocations are not necessarily representative of the amount that would have been reflected in the financial statements had the First Wind Operating Entities been an entity that operated independently of First Wind.
F-246
Table of Contents
FIRST WIND OPERATING ENTITIES
Notes to Combined Financial Statements
Variable Interest Entities. The usual condition for a controlling financial interest is ownership of a majority of the voting interests of an entity; however, a controlling financial interest may also exist in entities such as variable interest entities (VIEs), through arrangements that do not involve controlling voting interests. A variable interest holder is required to consolidate a VIE as its primary beneficiary if that party has the power to direct the activities that would significantly impact the entity’s performance, if it has the obligation to absorb the losses of a VIE or receive benefits that could potentially be significant to the VIE, or both.
Noncontrolling Interests. The First Wind Operating Entities use a hypothetical liquidation at book value (HLBV) method to account for noncontrolling interests in projects where it has entered into tax equity capital transactions. HLBV uses a balance sheet methodology that considers the noncontrolling interest holder’s claim on the net assets of the entity assuming a liquidation event. Equity in income or loss under HLBV is determined by calculating the change in the amount of net worth the tax equity investors are legally able to claim based on an assumed liquidation at book value of the entity at the beginning of the reporting period compared to the end of that period. The periodic changes in noncontrolling interest in the combined balance sheets, excluding impact of cash distributions, are recognized by the First Wind Operating Entities as “Net (income) loss attributable to noncontrolling interests” in the combined statements of operations.
The First Wind Operating Entities account for noncontrolling interests not related to tax equity capital transactions by applying the noncontrolling interest’s proportional ownership interest to the periodic operating results of the entity.
Segment Data
The First Wind Operating Entities operations are managed on a combined, single-segment basis for purposes of assessing performance and making operating decisions.
Use of Estimates and Market Risks
The preparation of financial statements in conformity with U.S. GAAP requires management to make estimates and judgments that affect the reported amounts of assets and liabilities and disclosure of contingencies at the date of the financial statements and the reported amounts of revenue and expenses during the reporting period. Management’s estimates and judgments are derived and continually evaluated based on available information, historical experience and various other assumptions that are believed to be reasonable under the circumstances. Because the use of estimates is inherent in the financial reporting process, actual results could differ from those estimates. In recording transactions and balances resulting from business operations, management makes estimates based on the best information available at the time the estimate is made. Estimates are used for such items as property, plant and equipment depreciable lives; amortization periods for identifiable intangible assets; valuation of long-term commodity contracts; and asset retirement obligations (AROs). In addition, estimates are used to test long-lived assets for impairment and to determine the fair value of impaired assets. As better information becomes available or actual amounts are determinable, the recorded estimates are revised. Consequently, operating results can be affected by revisions to prior estimates.
The First Wind Operating Entities are subject to risks associated with price movements of energy commodities and credit associated with its commercial activities; reliability of the systems, procedures and other infrastructure necessary to operate the business; changes in laws and regulations; weather
F-247
Table of Contents
FIRST WIND OPERATING ENTITIES
Notes to Combined Financial Statements
conditions; financial market conditions and access to and pricing of capital; the creditworthiness of its counterparties; reliance on tax equity financing arrangements; ability to meet obligations under debt instruments; and the successful operation of power markets, among other items.
Concentrations of Credit Risk
The First Wind Operating Entities are subject to concentrations of credit risk primarily through cash and cash equivalents, accounts receivable, and derivative instruments. The First Wind Operating Entities mitigate risk with respect to cash and cash equivalents and derivative instruments by maintaining deposits and contracts at high-quality financial institutions and monitoring the credit ratings of those institutions.
The First Wind Operating Entities derive a large portion of their electricity and renewable energy certificate (REC) revenues from a small number of customers. The First Wind Operating Entities have experienced no credit losses to date on their electricity and REC sales, and do not anticipate material credit losses to occur in the future with respect to related accounts receivable; therefore, no allowance for doubtful accounts has been provided.
Derivative Financial Instruments and Risk Management Activities
In the normal course of business, the First Wind Operating Entities employ financial instruments to manage their exposure to fluctuations in commodity prices and interest rates. The First Wind Operating Entities do not engage in speculative derivative activities or derivative trading activities. The First Wind Operating Entities enter into long-term cash settled swap agreements to hedge commodity price variability inherent in electricity sales arrangements. In instances where the First Wind Operating Entities sell electricity at market prices (e.g., where it has no full-output fixed price, long-term PPA in place), the First Wind Operating Entities seek to protect themselves against significant variability in spot electricity prices by entering into financial hedge transactions to help stabilize estimated revenue streams. These price swap agreements involve periodic notional quantity settlements where the First Wind Operating Entities swap market prices for fixed prices, based on a commodity or market price index, over the term of an agreement.
The First Wind Operating Entities use interest rate swap and cap agreements to convert anticipated cash interest payments under its variable rate financing arrangements to a fixed rate basis. These agreements involve the receipt of variable payments in exchange for fixed payments over the term of the agreements without the exchange of the underlying principal amounts.
The First Wind Operating Entities record, as either assets or liabilities, all derivative instruments in the combined balance sheets at their respective fair values. The estimated fair values of derivative instruments are calculated based on market rates. These values represent the estimated amounts the First Wind Operating Entities would receive or pay on termination of agreements, taking into consideration current market rates and the current creditworthiness of the counterparty.
The First Wind Operating Entities have not formally documented or designated their commodity price and interest rate swaps as hedges and therefore do not apply hedge accounting to these instruments. All derivative instruments have been marked to market through earnings.
Cash and Cash Equivalents and Restricted Cash
Cash and cash equivalents consist of all cash balances and highly liquid investments with original maturity of three months or less. Cash balances that are restricted by various financing arrangements are classified as restricted cash in the accompanying combined balance sheets.
F-248
Table of Contents
FIRST WIND OPERATING ENTITIES
Notes to Combined Financial Statements
Revenue Recognition
The First Wind Operating Entities earn revenue from the sale of electricity and RECs. The First Wind Operating Entities recognize revenues from the sale of electricity at market prices or under long-term PPAs based upon the output delivered at rates specified under the contracts. The First Wind Operating Entities recognize revenues from the sale of RECs based upon the certificates delivered at rates specified under the contracts. The First Wind Operating Entities defer recognition of revenue from sales of electricity and RECs in instances when criteria to recognize revenue have not been met.
Revenues by major customer were as follows (in thousands, except percentages):
| Years Ended December 31, | ||||||||||||||||
| 2012 | 2013 | |||||||||||||||
| Hawaiian Electric Company(1) |
$ | 17,184 | 18 | % | $ | 9,931 | 10 | % | ||||||||
| ISO New England |
10,976 | 12 | 20,518 | 20 | ||||||||||||
| Maui Electric Company |
21,849 | 23 | 23,384 | 23 | ||||||||||||
|
|
|
|
|
|
|
|
|
|||||||||
| Total revenue by major customers |
50,009 | 53 | 53,833 | 53 | ||||||||||||
| Revenues from all other customers |
43,530 | 47 | 48,209 | 47 | ||||||||||||
|
|
|
|
|
|
|
|
|
|||||||||
| $ | 93,539 | 100 | % | $ | 102,042 | 100 | % | |||||||||
|
|
|
|
|
|
|
|
|
|||||||||
| (1) | Includes $6,232 and $8,568 of business interruption insurance proceeds Kahuku received in connection with its outages for the years ended December 31, 2012 and 2013, respectively. |
The First Wind Operating Entities evaluate their long-term PPAs to determine whether they are leases. In the case of leases, at the inception of the lease or subsequent modification, the First Wind Operating Entities determine whether the lease is an operating or capital lease based upon its terms and characteristics. The First Wind Operating Entities have determined that several of its long-term PPAs are operating leases. The First Wind Operating Entities recognize revenues generated under these PPAs as contingent rental income as energy is delivered. Revenue from these PPAs is included in revenues in the accompanying combined statements of operations when it becomes probable of receipt.
Prior to commercial operations of its renewable energy projects, during the commissioning stage, the First Wind Operating Entities may generate electricity produced in the process of testing its wind turbines and solar panels. Revenue from testing is deferred and amortized over the estimated life of the project.
As described in the Derivative Financial Instruments and Risk Management Activities section of this Note 3, revenues also include risk management activities relating to operating projects, which are comprised of mark to market adjustments and cash settlements on commodity swaps.
The First Wind Operating Entities insure against losses stemming from business interruptions. In the years ended December 31, 2012 and 2013, the First Wind Operating Entities recognized $6.2 million and $8.6 million, respectively of business interruption recoveries that resulted from a fire at Kahuku’s battery energy storage system (BESS). The recoveries are included in revenues in the accompanying combined statements of operations.
F-249
Table of Contents
FIRST WIND OPERATING ENTITIES
Notes to Combined Financial Statements
Cost of Revenues
Cost of revenues includes transmission costs, project operating expenses and depreciation and amortization of operating assets. Project operating expenses consist of such costs as contracted operations and maintenance fees, turbine and related equipment warranty fees, land rent, insurance, professional fees, operating personnel salaries and the cost of permit compliance.
Property, Plant and Equipment
Property, plant and equipment are stated at cost, less accumulated depreciation. Renewals and betterments that increase the useful lives of the assets are capitalized. Depreciation is recorded on a straight-line basis, and the First Wind Operating Entities review the estimated useful lives of property, plant and equipment on an ongoing basis. Renewable energy project equipment and related assets are depreciated over their estimated useful lives of 25 to 30 years on a straight-line basis. Non-renewable energy project-related assets are depreciated over their estimated useful lives, which range from 3 to 7 years.
Construction in progress expenditures, insurance, interest and other costs related to construction activities are capitalized. As each project begins commercial operations, construction in progress is reclassified to property, plant and equipment and is depreciated over the estimated useful lives of the underlying assets.
The First Wind Operating Entities’ construction and equipment procurement agreements contain damage clauses relating to construction delays and contractually-specified performance targets. These clauses are negotiated to cover lost margin or revenues from a wind or solar energy project that is unable to operate when required or to perform as guaranteed. Liquidated damages received related to construction activities, and those payments received related to the failure to meet contractually specified performance targets or completion dates prior to commercial operations, are recorded as a reduction of construction in progress.
The proceeds from ARRA grants for wind energy projects have been recorded as a reduction of the cost of the wind energy projects’ property, plant and equipment. These proceeds are recognized in the statements of operations as a reduction in depreciation expense over the lives of the wind energy projects.
Project Development Costs
The First Wind Operating Entities expense all project development costs, primarily consisting of initial permitting, land rights, preliminary engineering work, analysis of project resources, analysis of project economics and legal work, until management deems a project probable of being technically, commercially and financially viable. Once this determination has been made, the First Wind Operating Entities begin capitalizing project development costs.
Interest Capitalization
The First Wind Operating Entities capitalize interest on borrowed funds used to finance capital projects. Capitalization is discontinued when a project achieves commercial operation or when construction is terminated. The First Wind Operating Entities incurred interest expense of $45.4 million
F-250
Table of Contents
FIRST WIND OPERATING ENTITIES
Notes to Combined Financial Statements
and $33.8 million, respectively, for the years ended December 31, 2012 and 2013. Of these amounts, the following was capitalized and is classified as follows in the accompanying combined balance sheets (in thousands):
| December 31, | ||||||||
| 2012 | 2013 | |||||||
| Property, plant and equipment |
$ | 6,404 | $ | — | ||||
| Construction in progress |
— | 311 | ||||||
|
|
|
|
|
|||||
| Total interest capitalized during the period |
$ | 6,404 | $ | 311 | ||||
|
|
|
|
|
|||||
Impairment of Long-Lived Assets
Long-lived assets primarily include property, plant and equipment. The First Wind Operating Entities periodically review long-lived assets for impairment whenever events or changes in business circumstances indicate that the carrying amount of the assets may not be fully recoverable. If there is an indication of impairment the undiscounted cash flows are compared to the recorded value of the asset. If the undiscounted cash flows are less than the recorded value of the asset, the asset is reduced to its estimated fair value based on a discounted cash flow analysis. Determining the fair value of long-lived assets includes significant judgment by management, and different judgments could yield different results. During the year ended December 31, 2012, write-downs of assets amounting to $28.3 million were recognized as a result of the Kahuku BESS fire, as described below in “—Other Income (Expenses)”. The write-downs are recognized in other expenses on the combined statements of operations. No impairment of long-lived assets was recorded for the years ended December 31, 2013.
Asset Retirement Obligations
The First Wind Operating Entities record the fair value of an ARO as a liability in the period in which a legal obligation associated with the retirement of tangible long-lived assets is incurred. Fair value is calculated utilizing a market approach based on the amount required to enter into an identical liability. The calculation takes into consideration the credit risk of the First Wind Operating Entities.
The First Wind Operating Entities enter into agreements to lease land on which to construct and operate their renewable energy projects. Pursuant to certain lease agreements, as well as applicable permits, the First Wind Operating Entities are required to decommission the renewable energy project equipment and provide for reclamation of the leased property upon the expiration, termination or cancellation of the lease agreements or cessation of commercial operation of the project.
The First Wind Operating Entities have recorded the offsetting asset to the initial obligation as an increase to the carrying amount of the related long-lived asset and depreciate that cost over the life of the asset. The liability is accreted at the end of each period to reflect the passage of time.
Determination of AROs requires a significant number of assumptions and estimates that affect the valuation of the obligation. These estimates can change as the result of various factors including new developments or better information. Accordingly, the First Wind Operating Entities periodically reevaluate these estimates. A significant change therein could materially change the value of the obligation.
F-251
Table of Contents
FIRST WIND OPERATING ENTITIES
Notes to Combined Financial Statements
Deferred Financing Costs
Deferred financing costs represent external costs incurred to obtain debt financing and are amortized over the terms of the related debt agreements. These costs are amortized using the effective interest method in instances where the use of the straight-line method generates materially different results. Prior to renewable energy projects reaching substantial completion, non-cash interest from amortization of deferred financing costs related to construction activities is capitalized. Amortization of deferred financing costs is included in interest expense in the accompanying combined statements of operations. At December 31, 2012 and 2013, the First Wind Operating Entities had deferred financing costs of 27.8 million and 26.1, with accumulated amortization of $13.5 million and $7.6 million, respectively. Included in other income and expenses for the years ended December 31, 2012 and 2013 is $4.8 million and $6.8 million, respectively, of deferred financing costs that were written off as a result of the early extinguishment of debt.
Other Non-Current Assets
Other non-current assets primarily include deposits, prepaid turbine warranty and maintenance contracts, acquired intangible assets, gearbox overhaul costs, inventory, an investment in an equity method investee, and the cost of structures constructed as required by the terms of certain PPAs and interconnection agreements.
Intangible assets consist primarily of a premium paid to acquire control of Mars Hill’s project assets, land studies, maps and surveys, wind studies and data, interconnection studies and permits. These finite-lived acquired intangible assets are amortized using the straight-line method over their expected period of benefit. At December 31, 2012 and 2013, the First Wind Operating Entities had intangible assets of $14.4 million, with accumulated amortization of $4.1 million and $4.7 million, respectively. The First Wind Operating Entities recorded amortization expense of $0.5 million per year for the years ended December 31, 2012 and 2013, respectively. As of December 31, 2013, amortization of finite-lived intangible assets is expected to be approximately $0.5 million per year for each of the next five years, with an aggregate amount of $7.1 million remaining to be expensed thereafter.
The cost of the finite-lived structures constructed as required by the terms of certain PPAs and interconnection agreements are amortized using the straight-line method over their expected period of benefit. At December 31, 2012 and 2013, the First Wind Operating Entities had related assets of $9.8 million and $18.5 million, with accumulated amortization of $0.3 million and $0.9 million, respectively. For the years ended December 31, 2012 and 2013, the First Wind Operating Entities recorded amortization expense of $0.1 million and $0.3 million, respectively, which offsets revenues on the accompanying combined statements of operations. In addition, the First Wind Operating Entities recorded amortization expense of $0.2 million and $0.3 million for the years ended December 31, 2012 and 2013, respectively, which is included in project operating expenses on the accompanying combined statements of operations.
Repair and maintenance activities, with the exception of gearbox overhauls, are expensed as incurred. Gearbox overhauls are accounted for as planned major maintenance activities using the deferral method and are amortized from the date of the overhaul to the date of the next expected overhaul, generally 10 years, using the straight-line method. The First Wind Operating Entities review the expected overhaul periods for its gearboxes on an ongoing basis. The First Wind Operating Entities
F-252
Table of Contents
FIRST WIND OPERATING ENTITIES
Notes to Combined Financial Statements
did not incur gearbox overhaul costs in 2012. As of December 31, 2013, the First Wind Operating Entities had capitalized $7.2 million of gearbox overhaul costs. For the year ended December 31, 2013, the First Wind Operating Entities recorded amortization expense of $0.3 million which is included in project operating expense on the accompanying combined statements of operations.
Income Taxes
The First Wind Operating Entities have been organized as limited liability companies and are disregarded entities that flow to partnerships or are treated as partnerships for federal and state income tax purposes. No provision for income taxes has been made, as income taxes are assessed at the parent level.
The First Wind Operating Entities’ policy is to record estimated interest and penalties related to uncertain tax positions in income tax expense. As of December 31, 2012 and 2013, the First Wind Operating Entities had no accrued interest or penalties recorded related to uncertain tax positions. The First Wind Operating Entities established no reserves for uncertain tax positions.
Other Income (Expenses)
Other income and expenses include gains or losses on the sale of assets, losses on disposal and impairment of assets, losses on early extinguishments of debt, interest income, settlements, and immaterial miscellaneous income.
Losses on disposal of assets for the year ended December 31, 2012 include the carrying value of the assets that were written off as a result of the Kahuku BESS fire. The write-off of the Kahuku BESS was in the amount of $22.9 million. Utility network upgrades, whose carrying value had previously been presented as other current assets and other non-current assets, were also written off in the amount of $5.4 million and included in other expenses in the accompanying combined statements of operations. Included in other income for the year ended December 31, 2013, is $13.5 million in related property and casualty insurance recoveries.
Losses on early extinguishments of debt for the years ended December 31, 2012 and 2013 were $43 million and $8.0 million, respectively. In 2012 and 2013, these losses related primarily to the CSSW Loan in 2012 and the various loans paid off with proceeds from the Northeast Wind Capital II Term Loan B, as defined and further discussed in Note 6, in 2013.
Included in other income for the year ended December 31, 2013, is a gain of $25.9 million related to the settlement received as part of the Master Agreement, further discussed in Note 10.
Commitments and Contingencies
Liabilities for loss contingencies arising from claims, assessments, litigation, fines and penalties and other sources are recorded when it is probable that a liability has been incurred and the amount of the assessment can be reasonably estimated. Legal costs incurred in connection with loss contingencies are expensed as incurred.
F-253
Table of Contents
FIRST WIND OPERATING ENTITIES
Notes to Combined Financial Statements
Leases
In the ordinary course of business, the First Wind Operating Entities have entered into non-cancelable operating leases, such as land leases to site its renewable energy projects, office facilities and related equipment leases and construction equipment leases. These leases expire at various dates through 2056, but may include options that permit renewals for additional periods. Rent abatements and escalations are recognized on a straight-line basis over the lease term, including any option period included in the determination of the lease term.
On November 21, 2012, the First Wind Operating Entities sold substantially all of Bull Hill’s property, plant and equipment to a financial institution and simultaneously entered into a long-term lease with that financial institution for use of these assets. The transaction was accounted for under ASC 840-40 Sale-Leaseback Transactions. The transaction does not qualify as a sale as the First Wind Operating Entities have the option to purchase the leased assets at fair value in year 15 of the lease, and as a result, has been accounted for as a financing. The leased assets remain on the First Wind Operating Entities’ books and are depreciated over their useful lives. The First Wind Operating Entities’ remaining obligations under the lease are recorded as long-term debt as further described in Note 6.
Fair Value of Financial Instruments
The carrying amounts of cash and cash equivalents, restricted cash, accounts receivable, accounts payable and accrued expenses approximates their fair value because of the short-term maturity of these instruments. The First Wind Operating Entities believe the carrying amounts of debt approximate fair value as the instruments generally bear interest at variable rates. The Kahuku Term Loan (as defined in Note 6) is at a fixed rate, but interest rates and risk premiums have not fluctuated significantly since the loan was made and therefore the First Wind Operating Entities believe the carrying amount approximates fair value. The estimated fair values of derivative instruments are calculated based on market rates. These values represent the estimated amounts the First Wind Operating Entities would receive or pay to terminate the agreements, taking into consideration market rates and the current creditworthiness of the First Wind Operating Entities and the counterparties.
Significant New Accounting Policies
In May 2014, the FASB issued Accounting Standards Update 2014-09, Revenue from Contracts with Customers (Topic 606) (ASU 2014-09), which provides that the amount of revenue recognized should be equal to the consideration that the entity expects to be entitled to for those promised goods or services. ASU 2014-09 provides for a five-step approach to recognizing and measuring revenue and supersedes most current revenue recognition guidance. ASU 2014-09 is effective for reporting periods beginning after December 15, 2017 for non-public entities, with early adoption permitted for reporting periods beginning after December 15, 2016. The standard permits the use of either a retrospective or a cumulative effect transition method. The First Wind Operating Entities have not determined when they will adopt ASU 2014-09, or which transition method they will use.
F-254
Table of Contents
FIRST WIND OPERATING ENTITIES
Notes to Combined Financial Statements
NOTE 4—NONCONTROLLING INTERESTS AND TAX EQUITY TRANSACTIONS
The First Wind Operating Entities have sold equity interests in certain projects under tax equity financing arrangements. These financing arrangements entitle the tax equity investors to substantially all of the production and investment tax credits and taxable income or loss generated by the project, including the tax benefits of accelerated depreciation available under the tax code (together referred to as the project’s “tax attributes”), and a portion of the operating cash flows, until the tax equity investors achieve their targeted investment returns and return of capital. Upon a tax equity investments’ meeting targets specified in the related tax equity agreement, the First Wind Operating Entities have the option to acquire the tax equity investors’ interest at the price described within the respective agreements. Generally, this price would be the higher of the investor’s capital account or the then-current market value of their interest or an amount sufficient to provide the investor with the return outlined in the agreement. The First Wind Operating Entities retain controlling interests in the subsidiaries that own the projects, and combine such subsidiaries. The terms of the tax equity financing arrangements also include restrictions on the transfer of assets from the relevant subsidiary without the consent of the tax equity investors.
For the years ended December 31, 2012 and 2013, the First Wind Operating Entities made distributions to its tax equity investors and a noncontrolling member of the subsidiary that owns KWP I of $4.8 million and $2.7 million, respectively, and to the tax equity investors in the subsidiary that owns Mars Hill of $3.5 million and $1.9 million, respectively. The First Wind Operating Entities made distributions to the tax equity investor in Sheffield of $35.6 million and $10 million for the years ended December 31, 2012 and 2013, respectively. On May 31, 2013, the First Wind Operating Entities repurchased JPMCC’s tax equity interest in Sheffield for $8.9 million.
In October 2012, the First Wind Operating Entities purchased from its partner, Makani Nui Associates, LLC, the membership interests in Hawaii Wind Partners, LLC, partial owners of KWP I. The equity interests were purchased for $7 million.
On August 22, 2013, the First Wind Operating Entities entered into a tax equity financing agreement with Firstar Development, LLC (Firstar) for the sale of equity interests in Mass Solar 1 Holdings, LLC. The initial capital contribution of $1.2 million was received in 2013 and was accounted for as a deposit in accordance with ASC 360-20 Property, Plant and Equipment—Real Estate Sales (ASC 360-20), and is classified within other liabilities on the accompanying combined balance sheet.
Noncontrolling interests in subsidiaries are comprised of the following as of December 31, 2012 and 2013 (in thousands):
| December 31, 2012 |
December 31, 2013 |
|||||||
| Noncontrolling interest attributable to: |
||||||||
| Tax equity investors |
$ | 124,591 | $ | 102,378 | ||||
| Other subsidiary equity ownership interests |
2,771 | 4,376 | ||||||
|
|
|
|
|
|||||
| Total noncontrolling interest |
$ | 127,362 | $ | 106,754 | ||||
|
|
|
|
|
|||||
F-255
Table of Contents
FIRST WIND OPERATING ENTITIES
Notes to Combined Financial Statements
NOTE 5—PROPERTY, PLANT AND EQUIPMENT, NET
Property, plant and equipment is comprised of the following as of December 31, 2012 and December 31, 2013 (in thousands):
| December 31, 2012 |
December 31, 2013 |
Estimated Useful Life | ||||||||
| Land |
$ | 9,453 | $ | 12,354 | ||||||
| Land and leasehold improvements |
73,205 | 73,371 | Economic life/ remaining lease term | |||||||
| Furniture, fixtures, vehicles and other |
10,544 | 11,015 | 3 - 7 years | |||||||
| Asset retirement obligations |
9,575 | 7,627 | 25 - 30 years | |||||||
| Power generation equipment |
982,600 | 990,906 | 3 - 30 years | |||||||
|
|
|
|
|
|||||||
| 1,085,377 | 1,095,273 | |||||||||
| Accumulated depreciation |
(143,970 | ) | (185,584 | ) | ||||||
|
|
|
|
|
|||||||
| $ | 941,407 | $ | 909,689 | |||||||
|
|
|
|
|
|||||||
Depreciation expense for all property, plant and equipment for the years ended December 31, 2012 and 2013 was $37.2 million and $42.2 million, respectively.
The First Wind Operating Entities have determined that their long-term PPAs at Kahuku, KWP I, KWP II and Mars Hill are operating leases. The property, plant and equipment at these projects subject to the operating leases included in the December 31, 2013 combined balance sheet were as follows (in thousands):
| Land |
$ | 8,046 | ||
| Land and leasehold improvements |
20,686 | |||
| Furniture, fixtures, vehicles and other |
5,044 | |||
| Asset retirement obligations |
3,371 | |||
| Wind power generation equipment |
328,158 | |||
|
|
|
|||
| 365,305 | ||||
| Accumulated depreciation |
(65,578 | ) | ||
|
|
|
|||
| $ | 299,727 | |||
|
|
|
Since the revenues of the projects are based on their respective variable output, there are no minimum future rental payments; therefore, the revenues of the projects are classified as contingent rental payments. Contingent rental payments included in income were $46.7 million and $41.1 million for the years ended December 31, 2012 and 2013, respectively.
NOTE 6—DEBT
The First Wind Operating Entities enter into loan agreements with financial institutions to finance the construction of renewable energy projects and the acquisition of turbines, solar panels and related equipment. The First Wind Operating Entities’ combined debt includes recourse and non-recourse borrowings entered into by the First Wind Operating Entities.
F-256
Table of Contents
FIRST WIND OPERATING ENTITIES
Notes to Combined Financial Statements
The First Wind Operating Entities had the following loans outstanding as of December 31, 2012 and 2013 (in thousands except percentages):
| Balance at | ||||||||||||||||
| Interest Rate | Maturity | December 31, 2012 |
December 31, 2013 |
|||||||||||||
| Construction Loans |
||||||||||||||||
| Mass Solar Construction Loan |
L + 3.50 | %(1) | 2014 | $ | — | $ | 7,615 | |||||||||
| Term Loans |
||||||||||||||||
| Maine Wind Term Loan |
N/A | N/A | 10,084 | — | ||||||||||||
| New York Wind Term Loan |
N/A | N/A | 47,809 | — | ||||||||||||
| Stetson Holdings Term Loan |
N/A | N/A | 44,946 | — | ||||||||||||
| Kahuku Term Loan |
3.56 | % | 2028 | 77,959 | 73,935 | |||||||||||
| Huron Holdings Term Loan |
N/A | N/A | 14,691 | — | ||||||||||||
| Rollins Term Loan |
N/A | N/A | 22,607 | — | ||||||||||||
| Sheffield Term Loan |
N/A | N/A | 8,224 | — | ||||||||||||
| KWP II Term Loan |
L + 3.00 | %(2) | 2018 | 45,056 | 43,540 | |||||||||||
| Hawaiian Island Holdings Loan |
L + 8.00 | %(2) | 2015 | 20,576 | 15,473 | |||||||||||
| Northeast Wind Capital II Loan |
N/A | N/A | 150,000 | — | ||||||||||||
| Northeast Wind Capital II Term Loan B |
L + 4.00 | %(3) | 2020 | — | 316,600 | |||||||||||
| Other |
||||||||||||||||
| Bull Hill Financing |
2.81 | % | 2032 | 71,836 | 62,055 | |||||||||||
|
|
|
|
|
|||||||||||||
| Gross Indebtedness |
|
513,788 | 519,218 | |||||||||||||
| Unamortized Discount |
|
— | (3,151 | ) | ||||||||||||
|
|
|
|
|
|||||||||||||
| Carrying Value |
|
513,788 | 516,067 | |||||||||||||
| Debt with maturities less than one year |
|
34,353 | 18,055 | |||||||||||||
|
|
|
|
|
|||||||||||||
| Total long-term debt |
|
$ | 479,435 | $ | 498,012 | |||||||||||
|
|
|
|
|
|||||||||||||
| (1) | As of December 31, 2013, L + equals 1 month LIBOR plus x% |
| (2) | As of December 31, 2013, L + equals 3 month LIBOR plus x% |
| (3) | As long as LIBOR is under 1.00% interest is equal to 1.00% + 4.00% |
Debt Facilities
Maine Wind Term Loan. On March 27, 2007, the First Wind Operating Entities through Maine Wind Partners, LLC (Maine Wind Partners), an indirect subsidiary, entered into a $24.8 million term loan facility (Maine Wind Term Loan) with HSH Nordbank AG, New York Branch (HSH). The Maine Wind Term Loan is secured by a pledge of Maine Wind Partners’ interest in Mars Hill, as well as by the assets of Maine Wind Partners and its subsidiary. Interest is payable at LIBOR plus a margin ranging from 1.50% to 3.50%, as defined in the financing agreement. The Maine Wind Term Loan was scheduled to mature March 27, 2022.
On November 14, 2013, the First Wind Operating Entities repaid the outstanding balance of the Maine Wind Term Loan in the amount of $9.5 million with proceeds from the Northeast Wind Capital II Term Loan B (as defined below). A write-off of deferred financing costs in the amount of $0.4 million was recognized as a result of this transaction. This item related to the early extinguishment of debt is included in other expenses in the accompanying combined statements of operations.
F-257
Table of Contents
FIRST WIND OPERATING ENTITIES
Notes to Combined Financial Statements
KWP I Term Loan. On August 16, 2007, the First Wind Operating Entities through KWP I, an indirect subsidiary, entered into a term loan with HSH which allows KWP I to draw up to $15 million to finance any payment due upon the termination of its commodity swap (KWP I Term Loan). The KWP I Term Loan has a term of five years from the termination of the commodity swap and bears interest at LIBOR plus 6.00%. The KWP I Term Loan is secured by the KWP I project and all of its assets. As of December 31, 2012, no amount on this term loan had been drawn. In 2013, the related commodity swap expired and amounts under this loan are no longer available. The KWP I Term Loan provides for a $3 million letter of credit facility (KWP I LC Facility) to support certain obligations including KWP I’s land lease and commodity swap agreement. The KWP I LC Facility is subject to a quarterly unutilized commitment fee of 0.50%. As of December 31, 2012 and 2013, the issued letters of credit totaled $2.5 million.
New York Wind Term Loan. On March 30, 2009, the First Wind Operating Entities, through New York Wind, LLC (New York Wind), an indirect subsidiary, entered into a secured promissory note (New York Wind Term Loan) with Norddeutsche Landesbank Girozentrale, New York Branch (Nord/LB), and HSH, which allowed the First Wind Operating Entities to borrow $95.5 million under a term loan facility and up to $10 million under a letter of credit facility (New York Wind LC Facility). In November 2009, Cohocton, repaid $45.5 million of amounts outstanding under the promissory note from proceeds received under the ARRA grant. On September 1, 2010, the First Wind Operating Entities refinanced the New York Wind Term Loan. This refinancing increased the loan size to $79 million and the New York Wind LC Facility to $14 million, extended the maturity date to March 1, 2018, and replaced HSH with Union Bank, N.A. (Union Bank), Deutsche Bank Trust Company Americas (Deutsche Bank) and Commerzbank AG, New York Branch as lenders. As of December 31, 2012, the issued letters of credit totaled $10.8 million. The New York Wind Term Loan is secured by a pledge of CSSW Cohocton Holdings, LLC’s interest in New York Wind and its subsidiaries, as well as by the assets of New York Wind and its subsidiaries. Semiannual principal payments began in December 2010, with interest payable at LIBOR plus 3.25% during years 1-3, 3.5% during years 4-6 and 3.75% from and after year 7.
On November 14, 2013, the First Wind Operating Entities repaid the outstanding balance of the New York Wind Term Loan in the amount of $44.1 million with proceeds from the Northeast Wind Capital II Term Loan B (as defined below). A loss on early extinguishment of debt was recognized in the amount of $0.2 million for the settlement and termination of a related interest rate swap, and is included in other expenses on the accompanying combined statements of operations.
CSSW Loan. During July and September 2009, the First Wind Operating Entities completed a transaction with affiliates of Alberta Investment Management Corporation (AIMCO) (CSSW Loan) in which it raised $115 million through issuance of: (i) indebtedness in CSSW, LLC (CSSW) and (ii) Series A-2 units in First Wind. The First Wind Operating Entities ascribed value to the loan and the Series A-2 Units based on their relative fair values at the time of the transaction. As such, approximately $24.3 million was allocated to the Series A-2 Units and approximately $90.7 million was allocated to the loan. In April 2010, the First Wind Operating Entities received an additional $15 million under the CSSW Loan for achieving commercial operation of Stetson II.
On June 15, 2012, the First Wind Operating Entities repaid the outstanding balance of the CSSW Loan in the amount of $155.1 million with proceeds from the Northeast Wind Capital II Term Loan (as defined below) and equity contributions from First Wind. The unamortized discount was written off in the amount of $16.1 million and a $23.3 million loss was recognized in the amount of the call premium paid. This loss on the early extinguishment of debt is included in other expenses in the accompanying combined statements of operations.
F-258
Table of Contents
FIRST WIND OPERATING ENTITIES
Notes to Combined Financial Statements
Stetson Holdings Term Loan. On December 22, 2009, Stetson I, entered into a construction and term loan facility (Stetson Holdings Term Loan) for $116.3 million with BNP Paribas and HSH. This loan provided a $71 million construction-term loan for both Stetson I and Stetson II, as well as an additional $18.6 million construction loan for Stetson II. In addition, a letter of credit facility of $26.7 million was provided. The letter of credit is subject to a commitment fee equal to 1.0% biannually of the daily average unutilized commitment. Interest is payable semi-annually at LIBOR plus 3.25% for the first three years and then increasing to LIBOR plus 3.50%. As of December 31, 2012, the outstanding balance on the letter of credit facility was $17.9 million and the related interest rate was 3.25%. The Stetson Holdings Loan is secured by a pledge of Stetson Wind Holdings Company, LLC’s interests in Stetson I and its subsidiary and all the assets of both Stetson I and Stetson II.
On November 14, 2013, the First Wind Operating Entities repaid the outstanding balance of the Stetson Holdings Term Loan in the amount of $40.6 million with proceeds from the Northeast Wind Capital II Term Loan B (as defined below). A write-off of deferred financing costs in the amount of $1.8 million and a loss related to the termination of the interest rate swap of $0.7 million were recognized as a result of this transaction. These items related to the early extinguishment of debt are included in other expenses in the accompanying combined statements of operations.
Kahuku Term Loan. On July 26, 2010, the First Wind Operating Entities, through Kahuku, an indirect subsidiary, entered into a $117.3 million construction and term loan facility (Kahuku Term Loan) guaranteed by the U.S. Department of Energy (DOE). The loan is secured by the Kahuku project and all of its assets. The DOE also has a $10 million guarantee from First Wind. Principal repayment began in March 2012 and the Kahuku Term Loan matures in June 2028. Interest accrues at a rate per annum on the unpaid principal balance with the interest rates set on the dates of each loan advance. On February 9, 2012, the First Wind Operating Entities received the proceeds from an ARRA grant in the amount of $35.2 million. In March 2012, the First Wind Operating Entities repaid $28.9 million of the Kahuku Term Loan with proceeds from the ARRA grant.
Huron Holdings Term Loan. On November 22, 2010, the First Wind Operating Entities, through Huron Holdings, LLC, an indirect subsidiary, entered into a combination bridge and term loan with HSH, as lead arranger and the lenders parties thereto (Huron Holdings Term Loan). The bridge loan totaled $12 million and a letter of credit facility was issued for $3.5 million (Huron Holdings LC). On January 31, 2012, the First Wind Operating Entities satisfied the term conversion conditions of the Huron Holdings Term Loan, which provided for an additional $4 million in borrowings and increased the Huron Holdings LC to $8 million. The Huron Holdings Term Loan is secured by a pledge of Huron Holdings’ interest in Steel Winds I and Steel Winds II, as well as by the assets of Huron Holdings and its subsidiaries. Interest on the Huron Holdings Term Loan is paid semi-annually at a rate of LIBOR plus 4.5%. The Huron Holdings Term Loan matures on November 22, 2015. The Huron Holdings LC is subject to a semi-annual LC commitment fee of 1.5% of the average available balance for such period. As of December 31, 2012, the outstanding balance on the Huron Holdings LC was $1.9 million.
On November 14, 2013, the First Wind Operating Entities repaid the outstanding balance of the Huron Holdings Term Loan in the amount of $13.4 million with proceeds from the Northeast Wind Capital II Term Loan B (as defined below). A write-off of deferred financing costs in the amount of $1.2 million and a loss related to the termination of the interest rate swap of $0.2 million were recognized as a result of this transaction. These items related to the early extinguishment of debt are included in other expenses in the accompanying combined statements of operations.
Rollins Term Loan. On December 3, 2010, the First Wind Operating Entities, through Rollins, an indirect subsidiary, entered into an $87 million construction loan facility with Nord/LB and Keybank
F-259
Table of Contents
FIRST WIND OPERATING ENTITIES
Notes to Combined Financial Statements
National Association (KeyBank) as joint lead arranger and joint bookrunner and the lenders parties thereto. On January 18, 2012, the First Wind Operating Entities repaid $53.2 million of the construction loan with proceeds from the ARRA grant program. The remaining portion of the loan was repaid and converted into a $25 million term loan with KeyBank (Rollins Term Loan). The Rollins Term Loan is secured by the assets of the Rollins project. Interest is payable quarterly at LIBOR plus an applicable margin ranging from 2.50% to 2.75%, as defined in the financing agreement. The Rollins Term Loan matures on January 18, 2019. In addition, a letter of credit facility in the amount of $21 million was provided (Rollins LC Facility). The Rollins LC Facility is subject to a quarterly letter of credit fee of 2.50% of the average stated amount of the letter of credit, and a commitment fee of 0.625% of the average available balance for such quarter. As of December 31, 2012, the outstanding balance of the Rollins LC was $21 million, which is the maximum available on the facility.
On November 14, 2013, the First Wind Operating Entities repaid the outstanding balance of the Rollins Term Loan in the amount of $20.4 million with proceeds from the Northeast Wind Capital II Term Loan B (as defined below). A write-off of deferred financing costs in the amount of $0.3 million and a loss related to the termination of the interest rate swap of $0.1 million were recognized as a result of this transaction. These items related to the early extinguishment of debt are included in other expenses in the accompanying combined statements of operations.
Sheffield Term Loan. On December 23, 2010, the First Wind Operating Entities, through Sheffield Holdings, LLC (Sheffield Holdings), an indirect subsidiary, entered into a $71.3 million construction loan with KeyBank as Arranger and the lenders parties thereto. On October 27, 2011, the First Wind Operating Entities satisfied the term conversion conditions of the loan and repaid $44.3 million of the outstanding balance with tax equity transaction proceeds and the remainder was converted into a $13 million term loan facility (Sheffield Term Loan). The Sheffield Term Loan is secured by a pledge of Sheffield Holdings’ interest in Sheffield, as well as by the assets of Sheffield Holdings in its subsidiaries. The Sheffield Term Loan was scheduled to mature on October 31, 2015. In addition, a letter of credit facility was issued for $1.5 million (Sheffield LC Facility) and the related interest rate was 3.50% at December 31, 2012.
On May 31, 2013, Sheffield entered into an agreement with KeyBank which amended the financing agreement entered into by Sheffield Holdings. On this date, the outstanding balance of $6.9 million was repaid and the term loan facility was increased to $22.1 million. In addition, under the amended and restated agreement, Sheffield replaced Sheffield Holdings as the borrower. The maturity date was extended to December 31, 2021. Interest is payable quarterly at LIBOR plus 2.75% through year 3, 3.00% during years 4-6, and 3.25% thereafter.
On November 14, 2013, the First Wind Operating Entities repaid the outstanding balance of the Sheffield Term Loan in the amount of $21.4 million with proceeds from the Northeast Wind Capital II Term Loan B (as defined below). A write-off of deferred financing costs in the amount of $1.1 million and a loss related to the termination of the interest rate swap of $0.1 million were recognized as a result of this transaction. These items related to the early extinguishment of debt are included in other expenses in the accompanying combined statements of operations.
KWP II Term Loan. On November 21, 2011 the First Wind Operating Entities, through KWP II, an indirect subsidiary, entered into a construction and term loan facility with KeyBank and Union Bank. On July 31, 2012, the First Wind Operating Entities satisfied the term conversion conditions and the outstanding principal was converted to a term loan facility (KWP II Term Loan) and additional borrowings were provided in the aggregate amount of $47.8 million, which is the maximum term loan
F-260
Table of Contents
FIRST WIND OPERATING ENTITIES
Notes to Combined Financial Statements
commitment. The KWP II Term Loan matures on July 31, 2018. The loan is secured by KWP II and all of its assets. Interest is payable quarterly at a rate of LIBOR plus an applicable margin of 3.00% through year 4 and 3.25% thereafter. In addition, a letter of credit facility of $6.1 million was provided (KWP II LC Facility). The KWP II LC Facility is subject to a quarterly letter of credit fee of 3.00% and a commitment fee of 0.625% of the average available balance for such quarter. As of December 31, 2012 and 2013, the outstanding balance of the KWP II LC Facility was $6.1 million and $5.7 million, respectively.
Hawaiian Island Holdings Loan. On November 21, 2011, the First Wind Operating Entities through Hawaiian Island Holdings, LLC, an indirect subsidiary, entered into a $25 million secured promissory note with KeyBank as arranger (Hawaiian Island Holdings Loan). The note is guaranteed by First Wind. The Hawaiian Island Holdings Loan is scheduled to mature on November 19, 2015. The First Wind Operating Entities is required to make principal payments in the amount of $5 million prior to June 30, 2015 so that the outstanding balance at that date is no greater than $15.6 million. Interest is payable quarterly and at the maturity date at LIBOR plus an applicable margin of 8.00%.
First Wind Pacific Holdings Loan. On December 22, 2011, First Wind Pacific Holdings, LLC, and indirect subsidiary, entered into a secured promissory note with KeyBank, as lender, in the amount of $30 million (First Wind Pacific Holdings Loan). On March 1, 2012, the First Wind Operating Entities paid the lender a duration fee of $0.6 million as required under the note. The First Wind Operating Entities repaid the outstanding balance of $30 million on June 15, 2012 with proceeds from the sale of subsidiary interests to NE Wind Holdings.
Bull Hill Financing. On April 20, 2012, the First Wind Operating Entities entered into a construction financing agreement including a construction loan, an ARRA grant bridge loan and a letter of credit facility. Union Bank served as Project LC Issuing Bank, Administrative Agent and Collateral Agent for the Secured Parties. On November 21, 2012, the First Wind Operating Entities sold substantially all of Bull Hill’s property, plant and equipment to a financial institution and simultaneously entered into a long-term lease with that financial institution for the use of the assets. The First Wind Operating Entities received proceeds in the amount of $95.2 million from the execution of the sale-leaseback transaction. These proceeds were used to the pay the outstanding obligation under the financing agreement with Union Bank in the amount of $67.7 million and to make an initial lease payment in the amount of $22.9 million. In 2013, a payment to Union Bank was made in the amount of $7.8 million that resulted from a purchase price adjustment and is reflected in the carrying value of debt on the accompanying combined balance sheets. As per the terms of the agreement, the First Wind Operating Entities will continue to operate the wind energy project and has the option to extend the lease or repurchase the assets sold at the end of the lease term. The First Wind Operating Entities has recorded its obligations under the lease as debt on the combined balance sheets.
In addition, a letter of credit facility was provided in the amount of $5.9 million by Bankers Commercial Corporation (Bull Hill LC Facility). The Bull Hill LC Facility is subject to quarterly LC fees of 2.50% from lease commencement through year 5, and 2.75% thereafter. As of December 31, 2012 and 2013, the outstanding balance on the Bull Hill LC facility was $5.4 million and $5.6 million, respectively.
Northeast Wind Capital II Term Loan. On June 15, 2012, the First Wind Operating Entities, through Northeast Wind Capital II, LLC (NE Wind Capital II), an indirect subsidiary, entered into a secured term loan in the aggregate principal amount of $150 million with NE Wind Holdings (Northeast
F-261
Table of Contents
FIRST WIND OPERATING ENTITIES
Notes to Combined Financial Statements
Wind Capital II Term Loan). The Northeast Wind Capital II Term Loan is secured by a pledge of NE Wind Partners II’s membership interests in NE Wind Capital II and subsidiaries. The proceeds of this loan were used to extinguish the CSSW Loan. Interest accrues at a fixed rate of 8% and is payable semi-annually.
On November 14, 2013, the First Wind Operating Entities repaid the outstanding balance of the Northeast Wind Capital II Term Loan in the amount of $150 million with proceeds from the Northeast Wind Capital II Term Loan B (as defined below).
Northeast Wind Capital II Term Loan B. On November 14, 2013, the First Wind Operating Entities, through NE Wind Capital II, entered into a credit agreement with Morgan Stanley Senior Funding, Inc., BNP Paribas, CIT Finance, LLC, Goldman Sachs Bank USA, Industrial and Commercial Bank of China Limited, New York, Keybank National Association, and Union Bank, N.A., as joint lead arrangers and joint bookrunners (Northeast Wind Capital II Term Loan B). Proceeds from the Northeast Wind Capital II Term Loan B, in the amount of $320 million, net of a 1% discount, were used to pay the then outstanding balances of the Northeast Wind Capital II Term Loan, Maine Wind Term Loan, New York Wind Term Loan, Stetson Holdings Term Loan, Huron Holdings Term Loan, Rollins Term Loan and Sheffield Term Loan. The effective interest rate of the Northeast Wind Capital II Term Loan B is 7.348% and it is scheduled to mature on November 14, 2020. Principal and interest payments are made quarterly at a rate equal to a base rate plus an applicable margin. In addition, the credit agreement provides for letter of credit facilities totaling $80 million during the first ninety days of the agreement which will reduce to $75 million thereafter (Northeast Wind Capital II LC). Letter of credit fees of 4.0% for issued letters of credit and commitment fees of 0.75% on the undrawn balance of the facilities will be payable quarterly. As of December 31, 2013, the outstanding balance on the Northeast Wind Capital II LC was $69.3 million.
Mass Solar Construction Loan. On August 22, 2013, Mass Solar 1 entered into a financing agreement for a $27 million construction and term loan facility (Mass Solar Construction Loan), a $20.2 million tax equity grant bridge loan (Mass Solar TE Bridge Loan), a $2 million working capital loan (Mass Solar Working Capital Loan), and a $3.4 million letter of credit facility (Mass Solar LC Facility). The Mass Solar Construction loan is scheduled to mature on July 31, 2014, but Mass Solar 1 has the option to convert the construction loan facility to a term loan facility before that date upon achieving all necessary conditions including substantial completion of the solar energy project as defined in the agreement. The amount of the term conversion shall not exceed the lesser of $27 million or the highest principal balance that would allow certain minimum debt service coverage ratios to be met throughout the term of the loan. Construction loan amounts borrowed in excess of the final term conversion amount calculated would have to be repaid before term conversion. Interest on the Mass Solar Construction Loan is payable quarterly at LIBOR plus an applicable margin of 3.50%. The Mass Solar TE Bridge Loan is scheduled to mature at the earlier of the day after the receipt of proceeds from Firstar’s final funding or the term conversion date of the Mass Solar Construction Loan. As of December 31, 2013, $19.4 million was available for borrowing under the Mass Solar Construction Loan. Interest on the Mass Solar TE Bridge Loan is payable quarterly at LIBOR plus an applicable margin of 3.50%. Upon term conversion of the construction loan facility, Mass Solar 1 will be able to draw on the Mass Solar Working Capital Loan. As of December 31, 2013, Mass Solar 1 had not drawn on the Mass Solar TE Bridge Loan or the Mass Solar LC Facility. Each facility is subject to a quarterly unutilized commitment fee of 0.75% during its availability period.
F-262
Table of Contents
FIRST WIND OPERATING ENTITIES
Notes to Combined Financial Statements
Aggregate Debt Repayments
The First Wind Operating Entities’ estimated aggregate debt repayments as of December 31, 2013 for the next five years and thereafter are as follows (in thousands):
| 2014 |
$ | 18,538 | ||
| 2015 |
26,148 | |||
| 2016 |
11,634 | |||
| 2017 |
12,482 | |||
| 2018 |
49,371 | |||
| Thereafter |
401,045 | |||
|
|
|
|||
| $ | 519,218 | |||
|
|
|
NOTE 7 —DERIVATIVE FINANCIAL INSTRUMENTS
As discussed in Note 3, in the normal course of business the First Wind Operating Entities employ a variety of financial instruments to manage exposure to fluctuations in interest rates and energy prices. The First Wind Operating Entities have not applied hedge accounting to these instruments and record changes in fair value related to derivative financial instruments in the combined statements of operations. The following tables reflect the amounts that are recorded in the First Wind Operating Entities’ combined balance sheets as of December 31, 2012 and 2013 (in thousands):
| December 31, 2012 | December 31, 2013 | |||||||||||||||||||||||
| Interest Rate Derivatives |
Commodity Derivatives |
Total | Interest Rate Derivatives |
Commodity Derivatives |
Total | |||||||||||||||||||
| Balance Sheet: |
||||||||||||||||||||||||
| Assets |
||||||||||||||||||||||||
| Derivative assets |
$ | — | $ | 11,913 | $ | 11,913 | $ | — | $ | 7,557 | $ | 7,557 | ||||||||||||
| Long-term derivative assets |
— | 52,643 | 52,643 | 2,118 | 41,032 | 43,150 | ||||||||||||||||||
|
|
|
|
|
|
|
|
|
|
|
|
|
|||||||||||||
| Total assets |
$ | — | $ | 64,556 | $ | 64,556 | $ | 2,118 | $ | 48,589 | $ | 50,707 | ||||||||||||
|
|
|
|
|
|
|
|
|
|
|
|
|
|||||||||||||
| Liabilities |
||||||||||||||||||||||||
| Derivative liabilities |
$ | 3,633 | $ | 4,722 | $ | 8,355 | $ | 644 | $ | — | $ | 644 | ||||||||||||
| Long-term derivative liabilities |
8,806 | — | 8,806 | 15 | — | 15 | ||||||||||||||||||
|
|
|
|
|
|
|
|
|
|
|
|
|
|||||||||||||
| Total liabilities |
$ | 12,439 | $ | 4,722 | $ | 17,161 | $ | 659 | $ | — | $ | 659 | ||||||||||||
|
|
|
|
|
|
|
|
|
|
|
|
|
|||||||||||||
F-263
Table of Contents
FIRST WIND OPERATING ENTITIES
Notes to Combined Financial Statements
The following tables reflect the amounts that are recorded in the First Wind Operating Entities’ combined statements of operations for the years ended December 31, 2012 and 2013 related to derivative financial instruments (in thousands):
| Years Ended | ||||||||||||||||||||||||
| December 31, 2012 | December 31, 2013 | |||||||||||||||||||||||
| Interest Rate Derivatives |
Commodity Derivatives |
Total | Interest Rate Derivatives |
Commodity Derivatives |
Total | |||||||||||||||||||
| Statement of Operations: |
||||||||||||||||||||||||
| Revenue: |
||||||||||||||||||||||||
| Risk management activities related to operating projects |
||||||||||||||||||||||||
| Net cash settlements |
$ | — | $ | 10,576 | $ | 10,576 | $ | — | $ | 5,656 | $ | 5,656 | ||||||||||||
| Fair value changes |
— | 4,978 | 4,978 | — | (11,245 | ) | (11,245 | ) | ||||||||||||||||
|
|
|
|
|
|
|
|
|
|
|
|
|
|||||||||||||
| — | 15,554 | 15,554 | — | (5,589 | ) | (5,589 | ) | |||||||||||||||||
| Other income (expenses): |
||||||||||||||||||||||||
| Fair value changes |
(3,459 | ) | — | (3,459 | ) | 7,566 | — | 7,566 | ||||||||||||||||
| Interest expense, net of capitalized interest: |
||||||||||||||||||||||||
| Net cash settlements |
(3,165 | ) | — | (3,165 | ) | (2,589 | ) | — | (2,589 | ) | ||||||||||||||
|
|
|
|
|
|
|
|
|
|
|
|
|
|||||||||||||
| Net income (loss) |
$ | (6,624 | ) | $ | 15,554 | $ | 8,930 | $ | 4,977 | $ | (5,589 | ) | $ | (612 | ) | |||||||||
|
|
|
|
|
|
|
|
|
|
|
|
|
|||||||||||||
Interest Rate Swap and Cap Agreements
The First Wind Operating Entities are subject to market risks from changes in interest rates. The First Wind Operating Entities regularly assess these risks and have established business strategies regarding the use of derivative instruments to protect against adverse effects. Under interest rate swap agreements, the First Wind Operating Entities may agree to swap, at specified intervals, contractually stated fixed rates for the variable rates implicit in their debt financing agreements, based on agreed-upon notional amounts. Under interest rate cap agreements, the First Wind Operating Entities settle the difference, if positive or negative, between the underlying variable rates and contractually specified cap rates, based on agreed-upon notional amounts.
Commodity Swap Agreements
The First Wind Operating Entities enter into long-term cash-settled swap agreements to hedge commodity price variability inherent in electricity sales arrangements. If the First Wind Operating Entities sell electricity into an independent system operator (ISO) market and there is no PPA available, the First Wind Operating Entities may enter into a commodity swap to stabilize all or a portion of their estimated revenue stream. These price swap agreements involve periodic settlements for specified quantities of electricity based on a fixed price and are obligated to pay the counterparty market price for the same quantities of electricity.
F-264
Table of Contents
FIRST WIND OPERATING ENTITIES
Notes to Combined Financial Statements
As of December 31, 2012 and 2013, the First Wind Operating Entities were party to the following derivative contracts (in thousands, except notional amounts):
| December 31, 2012 | ||||||||||||||||||||||||||||||||
| Underlying |
Current or Remaining Notional Amount |
Units | Periodic Settlement |
Expiration | Derivative Assets |
Derivative Liabilities |
Long-term Derivative Assets |
Long-term Derivative Liabilities |
||||||||||||||||||||||||
| Commodity Derivatives: |
||||||||||||||||||||||||||||||||
| Project: |
||||||||||||||||||||||||||||||||
| Cohocton |
NYISO Zone C Real-Time Power |
1,676,986 | MWH | Monthly | 2020 | $ | 5,043 | $ | — | $ | 16,196 | $ | — | |||||||||||||||||||
| Stetson I & II |
ISO-NE Mass Hub Real-Time Power | 872,497 | MWH | Monthly | 2019 | 5,812 | — | 32,981 | — | |||||||||||||||||||||||
| Steel Winds I & II |
NYISO Zone A Real-Time Power | 543,865 | MWH | Monthly | 2019 | 1,058 | — | 3,466 | — | |||||||||||||||||||||||
| KWP I |
NYMEX WTI Front Month Crude Oil | 73,659 | BBL | Quarterly | 2013 | — | 4,722 | — | — | |||||||||||||||||||||||
| Interest Rate Derivatives: |
||||||||||||||||||||||||||||||||
| Entity: |
||||||||||||||||||||||||||||||||
| New York Wind |
3-Month LIBOR | $ | 43,661,368 | USD | Quarterly | 2020 | — | 827 | — | 1,553 | ||||||||||||||||||||||
| Stetson I |
6-Month LIBOR | $ | 32,761,632 | USD | Semiannual | 2014-2016 | — | 1,426 | — | 3,771 | ||||||||||||||||||||||
| Huron Holdings |
6-Month LIBOR | $ | 14,029,925 | USD | Semiannual | 2020 | — | 193 | — | 307 | ||||||||||||||||||||||
| Maine Wind Partners |
3-Month LIBOR | $ | 6,051,000 | USD | Quarterly | 2017 | — | 280 | — | 683 | ||||||||||||||||||||||
| Sheffield Holdings |
3-Month LIBOR | $ | 7,694,408 | USD | Quarterly | 2015 | — | 96 | — | 58 | ||||||||||||||||||||||
| Rollins |
3-Month LIBOR | $ | 21,720,071 | USD | Quarterly | 2029 | — | 268 | — | 756 | ||||||||||||||||||||||
| KWP II |
3-Month LIBOR | $ | 42,925,969 | USD | Quarterly | 2030 | — | 543 | — | 1,678 | ||||||||||||||||||||||
|
|
|
|
|
|
|
|
|
|||||||||||||||||||||||||
| $ | 11,913 | $ | 8,355 | $ | 52,643 | $ | 8,806 | |||||||||||||||||||||||||
|
|
|
|
|
|
|
|
|
|||||||||||||||||||||||||
| December 31, 2013 | ||||||||||||||||||||||||||||||||
| Underlying | Current or Remaining Notional Amount |
Units | Periodic Settlement |
Expiration | Derivative Assets |
Derivative Liabilities |
Long-term Derivative Assets |
Long-term Derivative Liabilities |
||||||||||||||||||||||||
| Commodity Derivatives: |
||||||||||||||||||||||||||||||||
| Project: |
||||||||||||||||||||||||||||||||
| Cohocton |
NYISO Zone C Real-Time Power |
1,465,793 | MWH | Monthly | 2020 | $ | 4,288 | $ | — | $ | 14,786 | $ | — | |||||||||||||||||||
| Stetson I & II |
ISO-NE Mass Hub Real-Time Power |
738,852 | MWH | Monthly | 2019 | 2,593 | — | 22,909 | — | |||||||||||||||||||||||
| Steel Winds I & II |
NYISO Zone A Real-Time Power |
466,170 | MWH | Monthly | 2019 | 676 | — | 3,337 | — | |||||||||||||||||||||||
| Interest Rate Derivatives: |
||||||||||||||||||||||||||||||||
| Entity: |
||||||||||||||||||||||||||||||||
| KWP II |
3-Month LIBOR | 41,480,970 | USD | Quarterly | 2030 | — | 572 | 2,118 | — | |||||||||||||||||||||||
| Mass Solar 1 |
3-Month LIBOR | 13,503,028 | USD | Quarterly | 2023 | — | 72 | — | 15 | |||||||||||||||||||||||
|
|
|
|
|
|
|
|
|
|||||||||||||||||||||||||
| $ | 7,557 | $ | 644 | $ | 43,150 | $ | 15 | |||||||||||||||||||||||||
|
|
|
|
|
|
|
|
|
|||||||||||||||||||||||||
As a result of not applying hedge accounting to its derivative contracts, the First Wind Operating Entities’ have reported non-cash losses of $1.5 million and non-cash gains of $3.7 million related to marking the values of its derivative contracts to market for the years ended December 31, 2012 and 2013, respectively. These gains and losses were a result of fluctuations in the underlying forward electricity and oil prices for which the commodity price swap contracts are intended to economically hedge, and changes in underlying interest rates for which the interest rate derivative contracts are intended to economically hedge.
F-265
Table of Contents
FIRST WIND OPERATING ENTITIES
Notes to Combined Financial Statements
As of December 31, 2013, the First Wind Operating Entities have posted letters of credit in the amount of $1.5 million as collateral related to certain commodity swaps. Certain of the First Wind Operating Entities’ derivative contracts contain provisions providing the counterparties a lien on specific assets as collateral. The First Wind Operating Entities have no credit risk-related contingent features within all derivatives that affect the First Wind Operating Entities’ derivative portfolio as of December 31, 2013.
NOTE 8—ASSET RETIREMENT OBLIGATIONS
The following table presents a reconciliation of the beginning and ending aggregate carrying amounts of AROs for the year ended December 31, 2013 (in thousands):
| Balance at January 1, 2013 |
$ | 10,937 | ||
| Accretion |
898 | |||
| Revisions in estimated cash flows |
(533 | ) | ||
|
|
|
|||
| Balance at December 31, 2013 |
$ | 11,302 | ||
|
|
|
In 2013, KWP II’s ARO estimate was reduced by $0.5 million.
Accretion expense is included in depreciation and amortization on the accompanying combined statements of operations. The First Wind Operating Entities record assets related to AROs in property, plant and equipment.
NOTE 9—FAIR VALUE MEASUREMENTS
The First Wind Operating Entities hold interest rate and commodity price swaps that are carried at fair value. The First Wind Operating Entities determine fair value based upon quoted prices when available or through the use of alternative approaches when market quotes are not readily accessible or available.
Valuation techniques for fair value are based upon observable and unobservable inputs. Observable inputs reflect market data obtained from independent sources, while unobservable inputs reflect the First Wind Operating Entities’ best estimate, considering all relevant information. These valuation techniques involve some level of management estimation and judgment. The valuation process to determine fair value also includes making appropriate adjustments to the valuation model outputs to consider risk factors. The fair value hierarchy of the First Wind Operating Entities’ inputs used to measure the fair value of assets and liabilities during the current period consists of three levels:
| • | Level 1—Quoted prices for identical instruments in active markets. |
| • | Level 2—Quoted prices for similar instruments in active markets; quoted prices for identical or similar instruments in markets that are not active; and model-derived valuations in which all significant inputs and significant value drivers are observable in active markets. |
| • | Level 3—Valuations derived from valuation techniques in which one or more significant inputs or significant value drivers are unobservable. |
If inputs used to measure an asset or liability fall within different levels of the hierarchy, the categorization is based on the least observable input that is significant to the fair value measurement of the asset or liability. The First Wind Operating Entities’ assessment of the significance of a particular input to the fair value measurement in its entirety requires judgment, and considers factors specific to the asset or liability.
F-266
Table of Contents
FIRST WIND OPERATING ENTITIES
Notes to Combined Financial Statements
In accordance with the fair value hierarchy described above, the following table shows the fair value of the First Wind Operating Entities’ financial assets and liabilities that are required to be measured at fair value as of December 31, 2012 and December 31, 2013 (in thousands):
| December 31, 2012 | December 31, 2013 | |||||||||||||||||||||||||||||||
| Fair Value Measurements Using |
Fair Value Measurements Using |
|||||||||||||||||||||||||||||||
| Level 1 | Level 2 | Level 3 | Total | Level 1 | Level 2 | Level 3 | Total | |||||||||||||||||||||||||
| Assets: |
||||||||||||||||||||||||||||||||
| Interest rate derivatives |
$ | — | $ | — | $ | — | $ | — | $ | — | $ | 2,118 | $ | — | $ | 2,118 | ||||||||||||||||
| Commodity price swap derivatives |
— | — | 64,556 | 64,556 | — | 29,515 | 19,074 | 48,589 | ||||||||||||||||||||||||
|
|
|
|
|
|
|
|
|
|
|
|
|
|
|
|
|
|||||||||||||||||
| $ | — | $ | — | $ | 64,556 | $ | 64,556 | $ | — | $ | 31,633 | $ | 19,074 | $ | 50,707 | |||||||||||||||||
|
|
|
|
|
|
|
|
|
|
|
|
|
|
|
|
|
|||||||||||||||||
| Liabilities: |
||||||||||||||||||||||||||||||||
| Interest rate derivatives |
$ | — | $ | 12,439 | $ | — | $ | 12,439 | $ | — | $ | 659 | $ | — | $ | 659 | ||||||||||||||||
| Commodity price swap derivatives |
— | 4,722 | — | 4,722 | — | — | — | — | ||||||||||||||||||||||||
|
|
|
|
|
|
|
|
|
|
|
|
|
|
|
|
|
|||||||||||||||||
| $ | — | $ | 17,161 | $ | — | $ | 17,161 | $ | — | $ | 659 | $ | — | $ | 659 | |||||||||||||||||
|
|
|
|
|
|
|
|
|
|
|
|
|
|
|
|
|
|||||||||||||||||
The following table sets forth a reconciliation of changes in the fair value of derivative instruments classified as Level 3 in the fair value hierarchy for the years ended December 31, 2013 (in thousands):
| Balance as of January 1, 2013 |
$ | 64,556 | ||
| Net loss included in earnings |
(2,165 | ) | ||
| Transfers out of Level 3 |
(43,317 | ) | ||
|
|
|
|||
| Balance as of December 31, 2013 |
$ | 19,074 | ||
|
|
|
|||
| Changes in unrealized losses relating to derivatives still held as of December 31, 2013 |
$ | 2,878 | ||
|
|
|
Transfers out of Level 3 include derivatives that previously required unobservable electricity forward prices to calculate fair value. These derivatives are presented as Level 2 assets now that a change in the source of power price quotes have allowed for availability of prices throughout the remaining contract term of these derivatives.
For all derivatives, the First Wind Operating Entities have created internal valuation models to estimate the fair value, using observable data to the extent available. At each quarter-end, the models are generally prepared and reviewed by employees who manage the commodity and interest rate risks, and are then reviewed for reasonableness independently of those employees. The valuation models use the income approach, which consists of forecasting future cash flows based on contractual notional amounts and prices as well as applicable and available market data as of the valuation date. Those cash flows are then discounted using the relevant benchmark interest rate (such as LIBOR) and are further adjusted to reflect credit or nonperformance risk. This risk is estimated by the First Wind Operating Entities using credit spreads and risk premiums that are observable in the market, whenever possible. The First Wind Operating Entities’ methodology to fair value its derivatives is to start with any observable inputs; however, in certain instances the published forward rates or prices may not extend
F-267
Table of Contents
FIRST WIND OPERATING ENTITIES
Notes to Combined Financial Statements
through the remaining term of the contract and management must make assumptions to extrapolate the curve, which necessitates the use of unobservable inputs. Assets and liabilities are classified as Level 3 when the use of unobservable inputs becomes significant.
The following table summarizes the significant unobservable inputs used for the Level 3 derivative assets at December 31, 2013 (in thousands, except range):
| Type of Derivative |
Fair Value | Unobservable Input |
Range | |||||||
| Commodity derivatives |
$ | 19,074 | Electricity forward price ($/MWh) | $ | 33.94—45.13 | |||||
The First Wind Operating Entities measure the sensitivity of the fair value of their Level 3 commodity swaps to potential changes in commodity prices using a mark-to-market analysis based on the current forward commodity prices and estimates of the price volatility. The First Wind Operating Entities estimated that a one standard deviation move in the aggregate fair value of their Level 3 commodity swap positions from December 31, 2013 to March 31, 2014 would result in approximately $3.8 million of gain or loss, depending on the direction of the movement in the underlying commodity prices. An increase in power forward prices will produce a mark-to-market loss, while a decrease in prices will result in a mark-to-market gain.
NOTE 10—COMMITMENTS AND CONTINGENCIES
Operating Leases
As of December 31, 2013, the First Wind Operating Entities were obligated under long-term non-cancelable operating leases, primarily for land, offices and office equipment. Rental expense for lease commitments under these operating leases for the years ended December 31, 2012 and 2013 was $2.8 million and $3.3 million, respectively.
Future minimum lease payments under these operating leases at December 31, 2013 for 2014 through 2018 and thereafter were as follows (in thousands):
| 2014 |
$ | 1,967 | ||
| 2015 |
1,968 | |||
| 2016 |
1,972 | |||
| 2017 |
1,967 | |||
| 2018 |
1,909 | |||
| Thereafter |
27,600 | |||
|
|
|
|||
| $ | 37,383 | |||
|
|
|
In certain of the First Wind Operating Entities’ land lease agreements, the First Wind Operating Entities are obligated to decommission all wind energy project equipment and restore the land to original condition, excluding removal of access roads, upon expiration, cancellation or termination of the land lease agreements. In connection with KWP I and KWP II, the First Wind Operating Entities were required to provide to the lessor letters of credit in the amount of $1.5 million, each to ensure performance under the contract and to guarantee resources for decommissioning and reclamation. The First Wind Operating Entities pay quarterly letter of credit fees based on an annual rate of 1.75%. These letters of credit will remain in effect during the full terms of the leases, including option extensions.
F-268
Table of Contents
FIRST WIND OPERATING ENTITIES
Notes to Combined Financial Statements
Power Purchase Agreements
The First Wind Operating Entities enter into long-term PPAs with customers, generally electric utility companies, to sell all or a fixed proportion of the electricity generated by one of the First Wind Operating Entities’ projects, sometimes bundled with RECs and capacity. Electricity payments are calculated based on the amount of electrical energy delivered at a designated delivery point and may include fixed and variable price terms. Certain of the PPAs provide for potential payments by the First Wind Operating Entities if they fail to meet minimum target levels.
The First Wind Operating Entities generally enter into PPAs prior to its wind energy projects’ beginning construction and/or commencing commercial operations. Pursuant to the terms of certain PPAs, the First Wind Operating Entities may be required to make payments to the relevant power purchaser under certain conditions, such as shortfall on delivery of electricity, failure to meet certain performance threshold requirements or failure to commence commercial operations by a scheduled date.
Turbine Warranty and Operations and Maintenance Agreements
The First Wind Operating Entities may enter into warranty and guarantee agreements (WGAs) with the suppliers of wind turbines. These suppliers guarantee the delivery and performance of the turbines and related equipment in accordance with technical specifications defined in the WGA and they agree to perform services throughout the term of the WGA to maintain the performance of the turbines in accordance with these defined technical specifications. The WGAs generally commence on the start-up and commissioning of the turbines.
The First Wind Operating Entities enter into operations and maintenance (O&M) agreements with suppliers of its wind turbine generators and related equipment. Under the terms of the O&M agreements, the suppliers perform all scheduled routine maintenance, repairs, and replacement and management of spare parts related to the wind turbine generators and related equipment upon commencement of commercial operations.
In 2011, the First Wind Operating Entities entered into a combined operations and drive train services agreement (OSDTSA) with General Electric International, Inc. (GE). The OSDTSA is an extension of the support services included in the WGA and O&M agreements. Under the OSDTSA, the First Wind Operating Entities are entitled to liquidated damages under warranties related to turbine output, availability and reliability of the turbines, and the wind turbine generator sound levels. All liquidated damages payable under these warranties are subject to aggregate maximum caps. The First Wind Operating Entities also receive a standard warranty with respect to workmanship of the turbine equipment. The OSDTSA extends these support services through 2019.
On February 8, 2013, First Wind and certain of its affiliates, including but not limited to certain subsidiaries of the First Wind Operating Entities, entered into a Master Agreement with respect to the turbines owned and operated by these subsidiaries. Under the Master Agreement, United Technologies Corporation was released from its guaranty obligations related to the Sheffield project and Clipper Windpower Holdings and Clipper Windpower, LLC (together, Clipper) were released from any outstanding and future warranty claims with respect to these turbines. In conjunction with entering into the Master Agreement, the First Wind Operating Entities’ affected subsidiaries transitioned from the existing O&M agreements with Clipper to O&M and parts supply arrangements with affiliates of First Wind.
F-269
Table of Contents
FIRST WIND OPERATING ENTITIES
Notes to Combined Financial Statements
Payments received for warranty claims filed are recorded in the combined statements of operations within other income or, in cases where the warranty claim covers lost revenues, the warranty claims are recorded within revenues. During the years ended December 31, 2012, the First Wind Operating Entities recognized $0.6 million in revenue from warranty payments. No warranty payments were received for the year ended December 31, 2013. Fees under these agreements for the years ended 2012 and 2013 amounted to $11.9 million and $10.2 million, respectively, and are included in project operating expenses on the accompanying combined statements of operations.
The First Wind Operating Entities were committed to make the following future payments under the WGA, O&M, and OSDTSA agreements as of December 31, 2013 as follows (in thousands):
| 2014 |
$ | 10,862 | ||
| 2015 |
11,264 | |||
| 2016 |
11,264 | |||
| 2017 |
11,264 | |||
| 2018 |
11,264 | |||
| Thereafter |
14,216 | |||
|
|
|
|||
| $ | 70,134 | |||
|
|
|
Engineering, Procurement and Construction Agreements
In July 2013, the First Wind Operating Entities entered into Engineering, Procurement and Construction Agreements (EPCs) with Borrego Solar Systems, Inc. (Borrego). Under the terms of the EPCs, Borrego acts as general contractor and is engaged to design, engineer, construct and install all Mass Solar 1 project components. As per the terms of the agreements, payments are made throughout the construction period. The First Wind Operating Entities expect to pay Borrego the remaining $31.7 million balance of plant in 2014.
Letters of Credit
The First Wind Operating Entities’ customers and vendors and regulatory agencies often require the First Wind Operating Entities to post letters of credit in order to guarantee performance under relevant contracts and agreements. The First Wind Operating Entities’ are also required to post letters of credit to secure obligations under various swap agreements and leases and may, from time to time, decide to post letters of credit in lieu of cash deposits in reserve accounts under certain financing arrangements. The amount that can be drawn under some of these letters of credit may be increased from time to time subject to the satisfaction of certain conditions. The First Wind Operating Entities were contingently liable for performance under letters of credit totaling $73.8 million as of December 31, 2012, of which $3.1 million was guaranteed by First Wind and the remaining $70.7 million were non-recourse liabilities of the First Wind Operating Entities. As of December 31, 2013, letters of credit totaled $88.5 million, of which $5.4 million was guaranteed by First Wind and the remaining $83.1 million were non-recourse liabilities of the First Wind Operating Entities. As of December 31, 2013, the First Wind Operating Entities had total additional availability under committed letter of credit facilities of $11.9 million.
F-270
Table of Contents
FIRST WIND OPERATING ENTITIES
Notes to Combined Financial Statements
As of December 31, 2013, the First Wind Operating Entities had the following outstanding letters of credit (in thousands):
| PPAs and REC contracts |
$ | 44,769 | ||
| Financing agreements |
30,656 | |||
| Commodity swap agreements |
1,500 | |||
| Regulatory agencies |
8,207 | |||
| Other |
3,347 | |||
|
|
|
|||
| $ | 88,479 | |||
|
|
|
Guarantee Agreements
The First Wind Operating Entities have provided guarantees to certain of their institutional tax equity investors in connection with their tax equity financing transactions. These guarantees do not guarantee the returns targeted by the tax equity investors, but rather support any potential indemnity payments payable under the tax equity agreements.
Legal Proceedings
The First Wind Operating Entities are involved from time to time in litigation and disputes arising in the normal course of business, including proceedings contesting their permits or the operation of their projects. Management does not believe these proceedings will, if determined adversely, have a material adverse effect on the financial condition, results of operations and liquidity of the First Wind Operating Entities.
NOTE 11—RELATED PARTY TRANSACTIONS
In the normal course of business the First Wind Operating Entities engage in transactions with related parties. Amounts related to the operations of the projects, as described below, are payable on demand.
Administrative Services Agreement
The First Wind Operating Entities have entered into an Administrative Services Agreement (ASA) with First Wind Energy, LLC (First Wind Energy), a subsidiary of First Wind, whereby First Wind Energy provides management services to the First Wind Operating Entities. As part of its management services, First Wind Energy provides legal, accounting, project management and other administrative services to the First Wind Operating Entities. Management fees incurred under the ASA for the years ended December 31, 2012 and 2013 of $1.6 million and $2.1 million, respectively have been expensed and are included in project operating expenses in the accompanying combined statements of operations.
Management Services Agreement
Certain of the First Wind Operating Entities entered into a Management Services Agreement (MSA) with First Wind Energy, whereby First Wind Energy provides day-to-day management of the administrative function of the First Wind Operating Entities. As part of its management services, First Wind Energy provides legal, accounting, project management and other administrative services to the First Wind Operating Entities. During the years ended December 31,2012 and 2013, $3.5 million and $3.8 million, respectively, have been incurred under this agreement and the expense is included in general and administrative expenses on the accompanying combined statements of operations.
F-271
Table of Contents
FIRST WIND OPERATING ENTITIES
Notes to Combined Financial Statements
Project O&M Agreement
The First Wind Operating Entities have entered into a Project Operation and Maintenance (O&M) Agreement with First Wind O&M, LLC (FWO&M), a subsidiary of First Wind, whereby FWO&M acts as operations manager of the project upon achieving commercial operation. The First Wind Operating Entities reimburse FWO&M for direct third party costs related to managing the operations of the projects at cost. For the years ended December 31, 2012 and 2013, the First Wind Operating Entities incurred costs in the amount of $11.4 million and $12 million, respectively under these agreements. These costs are included in project operating expenses in the accompanying combined statement of operations.
Letters of Credit
The First Wind Operating Entities may be required to post letters of credit, as discussed in Note 10. First Wind has guaranteed letters of credit for certain Operating Entities in the amount of $5.4 million as of December 31, 2013.
Development Services Agreement
The First Wind Operating Entities entered into a Development Services Agreement (DSA) with First Wind Energy whereby First Wind Energy earned a development fee for developing Mass Solar 1. Development fees incurred under the DSA in the amount of $6.3 million were paid during the year ended December 31, 2013 and are included within construction in progress on the accompanying combined balance sheet.
F-272
Table of Contents
Shares

TerraForm Power, Inc.
Class A Common Stock
PRELIMINARY PROSPECTUS
Barclays
Goldman, Sachs & Co.
Morgan Stanley
BofA Merrill Lynch
Citigroup
Macquarie Capital
, 2014
Table of Contents
PART II
Item 13. Other expenses of issuance and distribution
The following table sets forth the costs and expenses, other than underwriting discounts and commissions to be paid by us in connection with the sale of the shares of Class A common stock being registered hereby. All amounts are estimates except for the SEC registration fee, the FINRA filing fee and the stock exchange listing fee.
| SEC registration fee |
$ | 40,670 | ||
| FINRA filing fee* |
||||
| NASDAQ listing fee* |
||||
| Legal fees and expenses* |
||||
| Accounting fees and expenses* |
||||
| Printing and engraving expenses* |
||||
| Transfer agent and registrar fees and expenses* |
||||
| Other Expenses* |
||||
|
|
|
|||
| Total |
$ | |||
|
|
|
| * | To be provided by amendment |
Item 14. Indemnification of directors and officers
Section 102(b)(7) of the DGCL allows a corporation to provide in its certificate of incorporation that a director of the corporation will not be personally liable to the corporation or its stockholders for monetary damages for breach of fiduciary duty as a director, except where the director breached the duty of loyalty, failed to act in good faith, engaged in intentional misconduct or knowingly violated a law, authorized the payment of a dividend or approved a stock repurchase in violation of Delaware corporate law or obtained an improper personal benefit. Our amended and restated certificate of incorporation provides for this limitation of liability.
Section 145 of the DGCL, or Section 145, provides that a Delaware corporation may indemnify any person who was, is or is threatened to be made, party to any threatened, pending or completed action, suit or proceeding, whether civil, criminal, administrative or investigative (other than an action by or in the right of such corporation), by reason of the fact that such person is or was an officer, director, employee or agent of such corporation or is or was serving at the request of such corporation as a director, officer, employee or agent of another corporation or enterprise. The indemnity may include expenses (including attorneys’ fees), judgments, fines and amounts paid in settlement actually and reasonably incurred by such person in connection with such action, suit or proceeding, provided such person acted in good faith and in a manner he reasonably believed to be in or not opposed to the corporation’s best interests and, with respect to any criminal action or proceeding, had no reasonable cause to believe that his or her conduct was illegal. A Delaware corporation may indemnify any persons who are, were or are a party to any threatened, pending or completed action or suit by or in the right of the corporation by reason of the fact that such person is or was a director, officer, employee or agent of another corporation or enterprise. The indemnity may include expenses (including attorneys’ fees) actually and reasonably incurred by such person in connection with the defense or settlement of such action or suit, provided such person acted in good faith and in a manner he reasonably believed to be in or not opposed to the corporation’s best interests, provided that no indemnification is permitted without judicial approval if the officer, director, employee or agent is adjudged to be liable to the corporation. Where an officer or director is successful on the merits or otherwise in the defense of any action referred to above, the corporation must indemnify him against the expenses which such officer or director has actually and reasonably incurred.
II-1
Table of Contents
Section 145 further authorizes a corporation to purchase and maintain insurance on behalf of any person who is or was a director, officer, employee or agent of the corporation or is or was serving at the request of the corporation as a director, officer, employee or agent of another corporation or enterprise, against any liability asserted against him and incurred by him in any such capacity, or arising out of his or her status as such, whether or not the corporation would otherwise have the power to indemnify him under Section 145.
Our amended and restated bylaws provides that we must indemnify our directors and officers to the fullest extent permitted by the DGCL and must also pay expenses incurred in defending any such proceeding in advance of its final disposition upon delivery of an undertaking, by or on behalf of an indemnified person, to repay all amounts so advanced if it should be determined ultimately that such person is not entitled to be indemnified.
We have entered into indemnification agreements with certain of our executive officers and directors pursuant to which have agreed to indemnify such persons against all expenses and liabilities incurred or paid by such person in connection with any proceeding arising from the fact that such person is or was an officer or director of our company, and to advance expenses as incurred by or on behalf of such person in connection therewith.
The indemnification rights set forth above shall not be exclusive of any other right which an indemnified person may have or hereafter acquire under any statute, provision of our certificate of incorporation, our bylaws, agreement, vote of stockholders or disinterested directors or otherwise.
We maintain standard policies of insurance that provide coverage (1) to our directors and officers against loss rising from claims made by reason of breach of duty or other wrongful act and (2) to us with respect to indemnification payments that we may make to such directors and officers.
The proposed form of Underwriting Agreement to be filed as Exhibit 1.1 to this Registration Statement will provide for indemnification of our directors and officers by the underwriters party thereto against certain liabilities. See “Item 17. Undertakings” for a description of the SEC’s position regarding such indemnification provisions.
Item 15. Recent sales of unregistered securities
Except as set forth below, we have not sold any securities, registered or otherwise, within the past three years, except for the shares issued upon our formation to our sole shareholder.
On January 29, 2014 and February 20, 2014, we issued 7,193 shares and 3,749 shares of our Class A common stock, respectively to certain individuals on account of their efforts in identifying potential projects for our portfolio. Following a stock split at the IPO, these holdings now represent 914,679 and 476,732 restricted shares of Class A common stock.
On January 31, 2014 and February 20, 2014, we granted an aggregate of 33,099 shares and 16,901 shares, respectively, of restricted securities to certain of our executives and other employees of SunEdison who provided services to us. These securities converted into a total of 3,586,174 restricted shares of Class A common stock at the IPO. These grants of restricted securities were made in the ordinary course of business and did not involve any cash payments from the recipients. The restricted securities did not involve a “sale” of securities for purposes of Section 2(3) of the Securities Act and were otherwise made in reliance upon Rule 701 under the Securities Act.
On July 23, 2014, we, pursuant to two private placements, sold and issued (i) 1,800,000 shares of our Class A common stock at the price of $25.00 per share to Altai Capital Master Fund, Ltd., or “ACMF,” pursuant to a Common Stock Purchase Agreement, dated as of July 3, 2014, between us and ACMF, and (ii) 800,000 shares of our Class A common stock at our initial public offering price of $25.00 per
II-2
Table of Contents
share to EverStream Opportunities Fund I, LLC (“EverStream Opportunities”) pursuant to the Common Stock Purchase Agreement, dated as of July 3, 2014, between the Company and EverStream Opportunities, for aggregate gross proceeds of $65.0 million.
On July 23, 2014, pursuant to the Mt. Signal Contribution Agreement, dated as of July 23, 2014, by and among us, Terra LLC and Silver Ridge Power, LLC (“Silver Ridge”), Terra LLC issued 5,840,000 Class B units (and we issued a corresponding number of shares of Class B common stock) and 5,840,000 Class B1 units (and we issued a corresponding number of shares of Class B1 common stock), based on our initial public offering price of $25.00 per share, to Silver Ridge as consideration for the outstanding equity interests in Imperial Valley Solar 1 Holdings II, LLC, which owns the Mt. Signal Project. Silver Ridge distributed the Class B1 shares and Class B1 units to R/C US Solar Investment Partnership, L.P. and the Class B shares and Class B units to our Sponsor.
On November 26, 2014, we, pursuant to a series of subscription agreements substantively similar in substance and form, sold and issued a total of 11,666,667 shares of our Class A common stock in a private placement to certain eligible investors for an aggregate purchase price of $350 million, or $30.00 per share.
Except as otherwise indicated, we issued the securities described above to the respective purchasers in reliance upon the exemption from the registration requirements of the Securities Act provided by Section 4(a)(2) thereof. In that regard, we obtained representations from each of the purchasers that it was an “accredited investor” within the meaning of Rule 501 of Regulation D promulgated under the Securities Act, and that it had such knowledge and experience in financial or business matters that such purchaser was capable of evaluating the merits and risk of an investment in our securities.
Item 16. Exhibits and Financial Statement Schedules
(a) Exhibits
The exhibit index attached hereto is incorporated herein by reference.
(b) Financial Statement Schedule
All schedules have been omitted because the information required to be set forth in the schedules is either not applicable or is shown in the financial statements or notes thereto.
Item 17. Undertakings
For the purpose of determining liability of the registrant under the Securities Act of 1933 to any purchaser in the initial distribution of the securities, the undersigned registrant undertakes that in a primary offering of securities of the undersigned registrant pursuant to this registration statement, regardless of the underwriting method used to sell the securities to the purchaser, if the securities are offered or sold to such purchaser by means of any of the following communications, the undersigned registrant will be a seller to the purchaser and will be considered to offer or sell such securities to such purchaser:
| (1) | Any preliminary prospectus or prospectus of the undersigned registrant relating to the offering required to be filed pursuant to Rule 424; |
| (2) | Any free writing prospectus relating to the offering prepared by or on behalf of the undersigned registrant or used or referred to by the undersigned registrant; |
II-3
Table of Contents
| (3) | The portion of any other free writing prospectus relating to the offering containing material information about the undersigned registrant or its securities provided by or on behalf of the undersigned registrant; and |
| (4) | Any other communication that is an offer in the offering made by the undersigned registrant to the purchaser. |
The undersigned registrant hereby undertakes to provide to the underwriters at the closing specified in the underwriting agreement certificates in such denominations and registered in such names as required by the underwriters to permit prompt delivery to each purchaser.
Insofar as indemnification for liabilities arising under the Securities Act may be permitted to directors, officers and controlling persons of the registrant pursuant to the provisions referenced in Item 14 of this registration statement or otherwise, the registrant has been advised that in the opinion of the SEC such indemnification is against public policy as expressed in the Securities Act and is, therefore, unenforceable. In the event that a claim for indemnification against such liabilities (other than the payment by the registrant of expenses incurred or paid by a director, officer or controlling person of the registrant in the successful defense of any action, suit or proceeding) is asserted by such director, officer or controlling person in connection with the securities being registered hereunder, the registrant will, unless in the opinion of its counsel the matter has been settled by controlling precedent, submit to a court of appropriate jurisdiction the question whether such indemnification by it is against public policy as expressed in the Securities Act and will be governed by the final adjudication of such issue.
The undersigned registrant hereby undertakes that:
| (1) | For purposes of determining any liability under the Securities Act of 1933, the information omitted from the form of prospectus filed as part of this registration statement in reliance upon Rule 430A and contained in the form of prospectus filed by the registrant pursuant to Rule 424(b) (1) or (4) or 497(h) under the Securities Act shall be deemed to be part of this registration statement as of the time it was declared effective; and |
| (2) | For the purpose of determining any liability under the Securities Act of 1933, each post-effective amendment that contains a form of prospectus shall be deemed to be a new registration statement relating to the securities offered therein, and the offering of such securities at the time shall be deemed to be the initial bona fide offering thereof. |
II-4
Table of Contents
SIGNATURES
Pursuant to the requirements of the Securities Act of 1933, TerraForm Power, Inc., a Delaware corporation, has duly caused this Registration Statement on Form S-1 to be signed on its behalf by the undersigned, thereunto duly authorized, in the City of Beltsville, State of Maryland, on December 9, 2014.
| TERRAFORM POWER, INC. | ||||
| By: | /S/ CARLOS DOMENECH ZORNOZA | |||
| Name: | Carlos Domenech Zornoza | |||
| Title: | Chief Executive Officer | |||
* * * * *
Each person whose signature appears below constitutes and appoints Ahmad Chatila, Carlos Domenech and Brian Wuebbels and each of them singly, his or her true and lawful attorneys-in-fact and agents, with full power of substitution and resubstitution, for him or her and in his or her name, place and stead, in any and all capacities, to sign any and all amendments (including post-effective amendments) to this registration statement and any and all additional registration statements pursuant to Rule 462(b) of the Securities Act and to file the same, with all exhibits thereto and all other documents in connection therewith, with the SEC, granting unto each said attorney-in-fact and agents full power and authority to do and perform each and every act in person, hereby ratifying and confirming all that said attorneys-in-fact and agents or either of them or their, his or her substitute or substitutes may lawfully do or cause to be done by virtue hereof.
Pursuant to the requirements of the Securities Act of 1933, this Registration Statement on Form S-1 has been signed by the following persons in the capacities indicated on December 9, 2014.
| Signature |
Title | |
| /S/ CARLOS DOMENECH ZORNOZA Carlos Domenech Zornoza |
Chief Executive Officer and Director (principal executive officer) | |
| /S/ ALEJANDRO “ALEX” HERNANDEZ Alejandro “Alex” Hernandez |
Chief Financial Officer (principal financial officer) | |
| /S/ AHMAD CHATILA Ahmad Chatila |
Director | |
| /S/ BRIAN WUEBBELS Brian Wuebbels |
Director | |
| /S/ FRANCISCO “PANCHO” PEREZ-GUNDIN Francisco “Pancho” Perez-Gundin |
Director | |
| /S/ STEVEN TESORIERE Steven Tesoriere |
Director | |
| /S/ MARTIN TRUONG Martin Truong |
Director | |
II-5
Table of Contents
| Signature |
Title | |
| /S/ MARK LERDAL Mark Lerdal |
Director | |
| /S/ MARK FLORIAN Mark Florian |
Director | |
| /S/ HANIF “WALLY” DAHYA Hanif “Wally” Dahya |
Director | |
II-6
Table of Contents
EXHIBIT INDEX
| Exhibit |
Exhibit Description | |
| 1.1* | Form of Underwriting Agreement. | |
| 3.1(b) | Amended and Restated Certificate of Incorporation of TerraForm Power, Inc.. | |
| 3.2(b) | Amended and Restated Bylaws of TerraForm Power, Inc.. | |
| 4.1(a) | Specimen Class A Common Stock Certificate. | |
| 4.2(b) | Amended and Restated Operating Agreement of TerraForm Power, LLC. | |
| 4.3* | First Amendment, dated as of December 3, 2014, to the Amended and Restated Operating Agreement of TerraForm Power, LLC. | |
| 5.1* | Opinion of Skadden, Arps, Slate, Meagher & Flom LLP. | |
| 10.1* | Management Services Agreement by and between TerraForm Power, Inc. and SunEdison, Inc. | |
| 10.2(b) | Project Support Agreement by and between TerraForm Power, LLC and SunEdison, Inc. | |
| 10.3(b) | Repowering Services ROFR Agreement by and between TerraForm Power, Inc., TerraForm Power, LLC, TerraForm Power Operating, LLC and SunEdison, Inc. | |
| 10.4(b) | Interest Payment Agreement by and between TerraForm Power, LLC, TerraForm Power Operating, LLC, SunEdison, Inc. and SunEdison Holdings Corporation. | |
| 10.5(b) | Exchange Agreement by and among TerraForm Power, Inc., TerraForm Power, LLC and SunEdison, Inc. | |
| 10.6(b) | Exchange Agreement by and among TerraForm Power, Inc., TerraForm Power, LLC and R/C US Solar Investment Partnership, L.P. | |
| 10.7(b) | Registration Rights Agreement by and between TerraForm Power, Inc. and SunEdison, Inc. | |
| 10.8(b) | Registration Rights Agreement by and between TerraForm Power, Inc. and R/C US Solar Investment Partnership, L.P. | |
| 10.9(c) | Registration Rights Agreement, dated November 26, 2014, by and between TerraForm Power, Inc. and the purchasers of the shares party thereto. | |
| 10.10(a) | Form of Indemnification Agreement between TerraForm Power, Inc. and its directors and officers. | |
| 10.11(a) | Investment Agreement, dated as of March 28, 2014, by and among TerraForm Power, LLC, TerraForm Power Operating, LLC and SunEdison, Inc. | |
| 10.12†(a) | SunEdison Yieldco, Inc. 2014 Second Amended and Restated Long-Term Incentive Plan. | |
| 10.13(a) | Common Stock Purchase Agreement, dated as July 3, 2014, by and among TerraForm Power, Inc. and Altai Capital Master Fund, Ltd. | |
| 10.14(a) | Common Stock Purchase Agreement, dated as July 3, 2014, by and among TerraForm Power, Inc. and Everstream Opportunities Fund I, LLC | |
| 10.15(b) | Mt. Signal Contribution Agreement by and among TerraForm Power, Inc., TerraForm Power, LLC and Silver Ridge Power, LLC | |
| 10.16(b) | Letter Agreement Regarding the Priced Call Right Assets, between TerraForm Power, Inc. and SunEdison, Inc. | |
II-7
Table of Contents
| Exhibit |
Exhibit Description | |
| 10.17* | Purchase and Sale Agreement, dated October 29, 2014, by and between TerraForm CD Holdings Corporation, TerraForm CD Holdings GP, LLC, TerraForm CD Holdings, LLC and the other parties thereto. | |
| 10.18* | Purchase and Sale Agreement, dated November 17, 2014, by and between TerraForm Power, LLC, TerraForm Power, Inc., First Wind Holdings, LLC, First Wind Capital, LLC, SunEdison, Inc. and the other parties thereto. | |
| 10.19* | Intercompany Agreement, dated November 17, 2014, by and between TerraForm Power, LLC, SunEdison, Inc. and SunEdison Holdings Corporation. | |
| 10.17†(a) | Form of Restricted Stock Unit Award Agreement for employees. | |
| 10.18†(a) | Form of Restricted Stock Unit Award Agreement for directors. | |
| 10.19(b) | Credit and Guaranty Agreement, dated as of July 23, 2014, by and among TerraForm Power Operating, LLC, as borrower, TerraForm Power, LLC, as a guarantor, certain subsidiaries of TerraForm Power Operating, LLC, as guarantors, various lenders signatory thereto, Goldman Sachs Bank USA, as administrative agent and collateral agent, Goldman Sachs Bank USA, Barclays Bank PLC, Citigroup Global Markets Inc. and JPMorgan Chase Bank, N.A., as joint lead arrangers, joint bookrunners and co-syndication agents, and Santander Bank, N.A., as documentation agent. | |
| 10.20* | First Amendment, dated as of August 25, 2014, to Credit and Guaranty Agreement, dated as of July 23, 2014, by and among TerraForm Power Operating, LLC, as borrower, TerraForm Power, LLC, as a guarantor, certain subsidiaries of TerraForm Power Operating, LLC, as guarantors, various lenders signatory thereto, Goldman Sachs Bank USA, as administrative agent and collateral agent, Goldman Sachs Bank USA, Barclays Bank PLC, Citigroup Global Markets Inc. and JPMorgan Chase Bank, N.A., as joint lead arrangers, joint bookrunners and co-syndication agents, and Santander Bank, N.A., as documentation agent. | |
| 21.1* | List of subsidiaries of TerraForm Power, Inc. | |
| 23.1 | Consent of KPMG LLP—TerraForm Power, Inc. | |
| 23.2 | Consent of KPMG LLP—TerraForm Power (Predecessor) | |
| 23.3 | Consent of KPMG LLP—Stonehenge Operating Group | |
| 23.4 | Consent of CohnReznick LLP—MMA NAFB Power, LLC and Subsidiary (Nellis) | |
| 23.5 | Consent of CohnReznick LLP—Summit Solar | |
| 23.6 | Consent of Moss Adams LLP—CalRenew—1 | |
| 23.7 | Consent of Moss Adams LLP—SPS Atwell Island, LLC | |
| 23.8 | Consent of Ernst & Young LLP—Imperial Valley Solar 1 Holdings II, LLC and Subsidiaries (Mt. Signal) | |
| 23.9 | Consent of Ernst & Young LLP—First Wind Operating Entities | |
| 23.10* | Consent of Skadden, Arps, Slate, Meagher & Flom LLP (included in Exhibit 5.1). | |
| 24.1 | Power of Attorney (included on the signature page of this Registration Statement). | |
| † | Indicates exhibits that constitute compensatory plans or arrangements. |
| * | Indicates exhibits to be filed by amendment. |
| (a) | Incorporated by reference to our Registration Statement on Form S-1, File No. 333-196345. |
| (b) | Incorporated by reference to our Current Report on Form 8-K, filed on July 25, 2014. |
| (c) | Incorporated by reference to our Current Report on Form 8-K, filed on November 26, 2014. |
II-8