Attached files
| file | filename |
|---|---|
| 8-K - CURRENT REPORT OF MATERIAL EVENTS OR CORPORATE CHANGES - LRR Energy, L.P. | a14-25859_18k.htm |
Exhibit 99.1
|
|
LRR Energy, L.P. December 2014 Wells Fargo Energy Symposium |
|
|
Forward Looking Statements LRR Energy, L.P. 1 |
|
|
Equity Market Capitalization $246 MM Net Debt $271 MM Enterprise Value $517 MM Current Yield 22.5% Proved Reserves 32.6 MMBoe % Proved Developed 89% LRR Energy Overview LRR Energy, L.P. Market Valuation1 Key Statistics2 2 Q3 2014 Production 6,574 Boe/d Total Proved Reserve Life (R/P) 13.6 Permian Basin Mid-Continent Gulf Coast |
|
|
LRR Energy, L.P. Recent Acquisition – Stroud Prue Sand Unit 3 |
|
|
Strategy: Stable Cash Flows with Exposure to Growth LRR Energy, L.P. 4 |
|
|
Quality Assets LRR Energy, L.P. 5 |
|
|
Q3 2014 Production (Boe/d) 6,574 Proved Reserves (MMBoe) (1) 32.6 % Proved Developed 89% % Liquids 52% Total Proved Reserve Life (R/P) 13.6 Producing Wells (gross) 1,303 Total Development Opportunities (gross) 548 % Operated By Total Proved Reserves 85% Property Summary (Includes Stroud Acquisition) LRR Energy, L.P. LRE Total Permian Basin Mid-Continent Coast Stroud Prue Sand Unit Acquisition 6 . BY PRODUCT 2013 Proved Reserve Characteristics BY CATEGORY BY AREA Gulf 72% 17% 11% PDP PDNP PUD |
|
|
Production Summary LRR Energy, L.P. 29% 58% 13% Oil Gas NGL AT IPO BY PRODUCT Q3 2014 BY PRODUCT 7 Q3 2014 BY AREA LRE has become more liquids weighted as a result of drilling at Red Lake and acquisitions Q3 2014 OP VS. NON-OP |
|
|
Permian Basin Region LRR Energy, L.P. Chaves Eddy Lea Reagan 8 62% 21% 17% PDP PDNP PUD 51% 32% 17% Oil Gas NGL Proved Reserves1 Martin Ward |
|
|
Red Lake Field LRR Energy, L.P. Chaves Eddy Lea 9 59% 17% 24% Oil Gas NGL Proved Reserves1 |
|
|
Red Lake Field – Significant Inventory of Drilling Opportunities LRR Energy, L.P. System mian Epoch/Series/ Stage Ochoan Guadalupian Time (M.Y.) 251 NW Shelf New Mexico Dewey Lake Ruster Salado Castile Upper San Andres Artesia Group Tansill Yates Seven Rivers Queen Grayburg 2014 Red Lake Capital Plan 10 Perm Pennsylvanian Leonardian Wolfcampian Virgilian Missourian Desmoinesian Atokan Morrowan 302 Lower San Andres Glorieta Paddock Blinebry Tubb Drinkard Yeso Abo Wolfcamp Cisco Canyon Strawn Atoka Morrow Total Proved Inventory |

|
|
Recompletions Appendix 70 80 90 100 Williams A #5 Recomplete of San Andres Approximately $450,000 for 5- stage gel frac 11 0 10 20 30 40 50 60 3-Dec 3-Jan 3-Feb 3-Mar 3-Apr 3-May 3-Jun 3-Jul 3-Aug 3-Sep 3-Oct 3-Nov 3-Dec 3-Jan 3-Feb 3-Mar 3-Apr 3-May 3-Jun 3-Jul 3-Aug 3-Sep 3-Oct 3-Nov 3-Dec 3-Jan 3-Feb 3-Mar 3-Apr 3-May 3-Jun 3-Jul 3-Aug 3-Sep 3-Oct 3-Nov Boe/d Gross Gas Gross Oil Estimated Project Economics(1): IRR: ~80% ROI: ~2.9X Payout Period: ~1.3 years |
|
|
Mid-Continent and Gulf Coast Regions LRR Energy, L.P. Mid-Continent Overview1 Gulf Coast Overview 12 8% 67% 25% Oil Gas NGL PROVED RESERVES2 (by Commodity) PROVED RESERVES2 (by Commodity) . |
|
|
2014 Capital Budget LRR Energy, L.P. 13 Area Project 73% 27% 1% Permian Mid-Continent Gulf Coast 76% 3% 21% Drilling Non-Production Recompletes & Other |
|
|
LRR Energy, L.P. Significant Growth Potential – Multiple Acquisition Sources 14 |
|
|
Illustrative Acquisition Analysis LRR Energy, L.P. 15 2015 Distributable Cash Flow Per Unit Accretion $125.0 $150.0 $175.0 5.0x 6.0x 7.0x $9.00 7% 3% (2%) $12.00 14% 10% 5% $15.00 18% 14% 10% Unit Price ($/Unit) Purchase Price ($MM) Acquisition EBITDA Multiple (x) |
|
|
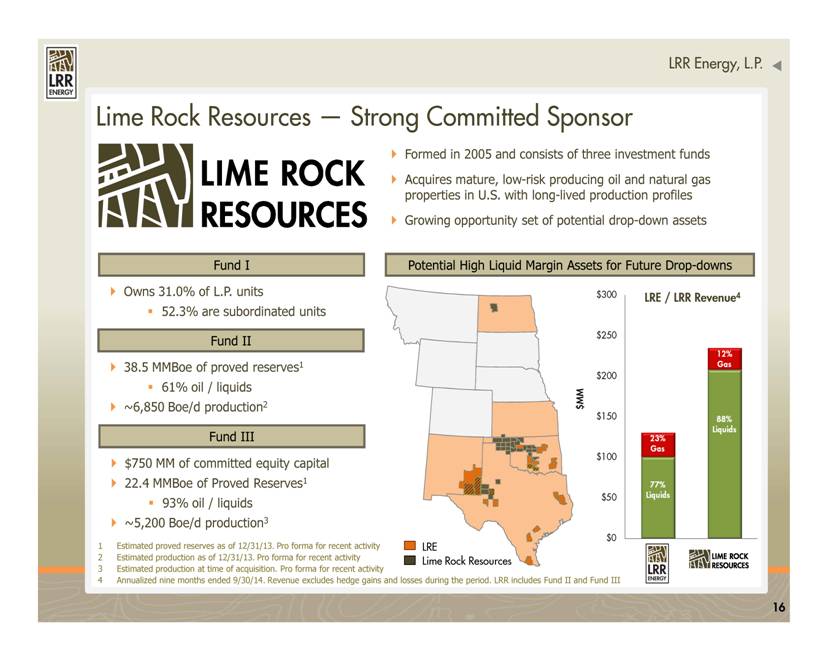
LRR Energy, L.P. Lime Rock Resources — Strong Committed Sponsor LRE / LRR Revenue4 16 LRE Lime Rock Resources |
|
|
As of October 30, 2014 ($ in thousands) Cash & Equivalents $12,000 Senior Credit Facility $233,000 2nd Lien Term Loan $50,000 Total Debt $283,000 Equity Market Capitalization (1) $245,907 l (2) $ Conservative Financial Strategy LRR Energy, L.P. 17 Enterprise Value 516,907 Senior Credit Facility Borrowing Base $260,000 Senior Credit Facility Availability $27,000 Liquidity $39,000 Pro Forma LTM Adjusted EBITDA $87,120 Total Debt / LTM Adjusted EBITDA 3.2x Total Debt / Enterprise Value 55% |
|
|
Stable and Consistent Source of Distributions LRR Energy, L.P. 18 |
|
|
87% 81% 65% 60% 92% 87% 86% 80% 75% 67% 87% 81% 64% 56% 41% 60% 80% 100% Oil Gas NGLs Robust Hedge Portfolio at Attractive Prices LRR Energy, L.P. Hedge Summary 19 50% 38% 0% 20% 40% Q4 2014 2015 2016 2017 2018 Weighted Average Price Oil Gas NGLs $96.14 $5.61 $34.71 Oil Gas NGLs $93.16 $5.72 $34.46 Oil Gas NGLs $87.27 $4.29 NA Oil Gas NGLs $84.34 $4.61 NA Oil Gas NGLs $82.26 $4.28 NA |
|
|
Protected from Commodity Price Volatility LRR Energy, L.P. 2015 Estimated EBITDA % Change $55.00 $65.00 $75.00 $85.00 Oil Price ($/Bbl) 20 $2.50 (4.9%) (3.7%) (2.5%) (1.2%) $3.00 (4.5%) (3.3%) (2.1%) (0.8%) $3.50 (4.1%) (2.9%) (1.6%) (0.4%) $4.00 (3.7%) (2.5%) (1.2%) 0.0% Gas Price ($/Mcf) |
|
|
Significant Total Return Potential LRR Energy, L.P. 21 22.5% 18.3% 5.7% 3.6% 2.3% 1.9% 0% 5% 10% 15% 20% 25% LRE E&P MLPs Alerian Index REIT Index 10-yr Treasury S&P 500 Annual Yield Current Yield Comparison1 |
|
|
Investment Highlights LRR Energy, L.P. Quality Assets Consistent Source of Distributions Significant Growth 22 Potential Comprehensive Hedging Program Compelling Valuation Committed Sponsor |
|
|
Appendix 23 pp |
|
|
Lime Rock Overview Appendix 24 . |
|
|
Organization and Ownership Summary Appendix 25 |
|
|
Management Team and Board of Directors Executive Leadership Appendix 26 Non-Management Directors |

|
|
Commodity Hedges Appendix Current Hedge Position Q4 2014 2015 2016 2017 2018 NYMEX HH GAS SWAPS Gas (MMBtu) 1,462,599 5,500,236 5,433,888 5,045,760 2,374,800 Wt Avg Price $5.61 $5.72 $4.29 $4.61 $4.28 NYMEX WTI OIL SWAPS Oil (Bbl) 204,595 757,321 610,131 473,698 562,522 Wt Avg Price $96.14 $93.16 $87.27 $84.34 $82.26 27 g NGL SWAPS NGLs (Bbl) 66,569 236,149 Wt Avg Price $34.71 $34.46 |
