Attached files
| file | filename |
|---|---|
| 8-K - 8-K - Ally Financial Inc. | goldmansachspres8-k12x10x14.htm |
1 Ally Financial Inc. Michael Carpenter, Chief Executive Officer Goldman Sachs U.S. Financial Services Conference December 10, 2014 Contact Ally Investor Relations at (866) 710-4623 or investor.relations@ally.com
2 Forward-Looking Statements and Additional Information The following should be read in conjunction with the financial statements, notes and other information contained in the Company’s Annual Reports on Form 10-K, Quarterly Reports on Form 10-Q, and Current Reports on Form 8-K. In the presentation that follows and related comments by Ally Financial Inc. (“Ally”) management, the use of the words “expect,” “anticipate,” “estimate,” “forecast,” “initiative,” “objective,” “plan,” “goal,” “project,” “outlook,” “priorities,” “target,” “explore,” “positions,” “intend,” “evaluate,” “pursue,” “seek,” “may,” “would, ” “could, ” “should, ” “believe, ” “potential, ” “continue,” or the negative of these words, or similar expressions is intended to identify forward-looking statements. All statements herein and in related management comments, other than statements of historical fact, including without limitation, statements about future events and financial performance, are forward-looking statements that involve certain risks and uncertainties. While these statements represent our current judgment on what the future may hold, and we believe these judgments are reasonable, these statements are not guarantees of any events or financial results, and Ally’s actual results may differ materially due to numerous important factors that are described in the most recent reports on SEC Forms 10-K and 10-Q for Ally, each of which may be revised or supplemented in subsequent reports filed with the SEC. Such factors include, among others, the following: maintaining the mutually beneficial relationship between Ally and General Motors (“GM”), and Ally and Chrysler Group LLC (“Chrysler”); our ability to maintain relationships with automotive dealers; our ability to realize the anticipated benefits associated with being a financial holding company, and the significant regulation and restrictions that we are now subject to; the potential for deterioration in the residual value of off-lease vehicles; disruptions in the market in which we fund our operations, with resulting negative impact on our liquidity; changes in our accounting assumptions that may require or that result from changes in the accounting rules or their application, which could result in an impact on earnings; changes in the credit ratings of Ally, Chrysler, or GM; changes in economic conditions, currency exchange rates or political stability in the markets in which we operate; and changes in the existing or the adoption of new laws, regulations, policies or other activities of governments, agencies and similar organizations (including as a result of the Dodd-Frank Act and Basel III). Investors are cautioned not to place undue reliance on forward-looking statements. Ally undertakes no obligation to update publicly or otherwise revise any forward-looking statements, whether as a result of new information, future events or other such factors that affect the subject of these statements, except where expressly required by law. Reconciliation of non-GAAP financial measures included within this presentation are provided in this presentation. Use of the term “loans” describes products associated with direct and indirect lending activities of Ally’s operations. The specific products include retail installment sales contracts, lines of credit, leases or other financing products. The term “originate” refers to Ally’s purchase, acquisition or direct origination of various “loan” products.

3 $207 $211 $271 $161 $339 $417 $467 2.9% 3.1% 5.4% 1.8% 6.5% 8.4% 9.1% 1Q 13 2Q 13 3Q 13 4Q 13 1Q 14 2Q 14 3Q 14 Core Pre tax Income (ex. repositioning) Core ROTCE Path to Double-Digit Core ROTCE is on Track 4% 2013 Core ROTCE Regulatory Normalization • Lower interest expense driving higher net financing revenue • Cost of funds down 50 bps YoY • NIM up 31 bps YoY NIM Expansion • Bank expansion and efficiency − Bank dividend to parent − Contributed Corporate Finance • Liability management • Redeploy excess capital • Provision expense • Normalized investment gains Other Expense Rationalization 9% - 11% Run-rate 2015 YE Core ROTCE • Lower operating expenses improving efficiency ratio • Adjusted efficiency ratio of 49%, down from 59% in 3Q13 • Partly offset by reinvestment in auto finance business 225-325bps 125-175bps 225-300bps 75-150bps 1 2 3 Core Pre Tax Income & Core ROTCE NIM and Adjusted Efficiency Ratio Please refer to slides 7 and 8 for notes and reconciliations 67% 67% 59% 73% 55% 49% 49% 2.07% 2.04% 2.34% 2.39% 2.53% 2.63% 2.65% 1Q 13 2Q 13 Q 13 Q 13 1Q 14 2Q 14 3Q 14 NIM Adj. Efficiency Ratio
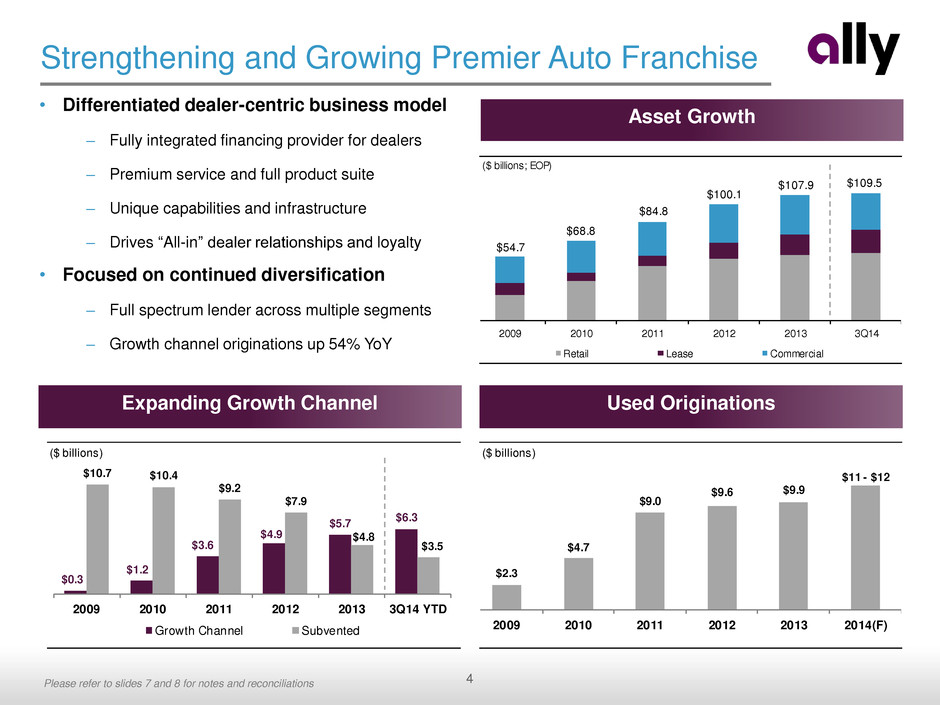
4 ($ billions) $0.3 $1.2 $3.6 $4.9 $5.7 $6.3 $10.7 $10.4 $9.2 $7.9 $4.8 $3.5 2009 2010 2011 2012 2013 3Q14 YTD Growth Channel Subvented ($ billions; EOP) $54.7 $68.8 $84.8 $100.1 $107.9 $109.5 2009 2010 2011 2012 2013 3Q14 Retail Lease Commercial Strengthening and Growing Premier Auto Franchise Asset Growth Expanding Growth Channel Used Originations • Differentiated dealer-centric business model – Fully integrated financing provider for dealers – Premium service and full product suite – Unique capabilities and infrastructure – Drives “All-in” dealer relationships and loyalty • Focused on continued diversification – Full spectrum lender across multiple segments – Growth channel originations up 54% YoY Please refer to slides 7 and 8 for notes and reconciliations ($ billions) $2.3 $4.7 $9.0 $9.6 $9.9 $11 - $12 2009 2010 2011 2012 2013 2014(F)
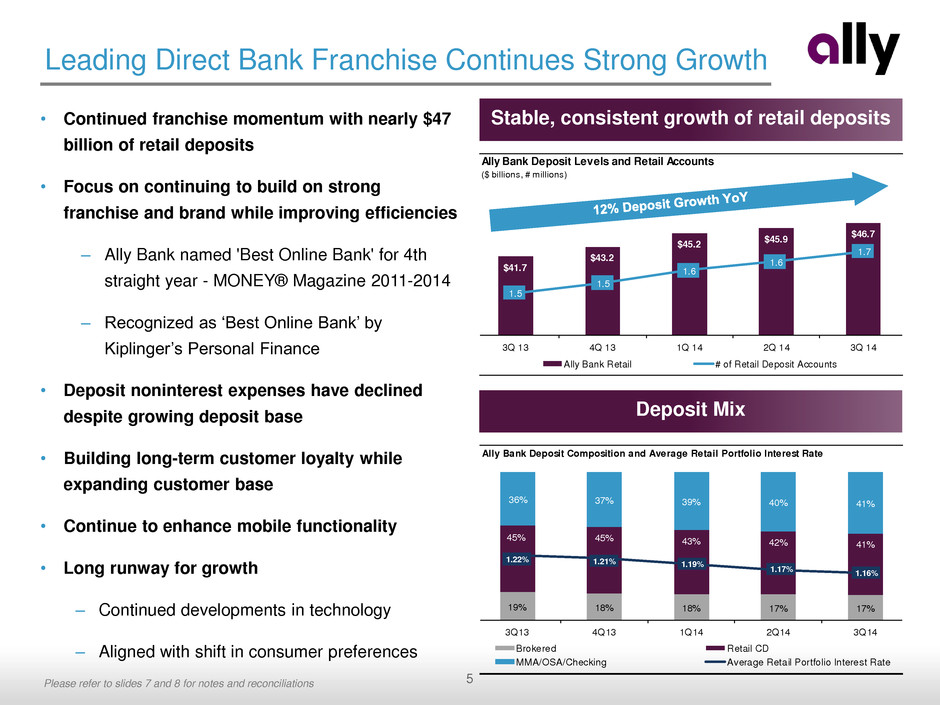
5 Ally Bank Deposit Levels and Retail Accounts ($ billions, # millions) $41.7 $43.2 $45.2 $45.9 $46.7 1.5 1.5 1.6 1.6 1.7 3Q 13 4Q 13 1Q 14 2Q 14 3Q 14 Ally Bank Retail # of Retail Deposit Accounts • Continued franchise momentum with nearly $47 billion of retail deposits • Focus on continuing to build on strong franchise and brand while improving efficiencies – Ally Bank named 'Best Online Bank' for 4th straight year - MONEY® Magazine 2011-2014 – Recognized as ‘Best Online Bank’ by Kiplinger’s Personal Finance • Deposit noninterest expenses have declined despite growing deposit base • Building long-term customer loyalty while expanding customer base • Continue to enhance mobile functionality • Long runway for growth – Continued developments in technology – Aligned with shift in consumer preferences Leading Direct Bank Franchise Continues Strong Growth Stable, consistent growth of retail deposits Deposit Mix Please refer to slides 7 and 8 for notes and reconciliations Ally Bank Deposit Composition and Average Retail Portfolio Interest Rate 19% 18% 18% 17% 17% 45% 45% 43% 42% 41% 36% 37% 39% 40% 41% 1.22% 1.21% 1.19% 1.17% 1.16% 3Q13 4Q13 1Q14 2Q14 3Q14 Brokered Retail CD MMA/OSA/Checking Average Retail Portfolio Interest Rate
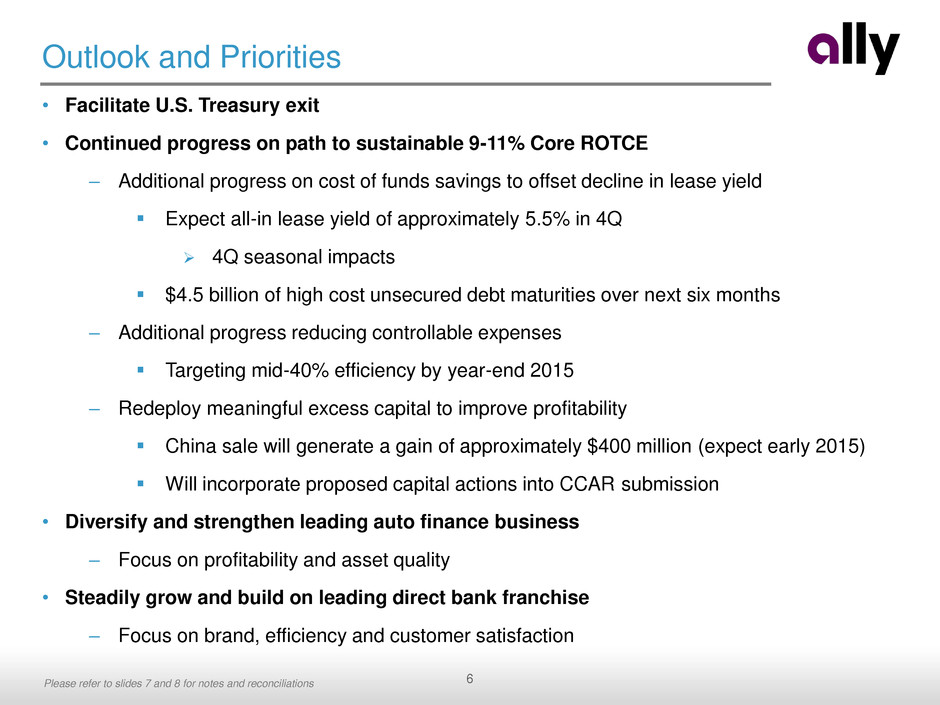
6 Outlook and Priorities • Facilitate U.S. Treasury exit • Continued progress on path to sustainable 9-11% Core ROTCE – Additional progress on cost of funds savings to offset decline in lease yield Expect all-in lease yield of approximately 5.5% in 4Q 4Q seasonal impacts $4.5 billion of high cost unsecured debt maturities over next six months – Additional progress reducing controllable expenses Targeting mid-40% efficiency by year-end 2015 – Redeploy meaningful excess capital to improve profitability China sale will generate a gain of approximately $400 million (expect early 2015) Will incorporate proposed capital actions into CCAR submission • Diversify and strengthen leading auto finance business – Focus on profitability and asset quality • Steadily grow and build on leading direct bank franchise – Focus on brand, efficiency and customer satisfaction Please refer to slides 7 and 8 for notes and reconciliations
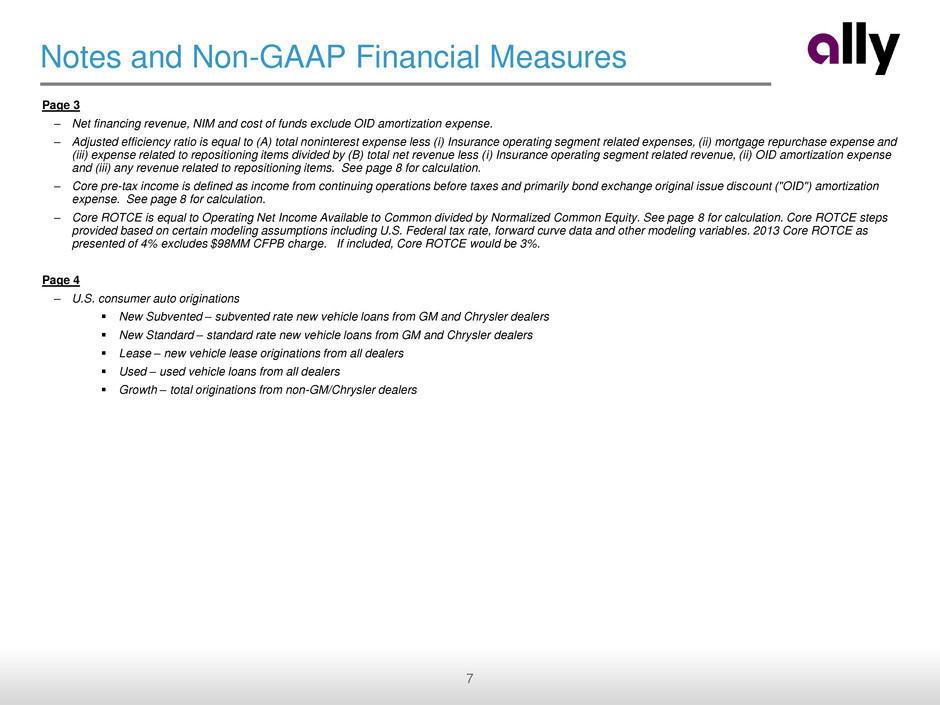
7 Notes and Non-GAAP Financial Measures Page 3 – Net financing revenue, NIM and cost of funds exclude OID amortization expense. – Adjusted efficiency ratio is equal to (A) total noninterest expense less (i) Insurance operating segment related expenses, (ii) mortgage repurchase expense and (iii) expense related to repositioning items divided by (B) total net revenue less (i) Insurance operating segment related revenue, (ii) OID amortization expense and (iii) any revenue related to repositioning items. See page 8 for calculation. – Core pre-tax income is defined as income from continuing operations before taxes and primarily bond exchange original issue discount ("OID") amortization expense. See page 8 for calculation. – Core ROTCE is equal to Operating Net Income Available to Common divided by Normalized Common Equity. See page 8 for calculation. Core ROTCE steps provided based on certain modeling assumptions including U.S. Federal tax rate, forward curve data and other modeling variables. 2013 Core ROTCE as presented of 4% excludes $98MM CFPB charge. If included, Core ROTCE would be 3%. Page 4 – U.S. consumer auto originations New Subvented – subvented rate new vehicle loans from GM and Chrysler dealers New Standard – standard rate new vehicle loans from GM and Chrysler dealers Lease – new vehicle lease originations from all dealers Used – used vehicle loans from all dealers Growth – total originations from non-GM/Chrysler dealers
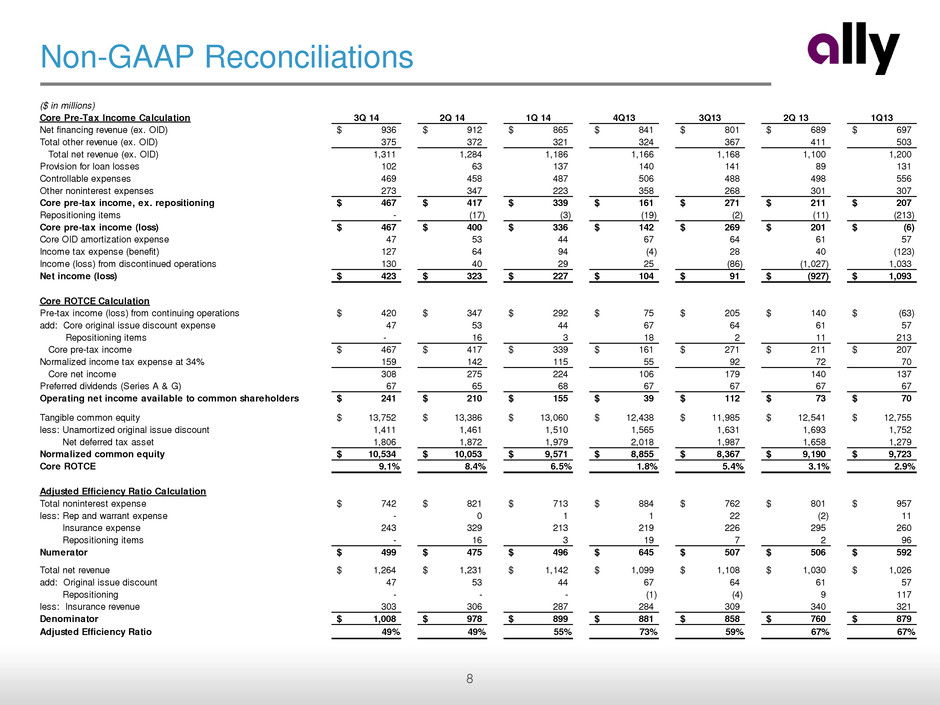
8 Non-GAAP Reconciliations ($ in millions) Core Pre-Tax Income Calculation 3Q 14 2Q 14 1Q 14 4Q13 3Q13 2Q 13 1Q13 Net financing revenue (ex. OID) 936$ 912$ 865$ 841$ 801$ 689$ 697$ Total other revenue (ex. OID) 375 372 321 324 367 411 503 Total net revenue (ex. OID) 1,311 1,284 1,186 1,166 1,168 1,100 1,200 Provision for loan losses 102 63 137 140 141 89 131 Controllable expenses 469 458 487 506 488 498 556 Other noninterest expenses 273 347 223 358 268 301 307 Core pre-tax income, ex. repositioning 467$ 417$ 339$ 161$ 271$ 211$ 207$ Repositioning items - (17) (3) (19) (2) (11) (213) Core pre-tax income (loss) 467$ 400$ 336$ 142$ 269$ 201$ (6)$ Core OID amortization expense 47 53 44 67 64 61 57 Income tax expense (benefit) 127 64 94 (4) 28 40 (123) Income (loss) from discontinued operations 130 40 29 25 (86) (1,027) 1,033 Net income (loss) 423$ 323$ 227$ 104$ 91$ (927)$ 1,093$ Core ROTCE Calculation Pre-tax income (loss) from continuing operations 420$ 347$ 292$ 75$ 205$ 140$ (63)$ add: Core original issue discount expense 47 53 44 67 64 61 57 Repositioning items - 16 3 18 2 11 213 Core pre-tax income 467$ 417$ 339$ 161$ 271$ 211$ 207$ Normalized income tax expense at 34% 159 142 115 55 92 72 70 Core net income 308 275 224 106 179 140 137 Preferred dividends (Series A & G) 67 65 68 67 67 67 67 Operating net income available to common shareholders 241$ 210$ 155$ 39$ 112$ 73$ 70$ Tangible common equity 13,752$ 13,386$ 13,060$ 12,438$ 11,985$ 12,541$ 12,755$ less: Unamortized original issue discount 1,411 1,461 1,510 1,565 1,631 1,693 1,752 Net deferred tax asset 1,806 1,872 1,979 2,018 1,987 1,658 1,279 Normalized common equity 10,534$ 10,053$ 9,571$ 8,855$ 8,367$ 9,190$ 9,723$ Core ROTCE 9.1% 8.4% 6.5% 1.8% 5.4% 3.1% 2.9% Adjusted Efficiency Ratio Calculation Total noninterest expense 742$ 821$ 713$ 884$ 762$ 801$ 957$ less: Rep and warrant expense - 0 1 1 22 (2) 11 Insurance expense 243 329 213 219 226 295 260 Repositioning items - 16 3 19 7 2 96 Numerator 499$ 475$ 496$ 645$ 507$ 506$ 592$ Total net revenue 1,264$ 1,231$ 1,142$ 1,099$ 1,108$ 1,030$ 1,026$ add: Original issue discount 47 53 44 67 64 61 57 Repositioning - - - (1) (4) 9 117 less: Insurance revenue 303 306 287 284 309 340 321 Denominator 1,008$ 978$ 899$ 881$ 858$ 760$ 879$ Adjusted Efficiency Ratio 49% 49% 55% 73% 59% 67% 67%
