Attached files
| file | filename |
|---|---|
| 8-K - 8-K - REGIONS FINANCIAL CORP | rf-201412098k.htm |

Goldman Sachs US Financial Service Conference December 9, 2014 1 Grayson Hall Chairman and CEO Exhibit 99.1

Leading Southeastern banking franchise 2 *As of 3Q14, except Market Cap as of 11/24/2014 Company Snapshot* Associates 23,599 Assets $119B Loans $77B Deposits $94B Branches 1,671 ATMs 1,995 Market Cap $13.9B Top Ten MSAs ’14-’19 Projected Population Growth Birmingham, AL Nashville, TN Tampa, FL Memphis, TN Miami, FL Atlanta, GA St. Louis, MO Jackson, MS New Orleans, LA Mobile, AL 1.0% 5.0% 2.6% 0.6% 6.4% 6.4% 2.9% 5.1% 6.2% 1.7% National Average: 3.5% Source: SNL Financial

Well positioned for growth 3 Liquidity Loan to deposit ratio(2) 82.2% 81.4% 89.3% 88.8% 3Q13 4Q13 1Q14 2Q14 3Q14 Capital Tier 1 Common ratio(1) Non-interest bearing deposits / total assets(3) Individual deposits(4) / total deposits (1) Non-GAAP – See appendix for reconciliation (2) Based on ending balances (3) Source: SNL Financial as of 9/30/14 (4) Excludes ZION; Source: SNL Financial as of 9/30/14 – Bank Call Reports identify individual deposits as “deposit products intended primarily for personal, household or family use” Note: Peer banks include BBT, CMA, FHN, FITB, HBAN, KEY, MTB, PNC, STI, USB, WFC, ZION 11.0% 11.8% 10.3% 10.7% 3Q13 4Q13 1Q14 2Q14 3Q14 Regions Peer Median 0% 5% 10% 15% 20% 25% 30% 35% 40% 45% Peer #1 Peer #2 Peer #3 Peer #4 RF Peer #5 Peer #6 Peer #7 Peer #8 Peer #9 Peer #10 Peer #11 Peer #12 0% 10% 20% 30% 40% 50% Peer #1 Peer #2 Peer #3 Peer #4 RF Peer #5 Peer #6 Peer #7 Peer #8 Peer #9 Peer #10 Peer #11 Peer Median = 22% Peer Median = 35%

Our excess capital position is sufficient to support both the return of capital and strong organic growth and other strategic opportunities 4 Invest and grow › Grow loans consistent with risk tolerance › Opportunistically evaluate complementary portfolios including banks and non-banks Return Capital to Shareholders › Increase dividends closer to peer average payout levels › Share repurchases

Key strategic initiatives in 2015 – General Bank 5 Consumer Services • Retain and increase customer relationships • Launch retail network strategy • Create products and services to generate additional revenue Wealth Management • Continue building out Investment Services • Execute larger Insurance lift-outs • Initiate discussions with potential sellers of insurance companies that fit our model Business Banking • Continue expansion of Small Business Administration program • Resource deployment to growth markets • Focus on targeted industries Consumer Lending • Increase non-real estate consumer lending through partnerships • Grow auto lending • Grow mortgage lending with focus on Texas and major metro markets that border 16-state footprint

Retail branch strategy: Long-term outlook 6 Priority Growth Core Conducted DETAILED market analysis to identify and prioritize growth markets Continue INVESTING in core markets to refine existing network, improve efficiency and maintain market share Designed to improve network efficiency and effectiveness and therefore increase our presence in key markets while maintaining a similar network size Will update outlook and strategy related to the retail network annually to ensure we remain aligned with changing needs of customers and usage patterns CONSOLIDATE lower performing branches

Allowing customers to bank the way they choose 7 Online / Mobile Branches Contact Center • Continues to be #1 sales generator • More than 80% of sales occur in a branch • Branch network strategy using various types of branch models. • Flagship, Neighborhood, Micro & Unmanned ATM / Kiosk • 37% of customers use mobile technology • Customers using mobile increased 20% YOY • Since 2012 mobile banking interactions increased 166% and mobile banking customers increased 32% • Agent call volume up 6% since 2012 • Contact center sales up 22% since 2012 • Supports/facilitates cross channel sales, service and expertise

Meeting customer needs through innovation 8 Video Tellers Universal Bankers • Provides customer convenience and extended hours • Banker can complete nearly all the transactions offered at a branch • Easily deployed throughout the footprint Online / Mobile Offerings • Enables bankers to provide both platform and teller assistance in key locations outside traditional branch model • Designed with emphasis on improving flexibility in branch network while encouraging increase in opportunity to fulfill client needs • Capabilities • Remote deposit capture • Funds availability uniqueness • New iPad® app iPad® is a registered trademark of Apple Inc.

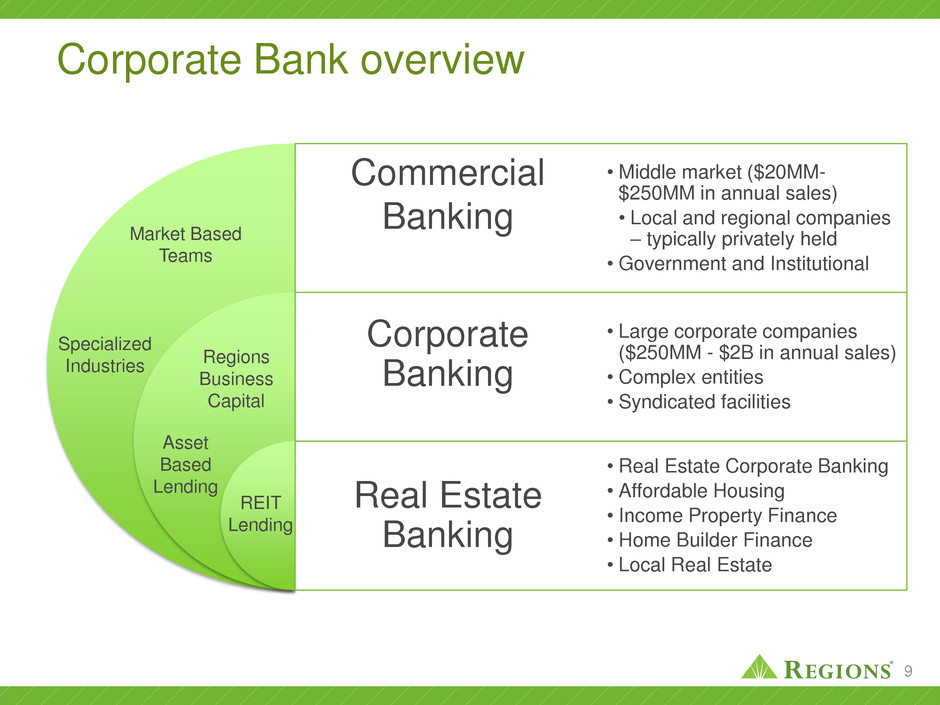
Corporate Bank overview 9 Commercial Banking Corporate Banking Real Estate Banking • Middle market ($20MM- $250MM in annual sales) • Local and regional companies – typically privately held • Government and Institutional • Large corporate companies ($250MM - $2B in annual sales) • Complex entities • Syndicated facilities • Real Estate Corporate Banking • Affordable Housing • Income Property Finance • Home Builder Finance • Local Real Estate Market Based Teams Specialized Industries Regions Business Capital REIT Lending Asset Based Lending

Key strategic initiatives in 2015 – Corporate Bank 10 Continue to recruit, retain, motivate and coach outstanding bankers Use data and analytics to allocate resources into target markets and specialized industries for expansion Continue to build Capital Markets and Treasury Management capabilities to drive NIR growth

Expectations for 2015 11 • Continued low interest rate environment throughout most of 2015; improvement expected late in the year • Leverage to grow customer relationships across business groups by 2% to 4% • Loan growth of 4% to 6% • Deposit growth of 1% to 2% • Expect to generate positive operating leverage

Regions’ aims to be the premier regional financial institution in America through being deeply embedded in its communities, operating as one team with the highest integrity, providing unique and extraordinary service to all of its customers, and offering an unparalleled opportunity for professional growth for its associates. Regions’ Vision Statement 12

13

Appendix 14

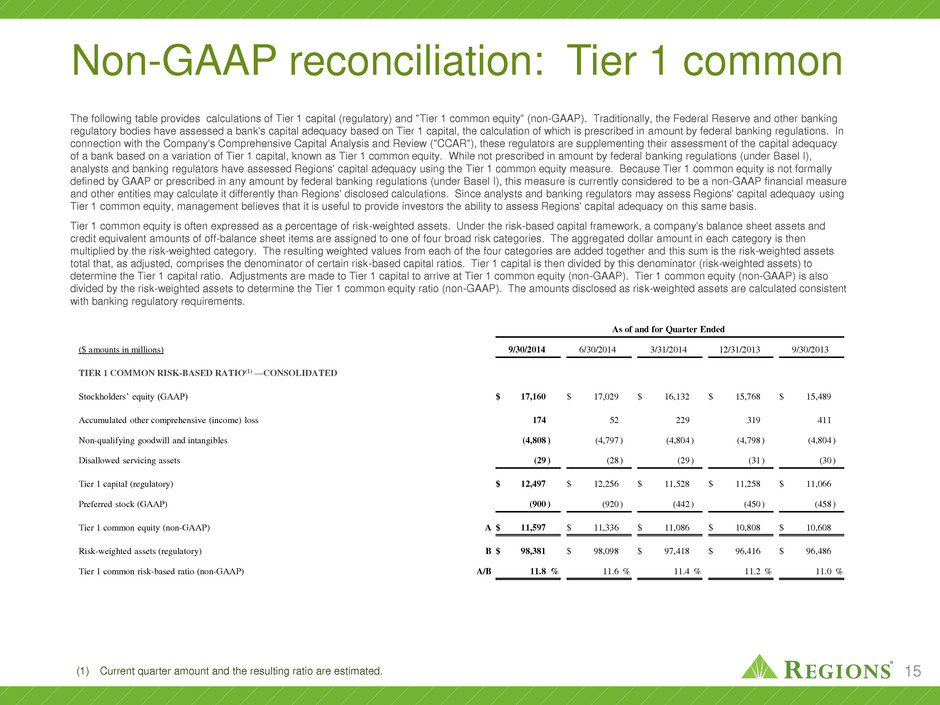
Non-GAAP reconciliation: Tier 1 common The following table provides calculations of Tier 1 capital (regulatory) and "Tier 1 common equity" (non-GAAP). Traditionally, the Federal Reserve and other banking regulatory bodies have assessed a bank's capital adequacy based on Tier 1 capital, the calculation of which is prescribed in amount by federal banking regulations. In connection with the Company's Comprehensive Capital Analysis and Review ("CCAR"), these regulators are supplementing their assessment of the capital adequacy of a bank based on a variation of Tier 1 capital, known as Tier 1 common equity. While not prescribed in amount by federal banking regulations (under Basel I), analysts and banking regulators have assessed Regions' capital adequacy using the Tier 1 common equity measure. Because Tier 1 common equity is not formally defined by GAAP or prescribed in any amount by federal banking regulations (under Basel I), this measure is currently considered to be a non-GAAP financial measure and other entities may calculate it differently than Regions' disclosed calculations. Since analysts and banking regulators may assess Regions' capital adequacy using Tier 1 common equity, management believes that it is useful to provide investors the ability to assess Regions' capital adequacy on this same basis. Tier 1 common equity is often expressed as a percentage of risk-weighted assets. Under the risk-based capital framework, a company's balance sheet assets and credit equivalent amounts of off-balance sheet items are assigned to one of four broad risk categories. The aggregated dollar amount in each category is then multiplied by the risk-weighted category. The resulting weighted values from each of the four categories are added together and this sum is the risk-weighted assets total that, as adjusted, comprises the denominator of certain risk-based capital ratios. Tier 1 capital is then divided by this denominator (risk-weighted assets) to determine the Tier 1 capital ratio. Adjustments are made to Tier 1 capital to arrive at Tier 1 common equity (non-GAAP). Tier 1 common equity (non-GAAP) is also divided by the risk-weighted assets to determine the Tier 1 common equity ratio (non-GAAP). The amounts disclosed as risk-weighted assets are calculated consistent with banking regulatory requirements. (1) Current quarter amount and the resulting ratio are estimated. 15 As of and for Quarter Ended ($ amounts in millions) 9/30/2014 6/30/2014 3/31/2014 12/31/2013 9/30/2013 TIER 1 COMMON RISK-BASED RATIO(1) —CONSOLIDATED Stockholders’ equity (GAAP) $ 17,160 $ 17,029 $ 16,132 $ 15,768 $ 15,489 Accumulated other comprehensive (income) loss 174 52 229 319 411 Non-qualifying goodwill and intangibles (4,808 ) (4,797 ) (4,804 ) (4,798 ) (4,804 ) Disallowed servicing assets (29 ) (28 ) (29 ) (31 ) (30 ) Tier 1 capital (regulatory) $ 12,497 $ 12,256 $ 11,528 $ 11,258 $ 11,066 Preferred stock (GAAP) (900 ) (920 ) (442 ) (450 ) (458 ) Tier 1 common equity (non-GAAP) A $ 11,597 $ 11,336 $ 11,086 $ 10,808 $ 10,608 Risk-weighted assets (regulatory) B $ 98,381 $ 98,098 $ 97,418 $ 96,416 $ 96,486 Tier 1 common risk-based ratio (non-GAAP) A/B 11.8 % 11.6 % 11.4 % 11.2 % 11.0 %

Forward-looking statements The foregoing list of factors is not exhaustive. For discussion of these and other factors that may cause actual results to differ from expectations, look under the captions “Forward-Looking Statements” and “Risk Factors" of Regions' Annual Report on Form 10-K for the year ended December 31, 2013, as filed with the Securities and Exchange Commission. The words “anticipates,” “intends,” “plans,” “seeks,” “believes,” “estimates,” “expects,” “targets,” “projects,” “outlook,” “forecast,” “will,” “may,” “could,” “should,” “can,” and similar expressions often signify forward-looking statements. You should not place undue reliance on any forward-looking statements, which speak only as of the date made. We assume no obligation to update or revise any forward-looking statements that are made from time to time. This presentation may include forward-looking statements, as defined in the Private Securities Litigation Reform Act of 1995, which reflect Regions’ current views with respect to future events and financial performance. Forward-looking statements are not based on historical information, but rather are related to future operations, strategies, financial results or other developments. Forward- looking statements are based on management’s expectations as well as certain assumptions and estimates made by, and information available to, management at the time the statements are made. Those statements are based on general assumptions and are subject to various risks, uncertainties and other factors that may cause actual results to differ materially from the views, beliefs and projections expressed in such statements. These risks, uncertainties and other factors include, but are not limited to, those described below: 16 • Current and future economic and market conditions in the United States generally or in the communities we serve, including the effects of declines in property values, unemployment rates and potential reduction of economic growth. • Possible changes in trade, monetary and fiscal policies of, and other activities undertaken by, governments, agencies, central banks and similar organizations. • The effects of a possible downgrade in the U.S. government’s sovereign credit rating or outlook. • Possible changes in market interest rates. • Any impairment of our goodwill or other intangibles, or any adjustment of valuation allowances on our deferred tax assets due to adverse changes in the economic environment, declining operations of the reporting unit, or other factors. • Possible changes in the creditworthiness of customers and the possible impairment of the collectability of loans. • Changes in the speed of loan prepayments, loan origination and sale volumes, charge-offs, loan loss provisions or actual loan losses. • Possible acceleration of prepayments on mortgage-backed securities due to low interest rates, and the related acceleration of premium amortization on those securities. • Our ability to effectively compete with other financial services companies, some of whom possess greater financial resources than we do and are subject to different regulatory standards than we are. • Loss of customer checking and savings account deposits as customers pursue other, higher-yield investments. • Our ability to develop and gain acceptance from current and prospective customers for new products and services in a timely manner. • Changes in laws and regulations affecting our businesses, including changes in the enforcement and interpretation of such laws and regulations by applicable governmental and self- regulatory agencies. • Our ability to obtain regulatory approval (as part of the CCAR process or otherwise) to take certain capital actions, including paying dividends and any plans to increase common stock dividends, repurchase common stock under current or future programs, or issue or redeem preferred stock or other regulatory capital instruments. • Our ability to comply with applicable capital and liquidity requirements (including finalized Basel III capital standards), including our ability to generate capital internally or raise capital on favorable terms. • The costs and other effects (including reputational harm) of any adverse judicial, administrative, or arbitral rulings or proceedings, regulatory enforcement actions, or other legal actions to which we or any of our subsidiaries are a party. • Any adverse change to our ability to collect interchange fees in a profitable manner, whether such change is the result of regulation, litigation, legislation, or other governmental action. • Our ability to manage fluctuations in the value of assets and liabilities and off-balance sheet exposure so as to maintain sufficient capital and liquidity to support our business. • Possible changes in consumer and business spending and saving habits and the related effect on our ability to increase assets and to attract deposits. • Any inaccurate or incomplete information provided to us by our customers or counterparties. • Inability of our framework to manage risks associated with our business such as credit risk and operational risk, including third-party vendors and other service providers. • The inability of our internal disclosure controls and procedures to prevent, detect or mitigate any material errors or fraudulent acts. • The effects of geopolitical instability, including wars, conflicts and terrorist attacks. • The effects of man-made and natural disasters, including fires, floods, droughts, tornadoes, hurricanes and environmental damage. • Our ability to keep pace with technological changes. • Our ability to identify and address cyber-security risks such as data security breaches, “denial of service” attacks, “hacking” and identity theft. • Possible downgrades in our credit ratings or outlook. • The effects of problems encountered by other financial institutions that adversely affect us or the banking industry generally. • The effects of the failure of any component of our business infrastructure which is provided by a third party. • Our ability to receive dividends from our subsidiaries. • Changes in accounting policies or procedures as may be required by the Financial Accounting Standards Board or other regulatory agencies. • The effects of any damage to our reputation resulting from developments related to any of the items identified above.
