Attached files
| file | filename |
|---|---|
| 8-K - 8-K - PANTRY INC | a09252014-form8xk.htm |
| EX-99.1 - PRESS RELEASE - PANTRY INC | a09252014-pressrelease.htm |

The Pantry, Inc. Fiscal Year 2014 Fourth Quarter Earnings Call Tuesday, December 9, 2014 Exhibit 99.2

Slide 2 Safe Harbor Statement Some of the statements in this presentation constitute “forward-looking statements” within the meaning of the Private Securities Litigation Reform Act of 1995. All statements other than those of historical facts included herein, including those related to the company’s financial outlook, goals, business strategy, projected plans and objectives of management for future operations and liquidity, are forward-looking statements. These forward-looking statements are based on the company’s plans and expectations and involve a number of risks and uncertainties that could cause actual results to vary materially from the results and events anticipated or implied by such forward-looking statements. Please refer to the company’s Annual Report on Form 10-K and its other filings with the SEC for a discussion of significant risk factors applicable to the company. In addition, the forward-looking statements included in this presentation are based on the company’s estimates and plans as of the date of this presentation. While the company may elect to update these forward-looking statements at some point in the future, it specifically disclaims any obligation to do so. In this presentation, we will refer to certain non-GAAP financial measures that we believe are helpful in understanding our financial performance. A reconciliation of each non-GAAP financial measure to the most directly comparable GAAP measure is included in the appendix of this presentation.

Fourth Quarter Business Overview and FY15 Outlook Performance summary Merchandise trends Merchandising initiatives Fuel trends Focus on managing costs and improving productivity QSR development Remodel and store development activities FY15 priorities Slide 3

FY2014 Q4 Summary and Full Year Summary (1) See Appendix for a description of each non-GAAP financial measure as well as a reconciliation of each non-GAAP financial measure to the most directly comparable GAAP measure. Slide 4 Q4 FY2014 Results Full Year FY2014 Results Income per diluted share of $0.63 versus $0.04 in 2013 Adjusted EBITDA(1) of $71.1 million versus $49.0 million in Q4 FY2013 Comparable store merchandise revenue increased 2.5% Merchandise sales per customer improved 4.5% on a comparable basis Comparable store retail fuel gallons sold declined 2.5% Retail fuel margins increased $0.026 per gallon to $0.133 Income per diluted share of $0.57 versus loss per share of $0.13 in 2013 Adjusted EBITDA(1) of $220.9 million versus $202.4 million in FY2013 Comparable store merchandise revenue increased 2.6% Merchandise sales per customer improved 4.0% on a comparable basis Comparable store retail fuel gallons sold declined 2.9% Retail fuel margins increased $0.007 per gallon to $0.122

Merchandise Trends Slide 5 Q1 Q2 Q3 Q4 FY Q1 Q2 Q3 Q4 FY Cigarettes -2.8% -6.4% -3.3% -2.0% -3.6% -0.7% -2.9% -1.5% -0.2% -1.3% Other Packaged Goods 4.3% 0.2% 3.0% 3.8% 2.9% 5.5% 4.2% 4.0% 3.1% 4.2% Packaged Goods 1.6% -2.3% 0.7% 1.8% 0.5% 3.3% 1.6% 2.1% 2.0% 2.3% Proprietary Foodservice 8.6% 3.3% 6.9% 3.3% 5.5% 6.5% 7.8% 3.2% 6.5% 6.0% QSR [1] -1.9% -5.9% -2.4% -0.7% -2.8% 4.1% 5.8% 7.7% 6.9% 6.2% Foodservice 4.2% -0.7% 3.0% 1.7% 2.1% 5.6% 7.0% 5.0% 6.7% 6.1% Services 12.0% 0.7% 9.2% 9.7% 7.8% 2.1% 3.2% -2.3% 1.3% 1.1% Total Comparable Store Merchandise Revenue 2.2% -2.0% 1.3% 2.0% 0.9% 3.5% 2.3% 2.3% 2.5% 2.6% Total Excluding Cigarettes 4.6% 0.1% 3.3% 3.7% 3.0% 5.4% 4.5% 3.9% 3.6% 4.3% Sales Comps FY13 FY14 [1] Includes QSR’s opened/closed in existing stores

Merchandising Initiatives Increased sales per customer ‒ Suggestive selling – adding one item ‒ Driving “Average Unit Retail” Cigarette sales continue to benefit store traffic and drive attachment sales Assortment enhancements ‒ Expanding Cold/Frozen dispensed beverage offering into additional stores ‒ Enhanced Snacks assortment with greater emphasis on premium and healthy items ‒ Introduced new bakery SKUs ‒ Expanded vaping assortment ‒ Adjusted cigar assortment (products, brand, flavors, packs) Promotional activity ‒ Expanded “Buy more, save more” promotions to additional categories ‒ Launched redesigned Roo Mug program Slide 6

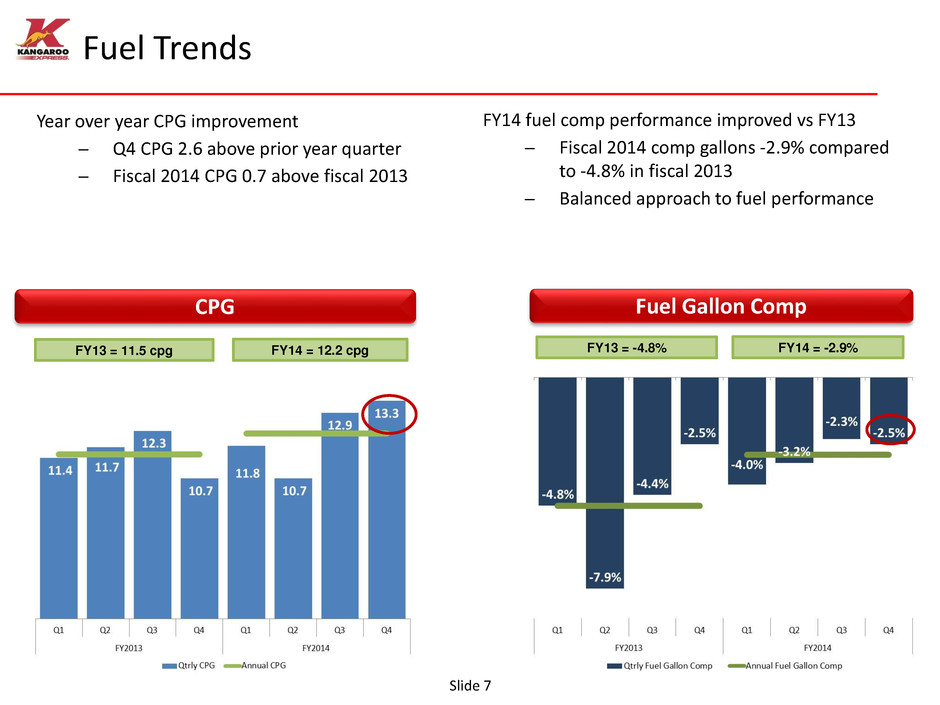
Fuel Trends Slide 7 Year over year CPG improvement ̶ Q4 CPG 2.6 above prior year quarter ̶ Fiscal 2014 CPG 0.7 above fiscal 2013 FY13 = 11.5 cpg CPG Fuel Gallon Comp FY13 = -4.8% FY14 = 12.2 cpg FY14 = -2.9% FY14 fuel comp performance improved vs FY13 ̶ Fiscal 2014 comp gallons -2.9% compared to -4.8% in fiscal 2013 ̶ Balanced approach to fuel performance CP Fu l allon Comp

Focus On Managing Costs And Improving Productivity Slide 8 Accelerated employee training and development programs Rationalization of 24 hour stores Streamlined communication channel between store operations and fuel Prioritized remodel best practices for use in fiscal 2015 Installed cellular back up in 800 stores Improved safety and claims management

QSR Development Opened nine Little Caesars during the fourth quarter Opened 20 QSRs and closed nine underperforming QSRs in FY 2014 Brand approvals in place to allow for approximately 30 additional QSRs in FY 2015 Investment in restaurant operations support - Training - Marketing - Brand development - Store openings Slide 9 Current QSRs: 233 Subway Aunt M’s Little Caesars Dairy Queen Hardees Krystal Other 150 36 19 13 6 5 4 New QSRs

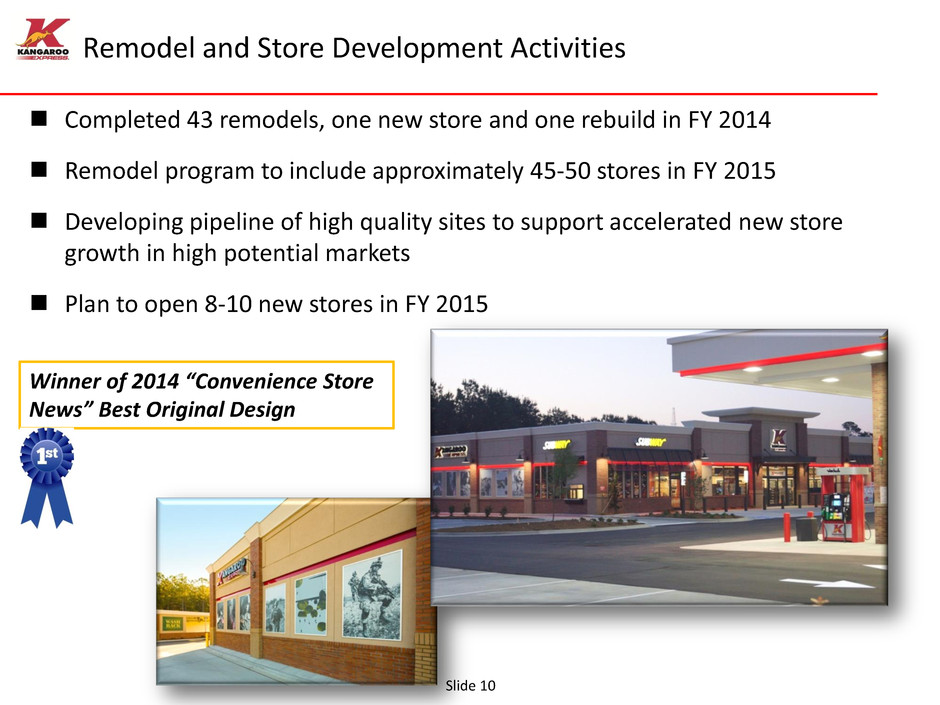
Remodel and Store Development Activities Slide 10 Completed 43 remodels, one new store and one rebuild in FY 2014 Remodel program to include approximately 45-50 stores in FY 2015 Developing pipeline of high quality sites to support accelerated new store growth in high potential markets Plan to open 8-10 new stores in FY 2015 Winner of 2014 “Convenience Store News” Best Original Design

Improving our customer experience Building store traffic and sales per customer Balancing fuel profitability and stabilizing market share Upgrading our stores through remodels, QSR additions and new stores Controlling costs and increasing productivity Hiring and developing the best and most energized people FY15 Priorities 11

Fourth Quarter Financial Review Slide 12 Financial summary Financial details Capital expenditures Store count Capital structure and liquidity Fiscal 2015 outlook

Fourth Quarter Financial Summary ($ millions except per share data) Slide 13 (1) Includes impairment charges of $0.7 million and $1.2 million in 2013 and 2014, respectively. (2) See Appendix for a description of each non-GAAP financial measure as well as a reconciliation of each non-GAAP financial measure to the most directly comparable GAAP measure. 2013 2014 Percent Change Total revenues $ 2,021.9 $ 1,955.3 -3.3% Total costs and operating expenses (1) 2,003.7 1,912.7 -4.5% Income from operations $ 18.1 $ 42.6 135.4% Interest expense 21.6 21.1 -2.3% Income before income taxes $ (3.4) $ 21.4 NM Income tax (benefit) expense (4.4) 6.8 NM Net Income $ 1.0 $ 14.6 NM Earnings per share $ 0.04 $ 0.63 NM Adjusted EBITDA(2) 49.0$ $ 71.1 45.1% Fourth Quarter

Fourth Quarter Financial Details ($ millions) Slide 14 2013 2014 Percent Change Merchandise revenue $ 475.6 $ 483.5 1.7% Fuel revenue 1,546.3 1,471.7 -4.8% Total revenues $ 2,021.9 $ 1,955.3 -3.3% Merchandise cost of goods sold $ 312.4 $ 313.5 0.4% Fuel cost of goods sold 1,498.4 1,414.1 -5.6% Store operating 132.5 129.0 -2.6% General and administrative 29.5 27.6 -6.4% Impairment charges 0.7 1.2 71.4% Depreciation and amortization 30.2 27.3 -9.6% Income from operations $ 18.1 $ 42.6 135.4% Selected financial data: Comparable store merchandise sales % 2.0% 2.5% Weighted-average store count 1,557 1,524 Merchandise margin 34.3% 35.2% Comparable store retail fuel gallons % -2.5% -2.5% Retail fuel margin per gallon $ 0.107 $ 0.133 Fourth Quarter

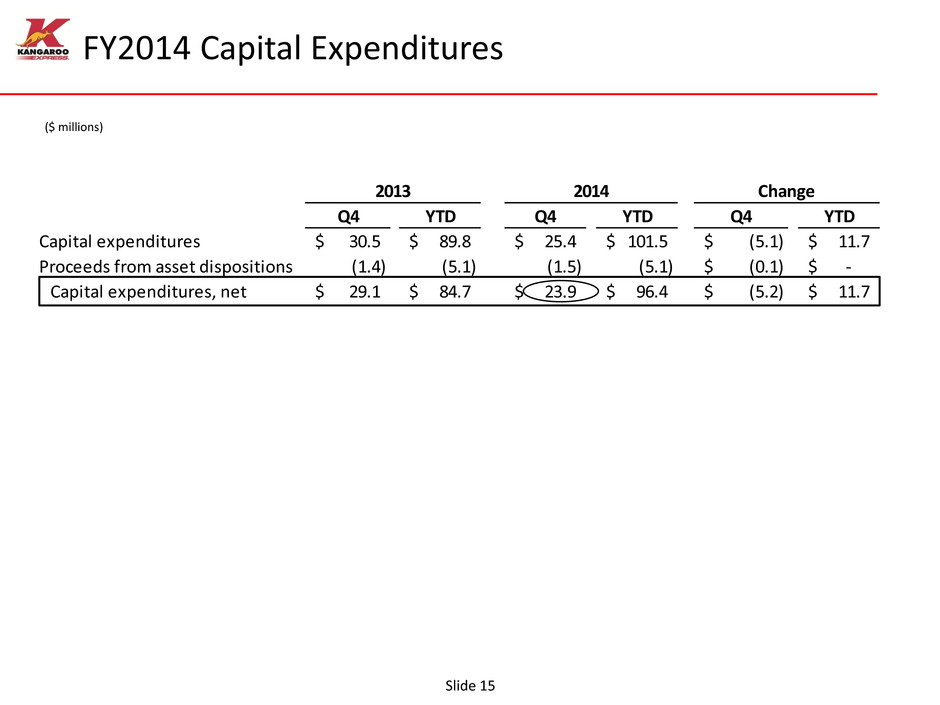
Q4 YTD Q4 YTD Q4 YTD Capital expenditures 30.5$ 89.8$ 25.4$ 101.5$ (5.1)$ 11.7$ Proceeds from asset dispositions (1.4) (5.1) (1.5) (5.1) (0.1)$ -$ Capital expenditures, net 29.1$ 84.7$ 23.9$ 96.4$ (5.2)$ 11.7$ 2013 2014 Change FY2014 Capital Expenditures ($ millions) Slide 15

Store Count Summary Slide 16 Ending Stores - FY2013 1,548 New 1 Closed (11) Ending Stores - Q1 FY2014 1,538 Closed (4) Ending Stores - Q2 FY2014 1,534 Closed (7) Ending Stores - Q3 FY2014 1,527 Closed (9) Ending Stores - Q4 FY2014 1,518

9/26/2013 9/25/2014 Cash 57.2$ 81.7$ Debt: Revolver - - Term loan 253.1 250.5 Notes 250.0 250.0 Lease finance obligations 445.0 434.6 Total Debt 948.1$ 935.1$ Shareholder's equity 323.7 339.4 Total capitalization 1,271.8$ 1,274.5$ Net debt 890.9$ 853.4$ Total liquidity (1) 187.6$ 221.8$ Capital Structure And Liquidity ($ millions) Slide 17 (1) Cash and cash equivalents plus revolver availability.

Fiscal 2015 Outlook Slide 18 (1) Fiscal 2015 guidance assumes closure of 40-50 stores. Q1 FY14 FY14 Actual Low High Actual Low High Merchandise sa les ($B) $0.441 $0.448 $0.453 $1.84 $1.85 $1.88 Merchandise gross margin 33.5% 33.4% 33.9% 34.2% 33.9% 34.3% Retai l fuel ga l lons (B) 0.409 0.414 0.419 1.65 1.63 1.66 Retai l fuel margin per ga l lon $0.118 $0.150 $0.160 $0.122 $0.118 $0.138 Store operating and general and adminis trative expenses ($M) Depreciation & amortization ($M) $29 $25 $27 $112 $105 $110 Effective corporate tax rate 39.2% 38.0% 39.0% 32.0% 38.0% 39.0% Interest expense ($M) $21 $21 $22 $85 $83 $85 Capita l expenditures , net ($M) $30 $17 $20 $102 $127 $137 Q1 FY15 Guidance(1) FY15 Guidance(1) $154 $152 $156 $610 $622 $632

Slide 19

Appendix Slide 20 Selected financial data Use of Non-GAAP measures

Selected Financial Data Slide 21 ($ thousands, except per share amounts) Revenues: Merchandise $ 475,608 $ 483,545 $ 1,800,001 $ 1,834,929 Fuel Total revenues Costs and operating expenses: Merchandise cost of goods sold Fuel cost of goods sold Store operating General and administrative Impairment charges Depreciation and amortization Total costs and operating expenses Income from operations O ther expenses: Interest expense Total other expenses Income (loss) before income taxes Income tax expense (benefit) Net income (loss) $ 972 $ 14,655 $ (3,012) $ 13,224 Income (loss) per diluted share: Income (loss) per diluted share $ 0.04 $ 0.63 $ (0.13) $ 0.57 Diluted shares outstanding Three Months Ended Fiscal Year Ended September 25, 2013 2014 2013 2014 September 26, September 25, September 26, 2,021,880 1,955,259 7,821,955 7,545,664 1,546,272 1,471,714 6,021,954 5,710,735 132,506 128,999 504,315 505,916 29,532 27,634 104,711 103,912 312,371 313,501 1,187,870 1,208,027 1,498,446 1,414,051 5,822,688 5,506,919 2,003,736 1,912,684 7,741,989 7,440,985 18,144 42,575 79,966 104,679 727 1,153 4,681 3,971 30,154 27,346 117,724 112,240 21,561 21,561 88,779 85,226 (3,417) 21,430 (8,813) 19,453 21,561 21,145 88,779 85,226 22,884 23,149 22,691 23,004 (4,389) 6,775 (5,801) 6,229

Selected Financial Data Slide 22 (1) Fuel margin per gallon represents fuel revenue less cost of product and expenses associated with credit card processing fees and repairs and maintenance on fuel equipment. Fuel margin per gallon as presented may not be comparable to similarly titled measures reported by other companies. ($ thousands, except per gallon) Selected financial data: Adjusted EBITDA $ 49,025 $ 71,074 $ 202,371 $ 220,890 Payments made for lease finance obligations $ 13,078 $ 13,161 $ 51,767 $ 52,799 Merchandise gross profit $ 163,237 $ 170,044 $ 612,131 $ 626,902 Merchandise margin Retail fuel data: Gallons Margin per gallon (1) $ 0.107 $ 0.133 $ 0.115 $ 0.122 Retail price per gallon $ 3.45 $ 3.39 $ 3.46 $ 3.41 Total fuel gross profit $ 47,826 $ 57,663 $ 199,266 $ 203,816 C mparable store data: Merchandise sales % Retail fuel gallons % Number of stores: End of period Weighted-average store count 1,557 1,524 1,567 1,534 1,548 1,518 1,548 1,518 (2.5%) (2.5%) (4.8%) (2.9%) 2.0% 2.5% 0.9% 2.6% 441,124 428,252 1,708,167 1,650,551 34.3% 35.2% 34.0% 34.2% September 25, 2013 2014 2013 2014 September 26, September 25, September 26,

Use of Non-GAAP Measures Adjusted EBITDA Adjusted EBITDA is defined by the Company as net income (loss) before interest expense, gain/loss on extinguishment of debt, income taxes, impairment charges and depreciation and amortization. Adjusted EBITDA is not a measure of operating performance or liquidity under generally accepted accounting principles in the United States of America (“GAAP”) and should not be considered as a substitute for net income, cash flows from operating activities or other income or cash flow statement data. The Company has included information concerning Adjusted EBITDA because it believes investors find this information useful as a reflection of the resources available for strategic opportunities including, among others, to invest in the Company’s business, make strategic acquisitions and to service debt. Management also uses Adjusted EBITDA to review the performance of the Company's business directly resulting from its retail operations and for budgeting and compensation targets. Adjusted EBITDA does not include impairment of long-lived assets and other charges. The Company excluded the effect of impairment losses because it believes that including them in Adjusted EBITDA is not consistent with reflecting the ongoing performance of its remaining assets. Adjusted EBITDA does not include gain/loss on extinguishment of debt because it represents financing activities and is not indicative of the ongoing performance of the Company’s remaining stores. Slide 23

Additional Information Regarding Non-GAAP Measures Any measure that excludes interest expense, gain/loss on extinguishment of debt, depreciation and amortization, impairment charges, or income taxes has material limitations because the Company uses debt and lease financing in order to finance its operations and acquisitions, uses capital and intangible assets in its business and must pay income taxes as a necessary element of its operations. Due to these limitations, the Company uses non-GAAP measures in addition to and in conjunction with results and cash flows presented in accordance with GAAP. The Company strongly encourages investors to review its consolidated financial statements and publicly filed reports in their entirety and not to rely on any single financial measure. Because non-GAAP financial measures are not standardized, the measures referenced above, each as defined by the Company, may not be comparable to similarly titled measures reported by other companies. It therefore may not be possible to compare the Company's use of these measures with non-GAAP financial measures having the same or similar names used by other companies. Slide 24

Adjusted EBITDA Reconciliation Slide 25 ($ thousands) September 26, September 25, September 26, September 25, 2013 2014 2013 2014 Adjusted EBITDA 49,025$ 71,074$ 202,371$ 220,890$ Impairment charges (727) (1,153) (4,681) (3,971) Interest expense (21,561) (21,145) (88,779) (85,226) Depreciation and amortization (30,154) (27,346) (117,724) (112,240) Income tax (provision) benefit 4,389 (6,775) 5,801 (6,229) Net income (loss) 972$ 14,655$ (3,012)$ 13,224$ Adjusted EBITDA 49,025$ 71,074$ 202,371$ 220,890$ Interest expense (21,561) (21,145) (88,779) (85,226) Income tax (provision) benefit 4,389 (6,775) 5,801 (6,229) Stock-based compensation expense 390 973 2,738 3,322 Changes in operating assets and liabilities 17,377 7,526 5,317 (7,432) Provision for deferred income taxes (4,641) 6,490 (5,697) 6,546 Other 2,019 1,242 6,360 4,997 Net cash provided by operating activities 46,998$ 59,385$ 128,111$ 136,868$ Additions to property and equipment, net (27,923)$ (24,306)$ (82,939)$ (96,834)$ Acquisitions of businesses, net (1,221) - (1,723) - Net cash used in investing activities (29,144)$ (24,306)$ (84,662)$ (96,834)$ Net cash used in financing activities (4,833)$ (3,432)$ (75,456)$ (15,550)$ Net increase (decrease) in cash 13,021$ 31,647$ (32,007)$ 24,484$ Three Months Ended Fiscal Year Ended
