Attached files
| file | filename |
|---|---|
| 8-K - FORM 8-K - CITIZENS FINANCIAL GROUP INC/RI | d834330d8k.htm |
 Goldman Sachs
US Financial Services Conference 2014 December 9, 2014
Bruce Van Saun, Chairman and Chief Executive Officer
Exhibit 99.1 |
 Forward-looking statements and Non-GAAP financial measures
Forward-Looking Statements
This document contains forward-looking statements within the Private Securities Litigation
Reform Act of 1995. Any statement that does not describe historical or current facts is a forward-looking statement. Statements regarding
potential
future
share
repurchases
and
future
dividends
are
forward-looking
statements.
These
statements
often
include
the
words
“believes,”
“expects,”
“anticipates,”
“estimates,”
“intends,”
“plans,”
“goals,”
“targets,”
“initiatives,”
“potentially,”
“probably,”
“projects,”
“outlook”
or
similar
expressions
or
future
conditional
verbs
such
as
“may,”
“will,”
“should,”
“would,”
and
“could.”
Forward-looking
statements
are
based
upon
the
current
beliefs
and
expectations
of
management
and
on
information
currently
available
to
management.
Our
statements
speak
as
of
the
date
hereof,
and
we
do
not
assume
any
obligation
to update these statements or to update the reasons why actual results could differ from those
contained in such statements in light of new information or future events. We caution you, therefore, against relying on any of these
forward-looking statements. They are neither statements of historical fact nor guarantees
or assurances of future performance. While there is no assurance that any list of risks and uncertainties or risk factors is complete, important
factors that could cause actual results to differ materially from those in the
forward-looking statements include the following, without limitation: negative
economic conditions that adversely affect the general economy, housing prices, the job market, consumer confidence and spending habits which may affect, among other things, the level of nonperforming assets,
charge-offs and provision expense;
the rate
of
growth
in
the
economy
and
employment
levels,
as
well
as
general
business
and
economic
conditions;
our ability to implement our strategic plan, including the cost savings and efficiency
components, and achieve our indicative performance targets; our ability to remedy
regulatory deficiencies and meet supervisory requirements and expectations; liabilities
resulting from litigation and regulatory investigations; our capital and liquidity
requirements (including under regulatory capital standards, such as the Basel III capital standards) and our ability to generate capital internally or raise capital on favorable terms;
the effect of the current low interest rate environment or changes in interest rates on our net
interest income, net interest margin and our mortgage originations, mortgage servicing rights and mortgages held for sale;
changes in interest rates and market liquidity, as well as the magnitude of such changes, which
may reduce interest margins, impact funding sources and affect the ability to originate and distribute financial products in the
primary and secondary markets;
the effect of changes in the level of checking or savings account deposits on our funding costs
and net interest margin; financial services reform and other current, pending or future
legislation or regulation that could have a negative effect on our revenue and businesses, including the Dodd-Frank Act and other legislation and regulation relating to
bank products and services;
a failure
in
or
breach
of
our
operational
or
security
systems
or
infrastructure,
or
those
of
our
third
party
vendors
or
other
service
providers,
including
as
a
result
of
cyber
attacks;
management’s ability to identify and manage these and other risks; and
any failure by us to successfully replicate or replace certain functions, systems and
infrastructure provided by RBS. In
addition
to
the
above
factors,
we
also
caution
that
the
amount
and
timing
of
any
future
common
stock
dividends
will
depend
on
our
financial
condition,
earnings,
cash
needs,
regulatory
constraints,
capital
requirements
(including
requirements of our subsidiaries), and any other factors that our Board of Directors deems
relevant in making such a determination. Therefore, there can be no assurance that we will pay any dividends to holders of our common stock,
or as to the amount of any such dividends. In addition, the timing and manner of the sale of
RBS's remaining ownership of our common stock remains uncertain, and we have no control over the manner in which RBS may seek to divest
such remaining shares. Any such sale would impact the price of our shares of common
stock. More
information
about
factors
that
could
cause
actual
results
to
differ
materially
from
those
described
in
the
forward-looking
statements
can
be
found
under
“Risk
Factors”
in
our
Registration
Statement
on
Form
S-1
filed
with the
United States Securities and Exchange Commission and declared effective on September 23,
2014. Non-GAAP Financial Measures
This
document
contains
non-GAAP
financial
measures,
"noninterest
income”,
“net
interest
income”,
“total
revenue”,
“
noninterest
expense”,
“net
income
(loss)”,
“income
tax
expense
(benefit)”,
“service
charges
and
fees”,
“card
fees”,
“trust & investment services fees”, and “securities gains, other income, and
estimated Chicago Divestiture fees”. In addition, we present computations for “return on average tangible common equity”, “return on average total tangible
assets”
and
“efficiency
ratio”
as
part
of
our
non-GAAP
measures.
These
non-GAAP
measures
exclude
discontinued
operations,
goodwill
impairment,
restructuring
charges
and
special
items,
which
are
usually
included,
where
applicable, in
the
financial
results
presented
in
accordance
with
GAAP.
Special
items
include
regulatory
expenses,
expenses
relating
to
our
initial
public
offering,
and
other
expenses
or
income.
All
references
to
“Adjusted”
results
are
non-GAAP
financial
measures.
These
measures
exclude
restructuring
charges
and
special
items.
We believe these non-GAAP measures provide useful information to investors because these
are among the measures used by our management team to evaluate our operating performance and make day-to-day operating decisions. In
addition, we believe discontinued operations, goodwill impairment, restructuring charges and
special items in any period do not reflect the operational performance of the business in that period and, accordingly, it is useful to consider
these line items with and without discontinued operations, goodwill impairment, restructuring
charges and special items. We believe this presentation also increases comparability of period-to-period results.
Other
companies
may
use
similarly
titled
non-GAAP
financial
measures
that
are
calculated
differently
from
the
way
we
calculate
such
measures.
Accordingly,
our
non-GAAP
financial
measures
may
not
be
comparable
to
similar
measures
used
by
other
companies.
We
caution
investors
not
to
place
undue
reliance
on
such
non-GAAP
measures,
but
instead
to
consider
them
with
the
most
directly
comparable
GAAP
measure.
Non-GAAP
financial
measures
have
limitations
as
analytical tools, and should not be considered in isolation, or as a substitute for our results
as reported under GAAP. A reconciliation of non-GAAP measures to the most comparable financial measure prepared in accordance with GAAP is
included in the Appendix hereto.
1 |
 2
Dimension
Rank
(2)
Assets -
$131.3 billion
#13
Loans -
$91.0 billion
#13
Deposits -
$93.5 billion
#14
Branches -
1,225
#11
ATM network -
3,208
#7
Lead/joint lead
bookrunner
#5
(3)
Deposits -
$93.5 billion
Top 5 rank:
9/10 markets
(1)
HELOC -
$16.1 billion
Top 5 rank:
9/9 markets
(4)
Auto -
$12.1 billion
Top 5 rank:
6/9 markets
(5)
Mortgage –
$11.3 billion
Top 5 rank:
2/9 markets
(6)
Middle-market lending
#5
(7)
1)
As of 6/30/2014, excludes non-retail branches and banks with limited retail
operations. 2)
As of 9/30/2014, unless otherwise noted; excludes non-retail depository institutions,
includes U.S. subsidiaries of foreign banks. 3)
Thomson Reuters LPC, 3Q14 data based on number of deals for Overall Middle Market (defined as
Borrower Revenues < $500MM and Deal Size < $500MM). 4)
According to Equifax; origination volume as of 1Q14, excludes Illinois.
5)
According to Autocount; origination volume as of 2Q14, excludes Illinois.
6)
According to Equifax; origination volume as of 4Q13, excludes Illinois.
7)
Based on market penetration, according to Greenwich Associates 2Q14 rolling four-quarter
data; survey may include clients & competitors in Illinois. Leading deposit market
share of 9.1% in top 10 MSAs –
#2 deposit market share in New England
Relatively diverse economies/affluent demographics
Serve 5 million+ individuals, institutions and
companies
As of 10/8/2014, 70.5% of CFG owned by The Royal
Bank of Scotland (RBS) -
intends to fully exit by the
end of 2016
Solid franchise with leading positions in attractive markets
Source: SNL Financial, unless otherwise noted.
Significant scale in core markets
(1)
>10%
5–10%
<5%
State Deposit Market Share
Buffalo, NY: #4
Providence, RI: #1
Albany, NY: #2
Pittsburgh, PA: #2
Cleveland, OH: #4
Manchester,
NH: #1
Boston, MA:
#2
Rochester, NY: #4
Philadelphia, PA: #5
13
th
largest
U.S.
retail
bank
by
assets |
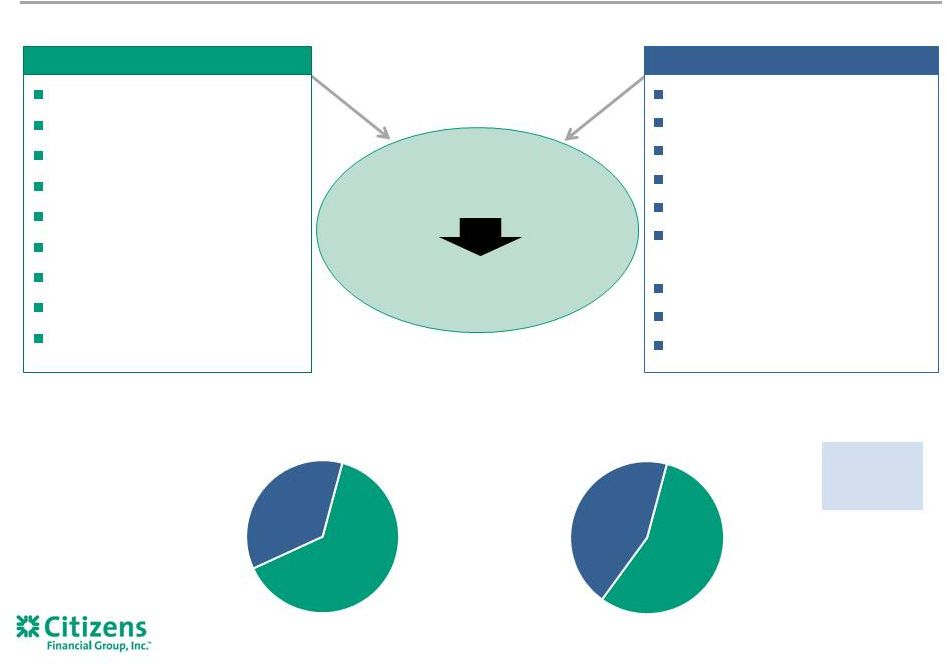 Corporate
banking Commercial real estate
Franchise finance
Asset finance
PE/sponsor finance
Healthcare/technology/not
for profit verticals
Capital markets
Treasury solutions
Commercial deposit services
Retail deposit services
Mobile/online banking
Credit/debit card
Wealth management
Home equity loans/lines
Mortgage
Auto
Education finance
Business banking
Consumer
Commercial
Targeting
50/50
Mix
Robust product offerings and balanced business mix
Deep client
relationships
+
Drive cross-sell and
wallet share
Extensive
product set
Period-end loans and leases
(1)
$87 billion 3Q14
$74 billion 2009
3
64%
36%
Commercial
Consumer
56%
44%
Commercial
Consumer
1) Reflects loans and leases and loans and leases held for sale in
our operating segments (Consumer and Commercial Banking). Excludes loans held in Other,
principally Non-core loans. |
 Well
capitalized
with
a
Tier
1
common
equity
ratio
of
12.6%
(1)
;
pro
forma
common
equity
Tier
1
ratio of 12.2%
(1)
on a fully phased-in Basel III basis
Solid asset quality performance with net charge-offs of 37 bps YTD 3Q14; core net
charge-offs of 30 bps YTD 3Q14
Strong
deposit
franchise
with
$81.9
billion
of
core
deposits
(2)
,
or
88%
of
total
period-end
deposits,
and a total deposit cost of 18 bps
Internal plan in place to address Fed’s CCAR standards
Strong, clean balance sheet funded with low-cost deposits
4
1)
3Q14 data. Pro forma for 14.3 million shares repurchased for $334 million on October 8,
2014. 2)
Core deposits defined as deposits, excluding term deposits.
3)
Peer banks include BB&T (BBT), Comerica (CMA), Fifth Third (FITB), KeyCorp (KEY), M&T
(MTB), PNC (PNC), Regions (RF), SunTrust (STI), and US Bancorp (USB). 4)
Non-core peer charge-offs reflects data from quarterly filings where non-core
data disclosed (PNC, BBT, KEY). 3Q14 period-end
Tier 1 common equity ratio
3Q14 average
cost of deposits
YTD 3Q14 net charge-offs/
average loans and leases
(3)
(3)
(1)
0.30%
0.32%
(4)
(3)
0.37%
0.34%
CFG
Peer
Average
0.18%
0.15%
CFG
Peer
12.6%
10.5%
CFG
Peer
Average
Core
Non-Core
Source: SNL financial, Company filings
Average |
 Customers
Serve our
customers well
Colleagues
Offer fulfilling jobs
Regulators
Comply with
letter and
spirit of rules
and
regulations
Investors
Deliver
strong value
proposition
and
attractive
returns
Communities & Society
Support sustainable prosperity
Aspire to be a top-performing regional bank, delivering well for all stakeholders
Customer-centric culture
5 |
 6
Return on average tangible
common equity (“ROTCE”)
(2)
End 2016
Targets
4.2%
4.9%
6.9%
Adjusted ROTCE
(2)(3)
4.5%
5.1%
5.9%
Return on average total tangible
assets
(2)
0.4%
0.6%
0.7%
1.0%+
Adjusted efficiency ratio
(2)(3)
66%
69%
69%
~60%
Tier 1 common equity ratio
13.3%
13.5%
12.9%
~11%
10%+
Key Indicators
2011
2013
(1)
YTD 2014
Embarked on a plan to improve financial results
1)
2013 excludes $4.4 billion pre-tax ($4.1 billion after-tax) goodwill impairment
charge. See appendix pages 29-31 for a reconciliation of non-GAAP items.
2)
See appendix pages 29-31 for a reconciliation of non-GAAP items.
3)
Excludes restructuring charges and special items.
6
Future target
12%+
Goal is to deliver a 10%+ run-rate ROTCE by end of 2016
10%+ |
 7
Offer our customers a differentiated customer experience through the quality of our
colleagues, products and services
–
Foster a culture around customer-centricity, commitment to excellence, leadership,
teamwork and integrity
Build a great brand that invokes trust from our customers and reinforces our value
proposition –
Consumer: Simple. Clear. Personal.
–
Commercial: Thought Leadership
Strive to deliver attractive risk-adjusted returns by making good
capital and resource allocation decisions, being good stewards of our resources, and
rigorously evaluating our execution Operate with a strong balance sheet with
regards to capital, liquidity and funding, and with a well- defined and prudent risk
appetite Maintain a balanced business mix between commercial banking and consumer
banking Position
the
bank
as
a
‘community
leader’
that
makes
a
positive
impact
on
the
communities
and
local economies we serve
Our vision and strategy
Our objective is to be a top-performing bank that delivers well for our stakeholders
Our vision is to deliver the best possible banking experience
7
Our strategy to achieve this is to: |
 8
Position Consumer Banking to deliver improved capabilities and profitability
Reenergize household growth and deepen relationships through cross-sell
Scale up growth in consumer asset businesses
Move towards smaller branch formats with fewer but more productive bankers and
enhanced on-line and mobile functionality
Continue our momentum in Commercial Banking
Equip our bankers to drive thought leadership and differentiate our customer experience
Deepen customer relationships with a focus on capital markets and treasury solutions
Grow
our
balance
sheet
to
build
scale
while
maintaining
a
strong
capital
position
Focus on growing a cost-effective, sustainable deposit base in support of
business loan growth
Tightly
manage
expense
base
while
funding
technology,
colleague,
and
regulatory
needs
and
maintaining sufficient investment in our infrastructure
Embed
risk
management
throughout
the
organization
and
build
strong
relationships
with regulators
Develop
a
high-performing,
customer-centric
organization
and
culture
Live our values every day
Empowerment with accountability
Our strategy results in six priorities
1
2
3
4
5
6
8 |
 Year over year
progress on strategic priorities 9
Improved
Consumer Bank
Continued
Commercial
Momentum
Balance Sheet
Growth /
Capital Mix
Normalization
Added 33 origination officers since 3Q13
Extended franchise finance capabilities into new food concepts
and convenience store segments
Acquiring select energy-sector assets and talent from RBS
Balance
sheet
growth
of
$11.3
billion
since
3Q13
Reinvigorating deposit growth; already LCR compliant
Executed $1.0 billion of capital actions in 2014
Leveraging
Capabilities in Auto
and Education
Finance
Introduced new One Deposit Product; investing in advertising
and marketing
Net checking account growth of over 80,000 YTD 3Q14
Expanding Sales
Force
Reenergizing
Household Growth
On track to add over 60 mortgage officers and reach a total of
~450 wealth managers by YE 2014
Business banking 3Q14 loan originations up 23% over PY
Auto originations/flow purchases up 112% from 3Q13 with
average FICO score of 750 in 3Q14
Student loan originations up 61% from 3Q13
including $38 million in
3Q14 new refinance product originations Growing
MidCorporate/
Specialty Verticals &
Franchise Finance
Strengthening Fee
Income Capabilities
Moved to #5 middle-market book runner ranking
Intensified treasury services focus with new products and
leadership
Improved Alignment
with Peers
1
2
3
Priorities
Proof Points
Initiatives |
 Priorities
Progress on strategic priorities
10
Enhanced
Efficiency &
Infrastructure
Embed Robust
Risk /
Regulatory
Framework
High-
Performing,
Customer-
Centric Culture
Established enterprise-wide capital planning & management
program with significant augmentation in resources
Strengthening our operating model and risk management
framework to address supervisory feedback
Ahead
of
schedule
on
separation
from
RBS
–
completed
largest
traditional
bank
IPO
–
solid
first
quarter
as
a
public
company
Maintaining
strong
customer-centric
culture
–
JD
Power
score
of
770
(1)
in Consumer, and in Commercial overall lead client
satisfaction
now
89%
(2)
Enhanced leadership, recruiting, and talent management
Continued commitment to volunteerism/financial contributions
Optimizing
Footprint/Branch
Delivery Model
Efficiency initiatives on track to achieve 25% of 2016 $200 million
targeted cost saves by YE 2014
Since 3Q13 -
upgraded or enhanced branch teller platform, ATM
network, call center system, auto loan platform, online and mobile
banking offerings, treasury services platform
Completed
Chicago
Divestiture
-
helping
to
fund
continued
investment in our businesses
Consolidated 36 branches since 3Q13; universal banker branch
penetration rate of 47% vs. 37% in 3Q13
Enhancing CCAR
and Regulatory
Framework
Driving Risk
Awareness and
Accountability
Enhancing our culture to embrace well-defined and prudent
approach to managing credit, operational and reputational risk
Repositioning
Organization for
Success
1)
J.D. Power and Associates score for New England; score based on a split year basis (i.e. ,
2014 score is based on measurement from half of 2013). 2)
Satisfaction based on Greenwich Associates Market Tracking Program (Citizens
–footprints, $25-$500 million, 3Q14 rolling four-quarter data).
4
5
6
Proof Points
Initiatives
Achieving Cost
Saves to Fund
Investments |
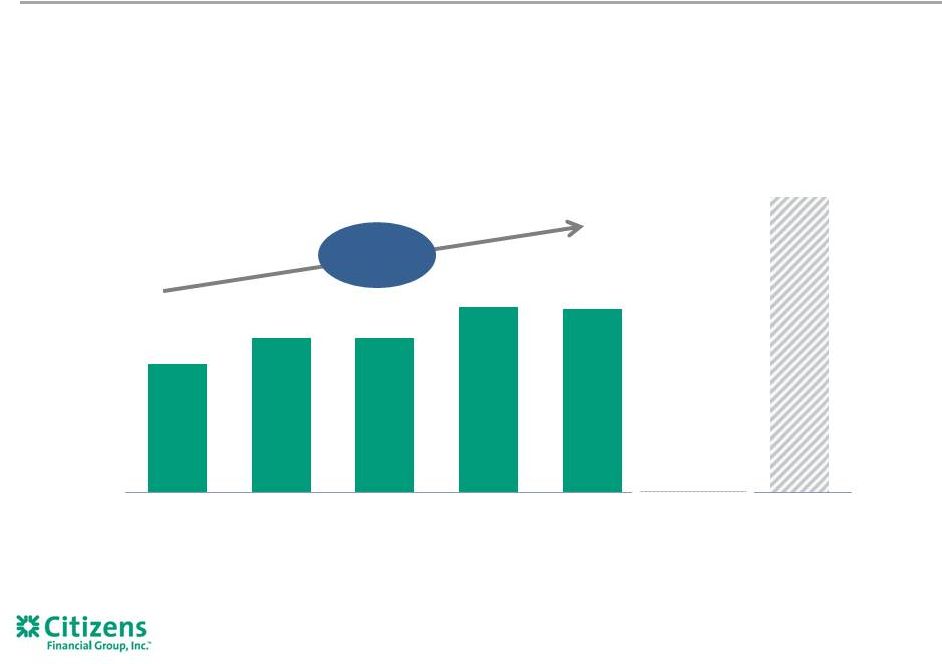 11
+188
bps
ROTCE is trending in line with plan
Adjusted ROTCE
(1)
4.34%
5.24%
5.24%
6.28%
6.22%
Target
10% +
3Q13
4Q13
1Q14
2Q14
3Q14
End 2016
1) Excluding restructuring charges and special items. See appendix
pages 29-31 for a reconciliation of non-GAAP items. |
 Asset-sensitive position relative to peers
12
Delivering loan growth
(1)
1)
Peer banks include BB&T, Comerica, Fifth Third, KeyCorp, M&T, PNC, Regions, SunTrust,
and US Bancorp. Note: peer estimate based on public disclosures; 200 2)
Quarterly results in each period prior to 3Q14 have been adjusted to exclude $13 million in
Net interest income associated with the estimated Chicago Divestiture impact.
Growing
the
balance
sheet
again
–
well
positioned
for
rising
rates
NII growing with NIM broadly stable
Net interest income
$s in billions
Average earning assets
$s in millions
excluding estimated
Chicago Divestiture impact
(2)
(2)
(2)
(2)
6.3%
3.7%
CFG
Peer Median
$757
$766
$795
$820
bps gradual impact inferred for certain peers based on available information. Data as of
September 30, 2014. Net interest income
Net interest income,
$105.9
$109.0
$112.5
$116.0
$117.2
3Q13
4Q13
1Q14
2Q14
3Q14
$770
$779
$808
$833
$820
3Q13
4Q13
1Q14
2Q14
3Q14 |
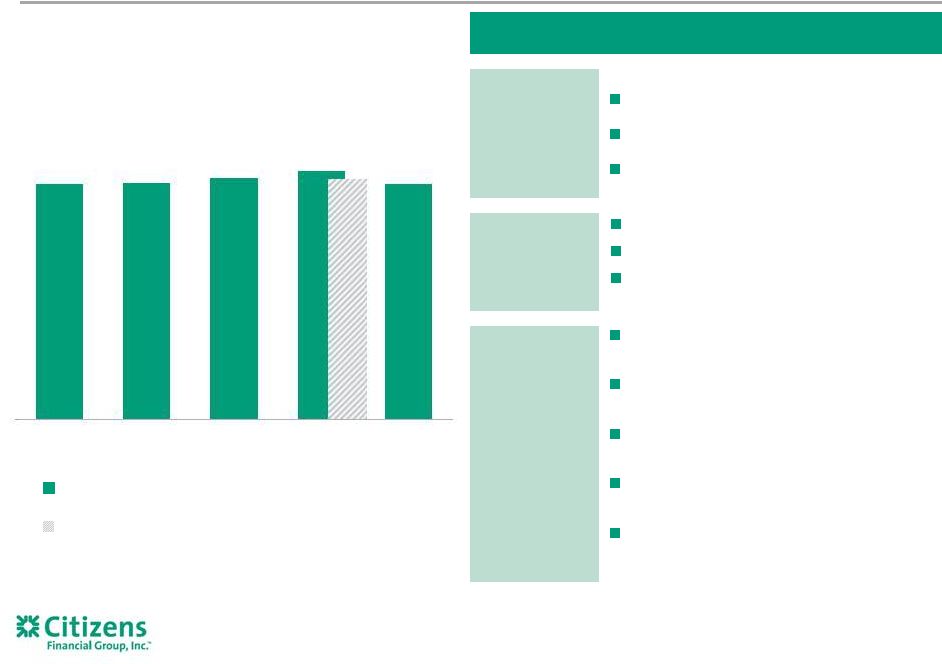
 Adjusted
noninterest income relatively stable, with recent underlying growth (1)
1)
2)
13
Adjusted noninterest income
$s in millions
$310
$301
$310
$301
$283
5% CAGR
since 3Q13 in
capital markets
fees, trust and
investment
services fees,
and mortgage
banking fees
(1)
$383
$379
$358
$352
$341
3Q13
4Q13
1Q14
2Q14
3Q14
Service
charges
and
fees,
excluding
Chicago
Divestiture
fees
(2)
Card
fees,
excluding
Chicago
Divestiture
fees
(2)
Foreign exchange and trade finance fees
Capital markets fees
Mortgage banking fees
Trust
and
investment
services
fees,
excluding
Chicago
Divestiture
fees
(2)
Securities
gains,
other
income,
and
estimated
Chicago
Divestiture
fees
(2)
Quarterly results in each period prior to 3Q14 have been adjusted to exclude $6 million in
service charges and fees, $3 million in card fees, $2 million in trust and investment
services fees and $1 million of Other fee income associated with the estimated Chicago Divestiture impact. These amounts have been included in
Securities gains , other Income, and estimated Chicago Divestiture fees category which also
includes bank-owned life insurance income. 2Q14 noninterest income of $352 million excludes $288 million Chicago Divestiture gain on
sale. See appendix pages 29-31 for a reconciliation of non-GAAP items.
|
 Discipline on
expenses is funding investments to drive growth 1)
Non-GAAP item. Adjusted results exclude the effect of net restructuring charges and
special items associated with Chicago Divestiture, efficiency and effectiveness
programs and separation from RBS. See important information on use of Non-GAAP items on
pages 29-31. Excludes restructuring charges and special items of: salaries and
benefits of $43 million in 2Q14 and $5 million in 4Q13; outside services of $19 million in 3Q14 and $41 million in 2Q14; occupancy of $2 million in 3Q14,
$9 million in 2Q14, and $11 million in 4Q13; equipment of $3 million in 2Q14 and $7 million
in 4Q13; and other expense of $19 million in 2Q14 and $3 million in 4Q13. 2)
Excludes estimated impact of Chicago Divestiture.
14
$s in millions
Adjusted noninterest expense
(1)
(1)
(1)
(1)
$200 million targeted cost savings by end 2016
(2)
Salaries and
employee
benefits
~$120
million
Other
~$60 million
Occupancy
~$20 million
Expand technology outsourcing model by
consolidating vendors/increasing scope
Consolidate and migrate IT application
portfolio to single sourcing partner
Strengthen competitive sourcing on
consulting engagements
Streamline internal travel and enhance
A/V facilities
Enhance loss collection by improving
segmentation of customers
Further optimize branch network
Exit surplus office space
Redevelop underutilized owned-branch
real estate
Align employee benefits to market
Organizational redesign
Reduction in FTEs
Noninterest expense
Noninterest expense, excluding estimated
Impact of Chicago Divestiture
$788
$792
$810
$833
$789
3Q13
4Q13
1Q14
2Q14
3Q14
$812
(2) |
 3Q14 net
charge-offs of 0.38% of average loans and leases with core portfolio charge-offs of
0.31%
Allowance coverage of NPLs of 111%, up from 72% in 3Q13
NPLs to total loans and leases down 79 bps to 1.19% from 1.98% in 3Q13
Provision for credit losses, charge-offs, NPLs
Allowance for loan and lease losses
1) Allowance for loan and lease losses to nonperforming loans and leases.
(1)
for credit
losses
15
Credit quality continues to improve
$s in millions
$s in millions
$1,219
$1,221
$1,259
$1,210
$1,201
72%
86%
92%
101%
111%
3Q13
4Q13
1Q14
2Q14
3Q14
Allowance for loan and lease losses
NPL coverage ratio
$131
$115
$87
$68
$88
$145
$132
$121
$49
$77
$1.7B
$1.4B
$1.4B
$1.2B
$1.1B
3Q13
4Q13
1Q14
2Q14
3Q14
Net charge-offs
Provision
NPLs |
 Adjusting capital
structure towards peers 1)
Data as of 3Q14
2)
Pro forma for 14.3 million shares repurchased for $334 million on October 8, 2014.
Progress against capital plan:
–
$333 million capital exchange transaction
on 8/1/14
–
$334 million sub-debt issuance and 14.3
million share repurchase on 10/8/14
3Q14 Tier 1 common equity ratio of 12.9%,
down 34 basis points from 2Q14
–
Targeting ~11% Basel III CET1 Ratio by end
of 2016
16
Tier 1 common equity ratio
(1)
(2)
9.6%
9.6%
9.7%
9.8%
10.5%
10.5%
10.7%
11.1%
11.3%
11.8%
12.6%
SunTrust
Fifth Third
U.S. Bancorp
M&T
Peer Average
BB&T
Comerica
PNC
KeyCorp
Regions
Citizens
Source: SNL Financial |
 Building blocks
are in place to drive enhanced performance 13
th
largest
U.S.
retail
bank
holding
company
with
attractive
demographics
in core markets
Attractive business mix with growing and profitable commercial business
complementing strong consumer business
Client-centric model focused on deepening customer relationships
Attractive,
client-centric
franchise with
scale
Intense focus on strategic priorities driving attractive growth with improving
asset mix and returns
Committed to driving enhanced efficiency and effectiveness
Prudently optimizing capital structure and risk profile to help drive improved
risk-adjusted returns
Peer-leading capital ratios
Stable, low-cost deposit base
Solid asset quality through credit cycles
Strong, clean
balance sheet
supports
growth plans
Expected path
to double-digit
ROTCE
17 |
 18
Q&A |
 |
 Appendix
|
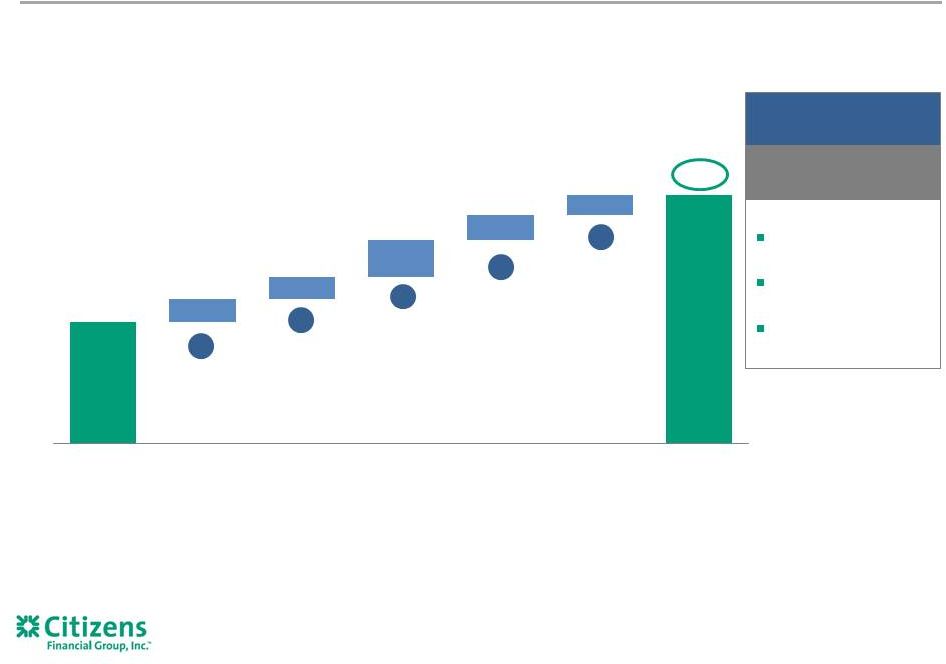 Expected path to
improving ROTCE 21
4Q16 ROTCE targeted to be in excess of 10%
Not shown in the above are the following offsetting items: runoff of legacy non-core
business and runoff of legacy-fixed rate swaps, which are offset by normalization
of credit provision and securities gains 0.8 –
1.0%
0.7 –
0.8%
0.9 –
1.0%
1.3 –
1.6%
0.8 –
1.0%
10%+
5%
A
B
C
D
E
Potential upside from
further normalization
Momentum carries
forward beyond 2016
Full Impact of:
1)
Subject to regulatory approval.
2)
Potential upside from further normalization assumes Fed Funds rate of 3%.
3)
Excludes $4.4 billion pre-tax ($4.1 billion after-tax) goodwill impairment
charge. See appendix pages 29-31 for a reconciliation of non-GAAP items.
(3)
2013
Earning asset
growth & NII
expansion
Fee income
growth
Yield curve
benefit
Cost saving
actions
Planned capital
actions
4Q16
Targeted
Capital
normalization
(1)
Rate normalization
(2)
(+100 to +150 bps)
Non-core runoff
(+15 to +20 bps) |
 Progress on ROTCE
improvement plan 22
Commercial loans up 7% annualized from year end 2013, driven by growth in
mid-corporate, franchise finance, technology, and business capital
Retail loans up 8% annualized from year end 2013, driven by growth in auto and mortgage
3Q14 NII up 7% annualized from 4Q13, driven by 10% annualized increase in average
interest earning assets
Yield Curve
Benefit
Fee Income
Growth
Earning Asset
Growth & NII
Expansion
1
2
3
Cost Saving
Actions
Planned Capital
Actions
4
5
Underlying momentum in service charges/fees masked by impact of posting order changes and
Chicago Divestiture
Mortgage banking relatively weaker despite improving origination
trends
Gaining traction in capital markets, foreign exchange and trade finance
6.3% modeled benefit to NII assuming 200 basis point gradual ramp in rates at September 30
Estimate
~85% of interest rate sensitivity is concentrated at the short end of the curve
Expense initiatives are tracking to all implementation dates
Expect to have 25% of 2016 $200 million targeted program goal in
run rate by end 2014
2014 capital realignment plan completed as of October 8
with 14.3 million share repurchase
Capital mix now 78% CET1/22% capital securities vs. goal of 70%/30%
Highlights
Adjusted ROTCE up 188 basis points since 3Q13
(1)
1)
Non-GAAP item. Adjusted results exclude the effect of net restructuring charges and
special items associated with Chicago Divestiture, efficiency and effectiveness
programs and separation from RBS. See pages 29-31 for a reconciliation of Non-GAAP items.
th
th |
 Delivered solid
3Q14 adjusted financials (1)
1)
Non-GAAP item. Adjusted results exclude the effect of net restructuring charges and
special items associated with Chicago Divestiture, efficiency and effectiveness
programs and separation from RBS. See pages 29-31 for a reconciliation of Non-GAAP items.
2)
Includes held for sale.
3)
Return on average tangible common equity.
4)
Return on average total tangible assets.
5)
Full-time equivalent employees.
Linked quarter:
Adjusted net income down $3 million largely
driven by effect of unusually low 2Q14
provision expense
Adjusted pre-provision profit up 6%
Adjusted revenue down $24 million driven
by an estimated $25 million related to
Chicago Divestiture
Adjusted NII stable excluding the impact
of the Chicago Divestiture
Adjusted noninterest income down $11
million driven by effect of Chicago
Divestiture and 2Q14 loan sale gain
Adjusted noninterest expense down $44
million, driven by an estimated $21 million
from the Chicago Divestiture as well as
lower regulatory costs and incentives
expense
Adjusted efficiency ratio improved 221 bps
Prior Year Quarter:
Adjusted net income up $58 million reflecting
positive operating leverage and a $68 million
reduction in provision expense
Highlights
23
3Q14 change from
$s in millions
3Q14
2Q14
3Q13
2Q14
3Q13
$
%
$
%
Net interest income
820
$
833
$
770
$
(13)
$
(2) %
50
$
6 %
Adjusted noninterest income
1
341
352
383
(11)
(3) %
(42)
(11) %
Adjusted total revenue
1
1,161
1,185
1,153
(24)
(2) %
8
1 %
Adjusted noninterest expense
1
789
833
788
(44)
(5) %
1
—
%
Adjusted pre-provision profit
1
372
352
365
20
6 %
7
2 %
Provision for credit losses
77
49
145
28
57 %
(68)
(47) %
Adjusted pretax income
1
295
303
220
(8)
(3) %
75
34 %
Adjusted income tax expense
1
93
98
76
(5)
(5) %
17
22 %
Adjusted net income
1
202
$
205
$
144
$
(3)
$
(1) %
58
$
40 %
$s in billions
Average interest earning assets
117
$
116
$
106
$
1
$
1 %
11
$
11 %
Average deposits
2
92
92
93
(0)
(1) %
(1)
(2) %
Key metrics
Net interest margin
2.77
%
2.87
%
2.88
%
(10)
bps
(11)
bps
Loan-to-deposit ratio (period-end)
2
97.32
%
97.20
%
91.34
%
12
bps
598
bps
Adjusted ROTCE
1,3
6.22
%
6.28
%
4.34
%
(6)
bps
188
bps
Adjusted ROTA
1,4
0.66
%
0.68
%
0.52
%
(2)
bps
14
bps
Adjusted efficiency ratio
1
68
%
70
%
68
%
(221)
bps
(47)
bps
FTEs
5
17,852
18,049
18,961
(197)
(1) %
(1,109)
(6) %
Per common share
Adjusted diluted EPS
1
0.36
$
0.37
$
0.26
$
(0.01)
$
(3) %
0.10
$
38 %
Tangible book value
23.04
$
23.39
$
22.97
$
(0.35)
$
(1) %
0.07
$
—
%
Average diluted shares outstanding
(in millions)
560.2
560.0
560.0
0.2
—
%
0.2
—
%
–
– |
 24
Bruce Van Saun
Chairman and
Chief Executive Officer
30 Years in Banking
Strong and experienced leadership team
Brad Conner
Vice Chairman-
Consumer
Banking
26 Years
Robert Matthews
Vice Chairman-
Commercial Banking
26 Years
John Fawcett
Chief Financial
Officer
26 Years
Robert Nelson
Chief Compliance
Officer
27 Years
David Bowerman
Vice Chairman-
Business Services
26 Years
Nancy Shanik
Group EVP-
Chief Risk Officer
36 Years
Michael Cleary
Group EVP-
Consumer
Distribution
14 Years
Stephen Gannon
Chief Legal Officer
36 Years
Brian O’Connell
Regional Director-
Technology Services
27 Years
Beth Johnson
Corporate
Strategy
15 Years
Susan LaMonica
Director of HR
21 Years
24
Executive committee with an average of over 24 years of banking experience
|
 Board
Member Title and Company
Year Joined
Committees
Bruce Van Saun
Chairman and Chief Executive Officer
Citizens Financial Group, Inc. and Head of RBS Americas
2013
Chairman of the Board
Chair of Executive Committee
Arthur F. Ryan
Former Chairman, Chief Executive Officer & President
Prudential Financial Inc.
2009
Lead Director
Chair of Compensation and Human Resources Committee
Member of Nominating and Corporate Governance Committee;
Executive Committee
Mark Casady
Chairman & Chief Executive Officer
LPL Financial Holdings Inc.
2014
Member of Risk Committee
Anthony Di Iorio
Former Chief Financial Officer
Deutsche Bank A.G.
2014
Member of Audit Committee; Nominating and Corporate
Governance Committee
Robert Gillespie
Director, The Royal Bank of Scotland Group plc
2014
Member of Executive Committee
William P. Hankowsky
Chairman, President & Chief Executive Officer
Liberty Property Trust
2006
Member of Audit Committee; Compensation and Human
Resources Committee
Howard W. Hanna III
Chairman & Chief Executive Officer
Howard Hanna Real Estate Services
2009
Member of Audit Committee; Nominating and Corporate
Governance Committee
Leo I. Higdon
Former Vice Chairman Solomon
Brothers
Past President of Connecticut College
2014
Member Audit Committee; Compensation and Human Resources
Committee
Charles J. (“Bud”) Koch
Former Chairman, President & Chief Executive Officer
Charter One Bank
2004
Chair of Risk Committee
Member of Audit Committee
Robert D. Matthews, Jr.
Vice Chairman, Commercial Banking
Citizens Financial Group, Inc.
2009
Shivan S. Subramaniam
Chairman & Chief Executive Officer
FM Global
2005
Chair of Nominating and Corporate Governance Committee
Member of Risk Committee; Executive Committee
Wendy A. Watson
Former Executive Vice President, Global Services
State Street Bank & Trust Company
2010
Chair of Audit Committee
Member of Risk Committee; Compensation and Human Resources
Committee
Marita Zuraitis
Director, President & CEO
The Horace Mann Companies
2011
Member of Risk Committee
Well respected and accomplished Board of Directors
25 |
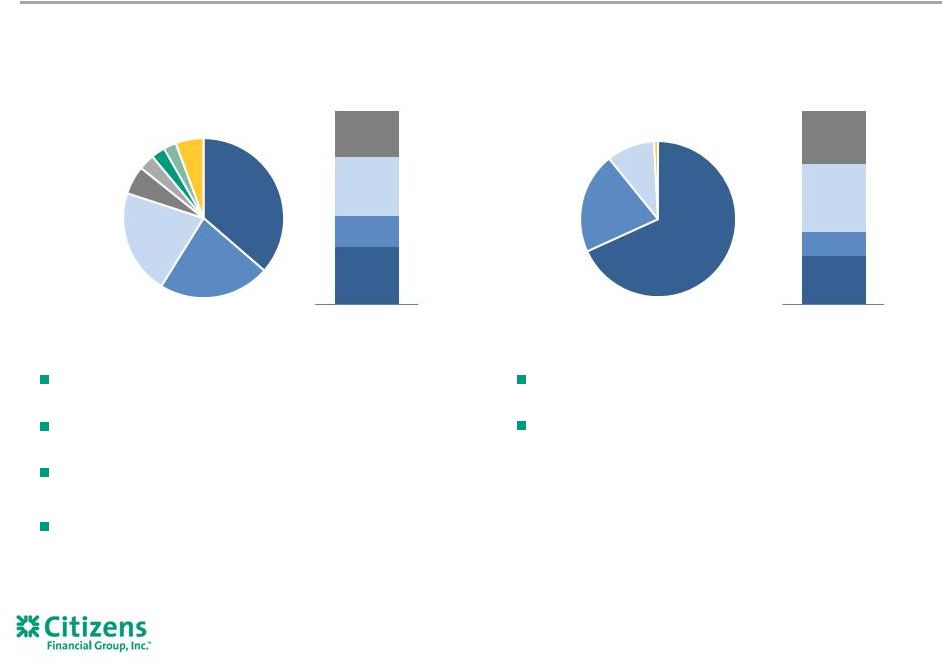 Diversified and
granular loan mix $52.2 billion
3Q14
Consumer
Banking
segment
portfolio
(1)
1)
Includes loans and leases (other than loans held for sale) from our Other portfolio allocated
by product class according to our risk management system. 2)
Includes owner-occupied commercial real estate.
$38.5 billion
3Q14
Commercial
Banking
segment
portfolio
(1)
Other
Mid-
Atlantic
Midwest
New England
30%
16%
(2)
Home Equity –
average FICO of 763 and average loan-to-
value of 66% on the Core portfolio
Mortgage –
average FICO of 762 and 65% average loan-to-
value on the Core portfolio
Auto Finance –
finance for purchase only, no leasing
–
6,687 dealers across 43 states; average FICO of 752
Student Lending –
94% of Trufit loans co-signed with average
portfolio FICO of 774
Within Citizens footprint focused on Middle Market,
Government Banking, Not-for-Profit and Professional
National mandate for Asset Finance, Business Capital,
Commercial Real Estate, Franchise Finance, Healthcare,
Technology and MidCorporate
26
Home
equity
Indirect auto
Residential
mortgage
Business banking
Education finance
Credit cards
Other
30%
24%
Non-core
Leases
C&I
CRE
Other
Mid-
Atlantic
Midwest
New England
25%
13%
35%
27%
Non-core
36%
22%
21%
6%
3%
3%
3%
6%
3Q14
68%
21%
10%
1%
3Q14 |
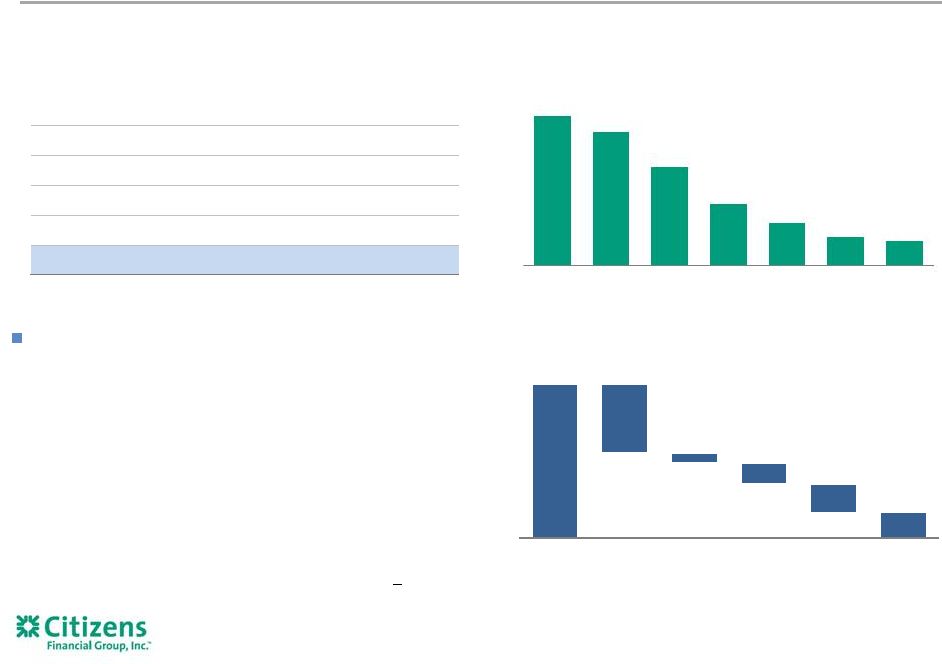 Non-core
portfolio significantly reduced Serviced by others home equity portfolio
(1)
$1.9
Other consumer real estate
0.6
Student lending
0.4
Commercial real estate
0.3
Commercial loans
0.1
Non-Core
$3.3
$20.5 billion of assets identified as Non-Core in June 2009
–
Balance has declined 43% from start of 2013
–
~4% of total loan and lease portfolio
–
57% related to out-of-footprint home equity Serviced By
Others (“SBO”) portfolio
–
69% home equity loans and 31% HELOC
–
SBO portfolio accounted for 2% of total loans as of
3Q14, but contributed over 14% of YTD charge-offs
–
Over
60%
of
SBO
loans
have
a
FICO
score
>
700
Non-core end of period assets
$s in billions as of 3Q14
Non-core end of period assets
$s in billions
Drivers of non-core asset reduction
$s in billions
Note: Data above was sourced from CFG’s risk systems and may not reconcile with other
disclosures due to differences in accounting methodology or the way the information is
captured. 1)
Portion of portfolio now serviced by Citizens.
$20.5
$3.3
$9.3
$1.3
$2.8
$3.8
Jun-09
Pay downs
Sales
Transfers to
Core
Net
Charge-offs
3Q14
27
$20.5
$18.3
$13.5
$8.4
$5.7
$3.8
$3.3
Jun-09
2009
2010
2011
2012
2013
3Q14 |
 Loan-to-value
FICO
Lien position
Lien position
FICO
Loan-to-value
<649
650-699
700-749
750-799
800+
<70%
90-100%
600-649
650-699
700-749
750-799
800+
<600
100%+
80-89%
71-79%
<70%
2nd
1st
2nd
1st
71-79%
80-89%
3Q14 home equity originations of $1.1 billion
HELOC originations had a weighted-average
FICO score of 788, and a weighted-average
CLTV of 64%
Between October 2014 –
December 2017 $5.0
billion of the HELOC portfolio is at risk for
payment shock
83% of the payment shock population has a
FICO score greater than 740 or an LTV of
80% or lower
3Q14 YTD performance is strong, 95%
current or refinanced/paid off, 4% past due
and 1% charged off
3Q14 $15.5 billion HELOC
3Q14 $3.9 billion HELOAN
Core home equity portfolio
(1)
28
1)
Excludes serviced by other portfolio.
Highlights
100%+
90-100% |
 Non-GAAP
financial measures 29
This document contains non-GAAP financial measures. The table below presents
reconciliations of certain non-GAAP measures to the most directly comparable measures.
These Non-GAAP measures exclude discontinued operations, goodwill impairment,
restructuring charges and/or special items, which are usually included, where applicable, in
the financial results presented in accordance with GAAP. Special items include regulatory
expenses, and expenses relating to our initial public offering and other expenses or
income. All references to “Adjusted” results are Non-GAAP financial measures.
These measures exclude restructuring charges and special items.
The non-GAAP measures set forth below include “noninterest income”, “net
interest income”, “total revenue”, “noninterest expense”, “net income (loss)”, “income tax expense
(benefit)”, “service charges and fees”, “card fees”, “trust
& investment services fees”, and “securities gains, other income, and estimated Chicago Divestiture fees”. In addition,
we present computations for “return on average tangible common equity”, “return
on average total tangible assets” and “efficiency ratio” as part of our non-GAAP measures.
We believe these non-GAAP measures provide useful information to investors because these
are among the measures used by our management team to evaluate our operating
performance and make day-to-day operating decisions. In addition, we believe goodwill impairment, restructuring charges and special items in any period do not
reflect the operational performance of the business in that period and, accordingly, it is
useful to consider these line items with and without goodwill impairment, restructuring
charges and special items. We believe this presentation also increases comparability of period-to-period results.
We also consider pro forma capital ratios defined by banking regulators but not effective at
each period end to be non-GAAP financial measures. Since analysts and banking
regulators may assess our capital adequacy using these pro forma ratios, we believe they are
useful to provide investors the ability to assess our capital adequacy on the same
basis.
Other companies may use similarly titled non-GAAP financial measures that are calculated
differently from the way we calculate such measures. Accordingly, our non-GAAP
financial measures may not be comparable to similar measures used by other companies. We
caution investors not to place undue reliance on such non-GAAP measures, but
instead to consider them with the most directly comparable GAAP measure. Non-GAAP
financial measures have limitations as analytical tools, and should not be considered in
isolation, or as a substitute for our results as reported under GAAP. |
 30
Non-GAAP reconciliation table
$s in millions, except per share data
2011
2013
YTD 2014
Noninterest income, excluding special items:
Noninterest income (GAAP)
A
$1,711
$1,632
$1,339
Less: Special items
-
-
288
Noninterest income, excluding special items (non-GAAP)
B
$1,711
$1,632
$1,051
Total revenue, excluding special items:
Total revenue (GAAP)
C
$5,031
$4,690
$3,800
Less: Special items
-
-
288
Total revenue, excluding special items (non-GAAP)
D
$5,031
$4,690
$3,512
Noninterest expense, excluding restructuring charges and special items:
Noninterest expense (GAAP)
E
$3,371
$7,679
$2,568
Less: Restructuring charges and special expense items
HH
65
4,461
136
Noninterest expense, excluding restructuring charges and special items (non-GAAP)
F
$3,306
$3,218
$2,432
Noninterest expense, excluding goodwill impairment
Noninterest expense (GAAP)
E
$3,371
$7,679
$2,568
Less: Goodwill impairment (GAAP)
-
4,435
-
Noninterest expense, excluding goodwill impairment (non-GAAP)
N
$3,371
$3,244
$2,568
Net income (loss), excluding goodwill impairment
Net income (loss) (GAAP)
G
$506
($3,426)
$668
Add: Goodwill impairment, net of income tax benefit (GAAP)
-
4,080
-
Net income (loss), excluding goodwill impairment (non-GAAP)
M
$506
$654
$668
Net income (loss), excluding restructuring charges and special items:
Net income (loss) (GAAP)
G
$506
($3,426)
$668
Add: Restructuring charges and special items, net of income tax expense (benefit)
42
4,097
(95)
Net income (loss), excluding restructuring charges and special items (non-GAAP)
H
$548
$671
$573
Return on average tangible common equity excluding goodwill impairment; return on average
tangible common equity excluding goodwill impairment, restructuring charges and special
items: Average common equity (GAAP)
I
$23,137
$21,834
$19,463
Less: Average goodwill (GAAP)
11,311
9,063
6,876
Less: Average other intangibles (GAAP)
15
9
7
Add: Average deferred tax liabilities related to goodwill (GAAP)
295
459
368
Average tangible common equity (non-GAAP)
J
$12,106
$13,221
$12,948
Return on average tangible common equity (non-GAAP)
G/J
4.2%
-25.9%
6.9%
Return on average tangible common equity excluding goodwill impairment (non-GAAP)
M/J
4.2%
4.9%
6.9%
Return on average tangible common equity, excluding goodwill impairment, restructuring charges
and special items (non-GAAP)
H/J
4.5%
5.1%
5.9%
Return on average total tangible assets excluding goodwill impairment
Average total assets (GAAP)
K
$128,344
$120,866
$126,598
Less: Average goodwill (GAAP)
11,311
9,063
6,876
Less: Average other intangibles (GAAP)
15
9
7
Add: Average deferred tax liabilities related to goodwill (GAAP)
295
459
368
Average tangible assets (non-GAAP)
L
$117,313
$112,253
$120,083
Return on average total tangible assets excluding goodwill impairment (non-GAAP)
M/L
0.4%
0.6%
0.7%
Efficiency ratio excluding goodwill impairment; efficiency ratio excluding goodwill impairment,
restructuring charges and special items:
Net interest income (GAAP)
$3,320
$3,058
$2,461
Add: Noninterest income (GAAP)
1,711
1,632
1,339
Total revenue (GAAP)
P
$5,031
$4,690
$3,800
Efficiency ratio
E/P
67%
164%
68%
Efficiency ratio, excluding goodwill impairment, restructuring charges and special items
(non-GAAP) F/D
66%
69%
69% |
 31
Non-GAAP reconciliation table
$s in millions, except per share data
3Q13
4Q13
1Q14
2Q14
3Q14
Net interest income, excluding estimated Chicago Divestiture impact:
Net interest income (GAAP)
$770
$779
$808
$833
$820
Less: estimated Chicago Divestiture Impact
13
13
13
13
—
Net interest income, excluding estimated Chicago Divestiture impact (non-GAAP)
$757
$766
$795
$820
$820
Noninterest income, excluding special items:
Noninterest income (GAAP)
A
$383
$640
$341
Less: Special items - Chicago gain
—
288
—
Noninterest income, excluding special items (non-GAAP)
B
$383
$352
$341
Service charges and fees, excluding estimated Chicago Divestiture fees:
Service charges and fees
$163
$152
$139
$147
$144
Less: estimated Chicago Divestiture fees
6
6
6
6
—
Service charges and fees, excluding estimated Chicago Divestiture fees (non-GAAP)
$157
$146
$133
$141
$144
Card fees, excluding estimated Chicago Divestiture fees:
Card fees
$63
$58
$56
$61
$58
Less: estimated Chicago Divestiture fees
3
3
3
3
—
Card fees, excluding estimated Chicago Divestiture fees (non-GAAP)
$60
$55
$53
$58
$58
Trust and investment services fees, excluding estimated Chicago Divestiture fees:
Trust and investment services fees
$39
$40
$39
$42
$39
Less: estimated Chicago Divestiture fees
2
2
2
2
—
Trust and investment services fees, excluding estimated Chicago Divestiture fees
(non-GAAP) $37
$38
$37
$40
$39
Other income, securities gains and estimated Chicago Divestiture fees:
Other income
$37
$42
$39
$40
$29
Add: securities gains
25
25
25
—
2
Add: estimated Chicago Divestiture fees
11
11
11
11
—
Other income, securities gains and estimated Chicago Divestiture fees (non-GAAP)
$73
$78
$75
$51
$31
Total revenue, excluding special items:
Total revenue (GAAP)
C
$1,153
$1,473
$1,161
Less: Special items - Chicago gain
—
288
—
Total revenue, excluding special items (non-GAAP)
D
$1,153
$1,185
$1,161
Noninterest expense, excluding restructuring charges and special items:
Noninterest expense (GAAP)
E
$788
$818
$948
$810
Less: Restructuring charges and special expense items
HH
—
26
115
21
Noninterest expense, excluding restructuring charges and special items (non-GAAP)
F
$788
$792
$833
$789
Net income (loss), excluding restructuring charges and special items:
Net income (loss) (GAAP)
G
$144
$313
$189
Add: Restructuring charges and special items, net of income tax expense (benefit)
—
(108)
13
Net income (loss), excluding restructuring charges and special items (non-GAAP)
H
$144
$205
$202
Return on average tangible common equity and return on average tangible common equity, excluding
restructuring charges and special items: Average common equity (GAAP)
I
$19,627
$19,364
$19,370
$19,607
$19,411
Less: Average goodwill (GAAP)
6,876
6,876
6,876
6,876
6,876
Less: Average other intangibles (GAAP)
9
8
7
7
6
Add: Average deferred tax liabilities related to goodwill (GAAP)
325
342
351
369
384
Average tangible common equity (non-GAAP)
J
$13,067
$12,822
$12,838
$13,093
$12,913
Return on average tangible common equity, excluding restructuring charges and special items
(non-GAAP) H/J
4.34%
5.24%
5.24%
6.28%
6.22%
Net interest income (GAAP)
$770
$833
$820
Add: Noninterest income (GAAP)
383
640
341
Total revenue (GAAP)
C
$1,153
$1,473
$1,161
Efficiency ratio, excluding restructuring charges and special items (non-GAAP)
F/D
68%
70%
68%
Total revenue, excluding restructuring charges and special items (non-GAAP)
D
$1,153
$1,185
$1,161
Less: Noninterest expense, excluding restructuring charges and special items
(non-GAAP) F
788
833
789
Pre-provision profit, excluding restructuring charges and special items (non-GAAP)
CC
$365
$352
$372
Income before income tax expense (benefit), excluding restructuring charges and special items
Income before income tax expense (benefit) (GAAP)
DD
$220
$476
$274
Less: Income before income tax expense (benefit) related to restructuring charges and special
items (GAAP) —
173
(21)
Income before income tax expense (benefit), excluding restructuring charges and special items
(non-GAAP) EE
$220
$303
$295
Income tax expense (benefit), excluding restructuring charges and special items:
Income tax expense (benefit) (GAAP)
FF
$76
$163
$85
Less: Income tax (benefit) related to restructuring charges and special items (GAAP)
—
65
(8)
Income tax expense (benefit), excluding restructuring charges and special items
(non-GAAP) GG
$76
$98
$93
Earnings per shares - diluted, excluding restructuring charges and special items
Average common shares outstanding - diluted (GAAP)
JJ
559,998,324
559,998,324
560,243,747
Earnings per shares - diluted, excluding restructuring charges and special items
(non-GAAP) H/JJ
$0.26
$0.37
$0.36
Return on average total tangible assets excluding restructuring charges and special items:
Average total assets (GAAP)
KK
$117,386
$127,148
$128,691 |
 32 |