Attached files
| file | filename |
|---|---|
| 8-K - FORM 8-K - ABM INDUSTRIES INC /DE/ | t1402423_8k.htm |
| EX-99.1 - EXHIBIT 99.1 - ABM INDUSTRIES INC /DE/ | t1402423_ex99-1.htm |
Exhibit 99.2

Cover Slide Title (20pt. Bold) Fourth Quarter 2014 Teleconference December 9, 2014

1 2 3 4 5 Agenda 2 Introduction & Overview | Henrik Slipsager, CEO Fourth Quarter 2014 Review of Financial Results | Jim Lusk, CFO Fourth Quarter 2014 Operational Review | Jim McClure, EVP, Tracy Price, EVP & Henrik Slipsager, CEO Fiscal 2015 Outlook | Henrik Slipsager, CEO Questions & Answers Forward - Looking Statements and Non - GAAP Financial Information: Our discussions during this conference call will include forward - looking statements. Actual results could differ materially from th ose projected in the forward - looking statements. The factors that could cause actual results to differ are discussed in the Company’s 2013 Annual Report on Form 10 - K and in our 2014 reports on Form 10 - Q and Form 8 - K. These reports are available on our website at http://investor.abm.com/ under “SEC Filings”. A description of factors that could cause actual results to differ is also set forth at the end of this presentation. Also, the discussion during this conference call will include certain financial measures that were not prepared in accordance wi th U.S. generally accepted accounting principles (“U.S. GAAP”). Reconciliations of those non - GAAP financial measures to the most directly comparable U.S. GAAP financial measures can be found on the Investor Relations portion of our website at http://investor.abm.com and at the end of this presentation.

Fourth Quarter 2014 Review of Financial Results

Fiscal Fourth Quarter & Fiscal Year 2014 Overview Fourth Quarter : • Achieved record revenue for the fourth quarter of $1.30 billion, up 5.0% – Select organic growth rates: ▪ Janitorial 4.6% 1 ; ▪ Building & Energy Solutions 9.0% 1 ; and ▪ Other (Air Serv) 13.4% • Operating profit up 15.2%, Adjusted operating profit up 10.0% • Net income up 15.3%, Adjusted net income up 10.0% – Items positively affecting adjusted net income comparison: ▪ Organic growth ▪ Realignment savings in the Onsite businesses – Items adversely affecting adjusted net income comparison: ▪ Fourth quarter 2013 included a benefit of $0.05 per diluted share for the Work Opportunity Tax Credit (“WOTC”) • Repurchased 387,500 shares at a cost of $10.0 million • Acquired GBM Support Services, expanding the Company’s U.K. presence • Announced 195th consecutive quarterly dividend Fiscal 2014 : • Achieved record revenue of $5.03 billion, up 4.6% • Net income of $1.32 per diluted share; Adjusted net income of $1.57 per diluted share up 3.3% – Items adversely affecting adjusted net income comparison ▪ Fiscal 2013 includes a net benefit of $0.11 from the WOTC compared to fiscal 2014 • Repurchased 765,000 shares at a cost of $20.0 million • Paid $34.6 million in dividends • Acquired 3 companies at a cost of approximately $48.0 million, net of cash 4 1 Excludes revenue from acquisition of GBM Support Services and Airco.
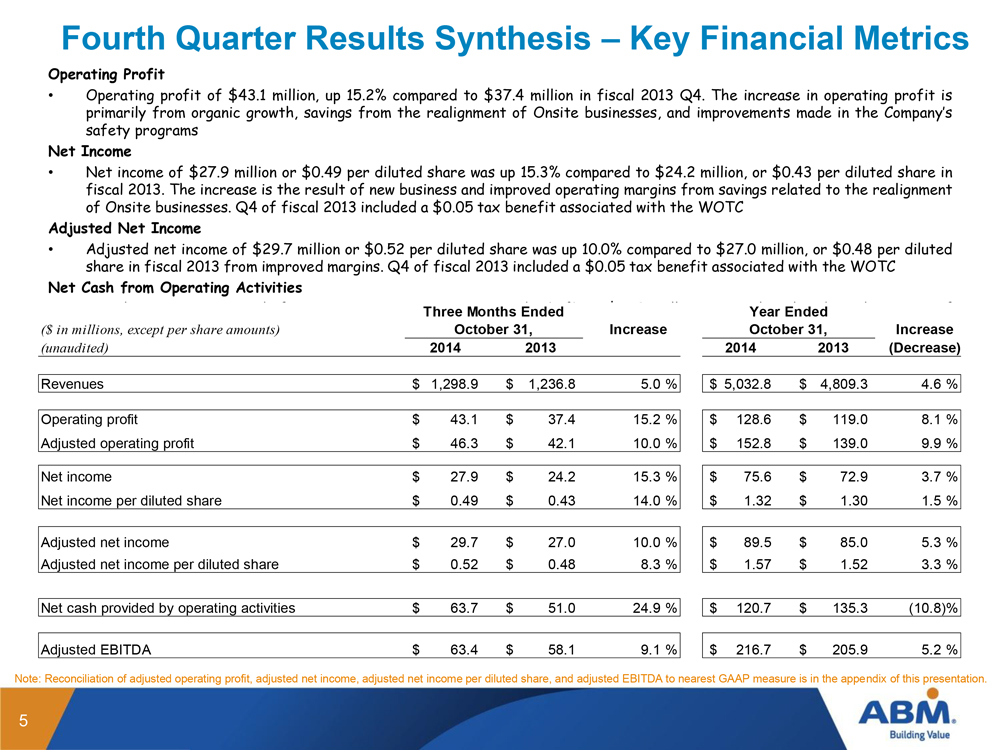
Fourth Quarter Results Synthesis – Key Financial Metrics 5 Note: Reconciliation of adjusted operating p rofit, adjusted net income, adjusted net income per diluted share, and adjusted EBITDA to nearest GAAP measure is in the appe ndi x of this presentation. Operating Profit • Operating profit of $ 43 . 1 million, up 15 . 2 % compared to $ 37 . 4 million in fiscal 2013 Q 4 . The increase in operating profit is primarily from organic growth, savings from the realignment of Onsite businesses, and improvements made in the Company’s safety programs Net Income • N et income of $ 27 . 9 million or $ 0 . 49 per diluted share was up 15 . 3 % compared to $ 24 . 2 million, or $ 0 . 43 per diluted share in fiscal 2013 . The increase is the result of new business and improved operating margins from savings related to the realignment of Onsite businesses . Q 4 of fiscal 2013 included a $ 0 . 05 tax benefit associated with the WOTC Adjusted Net Income • Adjusted net income of $ 29 . 7 million or $ 0 . 52 per diluted share was up 10 . 0 % compared to $ 27 . 0 million, or $ 0 . 48 per diluted share in fiscal 2013 from improved margins . Q 4 of fiscal 2013 included a $ 0 . 05 tax benefit associated with the WOTC Net Cash from Operating Activities • For the quarter, net cash from operating a ctivities increased 24 . 9 % to $ 63 . 7 million, primarily related to the timing of collecting client receivables and payments made on vendor invoices ($ in millions, except per share amounts) Increase Increase (unaudited) 2014 2013 2014 2013 (Decrease) Revenues 1,298.9$ 1,236.8$ 5.0% 5,032.8$ 4,809.3$ 4.6% 43.1$ 37.4$ 15.2% 128.6$ 119.0$ 8.1% 46.3$ 42.1$ 10.0% 152.8$ 139.0$ 9.9% Net income 27.9$ 24.2$ 15.3% 75.6$ 72.9$ 3.7% 0.49$ 0.43$ 14.0% 1.32$ 1.30$ 1.5% 29.7$ 27.0$ 10.0% 89.5$ 85.0$ 5.3% 0.52$ 0.48$ 8.3% 1.57$ 1.52$ 3.3% 63.7$ 51.0$ 24.9% 120.7$ 135.3$ (10.8)% Adjusted EBITDA 63.4$ 58.1$ 9.1% 216.7$ 205.9$ 5.2% Operating profit Adjusted operating profit Year Ended October 31, Three Months Ended October 31, Net cash provided by operating activities Adjusted net income Adjusted net income per diluted share Net income per diluted share

Select Cash Flow & Balance Sheet Items Cash Flow from Operating Activities (in millions) • Q4 2014 Insurance claim liabilities of $349.7 million down $8.3 million compared to Q4 2013 • Q4 2014 Self - insurance claims paid $23.6 million down $1.5 million compared to Q4 2013 • Q4 2014 c apital expenditures of $8.9 million, down $2.3 million Y - o - Y 6 • Days sales outstanding (DSO) for the fourth quarter were 53 days • DSO up 1 day on a Y - o - Y basis and down 1 day sequentially • Q4 2014 Depreciation and amortization of $14.9 million down $1.3 million Y - o - Y -$40 -$20 $0 $20 $40 $60 $80 $100 $120 $140 $160 Q1 Q2 Q3 Q4 FY FY09 FY10 FY11 FY12 FY13 FY14

Select Cash Flow & Balance Sheet Items – Continued 7 Line of Credit OneSource Linc Air Serv/HHA In Millions Dividends Paid (Fiscal Year Basis) Per Share $0 $50 $100 $150 $200 $250 $300 $350 $400 $450 Q108 Q208 Q308 Q408 Q109 Q209 Q309 Q409 Q110 Q210 Q310 Q410 Q111 Q211 Q311 Q411 Q112 Q212 Q312 Q412 Q113 Q213 Q313 Q413 Q114 Q214 Q314 Q414 GBM $0.250 $0.300 $0.350 $0.400 $0.450 $0.500 $0.550 $0.600 $0.650 2004 2005 2006 2007 2008 2009 2010 2011 2012 2013 2014 $0.395 $0.415 $0.435 $0.470 $0.495 $0.515 $0.535 $0.555 $0.575 $0.595 $0.615

Fourth Quarter 2014 Operational Review

Q4 2014 Results Synthesis - Revenues • Revenues of $666.1 million, up organically $28.8 million or 4.6% compared to 2013 Q4 • Janitorial tag business up 7.0% compared to fourth quarter of 2013 Consolidated revenues up 5.0% at ~ $1.30 billion – A Q4 Record Janitorial Services 9 Facility Services Parking & Shuttle Services Security Services Building & Energy Solutions Other (Air Serv) • Revenues of $147.1 million, down $5.7 million or (3.7)% compared to 2013 Q4 • Recent wins in automotive and high - tech verticals will partially offset decline in revenue • Revenues of $156.7 million, up $4.4 million or 2.9% compared to 2013 Q4 • Management reimbursement revenues were essentially flat at $74.7 million • Revenues of $94.2 million, down $2.9 million or (3.0)% compared to 2013 Q4 • Revenues of $135.7 million, up $21.0 million or 18.3% compared to 2013 Q4; organic revenue grew 9 .0% • Y - o - Y organic growth of 8.5% in ABES and 19.9% in ABM Healthcare Support Services • Revenues of $99.1 million, up $11.7 million or 13.4% compared to 2013 Q4 • Strong organic growth in the U.K. and improving growth trends among U.S. commercial carrier clients

Q4 2014 Results Synthesis - Operating Profits 1 • Janitorial operating profit of $38.7 million, increased $4.6 million or 13.5%. This significant growth was primarily related to new business added, lower expenses as a result of safety initiatives and realignment savings • Operating profit for Facility Services was $8.5 million, up $0.4 million or 4.9% Y - o - Y on a number of items • Parking operating profit increased $1.0 million, or 11.9%, as compared to the fiscal fourth quarter of 2013. The increase is attributable to improved safety performance, lower expense from the Onsite realignment and new business added • Operating profit for Security was down $1.4 million primarily on lower revenue • Building & Energy Solutions profit increased 29.5% to $10.1 million from new business and the Airco acquisition • Operating profit for the Other segment, which represents the results of Air Serv, decreased $0.5 million to $3.4 million, due to $0.8 million in unusual items related to operations, partially offset by new business in the United Kingdom ($ in millions) 2014 2013 Change Janitorial 38.7$ 34.1$ 13.5% Facility Services 8.5 8.1 4.9% Parking 9.4 8.4 11.9% Security 3.8 5.2 (26.9)% Building & Energy Solutions 10.1 7.8 29.5% Other 3.4 3.9 (12.8)% Total Profit 73.9 67.5 9.5% Fourth Quarter 10 1 Excludes Corporate
Q4 2014 Business & Sales Highlights • Completed acquisition of GBM Support Services Group Limited, a provider of cleaning, security, building maintenance, waste and facilities management services for retail, leisure, public sector, and commercial clients throughout the U.K. GBM generates annual revenues of approximately £40 million and has 2,000 employees • ABM Healthcare Support Services selected to provide environmental services for regional West Medical Center. Under a multi - year, multi - million dollar partnership, ABM has begun overseeing all housekeeping operations • ABM’s Onsite Services successfully began work at one of the NFL’s premier stadiums and was awarded a contract at another. In all, Onsite businesses now perform various services for five NFL teams • We have nearly 2,200 leads submitted through our Solve - One - More program and this is with a rollout to only 20% of the ~ 300 ABM offices. Closed leads are over 10% of total. A nd the sales pipeline and is now at approximately $110 million. 11

O utlook

Fiscal 2015 Outlook 13 • The Company is providing the following guidance: o Adjusted net income to $1.65 to $1.75 per diluted share o Net income of $1.45 to $1.55 per diluted share o This guidance excludes potential benefits associated with the Work Opportunity Tax Credit, should Congress reenact the credit. The reenactment of the calendar 2014 WOTC could provide a benefit of $0.10 per diluted share in fiscal 2015. o If Congress were to extend the WOTC for calendar 2015, the Company could have a further benefit of $0.08 per diluted share in fiscal 2015. • Effective tax rate in the range of 40% to 43%. • Fiscal 2015 has one less work day, which the Company anticipates will reduce labor expense by approximately $4.0 million on a pre-tax basis: o Work days for fiscal 2015 by quarter are as follows: Q1 65; Q2 64; Q3 66; and Q4 65. Year-over-year compared to fiscal 2014, Q1 has one less work day; Q2 has one more work day; Q3 works days are the same; and Q4 has one less work day. • Interest expense of $11.0 million to $13.0 million • Depreciation and amortization expense of $56.0 million to $60.0 million. • Capital expenditures are expected to be in the range of $31.0 million to $35.0 million.
Forward - Looking Statement 14 This presentation contains forward - looking statements that set forth management's anticipated results based on management's current plans and assumptions . Any number of factors could cause the Company's actual results to differ materially from those anticipated . These factors include but are not limited to the following : ( 1 ) risks relating to our acquisition strategy may adversely impact our results of operations ; ( 2 ) our strategy of moving to an integrated facility solutions provider platform, which focuses on vertical markets, may not generate the organic growth in revenues or profitability that we expect ; ( 3 ) we are subject to intense competition that can constrain our ability to gain business as well as our profitability ; ( 4 ) our business success depends on our ability to preserve our long - term relationships with clients ; ( 5 ) increases in costs that we cannot pass on to clients could affect our profitability ; ( 6 ) we have high deductibles for certain insurable risks, and therefore we are subject to volatility associated with those risks ; ( 7 ) our restructuring initiatives may not achieve the expected cost reductions ; ( 8 ) our business success depends on retaining senior management and attracting and retaining qualified personnel ; ( 9 ) we are at risk of losses stemming from accidents or other incidents at facilities in which we operate, which could cause significant damage to our reputation and financial loss ; ( 10 ) negative or unexpected tax consequences could adversely affect our results of operations ; ( 11 ) federal health care reform legislation may adversely affect our business and results of operations ; ( 12 ) changes in energy prices and government regulations could adversely impact the results of operations of our Building & Energy Solutions business ; ( 13 ) significant delays or reductions in appropriations for our government contracts may negatively affect our business and could have an adverse effect on our financial position, results of operations, and cash flows ; ( 14 ) we conduct some of our operations through joint ventures, and our ability to do business may be affected by the failure of our joint venture partners to perform their obligations ; ( 15 ) our business may be negatively affected by adverse weather conditions ; ( 16 ) we are subject to business continuity risks associated with centralization of certain administrative functions ; ( 17 ) our services in areas of military conflict expose us to additional risks ; ( 18 ) we are subject to cyber - security risks arising out of breaches of security relating to sensitive company, client, and employee information and to the technology that manages our operations and other business processes ; ( 19 ) a decline in commercial office building occupancy and rental rates could affect our revenues and profitability ; ( 20 ) deterioration in general economic conditions could reduce the demand for facility services and, as a result, reduce our earnings and adversely affect our financial condition ; ( 21 ) financial difficulties or bankruptcy of one or more of our clients could adversely affect our results ; ( 22 ) we incur accounting and other control costs that reduce profitability ; ( 23 ) any future increase in the level of our debt or in interest rates could affect our results of operations ; ( 24 ) our ability to operate and pay our debt obligations depends upon our access to cash ; ( 25 ) goodwill impairment charges could have a material adverse effect on our financial condition and results of operations ; ( 26 ) impairment of long - lived assets may adversely affect our operating results ; ( 27 ) we are defendants in class and representative actions and other lawsuits alleging various claims that could cause us to incur substantial liabilities ; ( 28 ) changes in immigration laws or enforcement actions or investigations under such laws could significantly adversely affect our labor force, operations, and financial results ; ( 29 ) labor disputes could lead to loss of revenues or expense variations ; ( 30 ) we participate in multiemployer pension plans that under certain circumstances could result in material liabilities being incurred ; and ( 31 ) disasters or acts of terrorism could disrupt services .

Appendix - Unaudited Reconciliation of non - GAAP Financial Measures

Unaudited Reconciliation of non - GAAP Financial Measures 16 ABM INDUSTRIES INCORPORATED AND SUBSIDIARIES RECONCILIATIONS OF NON-GAAP FINANCIAL MEASURES (UNAUDITED) ($ in millions) 2014 2013 2014 2013 Reconciliation of Adjusted Net Income to Net Income Adjusted net income 29.7$ 27.0$ 89.5$ 85.0$ Items impacting comparability: Rebranding (a) (0.9) (1.5) (4.1) (3.6) U.S. Foreign Corrupt Practices Act investigation (b) (0.1) (0.4) (1.2) (0.8) Self-insurance adjustment (1.0) (0.7) (11.5) (10.6) Acquisition costs (0.8) (0.1) (1.4) (1.1) Litigation and other settlements - - (3.4) (0.1) Restructuring (c) (0.4) (2.0) (2.6) (3.8) Total items impacting comparability (3.2) (4.7) (24.2) (20.0) Benefit from income taxes 1.4 1.9 10.3 7.9 Items impacting comparability, net of taxes (1.8) (2.8) (13.9) (12.1) Net income 27.9$ 24.2$ 75.6$ 72.9$ (a) Represents costs related to the Company's branding initiative. (b) Includes legal and other costs incurred in connection with an internal investigation into a foreign entity affiliated with a former joint venture partner. (c) Restructuring costs associated with realignment of our operational structure. Year Ended October 31, Three Months Ended October 31,

Unaudited Reconciliation of non - GAAP Financial Measures 17 ABM INDUSTRIES INCORPORATED AND SUBSIDIARIES RECONCILIATIONS OF NON-GAAP FINANCIAL MEASURES (UNAUDITED) ($ in millions, except per share amounts) 2014 2013 2014 2013 Reconciliation of Adjusted Operating Profit to Operating Profit Adjusted operating profit 46.3$ 42.1$ 152.8$ 139.0$ Total items impacting comparability (3.2) (4.7) (24.2) (20.0) Operating profit 43.1$ 37.4$ 128.6$ 119.0$ Reconciliation of Adjusted EBITDA to Net Income Adjusted EBITDA 63.4$ 58.1$ 216.7$ 205.9$ Items impacting comparability (3.2) (4.7) (24.2) (20.0) Provision for income taxes (14.8) (12.4) (48.8) (39.5) Interest expense (2.6) (3.2) (10.7) (12.9) Depreciation and amortization (14.9) (13.6) (57.4) (60.6) Net income 27.9$ 24.2$ 75.6$ 72.9$ - - - - Reconciliation of Adjusted Net Income per Diluted Share to Net Income per Diluted Share 2014 2013 2014 2013 Adjusted net income per diluted share 0.52$ 0.48$ 1.57$ 1.52$ Items impacting comparability, net of taxes (0.03) (0.05) (0.25) (0.22) Net income per diluted share 0.49$ 0.43$ 1.32$ 1.30$ Diluted shares 57.2 56.7 57.1 56.1 Three Months Ended October 31, Year Ended October 31, Three Months Ended October 31, Year Ended October 31,

Unaudited Reconciliation of non-GAAP Financial Measures 18 ABM INDUSTRIES INCORPORATED AND SUBSIDIARIES RECONCILIATION OF ESTIMATED ADJUSTED NET INCOME PER DILUTED SHARE TO ESTIMATED NET INCOME PER DILUTED SHARE FOR THE YEAR ENDING OCTOBER 31, 2015 Estimated net income per diluted share (a) Low Estimate High Estimate Adjusted net income per diluted share 1.65$ 1.75$ Adjustments (b) (0.20)$ (0.20)$ Net income per diluted share 1.45$ 1.55$ Year Ending October 31, 2015 (per diluted share) (b)Adjustmentsincludecertainrebrandingcostsandlegalsettlements,adjustmentstoself-insurancereservespertainingtoprior year's claims and other unique items impacting comparability. (a)ThisguidanceexcludespotentialbenefitsassociatedwiththeWorkOpportunityTaxCredit,shouldCongressreenactthecredit. Thereenactmentofthecalendar2014WOTCcouldprovideabenefitof$0.10perdilutedshareinfiscal2015.IfCongresswereto extend the WOTC for calendar 2015, the Company could have a further benefit of $0.08 per diluted share.