Attached files
| file | filename |
|---|---|
| 8-K - FORM 8-K - Gogo Inc. | d834182d8k.htm |
Exhibit 99.1
|
|
December 2014 Investor Presentation Michael Small President and CEO
|
|
2 DISCLAIMER Safe Harbor Statement This presentation contains “forward-looking statements” that are based on management’s beliefs and assumptions and on information currently available to management. Most forward-looking statements contain words that identify them as forward-looking, such as “anticipates,” “believes,” “continues,” “could,” “seeks,” “estimates,” “expects,” “intends,” “may,” “plans,” “potential,” “predicts,” “projects,” “should,” “will,” “would” or similar expressions and the negatives of those terms that relate to future events. Forward-looking statements involve known and unknown risks, uncertainties and other factors that may cause Gogo’s actual results, performance or achievements to be materially different from any projected results, performance or achievements expressed or implied by the forward-looking statements. Forward-looking statements represent the beliefs and assumptions of Gogo only as of the date of this presentation and Gogo undertakes no obligation to update or revise publicly any such forward-looking statements, whether as a result of new information, future events or otherwise. As such, Gogo’s future results may vary from any expectations or goals expressed in, or implied by, the forward-looking statements included in this presentation, possibly to a material degree. Gogo cannot assure you that the assumptions made in preparing any of the forward-looking statements will prove accurate or that any long-term financial or operational goals and targets will be realized. In particular, the availability and performance of certain technology solutions yet to be implemented by the Company set forth in this presentation represent aspirational long-term goals based on current expectations. For a discussion of some of the important factors that could cause Gogo’s results to differ materially from those expressed in, or implied by, the forward-looking statements included in this presentation, investors should refer to the disclosure contained under the heading “Risk Factors” in the Company’s Annual Report on Form 10-K filed with the SEC on March 14, 2014 and “Special Note Regarding Forward-Looking Statements” in the Company’s Quarterly Report on Form 10-Q filed with the SEC on November 10, 2014. Note to Certain Operating and Financial Data In addition to disclosing financial results that are determined in accordance with U.S. generally accepted accounting principles (“GAAP”), Gogo also discloses in this presentation certain non-GAAP financial information, including Adjusted EBITDA and Cash CapEx. These financial measures are not recognized measures under GAAP and are not intended to be, and should not be, considered in isolation or as a substitute for, or superior to, the financial information prepared and presented in accordance with GAAP. In addition, this presentation contains various customer metrics and operating data, including numbers of aircraft or units online, that are based on internal company data, as well as information relating to the commercial and business aviation market, and our position within those markets. While management believes such information and data are reliable, they have not been verified by an independent source and there are inherent challenges and limitations involved in compiling data across various geographies and from various sources.
|
|
3 GOGO’S MISSION Advance aviation by connecting every aircraft with the most trusted communications services on and above our planet
|
|
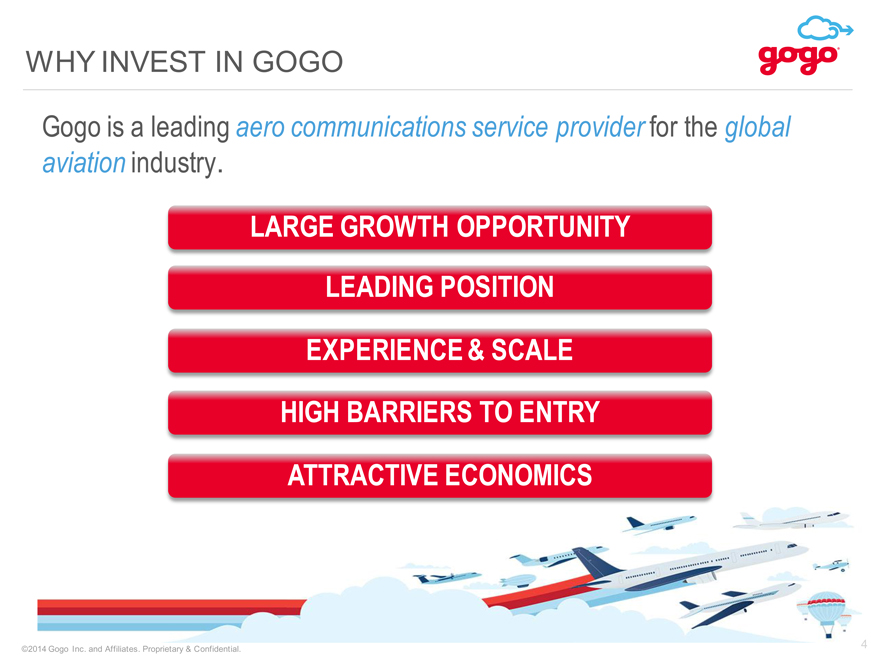
WHY INVEST IN GOGO Gogo is a leading aero communications service provider for the global aviation industry. LARGE GROWTH OPPORTUNITY HIGH BARRIERS TO ENTRY EXPERIENCE & SCALE LEADING POSITION 4 ATTRACTIVE ECONOMICS
|
|
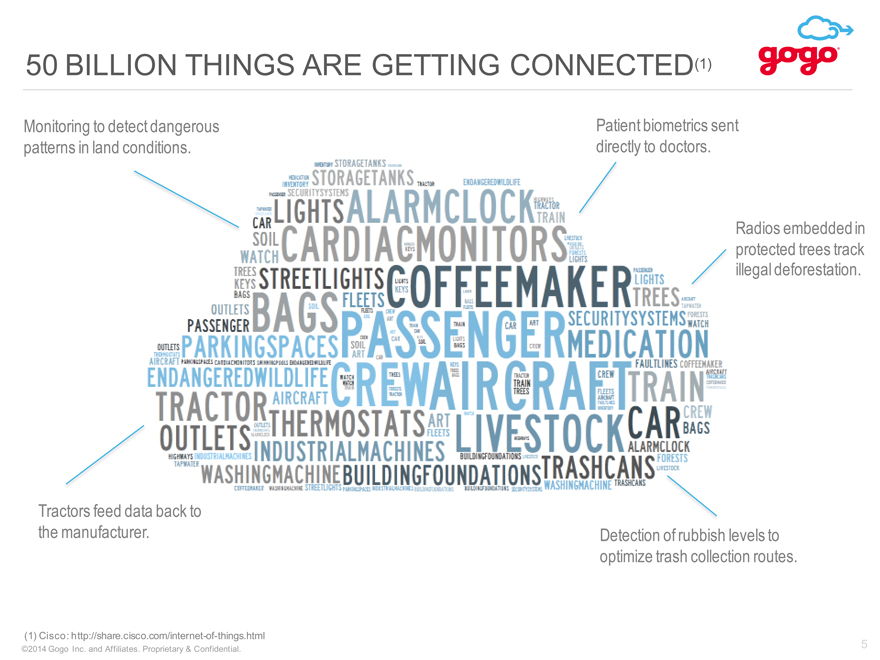
5 50 BILLION THINGS ARE GETTING CONNECTED(1) Monitoring to detect dangerous patterns in land conditions. Detection of rubbish levels to optimize trash collection routes. Patient biometrics sent directly to doctors. Tractors feed data back to the manufacturer. Radios embedded in protected trees track illegal deforestation. (1) Cisco: http://share.cisco.com/internet-of-things.html
|
|
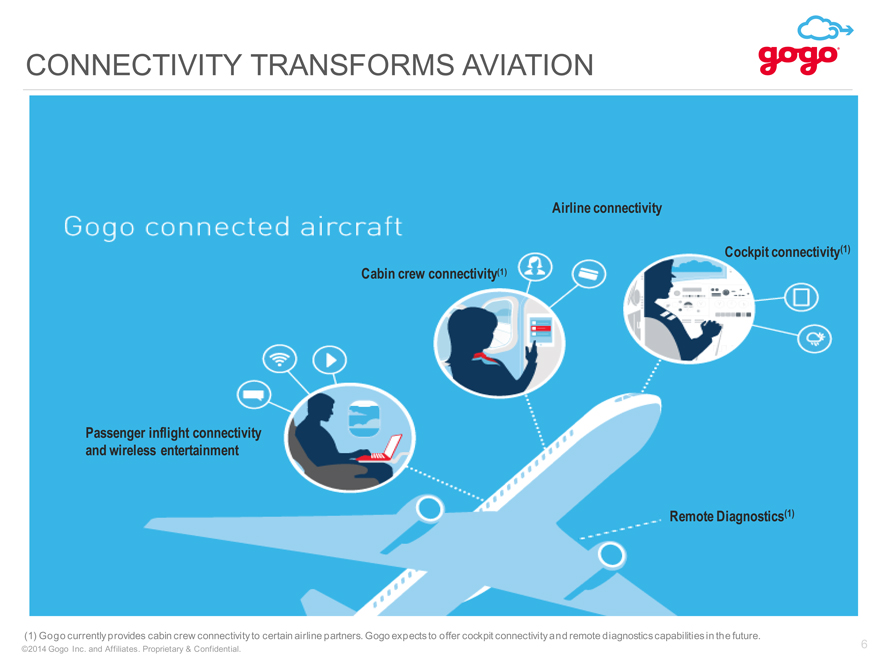
6 CONNECTIVITY TRANSFORMS AVIATION Airline connectivity Passenger inflight connectivity and wireless entertainment Cabin crew connectivity(1) Cockpit connectivity(1) Remote Diagnostics(1) (1) Gogo currently provides cabin crew connectivity to certain airline partners. Gogo expects to offer cockpit connectivity and remote diagnostics capabilities in the future.
|
|
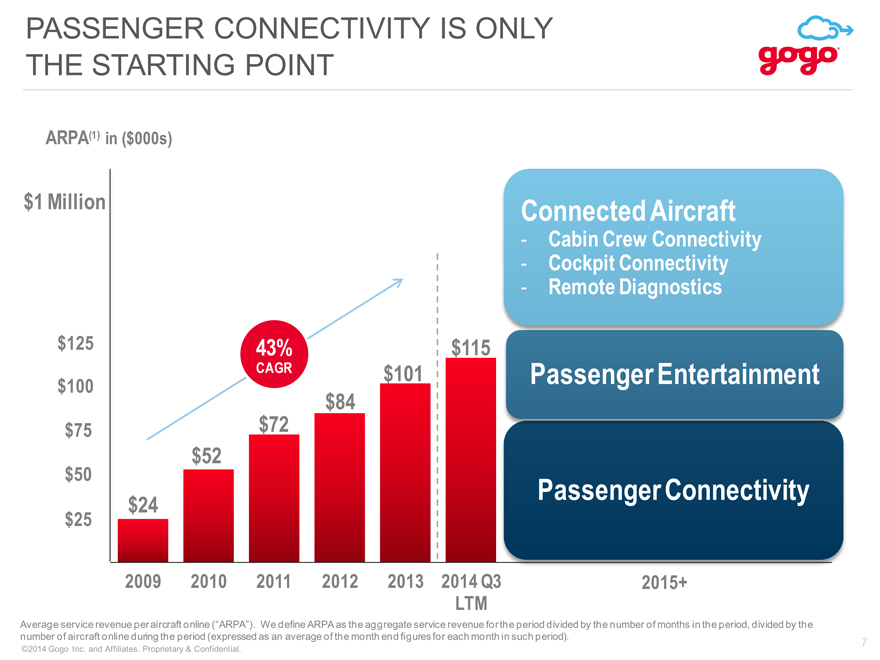
7 PASSENGER CONNECTIVITY IS ONLY THE STARTING POINT (CHART) 43% CAGR $50 $25 $75 $100 $125 $1 Million Passenger Connectivity Passenger Entertainment 2015+ Average service revenue per aircraft online (“ARPA”). We define ARPA as the aggregate service revenue for the period divided by the number of months in the period, divided by the number of aircraft online during the period (expressed as an average of the month end figures for each month in such period). ARPA(1) in ($000s) Connected Aircraft Cabin Crew Connectivity Cockpit Connectivity Remote Diagnostics
|
|
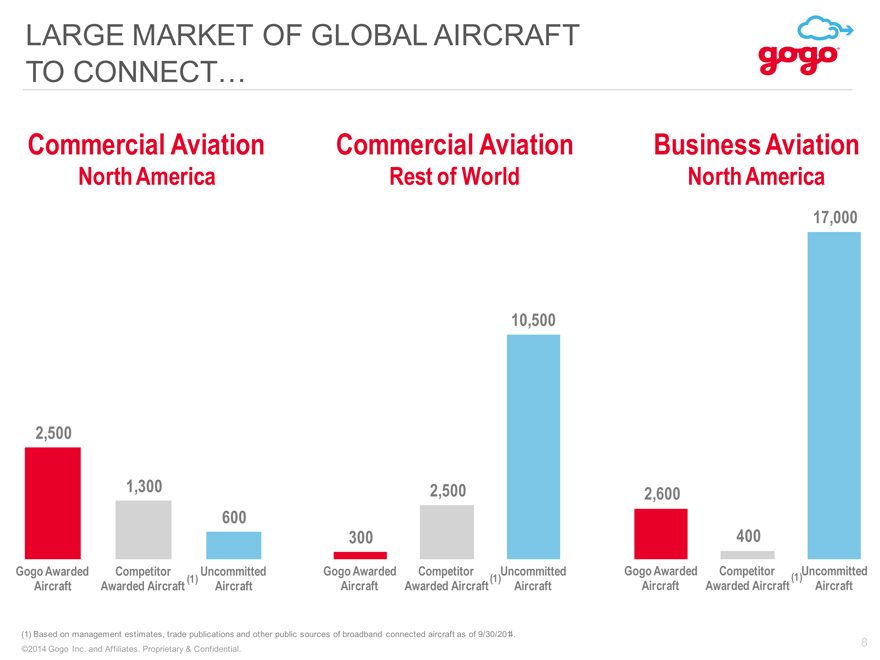
LARGE MARKET OF GLOBAL AIRCRAFT TO CONNECT. (CHART) (1) Based on management estimates, trade publications and other public sources of broadband connected aircraft as of 9/30/2014. Commercial Aviation North America (CHART) (CHART) Business Aviation North America Commercial Aviation Rest of World 8 (1) (1) (1)
|
|
MARKET & COMPANY OVERVIEW
|
|
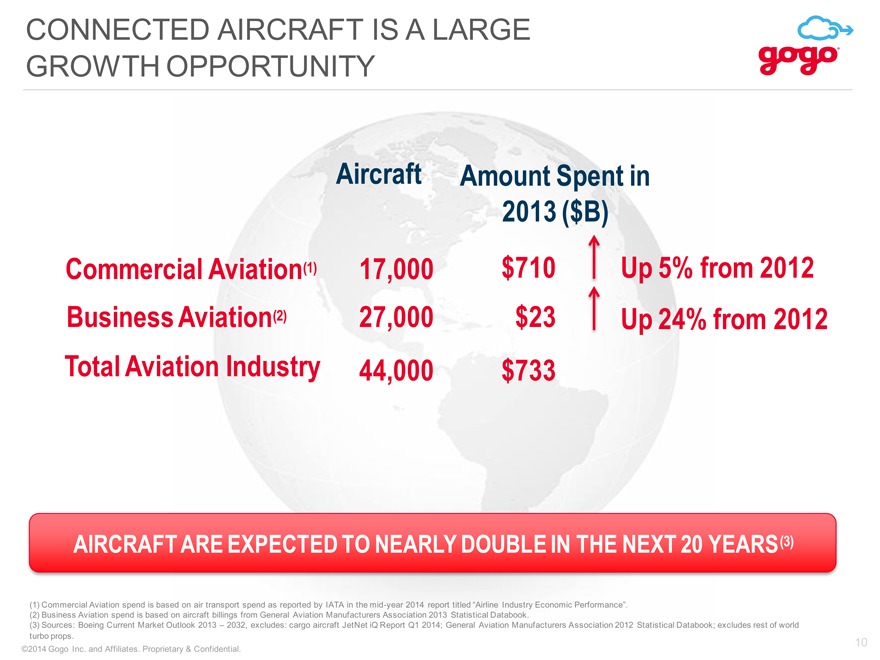
CONNECTED AIRCRAFT IS A LARGE GROWTH OPPORTUNITY Commercial Aviation(1) Business Aviation(2) Aircraft 17,000 Amount Spent in 2013 ($B) $710 27,000 $23 (1) Commercial Aviation spend is based on air transport spend as reported by IATA in the mid-year 2014 report titled “Airline Industry Economic Performance”. (2) Business Aviation spend is based on aircraft billings from General Aviation Manufacturers Association 2013 Statistical Databook. (3) Sources: Boeing Current Market Outlook 2013 – 2032, excludes: cargo aircraft JetNet iQ Report Q1 2014; General Aviation Manufacturers Association 2012 Statistical Databook; excludes rest of world turbo props. Total Aviation Industry 44,000 $733 Up 5% from 2012 AIRCRAFT ARE EXPECTED TO NEARLY DOUBLE IN THE NEXT 20 YEARS(3) Up 24% from 2012 10
|
|
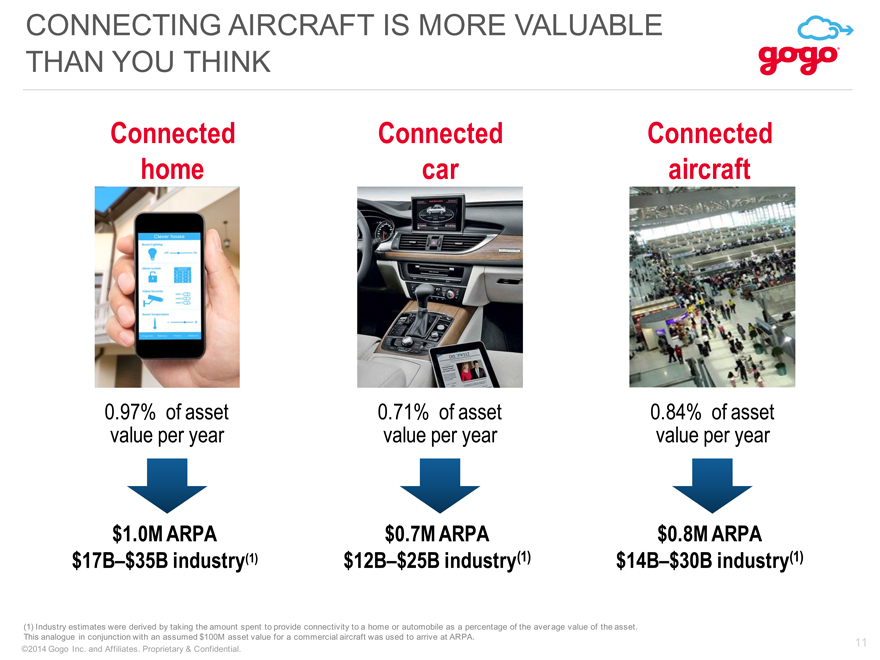
CONNECTING AIRCRAFT IS MORE VALUABLE THAN YOU THINK (1) Industry estimates were derived by taking the amount spent to provide connectivity to a home or automobile as a percentage of the average value of the asset. This analogue in conjunction with an assumed $100M asset value for a commercial aircraft was used to arrive at ARPA. Connected home Connected car $1.0M ARPA $17B–$35B industry(1) $0.8M ARPA $14B–$30B industry(1) $0.7M ARPA $12B–$25B industry(1) 0.97% of asset value per year 0.71% of asset value per year 0.84% of asset value per year Connected aircraft 11
|
|
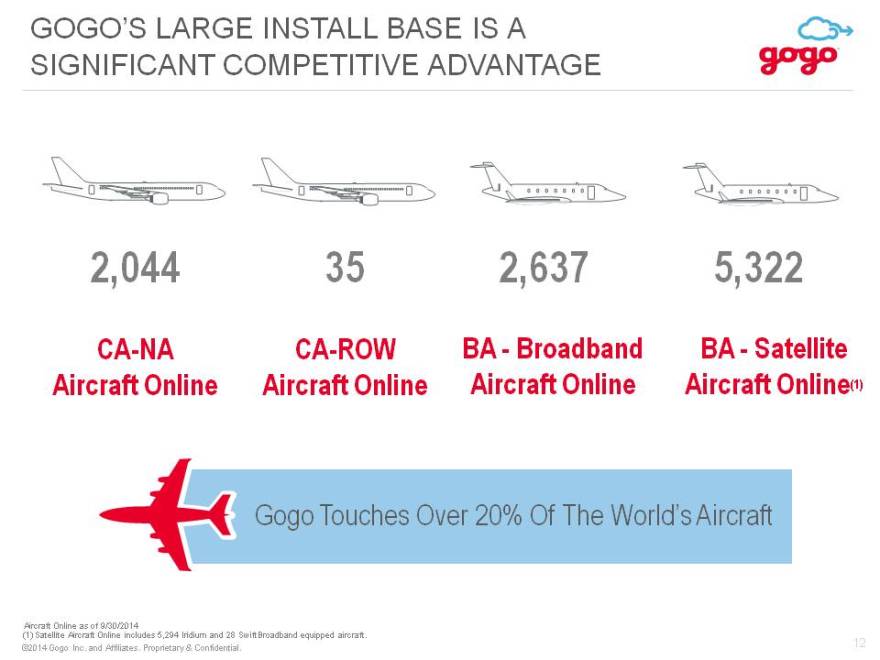
12 GOGO’S LARGE INSTALL BASE IS A SIGNIFICANT COMPETITIVE ADVANTAGE CA-NA Aircraft Online CA-ROW Aircraft Online BA—Broadband Aircraft Online BA—Satellite Aircraft Online(1) 2,044 35 2,637 5,322 Gogo Touches Over 20% Of The World’s Aircraft (1) Satellite Aircraft Online includes 5,294 Iridium and 28 SwiftBroadband equipped aircraft. Aircraft Online as of 9/30/2014
|
|
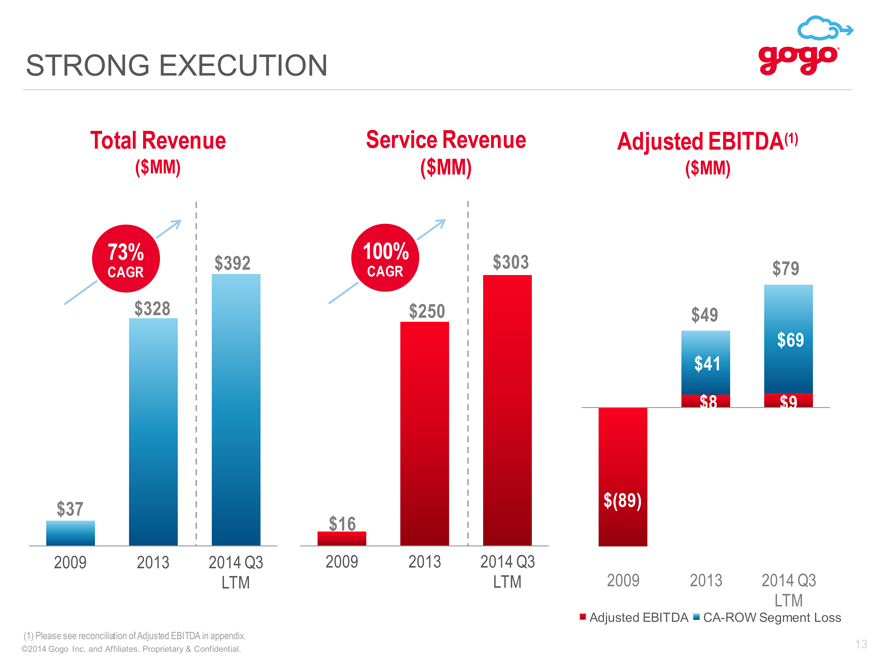
13 STRONG EXECUTION (CHART) Service Revenue ($MM) Note: Minor differences exist due to rounding. (CHART) Total Revenue ($MM) (CHART) Adjusted EBITDA(1) ($MM) 100% CAGR 73% CAGR $79 (1) Please see reconciliation of Adjusted EBITDA in appendix.
|
|
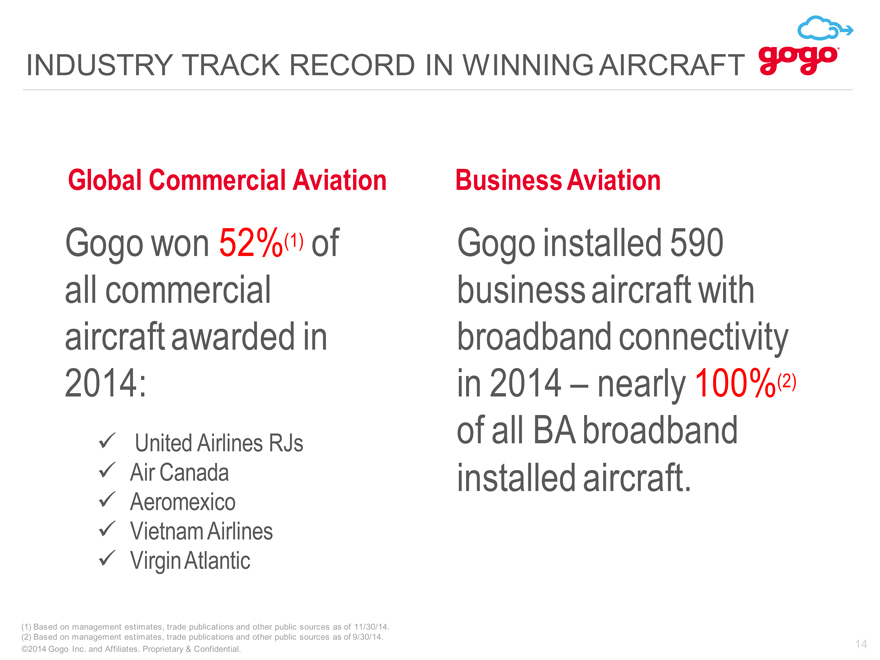
14 INDUSTRY TRACK RECORD IN WINNING AIRCRAFT (1) Based on management estimates, trade publications and other public sources as of 11/30/14. (2) Based on management estimates, trade publications and other public sources as of 9/30/14. ITG Gogo won 52%(1) of all commercial aircraft awarded in 2014: Gogo installed 590 business aircraft with broadband connectivity in 2014 – nearly 100%(2) of all BA broadband installed aircraft. Global Commercial Aviation Business Aviation United Airlines RJs Air Canada Aeromexico Vietnam Airlines Virgin Atlantic
|
|
15 Why we win Specialize in global aviation Superior technology and roadmap End-to-end service provider Deliver excellent reliability 1 2 3 4
|
|
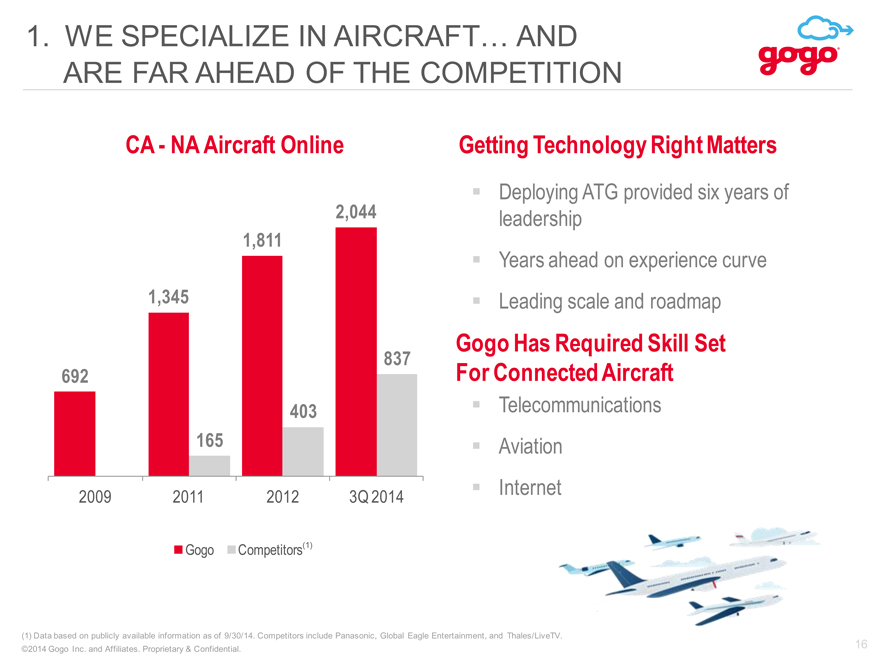
16 1. WE SPECIALIZE IN AIRCRAFT. AND ARE FAR AHEAD OF THE COMPETITION Telecommunications Aviation Internet CA—NA Aircraft Online Gogo Has Required Skill Set For Connected Aircraft (CHART) (1) Data based on publicly available information as of 9/30/14. Competitors include Panasonic, Global Eagle Entertainment, and Thales/LiveTV. (1) Deploying ATG provided six years of leadership Years ahead on experience curve Leading scale and roadmap Getting Technology Right Matters
|
|
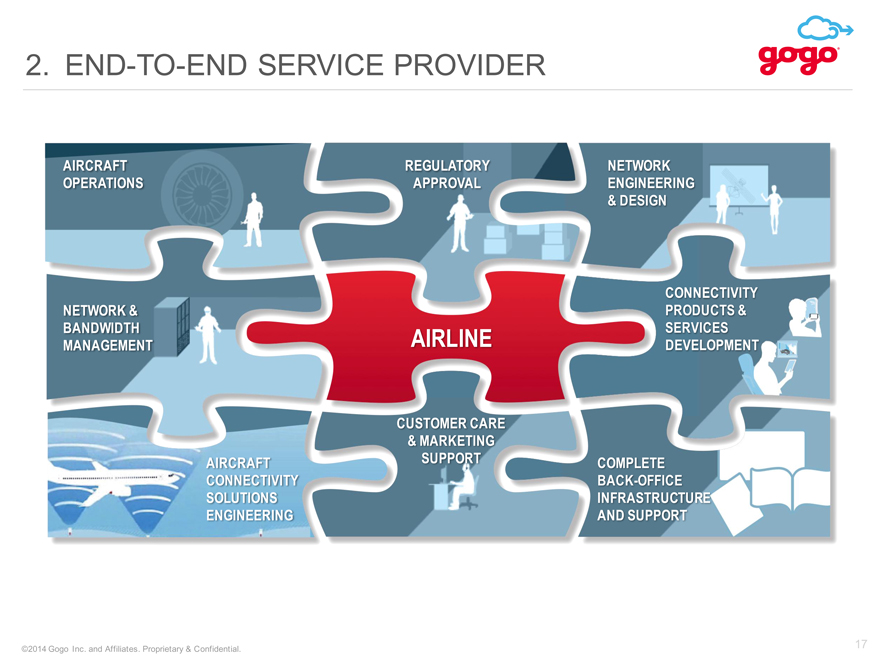
17 2. END-TO-END SERVICE PROVIDER AIRCRAFT OPERATIONS REGULATORY APPROVAL NETWORK & BANDWIDTH MANAGEMENT CUSTOMER CARE & MARKETING SUPPORT NETWORK ENGINEERING & DESIGN AIRCRAFT CONNECTIVITY SOLUTIONS ENGINEERING COMPLETE BACK-OFFICE INFRASTRUCTURE AND SUPPORT AIRLINE CONNECTIVITY PRODUCTS & SERVICES DEVELOPMENT
|
|
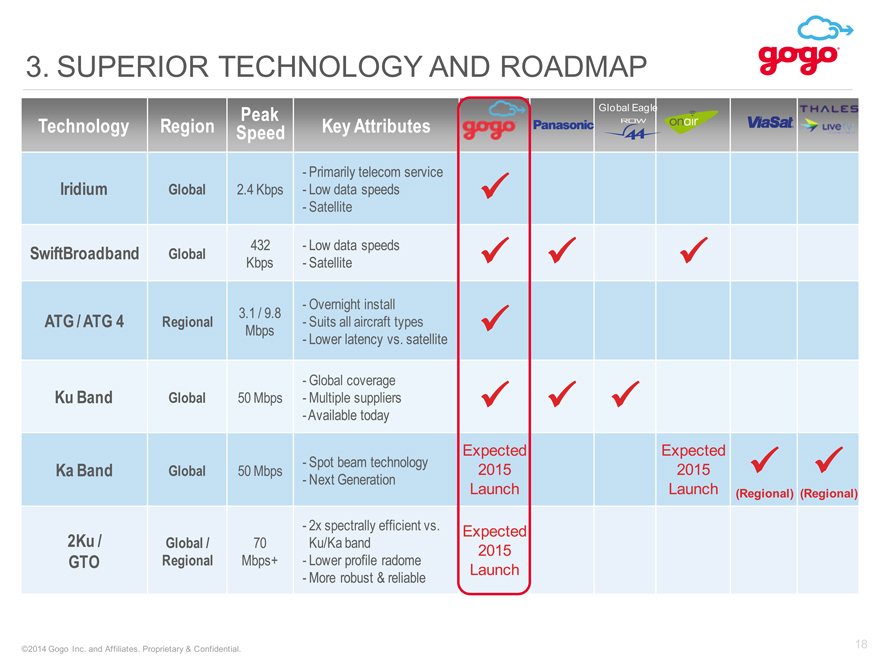
18 3. SUPERIOR TECHNOLOGY AND ROADMAP Technology Region Peak Speed Key Attributes Iridium Global 2.4 Kbps Primarily telecom service Low data speeds- Satellite ? SwiftBroadband Global 432 Kbps Low data speeds Satellite ? ? ? ATG / ATG 4 Regional 3.1 / 9.8 Mbps—Overnight install- Suits all aircraft types- Lower latency vs. satellite ? Ku Band Global 50 Mbps—Global coverage- Multiple suppliers- Available today ? ? ? Ka Band Global 50 Mbps—Spot beam technology- Next Generation Expected2015Launch Expected2015Launch ?(Regional) ?(Regional) 2Ku / GTO Global / Regional 70 Mbps+—2x spectrally efficient vs. Ku/Ka band- Lower profile radome- More robust & reliable Expected2015Launch Global Eagle
|
|
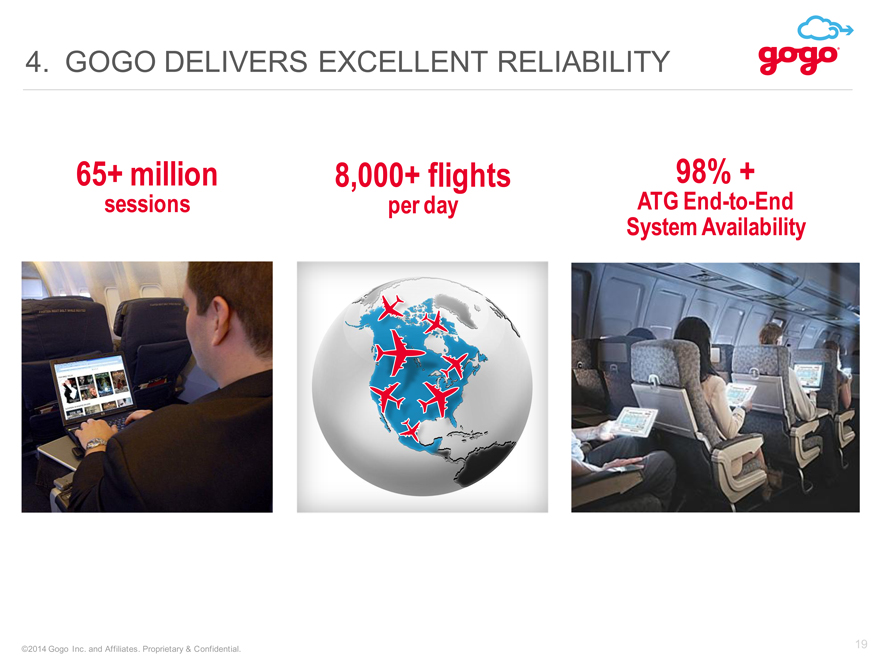
19 65+ million sessions 8,000+ flights per day 98% + ATG End-to-End System Availability 4. GOGO DELIVERS EXCELLENT RELIABILITY
|
|
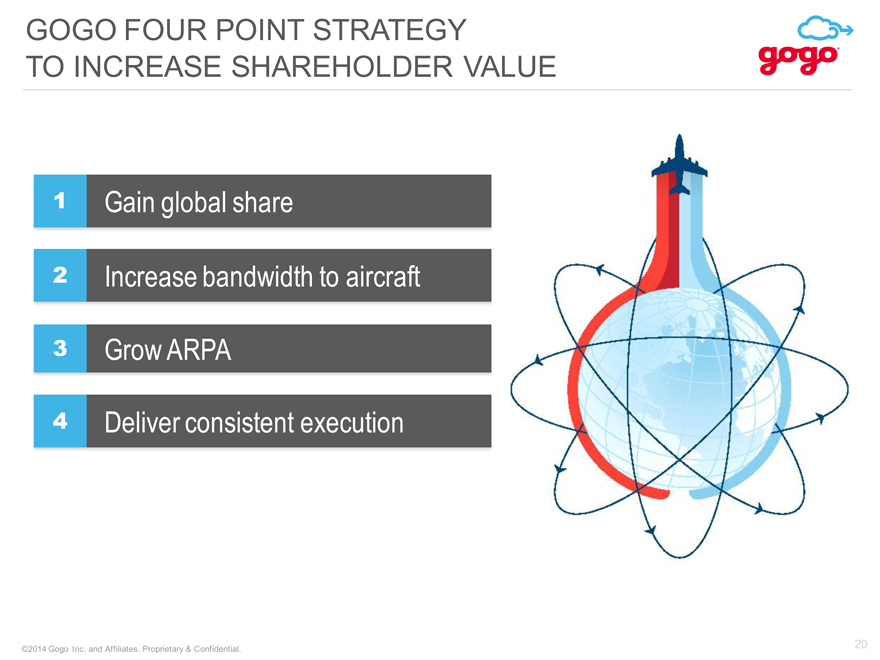
20 GOGO FOUR POINT STRATEGY TO INCREASE SHAREHOLDER VALUE Gain global share Grow ARPA Increase bandwidth to aircraft Deliver consistent execution 1 2 3 4
|
|
WHY INVEST IN GOGO 21 LARGE GROWTH OPPORTUNITY HIGH BARRIERS TO ENTRY EXPERIENCE & SCALE LEADING POSITION ATTRACTIVE ECONOMICS
|
|

22 Q&A
|
|
APPENDIX
|
|
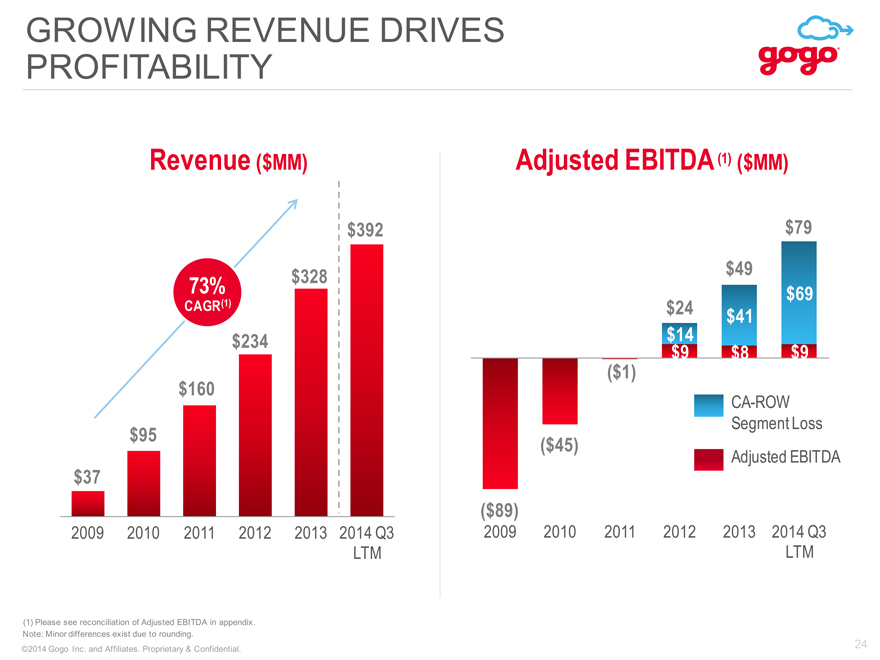
24 GROWING REVENUE DRIVES PROFITABILITY (1) Please see reconciliation of Adjusted EBITDA in appendix. Note: Minor differences exist due to rounding. Adjusted EBITDA (1) ($MM) (CHART) (CHART) $49 $24 CA-ROW Segment Loss Revenue ($MM) 73% CAGR(1) $79 Adjusted EBITDA
|
|
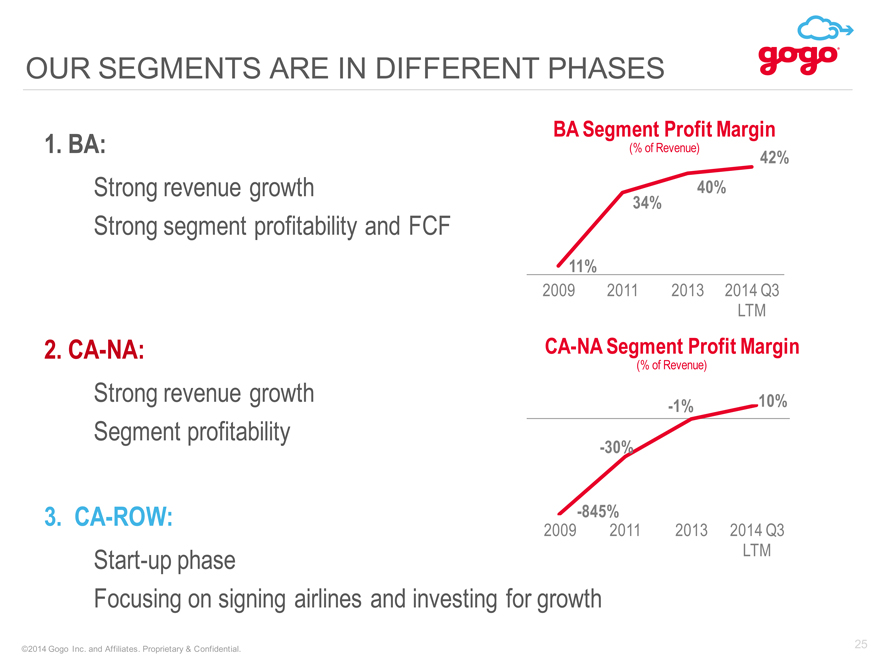
25 OUR SEGMENTS ARE IN DIFFERENT PHASES 1. BA: Strong revenue growth Strong segment profitability and FCF 2. CA-NA: Strong revenue growth Segment profitability 3. CA-ROW: Start-up phase Focusing on signing airlines and investing for growth (CHART) BA Segment Profit Margin (% of Revenue) (CHART) CA-NA Segment Profit Margin (% of Revenue)
|
|
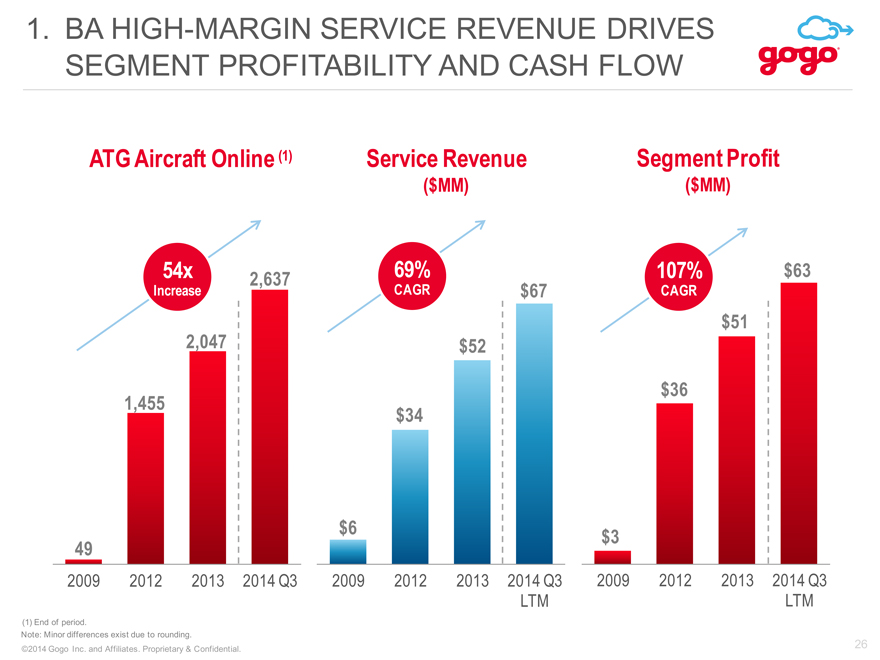
26 1. BA HIGH-MARGIN SERVICE REVENUE DRIVES SEGMENT PROFITABILITY AND CASH FLOW (CHART) ATG Aircraft Online (1) Note: Minor differences exist due to rounding. (CHART) Service Revenue ($MM) (CHART) Segment Profit ($MM) (1) End of period. 54x Increase 107% CAGR 69% CAGR
|
|
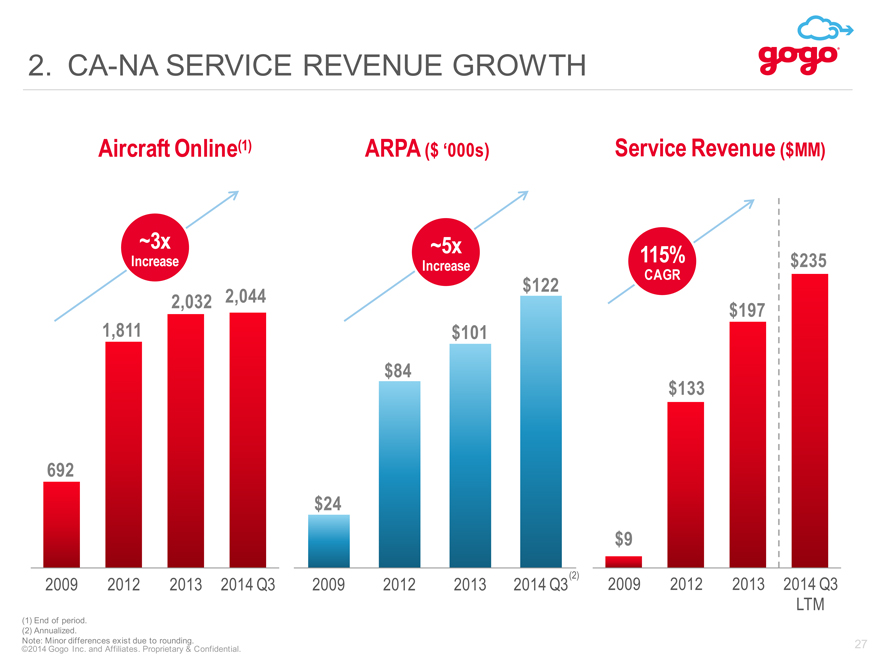
(CHART) 27 2. CA-NA SERVICE REVENUE GROWTH (CHART) Aircraft Online(1) ~3x Increase ARPA ($ ‘000s) (CHART) Service Revenue ($MM) ~5x Increase 115% CAGR (1) End of period. (2) Annualized. Note: Minor differences exist due to rounding. (2)
|
|
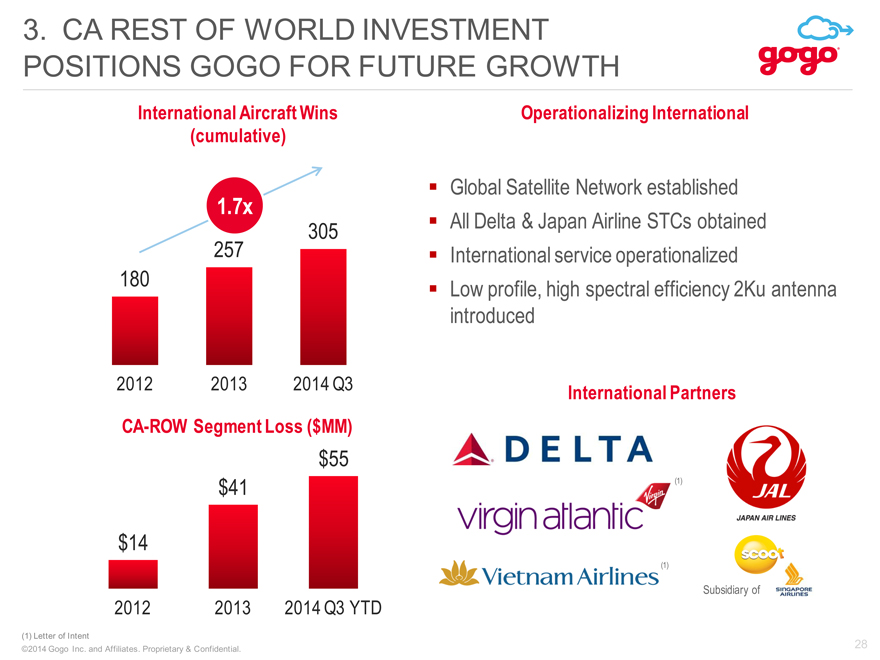
28 3. CA REST OF WORLD INVESTMENT POSITIONS GOGO FOR FUTURE GROWTH Global Satellite Network established All Delta & Japan Airline STCs obtained International service operationalized Low profile, high spectral efficiency 2Ku antenna introduced (CHART) Subsidiary of (1) (1) (1) Letter of Intent (CHART) International Aircraft Wins (cumulative) Operationalizing International CA-ROW Segment Loss ($MM) International Partners 1.7x
|
|
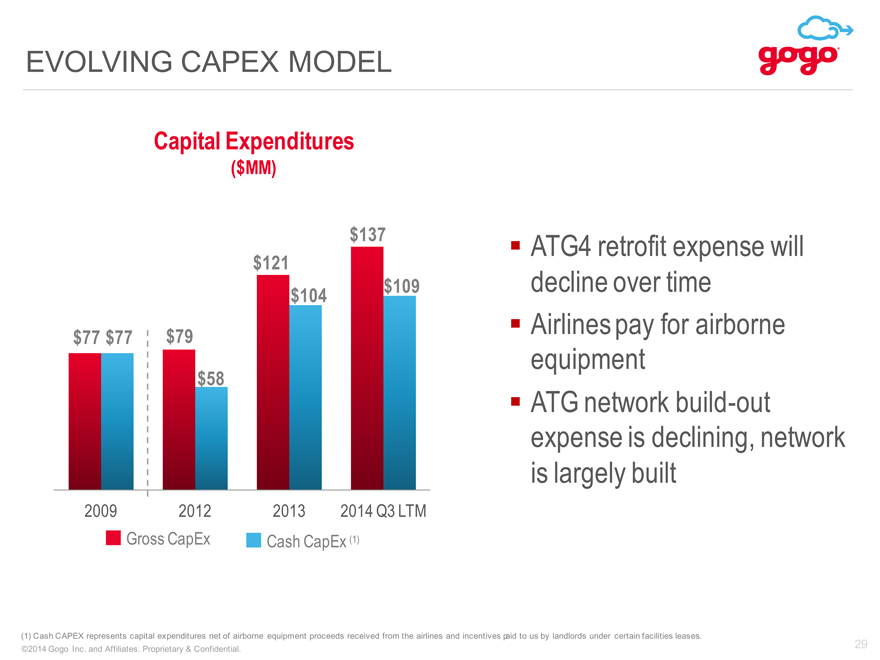
29 EVOLVING CAPEX MODEL (1) Cash CAPEX represents capital expenditures net of airborne equipment proceeds received from the airlines and incentives paid to us by landlords under certain facilities leases. Gross CapEx Cash CapEx (1) (CHART) Capital Expenditures ($MM) ATG4 retrofit expense will decline over time Airlines pay for airborne equipment ATG network build-out expense is declining, network is largely built
|
|
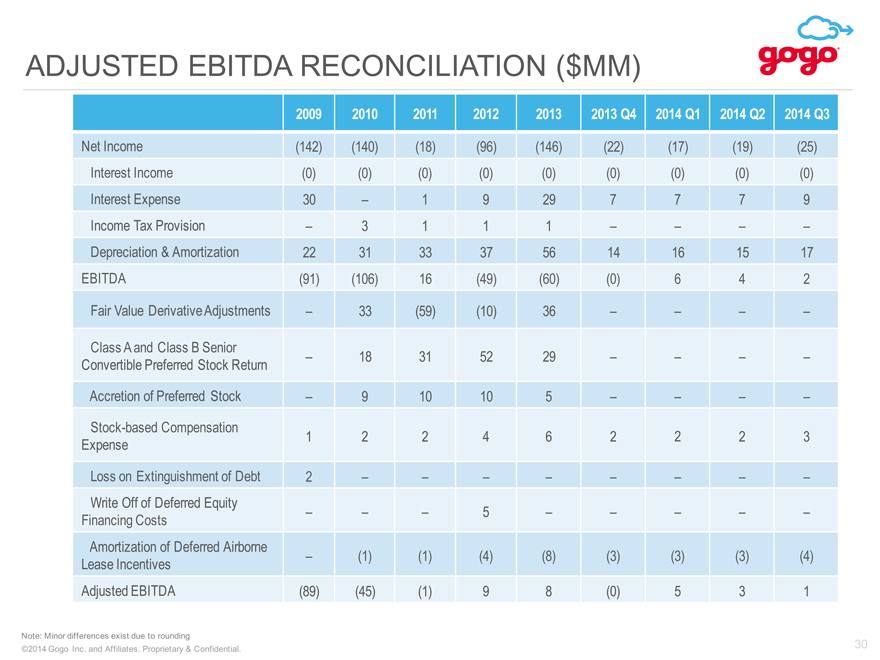
30 ADJUSTED EBITDA RECONCILIATION ($MM) 2009 2010 2011 2012 2013 2013 Q4 2014 Q1 2014 Q2 2014 Q3 Net Income (142) (140) (18) (96) (146) (22) (17) (19) (25) Interest Income (0) (0) (0) (0) (0) (0) (0) (0) (0) Interest Expense 30 – 1 9 29 7 7 7 9 Income Tax Provision – 3 1 1 1 – – – – Depreciation & Amortization 22 31 33 37 56 14 16 15 17 EBITDA (91) (106) 16 (49) (60) (0) 6 4 2 Fair Value Derivative Adjustments – 33 (59) (10) 36 – – – – Class A and Class B Senior Convertible Preferred Stock Return – 18 31 52 29 – – – – Accretion of Preferred Stock – 9 10 10 5 – – – – Stock-based Compensation Expense 1 2 2 4 6 2 2 2 3 Loss on Extinguishment of Debt 2 – – – – – – – – Write Off of Deferred Equity Financing Costs – – – 5 – – – – – Amortization of Deferred Airborne Lease Incentives – (1) (1) (4) (8) (3) (3) (3) (4) Adjusted EBITDA (89) (45) (1) 9 8 (0) 5 3 1 Note: Minor differences exist due to rounding
|
|
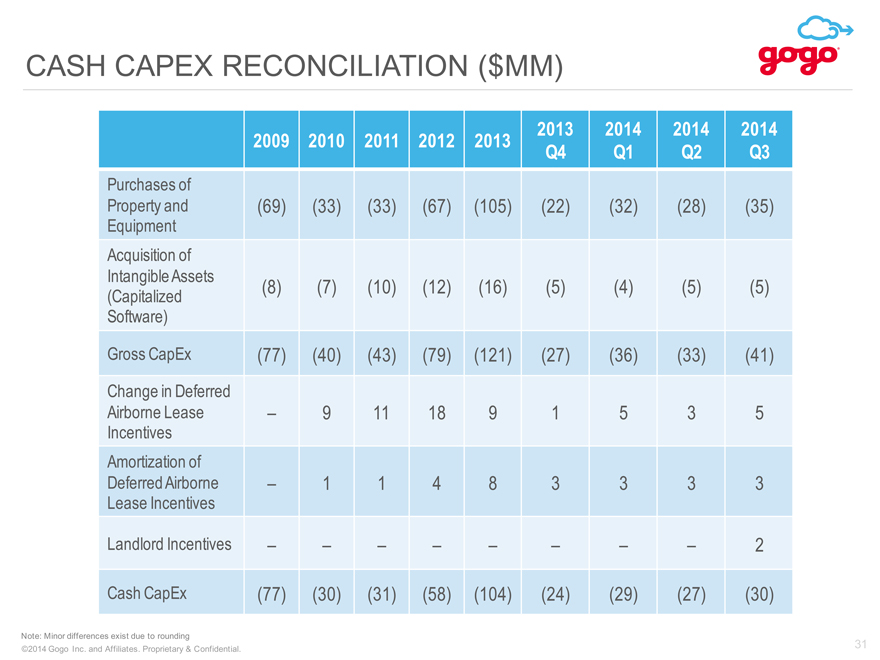
31 CASH CAPEX RECONCILIATION ($MM) 2009 2010 2011 2012 2013 2013Q4 2014 Q1 2014 Q2 2014 Q3 Purchases of Property and Equipment (69) (33) (33) (67) (105) (22) (32) (28) (35) Acquisition of Intangible Assets (Capitalized Software) (8) (7) (10) (12) (16) (5) (4) (5) (5) Gross CapEx (77) (40) (43) (79) (121) (27) (36) (33) (41) Change in Deferred Airborne Lease Incentives – 9 11 18 9 1 5 3 5 Amortization of Deferred Airborne Lease Incentives – 1 1 4 8 3 3 3 3 Landlord Incentives – – – – – – – – 2 Cash CapEx (77) (30) (31) (58) (104) (24) (29) (27) (30) Note: Minor differences exist due to rounding