Attached files
| file | filename |
|---|---|
| 8-K - FORM 8-K - PUBLIC SERVICE ENTERPRISE GROUP INC | d829385d8k.htm |
 Forward-Looking Statement
2
Certain of the matters discussed in this report about our and our subsidiaries'
future performance, including, without limitation, future revenues, earnings, strategies, prospects, consequences and
all other statements that are not purely historical constitute
“forward-looking statements” within the meaning of the Private Securities Litigation Reform Act of 1995. Such forward-looking
statements are subject to risks and uncertainties, which could cause actual
results to differ materially from those anticipated. Such statements are based on management's beliefs as well as
assumptions made by and information currently available to management. When
used herein, the words “anticipate,” “intend,” “estimate,” “believe,” “expect,” “plan,” “should,” “hypothetical,”
“potential,” “forecast,” “project,” variations of
such words and similar expressions are intended to identify forward-looking statements. Factors that may cause actual results to differ are often
presented with the forward-looking statements themselves. Other factors
that could cause actual results to differ materially from those contemplated in any forward-looking statements made by us
herein are discussed in filings we make with the United States Securities and
Exchange Commission (SEC), including our Annual Report on Form 10-K and subsequent reports on Form 10-Q and
Form 8-K and available on our website: http://www.pseg.com. These factors
include, but are not limited to: •
adverse changes in the demand for or the price of the capacity and energy that
we sell into wholesale electricity markets, •
adverse changes in energy industry law, policies and regulation, including
market structures and a potential shift away from competitive markets toward subsidized market
mechanisms, capacity market design, transmission planning and cost allocation
rules, including how transmission projects are planned and who is permitted to build transmission
in the future, and reliability standards,
•
any inability of our transmission and distribution businesses to obtain
adequate and timely rate relief and regulatory approvals from federal and state regulators,
•
changes in federal and state environmental regulations and enforcement that
could increase our costs or limit our operations, •
changes in nuclear regulation and/or general developments in the nuclear power
industry, including various impacts from any accidents or incidents experienced at our facilities or by
others in the industry, that
could limit operations of our nuclear generating units, •
actions or activities at one of our nuclear units located on a multi-unit
site that might adversely affect our ability to continue to operate that unit or other units located at the same site,
•
any inability to manage our energy obligations, available supply and risks,
•
adverse outcomes of any legal, regulatory or other proceeding, settlement,
investigation or claim applicable to us and/or the energy industry,
•
any deterioration in our credit quality or the credit quality of our
counterparties, •
availability of capital and credit at commercially reasonable terms and
conditions and our ability to meet cash needs, •
changes in the cost of, or interruption in the supply of, fuel and other
commodities necessary to the operation of our generating units, •
delays in receipt of necessary permits and approvals for our
construction and development activities, •
delays or unforeseen cost escalations in our construction and development
activities, •
any inability to achieve, or continue to sustain, our expected levels of
operating performance, •
any equipment failures, accidents, severe weather events or other incidents
that impact our ability to provide safe and reliable service to our customers, and any inability to obtain
sufficient insurance coverage
or recover proceeds of insurance with respect to such events, •
acts of terrorism, cybersecurity attacks or intrusions that could
adversely impact our businesses, •
increases in competition in energy supply markets as well as competition for
certain transmission projects, •
any inability to realize anticipated tax benefits or retain tax credits,
•
challenges associated with recruitment and/or retention of a qualified
workforce, •
adverse performance of our decommissioning and defined benefit plan trust fund
investments and changes in funding requirements, •
changes in technology, such as distributed generation and micro grids, and
greater reliance on these technologies, and •
changes in customer behaviors, including increases in energy efficiency,
net-metering and demand response. All of the forward-looking statements made in this report are qualified by
these cautionary statements and we cannot assure you that the results or developments anticipated by management will be
realized or even if realized, will have the expected consequences to, or
effects on, us or our business prospects, financial condition or results of operations. Readers are cautioned not to place
undue reliance on these forward-looking statements in making any investment
decision. Forward-looking statements made in this report apply only as of the date of this report. While we may elect
to update forward-looking statements from time to time, we specifically
disclaim any obligation to do so, even if internal estimates change, unless otherwise required by applicable securities laws.
The forward-looking statements contained in this report are intended to
qualify for the safe harbor provisions of Section 27A of the Securities Act of 1933, as amended, and Section 21E of the
Securities Exchange Act of 1934, as amended.
Exhibit 99 |
 GAAP Disclaimer
These materials and other financial releases can be found on the
pseg.com
website under the investor tab, or at http://investor.pseg.com/
PSEG presents Operating Earnings in addition to its Net Income reported in
accordance with accounting principles generally accepted in the United
States (GAAP). Operating Earnings is a non-GAAP financial measure
that differs from Net Income because it excludes gains or losses
associated with Nuclear Decommissioning Trust (NDT),
Mark-to-Market (MTM) accounting, and other material one-time
items. PSEG presents Operating Earnings because management believes that
it is appropriate for investors to consider results excluding these
items in addition to the results reported in accordance with GAAP. PSEG
believes that the non-GAAP financial measure of Operating Earnings
provides a consistent and comparable measure of performance of its
businesses to help shareholders understand performance trends. This
information is not
intended to be viewed as an alternative to GAAP information.
The last slides in this presentation include a list of items excluded from Net
Income to reconcile to Operating Earnings, with a reference to those
slides included on each of the slides where the non-GAAP information
appears. 3 |
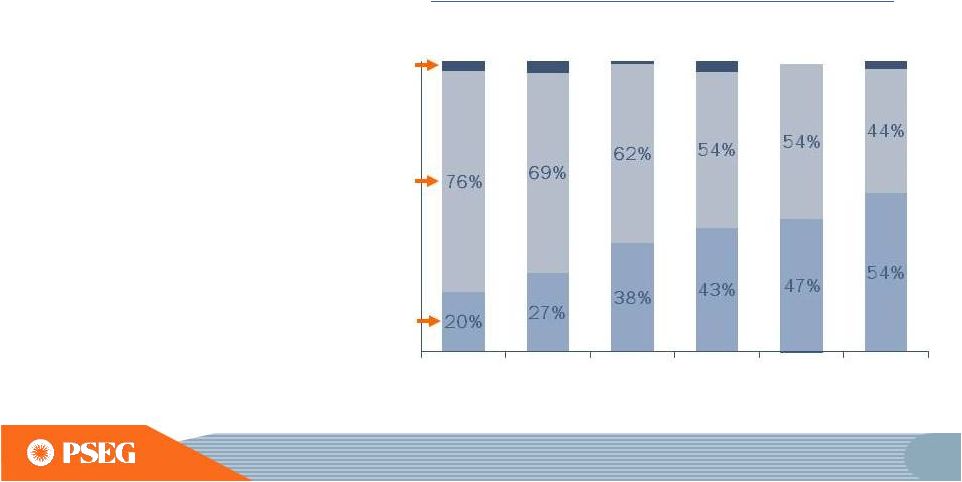 Operating Earnings Mix
Long term investment program has driven increased earnings
contribution from stable, regulated business
*SEE SLIDE A FOR ITEMS EXCLUDED FROM INCOME FROM
CONTINUING OPERATIONS/ NET INCOME TO RECONCILE TO OPERATING EARNINGS;
DISCONTINUED OPERATIONS REFLECT TEXAS. E=ESTIMATE ** 2014
PERCENTS USE MIDPOINT OF EARNINGS GUIDANCE. Power’s
diverse fuel mix
and dispatch flexibility
continues to generate
earnings and free cash flow
PSE&G’s
investment
in
transmission has
diversified its asset base
and, coupled with other
investments
and cost controls,
supported compound
annual earnings growth of
~18% over 2009 –
2013
Operating
Earnings*
Contribution
by
Subsidiary
(%)
PSE&G
Power
Other
$2.44
$2.58
$2.60 -
$2.75E
$3.12
$2.74
$3.09
8
2009
2010
2011
2012
2013
2014E** |
 PSEG –
Year to Date 2014 Highlights
Operating Earnings YTD up 9% to $2.27 per share from $2.09 for YTD 2013
PSE&G on track to record double-digit growth in earnings on expanded
capital investment program
PSEG Power expected to earn at upper level of expectations for the full year
Narrowed 2014 full–year, operating earnings guidance to
$2.60-$2.75 per share, from $2.55-$2.75 per share prior
Executing on our capital program
Replacement of PSE&G’s gas cast-iron pipe underway as part of $1.22
billion Energy Strong capital program
Major transmission projects under $6.8 billion capital program are
on-time and on-budget
Market developments
PJM proposed changes to its Reliability Price Mechanism, Demand Curve Adjustment
and pending Demand Response (DR) issues supportive of price formation
13 |
 SEE SLIDE A FOR ITEMS EXCLUDED FROM INCOME FROM CONTINUING
OPERATIONS/NET INCOME TO RECONCILE TO OPERATING
EARNINGS. E = ESTIMATE.
$2.44
$2.58
$2.60 -
$2.75E
2014 operating earnings guidance narrowed; forecast full-year at upper
end of range, assuming normal weather and unit operations for rest of
year PSEG –
2014 Another Year of Growth
14
2014 Guidance
2013
2012 |
 PSE&G’s 2014 operating earnings
to benefit from increased investment in transmission and
on-going cost control
42
PSE&G Operating Earnings*
($ Millions)
2012
2013
2014 Guidance
E=ESTIMATE
*SEE SLIDE A FOR ITEMS EXCLUDED FROM NET INCOME TO RECONCILE
TO OPERATING EARNINGS. |
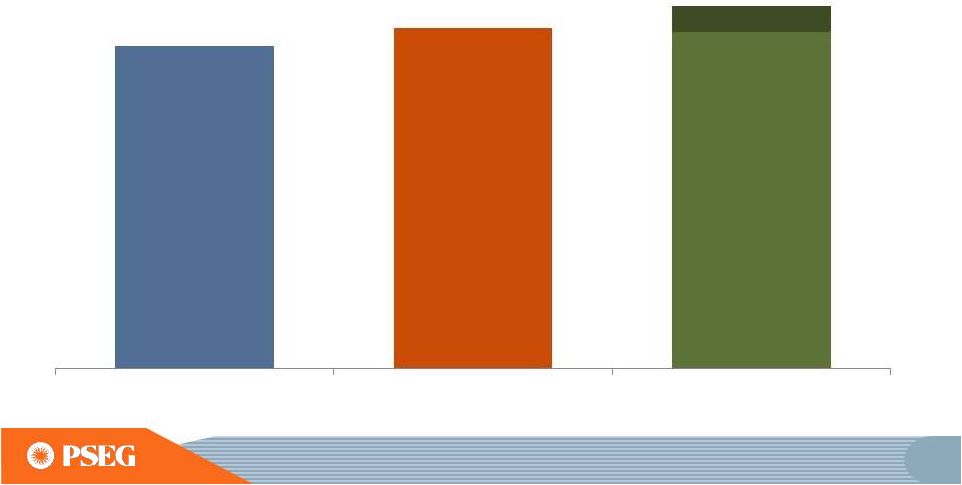
 Improving Operating Earnings
and increased contribution from PSE&G
PSEG Operating Earnings
$ Millions (except EPS)
2012
2013
2014E
PSE&G
$528
$612
$710 -
$745
PSEG Power
$663
$710
$575 -
$610
Enterprise/Other
$45
($13)
$35 -
$40
Operating Earnings*
$1,236
$1,309
$1,320 -
$1,395
Operating EPS*
$2.44
$2.58
$2.60 -
$2.75
Regulated % of Earnings
43%
47%
53% -
54%
*SEE SLIDE A FOR ITEMS EXCLUDED FROM INCOME FROM CONTINUING
OPERATIONS/NET INCOME TO RECONCILE TO OPERATING EARNINGS.
NOTE: 2012 OPERATING EARNINGS RE-STATED FOR TRANSFER OF ASSETS FROM PSEG
HOLDINGS TO PSEG POWER. E=ESTIMATE.
92 |
 Items
Excluded from Income from Continuing Operations/Net Income to Reconcile to
Operating Earnings PLEASE SEE PAGE 3 FOR AN EXPLANATION OF PSEG’S
USE OF OPERATING EARNINGS AS A NON-GAAP FINANCIAL MEASURE AND HOW IT
DIFFERS FROM NET INCOME.
2013
2012
2011
2010
2009
2008
Earnings Impact ($ Millions)
Operating Earnings
1,309
$
1,236
$
1,389
$
1,584
$
1,567
$
1,478
$
Gain (Loss) on Nuclear Decommissioning Trust (NDT)
Fund Related Activity (PSEG Power)
40
52
50
46
9
(71)
Gain (Loss) on Mark-to-Market (MTM) (PSEG Power)
(74)
(10)
107
(1)
(11)
14
Lease Transaction Activity (PSEG Enterprise/Other)
-
36
(173)
-
29
(490)
Storm O&M (PSEG Power)
(32)
(39)
-
-
-
-
Market Transition Charge Refund (PSE&G)
-
-
-
(72)
-
-
Gain (Loss) on Asset Sales and Impairments (PSEG Enterprise/Other)
-
-
34
-
-
(13)
Income from Continuing Operations
1,243
$
1,275
$
1,407
$
1,557
$
1,594
$
918
$
Discontinued Operations
-
-
96
7
(2)
270
Net Income
1,243
$
1,275
$
1,503
$
1,564
$
1,592
$
1,188
$
Fully Diluted Average Shares Outstanding (in Millions)
508
507
507
507
507
508
Per Share Impact (Diluted)
Operating Earnings
2.58
$
2.44
$
2.74
$
3.12
$
3.09
$
2.91
$
Gain (Loss) on NDT Fund Related Activity (PSEG Power)
0.08
0.10
0.10
0.09
0.02
(0.14)
Gain (Loss) on MTM (PSEG Power)
(0.14)
(0.02)
0.21
-
(0.02)
0.03
Lease Transaction Activity (PSEG Enterprise/Other)
-
0.07
(0.34)
-
0.05
(0.96)
Storm O&M (PSEG Power)
(0.07)
(0.08)
-
-
-
-
Market Transition Charge Refund (PSE&G)
-
-
-
(0.14)
-
-
Gain (Loss) on Asset Sales and Impairments (PSEG Enterprise/Other)
-
-
0.06
-
-
(0.03)
Income from Continuing Operations
2.45
$
2.51
$
2.77
$
3.07
$
3.14
$
1.81
$
Discontinued Operations
-
-
0.19
0.01
-
0.53
Net Income
2.45
$
2.51
$
2.96
$
3.08
$
3.14
$
2.34
$
For the Year Ended
December 31,
(Unaudited)
Reconciling Items, net of tax
(a)
Includes the financial impact from positions with forward delivery
months. A
(a)
(a)
PUBLIC SERVICE ENTERPRISE GROUP INCORPORATED |