Attached files
| file | filename |
|---|---|
| EX-23.1 - EX-23.1 - Enova International, Inc. | d810177dex231.htm |
| EX-5.1 - EX-5.1 - Enova International, Inc. | d810177dex51.htm |
Table of Contents
As filed with the Securities and Exchange Commission on December 4, 2014
Registration No. 333-199733
UNITED STATES
SECURITIES AND EXCHANGE COMMISSION
Washington, D.C. 20549
AMENDMENT NO. 1 to
FORM S-1
REGISTRATION STATEMENT
UNDER
THE SECURITIES ACT OF 1933
ENOVA INTERNATIONAL, INC.
(Exact Name of Registrant as Specified in its Charter)
| Delaware | 6141 | 45-3190813 | ||
| (State or Other Jurisdiction of Incorporation or Organization) |
(Primary Standard Industrial Classification Code Number) |
(I.R.S. Employer Identification Number) |
200 West Jackson Blvd.
Chicago, Illinois 60606
(312) 568-4200
(Address, including zip code and telephone number, including area code, of registrant’s principal executive offices)
David A. Fisher
President and Chief Executive Officer
200 West Jackson Blvd.
Chicago, Illinois 60606
(312) 568-4200
(Name, address, including zip code and telephone number, including area code, of agent for service)
Copies to:
L. Steven Leshin
Hunton & Williams LLP
1445 Ross Avenue, Suite 3700
Dallas, Texas 75202
(214) 979-3000
Approximate date of commencement of proposed sale to the public: As soon as practicable after this registration statement becomes effective.
If any of the securities being registered on this Form are to be offered on a delayed or continuous basis pursuant to Rule 415 under the Securities Act of 1933, as amended, check the following box. x
If this Form is filed to register additional securities for an offering pursuant to Rule 462(b) under the Securities Act, check the following box and list the Securities Act registration statement number of the earlier effective registration statement for the same offering. ¨
If this Form is a post-effective amendment filed pursuant to Rule 462(c) under the Securities Act, check the following box and list the Securities Act registration statement number of the earlier effective registration statement for the same offering. ¨
If this Form is a post-effective amendment filed pursuant to Rule 462(d) under the Securities Act, check the following box and list the Securities Act registration statement number of the earlier effective registration statement for the same offering. ¨
Indicate by check mark whether the registrant is a large accelerated filer, an accelerated filer, a non-accelerated filer, or a smaller reporting company. See the definitions of “large accelerated filer,” “accelerated filer,” “non-accelerated filer,” or “smaller reporting company” in Rule 12b-2 of the Exchange Act.
| Large accelerated filer | ¨ | Accelerated filer | ¨ | |||
| Non-accelerated filer | x (do not check if a smaller reporting company) | Smaller reporting company | ¨ | |||
The Registrant hereby amends this Registration Statement on such date or dates as may be necessary to delay its effective date until the Registrant shall file a further amendment which specifically states that this Registration Statement shall thereafter become effective in accordance with Section 8(a) of the Securities Act of 1933, or until the Registration Statement shall become effective on such date as the Commission, acting pursuant to said Section 8(a), may determine.
Table of Contents
The information in this prospectus is not complete and may be changed. These securities may not be sold until the registration statement filed with the Securities and Exchange Commission is effective. This prospectus is not an offer to sell and it is not soliciting an offer to buy these securities in any jurisdiction where the offer or sale is not permitted.
| PRELIMINARY PROSPECTUS | Subject to Completion | December 4, 2014 |
PROSPECTUS
6,596,926 Shares
Enova International, Inc.

Common Stock, Par Value $0.00001 Per Share
This prospectus relates to the offer and sale from time to time of 6,596,926 shares of common stock, $0.00001 par value, of Enova International, Inc., or Enova, currently held by Cash America International, Inc., or Cash America, the selling stockholder. Cash America will receive all of the net proceeds from the sale of the shares of common stock offered hereby. We will not receive any of the proceeds from the sale of the shares of our common stock being sold by Cash America. The 6,596,926 shares of our common stock as to which this prospectus relates includes up to 685,087 of these shares of our common stock which may be delivered by Cash America to holders of certain outstanding unvested restricted stock units, or RSUs, vested deferred RSUs, and unvested deferred RSUs which were granted by Cash America to certain of Cash America’s officers, directors and employees and certain deferred shares payable to Cash America’s directors relating to Cash America common stock under Cash America’s long-term incentive plans. Such RSU awards and deferred shares will be payable by Cash America in both shares of Cash America common stock and our common stock, subject to the terms of Cash America’s long-term incentive plans and the applicable award agreement, as described in the section entitled “Description of Cash America Long-Term Incentive Plan Shares and Awards.”
On November 13, 2014, we were spun off from Cash America through a distribution to its shareholders of 80 percent of the outstanding shares of Enova common stock.
Cash America may sell the shares of common stock covered by this prospectus from time to time in a number of different ways and at varying prices. We provide more information about how Cash America may sell the shares, or deliver shares pursuant to Cash America’s long-term incentive plans, in the section entitled “Plan of Distribution” beginning on page 189.
Enova’s common stock is listed on the New York Stock Exchange under the symbol “ENVA.” On December 1, 2014, the last reported sale price of our common stock on the New York Stock Exchange was $22.70 per share.
In reviewing this prospectus, you should carefully consider the matters described under the caption “Risk Factors” beginning on page 15 of this prospectus.
Neither the Securities and Exchange Commission nor any state securities commission has approved or disapproved of these securities or determined if this prospectus is truthful or complete. Any representation to the contrary is a criminal offense.
This prospectus does not constitute an offer to sell or the solicitation of an offer to buy any securities.
The date of this prospectus is , 2014
Table of Contents
| Headings |
Page | |||
| ii | ||||
| 1 | ||||
| 11 | ||||
| SUMMARY HISTORICAL AND PRO FORMA CONDENSED CONSOLIDATED FINANCIAL DATA |
12 | |||
| 15 | ||||
| 50 | ||||
| 52 | ||||
| 59 | ||||
| 60 | ||||
| 61 | ||||
| 62 | ||||
| 63 | ||||
| 66 | ||||
| MANAGEMENT’S DISCUSSION AND ANALYSIS OF FINANCIAL CONDITION AND RESULTS OF OPERATIONS |
69 | |||
| 115 | ||||
| 128 | ||||
| 136 | ||||
| 146 | ||||
| 147 | ||||
| SECURITY OWNERSHIP OF CERTAIN BENEFICIAL OWNERS AND MANAGEMENT |
187 | |||
| 189 | ||||
| DESCRIPTION OF CASH AMERICA LONG-TERM INCENTIVE PLAN SHARES AND AWARDS |
192 | |||
| 193 | ||||
| 196 | ||||
| 197 | ||||
| 199 | ||||
| 204 | ||||
| 205 | ||||
| 206 | ||||
| F-1 | ||||
i
Table of Contents
NOTE REGARDING THE USE OF CERTAIN TERMS
We use the following terms throughout this prospectus to refer to the items indicated:
| • | The term “Adjusted EBITDA” means our net income excluding depreciation, amortization, interest, foreign currency transaction gains or losses, taxes and certain other expense items. Adjusted EBITDA is a financial measure that is not in conformity with generally accepted accounting principles in the United States, or GAAP, which we refer to as non-GAAP financial information. See “Selected Historical Financial and Other Data” for a reconciliation of Adjusted EBITDA, a non-GAAP measure, to Net Income for the years ended December 31, 2009, 2010, 2011, 2012 and 2013 and for the nine months ended September 30, 2013 and 2014, and “Summary Historical and Pro Forma Condensed Consolidated Financial Data” for a reconciliation of Adjusted EBITDA to Net Income for the LTM Period (as defined below). Enova management believes Adjusted EBITDA is used by investors to analyze operating performance and evaluate our ability to incur and service debt and our capacity for making capital expenditures. Adjusted EBITDA is also useful to investors to help assess our estimated enterprise value. In addition, management believes that the adjustments for certain expense items are useful to investors to allow them to compare our financial results during the periods presented without the effect of those expense items. The computation of Adjusted EBITDA as presented may differ from the computation of similarly-titled measures provided by other companies. |
| • | “Cash America” refers to Cash America International, Inc., a Texas corporation, and, where appropriate in context, to one or more of its subsidiaries or all of them together, including Enova prior to the distribution and excluding Enova after the distribution. |
| • | The term “distribution” refers to the distribution of 80 percent of the outstanding shares of Enova common stock on November 13, 2014 by Cash America to shareholders of Cash America as of the record date. |
| • | The term “distribution date” means the date on which the distribution occured. |
| • | The term “e-commerce business” or “e-commerce segment” refers to the operations of Cash America’s E-Commerce Division, which, prior to the distribution, was composed of Cash America’s domestic and international online lending channels through which it offered or arranged consumer loans. In connection with the preparation for the proposed initial public offering of Enova’s common stock in 2011 and 2012, which was abandoned, substantially all assets and liabilities related to the e-commerce business that were not previously held by Enova or its subsidiaries were transferred to Enova or its subsidiaries at that time. |
| • | “Enova” refers to Enova International, Inc., a Delaware corporation, and, where appropriate in context, to one or more of its subsidiaries or all of them taken together. |
| • | The term ‘‘LTM Period’’ means the last twelve-month period ended September 30, 2014. |
| • | The term “retail services business” refers to all of the operations of Cash America’s Retail Services Division, which is composed of domestic storefront locations that offer some or all of the following services: pawn loans, consumer loans, the purchase and sale of merchandise, check cashing and other ancillary products and services such as money orders, wire transfers, prepaid debit cards, tax filing services and auto insurance. Following the distribution, Cash America’s business consists solely of the retail services business, together with Cash America’s corporate operations. |
| • | The term “separation” refers to the separation of the e-commerce business from Cash America’s retail services business. |
| • | The term “transaction” means any transaction whereby a customer is provided credit, whether through direct funding of a loan originated by us, through a loan funded by an unaffiliated lender in connection with our credit services organization and credit access business programs and certain other relationships with third-party lenders that we arrange and guarantee, and includes new loans, renewals (where the customer agrees to pay the current finance charge on a loan for the right to make payment of |
ii
Table of Contents
| the outstanding principal balance of such loan at a later date plus an additional finance charge) and each advance on a line of credit; in some instances in the United Kingdom, customers agree to repay a new short-term consumer loan by making two or three finance charge payments with repayment of the amount loaned due with the last finance charge payment, and in these cases we consider the obligation to make the first payment as a new short term consumer loan and the obligation to make additional payments as renewals of that loan because the customer pays a finance charge when each payment is made, similar to a renewed loan. |
| • | “We,” “us,” “our” and “company,” unless the context requires otherwise, refer to Enova. |
| • | All references to $’s in this prospectus represent U.S. dollars, unless expressly stated otherwise (and foreign currencies have been converted to U.S. dollars as described in Note 2 to our consolidated financial statements for the year ended December 31, 2013 contained elsewhere herein). |
iii
Table of Contents
The following is a summary of material information discussed in this prospectus. This summary may not contain all the details concerning our business or the separation and distribution, the securities offered hereby or other information that may be important to you. To better understand the separation and distribution and Enova’s business and financial position, you should carefully review this entire prospectus.
Our Business
Company Overview
Enova is a leading provider of online financial services. In 2013, we extended approximately $2.6 billion in credit to borrowers. We currently offer or arrange loans to customers in 34 states in the United States and in the United Kingdom, Australia and Canada. In June 2014 and July 2014 we launched pilot programs in Brazil and China, respectively, where we have begun arranging loans for borrowers through a third party lender in each country. In addition, in late July 2014, we also introduced a pilot program for a new line of credit product in the United States to serve the needs of small businesses. We use our proprietary technology, analytics and customer service capabilities to quickly evaluate, underwrite and fund loans, allowing us to offer consumers credit when and how they want it. Our customers include the large and growing number of consumers who have bank accounts but use alternative financial services because of their limited access to more traditional consumer credit from banks, credit card companies and other lenders. We believe our customers highly value our services as an important component of their personal finances because our products are convenient, quick and often less expensive than other available alternatives.
We were an early entrant into online lending, launching our online business in 2004, and through September 30, 2014, we have completed over 30 million transactions and collected approximately nine terabytes of currently accessible consumer behavior data since launch, allowing us to better analyze and underwrite our specific customer base. We attribute the success of our business to our advanced and innovative technology systems, the proprietary analytical models we use to predict loan performance, our sophisticated customer acquisition programs, our dedication to customer service and our talented employees. We have developed a proprietary underwriting system based on data we have collected over our ten years of online lending experience. This system employs advanced risk analytics to decide whether to approve loan transactions, to structure the amount and terms of the loans we offer pursuant to jurisdiction-specific regulations and to provide customers with their funds quickly and efficiently. Our systems closely monitor loan collection and portfolio performance data that we use to continually refine the analytical models and statistical measures used in making our credit, marketing and collection decisions.
Our flexible and scalable technology platform allows us to process and complete customers’ transactions quickly and efficiently. In 2013, we processed approximately 4.9 million transactions, and we continue to grow our loan portfolio and increase the number of customers we serve through both desktop and mobile platforms. Our highly customizable technology platform allows us to efficiently develop and deploy new products to adapt to evolving regulatory requirements and consumer preference, and to enter new markets quickly.
We have significantly diversified our business over the past several years and currently offer or arrange multiple loan products in the United States, the United Kingdom, Australia, Canada, Brazil and China. The loan products that we offer or arrange include short-term loans, installment loans and line of credit accounts. We generated revenue and Adjusted EBITDA of $823.9 million and $222.5 million, respectively, for the LTM Period. In 2012, we launched a new product in the United States designed to serve near-prime customers and recently we introduced a similar product in the United Kingdom. In June 2014 and July 2014 we launched pilot programs in Brazil and China, respectively, where we have begun arranging loans for borrowers through a third party lender
1
Table of Contents
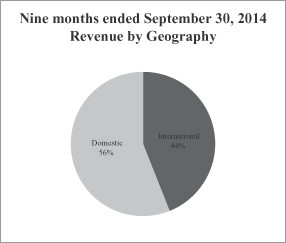
in each country. In addition, in late July 2014, we also introduced a pilot program for a new line of credit product in the United States to serve the needs of small businesses. These new products are intended to allow us to further diversify our product offerings, customer base and geographic scope. In 2013, we derived 51.7% of our total revenue from the United States and 48.3% of our total revenue internationally, with 97.4% of international revenue (representing 47.1% of our total revenue) generated in the United Kingdom. Our results from operations for the nine-month period ended September 30, 2014 and for the year ended December 31, 2013 do not include the full impact of changes and expected changes in our U.K. operations resulting from recent regulatory and legislative changes. As a result, such results are not indicative of our future results of operations and cash flow from our U.K. operations. See “Management’s Discussion and Analysis of Financial Condition and Results of Operations—Recent Regulatory Developments—Financial Conduct Authority” included elsewhere in this prospectus for a discussion of the changes in our U.K. operations and our expectations for our U.K. business going forward.
Our online loans provide customers with a deposit of funds to their bank account or debit card in exchange for a commitment to repay the amount deposited plus fees and/or interest. We originate, arrange, guarantee or purchase short-term consumer loans, installment loans and line of credit accounts.
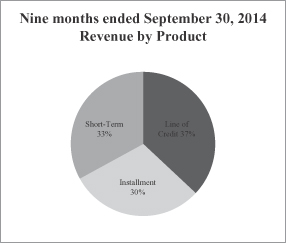
| • | Short-term consumer loans. We offer or arrange short-term, small-denomination consumer loans in 24 states in the United States, the United Kingdom and Canada. Short-term loans are unsecured short-term loans written by us or by a third-party lender through our credit services organization and credit access business programs, which we refer to as our CSO programs, that we arrange and guarantee. Short-term loans generally have terms of seven to 90 days, with proceeds promptly deposited in the customer’s bank account or on a debit card in exchange for a pre-authorized debit from their account. Our short-term consumer loans contributed approximately 32.6% of our total revenue for the nine months ended September 30, 2014, 50.9% in 2013, 69.6% in 2012 and 83.4% in 2011. |
| • | Installment loans. We offer or arrange, through our CSO programs, unsecured multi-payment installment loan products in the United Kingdom and Australia and in 15 states in the United States. In September 2014, we began arranging and guaranteeing installment loans written by a third-party lender through our CSO programs in one state in the United States. Generally, terms are between two and 12 months, but certain loans have available terms up to 60 months. Our installment loan products generally have higher principal amounts than short-term loans and are repaid in installments of both principal and interest over the term of the loan. These loans may be repaid early at any time with no prepayment charges. Our installment loans contributed approximately 30.1% of our total revenue for the nine months ended September 30, 2014, 26.6% in 2013, 19.1% in 2012 and 10.0% in 2011. |
| • | Line of credit accounts. We offer unsecured line of credit accounts in seven states in the United States and in the United Kingdom that allow customers to draw on the line of credit in increments of their choosing up to their credit limits. Customers may pay off their account balance in full at any time or make required minimum payments in accordance with the terms of the line of credit account. As long as the customer’s account is in good standing and has credit available, customers may continue to borrow on their line of credit. Our line of credit accounts contributed approximately 37.2% of our total revenue for the nine months ended September 30, 2014, 22.3% in 2013, 11.1% in 2012 and 6.4% in 2011. |
| • | Pilot Programs. In June 2014 and July 2014 we launched pilot programs in Brazil and China, respectively, where we have begun arranging loans for borrowers through a third party lender in each country as described below. In addition, in late July 2014, we also introduced a pilot program for a new line of credit product to serve the needs of small businesses, which is now offered in seven states in the United States and is included under “line of credit accounts.” |
2
Table of Contents
We currently provide our services in the following countries:
| • | United States. We began our online business in the United States in May 2004. As of the date of this prospectus, we provide services in 34 states under the names CashNetUSA at www.cashnetusa.com, NetCredit at www.netcredit.com and Headway Capital at www.headwaycapital.com. |
| • | United Kingdom. We provide our services in the United Kingdom under the names QuickQuid at www.quickquid.co.uk, QuickQuid FlexCredit at www.quickquidflexcredit.co.uk, Pounds to Pocket at www.poundstopocket.co.uk and OnStride Financial at www.onstride.co.uk. We began our QuickQuid short-term consumer loan business in July 2007, our Pounds to Pocket installment loan business in September 2010, our QuickQuid FlexCredit line of credit account business in March 2013 and our OnStride Financial near-prime installment loan business in April 2014. |
| • | Australia. We began providing services in Australia in May 2009, where we provide services under the name DollarsDirect at www.dollarsdirect.com.au. |
| • | Canada. We began providing services in Canada in October 2009. As of the date of this prospectus, we provide services in the provinces of Ontario, British Columbia, Alberta and Saskatchewan under the name DollarsDirect at www.dollarsdirect.ca. |
| • | Brazil. We launched a pilot program in Brazil on June 30, 2014, where we arrange loans for a third-party lender in accordance with applicable laws under the name Simplic at www.simplic.com.br. We also guarantee the payment of these loans by agreeing to purchase the loans from the third-party lender under certain circumstances. Our future plans for Brazil will largely depend on our results from this pilot program. |
| • | China. We launched a pilot program in China in late July 2014 where we have entered into a joint venture with a third party lender where the third party lender makes loans in accordance with applicable laws under the name YouXinYi at www.youxinyi.cn. Our future plans for China will largely depend on our results from this pilot program. |
We have achieved significant growth since we began our online business as we have expanded both our product offerings and the geographic markets we serve. This growth in product offerings and geographic markets has resulted in significant revenue diversification as set forth below:
|
|
3
Table of Contents
Our Industry
The Internet has transformed how consumers shop for and acquire products and services. According to International Data Corporation, global Internet usage increased 51% from 2009 to 2013, from 1.8 billion to 2.7 billion users, and is expected to increase an additional 33%, to 3.5 billion users, by 2017. As Internet accessibility has grown, a number of traditional financial services such as banking, bill payment and investing have become widely available online. A recent study by CFI Group found that approximately 82% of bank customers in a United States sample used their bank’s website at least once in the last 30 days. This level of use highlights the extent to which consumers now accept the Internet for conducting their financial transactions and are willing to entrust their financial information to online companies. Moreover, the CFI Group study suggests that bank customers are actually more likely to bank online than at a branch. We believe the increased acceptance of online financial services has led to an increased demand for online lending, the benefits of which include customer privacy, easy access, security, 24/7 availability, speed of funding and transparency of fees and interest.
We use the Internet to serve the large and growing number of underbanked consumers who have bank accounts but use alternative financial services because of their limited access to more traditional consumer credit from banks, credit card companies and other lenders. Demand from these consumers has been fueled by several demographic and socioeconomic trends, including an overall increase in the population and stagnant to declining growth in the household income for working-class individuals. The necessity for alternative financial services was highlighted by a 2011 report from The National Bureau of Economic Research, which found that half of the Americans surveyed reported that it is unlikely that they would be able to gather $2,000 to cover a financial emergency, even if given a month to obtain funds.
We believe that consumers seek online lending services for numerous reasons, including because they often:
| • | prefer the simplicity, transparency and convenience of these services; |
| • | require access to financial services outside of normal banking hours; |
| • | have an immediate need for cash for financial challenges and unexpected expenses; |
| • | have been unable to access certain traditional lending or other credit services; |
| • | seek an alternative to the high cost of bank overdraft fees, credit card and other late payment fees and utility late payment fees or disconnect and reconnection fees; and |
| • | wish to avoid potential negative credit consequences of missed payments with traditional creditors. |
Competitive Strengths
We believe that the following competitive strengths position us well for continued growth:
| • | Significant operating history and first mover advantage. As an early entrant in the online lending sector, we have accumulated approximately nine terabytes of currently accessible consumer behavior data from more than 30 million transactions during the past ten years. This database allows us to market to a customer base with an established borrowing history as well as to better evaluate and underwrite new customers, leading to better loan performance. In order to develop a comparable database, we believe that competitors would need to incur high marketing and customer acquisition costs, overcome consumer brand loyalties and have sufficient capital to withstand higher early losses associated with unseasoned loan portfolios. Additionally, we are licensed in all jurisdictions which require licensing and believe that it would be difficult and time consuming for a new entrant to obtain such licenses. We have also created strong brand recognition over our ten year operating history and we continue to invest in our brands, such as CashNetUSA, NetCredit, Pounds to Pocket, QuickQuid, DollarsDirect, QuickQuid FlexCredit, OnStride Financial, Headway Capital, Simplic and YouXinYi, to further increase our visibility. |
4
Table of Contents
| • | Proprietary analytics, data and underwriting. We have developed a fully integrated decision engine that evaluates and rapidly makes credit and other determinations throughout the customer relationship, including automated decisions regarding marketing, underwriting, customer contact and collections. Our decision engine currently handles more than 100 algorithms and over 1,000 variables. These algorithms are constantly monitored, validated, updated and optimized to continuously improve our operations. Our proprietary models are built on ten years of lending history, using advanced statistical methods that take into account our experience with the millions of transactions we have processed during that time and the use of data from multiple third-party sources. Since we designed our system specifically for our specialized products, we believe our system provides more predictive assessments of future loan behavior than traditional credit assessments, such as Fair Isaacs Corporation, or FICO, and therefore, results in better evaluation of our customer base. |
| • | Scalable and flexible technology platform. Our proprietary technology platform is designed to be powerful enough to handle the large volume of data required to evaluate customer applications and flexible enough to capitalize on changing customer preferences, market trends and regulatory requirements. This platform has enabled us to achieve significant growth over the last ten years as we have expanded both our product offerings and the geographic markets we serve. We began offering installment loans in the United States and United Kingdom in 2008 and 2010, respectively, and added line of credit products in the United States and United Kingdom in 2010 and 2013, respectively. We have experienced significant growth in these products, with revenue contribution from installment and line of credit products increasing from 11.7% of total revenue in 2010 to 48.9% of total revenue in 2013 and 67.3% of total revenue for the nine months ended September 30, 2014. Similarly, total revenue contribution from our international operations, primarily in the United Kingdom, has grown at a compound annual growth rate of 73.8%, from $40.5 million, or 15.9% of total revenue in 2009, to $369.8 million, or 48.3% of total revenue in 2013. Our results from operations for the nine-month period ended September 30, 2014 and for the year ended December 31, 2013 do not include the full impact of changes and expected changes in our U.K. operations resulting from recent regulatory and legislative changes. As a result, such results are not indicative of our future results of operations and cash flow from our U.K. operations. See “Management’s Discussion and Analysis of Financial Condition and Results of Operations—Recent Regulatory Developments—Financial Conduct Authority” included elsewhere in this prospectus for a discussion about our expectations for our U.K. business going forward. Due to the scalability of our platform, we were able to achieve this growth without significant investment in additional infrastructure, and over the past three years capital expenditures have averaged only 2.6% of revenue per year. We expect our advanced technology and underwriting platform to help continue to drive significant growth in our business. |
| • | Focus on consumer experience. We believe that alternative credit consumers are not adequately served by traditional lenders. To better serve these consumers, we use customer-focused business practices, including 24/7 customer service by phone, email, fax and web chat. We continuously work to improve customer satisfaction by evaluating information from website analytics, customer surveys, call center feedback and focus groups. Our call center teams receive training on a regular basis and are monitored by quality assurance managers. We believe customers who wish to access credit again often return to us because of our dedication to customer service, the transparency of our fees and interest charges and our adherence to trade association “best practices.” |
| • | Diligent regulatory compliance. We conduct our business in a highly regulated industry. We are focused on regulatory compliance and have devoted significant resources to comply with laws that apply to us, while we believe many of our online competitors have not. We tailor our lending products and services to comply with the specific requirements of each of the jurisdictions in which we operate, including laws and regulations relating to fees, loan durations and renewals or extensions, loan amounts, disclosures and underwriting requirements. Our compliance experience and proprietary technology platform allow us to launch new products and to enter new geographic regions with a focus |
5
Table of Contents
| on compliance with applicable laws and customer protection. We are members of industry trade groups, including the Online Lenders Alliance in the United States and the Consumer Finance Association in the United Kingdom, which have promulgated “best practices” for our industry that we have adopted. The flexibility of our online platform enables us to rapidly adapt our products as necessary to comply with changes in regulation, without the need for costly and time consuming retraining of store-based employees and other expenses faced by our storefront competitors. |
| • | Proven history of growth and profitability. Over the last five years, we grew our net consumer loans, which are the gross outstanding balances for our consumer loans carried in the consolidated balance sheets net of the allowance for estimated loan losses, at a compound annual growth rate of 49.5%, from $60.8 million as of December 31, 2009 to $303.5 million as of December 31, 2013. Over the same period, our revenue grew at a compound annual growth rate of 31.6%, from $255.0 million in 2009 to $765.3 million in 2013, while Adjusted EBITDA grew at a compound annual growth rate of 36.3%, from $47.0 million to $162.2 million. Adjusted EBITDA has further improved to $222.5 million during the LTM Period. Adjusted EBITDA margin has likewise improved, increasing over 800 basis points from 18.4% of revenue in 2009 to 27.0% of revenue for the LTM Period. Our results from operations for the nine-month period ended September 30, 2014 and for the year ended December 31, 2013 do not include the full impact of changes and expected changes in our U.K. operations resulting from recent regulatory and legislative changes. As a result, such results are not indicative of our future results of operations and cash flow from our U.K. operations. See “Management’s Discussion and Analysis of Financial Condition and Results of Operations—Recent Regulatory Developments—Financial Conduct Authority” included elsewhere in this prospectus for a discussion about our expectations for our U.K. business going forward. |
| • | Talented, highly educated employees. We believe we have one of the most skilled and talented teams of professionals in the industry. Our employees have exceptional educational backgrounds, with numerous post-graduate and undergraduate degrees in science, technology, engineering and mathematics fields. We hire and develop top talent from graduate and undergraduate programs at institutions such as Carnegie Mellon University, Northwestern University and the University of Chicago. The extensive education of our team is complemented by the experience our leadership team obtained at leading technology firms and financial services companies such as Intel, optionsXpress, First American Bank and JPMorgan Chase. |
Growth Strategy
| • | Increase penetration in existing markets through direct marketing. We believe that we have reached only a small number of the potential customers for our products and services in the markets in which we currently operate. We continue to focus on our direct customer acquisition channels, with direct marketing (traditional and digital) generating more than 52% of our new customer transactions in 2013, as compared to 32% in 2009. We believe these channels will ultimately allow us to reach a larger customer base at a lower acquisition cost than the traditional online lead purchasing model. Additionally, as our smaller and less sophisticated competitors, both online and storefront, struggle to adapt to both regulatory developments and evolving consumer preference, we believe we have the opportunity to gain significant market share. |
| • | Expand globally to reach new markets. We are building on our global reach by entering new markets, particularly in Latin America and Asia. In June 2014 and July 2014 we launched pilot programs in Brazil and China, respectively, where we have begun arranging loans for borrowers through a third party lender in each country. We believe that these countries have significant populations of underserved consumers. When pursuing geographic expansion, factors we consider include, among others, whether there is (i) widespread Internet usage, (ii) an established and interconnected banking system and (iii) government policy that promotes the extension of credit. Our recent launches in Brazil |
6
Table of Contents
| and China, as well as our launches into the United Kingdom in 2007 and Australia and Canada in 2009, demonstrate that we can quickly and efficiently enter new markets. Our revenue from international operations has increased from $1.6 million in 2007, or 0.9% of our total revenue, to $369.8 million in 2013, or 48.3% of our total revenue. Our results from operations for the nine-month period ended September 30, 2014 and for the year ended December 31, 2013 do not include the full impact of changes and expected changes in our U.K. operations resulting from recent regulatory and legislative changes. As a result, such results are not indicative of our future results of operations and cash flow from our U.K. operations. See “Management’s Discussion and Analysis of Financial Condition and Results of Operations—Recent Regulatory Developments—Financial Conduct Authority” included elsewhere in this prospectus for a discussion about our expectations for our U.K. business going forward. |
| • | Introduce new products and services. We plan to attract new categories of consumers not served by traditional lenders through the introduction of new products and services. We have introduced new products to expand our businesses from solely single-payment consumer loans to installment loans and line of credit accounts, using our analytics expertise and our flexible and scalable technology platform. In 2012, we launched NetCredit, a longer duration installment loan product for near-prime consumers in the United States, and we launched OnStride Financial, a similar near-prime product, in the United Kingdom in April 2014. In late July 2014 we launched Headway Capital, a pilot program for a new line of credit product in the United States that serves the needs of small businesses. In addition, we intend to continue to evaluate and offer new products and services that complement our online specialty financial services in order to meet the growing needs of our consumers, both in the United States and internationally. |
Credit Agreement and Financing
Our outstanding indebtedness consists of:
| • | an unsecured revolving line of credit in an aggregate principal amount of up to $75 million, or the revolving line of credit; and |
| • | $500 million in aggregate principal amount of 9.75% Senior Notes due 2021, or the Notes. |
We entered into our Credit Agreement for our revolving line of credit on May 14, 2014, or the Credit Agreement. Our Credit Agreement allows us to borrow, repay and re-borrow funds up to an aggregate principal amount of $75 million and also includes a $20 million sub-limit for commercial and standby letters of credit. Our Credit Agreement will mature on June 30, 2017. The revolving line of credit under the Credit Agreement was undrawn as of September 30, 2014, but had outstanding standby letters of credit of $3.0 million.
On May 30, 2014, we issued and sold the Notes. The Notes bear interest at a rate of 9.75% and were sold at a discount of the principal amount thereof to yield 10.0% to maturity. The Notes were sold to qualified institutional buyers in accordance with Rule 144A under the Securities Act of 1933, as amended, or the Securities Act, and outside the United States pursuant to Regulation S under the Securities Act. We used all of the net proceeds of the Notes offering to repay all of our intercompany indebtedness due to Cash America, which was $361.4 million as of May 30, 2014, and the remaining net proceeds were used to pay a significant portion of a dividend to Cash America on May 30, 2014. See “Certain Relationships and Related-Party Transactions—Historical Relationship with Cash America” for additional information regarding our relationship with Cash America and the dividend paid to Cash America on May 30, 2014.
See “Financing Arrangements” for additional information regarding our outstanding indebtedness.
7
Table of Contents
Recent Developments—Developments in Our Business in the United Kingdom
During the nine-month periods ended September 30, 2014 and September 30, 2013 and the twelve-month period ended December 31, 2013, our U.K. operations generated 42.8%, 47.7% and 47.1%, respectively, of our consolidated total revenue. Recent regulatory changes in the United Kingdom will significantly affect future results from our U.K. operations as described below.
In the United Kingdom, supervision of consumer credit was transferred on April 1, 2014 to the Financial Conduct Authority, or the FCA, and pursuant to new legislation, the FCA is authorized to adopt prescriptive rules and regulations. On February 28, 2014, the Consumer Credit Sourcebook was issued under the FCA Handbook and incorporates prescriptive regulations for lenders such as us, including mandatory affordability assessments on borrowers, limiting the number of rollovers to two, restricting how lenders can advertise, banning advertisements it deems misleading, and introducing a limit of two unsuccessful attempts on the use of continuous payment authority (which provides a creditor the ability to directly debit a customer’s account for payment when authorized by the customer to do so) to pay off a loan. We are in frequent communication with the FCA in an effort to demonstrate that we satisfy the expectations of the FCA, and we have made and are continuing to make significant modifications to many of our business practices to address the FCA’s requirements. These modifications included adjustments to our affordability assessment practices and underwriting standards that govern who will qualify for a loan from us, reductions in certain maximum loan amounts, alterations to advertising practices and adjustments to collections processes (including our practices related to continuous payment authority) and debt forbearance processes (or our practices regarding customers who have indicated they are experiencing financial difficulty). In addition, we previously have not had a physical presence in the United Kingdom as business functions have been performed remotely from our facilities in the United States. In order to alleviate concerns in relation to our ability to presently demonstrate to the FCA that we are capable of being effectively supervised, we have established an office in the United Kingdom.
In connection with implementing these changes to our U.K. business, we expect a significant year-over-year decrease in our U.K. loan volume, U.K. loan balances and U.K. revenue for the remainder of 2014 and into 2015 as a result of adapting our U.K. business practices in response to the requirements of the FCA. The implementation of stricter affordability assessments and underwriting standards will result in a decrease in the number of consumer loans written, the average consumer loan amount and the total amount of consumer loans written to new and returning customers. Additionally, we will experience an increase in compliance- and administrative-related costs for the United Kingdom, but the overall expenses of our U.K. business (including our cost of revenue) are expected to decrease as our U.K. business contracts. The ultimate impact of the changes we have made and are continuing to make to our U.K. operations will be dependent on a number of factors (some of which may be unforeseen), including the effectiveness of our execution of the operational changes, the impact the FCA’s requirements may have on our competitors that could result in a potential increase in our market share, and consumer reaction to the changes occurring to our services, among other things. The impact potentially could also be offset by an improved performance of our U.K. consumer loan portfolio as a result of stricter affordability assessments and underwriting standards being implemented, which is expected to result in lower consumer loan loss rates, and by continued strong demand for the online loan products we offer in the U.S. and other markets. We are still assessing the potential impact of the changes we have made and are continuing to make to our U.K. operations and what effect such changes may have on our business, but the impact of these changes is likely to be significant for the balance of 2014 and into 2015.
On July 15, 2014, the FCA issued a consultation paper that proposed a cap on the total cost of high-cost short-term credit and requested comments on the proposal. The consultation paper proposed a maximum rate of 0.8% of principal per day, and the proposal limits the total fees, interest (including post-default interest) and charges (including late fees which are capped at £15) to an aggregate amount not to exceed 100% of the principal amount loaned. The FCA requested comments on the proposal and issued its final rule on November 11, 2014. The final rule was largely the same as the proposed rule except for additional language governing line of credit products
8
Table of Contents
and will likely require us to make changes to all of our high-cost short-term products in the United Kingdom. We are still assessing the impact of the final rule and what additional changes to our products will be necessary. The final rule will become effective on January 2, 2015, as required by the 2013 amendment to the Financial Services and Markets Act 2000. It is possible that the rule change could have a significant effect on the results of our U.K. operations.
The results for the nine-month period ended September 30, 2014 do not include the full impact of the changes described above, and the results for the nine-month period ended September 30, 2013 and the twelve-month period ended December 31, 2013 do not include any impact of the changes described above. The results for each of these periods are not indicative of our future results of operations and cash flows from our operations in the United Kingdom. For recent developments related to the FCA, including concerns that have been expressed by the FCA regarding our compliance with U.K. legal and regulatory requirements, such as the requirement that our business be capable of being effectively supervised by the FCA given our location outside the United Kingdom and compliance with FCA rules and principles relating to affordability assessments and debt collection and forbearance processes, see “Risk Factors—Risks Related to Our Business and Industry—Our primary regulators in the United Kingdom have expressed and continue to express serious concerns about our compliance with applicable U.K. regulations, which has caused and will continue to cause us to make significant changes to our U.K. business that will negatively impact our operations and results, and this impact will likely be significant,” “—Due to restructuring of the consumer credit regulatory framework in the United Kingdom, we are required to obtain full authorization from our U.K. regulators to continue providing consumer credit and perform related activities in the United Kingdom, and there is no guarantee that we will receive full authorization to continue offering consumer loans in the United Kingdom” and “—The United Kingdom has imposed, and continues to impose, increased regulation of the short-term high-cost credit industry with the stated expectation that some firms will exit the market.”
The Separation and the Distribution
On April 10, 2014, Cash America announced that the Board of Directors of Cash America had authorized Cash America management to review potential strategic alternatives, including a tax-free spin-off, for the separation of Enova. On October 22, 2014, the Board of Directors of Cash America approved the distribution of approximately 80 percent of our issued and outstanding shares of common stock. On November 13, 2014, holders of Cash America common stock received 0.915 shares of Enova common stock for every one share of Cash America common stock held on November 3, 2013, the record date for the distribution, or the record date. Following the distribution, Cash America retained 20 percent of our common stock. Cash America will dispose of its retained shares of Enova (other than the shares retained for delivery under Cash America’s long-term incentive plans as described in this prospectus) as soon as practical consistent with the business reasons for the retention, but in no event later than two years after the distribution. The holders of outstanding unvested restricted stock units, or RSUs, vested deferred RSUs, unvested deferred RSUs and certain deferred shares payable by Cash America to Cash America’s directors relating to Cash America common stock under Cash America’s long-term incentive plans on the record date are entitled to receive, in addition to shares of Cash America, shares of Enova in the same ratio of the shareholders of Cash America with vesting and payment schedules consistent with the terms underlying the applicable Cash America equity awards. This prospectus covers up to 685,087 shares of our common stock from the 20% of our common stock that Cash America retained, representing approximately 2.08% of our outstanding shares, for delivery to holders of such awards or rights to deferred shares. See “Description of Cash America Long-Term Incentive Plan Shares and Awards” for additional information.
Our Post-Separation Relationship with Cash America
As part of the separation and the distribution, we entered into a Separation and Distribution Agreement and several other agreements with Cash America to effect the separation and to provide a framework for our relationship with Cash America after the separation and the distribution. These agreements provide for the
9
Table of Contents
allocation between us and Cash America of the assets, liabilities and obligations of Cash America and its subsidiaries, and govern various aspects of the relationship between us and Cash America subsequent to the separation, including with respect to transition services, registration rights, tax matters and other commercial relationships. In addition to the Separation and Distribution Agreement, which contains key provisions related to the separation and the distribution, these agreements include:
| • | Tax Matters Agreement; |
| • | Transition Services Agreement; |
| • | Stockholder’s and Registration Rights Agreement; and |
| • | Software Lease and Maintenance Agreement. |
Prior to the distribution, we and Cash America entered into a Stockholder’s and Registration Rights Agreement pursuant to which we agreed that, upon the request of Cash America, we will use our best efforts to effect the registration under applicable federal and state securities laws of the shares of our common stock retained by Cash America after the distribution. For additional information regarding the Separation and Distribution Agreement and other agreements, see the section entitled “Risk Factors—Risks Related to the Separation and the Distribution.”
Corporate Information
Enova was incorporated under the laws of the State of Delaware on September 7, 2011. On September 13, 2011, Cash America contributed to us all of the capital stock of the subsidiaries owned by it through which Cash America has engaged in its e-commerce business prior to the contribution in exchange for 33 million shares of our common stock. Our principal executive offices are located at 200 W. Jackson Blvd., Suite 2400, Chicago, Illinois 60606, and our telephone number is (312) 568-4200. Our corporate website is located at www.enova.com. The information contained on or accessible from our websites is not incorporated by reference into this prospectus, and you should not consider information on our websites as part of this prospectus.
10
Table of Contents
| Securities Offered |
6,596,926 shares of common stock |
| Selling Stockholder |
All of the shares of our common stock being registered in this offering are currently held by Cash America. |
| Use of Proceeds |
Cash America will receive all of the net proceeds from the sale of the shares of common stock offered hereby. We will not receive any of the proceeds from the sale of the shares of our common stock being sold by Cash America. |
| Listing |
Our common stock is listed on the New York Stock Exchange under the symbol “ENVA.” On December 1, 2014, the last reported sale price of our common stock on the New York Stock Exchange was $22.70 per share. |
11
Table of Contents
SUMMARY HISTORICAL AND PRO FORMA CONDENSED CONSOLIDATED FINANCIAL DATA
The following table presents our summary historical consolidated financial data for the periods indicated. The data as of December 31, 2013 and 2012 and for the years ended December 31, 2013, 2012 and 2011 have been derived from, and should be read together with, the consolidated financial statements for such years and accompanying notes thereto included elsewhere in this prospectus, which statements have been audited. The data as of and for the nine-month periods ended September 30, 2014 and 2013 have been derived from, and should be read together with, the unaudited interim consolidated financial statements that are included elsewhere in this prospectus and that, in our opinion, include all adjustments, consisting of normal, recurring adjustments, necessary for the fair presentation of such information. The data for the LTM Period was calculated by subtracting the unaudited data for the nine-month period ended September 30, 2013 from the data for the year ended December 31, 2013, and adding the unaudited data for the nine-month period ended September 30, 2014.
Our historical results are not necessarily indicative of future operating results. You should read the information set forth below in conjunction with “Selected Historical Financial and Other Data,” “Management’s Discussion and Analysis of Financial Condition and Results of Operations” and the historical consolidated financial statements for the year ended December 31, 2013 and the related notes included elsewhere in this prospectus.
| (In thousands, except per share) | ||||||||||||||||||||||||
| NINE MONTHS ENDED SEPTEMBER 30, |
LTM ENDED SEPTEMBER 30, 2014 |
YEAR ENDED DECEMBER 31, | ||||||||||||||||||||||
| 2014 | 2013 | 2013 | 2012 | 2011 | ||||||||||||||||||||
| (Unaudited) | (Unaudited) | (Unaudited) | ||||||||||||||||||||||
| Statement of Income Data: |
||||||||||||||||||||||||
| Revenue |
$ | 615,115 | $ | 556,553 | $ | 823,885 | $ | 765,323 | $ | 660,928 | $ | 480,340 | ||||||||||||
| Cost of Revenue |
206,195 | 228,547 | 292,700 | 315,052 | 288,474 | 201,687 | ||||||||||||||||||
|
|
|
|
|
|
|
|
|
|
|
|
|
|||||||||||||
| Gross Profit |
408,920 | 328,006 | 531,185 | 450,271 | 372,454 | 278,653 | ||||||||||||||||||
|
|
|
|
|
|
|
|
|
|
|
|
|
|||||||||||||
| Expenses |
||||||||||||||||||||||||
| Marketing |
92,699 | 94,592 | 133,443 | 135,336 | 108,810 | 73,329 | ||||||||||||||||||
| Operations and technology |
54,370 | 52,505 | 72,641 | 70,776 | 63,505 | 52,371 | ||||||||||||||||||
| General and administrative |
82,525 | 61,879 | 105,066 | 84,420 | 72,690 | 65,401 | ||||||||||||||||||
| Depreciation and amortization |
13,772 | 12,986 | 17,929 | 17,143 | 13,272 | 11,263 | ||||||||||||||||||
|
|
|
|
|
|
|
|
|
|
|
|
|
|||||||||||||
| Total Expenses |
243,366 | 221,962 | 329,079 | 307,675 | 258,277 | 202,364 | ||||||||||||||||||
|
|
|
|
|
|
|
|
|
|
|
|
|
|||||||||||||
| Income from Operations |
165,554 | 106,044 | 202,106 | 142,596 | 114,177 | 76,289 | ||||||||||||||||||
| Interest expense |
(25,201 | ) | (14,738 | ) | (30,251 | ) | (19,788 | ) | (20,996 | ) | (17,420 | ) | ||||||||||||
| Foreign currency transaction loss |
(555 | ) | (1,023 | ) | (708 | ) | (1,176 | ) | (342 | ) | (487 | ) | ||||||||||||
|
|
|
|
|
|
|
|
|
|
|
|
|
|||||||||||||
| Income before Income Taxes |
139,798 | 90,283 | 171,147 | 121,632 | 92,839 | 58,382 | ||||||||||||||||||
| Provision for income taxes |
50,629 | 31,959 | 62,264 | 43,594 | 33,967 | 21,350 | ||||||||||||||||||
|
|
|
|
|
|
|
|
|
|
|
|
|
|||||||||||||
| Net Income |
$ | 89,169 | $ | 58,324 | $ | 108,883 | $ | 78,038 | $ | 58,872 | $ | 37,032 | ||||||||||||
|
|
|
|
|
|
|
|
|
|
|
|
|
|||||||||||||
| Earnings Per Share: |
||||||||||||||||||||||||
| Earnings per common share, basic and diluted |
$ | 2.70 | $ | 1.77 | $ | 3.30 | $ | 2.36 | $ | 1.78 | $ | 1.12 | ||||||||||||
| Weighted average common shares outstanding, basic and diluted |
33,000 | 33,000 | 33,000 | 33,000 | 33,000 | 33,000 | ||||||||||||||||||
| Pro forma Statement of Income Data: (a) |
||||||||||||||||||||||||
| Pro forma net income |
$ | 80,111 | $ | 57,092 | ||||||||||||||||||||
| Pro forma earnings per share |
$ | 2.43 | $ | 1.73 | ||||||||||||||||||||
12
Table of Contents
| (In thousands, except per share) | ||||||||||||||||||||||||
| NINE MONTHS ENDED SEPTEMBER 30, |
LTM ENDED SEPTEMBER 30, 2014 |
YEAR ENDED DECEMBER 31, | ||||||||||||||||||||||
| 2014 | 2013 | 2013 | 2012 | 2011 | ||||||||||||||||||||
| (Unaudited) | (Unaudited) | (Unaudited) | ||||||||||||||||||||||
| Other Financial Data: |
||||||||||||||||||||||||
| Adjusted EBITDA (b) |
$ | 179,326 | $ | 119,030 | $ | 222,535 | $ | 162,239 | $ | 131,328 | $ | 87,552 | ||||||||||||
| Capital expenditures |
$ | 9,858 | $ | 11,544 | $ | 13,186 | $ | 14,872 | $ | 17,872 | $ | 15,073 | ||||||||||||
| Gross profit margin |
66.5 | % | 58.9 | % | 64.5 | % | 58.8 | % | 56.4 | % | 58.0 | % | ||||||||||||
| Adjusted EBITDA margin (b) |
29.2 | % | 21.4 | % | 27.0 | % | 21.2 | % | 19.9 | % | 18.2 | % | ||||||||||||
| Domestic revenue |
$ | 344,003 | $ | 284,132 | $ | 455,420 | $ | 395,549 | $ | 334,066 | $ | 254,752 | ||||||||||||
| International revenue |
$ | 271,112 | $ | 272,421 | $ | 368,465 | $ | 369,774 | $ | 326,862 | $ | 225,588 | ||||||||||||
| Number of employees (at period end) |
1,096 | 995 | 1,096 | 1,027 | 993 | 872 | ||||||||||||||||||
| Balance Sheet Data (at period end): |
||||||||||||||||||||||||
| Cash and cash equivalents (c) |
$ | 104,241 | $ | 61,381 | $ | 104,241 | $ | 47,480 | $ | 37,548 | $ | 34,411 | ||||||||||||
| Consumer loans, net (c) |
$ | 303,694 | $ | 272,001 | $ | 303,694 | $ | 303,467 | $ | 228,390 | $ | 162,985 | ||||||||||||
| Total assets (c) |
$ | 760,438 | $ | 676,847 | $ | 760,438 | $ | 692,152 | $ | 612,868 | $ | 529,740 | ||||||||||||
| Long-term debt (d) |
$ | 494,021 | $ | 437,397 | $ | 494,021 | $ | 424,133 | $ | 427,889 | $ | 410,964 | ||||||||||||
| Total stockholder’s equity (d) |
$ | 135,913 | $ | 151,804 | $ | 135,913 | $ | 173,048 | $ | 97,416 | $ | 41,849 | ||||||||||||
| Other Operating Data: |
||||||||||||||||||||||||
| Combined consumer loan balances, gross |
||||||||||||||||||||||||
| Short-term loans (e) |
$ | 86,211 | $ | 131,633 | $ | 86,211 | $ | 122,165 | $ | 194,679 | $ | 182,939 | ||||||||||||
| Installment loans |
194,636 | 162,944 | 194,636 | 179,230 | 121,570 | 60,213 | ||||||||||||||||||
| Line of credit accounts |
128,275 | 99,606 | 128,275 | 125,802 | 42,700 | 21,648 | ||||||||||||||||||
|
|
|
|
|
|
|
|
|
|
|
|
|
|||||||||||||
| Total combined consumer loan balances, gross (e) |
$ | 409,122 | $ | 394,183 | $ | 409,122 | $ | 427,197 | $ | 358,949 | $ | 264,800 | ||||||||||||
|
|
|
|
|
|
|
|
|
|
|
|
|
|||||||||||||
| (a) | Derived from our unaudited pro forma consolidated statements of income for the year ended December 31, 2013 and the nine months ended September 30, 2014, which are included elsewhere in the prospectus and gives effect to the issuance of the Notes and Credit Agreement and the resulting repayment of all of our intercompany indebtedness due to Cash America and the payment of a dividend to Cash America as if these transactions had occurred as of January 1, 2013 and 2014, respectively. See “Unaudited Pro Forma Consolidated Financial Statements.” |
| (b) | The table below shows a reconciliation of Adjusted EBITDA, a non-GAAP measure, to Net Income and Adjusted EBITDA as a percentage of total revenue, which is Adjusted EBITDA margin (dollars in thousands): |
| NINE MONTHS ENDED SEPTEMBER 30, |
LTM ENDED SEPTEMBER 30, 2014 |
YEAR ENDED DECEMBER 31, | ||||||||||||||||||||||
| 2014 | 2013 | 2013 | 2012 | 2011 | ||||||||||||||||||||
| (Unaudited) | (Unaudited) | (Unaudited) | ||||||||||||||||||||||
| Net income |
$ | 89,169 | $ | 58,324 | $ | 108,883 | $ | 78,038 | $ | 58,872 | $ | 37,032 | ||||||||||||
| Regulatory penalty (1) |
— | — | 2,500 | 2,500 | — | — | ||||||||||||||||||
| Withdrawn IPO (2) |
— | — | — | — | 3,879 | — | ||||||||||||||||||
| Interest expense, net |
25,201 | 14,738 | 30,251 | 19,788 | 20,996 | 17,420 | ||||||||||||||||||
| Provision for income taxes |
50,629 | 31,959 | 62,264 | 43,594 | 33,967 | 21,350 | ||||||||||||||||||
| Depreciation and amortization |
13,772 | 12,986 | 17,929 | 17,143 | 13,272 | 11,263 | ||||||||||||||||||
| Foreign currency transaction loss |
555 | 1,023 | 708 | 1,176 | 342 | 487 | ||||||||||||||||||
|
|
|
|
|
|
|
|
|
|
|
|
|
|||||||||||||
| Adjusted EBITDA |
$ | 179,326 | $ | 119,030 | $ | 222,535 | $ | 162,239 | $ | 131,328 | $ | 87,552 | ||||||||||||
|
|
|
|
|
|
|
|
|
|
|
|
|
|||||||||||||
| Revenue |
$ | 615,115 | $ | 556,553 | $ | 823,885 | $ | 765,323 | $ | 660,928 | $ | 480,340 | ||||||||||||
| Adjusted EBITDA |
$ | 179,326 | $ | 119,030 | $ | 222,535 | 162,239 | 131,328 | 87,552 | |||||||||||||||
|
|
|
|
|
|
|
|
|
|
|
|
|
|||||||||||||
| Adjusted EBITDA margin |
29.2 | % | 21.4 | % | 27.0 | % | 21.2 | % | 19.9 | % | 18.2 | % | ||||||||||||
|
|
|
|
|
|
|
|
|
|
|
|
|
|||||||||||||
13
Table of Contents
| (1) | On November 20, 2013, Cash America consented to the issuance of a Consent Order by the CFPB pursuant to which it agreed, without admitting or denying any of the facts or conclusions made by the CFPB from its 2012 review of Cash America and us, to pay a civil money penalty of $5 million, of which we and Cash America agreed to allocate $2.5 million of this penalty to us, or the Regulatory Penalty. For the year ended December 31, 2013, this figure represents the amount paid in connection with the Regulatory Penalty, which is nondeductible for tax purposes. |
| (2) | For the year ended December 31, 2012, this figure represents costs of $3.9 million, net of tax benefit of $1.5 million, related to our withdrawn Registration Statement in July 2012 in connection with efforts in pursuit of an initial public offering. |
| (c) | Cash and cash equivalents, Consumer loans, net, and Total assets as of December 31, 2011 were revised to correct the classification of cash and accounts payable and to correct for consumer loans that had not funded as of the balance sheet date. The correction resulted in a decrease in cash and cash equivalents of $3.7 million, a decrease in consumer loans, net of $1.0 million and a decrease in accounts payable and accrued expenses of $4.7 million as of December 31, 2011. Management determined that the impact on previously issued financial statements was immaterial; however, management determined it was appropriate to correct the presentation for the year ended December 31, 2011. |
| (d) | Long-term debt and total stockholder’s equity as of December 31, 2011 were revised to correct the classification of certain net equity transactions with Cash America. Management determined that the impact on previously issued financial statements was immaterial; however, management determined it was appropriate to correct the presentation herein. The correction resulted in increases of $0.1 million to long-term debt and $0.3 million to total stockholder’s equity as of December 31, 2011. |
| (e) | See “Management’s Discussion and Analysis of Financial Condition and Results of Operations—Non-GAAP Disclosure—Combined Consumer Loans” for additional information about combined consumer loans. The table below shows combined consumer loan balances, a non-GAAP measure, which is composed of Company-owned consumer loan balances as reported on our consolidated balance sheets and consumer loans originated by third party lenders through the CSO programs that are not included in our financial statements but are disclosures required by GAAP. The amounts in the table below reflect the revision amounts from (c) above (in thousands): |
| SEPTEMBER 30, | DECEMBER 31, | |||||||||||||||||||
| 2014 | 2013 | 2013 | 2012 | 2011 | ||||||||||||||||
| (Unaudited) | (Unaudited) | |||||||||||||||||||
| Short-term loan balances, gross: |
||||||||||||||||||||
| Company owned |
$ | 50,822 | $ | 96,505 | $ | 80,753 | $ | 146,472 | $ | 140,178 | ||||||||||
| Guaranteed by the Company |
35,389 | 35,128 | 41,412 | 48,207 | 42,761 | |||||||||||||||
|
|
|
|
|
|
|
|
|
|
|
|||||||||||
| Combined |
$ | 86,211 | $ | 131,633 | $ | 122,165 | $ | 194,679 | $ | 182,939 | ||||||||||
|
|
|
|
|
|
|
|
|
|
|
|||||||||||
| Total consumer loan balances, gross: |
||||||||||||||||||||
| Company owned |
$ | 373,693 | $ | 359,055 | $ | 385,785 | $ | 310,742 | $ | 222,039 | ||||||||||
| Guaranteed by the Company |
35,429 | 35,128 | 41,412 | 48,207 | 42,761 | |||||||||||||||
|
|
|
|
|
|
|
|
|
|
|
|||||||||||
| Combined |
$ | 409,122 | $ | 394,183 | $ | 427,197 | $ | 358,949 | $ | 264,800 | ||||||||||
|
|
|
|
|
|
|
|
|
|
|
|||||||||||
14
Table of Contents
You should carefully consider each of the following risks, together with all of the other information in this prospectus, in evaluating our common stock. Some of the following risks relate to the distribution of our common stock and this offering. Other risks relate to our business, our indebtedness, the securities markets and ownership of our common stock. Our business may also be adversely affected by risks and uncertainties not presently known to us or that we currently believe are immaterial. If any of the following risks and uncertainties develop into actual events, we could be materially and adversely affected. If this occurs, the trading price of our common stock could decline, and you may lose all or part of your investment.
Risks Related to Our Business and Industry
Our business is highly regulated, and if we fail to comply with applicable laws, regulations, rules and guidance, our business could be adversely affected.
Our products and services are subject to extensive regulation, supervision and licensing under various federal, state, local and foreign statutes, ordinances, regulations, rules and guidance. These requirements generally mandate licensing or authorization as a lender or as a credit services organization or credit access business, or CSO, establish limits on the amount, duration, renewals or extensions of and charges for (including interest rates and fees) various categories of loans, direct the form and content of our loan contracts and other documentation, restrict collection practices, outline underwriting requirements and subject us to periodic examination and ongoing supervision by regulatory authorities, among other things. Because short-term loans, installment loans and line of credit accounts, such as those provided by us, are viewed as extensions of credit in the United States, we must comply with certain federal laws, such as the federal Truth in Lending Act, or TILA, the Equal Credit Opportunity Act, the Fair Credit Reporting Act, the Electronic Funds Transfer Act, the Gramm-Leach-Bliley Act and Title X of the Dodd-Frank Wall Street Reform and Consumer Protection Act of 2010, or the Dodd-Frank Act, among other laws, and with respect to our CSO programs, the Fair Debt Collection Practices Act, as well as regulations adopted to implement those laws. In addition, our marketing and disclosure efforts and the representations made about our products and services are subject to unfair and deceptive practice statutes, including the Federal Trade Commission Act, the Telephone Consumer Protection Act and the CAN-SPAM Act of 2003 in the United States and analogous state statutes under which the Federal Trade Commission, or the FTC, the Consumer Financial Protection Bureau, or the CFPB, state attorneys general or private plaintiffs may bring legal actions.
We are also subject to various international laws, licensing or authorization requirements and disciplinary actions in connection with the products or services we offer in Australia, China, Brazil, Canada, and the United Kingdom, which are discussed below. Compliance with applicable laws, regulations, rules and guidance requires forms, processes, procedures, training, controls and the infrastructure to support these requirements. Compliance may also create operational constraints, be costly or adversely affect operating results. See “Regulation and Legal Proceedings” for further discussion of the laws applicable to us.
The regulatory environment in which we conduct our business is extensive and complex. From time to time we become aware of instances where our products and services have not fully complied with requirements under applicable laws and regulations or applicable contracts. Determinations of compliance with applicable requirements or contracts, such as those discussed above, can be highly technical and subject to varying interpretations. When we become aware of such an instance, whether as a result of our compliance reviews, regulator inquiry, customer complaint or otherwise, we generally conduct a review of the activity in question and determine how to address it, such as modifying the product, making customer refunds or providing additional disclosure. We also evaluate whether reports or other notices to regulators are required and provide notice to regulators whenever required. In some cases we have decided to take corrective action even after applicable statutory or regulatory cure periods, and in some cases we have notified regulators even where such notification
15
Table of Contents
may not have been required. Regulators reviewing such incidents may interpret the laws and regulations differently than we have, or may choose to take regulatory action against us notwithstanding the corrective measures we have taken. This may be the case even if we no longer offer the product or service in question.
State, federal and international regulators, as well as the plaintiffs’ bars, have subjected our industry to intense scrutiny in recent years. Failure to comply with applicable laws, regulations, rules and guidance, or any finding that our past forms, practices, processes, procedures, controls or infrastructure were insufficient or not in compliance, could subject us to regulatory enforcement actions, result in the assessment against us of civil, monetary, criminal or other penalties (some of which could be significant in the case of knowing or reckless violations), result in the issuance of cease and desist orders (which can include orders for restitution, as well as other kinds of affirmative relief), require us to refund interest or fees, result in a determination that certain loans are not collectible, result in a revocation of licenses or authorization to transact business, result in a finding that we have engaged in unfair and deceptive practices, limit our access to services provided by third-party financial institutions or cause damage to our reputation, brands and valued customer relationships.
Our failure to comply with any regulations, rules or guidance applicable to our business could have a material adverse effect on our business, prospects, results of operations, financial condition and cash flows and could prohibit or directly or indirectly impair our ability to continue current operations.
The consumer lending industry continues to be targeted by new laws or regulations in many jurisdictions that could restrict the short-term consumer lending products and services we offer, impose additional compliance costs on us, render our current operations unprofitable or even prohibit our current operations.
Governments at the national, state and local levels, as well as foreign governments, may seek to impose new laws, regulatory restrictions or licensing requirements that affect the products or services we offer, the terms on which we may offer them, and the disclosure, compliance and reporting obligations we must fulfill in connection with our business. They may also interpret or enforce existing requirements in new ways that could restrict our ability to continue our current methods of operation or to expand operations, impose significant additional compliance costs, and may have a negative effect on our business, prospects, results of operations, financial condition and cash flows. In some cases these measures could even directly prohibit some or all of our current business activities in certain jurisdictions, or render them unprofitable and/or impractical to continue.
In recent years, consumer loans, and in particular the category commonly referred to as “payday loans,” which includes certain of our short-term loan products, have come under increased regulatory scrutiny that has resulted in increasingly restrictive regulations and legislation that makes offering such loans in certain states in the United States or the foreign countries where we operate (as further described below) less profitable or unattractive. Laws or regulations in some states in the United States require that all borrowers of certain short-term loan products be reported to a centralized database and limit the number of loans a borrower may receive or have outstanding. Other laws limit the availability of some of our consumer loan products in the United States to active duty military personnel, active members of the National Guard or members on active reserve duty and their immediate dependents.
Certain consumer advocacy groups and federal and state legislators and regulators have advocated that laws and regulations should be tightened so as to severely limit, if not eliminate, the type of loan products and services we offer, and this has resulted in both the executive and legislative branches of the U.S. federal government and state governmental bodies exhibiting an interest in debating legislation that could further regulate consumer loan products and services such as those that we offer. The U.S. Congress, as well as other similar federal, state and local bodies and similar foreign governmental authorities, have debated, and may in the future adopt, legislation or regulations that could, among other things, place a cap on the interest or fees that we can charge or a cap on the effective annual percentage rate that limits the amount of interest or fees that may be charged, ban or limit loan renewals or extensions (where the customer agrees to pay the current finance charge on a loan for the right to make payment of the outstanding principal balance of such loan at a later date plus an additional finance
16
Table of Contents
charge), including the rates to be charged for loan renewals or extensions, require us to offer an extended payment plan, allow for only minimal origination fees for loans, require changes to our underwriting or collections practices, require short-term lenders to be bonded or require lenders to report consumer loan activity to databases designed to monitor or restrict consumer borrowing activity, impose “cooling off” periods between the time a loan is paid off and another loan is obtained or prohibit us from providing any of our consumer loan products in the United States to active duty military personnel, active members of the National Guard or members on active reserve duty and their immediate dependents.
Significant new laws and regulations have also been adopted in the United Kingdom, and further new laws and regulations will continue to be imposed. See “—The United Kingdom has imposed, and continues to impose, increased regulation of the short-term high-cost credit industry with the stated expectation that some firms will exit the market.”
We cannot currently assess the likelihood of any future unfavorable federal, state, local or foreign legislation or regulations being proposed or enacted that could affect our products and services. We closely monitor proposed legislation in jurisdictions where we offer consumer loan products. Additional legislative or regulatory provisions could be enacted that could severely restrict, prohibit or eliminate our ability to offer a consumer loan product. In addition, under statutory authority, U.S. state regulators have broad discretionary power and may impose new licensing requirements, interpret or enforce existing regulatory requirements in different ways or issue new administrative rules, even if not contained in state statutes, that could adversely affect the way we do business and may force us to terminate or modify our operations in particular states or affect our ability to obtain new licenses or renew the licenses we hold.
Furthermore, legislative or regulatory actions may be influenced by negative perceptions of us and our industry, even if such negative perceptions are inaccurate, attributable to conduct by third parties not affiliated with us (such as other industry members), or attributable to matters not specific to our industry.
Any of these or other legislative or regulatory actions that affect our consumer loan business at the national, state, foreign and local level could, if enacted or interpreted differently, have a material adverse impact on our business, prospects, results of operations, financial condition and cash flows and could prohibit or directly or indirectly impair our ability to continue current operations.
The Consumer Financial Protection Bureau has examination authority over our U.S. consumer lending business that could have a significant impact on our U.S. business.
In July 2010, the U.S. Congress passed the Dodd-Frank Act, and Title X of the Dodd-Frank Act created the CFPB, which regulates U.S. consumer financial products and services, including consumer loans offered by us. The CFPB has regulatory, supervisory and enforcement powers over providers of consumer financial products and services, such as us, including explicit supervisory authority to examine and require registration of such providers.
The CFPB has begun exercising supervisory review over and examining certain non-bank providers of consumer financial products and services, including providers of consumer loans such as us. The CFPB’s examination authority permits CFPB examiners to inspect the books and records of providers of short-term, small dollar lenders, such as us, and ask questions about their business practices, and the examination procedures include specific modules for examining marketing activities; loan application and origination activities; payment processing activities and sustained use by consumers; collections, accounts in default, and consumer reporting activities as well as third-party relationships. As a result of these examinations of non-bank providers of consumer credit, we could be required to change our practices or procedures, whether as a result of another party being examined or as a result of an examination of us, or we could be subject to monetary penalties, which could materially adversely affect us.
Furthermore, because the CFPB is a relatively new entity, its practices and procedures regarding examination, enforcement and other matters relevant to us and other CFPB-regulated entities are subject to further
17
Table of Contents
development and change. Where the CFPB holds powers previously assigned to other regulators, the CFPB may not continue to apply such powers or interpret relevant concepts consistent with previous regulators’ practice. This may adversely affect our ability to anticipate the CFPB’s expectations or interpretations in our interaction with the CFPB.
The CFPB also has broad authority to prohibit unfair, deceptive and abusive acts and practices and to investigate and penalize financial institutions that violate this prohibition. In addition to having the authority to obtain monetary penalties for violations of applicable federal consumer financial laws (including the CFPB’s own rules), the CFPB can require remediation of practices, pursue administrative proceedings or litigation and obtain cease and desist orders (which can include orders for restitution or rescission of contracts, as well as other kinds of affirmative relief). Also, where a company has violated Title X of the Dodd-Frank Act or CFPB regulations implemented thereunder, the Dodd-Frank Act empowers state attorneys general and state regulators to bring civil actions to remedy violations of state law. If the CFPB or one or more state attorneys general or state regulators believe that we have violated any of the applicable laws or regulations, they could exercise their enforcement powers in ways that could have a material adverse effect on our business, prospects, results of operations, financial condition and cash flows.
We are subject to a Consent Order issued by the Consumer Financial Protection Bureau, and any noncompliance would materially adversely affect our business.
On November 20, 2013, Cash America consented to the issuance of a Consent Order by the CFPB pursuant to which it agreed, without admitting or denying any of the facts or conclusions made by the CFPB from its 2012 review of Cash America and us, to pay a civil money penalty of $5 million. Cash America also agreed to set aside $8 million for a period of 180 days to fund any further payments to eligible Ohio customers in connection with Cash America’s program to reimburse certain Ohio customers in connection with legal collections proceedings initiated by Cash America, or the Ohio Reimbursement Program. The Consent Order also relates to issues self-disclosed to the CFPB during its 2012 examination of Cash America and us, including the making of a limited number of loans to consumers who may have been active duty members of the military at the time of the loan at rates in excess of the interest rate permitted by the federal Military Lending Act, for which we have made refunds of approximately $33,500; for certain failures to timely provide and preserve records and information in connection with the CFPB’s examination of us and Cash America; for certain conduct in the examination process; and certain conduct giving rise to the Ohio Reimbursement Program initiated by Cash America. In addition, as a result of the CFPB’s review, we are in the process of enhancing our compliance management programs and implementing additional policies and procedures to address the issues identified by the CFPB. We are also required to provide periodic reports to the CFPB. We are subject to the restrictions and obligations of the Consent Order, including the CFPB’s order that we ensure compliance with federal consumer financial laws and develop more robust compliance policies and procedures. These new policies, procedures and other initiatives are in many cases subject to review and potential objection by the CFPB, and no guarantee can be made regarding the timing, substance or effect of any such measures the CFPB may decide to take. Furthermore, the compliance plan mandated by the Consent Order requires us to perform a formal consumer protection compliance risk review before introducing or implementing new or changed products or services. This requirement could result in additional delay or cost when introducing or implementing new or changed products or services, or a decision not to proceed with such initiatives. Any noncompliance with the Consent Order or similar orders or agreements from other regulators could lead to further regulatory penalties and could have a material adverse impact on our business, prospects, results of operations, financial condition and cash flows and could prohibit or directly or indirectly impair our ability to continue current operations.
The CFPB has announced that it will soon promulgate new rules affecting the consumer lending industry, and these or subsequent new rules and regulations may significantly restrict the conduct of our U.S. consumer lending business.
On April 24, 2013, the CFPB issued a report entitled “Payday Loans and Deposit Advance Products: A White Paper of Initial Findings,” indicating that it had “engaged in an in-depth review of short-term small dollar loans,
18
Table of Contents
including payday loans.” The report discusses the initial findings of the CFPB regarding short-term payday loans, a category which the CFPB and some other regulators use to include certain of our short-term loan products, loans provided by non-bank financial institutions at storefront locations and deposit account advances offered by depository institutions. While the CFPB’s study stated that “these products may work for some consumers for whom an expense needs to be deferred for a short period of time,” the CFPB also stated that its “findings raised substantial consumer protection concerns” related to the sustained use of payday loans and deposit account advances. The report also indicated that the CFPB planned to analyze the effectiveness of limitations such as cooling-off periods between payday loans, “in curbing sustained use and other harms.” In furtherance of that report, on March 25, 2014, the CFPB held a hearing on payday lending and issued a report entitled “CFPB Data Point: Payday Lending,” presenting “the results of several analyses of consumers’ use of payday loans.” The report presents the CFPB’s findings as to borrowers’ loan sequences, which refers to a series of loans a borrower may take out following an initial loan. The CFPB found that payday borrowing typically involves multiple renewals following an initial loan, rather than distinct loans separated by at least 15 days. The report states that for the majority of loan sequences, there is no reduction in the principal amount between the first and last loan in the sequence. In the reports and subsequent statements, the CFPB reiterated its commitment to use its various tools to protect consumers from unlawful acts and practices in connection with the offering of consumer financial products and services. Both the April 24, 2013 white paper and the March 25, 2014 report indicated that online payday loans were not the focus of the CFPB’s reports, but the CFPB has indicated that it is currently analyzing borrowing activity by consumers using online payday loans.
The CFPB announced that it is in the late stages of considering the formulation of rules regarding consumer loans, including certain of our short-term loan products, that will ensure that consumers can get the credit they need without long-term impact to their financial futures. These rules will likely impose limitations on payday lending. We do not currently know the nature and extent of the rules that the CFPB will adopt, but those rules could be proposed and adopted in 2015. If the CFPB adopts any rules or regulations that significantly restrict the conduct of our business, any such rules or regulations could have a material adverse effect on our business, prospects, results of operations, financial condition and cash flows or could make the continuance of all or part of our U.S. business impractical or unprofitable. Any new rules or regulations adopted by the CFPB could also result in significant compliance costs.
The United Kingdom has imposed, and continues to impose, increased regulation of the short-term high-cost credit industry with the stated expectation that some firms will exit the market.
In the United Kingdom, we are subject to regulation by the Financial Conduct Authority, or the FCA, the Financial Services and Markets Act 2000, or the FSMA, the European Union Consumer Credit Directive, the Consumer Credit Act 1974, as amended, or the CCA, and secondary legislation passed under it, among other rules and regulations. In December 2012, the U.K. Parliament passed the Financial Services Act 2012, or the FSA Act 2012, which created a new regulatory framework for the supervision and regulation of the consumer credit industry in the United Kingdom, including the consumer lending industry in which we operate. The FSA Act 2012 mandated that, in April 2014, the FCA take over responsibility for regulating consumer credit from the Office of Fair Trading, or the OFT, and it also made changes to the relevant legislation including the CCA and the FSMA. During the period of transition of regulatory responsibility over consumer credit from the OFT to the FCA, the OFT continued to regulate consumer credit, including the short-term loan market.
The FCA regulates consumer credit and related activities pursuant to the FSMA and the FCA Handbook, which includes prescriptive rules and regulations and carries across many of the standards set out in the CCA and its secondary legislation as well as the OFT’s previous Irresponsible Lending Guidance, or the Guidance. The regulations under the FCA consumer credit regime are more prescriptive than the former U.K. consumer credit regime. The FSMA gives the FCA the power to authorize, supervise, examine and bring enforcement actions against providers of consumer credit, as well as to make rules for the regulation of consumer credit. On February 28, 2014, the FCA issued the Consumer Credit Sourcebook, or the CONC, contained in the FCA Handbook. The CONC incorporates prescriptive regulations for consumer loans such as those that we offer, including mandatory affordability checks on borrowers, limiting the number of rollovers to two, restricting how
19
Table of Contents
lenders can advertise, banning advertisements it deems misleading, and introducing a limit of two unsuccessful attempts on the use of continuous payment authority (which provides a creditor the ability to directly debit a customer’s account for payment when authorized by the customer to do so) to pay off a loan. Certain provisions of the CONC took effect on April 1, 2014, and other provisions for high-cost short-term credit providers, such as the limits on rollovers, continuous payment authority and advertising, took effect on July 1, 2014. As a result of the FCA’s requirements, we have made, and are in the process of making significant adjustments to many of our business practices in the United Kingdom, as discussed below under “—Our primary regulators in the United Kingdom have expressed and continue to express serious concerns about our compliance with applicable U.K. regulations, which has caused and will continue to cause us to make significant changes to our U.K. business that will negatively impact our operations and results, and this impact will likely be significant.”
In addition, on December 18, 2013, the United Kingdom passed the Financial Services (Banking Reform) Act, which includes an amendment to the FSMA that requires the FCA to introduce rules “with a view to securing an appropriate degree of protection for borrowers against excessive charges” on “high-cost short-term” consumer loans. On July 15, 2014, the FCA issued a consultation paper that proposed a cap on the total cost of high-cost short-term credit and requested comments on the proposal. The consultation paper proposed a maximum rate of 0.8% of principal per day, and the proposal limits the total fees, interest (including post-default interest) and charges (including late fees which are capped at £15) to an aggregate amount not to exceed 100% of the principal amount loaned. The FCA requested comments on the proposal and issued its final rule on November 11, 2014. The final rule was largely the same as the proposed rule except for additional language governing line of credit products and will likely require us to make changes to all of our high-cost short-term products in the United Kingdom. We are still assessing the impact of the final rule and what additional changes to our products will be necessary. The final rule will become effective on January 2, 2015, as required by the 2013 amendment to the FSMA. It is possible that the rule change could have a significant effect on the results of our U.K. operations. Any changes we make to our U.K. business as a result of the final rule could have a material adverse effect on our business, prospects, results of operations, financial condition and cash flows.
The FCA has stated that actions taken by it with respect to the payday industry will likely force a quarter or more of the firms out of the industry. During the nine-month periods ended September 30, 2014 and 2013 and the twelve-month period ended December 31, 2013, our U.K. operations represented 42.8%, 47.7% and 47.1%, respectively, of our consolidated total revenue. The results for the nine-month period ended September 30, 2014 and the year ended December 31, 2013 do not include the full impact of the changes described above, and the results for the nine-month period ended September 30, 2013 do not include any impact of the changes described above. The results for each of these periods are not indicative of our future results of operations and cash flows from our operations in the United Kingdom.
These legislative or regulatory activities and changes that we have implemented or are required to implement in the future as a result of such legislative and regulatory activities could have a material adverse effect on our U.K. business, as further described below under “—Our primary regulators in the United Kingdom have expressed and continue to express serious concerns about our compliance with applicable U.K. regulations, which has caused and will continue to cause us to make significant changes to our U.K. business that will negatively impact our operations and results, and this impact will likely be significant,” and “—Due to restructuring of the consumer credit regulatory framework in the United Kingdom, we are required to obtain full authorization from our U.K. regulators to continue providing consumer credit and perform related activities in the United Kingdom, and there is no guarantee that we will receive full authorization to continue offering consumer loans in the United Kingdom.”
Due to restructuring of the consumer credit regulatory framework in the United Kingdom, we are required to obtain full authorization from our U.K. regulators to continue providing consumer credit and perform related activities in the United Kingdom, and there is no guarantee that we will receive full authorization to continue offering consumer loans in the United Kingdom.
We have obtained interim permission from the FCA to provide consumer credit and perform related activities. We are required to apply for and obtain full authorization from the FCA to continue to provide consumer credit. In order
20
Table of Contents
to obtain full authorization, and as a threshold condition to maintaining our interim permission to provide consumer credit in the United Kingdom, we are required to demonstrate that we satisfy, and will continue to satisfy, certain minimum standards set out in the FSMA, including certain specified “threshold conditions,” and this may result in additional costs to us that could be significant. As a “threshold condition” to maintaining our interim permission and to obtaining and retaining full authorization, the FCA must be satisfied that we can be “effectively supervised” by the FCA, as this term is defined in the FSMA. The FCA informed us that it had concerns that we could not be “effectively supervised” given our previous structure with all of our operations conducted outside of the United Kingdom. We have historically performed substantially all of our U.K. business operations from the United States, as business functions have been performed remotely from our U.S. facilities. In order to alleviate the FCA’s concerns in relation to our ability to presently demonstrate to the FCA that we are capable of being effectively supervised, we have established an office in the United Kingdom. Furthermore, the FCA must approve certain individuals conducting “controlled functions” with respect to the operation and management of our U.K. business. All of these changes will result in additional costs to us. We are in frequent communication with the FCA regarding our activities to address the FCA’s concerns about the threshold conditions. The FCA has the power to revoke our interim permission to conduct a consumer credit business if it determines we do not meet the threshold conditions. Additionally, the FCA could elect to impose additional conditions that could delay the authorization process, further increase our compliance costs or require further changes to the conduct of our U.K. business that could have a material adverse effect on our U.K. operations.
We will begin the official application process for full authorization in early 2015. The FCA is expected to complete the process of reviewing applications of previous OFT license holders, such as us, for full authorization by April 1, 2016, and there is no guarantee that we will receive full authorization. If we do not receive full authorization, we will have to cease our U.K. consumer loan business.
Our primary regulators in the United Kingdom have expressed and continue to express serious concerns about our compliance with applicable U.K. regulations, which has caused and will continue to cause us to make significant changes to our U.K. business that will negatively impact our operations and results, and this impact will likely be significant.
In February 2012, the OFT launched a review of the payday lending sector to assess the sector’s compliance with the CCA, the Guidance, and other relevant guidance and legal obligations. As part of this review, the OFT conducted examinations of a number of payday lenders in the United Kingdom, including us, to assess individual company compliance with these laws and guidance. In May 2013, the OFT sent us a letter of findings related to its examination of our U.K. short term consumer loan (or payday) business, which indicated that we may not have been complying fully with all aspects of the Guidance, the CCA and other relevant laws and guidance. This letter indicated the OFT’s general and specific concerns in the following categories: advertising and marketing, pre-contract information and explanations, affordability assessments, rollovers, debt forbearance and debt collection, and regulatory and other compliance issues. As requested by the OFT, in July 2013, we provided the OFT with an independent audit report setting out the steps taken to address each concern the OFT had identified in its letter. Through March 2014, we continued to receive additional requests for data and documentation from the OFT, and we complied with those requests.
The FCA has now assumed the supervision and regulation of us, and we continue to receive additional requests for data and documentation from the FCA about our consumer loan products and have been complying with those requests. The FCA informed us that it has serious concerns regarding our compliance with the FCA’s rules and principles, including those with respect to our affordability assessment process in determining whether the loans we make are affordable for our customers and our debt forbearance practices (or our practices regarding customers who have indicated they are experiencing financial difficulty). The FCA also noted concerns regarding certain of our advertising practices. We have been, and continue to be, in frequent communication with the FCA regarding the concerns raised by the FCA and our efforts to address such concerns through, among other things, significant modifications to our business practices. The FCA is closely monitoring our efforts to comply with its requirements, including our changes to our business practices made in an effort to comply with the FCA’s
21
Table of Contents
concerns. For example, we have established an office in the United Kingdom to help alleviate the FCA’s concerns about effective supervision, and we will be required to obtain FCA approval of certain individuals performing “controlled functions,” as defined by applicable regulation, as discussed above under “—Due to restructuring of the consumer credit regulatory framework in the United Kingdom, we are required to obtain full authorization from our U.K. regulators to continue providing consumer credit and perform related activities in the United Kingdom, and there is no guarantee that we will receive full authorization to continue offering consumer loans in the United Kingdom.”
In addition, we have made and are in the process of making significant adjustments to many of our business practices, including modifying our affordability assessments and underwriting standards, reducing certain maximum loan amounts, changing our collections processes (including our practices relating to continuous payment authority) and debt forbearance practices and altering certain advertising practices, all of which we believe will result in a significant year-over-year decrease in our U.K. loan volume, U.K. loan balances and U.K. revenue for the remainder of 2014 and into 2015 as a result of adapting our U.K. business practices in response to the requirements of the FCA. The implementation of stricter affordability assessments and underwriting standards will result in a decrease in the number of consumer loans written, the average consumer loan amount and the total amount of consumer loans written to new and returning customers. Additionally, the changes we made to our collections and debt forbearance practices in the United Kingdom could result in lower collection rates, and we will experience an increase in compliance- and administrative-related costs for our U.K. operations. In addition, the FCA could require us to make additional changes to our business that could further negatively affect future results for our U.K. operations. We are still assessing the potential impact of the changes we have made and are continuing to make to our U.K. operations and what effect such changes may have on our business, but the impact of these changes is likely to be significant for the balance of 2014 and into 2015 and could result in a material adverse effect on our U.K. business and our prospects, results of operation, financial condition and cash flows.
We are subject to examination and review by the FCA. If such examination or review identifies activities that are deemed by the FCA to have caused consumer detriment or are not in compliance with the FCA’s requirements, the FCA could require us to take remedial action, which could result in additional changes to our business practices, the payment of consumer redress, fines or penalties, the denial of our permanent authorization application, the withdrawal of our interim authorization or permanent authorization if granted, or other remedial actions.
We may be unable to successfully implement the changes we are making to our U.K. business described above or any additional changes we may be required to make to our U.K business to address concerns raised by the FCA. Any inability to make changes to the satisfaction of the FCA could also have an adverse effect on our existing interim authorization from the FCA to continue to provide consumer credit and on our ability to obtain full authorization from the FCA, and we may not be able to successfully resolve the concerns expressed by the FCA. Any such changes or our failure to successfully make any such changes or resolve the concerns of the FCA could have a material adverse effect on our business, prospects, results of operations, financial condition and cash flows.
Many U.K. regulatory matters are subject to increased uncertainty because supervision of the U.K. consumer credit regime has recently been transferred to the FCA, which previously did not hold such authority.
Supervision of our U.K. business was transferred from the OFT to the FCA in April 2014. The FCA applies more prescriptive regulations to our U.K. operations, as opposed to the previous regime. The FCA is responsible for determining whether we will receive full authorization to continue providing consumer credit and perform related activities and whether we will continue to hold our existing interim permission. Because the FCA’s authority over consumer credit is new, the FCA’s practices regarding supervisory matters and other matters relevant to us are subject to further development and change. The FCA is not bound by the previous practices of the OFT and is
22
Table of Contents
operating under a different legal framework and regime, and the FCA will apply its supervisory powers and interpret relevant concepts more stringently than such previous practices. This may adversely affect our ability to anticipate the FCA’s expectations or interpretations in our interaction with the FCA.
Competition regulators in the United Kingdom are currently reviewing our industry and could order remedial action, which could materially adversely affect our business or even impair our ability to continue our current operations in the United Kingdom.
In June 2013, the OFT referred the payday lending industry in the United Kingdom to the Competition Commission, which is now the Competition & Markets Authority, or the CMA, for a market investigation. The CMA has been gathering data from industry participants, including us, in connection with its review of the U.K. payday lending industry to determine whether certain features of the payday lending industry prevent, restrict or distort competition (which is also referred to as having an adverse effect on competition) and, if so, what remedial action should be taken.
On June 11, 2014, the CMA released a provisional findings report in which it indicated that it believes that many payday lenders fail to compete on price and indicated that it will look at potential ways to increase price competition. The CMA also announced the expansion of its review of the payday lending industry to include lead generators. The CMA announced its provisional decision on remedies on October 9, 2014, which include the establishment of independent price comparison websites, requiring more clear upfront disclosure of borrowing costs if a loan is not paid back in full and on time, requiring lenders to assist customers in assessing their own creditworthiness and likelihood of obtaining a loan, requiring periodic account statements to be provided to borrowers and requiring greater transparency about the role played by lead generators.
The CMA is required to complete its report by June 26, 2015, although it has stated publicly that it expects to publish its final report in December 2014 or January 2015. If the investigation’s final conclusions indicate that remedial action is necessary for the payday loan industry, the CMA will decide whether to order such remedial action itself or whether it should recommend certain actions or remedies be taken by the FCA, or other government bodies or organizations. If such action is taken, it may include any of the remedies outlined above or other remedies, and any of these remedies could have a material adverse effect on our business, prospects, results of operations, financial conditions and cash flows and could impair our ability to continue current operations in the United Kingdom.
Our advertising and marketing materials and disclosures have been and continue to be subject to regulatory scrutiny, particularly in the United Kingdom.
In the jurisdictions where we operate, our advertising and marketing activities and disclosures are subject to regulation under various industry standards, consumer protection laws, and other applicable laws and regulations. Consistent with the consumer lending industry as a whole (see “—The consumer lending industry continues to be targeted by new laws or regulations in many jurisdictions that could restrict the short-term consumer lending products and services we offer, impose additional compliance costs on us, render our current operations unprofitable or even prohibit our current operations” above), our advertising and marketing materials have come under increased scrutiny. In the United Kingdom, for example, consumer credit firms are subject to the financial promotions regime set out in the FSMA (Financial Promotions) Order 2005 and specific rules in the CONC, such as the inclusion of a risk warning on certain advertising materials. The FCA has also decided to adopt certain elements of industry codes as FCA rules on a case by case basis. Our advertising and marketing materials are reviewed both by the FCA and the Advertising Standards Authority. We have in some cases been ordered to withdraw, amend or add disclosures to such materials, or have done so voluntarily in response to inquiries or complaints. We remain in discussion with the relevant U.K. authorities regarding the extent to which additional amendments and specific risk disclosures will be necessary. Going forward, there can be no guarantee that we will be able to advertise and market our business in the United Kingdom or elsewhere in a manner we consider effective. Any inability to do so could have a material adverse effect on our business, prospects, results of operations, financial condition and cash flows.
23
Table of Contents
Our business in Australia has become less profitable due to compliance with new regulations there, and if our new product offering is not sustainable, this could require us to exit the Australian market.
In Australia we must comply with the responsible lending conduct obligations under the National Consumer Credit Protection Act (2010), which was amended in 2012. The amendment includes limitations on permissible fees and interest charged on certain consumer loans, including consumer loans made by us. We have altered the product we offer in Australia and expect the product offering will be less profitable after giving effect to this alteration. If the reduction in profitability is such that our product offering is not sustainable, we may need to exit Australia if the product cannot be further modified in a way that retains our profitability in that country.
Significant changes in foreign laws or regulations or a deterioration of the political, regulatory or economic environment of Australia, Canada, the United Kingdom, Brazil or China, or any other country in which we intend to begin operations, could affect our operations in these countries.
We offer or arrange online consumer loans to customers in Australia, Brazil, Canada, China and the United Kingdom. Australia and the United Kingdom have recently increased regulation of our industry as well as demonstrated an increasing interest in legislation or regulations that could further regulate or restrict the consumer loan products we offer. See the risk factors above for recent U.K. and Australian regulatory activity.
Significant changes in foreign laws or regulations or a deterioration of the political, regulatory or economic environment of Australia, Brazil, Canada, China or the United Kingdom could restrict our ability to sustain or expand our operations in these countries. Similarly, a significant change in laws, regulations or overall treatment (including an interpretation or application of such laws and regulations not anticipated when exploring or initiating business) or a deterioration of the political, regulatory or economic environment of any other country in which we may decide to explore business, could also materially adversely affect our prospects and could restrict our ability to initiate a pilot program or develop a pilot program into full business operations.
We have previously ceased business in certain jurisdictions due to regulatory restrictions and, if we are forced to exit many key jurisdictions due to regulatory restrictions, it could adversely affect our business as a whole.
In the past we have ceased business in, restricted our operations in, or chosen not to begin business in, certain jurisdictions due to regulatory restrictions which render our operations impermissible, unprofitable or impractical. In addition, because we are in some cases subject to state/provincial and local regulation in addition to federal/national regulation, we may restrict or discontinue business in certain jurisdictions within countries where we are otherwise active. For example, we currently do not conduct business in 16 U.S. states (including five states in which we used to conduct business) or in the District of Columbia because we do not believe it is economically feasible to operate in those jurisdictions due to specific statutory or regulatory restrictions, such as interest rate ceilings or caps on the fees that may be charged.
The adoption of state regulatory measures cannot be predicted, but we expect that other states may propose or enact similar restrictions on our consumer loan products in the future, which could affect our operations in such states. Additional regulations targeting or otherwise directly affecting our products and services have also been recently passed in Idaho, Louisiana, Utah and Wyoming and proposed in Alabama, Minnesota, Missouri, Rhode Island, Texas and Wisconsin. For more information, see “Regulation and Legal Proceedings—U.S. State Regulation.”
If we are forced to exit many key jurisdictions due to such concerns, we cannot guarantee that we will be able to find suitably attractive additional business opportunities elsewhere, which could have a material adverse effect on our business, prospects, results of operations, financial condition and cash flows.
24
Table of Contents
Regulators and payment processors are scrutinizing certain online lenders’ access to the Automated Clearing House system to disburse and collect loan proceeds and repayments, and any interruption or limitation on our ability to access this critical system would materially adversely affect our business.
When making consumer loans in the United States, we use the Automated Clearing House, or ACH, system to deposit loan proceeds into our customers’ bank accounts, and our business, including loans made through the CSO programs, depends on the ACH system to collect amounts due by withdrawing funds from our customers’ bank accounts when we have obtained authorization to do so from the customer. Our ACH transactions are processed by banks, and if these banks cease to provide ACH processing services, we would have to materially alter, or possibly discontinue, some or all of our business if alternative ACH processors are not available.
It has been reported that recent actions by the U.S. Department of Justice, or the Justice Department, the Federal Deposit Insurance Corporation, or the FDIC, and certain state regulators, referred to as Operation Choke Point, appear to be intended to discourage banks and ACH payment processors from providing access to the ACH system for certain short-term consumer loan providers that they believe are operating illegally, cutting off their access to the ACH system to either debit or credit customer accounts (or both). According to published reports, the Justice Department has issued subpoenas to banks and payment processors and the FDIC and other regulators are said to be using bank oversight examinations to discourage banks from providing access to the ACH system to certain online lenders. In August 2013, the Department of Financial Services of the State of New York, or the NYDFS, sent letters to approximately 35 online short-term consumer loan companies (which did not include us as we do not offer consumer loans in New York) demanding that they cease and desist offering illegal payday loans to New York consumers and also sent letters to over 100 banks, as well as the National Automated Clearing House Association, or NACHA (which oversees the ACH network), requesting that they work with the NYDFS to cut off ACH system access to New York customer accounts for illegal payday lenders. NACHA, in turn, has requested that its participants review origination activity for these 35 online short-term consumer loan companies and to advise NACHA whether it has terminated these lenders’ access to the ACH system or, if not, the basis for not doing so. NACHA also requested that participants review ACH origination activities related to other online loan companies and to terminate any ACH system access that would violate NACHA rules, which would include, according to NACHA, any authorizations to use the ACH system to pay illegal short-term consumer loans that are unenforceable under state law. Maryland’s Division of Financial Regulation has also been reported to have taken steps to stop banks in Maryland from processing illegal payday loans in its state, and the California Department of Business Oversight is reported to have similarly directed state-licensed banks and credit unions to monitor transactions with any unlicensed lenders.
This heightened regulatory scrutiny by the Justice Department, the FDIC and other regulators has caused banks and ACH payment processors to cease doing business with consumer lenders who are operating legally, without regard to whether those lenders are complying with applicable laws, simply to avoid the risk of heightened scrutiny or even litigation. In June 2014, Community Financial Services of America, a trade association representing short-term lenders and a major payday lender filed a lawsuit against three U.S. banking regulators, the Federal Reserve, the FDIC, the Office of the Comptroller of the Currency and the Comptroller of the Currency, alleging that the federal regulators are improperly causing banks to terminate business relationships with payday lenders. The complaint seeks a declaration that the agencies have acted wrongfully and seeks an injunction barring the agencies from certain actions or informally pressuring banks to terminate their relationship with payday lenders. The lawsuit says that Bank of America Corp., Capital Financial One Corp., Fifth Third Bancorp, J.P. Morgan Chase & Co. and many smaller banks have terminated their relationships with payday lenders.
In addition, NACHA has certain operating rules that govern the use of the ACH system. In November 2013, NACHA proposed amendments to these rules. After a public comment period, on July 28, 2014, NACHA revised its proposed amendments and distributed ballots to its membership to solicit votes on the revised amendments. The revised amendments were adopted by NACHA’s members in August 2014 and will become effective on various dates in 2015 and 2016. These amendments will, among other things (1) establish certain ACH return rate levels, including an overall ACH return rate level of 15% of the originator’s debit entries (and if any of the
25
Table of Contents
specified return rate levels are exceeded, the origination practices and activities of the originator would be subject to a new preliminary inquiry process by NACHA), (2) enhance limitations on certain ACH reinitiation activities, (3) impose fees on certain unauthorized ACH returns and (4) allow for increased flexibility in how an initial NACHA rules violation investigation can be initiated, which does not change the rules enforcement process, but defines additional circumstances under which NACHA may initiate a risk investigation or rules enforcement proceeding based on the origination of unauthorized entries. The revised amendments provide clarification that certain industries deal with customers who are more likely to experience an insufficient funds scenario and that the review of an originator with returns in excess of certain of the specified thresholds would take into account the originator’s business model in conjunction with its ACH origination practices. As a result of these amendments, our access to the ACH system could be restricted, our ACH costs could increase and we may need to make changes to our business practices.
Our access to the ACH system could be impaired as a result of this operation by regulators to cut off the ACH system to payday lenders or the NACHA rule amendments. The limited number of financial institutions we depend on may choose to discontinue providing ACH system and similar services to us.
If our access to the ACH system is impaired, we may find it difficult or impossible to continue some or all of our business, which could have a material adverse effect on our business, prospects, results of operations, financial condition and cash flows. If we are unable to maintain access to needed services on favorable terms, we would have to materially alter, or possibly discontinue, some or all of our business if alternative processors are not available.
The failure to comply with debt collection regulations could subject us to fines and other liabilities, which could harm our reputation and business.
The Fair Debt Collection Practices Act, or the FDCPA, regulates persons who regularly collect or attempt to collect, directly or indirectly, consumer debts owed or asserted to be owed to another person. Many states impose additional requirements on debt collection communications, and some of those requirements may be more stringent than the federal requirements. Moreover, regulations governing debt collection are subject to changing interpretations that differ from jurisdiction to jurisdiction.
Non-U.S. jurisdictions also regulate debt collection. For example, in the United Kingdom, due to new rules under the CONC we will be required to make adjustments to some of our business practices, including our collections processes, which could possibly result in lower collections on loans made by us and a decrease in the number of new customers that we are able to approve. In addition, the concerns expressed to us by the OFT and the FCA relate in part to debt collection. We could be subject to fines, written orders or other penalties if we, or parties working on our behalf, are determined to have violated the FDCPA, the CONC or analogous state or foreign laws, which could have a material adverse effect on our reputation, business, prospects, results of operations, financial condition and cash flows.
We use lead providers and marketing affiliates to assist us in obtaining new customers, and if lead providers or marketing affiliates do not comply with an increasing number of applicable laws and regulations, or if our ability to use such lead providers or marketing affiliates is otherwise impaired, it could adversely affect our business.
We are dependent on third parties, referred to as lead providers (or lead generators) and marketing affiliates, as a source of new customers. Our marketing affiliates place our advertisements on their websites that direct potential customers to our websites. Generally, lead providers operate, and also work with their own marketing affiliates who operate, separate websites to attract prospective customers and then sell those “leads” to online lenders. As a result, the success of our business depends substantially on the willingness and ability of lead providers or marketing affiliates to provide us customer leads at acceptable prices.
If regulatory oversight of lead providers or marketing affiliates is increased, through the implementation of new laws or regulations or the interpretation of existing laws or regulations, our ability to use lead providers or
26
Table of Contents
marketing affiliates could be restricted or eliminated. For example, during 2013, the State of California began enforcing its short-term lending statute to require lead providers to be licensed in order to provide leads to licensed lenders. As a result, we have discontinued using lead providers to generate leads for short-term consumer loans in California. In April 2014, the Attorney General of the State of Illinois filed a lawsuit against a lead provider, alleging that the lead provider offered and arranged payday loans without a license. As a result, we recently discontinued the use of lead providers in Illinois. While these discontinuations did not have a material adverse effect on us, we expect that other states may propose or enact similar restrictions on lead providers and potentially on marketing affiliates in the future, and if other states adopt similar restrictions, our ability to use lead providers or marketing affiliates in those states would also be interrupted. In addition, the CFPB has indicated its intention to examine compliance with federal laws and regulations by lead providers and to scrutinize the flow of non-public, private consumer information between lead providers and lead buyers, such as us. We also expect that the ongoing regulatory review of consumer lending in the United Kingdom may lead to increased restrictions on the operations and/or use of lead providers.
Lead providers’ or marketing affiliates’ failure to comply with applicable laws or regulations, or any changes in laws or regulations applicable to lead providers or marketing affiliates’ or changes in the interpretation or implementation of such laws or regulations, could have an adverse effect on our business and could increase negative perceptions of our business and industry. Additionally, the use of lead providers and marketing affiliates could subject us to additional regulatory cost and expense. If our ability to use lead generators or marketing affiliates were to be impaired, our business, prospects, results of operations, financial condition and cash flows could be materially adversely affected.
The use of personal data used in credit underwriting is highly regulated.
The Fair Credit Reporting Act, or the FCRA, regulates the collection, dissemination and use of consumer information, including consumer credit information. Compliance with the FCRA and related laws and regulations concerning consumer reports has recently been under regulatory scrutiny. The FCRA requires us to provide a Notice of Adverse Action to a loan applicant when we deny an application for credit, which, among other things, informs the applicant of the action taken regarding the credit application and the specific reasons for the denial of credit. The FCRA also requires us to promptly update any credit information reported to a consumer reporting agency about a consumer and to allow a process by which consumers may inquire about credit information furnished by us to a consumer reporting agency. Historically, the FTC has played a key role in the implementation, oversight, enforcement and interpretation of the FCRA. Pursuant to the Dodd-Frank Act, the CFPB has primary supervisory, regulatory and enforcement authority of FCRA issues, although the FTC also retains its enforcement role regarding the FCRA but shares that role in many respects with the CFPB. The CFPB has taken a more active approach than the FTC, including with respect to regulation, enforcement and supervision of the FCRA. Changes in the regulation, enforcement or supervision of the FCRA may materially affect our business if new regulations or interpretations by the CFPB or the FTC require us to materially alter the manner in which we use personal data in our credit underwriting.
In the United Kingdom, we are also subject to the requirements of the Data Protection Act 1988, or the DPA, and are required to be fully registered as a data-controller under the DPA. We are also required to be certified under the European Union Safe Harbor provisions, which allow European Union data to be passed to non-European Union countries.
The oversight of the FCRA by both the CFPB and the FTC and any related investigation or enforcement activities or our failure to comply with the DPA may have a material adverse impact on our business, including our operations, our mode and manner of conducting business and our financial results.
Negative public perception of our business could cause demand for our products to significantly decrease.
In recent years, consumer advocacy groups and some media reports have advocated governmental action to prohibit or place severe restrictions on short-term and high-cost consumer loans. Such consumer advocacy groups and media reports generally focus on the annual percentage rate for this type of consumer loan, which is
27
Table of Contents
compared unfavorably to the interest typically charged by banks to consumers with top-tier credit histories. The fees and/or interest charged by us and others in the industry attract media publicity about the industry and can be perceived as controversial. If the negative characterization of these types of loans becomes increasingly accepted by consumers, demand for any or all of the consumer loan products that we offer could significantly decrease, which could materially affect our business, prospects, results of operations, financial condition and cash flows. Additionally, if the negative characterization of these types of loans is accepted by legislators and regulators, we could become subject to more restrictive laws and regulations applicable to short-term loans or other consumer loan products that we offer that could materially adversely affect our business, prospects, results of operations, financial condition and cash flows and could impair our ability to continue current operations.
In addition, our ability to attract and retain customers is highly dependent upon the external perceptions of our level of service, trustworthiness, business practices, financial condition and other subjective qualities. Negative perceptions or publicity regarding these matters—even if related to seemingly isolated incidents, or even if related to practices not specific to short-term loans, such as debt collection—could erode trust and confidence and damage our reputation among existing and potential customers, which could make it difficult for us to attract new customers and retain existing customers and could significantly decrease the demand for our products, could materially adversely affect our business, prospects, results of operations, financial condition and cash flows and could impair our ability to continue current operations.
Current and future litigation or regulatory proceedings could have a material adverse effect on our business, prospects, results of operations, financial condition and cash flows.
We have been and are currently subject to lawsuits (including purported class actions) that could cause us to incur substantial expenditures, generate adverse publicity and could significantly impair our business, force us to cease doing business in one or more jurisdictions or cause us to cease offering or alter one or more products. We are also likely to be subject to further litigation in the future. An adverse ruling in or a settlement of any current or future litigation against us or another lender could cause us to have to refund fees and/or interest collected, forego collection of the principal amount of loans, pay treble or other multiple damages, pay monetary penalties and/or modify or terminate our operations in particular jurisdictions.
Defense of any lawsuit, even if successful, could require substantial time and attention of our management and could require the expenditure of significant amounts for legal fees and other related costs. We and others are also subject to regulatory proceedings, and we could suffer losses from interpretations of applicable laws, rules and regulations in those regulatory proceedings, even if we are not a party to those proceedings. Any of these events could have a material adverse effect on our business, prospects, results of operations, financial condition and cash flows and could impair our ability to continue current operations.
Judicial decisions, CFPB rule-making or amendments to the Federal Arbitration Act could render the arbitration agreements we use illegal or unenforceable.
We include arbitration provisions in our consumer loan agreements. These provisions are designed to allow us to resolve any customer disputes through individual arbitration rather than in court and explicitly provide that all arbitrations will be conducted on an individual and not on a class basis. Thus, our arbitration agreements, if enforced, have the effect of shielding us from class action liability. Our arbitration agreements do not generally have any impact on regulatory enforcement proceedings. We take the position that the arbitration provisions in our consumer loan agreements, including class action waivers, are valid and enforceable; however, the enforceability of arbitration provisions is often challenged in court. If those challenges are successful, our arbitration and class action waiver provisions could be unenforceable, which could subject us to additional litigation, including additional class action litigation.
In addition, the U.S. Congress has considered legislation that would generally limit or prohibit mandatory arbitration agreements in consumer contracts and has enacted legislation with such a prohibition with respect to
28
Table of Contents
certain mortgage loan agreements and also certain consumer loan agreements to members of the military on active duty and their dependents. Further, the Dodd-Frank Act directs the CFPB to study consumer arbitration and report to the U.S. Congress, and it authorizes the CFPB to adopt rules limiting or prohibiting consumer arbitration, consistent with the results of its study. In 2013, the CFPB released a preliminary report on consumer arbitration provisions and indicated further study was in process. In April 2014, a representative of the CFPB managing the study indicated publicly that the study is expected to be completed by the end of 2014. Any rule adopted by the CFPB would apply to arbitration agreements entered into more than six months after the final rule becomes effective (and not to prior arbitration agreements).
Any judicial decisions, legislation or other rules or regulations that impair our ability to enter into and enforce consumer arbitration agreements and class action waivers could significantly increase our exposure to class action litigation as well as litigation in plaintiff-friendly jurisdictions, which would be costly and could have a material adverse effect on our business, prospects, results of operations, financial condition and cash flows.
The failure of third parties who provide products, services or support to us to maintain their products, services or support could disrupt our operations or result in a loss of revenue.
A portion of our short-term consumer loan and installment loan revenue depends in part on the willingness and ability of unaffiliated third-party lenders, through the CSO programs, to make loans to customers and other third parties to provide services to facilitate lending, loan underwriting and payment processing in our online lending consumer loan channels. In addition, we rely on third party lenders in connection with our pilot programs that we recently launched in Brazil and China. The loss of the relationship with any of these third parties, and an inability to replace them or the failure of these third parties to maintain quality and consistency in their programs or services or to have the ability to provide their products and services, could cause us to lose customers and substantially decrease the revenue and earnings of our business. Our revenue and earnings could also be adversely affected if any of those third-party providers make material changes to the products or services that we rely on. We also use third parties to support and maintain certain of our communication systems and information systems. If a third-party provider fails to provide its products or services, makes material changes to such products and services, does not maintain its quality and consistency or fails to have the ability to provide its products and services, our operations could be disrupted. Any of these events could result in a loss of revenue and could have a material adverse effect on our business, prospects, results of operations, financial condition and cash flows.
Our business depends on the uninterrupted operation of our systems and business functions, including our information technology and other business systems, as well as the ability of such systems to support compliance with applicable legal and regulatory requirements.
Our business is highly dependent upon our employees’ ability to perform, in an efficient and uninterrupted fashion, necessary business functions, such as Internet support, call center activities, and processing and servicing consumer loans. A shut-down of or inability to access the facilities in which our Internet operations and other technology infrastructure are based, such as a power outage, a failure of one or more of our information technology, telecommunications or other systems, or sustained or repeated disruptions of such systems could significantly impair our ability to perform such functions on a timely basis and could result in a deterioration of our ability to underwrite, approve and process Internet consumer loans, provide customer service, perform collections activities, or perform other necessary business functions. Any such interruption could have a materially adverse effect on our business, prospects, results of operations, financial condition and cash flows.
In addition, our systems and those of third parties on whom we rely must consistently be capable of compliance with applicable legal and regulatory requirements and timely modification to comply with new or amended requirements. For example, we believe that the federal Military Lending Act compliance issues involved in the CFPB’s Consent Order were related in part to system errors. Any such systems problems going forward could have a material adverse effect on our business, prospects, results of operations, financial conditions and cash flows and could impair or prohibit our ability to continue current operations.
29
Table of Contents
Decreased demand for our products and specialty financial services and our failure to adapt to such decrease could result in a loss of revenue and could have a material adverse effect on us.
The demand for a particular product or service may decrease due to a variety of factors, such as regulatory restrictions that reduce customer access to particular products, the availability of competing or alternative products or changes in customers’ financial conditions. Should we fail to adapt to a significant change in our customers’ demand for, or access to, our products, our revenue could decrease significantly. Even if we make adaptations or introduce new products to fulfill customer demand, customers may resist or may reject products whose adaptations make them less attractive or less available. In any event, the effect of any product change on the results of our business may not be fully ascertainable until the change has been in effect for some time. In particular, we have changed, and will continue to change, some of our operations and the products we offer. Any of these events could result in a loss of revenue and could have a material adverse effect on our business, prospects, results of operations, financial condition and cash flows.
Potential union activities could have an adverse effect on our relationship with our workforce.
None of our employees are currently covered by a collective bargaining agreement or represented by an employee union. Occasionally we experience union organizing activities. If our employees become represented by an employee union or become subject to a collective bargaining agreement, it may make it more difficult for us to manage our business and to attract and retain new employees and may increase our cost of doing business. Having our employees become represented by an employee union, having a collective bargaining agreement or having additional requirements related to our employees imposed on us could result in work stoppages and higher employee costs and could have a material adverse effect on our business, prospects, results of operations, financial condition and cash flows and could impair our ability to continue current operations.
If our allowance for losses and liability for estimated losses on third-party lender-owned consumer loans is not adequate to absorb losses or if we do not successfully manage our credit risk for unsecured consumer loans, our business, prospects, results of operations, financial condition and cash flows may be adversely affected.
As more fully described under Note 2 to our consolidated financial statements for the year ended December 31, 2013 included elsewhere in this prospectus, we utilize a variety of underwriting criteria, monitor the performance of our consumer loan portfolios and maintain either an allowance or liability for estimated losses on consumer loans (including fees and interest) at a level estimated to be adequate to absorb credit losses inherent in the receivables portfolio and expected losses from loans guaranteed under the CSO programs. The allowance deducted from the carrying value of consumer loans was $70.0 million at September 30, 2014, and the liability for estimated losses on third-party lender-owned consumer loans was $1.4 million at September 30, 2014. These reserves are estimates, and if actual loan losses are materially greater than our reserves, our results of operations and financial condition could be adversely affected. In addition, if we do not successfully manage credit risk for our unsecured consumer loans through our loan underwriting, we could incur substantial credit losses due to customers being unable to repay their loans. Any failure to manage credit risk could materially adversely affect our business, prospects, results of operations, financial condition and cash flows.
We are subject to impairment risk.
At September 30, 2014, we had goodwill totaling $255.9 million on our consolidated balance sheets, all of which represents assets capitalized in connection with acquisitions and business combinations. Accounting for goodwill requires significant management estimates and judgment. Events may occur in the future, and we may not realize the value of our goodwill. Management performs periodic reviews of the carrying values of our goodwill to determine whether events and circumstances indicate that impairment in value may have occurred. A variety of factors could cause the carrying value of goodwill or an intangible asset to become impaired. Should a review indicate impairment, a write-down of the carrying value of the goodwill or intangible asset would occur, resulting in a non-cash charge, which could adversely affect our results of operations and could also lead to our inability to comply with certain covenants in our financing documents, which could cause a default under those agreements.
30
Table of Contents
We are subject to anticorruption laws including the U.S. Foreign Corrupt Practices Act and the U.K. Bribery Act 2010, anti-money laundering laws and economic sanctions laws, and our failure to comply therewith, particularly as we continue to expand internationally, could result in penalties that could harm our reputation and have a material adverse effect on our business, prospects, results of operations, financial condition and cash flows.
Anticorruption Laws. We are subject to the U.S. Foreign Corrupt Practices Act, or the FCPA, which generally prohibits companies and their agents or intermediaries from making improper payments to foreign officials for the purpose of obtaining or keeping business and/or other benefits. Although we have policies and procedures designed to ensure that we, our employees, agents and intermediaries comply with the FCPA and other anticorruption laws, such policies or procedures may not work effectively all of the time or protect us against liability for actions taken by our employees, agents and intermediaries with respect to our business or any businesses that we may acquire. In the event that we believe, or have reason to believe, that our employees, agents or intermediaries have or may have violated applicable anti-corruption laws, including the FCPA, we may be required to investigate or have a third party investigate the relevant facts and circumstances, which can be expensive and require significant time and attention from senior management. Our continued operation and expansion outside the United States could increase the risk of such violations in the future.
We are subject to other anti-corruption laws, such as the U.K. Bribery Act 2010, or the Bribery Act, which prohibits the giving or receiving of a bribe to any person, including but not limited to public officials, and makes failing to prevent bribery by relevant commercial organizations a criminal offense. This offense applies when any person associated with the organization offers or accepts bribes anywhere in the world intending to obtain or retain a business advantage for the organization or in the conduct of business. The Bribery Act is applicable to businesses that operate in the United Kingdom such as us. The Bribery Act is broader in scope than the FCPA in that it directly addresses commercial bribery in addition to bribery of government officials and it does not allow certain exceptions, notably facilitation payments that are permitted by the FCPA.
Other countries in which we operate, including Australia, Canada, China and Brazil, and other countries where we intend to operate also have anticorruption laws, which we are or will be subject to.
If we are not in compliance with the FCPA, the Bribery Act and other laws governing the conduct of business with government entities (including local laws), we may be subject to criminal and civil penalties and other remedial measures, which could have an adverse effect on our business, reputation, results of operations and financial condition. Any investigation of any potential violations of the FCPA, the Bribery Act or other anticorruption laws by U.S. or foreign authorities could harm our reputation and could have a material adverse effect on our business, reputation, prospects, results of operations, financial condition and cash flows.
Anti–Money Laundering Laws. We are also subject to anti-money laundering laws and related compliance obligations in the United States and other jurisdictions in which we do business. In the United States, the USA PATRIOT Act and the Bank Secrecy Act require us to maintain an anti-money laundering compliance program covering certain of our business activities. The program must include: (1) the development of internal policies, procedures and controls; (2) designation of a compliance officer; (3) an ongoing employee training program; and (4) an independent audit function to test the program. Furthermore, certain of our subsidiaries are registered as money services businesses with the U.S. Treasury Department and must re-register with the Financial Crimes Enforcement Network, or FinCEN, at least every two years. If we are not in compliance with U.S. or other anti-money laundering laws, we may be subject to criminal and civil penalties and other remedial measures, which could have an adverse effect on our business, results of operations, financial condition and cash flows. Any investigation of any potential violations of anti-money laundering laws by U.S. or foreign authorities could harm our reputation and could have a material adverse effect on our business, prospects, results of operations, financial condition and cash flows. In the United Kingdom, we are also subject to specific anti-money laundering and counter terrorist financing requirements that require us to develop and maintain anti-money laundering and counter terrorist financing policies and procedures, including reporting suspicious activity to the Serious Organised Crime Agency pursuant to the Proceeds of Crime Act 2002 and the Terrorism Act 2000.
31
Table of Contents
In Australia, we are also subject to specific anti-money laundering and counter terrorist financing requirements that require us to develop and maintain anti-money laundering and counter terrorist financing policies and procedures, including: (i) the appointment of a compliance officer; (ii) regular review to identify significant changes in money laundering/terrorist financing risk; (iii) regular independent review; (iv) reporting suspicious matters to the Australian Transaction Reports and Analysis Centre, or the AUSTRAC; and (v) consideration of AUSTRAC feedback.
Economic Sanctions Laws. The United States has imposed economic sanctions that affect transactions with designated foreign countries, nationals and others. In particular, the United States prohibits U.S. persons from engaging with individuals and entities identified as “Specially Designated Nationals,” such as terrorists and narcotics traffickers. These prohibitions are administered by the U.S. Department of the Treasury’s Office of Foreign Assets Control, or OFAC. OFAC rules prohibit U.S. persons from engaging in financial transactions with or relating to the prohibited individual, entity or country, require the blocking of assets in which the individual, entity or country has an interest. Blocked assets (e.g., property or bank deposits) cannot be paid out, withdrawn, set off or transferred in any manner without a license from OFAC. Other countries in which we operate, including Australia, Canada, and the United Kingdom, also maintain economic and financial sanctions regimes. In the event that we believe, or have reason to believe, that our employees, agents or intermediaries have or may have violated applicable laws or regulations, we may be required to investigate or have a third party investigate the relevant facts and circumstances, which can be expensive and require significant time and attention from senior management. If we are not in compliance with OFAC regulations and other economic and financial sanctions regulations, we may be subject to criminal and civil penalties and other remedial measures, which could have an adverse effect on our business, prospects, results of operations, financial condition and cash flows. Any investigation of any potential violations of OFAC regulations or other economic sanctions by U.S. or foreign authorities could harm our reputation and could have a material adverse effect on our business, prospects, results of operations, financial condition and cash flows.
Our continued international expansion could increase the risk of violations of FCPA, the Bribery Act, anti-money laundering laws, OFAC regulations, or similar applicable laws and regulations in the future.
Increased competition from banks, credit card companies, other consumer lenders, and other entities offering similar financial products and services could adversely affect our business, prospects, results of operations, financial condition and cash flows.
We have many competitors. Our principal competitors are consumer loan companies, CSOs, online lenders, credit card companies, consumer finance companies, pawnshops and other financial institutions that serve our primary customer base. Many other financial institutions or other businesses that do not now offer products or services directed toward our traditional customer base, many of whom may be much larger than us, could begin doing so. Significant increases in the number and size of competitors for our business could result in a decrease in the number of consumer loans that we fund, resulting in lower levels of revenue and earnings in these categories.
Competitors of our business may operate, or begin to operate, under business models less focused on legal and regulatory compliance, which could put us at a competitive disadvantage. Some of our U.S. competitors operate using other business models, including a “single-state model” where the lender is generally licensed in one state and follows only the laws and regulations of that state regardless of the state in which the customer resides and a “tribal model” where the lender follows the laws of a Native American tribe regardless of the state in which the customer resides. Competitors using these models may have higher revenue per customer and significantly less burdensome compliance requirements, among other advantages. Additionally, negative perceptions about these models could cause legislators or regulators to pursue additional industry restrictions that could affect the business model under which we operate. To the extent that these models or other new lending models gain acceptance among consumers and investors or that they face less onerous regulatory restrictions than we do, we may be unable to replicate their business practices or otherwise compete with them effectively, which could
32
Table of Contents
cause demand for our products to decline substantially. We may be unable to compete successfully against any or all of our current or future competitors. As a result, we could lose market share and our revenue could decline, thereby affecting our ability to generate sufficient cash flow to service our indebtedness and fund our operations. Any such changes in our competition could materially adversely affect our business, prospects, results of operations, financial condition and cash flows.
Our success is dependent, in part, upon our officers, and if we are not able to attract and retain qualified officers, our business could be materially adversely affected.
Our success depends, in part, on our officers, which is comprised of a relatively small group of individuals. Many members of the senior management team have significant industry experience, and we believe that our senior management would be difficult to replace, if necessary. Because the market for qualified individuals is highly competitive, we may not be able to attract and retain qualified officers or candidates. In addition, increasing regulations and negative publicity on the consumer financial services industry could affect our ability to attract and retain qualified officers. If we are unable to attract or retain qualified officers, it could materially adversely affect our business.
Our international operations subject us to foreign exchange risk.
We are subject to the risk of unexpected changes in foreign currency exchange rates by virtue of our loans to residents of Australia, Brazil, Canada, China and the United Kingdom. In 2013, 48.3% of our total revenue was derived from our international operations. Our results of operations and certain of our intercompany balances associated with our Australia, Brazil, Canada, China and United Kingdom businesses are denominated in their respective currencies and are, as a result, exposed to foreign exchange rate fluctuations. Upon consolidation, as exchange rates vary, net revenue and other operating results may differ materially from expectations, and we may record significant gains or losses on the remeasurement of intercompany balances.
A sustained deterioration in the economy could reduce demand for our products and services and result in reduced earnings.
A sustained deterioration in the economy could cause deterioration in the performance of our consumer loan portfolios. An economic slowdown could result in a decreased number of consumer loans being made to customers due to higher unemployment or an increase in loan defaults in our consumer loan products. During an economic slowdown, we could be required to tighten our underwriting standards, which would likely reduce consumer loan balances, and we could face more difficulty in collecting defaulted consumer loans, which could lead to an increase in loan losses.
We may be unable to protect our proprietary technology or keep up with that of our competitors.
The success of our business depends to a significant degree upon the protection of our software and other proprietary intellectual property rights. We may be unable to deter misappropriation of our proprietary information, detect unauthorized use or take appropriate steps to enforce our intellectual property rights. In addition, competitors could, without violating our proprietary rights, develop technologies that are as good as or better than our technology. Our failure to protect our software and other proprietary intellectual property rights or to develop technologies that are as good as our competitors’ could put us at a disadvantage relative to our competitors. Any such failures could have a material adverse effect on our business.
We may be subject to intellectual property disputes, which are costly to defend and could harm our business and operating results.
From time to time, we face, and we expect to face in the future, allegations that we have infringed the trademarks, copyrights, patents or other intellectual property rights of third parties, including from our competitors or non-practicing entities. Patent and other intellectual property litigation may be protracted and
33
Table of Contents
expensive, and the results are difficult to predict and may require us to stop offering certain products or product features, acquire licenses, which may not be available at a commercially reasonable price or at all, or modify our products, product features, processes or websites while we develop non-infringing substitutes.
In addition, we use open source software in our technology platform and plan to use open source software in the future. From time to time, we may face claims from parties claiming ownership of, or demanding release of, the source code, potentially including our valuable proprietary code, or derivative works that were developed using such software, or otherwise seeking to enforce the terms of the applicable open source license. These claims could also result in litigation, require us to purchase a costly license or require us to devote additional research and development resources to change our platform, any of which could have a negative effect on our business and operating results.
We are subject to cyber security risks and security breaches and may incur increasing costs in an effort to minimize those risks and to respond to cyber incidents.
Our business involves the storage and transmission of consumers’ proprietary information, and security breaches could expose us to a risk of loss or misuse of this information, litigation, and potential liability. We are entirely dependent on the secure operation of our websites and systems as well as the operation of the Internet generally. While we have incurred no material cyber-attacks or security breaches to date, a number of other companies have disclosed cyber-attacks and security breaches, some of which have involved intentional attacks. Attacks may be targeted at us, our customers, or both. Although we devote significant resources to maintain and regularly upgrade our systems and processes that are designed to protect the security of our computer systems, software, networks and other technology assets and the confidentiality, integrity and availability of information belonging to us and our customers, our security measures may not provide absolute security. Despite our efforts to ensure the integrity of our systems, it is possible that we may not be able to anticipate or to implement effective preventive measures against all security breaches of these types, especially because the techniques used change frequently or are not recognized until launched, and because cyber-attacks can originate from a wide variety of sources, including third parties outside the company such as persons who are involved with organized crime or associated with external service providers or who may be linked to terrorist organizations or hostile foreign governments. These risks may increase in the future as we continue to increase our mobile and other Internet-based product offerings and expand our internal usage of web-based products and applications or expand into new countries. If an actual or perceived breach of security occurs, customer and/or supplier perception of the effectiveness of our security measures could be harmed and could result in the loss of customers, suppliers or both. Actual or anticipated attacks and risks may cause us to incur increasing costs, including costs to deploy additional personnel and protection technologies, train employees, and engage third party experts and consultants.
A successful penetration or circumvention of the security of our systems could cause serious negative consequences, including significant disruption of our operations, misappropriation of our confidential information or that of our customers, or damage to our computers or systems or those of our customers and counterparties, and could result in violations of applicable privacy and other laws, financial loss to us or to our customers, loss of confidence in our security measures, customer dissatisfaction, significant litigation exposure, and harm to our reputation, all of which could have a material adverse effect on us. In addition, most of our applicants provide personal information, including bank account information when applying for consumer loans. We rely on encryption and authentication technology licensed from third parties to provide the security and authentication to effectively secure transmission of confidential information, including customer bank account and other personal information. Advances in computer capabilities, new discoveries in the field of cryptography or other developments may result in the technology used by us to protect transaction data being breached or compromised. Data breaches can also occur as a result of non-technical issues.
Our servers are also vulnerable to computer viruses, physical or electronic break-ins, and similar disruptions, including “denial-of-service” type attacks. We may need to expend significant resources to protect against
34
Table of Contents
security breaches or to address problems caused by breaches. Security breaches, including any breach of our systems or by persons with whom we have commercial relationships that result in the unauthorized release of consumers’ personal information, could damage our reputation and expose us to a risk of loss or litigation and possible liability. In addition, many of the third parties who provide products, services or support to us could also experience any of the above cyber risks or security breaches, which could impact our customers and our business and could result in a loss of customers, suppliers or revenue.
Any of these events could result in a loss of revenue and could have a material adverse effect on our business, prospects, results of operations, financial condition and cash flows.
If Internet search engine providers change their methodologies for organic rankings or paid search results, or our organic rankings or paid search results decline for other reasons, our new customer growth or volume from returning customers could decline.
Our new customer acquisition marketing and our returning customer relationship management is partly dependent on search engines such as Google, Bing and Yahoo! to direct a significant amount of traffic to our desktop and mobile websites via organic ranking and paid search advertising. Our competitors’ paid search activities, Pay Per Click, or PPC, or Search Engine Marketing, or SEM, may result in their sites receiving higher paid search results than ours and significantly increasing the cost of such advertising for us.
Our paid search activities may not produce (and in the past have not always produced) the desired results. Internet search engines often revise their methodologies, which could adversely affect our organic rankings or paid search results, resulting in a decline in our new customer growth or existing customer retention; difficulty for our customers in using our web and mobile sites; more successful organic rankings, paid search results or tactical execution efforts for our competitors than for us; a slowdown in overall growth in our customer base and the loss of existing customers; and higher costs for acquiring returning customers, which could adversely impact our business. In addition, search engines could implement policies that restrict the ability of consumer finance companies such as us to advertise their services and products, which could preclude companies in our industry from appearing in a favorable location or any location in the organic rankings or paid search results when certain search terms are used by the consumer. Our online marketing efforts are also susceptible to actions by third parties that negatively impact our search results such as spam link attacks, which are often referred to as “black hat” tactics. Our sites have experienced meaningful fluctuations in organic rankings and paid search results in the past, and we anticipate similar fluctuations in the future. Any reduction in the number of consumers directed to our web and mobile sites could harm our business and operating results.
Our operations could be subject to natural disasters and other business disruptions, which could adversely impact our future revenue and financial condition and increase our costs and expenses.
Our services and operations are vulnerable to damage or interruption from tornadoes, hurricanes, earthquakes, fires, floods, power losses, telecommunications failures, terrorist attacks, acts of war, human errors and similar events. A significant natural disaster, such as a tornado, hurricane, earthquake, fire or flood, could have a material adverse impact on our ability to conduct business, and our insurance coverage may be insufficient to compensate for losses that may occur. Acts of terrorism, war, civil unrest, violence or human error could cause disruptions to our business or the economy as a whole. Any of these events could cause consumer confidence to decrease, which could result in a decreased number of loans being made to customers. Any of these occurrences could have a material adverse effect on our business, prospects, results of operations, financial condition and cash flows.
Failure to keep up with the rapid changes in e-commerce and the uses and regulation of the Internet could harm our business.
The business of providing products and services such as ours over the Internet is dynamic and relatively new. We must keep pace with rapid technological change, consumer use habits, Internet security risks, risks of system failure or inadequacy, and governmental regulation and taxation, and each of these factors could adversely
35
Table of Contents
impact our business. In addition, concerns about fraud, computer security and privacy and/or other problems may discourage additional consumers from adopting or continuing to use the Internet as a medium of commerce. In countries such as the United States and the United Kingdom, where e-commerce generally has been available for some time and the level of market penetration of our online financial services is relatively high, acquiring new customers for our services may be more difficult and costly than it has been in the past. In order to expand our customer base, we must appeal to and acquire consumers who historically have used traditional means of commerce to conduct their financial services transactions. If these consumers prove to be less profitable than our previous customers, and we are unable to gain efficiencies in our operating costs, including our cost of acquiring new customers, our business could be adversely impacted.
Our business is subject to complex and evolving U.S. and foreign laws and regulations regarding privacy, data protection, and other matters. Many of these laws and regulations are subject to change and uncertain interpretation, and could result in claims, changes to our business practices, monetary penalties, increased cost of operations, or declines in user growth or engagement, or otherwise harm our business.
Our business is subject to a variety of laws and regulations in the United States and internationally that involve user privacy issues, data protection, advertising, marketing, disclosures, distribution, electronic contracts and other communications, consumer protection and online payment services. The introduction of new products or expansion of our activities in certain jurisdictions may subject us to additional laws and regulations. In addition, foreign data protection, privacy, and other laws and regulations can be more restrictive than those in the United States. U.S. federal and state and foreign laws and regulations, which can be enforced by private parties or government entities, are constantly evolving and can be subject to significant change, and the U.S. government, including the FTC and the Department of Commerce, has announced that it is reviewing the need for greater regulation of the collection of information concerning consumer behavior on the Internet, including regulation aimed at restricting certain targeted advertising practices. In addition, the application and interpretation of these laws and regulations are often uncertain, particularly in the new and rapidly evolving e-commerce industry in which we operate, and may be interpreted and applied inconsistently from country to country and inconsistently with our current or past policies and practices. A number of proposals are pending before federal, state, and foreign legislative and regulatory bodies that could significantly affect our business. For example, the European Commission is currently considering a data protection regulation that may include operational requirements for companies that receive personal data that are different than those currently in place in the European Union, and that may also include significant penalties for non-compliance. Similarly, there have been a number of recent legislative proposals in the United States, at both the federal and state level, that could impose new obligations in areas such as privacy. In addition, some countries are considering legislation requiring local storage and processing of data that, if enacted, would increase the cost and complexity of delivering our services. These existing and proposed laws and regulations can be costly to comply with and can delay or impede the development of new products, the expansion into new markets, result in negative publicity, increase our operating costs, require significant management time and attention, and subject us to inquiries or investigations, claims or other remedies, including demands that we modify or cease existing business practices or pay fines, penalties or other damages.
Growth may place significant demands on our management and our infrastructure and could be costly.
We have experienced substantial growth in our business. This growth has placed and may continue to place significant demands on our management and our operational and financial infrastructure. Expanding our products or entering into new jurisdictions with new or existing products can be costly and require significant management time and attention. Additionally, as our operations grow in size, scope and complexity and our product offerings increase, we will need to enhance and upgrade our systems and infrastructure to offer an increasing number of customers’ enhanced solutions, features and functionality. The expansion of our systems and infrastructure will require us to commit substantial financial, operational and technical resources in advance of an increase in the volume of business, with no assurance that the volume of business will increase. Continued growth could also strain our ability to maintain reliable service levels for our customers, develop and improve our operational,
36
Table of Contents
financial and management controls, develop and enhance our legal and compliance controls and processes, enhance our reporting systems and procedures and recruit, train and retain highly skilled personnel. Competition for these personnel is intense and is particularly intense for technology and analytics professionals. We may not be successful in attracting and retaining qualified personnel. We have from time to time in the past experienced, and we expect to experience in the future, difficulty in hiring and retaining highly skilled employees with appropriate qualifications. Many of the companies with which we compete for experienced personnel have greater resources or more attractive compensation mixes, including stock options, than we have had. Managing our growth will require significant expenditures and allocation of valuable management resources. Failure to achieve the necessary level of efficiency in our organization as it grows could materially adversely affect our business, prospects, results of operations, financial condition and cash flows and could impair our ability to continue current operations.
New top level domain names may allow the entrance of new competitors or dilution of our brands, which may reduce the value of our domain name assets.
We have invested heavily in promoting our brands, including our website addresses. The Internet Corporation for Assigned Names and Numbers, the entity responsible for administering Internet protocol addresses, has introduced, and has proposed the introduction of, additional new domain name suffixes in different formats, many of which may be more attractive than the formats held by us and which may allow the entrance of new competitors at limited cost. It may also permit other operators to register websites with addresses similar to ours, causing customer confusion and dilution of our brands, which could materially adversely affect our business, prospects, results of operations, financial condition and cash flows. Any defensive domain registration strategy or attempts to protect our trademarks or brands could become a large and recurring expense and may not be successful.
Future acquisitions could disrupt our business and harm our financial condition and operating results.
Our success will depend, in part, on our ability to expand our product and service offerings and markets and grow our business in response to changing customer demands, regulatory environments, technologies and competitive pressures. In some circumstances, we may expand our offerings through the acquisition of complementary businesses, solutions or technologies rather than through internal development. The identification of suitable acquisition candidates can be difficult, time-consuming and costly, and we may not be able to successfully complete identified acquisitions. Furthermore, even if we successfully complete an acquisition, we may not be able to successfully assimilate and integrate the business, technologies, solutions, personnel or operations of the business that we acquire, particularly if key personnel of an acquired company decide not to work for us. In addition, we may issue equity securities to complete an acquisition, which would dilute our stockholders’ ownership and could adversely affect the price of our common stock. Acquisitions may also involve the entry into geographic or business markets in which we have little or no prior experience or may expose us to additional material liabilities. Consequently, we may not achieve anticipated benefits of the acquisitions, which could harm our operating results.
We may incur property, casualty or other losses not covered by insurance.
We maintain a program of insurance coverage for various types of property, casualty and other risks. The types and amounts of insurance that we obtain will vary from time to time, depending on availability, cost and management’s decisions with respect to risk retention. The policies are subject to deductibles and exclusions that could result in our retention of a level of risk on a self-insurance basis. Losses not covered by insurance could be substantial and may increase our expenses, which could harm our results of operations and financial condition.
37
Table of Contents
The preparation of our financial statements and certain tax positions taken by us require the judgment of management, and we could be subject to risks associated with these judgments or could be adversely affected by the implementation of new, or changes in the interpretation of existing, accounting principles, financial reporting requirements or tax rules.
The preparation of our financial statements requires management to make estimates and assumptions that affect the reported amounts of assets and liabilities, and disclosure of contingent assets and liabilities, at the dates of the consolidated financial statements and the reported amounts of revenue and expenses during the reporting periods. In addition, management’s judgment is required in determining the provision for income taxes, the deferred tax assets and liabilities and any valuation allowance recorded against deferred tax assets. Management’s judgment is also required in evaluating whether tax benefits meet the more-likely-than-not threshold for recognition under Accounting Standards Codification 740-10-25, Income Taxes. Upon audit, if the ultimate determination of the taxes owed by us is for an amount in excess of amounts previously accrued, we could be required to make certain additional tax payments, which could materially adversely affect our results of operations and cash flows.
In addition, we prepare our financial statements in accordance with GAAP and its interpretations are subject to change over time. If new rules or interpretations of existing rules require us to change our financial reporting, our results of operations and financial condition could be materially adversely affected, and we could be required to restate historical financial reporting.
Our U.S. business is seasonal in nature, which causes our revenue and earnings to fluctuate.
Our U.S. business is affected by fluctuating demand for our products and services and fluctuating collection rates throughout the year. Demand for our short-term consumer loan products in the United States has historically been highest in the third and fourth quarters of each year, corresponding to the holiday season, and lowest in the first quarter of each year, corresponding to our customers’ receipt of income tax refunds. Typically, our cost of revenue for our short-term consumer loan products in the United States, which represents our loan loss provision, is lowest as a percentage of revenue in the first quarter of each year, corresponding to our customers’ receipt of income tax refunds, and increases as a percentage of revenue for the remainder of each year. This seasonality requires us to manage our cash flows over the course of the year. If our revenue or collections were to fall substantially below what we would normally expect during certain periods, our ability to service debt and meet our other liquidity requirements may be adversely affected, which could have a material adverse effect on our business, prospects, results of operations, and financial condition.
Risks Related to the Separation and the Distribution
We may be responsible for U.S. federal and state income tax liabilities that relate to the distribution.
Prior to the distribution, Cash America received a private letter ruling from the IRS, or the IRS Ruling, to the effect that the retention by Cash America of up to 20% of Enova’s stock will not be in pursuant to a plan having as one of its principal purposes the avoidance of U.S. federal income tax within the meaning of Section 355(a)(1)(D)(ii) of the Internal Revenue Code, or the Code. Notwithstanding the IRS Ruling, the IRS could determine on audit that the retention of the Enova stock was in pursuant to a plan having as one of its principal purposes the avoidance of U.S. federal income tax if it determines that any of the facts, assumptions, representations or undertakings that we or Cash America have made or provided to the IRS are not correct. If the retention was in pursuant to a plan having as one of its principal purposes the avoidance of U.S. federal income tax, then the distribution could ultimately be determined to be taxable, and Cash America would recognize gain in an amount equal to the excess of the fair market value of shares of our common stock distributed to Cash America shareholders on the distribution date over Cash America’s tax basis in such shares of our common stock. Moreover, Cash America could incur significant U.S. federal and state income tax liabilities if it is ultimately determined that certain internal transactions undertaken in anticipation of the distribution are taxable. Under U.S. Treasury regulations each member of the Cash America consolidated group at the time of the distribution (including us and our subsidiaries), would be severally liable for the entire amount of any resulting U.S. federal income tax liability.
38
Table of Contents
Cash America has also received an opinion of tax counsel that the distribution will be treated as a transaction that is tax-free for U.S. federal income tax purposes under Section 355(a) of the Code. An opinion of tax counsel is not binding on the IRS. Accordingly, the IRS may reach conclusions with respect to the distribution that are different from the conclusions reached in the opinion. Like the IRS Ruling, the opinion is based on certain factual statements and representations, which, if incomplete or untrue in any material respect, could alter tax counsel’s conclusions. If, notwithstanding the receipt of the IRS Ruling and the opinion of tax counsel, the IRS were to determine the distribution to be taxable, Cash America would recognize a substantial tax liability.
The Tax Matters Agreement that we entered into in connection with the separation and distribution allocates the responsibility for taxes for periods prior to the distribution among Cash America and us. For periods prior to the distribution, generally we are required to reimburse Cash America with respect to any U.S. federal, state or local or foreign income taxes reportable on returns that include us that are attributable to us. We are responsible for filing and paying all U.S. federal, state or local or foreign income taxes that are reportable on returns that only include us. We and Cash America are responsible for certain non-income taxes, such as property, excise, sales and use taxes, attributable to each company and its respective subsidiaries.
Under the Tax Matters Agreement between Cash America and us that we entered into in connection with the separation and distribution, we are generally required to indemnify Cash America against any tax resulting from the distribution to the extent that such tax resulted from (i) an acquisition of all or a portion of our stock or assets, whether by merger or otherwise, (ii) other actions or failures to act by us or (iii) any of our representations or undertakings being incorrect. For a more detailed discussion, see “Certain Relationships and Related-Party Transactions—Agreements Between Us and Cash America—Tax Matters Agreement.” Our indemnification obligations to Cash America and its officers and directors are not limited by any maximum amount. If we are required to indemnify Cash America or such other persons under the circumstances set forth in the Tax Matters Agreement, we may be subject to substantial liabilities.
We may not realize the potential benefits from our separation from Cash America, and our historical and pro forma consolidated financial information is not necessarily indicative of our future prospects. We may be unable to achieve some or all of the benefits that we expect to achieve as an independent, publicly traded company.
We may not realize the potential benefits we expect from our separation from Cash America. In addition, we will incur significant costs, including those described below, which may exceed our estimates, and we will incur some negative effects from our separation from Cash America, including loss of access to some of the financial, managerial and professional resources from which we have benefited in the past.
The historical and pro forma consolidated financial information that we have included in this prospectus may not necessarily reflect what our financial position, results of operations or cash flows would have been had we been an independent entity during the periods presented or those that we will achieve in the future. The costs and expenses reflected in our historical consolidated financial information include an allocation for certain corporate functions historically provided by Cash America, including executive oversight, insurance and risk management, government relations, internal audit, treasury, licensing, and to a limited extent finance, accounting, tax, legal, human resources, compensation and benefits, compliance and support for certain information systems related to financial reporting that may be different from the comparable expenses that we would have incurred had we operated as a stand-alone company. We have not adjusted our historical or pro forma consolidated financial information to reflect changes that will occur in our cost structure and operations as a result of our transition to becoming a stand-alone public company, including changes in our employee base, potential increased costs associated with reduced economies of scale and increased costs associated with Securities and Exchange Commission, or the SEC, reporting and the NYSE requirements. Therefore, our historical and pro forma consolidated financial information may not necessarily be indicative of what our financial position, results of operations or cash flows will be in the future. Please refer to “Management’s Discussion and Analysis of Financial Condition and Results of Operations,” “Unaudited Pro Forma Consolidated Financial Statements” and our historical audited and unaudited consolidated financial statements and the notes to those statements included elsewhere in this prospectus.
39
Table of Contents
The one-time and ongoing costs of the distribution may be greater than we expected.
We will incur costs in connection with our transition to being a stand-alone public company that relate primarily to accounting, tax, legal and other professional costs; compensation, such as modifications to certain incentive awards upon completion of the distribution; recruiting and relocation costs associated with hiring additional senior management personnel; and costs to separate assets and information systems. In addition, we have already incurred costs of approximately $16.3 million in connection with obtaining independent financing that we will need in order to operate as a separate stand-alone company. These costs may be greater than anticipated and could have a material adverse effect on our business, financial condition, results of operations and cash flows.
We have no history operating as an independent public company. We will incur significant costs to create the corporate infrastructure necessary to operate as an independent public company and meet our legal and regulatory compliance requirements. We may be unable to make, on a timely or cost-effective basis, the changes necessary to operate as an independent company and meet our legal and regulatory compliance requirements.
We have historically used Cash America’s corporate infrastructure to support some of our business functions, including services related to executive oversight, insurance and risk management, government relations, internal audit, treasury, licensing, and to a limited extent finance, accounting, tax, legal, human resources, compensation and benefits, compliance and support for certain information systems related to financial reporting. The expenses related to establishing and maintaining this infrastructure were spread among all of Cash America’s businesses. Following the separation and after the expiration of the transition arrangements described below, we will no longer have access to Cash America’s infrastructure, and we will need to establish our own. We have begun incurring costs to establish the necessary infrastructure and expect to continue to incur such costs. See “Unaudited Pro Forma Consolidated Financial Statements” included elsewhere in this prospectus.
Cash America is only contractually obligated to provide to us those transition services specified in the Transition Services Agreement and the other agreements we entered into with Cash America in connection with the separation and the distribution. The expiration date of the Transition Services Agreement varies by service provided, but generally is no longer than 12 months from the distribution date. See “Certain Relationships and Related-Party Transactions—Agreements Between Us and Cash America—Transition Services Agreement” for a description of the terms of the Transition Services Agreement. We may be unable to replace in a timely manner or on comparable terms the services or other benefits that Cash America previously provided to us. Upon the expiration of the Transition Services Agreement or other agreements, many of the services that are covered in such agreements will be provided internally or by unaffiliated third parties. We expect that, in some instances, we will incur higher costs to obtain such services than we incurred prior to the separation and the distribution or under the terms of such agreements. If Cash America does not effectively perform the services that are called for under the Transition Services Agreement and other agreements, we may not be able to operate our business effectively, and our profitability may decline. After the expiration of the Transition Services Agreement and the other agreements, we may be unable to replace the services specified in such agreements in a timely manner or on comparable terms.
Furthermore, as discussed under “—Risks Related to Our Business and Industry” under the captions “—Our business is highly regulated, and if we fail to comply with applicable laws, regulations, rules and guidance, our business could be adversely affected,” “—The consumer lending industry continues to be targeted by new laws or regulations in many jurisdictions that could restrict the short-term consumer lending products and services we offer, impose additional compliance costs on us, render our current operations unprofitable or even prohibit our current operations,” “—We are subject to a Consent Order issued by the Consumer Financial Protection Bureau, and any noncompliance would materially adversely affect our business” and “—The United Kingdom has imposed, and continues to impose, increased regulation of the short-term high-cost credit industry with the stated expectation that some firms will exit the market,” we face significant ongoing legal and regulatory compliance requirements arising from the heavily regulated industry in which we operate, which continues to be targeted by lawmakers and regulators, and also from compliance with enforcement actions, orders and
40
Table of Contents
agreements issued by applicable regulators, such as the November 2013 Consent Order issued by the Consumer Financial Protection Bureau. In particular, the Consent Order requires us and Cash America to allocate resources to ensure that we have a compliance function that is commensurate with our size, complexity, product lines, and business operations to ensure the implementation of an adequate compliance program, including appropriate staffing levels with qualified and experienced personnel. If, as a stand-alone company, we are unable to maintain these resources in a timely manner or on comparable terms following the separation, we may face an increased risk of noncompliance with the Consent Order and other regulatory requirements or additional enforcement actions. These risks could have a material adverse impact on our business, prospects, results of operations, financial condition and could prohibit or directly or indirectly impair our ability to continue current operations.
In connection with our separation from Cash America, Cash America will indemnify us for certain liabilities, and we will indemnify Cash America for certain liabilities. If we are required to act on these indemnities to Cash America, we may need to divert cash to meet those obligations, and our financial results could be negatively impacted. In the case of Cash America’s indemnity, the indemnity could be insufficient to insure us against the full amount of such liabilities, or Cash America may be unable to satisfy its indemnification obligations in the future.
Pursuant to the Separation and Distribution Agreement and other agreements with Cash America, Cash America agreed to indemnify us for certain liabilities, and we agreed to indemnify Cash America for certain liabilities, in each case for uncapped amounts, as discussed further in “Certain Relationships and Related-Party Transactions—Agreements Between Us and Cash America.” Indemnities that we may be required to provide Cash America are not subject to any cap, may be significant and could negatively impact our business, particularly indemnities relating to our actions that could impact the tax-free nature of the distribution. Third parties could also seek to hold us responsible for any of the liabilities that Cash America has agreed to retain. Further, the indemnity from Cash America could be insufficient to protect us against the full amount of such liabilities, or Cash America may be unable to fully satisfy its indemnification obligations. Moreover, even if we ultimately succeed in recovering from Cash America any amounts for which we are held liable, we may be temporarily required to bear these losses ourselves. Each of these risks could negatively affect our business, prospects, results of operations, financial condition and cash flows.
Fulfilling our obligations incident to being a public company, including with respect to the requirements of and related rules under the Sarbanes-Oxley Act of 2002, will be expensive and time-consuming, and any delays or difficulties in satisfying these obligations could have a material adverse effect on our future results of operations and our stock price.
We have historically operated as a subsidiary of Cash America and have not been subject to financial and other reporting and corporate governance requirements of a stand-alone public company. As a stand-alone public company, we are required to file annual, quarterly and other reports with the SEC. We will need to prepare and timely file financial statements that comply with SEC reporting requirements. We are also subject to other reporting and corporate governance requirements under the listing standards of the NYSE and the Sarbanes-Oxley Act of 2002, or the Sarbanes-Oxley Act, which could impose significant new compliance costs and obligations upon us. The changes necessitated by becoming a stand-alone public company require a commitment of additional resources and management oversight which will increase our operating costs. These changes also place significant additional demands on our finance, accounting and legal staff and on our financial accounting and information systems. Other expenses associated with being a stand-alone public company include increases in auditing, accounting and legal fees and expenses, investor relations expenses, directors’ fees and director and officer liability insurance costs, registrar and transfer agent fees and listing fees, as well as other expenses. As a stand-alone public company, we are required, among other things, to:
| • | prepare and file periodic and current reports, and distribute other stockholder communications, in compliance with the federal securities laws and the NYSE; |
| • | define and expand the roles and the duties of our Board of Directors and its committees; |
41
Table of Contents
| • | institute comprehensive investor relations and internal audit functions and continue to enhance our compliance function; and |
| • | subject to applicable phase-in requirements, evaluate and maintain our system of internal control over financial reporting, and report on management’s assessment thereof, in compliance with rules and regulations of the SEC and the Public Company Accounting Oversight Board. |
In particular, beginning with the year ending December 31, 2015, we will be required to perform system and process evaluation and testing of our internal control over financial reporting to allow management to report on the effectiveness of our internal control over financial reporting, as required by Section 404(a) of the Sarbanes-Oxley Act. Likewise, our independent registered public accounting firm will be required to provide an attestation report on the effectiveness of our internal control over financial reporting pursuant to Section 404(b) of the Sarbanes-Oxley Act. In addition we are required under the Securities Exchange Act of 1934, as amended, or the Exchange Act, to maintain disclosure controls and procedures and internal control over financial reporting. Any failure to implement required new or improved controls, or difficulties encountered in their implementation, could harm our operating results or cause us to fail to meet our reporting obligations. If we are unable to conclude that we have effective internal control over financial reporting, or if our independent registered public accounting firm is unable to provide us with an unqualified report regarding the effectiveness of our internal control over financial reporting (at such time as it is required to do so), investors could lose confidence in the reliability of our financial statements. This could result in a decrease in the value of our common stock. Failure to comply with the Sarbanes-Oxley Act could potentially subject us to sanctions or investigations by the SEC or other regulatory authorities.
We are unable to take certain actions because such actions could jeopardize the tax-free status of the distribution, and such restrictions could be significant.
The Tax Matters Agreement prohibits us from taking actions that could reasonably be expected to cause the distribution to be taxable or to jeopardize the conclusions of the IRS Ruling or opinions of counsel received by us or Cash America. In particular, for two years after the distribution, we may not:
| • | enter into any agreement, understanding or arrangement or engage in any substantial negotiations with respect to any transaction involving the acquisition, issuance, repurchase or change of ownership of our capital stock, or options or other rights in respect of our capital stock, subject to certain exceptions relating to employee compensation arrangements and open market stock repurchases; |
| • | cease the active conduct of our business; or |
| • | voluntarily dissolve, liquidate, merge or consolidate with any other person, unless we survive and the transaction otherwise complies with the restrictions in the Tax Matters Agreement. |
Nevertheless, we are permitted to take any of the actions described above if we obtain Cash America’s consent, or if we obtain a supplemental IRS private letter ruling and an opinion of counsel that is reasonably acceptable to Cash America to the effect that the action will not affect the tax-free status of the distribution. However, the receipt by us of any such consent or opinion and ruling does not relieve us of any obligation we have to indemnify Cash America for an action we take that causes the distribution to be taxable to Cash America or its shareholders.
Because of these restrictions, for two years after the distribution, we may be limited in the amount of capital stock that we can issue to make acquisitions or to raise additional capital. Also, our indemnity obligation to Cash America may discourage, delay or prevent a third party from acquiring control of us during this two-year period in a transaction that our stockholders might consider favorable. See “Certain Relationships and Related-Party Transactions—Agreements Between Us and Cash America—Tax Matters Agreement” and “The Separation and the Distribution—Material U.S. Federal Income Tax Consequences of the Distribution.”
42
Table of Contents
We potentially could have received better terms from unaffiliated third parties than the terms we receive in our agreements with Cash America.
The agreements we entered into with Cash America in connection with the separation, including the Separation and Distribution Agreement, the Transition Services Agreement, the Tax Matters Agreement and the Software Lease and Maintenance Agreement, were negotiated in the context of the separation while we were still a wholly-owned subsidiary of Cash America. Accordingly, during the period in which the terms of those agreements were negotiated, we did not have had a Board of Directors independent of Cash America. As a result, the terms of those agreements may not reflect terms that would have resulted from arm’s-length negotiations between unaffiliated third parties. The terms of the agreements negotiated in the context of the separation relate to, among other things, the allocation of assets, liabilities, rights and other obligations between Cash America and us. Arm’s-length negotiations between Cash America and an unaffiliated third party in another form of transaction, such as a buyer in a sale of a business transaction, may have resulted in more favorable terms to the unaffiliated third party. See “Certain Relationships and Related-Party Transactions—Agreements Between Us and Cash America” included elsewhere in this prospectus.
We are subject to continuing contingent liabilities of Cash America.
There are several significant areas where the liabilities of Cash America may become our obligations. For example, under the Code and the related rules and regulations, each corporation that was a member of the Cash America consolidated U.S. federal income tax reporting group during any taxable period or portion of any taxable period ending on or before the effective time of the distribution is jointly and severally liable for the U.S. federal income tax liability of the entire Cash America consolidated tax reporting group for that taxable period. In connection with the separation, we entered into a Tax Matters Agreement with Cash America that allocates the responsibility for prior period taxes of the Cash America consolidated tax reporting group between us and Cash America. See “Certain Relationships and Related-Party Transactions—Agreements Between Us and Cash America—Tax Matters Agreement.” However, if Cash America is unable to pay any prior period taxes for which it is responsible, we could be required to pay the entire amount of such taxes.
The separation and distribution may expose us to potential liabilities arising out of state and federal fraudulent conveyance laws and legal distribution requirements.
The separation and distribution could be challenged under various state and federal fraudulent conveyance laws. An unpaid creditor or an entity vested with the power of such creditor (such as a trustee or debtor-in-possession in a bankruptcy) could claim that the distribution left Cash America insolvent or with unreasonably small capital or that Cash America intended or believed it would incur debts beyond its ability to pay such debts as they mature and that Cash America did not receive fair consideration or reasonably equivalent value in the separation and distribution. If a court were to agree with such a plaintiff, then such court could void the distribution as a fraudulent transfer and could impose a number of different remedies, including without limitation, returning our assets or your shares in our company to Cash America, voiding our liens and claims against Cash America, or providing Cash America with a claim for money damages against us in an amount equal to the difference between the consideration received by Cash America and the fair market value of our company at the time of the distribution.
The measure of insolvency for purposes of the fraudulent conveyance laws will vary depending on which jurisdiction’s law is applied. Generally, however, an entity would be considered insolvent if either the fair saleable value of its assets is less than the amount of its liabilities (including the probable amount of contingent liabilities), or it is unlikely to be able to pay its liabilities as they become due. We do not know what standard a court would apply to determine insolvency. Further, a court could determine that Cash America was insolvent at the time of or after giving effect to the distribution of Enova common stock.
Under the Separation and Distribution Agreement, we are responsible for the debts, liabilities and other obligations related to the business or businesses which we own and operate. Although we do not expect to be
43
Table of Contents
liable for any obligations not expressly assumed by us pursuant to the Separation and Distribution Agreement, it is possible that we could be required to assume responsibility for certain obligations retained by Cash America should Cash America fail to pay or perform its retained obligations. See “Certain Relationships and Related-Party Transactions—Agreements Between Us and Cash America—Separation and Distribution Agreement.”
Certain members of management, directors and stockholders may face actual or potential conflicts of interest.
Our management and directors and the management and directors of Cash America may own both Cash America common stock and our common stock. This ownership overlap could create, or appear to create, potential conflicts of interest when our management and directors and Cash America’s management and directors face decisions that could have different implications for us and Cash America. For example, potential conflicts of interest could arise in connection with the resolution of any dispute between us and Cash America regarding the terms of the agreements governing the distribution and our relationship with Cash America thereafter or in the strategy for defending or resolving any litigation in which both Cash America and Enova are involved. These agreements include the Separation and Distribution Agreement, the Tax Matters Agreement, the Transition Services Agreement, the Software Lease and Maintenance Agreement and any commercial agreements between the parties or their affiliates. Potential conflicts of interest may also arise because one of our directors, Daniel R. Feehan, is currently the President and Chief Executive Officer of Cash America. Further, conflicts of interest may arise out of any commercial arrangements that we or Cash America may enter into in the future.
We do not have a non-competition agreement with Cash America to restrict Cash America from competing with us, and Cash America is not required to offer corporate opportunities to us.
We do not have any noncompetition agreement or arrangement with Cash America. Cash America is free to compete with us in any activity or line of business. Additionally, Cash America continues to offer alternative financial services and other financial services to consumers through its retail locations in markets served by us and is not restricted from reentering the online financial services business such as ours. We will not have any interest or expectancy in any business activity, opportunity, transaction or other matter in which Cash America engages or seeks to engage merely because we engage in the same or similar lines of business. In addition, Cash America will have no duty to communicate its knowledge of, or offer, any potential business opportunity, transaction or other matter to us, and Cash America is free to pursue or acquire such business opportunity, including opportunities that would be in direct competition with us.
Risks Related to our Indebtedness
We have incurred significant indebtedness, which could adversely affect our financial condition and prevent us from fulfilling our obligations under anticipated agreements governing our indebtedness.
On May 30, 2014 we issued and sold $500 million in aggregate principal amount of the Notes in a private offering. The Notes bear interest at a rate of 9.75% and were sold at a discount of the principal amount thereof to yield 10.0% to maturity. All of the net proceeds from the Notes offering were paid to Cash America to repay all of our intercompany indebtedness and to pay a significant portion of a cash dividend to Cash America. In addition, we have certain registration obligations with respect to the Notes, and if we do not satisfy our obligations, we will be required to pay the holders of the Notes additional interest of 0.25% to 0.50% per annum until we satisfy our registration obligations in accordance with the terms of the related registration rights agreement. In addition, on May 14, 2014 we entered into the Credit Agreement that provides for our unsecured revolving line of credit in an aggregate principal amount of up to $75 million. Interest on the loans taken under the Credit Agreement will be charged, at our option, at either LIBOR for one week or one-, two-, three- or six-month periods, as selected by us, plus a margin varying from 2.50% to 3.75% or at the agent’s base rate plus a margin varying from 1.50% to 2.75%. The margin for the Credit Agreement borrowings is dependent on our cash flow leverage ratios. We will also be required to pay a fee on the unused portion of our revolving line of credit ranging from 0.25% to 0.50%
44
Table of Contents
based on our cash flow leverage ratios. The revolving line of credit was undrawn as of September 30, 2014, but had outstanding standby letters of credit of $3.0 million as of such date. For additional information regarding the Notes and our Credit Agreement, see “Financing Arrangements” in this prospectus.
Our level of debt could have important consequences to our stockholders, including:
| • | limiting our ability to obtain additional financing to fund future working capital, capital expenditures, acquisitions or other general corporate requirements; |
| • | requiring a substantial portion of our cash flows to be dedicated to debt service payments instead of other purposes, thereby reducing the amount of cash flows available for working capital, capital expenditures, acquisitions and other general corporate purposes; |
| • | increasing our vulnerability to general adverse economic and industry conditions; |
| • | exposing us to the risk of increased interest rates to the extent that our borrowings are at variable rates of interest; |
| • | limiting our flexibility in planning for and reacting to changes in the industry in which we compete; |
| • | placing us at a disadvantage compared to other, less leveraged competitors or competitors with comparable debt and more favorable terms and thereby affecting our ability to compete; and |
| • | increasing our cost of borrowing. |
We and our subsidiaries may incur significant additional indebtedness in the future. If new indebtedness is added to our current indebtedness levels after the distribution, the related risks that we face would increase.
The terms of the agreements governing our indebtedness restrict our current and future operations, particularly our ability to respond to changes or to take certain actions, which could harm our long-term interests.
The agreements governing our indebtedness (including the indenture governing the Notes and the Credit Agreement) contain various restrictive covenants and require that we maintain certain financial ratios that impose operating and financial restrictions on us and limit our ability to engage in actions that may be in our long-term best interests. These restrictive covenants, among other things, restrict our ability to:
| • | incur additional debt; |
| • | incur or permit certain liens to exist; |
| • | make certain investments; |
| • | merge or consolidate with or into, or convey, transfer, lease or dispose of all or substantially all of our assets to, another company; |
| • | make certain dispositions; |
| • | make certain payments; and |
| • | engage in certain transactions with affiliates. |
As a result of all of these covenants and restrictions, we may be:
| • | limited in how we conduct our business; |
| • | unable to raise additional debt or equity financing to operate during general economic or business downturns; or |
| • | unable to compete effectively or to take advantage of new business opportunities. |
45
Table of Contents
Any failure to comply with any of these financial and other affirmative and negative covenants could constitute an event of default under our debt agreements, entitling the lenders to, among other things, terminate future credit availability under our Credit Agreement, and/or increase the interest rate on outstanding debt, and/or accelerate the maturity of outstanding obligations under our debt agreements. Any such default could materially adversely affect our business, prospects, results of operations, financial condition and cash flows and could impair our ability to continue current operations. See “Financing Arrangements” for additional information concerning our indebtedness.
We may not be able to generate sufficient cash to service our indebtedness and may be forced to take other actions to satisfy our obligations under our indebtedness, which may not be successful.
Our ability to make scheduled payments on or refinance our debt obligations will depend on our financial condition and operating performance and our ability to enter into other debt financings, which are subject to prevailing economic and competitive conditions and to financial, business, legislative, regulatory, capital markets and other factors beyond our control. We might not be able to maintain a level of cash flows from operating activities sufficient to permit us to pay the principal, premium, if any, and interest on our indebtedness. For information regarding the risks to our business that could impair our ability to satisfy our obligations under our indebtedness, see “Risk Factors—Risks Related to Our Business and Industry.” If our cash flows and capital resources are insufficient to fund our debt service obligations, we could face substantial liquidity problems and could be forced to reduce or delay investments and capital expenditures or to dispose of material assets or operations, seek additional debt or equity capital or restructure or refinance our indebtedness. We may not be able to affect any such alternative measures on commercially reasonable terms or at all and, even if successful, those alternative actions may not allow us to meet our scheduled debt service obligations. If we cannot make scheduled payments on our debt, we will be in default, and lenders could declare all outstanding principal and interest to be due and payable, the lenders under our Credit Agreement could terminate their commitments to loan money and we could be forced into bankruptcy or liquidation. The agreements governing our indebtedness restrict our ability to dispose of assets and use the proceeds from those dispositions and also restrict our ability to raise debt or equity capital to be used to repay other indebtedness when it becomes due. We may not be able to consummate those dispositions or to obtain proceeds in an amount sufficient to meet any debt service obligations then due. Our inability to generate sufficient cash flows to satisfy our debt obligations, or to refinance our indebtedness on commercially reasonable terms or at all, would materially and adversely affect our financial condition, liquidity, results of operations and cash flows and our ability to satisfy our obligations under our indebtedness.
Changes in our financial condition or a potential disruption in the capital markets could reduce available capital.
If funds are not available from our operations and any excess cash or from our Credit Agreement, we will be required to rely on the banking and credit markets to meet our financial commitments and short-term liquidity needs. We also expect to periodically access the debt capital markets to obtain capital to finance growth. Efficient access to the debt capital markets will be critical to our ongoing financial success; however, our future access to the debt capital markets could become restricted due to a variety of factors, including a deterioration of our earnings, cash flows, balance sheet quality, or overall business or industry prospects, adverse regulatory changes, a disruption to or deterioration in the state of the capital markets or a negative bias toward our industry by market participants. Disruptions and volatility in the capital markets may cause banks and other credit providers to restrict availability of new credit. Due to the negative bias toward our industry, commercial banks and other lenders have restricted access to available credit to participants in our industry, and following the consummation of this offering, we may have more limited access to commercial bank lending than other businesses. Our ability to obtain additional financing in the future will depend in part upon prevailing capital market conditions, and a potential disruption in the capital markets may adversely affect our efforts to arrange additional financing on terms that are satisfactory to us, if at all. If adequate funds are not available, or are not available on acceptable terms, we may not have sufficient liquidity to fund our operations, make future investments, take advantage of acquisitions or other opportunities, or respond to
46
Table of Contents
competitive challenges and this, in turn, could adversely affect our ability to advance our strategic plans. Additionally, if the capital and credit markets experience volatility, and the availability of funds is limited, third parties with whom we do business may incur increased costs or business disruption and this could adversely affect our business relationships with such third parties.
Risks Related to our Common Stock and the Securities Market
Certain provisions of our amended and restated certificate of incorporation, amended and restated bylaws, Tax Matters Agreement, Separation and Distribution Agreement, Transition Services Agreement and Delaware law may discourage takeovers.
Our amended and restated certificate of incorporation authorizes our Board of Directors to issue preferred stock and to determine the designations, powers, preferences, and relative, participating, optional, or other special rights, if any, and the qualifications, limitations, or restrictions of our preferred stock, including the number of shares, in any series, without any further vote or action by the stockholders. The rights of the holders of our common stock will be subject to the rights of the holders of any preferred stock that may be issued in the future. The issuance of preferred stock could delay, deter, or prevent a change in control and could adversely affect the voting power or economic value of your shares.
In addition, some provisions of our amended and restated certificate of incorporation and amended and restated bylaws could make it more difficult for a third party to acquire control of us, even if the change of control would be beneficial to our stockholders, including:
| • | limitations on the ability of our stockholders to call special meetings; |
| • | limitations on the ability of our stockholders to act by written consent; |
| • | a separate vote of 80% of the voting power of the outstanding shares of capital stock in order for stockholders to amend the bylaws; and |
| • | advance notice provisions for stockholder proposals and nominations for elections to the Board of Directors to be acted upon at meetings of stockholders. |
Under the Tax Matters Agreement, we have agreed to indemnify Cash America for certain tax related matters, and we may be unable to take certain actions. See “—Risks Related to the Separation and the Distribution—We are unable to take certain actions because such actions could jeopardize the tax-free status of the distribution, and such restrictions could be significant.” We also entered into the Separation and Distribution Agreement, the Tax Matters Agreement and the Transition Services Agreement covering specified indemnification and other matters that may arise after the distribution. The Separation and Distribution Agreement, the Tax Matters Agreement and the Transition Services Agreement may have the effect of discouraging or preventing an acquisition of us or a disposition of our business.
There is no guarantee that our common stock will sustain an active trading market that will provide you with adequate liquidity for our common stock. In addition, the market price of our shares may fluctuate widely.
An active trading market for our common stock may not be sustained following the distribution. In addition, until the market has fully evaluated our business and potentially thereafter, the price at which our common stock trades may fluctuate significantly.
The market price of our common stock may also be influenced by many other factors, some of which are beyond our control, including, among other things:
| • | changes in federal, state or foreign laws and regulations affecting our industry; |
| • | actual or anticipated variations in quarterly and annual operating results; |
47
Table of Contents
| • | changes in financial estimates and recommendations by research analysts following our common stock or the failure of research analysts to cover our common stock after the distribution; |
| • | actual or anticipated changes in the United States or foreign economies; |
| • | terrorist acts or wars; |
| • | announcements by us or our competitors of significant acquisitions, strategic partnerships, divestitures, joint ventures, or other strategic initiatives; |
| • | actual or anticipated sales or distributions of shares of our common stock by Cash America, as well as by our officers and directors, whether in the market or in subsequent public offerings; |
| • | the trading volume of our common stock; and |
| • | the other risks and uncertainties described herein. |
The stock markets have experienced price and volume fluctuations that have affected and continue to affect the market price of equity securities of many companies. These fluctuations have often been unrelated or disproportionate to the operating performance of these companies. These broad market fluctuations, as well as general economic, systemic, political, and market conditions, such as recessions, loss of investor confidence, or interest rate changes, may negatively affect the market price of our common stock.
Future sales or distributions of our common stock, including the sale by Cash America of the shares of our common stock that it has retained, could depress the market price for shares of our common stock.
The shares of our common stock that Cash America distributed to its shareholders generally may be sold immediately in the public market. It is possible that some shareholders of Cash America, including possibly some of Cash America’s major shareholders and index fund investors, will sell our common stock received in the distribution for various reasons (for example, if our business profile or market capitalization as an independent company does not fit their investment objectives). The sales of significant amounts of our common stock or the perception in the market that this will occur may result in the lowering of the market price of our common stock. In addition, Cash America retained a 20 percent ownership interest in our common stock. Pursuant to a Stockholder’s and Registration Rights Agreement with Cash America, Cash America is required to vote such shares in proportion to the votes cast by our other stockholders and has granted a related proxy to us to vote its shares in accordance with such requirement. See “Certain Relationships and Related-Party Transactions—Agreements Between Us and Cash America—Stockholder’s and Registration Rights Agreement” included elsewhere in this prospectus. In order to not jeopardize the tax-free status of the distribution, Cash America is required to dispose of such retained shares (other than the shares retained for delivery under Cash America’s long-term incentive plans as described in this prospectus) of our common stock that it owns as soon as practicable and consistent with its reasons for retaining such shares, but in no event no later than two years after the distribution. Pursuant to the Stockholder’s and Registration Rights Agreement, we agreed that, upon the request of Cash America, we will use our best efforts to effect the registration under applicable securities laws of the shares of common stock retained by Cash America and not otherwise registered and sold pursuant to the registration statement of which this prospectus forms a part. Any disposition by Cash America, or any significant shareholder, of our common stock in the public market, or the perception that such dispositions could occur, could adversely affect prevailing market prices for our common stock.
If securities or industry analysts publish research that is unfavorable about our business, our stock price and trading volume could decline.
The trading market for our common stock will depend in part on the research and reports that securities or industry analysts publish about us or our business. We currently have a limited number of analysts who are publishing research about us. In the event that one or more of our analysts downgrades our stock or publishes misleading or unfavorable research about our business, our stock price could decline. If one or more of these
48
Table of Contents
analysts ceases coverage of our company, demand for our stock may decrease, which could cause our stock price or trading volume to decline.
We do not anticipate paying any dividends on our common stock in the foreseeable future. As a result, you will need to sell your shares of common stock to receive any income or realize a return on your investment.
We do not anticipate paying any dividends on our common stock in the foreseeable future. Any declaration and payment of future dividends to holders of our common stock may be limited by the provisions of the Delaware General Corporation Law, or DGCL, and are limited by the terms of the Credit Agreement and Notes. The future payment of dividends, if permitted by our Credit Agreement and the indenture governing the Notes, will be at the sole discretion of our Board of Directors and will depend on many factors, including our earnings, capital requirements, financial condition, and other considerations that our Board of Directors deems relevant. As a result, to receive any income or realize a return on your investment, you will need to sell your shares of common stock.
Our amended and restated certificate of incorporation designates the Court of Chancery of the State of Delaware as the exclusive forum for certain litigation that may be initiated by our stockholders, which could limit our stockholders’ ability to obtain a favorable judicial forum for disputes with us.
Our amended and restated certificate of incorporation provides that the Court of Chancery of the State of Delaware will be the sole and exclusive forum for (i) any derivative action or proceeding brought on our behalf, (ii) any action asserting a claim of breach of a fiduciary duty owed to us or our stockholders by any of our directors, officers, employees or agents, (iii) any action asserting a claim against us arising under the DGCL or (iv) any action asserting a claim against us that is governed by the internal affairs doctrine. By becoming a stockholder in our company, you will be deemed to have notice of and have consented to the provisions of our amended and restated certificate of incorporation related to choice of forum. The choice of forum provision in our amended and restated certificate of incorporation may limit our stockholders’ ability to obtain a favorable judicial forum for disputes with us.
49
Table of Contents
CAUTIONARY STATEMENT CONCERNING FORWARD-LOOKING STATEMENTS
This prospectus and other materials we have filed or will file with the SEC contain, or will contain, certain forward-looking statements regarding business strategies, market potential, future financial performance and other matters. You should not place undue reliance on these statements. These forward-looking statements give current expectations or forecasts of future events and reflect the views and assumptions of our senior management with respect to our business, financial condition, operations and prospects. When used in this prospectus, terms such as “believes,” “estimates,” “should,” “could,” “would,” “plans,” “expects,” “intends,” “anticipates,” “may,” “forecast,” “project” and similar expressions or variations as they relate to us or our management are intended to identify forward-looking statements. Forward-looking statements address matters that involve risks and uncertainties that are beyond our ability to control and, in some cases, predict. Accordingly, there are or will be important factors that could cause our actual results to differ materially from those indicated in these statements. Key factors that could cause our actual financial results, performance or condition to differ from the expectations expressed or implied in such forward-looking statements include, but are not limited to, the following:
| • | the effect of laws and regulations targeting our industry that directly or indirectly regulate or prohibit our operations or render them unprofitable or impractical; |
| • | the effect of and compliance with domestic and international consumer credit, tax and other laws and government rules and regulations applicable to our business, including changes in such laws, rules and regulations, or changes in the interpretation or enforcement thereof, and the regulatory and examination authority of the Consumer Financial Protection Bureau with respect to providers of consumer financial products and services in the United States and the Financial Conduct Authority in the United Kingdom; |
| • | changes in our U.K. business practices in response to the requirements of the Financial Conduct Authority; |
| • | the effect of and compliance with enforcement actions, orders and agreements issued by applicable regulators, such as the November 2013 Consent Order issued by the Consumer Financial Protection Bureau; |
| • | our ability to effectively operate as a stand-alone, public company; |
| • | our ability to process or collect consumer loans through the Automated Clearing House system; |
| • | the deterioration of the political, regulatory or economic environment in countries where we operate or in the future may operate; |
| • | the actions of third parties who provide, acquire or offer products and services to, from or for us; |
| • | public and regulatory perception of the consumer loan business and our business practices; |
| • | the effect of any current or future litigation proceedings and any judicial decisions or rule-making that affects us, our products or the legality or enforceability of our arbitration agreements; |
| • | changes in demand for our services, changes in competition and the continued acceptance of the online channel by our customers; |
| • | changes in our ability to satisfy our debt obligations or to refinance existing debt obligations or obtain new capital to finance growth; |
| • | a prolonged interruption in the operations of our facilities, systems and business functions, including our information technology and other business systems; |
| • | our ability to maintain an allowance or liability for estimated losses on consumer loans that are adequate to absorb credit losses; |
50
Table of Contents
| • | compliance with laws and regulations applicable to our international operations, including anti-corruption laws such as the Foreign Corrupt Practices Act and the U.K. Bribery Act 2010 and international anti-money laundering, trade and economic sanctions laws; |
| • | our ability to attract and retain qualified officers; |
| • | cyber-attacks or security breaches; |
| • | acts of God, war or terrorism, pandemics and other events; |
| • | the ability to successfully integrate newly acquired businesses into our operations; |
| • | interest rate and foreign currency exchange rate fluctuations; |
| • | changes in the capital markets, including the debt and equity markets; |
| • | the effect of any of the above changes on our business or the markets in which we operate; and |
| • | other risks and uncertainties described herein. |
All forward-looking statements involve risks, assumptions and uncertainties. The occurrence of the events described, and the achievement of the expected results, depend on many events, some or all of which are not predictable or within our control. Actual results may differ materially from expected results. See the section titled “Risk Factors” and elsewhere in this prospectus for a more complete discussion of these risks, assumptions and uncertainties and for other risks and uncertainties. These risks, assumptions and uncertainties are not necessarily all of the important factors that could cause actual results to differ materially from those expressed in any of our forward-looking statements. Other unknown or unpredictable factors also could harm our results. In light of these risks, uncertainties and assumptions, the forward-looking events discussed in this prospectus might not occur.
The forward-looking statements contained in this prospectus are expressly qualified in their entirety by this cautionary statement. The forward-looking statements included in this prospectus are made as of the date of this prospectus and we undertake no obligation to publicly update or revise any forward-looking statements to reflect new information, future events or otherwise, except as required by applicable securities law.
51
Table of Contents
CERTAIN RELATIONSHIPS AND RELATED-PARTY TRANSACTIONS
Procedures for Approval of Related Person Transactions
Our written related person transaction policy governs the review of any transaction, or series of transactions, involving amounts greater than $60,000 in which a director, director nominee, executive officer, 5% shareholder, members of their immediate families, or any entity of which any such person or any member of their immediate family is an officer, director, partner, principal or 5% shareholder (each, a “related person”) has a direct or indirect material interest. The policy does not cover transactions, or series of transactions, that involve (i) compensation arrangements of any executive officer, if such arrangements have been approved by the Board or one of its committees, (ii) less than $60,000, (iii) rates or charges that are determined by competitive bids, (iv) the rendering of services as a common or contract carrier, or public utility, at rates or charges fixed in conformity with law or governmental authority, or (v) services as a bank depositary of funds, transfer agent, registrar, trustee under a trust indenture or similar services. The policy also does not cover transactions, or series of transactions, that arise solely from the ownership of a class of our equity securities if all holders of that class of our equity securities received the same benefit on a pro rata basis.
The Nominating and Corporate Governance Committee, or another committee of the Board of Directors comprised of at least three independent directors who are not involved in the transaction, must approve, ratify or refer to the full Board of Directors related person transactions involving amounts from $60,000 to $120,000. For transactions involving amounts greater than $120,000, the Nominating and Corporate Governance Committee, or such other committee that has reviewed the transaction, will make a recommendation to the full Board of Directors concerning such related person transaction and the full Board of Directors will then ratify, approve or disapprove of such transaction. A director may not participate in the review or approval of any transaction involving himself or any of his affiliates or family members. In addition, if shareholder approval is required under the NYSE rules, our articles of incorporation or applicable law for any related person transaction, our related person transaction policy requires us to seek shareholder approval for such transaction.
If it is impractical or undesirable to wait until a committee or Board of Directors meeting to consummate a related person transaction involving $120,000 or less, the Nominating and Corporate Governance Committee chair may review and approve the transaction pursuant to the criteria set forth in the related person transaction policy. Another Nominating and Corporate Governance Committee member may review and approve the transaction if the chair is unavailable or if he, a family member or an affiliate of his is a party to the transaction. Such approval shall be reported to the Board of Directors at its next regularly scheduled meeting.
The Separation from Cash America
Our separation from Cash America was accomplished by means of the distribution by Cash America of 80 percent of the outstanding shares of Enova common stock to holders of Cash America common stock entitled to such distribution, as described under “The Separation and the Distribution” included elsewhere in this prospectus.
Historical Relationship with Cash America
Prior to the distribution, we were a wholly-owned subsidiary of Cash America. Cash America historically provided corporate services such as executive oversight, insurance and risk management, government relations, internal audit, treasury, licensing, and to a limited extent finance, accounting, tax, legal, human resources, compensation and benefits, compliance and support for certain information systems related to financial reporting for which we are now responsible. Expenses allocated to us by Cash America relating to these services were $7.9 million for the nine months ended September 30, 2014, and $10.0 million, $10.6 million and $18.0 million for the years ended December 31, 2013, 2012 and 2011, respectively.
52
Table of Contents
Historically, we funded our strategic and operating capital needs through a combination of cash flows from operating activities and affiliate advances from Cash America. Our affiliate advances were evidenced through borrowings under an intercompany credit agreement with Cash America. On May 30, 2014 we issued and sold the Notes in a private offering and terminated our credit agreement with Cash America. We used all of the net proceeds, or $479.0 million, of the Notes offering to repay all of our intercompany indebtedness due to Cash America, which was $361.4 million as of May 30, 2014, and the remaining net proceeds in the amount of $117.6 million were used to pay a significant portion of a dividend to Cash America. We expect that our operating needs will be satisfied by a combination of cash flows from operations and borrowings under our Credit Agreement. We are no longer able to obtain financing from Cash America. As such, we are not able to rely on Cash America to fund our business and will be required to utilize other sources of financing to develop and operate our business. In addition, prior to the separation and distribution and when we were a subsidiary of Cash America, we also guaranteed Cash America’s long-term debt. These guarantees were released in connection with the separation and distribution.
On May 30, 2014, we paid Cash America a $120.7 million dividend, or the Cash America Dividend, a substantial portion of which was paid from the net proceeds under the Notes. We also paid a cash dividend of $1.7 million to Cash America on June 30, 2014. Additionally, on September 6, 2011, we paid Cash America a $75.0 million dividend, which was evidenced by a promissory note payable to Cash America that was subsequently included in the borrowings evidenced by our credit agreement with Cash America (which was terminated following the Notes offering).
Prior to the separation and distribution, Cash America guaranteed our performance of our obligations to third party lenders under our CSO programs, totaling $35.4 million and $41.4 million as of September 30, 2014 and December 31, 2013, respectively, and our obligations under the leases covering certain of our leased premises for which we are liable for an aggregate amount of approximately $5.9 million to be paid during the remaining lease term that expires on June 30, 2017, which amount will decline over time. Cash America no longer guarantees our obligations to third-party lenders that participate in our CSO programs but still guarantees our obligations under the leases covering our current headquarters location. We have agreed to indemnify Cash America for any liability incurred by it based on guarantees of our obligations under the leases covering our current headquarters location.
On December 22, 2011, we purchased preferred stock representing a minority interest in BillFloat, Inc., a Delaware corporation that is now known as Better Finance, Inc., from Cash America. The purchase price of $5.0 million was paid to Cash America through borrowings under our credit agreement with Cash America. The purchase price was not determined in an arm’s length transaction and no independent valuation was made. Rather, the purchase price represents the amount Cash America paid to originally purchase the minority interest in BillFloat, Inc. on March 31, 2011. Cash America sold us the minority interest in BillFloat, Inc., in part, to more effectively align this asset with the assets held by its online short-term consumer loan subsidiaries. BillFloat, Inc. is an early stage privately-held consumer financial services entity.
Related-Party Transactions
Prior to the distribution, we were a subsidiary of Cash America and we engaged in related-party transactions with Cash America. Those transactions are described in more detail in Note 14 of notes to consolidated financial statements for the year ended December 31, 2013 that accompany our audited consolidated financial statements included elsewhere in this prospectus and in the other disclosure in this section “Certain Relationships and Related-Party Transactions.”
Prior to the distribution, we paid Cash America compensation for loans made to or arranged for customers who were referred from Cash America. We paid $1.1 million and $0.9 million for the nine months ended September 30, 2014 and 2013, respectively, pursuant to this arrangement. In addition, prior to the distribution, we administered the consumer loan underwriting model utilized by Cash America’s Retail Services Division in exchange for the reimbursement of our direct third-party costs incurred in providing the service. We received $0.5 million and $0.7 million for the nine months ended September 30, 2014 and 2013, respectively, pursuant to this arrangement.
53
Table of Contents
As discussed under “Corporate Governance and Management—Executive Officers,” the individuals listed below are executive officers of Enova. As executive officers of Enova, each person is considered a “related person” (as defined in Item 404(a) of SEC Regulation S-K). On the date of the distribution, unvested RSUs of Cash America common stock held by Mr. Fisher, our president and chief executive officer, (as shown below) vested. See “Security Ownership of Beneficial Owners and Management” for information regarding the shares of Enova that Mr. Fisher will receive in connection with these RSUs and the distribution. The number of Cash America RSUs that vested, the approximate expense thereof, and the approximate dollar value of the related-persons’ interests in the transaction are as follows:
| Name |
No. of Cash America Restricted Stock Units Held as of November 12, 2014 (1) |
Amount of Expense (2) |
Approximate Dollar Value of Shares as of November 12, 2014 (3) |
|||||||||
| David A. Fisher |
14,260 | $ | 687,189 | $ | 728,686 | |||||||
| Kirk Chartier |
— | — | — | |||||||||
| Alex T. King |
— | — | — | |||||||||
| Arad Levertov |
— | — | — | |||||||||
| Robert S. Clifton |
— | — | — | |||||||||
| Joseph DeCosmo |
— | — | — | |||||||||
| Sean Rahilly |
— | — | — | |||||||||
| Daniel Shteyn |
— | — | — | |||||||||
| Lisa M. Young |
— | — | — | |||||||||
| (1) | On January 29, 2013 Mr. Fisher received a special one-time grant of 14,260 Cash America RSUs. The number of RSUs granted to Mr. Fisher by Cash America was determined by dividing $600,000 by the average closing price of Cash America common stock for the 20 trading-day period ending on the day before the grant date. |
| (2) | The amount shown represents the grant date fair value in compliance with ASC 718, Compensation—Stock Compensation, or ASC 718, for RSU awards granted under Cash America’s long-term incentive plan. In accordance with ASC 718, the amount in this column was calculated by multiplying the number of RSUs granted by the closing stock price of Cash America’s common stock on the last trading day preceding the grant date, which was $48.19. |
| (3) | The approximate dollar value of the RSU grant was calculated by multiplying the number of RSUs granted by the closing stock price of Cash America’s common stock on the day prior to the distribution, or November 12, 2014, which was $51.10. Mr. Fisher’s RSUs vested on the date of the distribution. |
In addition, Cash America granted cash-based performance unit awards to our officers and certain other employees in 2012, 2013 and 2014. Any of the cash-based performance units granted in 2013 and 2014 that were scheduled to vest within twelve months from the date of separation vested on the effective date of the separation, with the vested value to be paid in cash. The value of vested cash-based performance units granted in 2013 and 2014 was based on our earnings before interest, taxes, depreciation and amortization adjusted for certain items, or LTI Adjusted EBITDA, for the most recent twelve-calendar month period ending before the date of the separation, or October 2014, compared to (i) our 2012 LTI Adjusted EBITDA for the awards granted in 2013 and (ii) our 2013 LTI Adjusted EBITDA for the awards granted in 2014. The remaining portion of these cash-based performance unit awards that were scheduled to vest after the date of our separation were terminated. In addition, the cash-based performance unit awards that were granted to our officers and certain other employees in July 2012 that were scheduled to vest on January 1, 2015, which is their final vesting date, vested on the effective date of the separation and distribution, with the vested value to be paid in cash. The value of these cash-based performance units that were granted in July 2012 was as follows: (i) 50% was based on our year-to-date LTI Adjusted EBITDA through the last day of the calendar month preceding or coincident with the date of the separation compared to the same period year-to-date LTI Adjusted EBITDA for the year prior to the separation, (ii) 25% was based on our 2013 LTI Adjusted EBITDA compared to our 2012 LTI Adjusted EBITDA, and (iii) 25% was based on our LTI Adjusted EBITDA for the last six months of 2012 compared to our LTI Adjusted EBITDA for the last six months of 2011.
54
Table of Contents
The cash payments to be made for the performance units that vested on the date of distribution under these awards was determined in accordance with the provisions described above. The performance units that vested for each executive officer upon the distribution, and the amount that will be paid to each executive officer in December 2014 is set forth below:
| Performance Units that Vested on the Distribution Date | Total Value of the Performance Units |
|||||||||||||||
| Name | Performance Units Granted in 2012 |
Performance Units Granted in 2013 |
Performance Units Granted in 2014 |
|||||||||||||
| David A. Fisher |
— | 5,125.500 | 1,528.125 | $ | 972,522 | |||||||||||
| Kirk Chartier |
— | — | 481.500 | $ | 111,116 | |||||||||||
| Alex T. King |
4,668 | 3,986.625 | 848.875 | $ | 1,626,954 | |||||||||||
| Arad Levertov |
3,668 | 2,684.625 | 918.375 | $ | 1,263,869 | |||||||||||
| Robert S. Clifton |
1,934 | 1,291.875 | 405.875 | $ | 628,286 | |||||||||||
| Joseph DeCosmo |
— | — | 390.000 | $ | 90,001 | |||||||||||
| Sean Rahilly |
— | — | 339.125 | $ | 78,260 | |||||||||||
| Daniel Shteyn |
1,934 | 895.500 | 353.250 | $ | 551,942 | |||||||||||
| Lisa M. Young |
1,934 | 1,310.625 | 413.875 | $ | 633,169 | |||||||||||
See “Compensation Discussion and Analysis—Compensation Actions Taken in Connection with the Separation and Distribution” for a discussion of long-term incentive awards under the Enova LTIP that our management development and compensation committee has approved to be made to our executive officers, including our named executive officers. These awards will include (a) restricted stock units and (b) a special one-time grant of options to purchase Enova stock. These awards will be granted on the 30th day following the distribution date.
We have in effect a Code of Business Conduct and Ethics, or the Code of Conduct, and a Statement of Policy for the Review, Approval or Ratification of Transactions with Related Persons, or the Related-Party Transaction Policy. The Code of Conduct prohibits our employees from entering into a transaction with companies in which the employee, a family relative of the employee or personal friend of the employee has a financial or other interest for the purpose of benefiting the associate, relative or friend without the approval of the associate’s supervisor or the legal department. The Related-Party Transaction Policy requires a member of management to notify our Board of Directors, or the Board, or an appropriate committee of the Board, of any transaction or relationship that arises and of which she or he becomes aware that reasonably could be expected to constitute a related-party transaction. For purposes of the company’s Related-Party Transaction Policy, a related-party transaction includes a transaction in which the company (including its affiliates) is a participant and in which any director, executive officer or shareholder owning at least 5% of the total equity of Enova (or any of their respective immediate family members or an entity in which such director, executive officer, shareholder or any of their respective immediate family members holds or controls more than 5% of such entity’s total equity) has or will have a direct or indirect material interest. For so long as Cash America continues to be a related party, including due to its retained ownership in Enova, future transactions with Cash America are related-party transactions subject to the Code of Conduct and the Related-Party Transaction Policy. Any such transaction or relationship will be reviewed by our company’s management or the appropriate Board committee to ensure it does not constitute a conflict of interest and is reported appropriately. Additionally, the Nominating and Governance Committee’s charter provides for the committee to conduct an annual review of related-party transactions between each of our directors and the company (and its affiliates) and to make recommendations to the Board of Directors regarding the continued independence of each Board member.
Agreements Between Us and Cash America
As part of the separation and the distribution, we entered into a Separation and Distribution Agreement and several other agreements with Cash America to effect the separation and to provide a framework for our relationship with Cash America after the separation and the distribution. These agreements provide for the allocation between us and
55
Table of Contents
Cash America of the assets, liabilities and obligations of Cash America and its subsidiaries, and govern various aspects of the relationship between us and Cash America subsequent to the separation, including with respect to transition services, registrations rights, tax matters and other commercial relationships. In addition to the Separation and Distribution Agreement, which contains key provisions related to the separation and the distribution, these agreements include:
| • | Tax Matters Agreement; |
| • | Transition Services Agreement; |
| • | Stockholder’s and Registration Rights Agreement; and |
| • | Software Lease and Maintenance Agreement. |
The agreements described below have been filed as exhibits to the registration statement of which this prospectus is a part. The summaries of the material terms of these agreements are qualified in their entirety by reference to the full text of the applicable agreements, which are incorporated by reference into this prospectus.
Separation and Distribution Agreement
The Separation and Distribution Agreement governs the terms of the separation of our e-commerce business from Cash America’s retail services business. Generally, the Separation and Distribution Agreement includes Cash America’s and our agreements relating to the restructuring steps to be taken to complete the separation, including the assets, equity interests and rights to be transferred, liabilities to be assumed, contracts to be assigned and related matters. The Separation and Distribution Agreement provides for Cash America and us to transfer specified assets (including the equity interests of certain Cash America subsidiaries, if necessary) and liabilities between the companies that operate the e-commerce business after the distribution, on the one hand, and Cash America’s remaining storefront retail services business, on the other hand. The Separation and Distribution Agreement also requires that we file a registration statement to register the shares of common stock retained by Cash America, including the shares retained by Cash America for delivery under Cash America’s long-term incentive plans. We have filed the registration statement of which this prospectus forms a part in order to satisfy that obligation.
Except as expressly set forth in the Separation and Distribution Agreement or any ancillary agreement, neither Cash America nor Enova made any representation or warranty as to the assets, equity interests, business or liabilities transferred or assumed as part of the separation, as to any approvals or notifications required in connection with the transfers, as to the value or freedom from any security interests of any of the assets transferred, as to the absence or presence of any defenses or right of setoff or freedom from counterclaim with respect to any claim or other asset of either Cash America or Enova or as to the legal sufficiency of any assignment, document or instrument delivered to convey title to any asset or thing of value transferred in connection with the separation. All assets were transferred on an “as is,” “where is” basis and the respective transferees bear the economic and legal risks that any conveyance will prove to be insufficient to vest in the transferee good and marketable title, free and clear of any security interest, and that any necessary consents or governmental approvals were not obtained or that any requirements of laws, agreements, security interests or judgments were not complied with.
Tax Matters Agreement
The Tax Matters Agreement governs Cash America’s and our respective rights, responsibilities and obligations with respect to taxes (including taxes arising in the ordinary course of business and taxes, if any, incurred as a result of any failure of the distribution and certain related transactions to qualify as tax-free for federal income tax purposes), tax attributes, tax returns, tax contests and certain other tax matters.
56
Table of Contents
In general, under the Tax Matters Agreement, responsibility for taxes for periods prior to the distribution was allocated in the following manner:
| • | With respect to any U.S. federal income taxes of the affiliated group of which Cash America is the common parent, Cash America generally is responsible for filing and paying all such taxes, and we will reimburse Cash America for the portion of the taxes attributable to us. |
| • | With respect to U.S. state or local income taxes of any state or local consolidated, combined or unitary group that includes Cash America or one of its subsidiaries and us, Cash America generally is responsible for filing and paying such taxes of the consolidated, combined or unitary group, and we will reimburse Cash America for the portion of the consolidated or combined taxes attributable to us. |
| • | Cash America generally is responsible for filing and paying any U.S. federal, state or local or foreign income taxes reportable on returns that include only Cash America and its subsidiaries (excluding us and our subsidiaries), and we generally are responsible for filing and paying any U.S. federal, state or local or foreign income taxes reportable on returns that include only us or our subsidiaries. |
| • | We and Cash America are responsible for certain non-income taxes, such as property, excise, sales and use taxes, attributable to each company and its respective subsidiaries (or property owned by such company or one of its subsidiaries following the distribution). |
In addition, the Tax Matters Agreement imposes certain restrictions on us and our subsidiaries (including restrictions on share issuances, business combinations, sales of assets and similar transactions) that are designed to preserve the tax-free status of the distribution and certain related transactions. The Tax Matters Agreement provides special rules allocating tax liabilities in the event the distribution, together with certain related transactions, is not tax-free. In general, under the Tax Matters Agreement, each party is responsible for any taxes imposed on Cash America that arise from the failure of the distribution and certain related transactions to qualify as a tax-free transaction for federal income tax purposes within the meaning of Sections 355 and certain other relevant provisions of the Code to the extent that the failure to qualify is attributable to actions, events or transactions relating to such party’s respective stock, assets or business, or a breach of the relevant representations or covenants made by that party in the Tax Matters Agreement.
The Tax Matters Agreement also sets forth Cash America’s and our obligations as to the filing of tax returns, the administration of tax contests and assistance and cooperation on tax matters.
Transition Services Agreement
In connection with the separation and the distribution, we entered into a transition services agreement with Cash America, pursuant to which Cash America agreed to provide to us, on a transitional basis, certain information systems support generally consistent with the services provided by Cash America to us before the separation. The charges for the transition services generally are intended to allow Cash America to fully recover the costs directly associated with providing the services to us, plus all out-of-pocket costs and expenses, with nominal profit. The charges for the transition services generally are approximately $18,000 per month plus reimbursement of Cash America’s out of pocket expenses. We have been preparing for the transition of the services provided by Cash America, or third-party providers on behalf of Cash America, to us under the transition services agreement. We expect that we will be able to complete the transition of those services on or before 12 months following the completion of the separation and distribution.
Subject to certain exceptions, Cash America’s liability for providing services under the transition services agreement generally is limited to the aggregate amount (excluding any third-party costs and expenses included in such amount) actually paid to Cash America by us pursuant to the transition services agreement. The transition services agreement also provides that Cash America shall not be liable to us for any consequential, special, indirect, incidental, punitive, or exemplary damages.
57
Table of Contents
Stockholder’s and Registration Rights Agreement
Prior to the distribution, we and Cash America entered into a Stockholder’s and Registration Rights Agreement pursuant to which we agreed that, upon the request of Cash America, we will use our best efforts to effect the registration under applicable federal and state securities laws of the shares of our common stock retained by Cash America after the distribution. In addition, Cash America granted us a proxy to vote the shares of our common stock that Cash America retained immediately after the distribution in proportion to the votes cast by our other stockholders. This proxy, however, will be automatically revoked as to a particular share upon any sale or transfer of such share from Cash America to a person other than Cash America, and neither the voting agreement nor the proxy limits or prohibits any such sale or transfer.
Software Lease and Maintenance Agreement
In connection with the separation and the distribution, we entered into a software lease and maintenance agreement with Cash America whereby we lease a version of our consumer loan underwriting model to Cash America for its use in its consumer credit business and provide maintenance of that model for a term of three (3) years with successive one (1) year renewal options until such time as either party elects to terminate the agreement. Cash America pays us lease and maintenance fees under this agreement.
58
Table of Contents
Cash America will receive all of the net proceeds from the sale of the shares of common stock offered hereby. We will not receive any of the proceeds from the sale of the shares of our common stock being sold by Cash America.
59
Table of Contents
Prior to the distribution, we were a subsidiary of Cash America. On November 13, 2014, Cash America completed the spin off of our company through a distribution to its shareholders of 80 percent of the outstanding shares of our common stock. In connection with the separation and distribution, Cash America retained 20 percent of our outstanding common stock, or 6,596,926 shares. Pursuant to the private letter ruling received from the Internal Revenue Service by Cash America in connection with the separation and distribution, Cash America is required to dispose of these shares (other than the shares retained for delivery under Cash America’s long-term incentive plans as described in this prospectus) within two years of the distribution date. The following table sets forth, as of December 1, 2014, certain information regarding the number of shares of our common stock registered on the registration statement of which this prospectus forms a part that may be sold from time to time in the offering by Cash America and Cash America’s beneficial ownership of our common stock.
In accordance with the rules of the SEC, “beneficial ownership” includes voting or investment power with respect to securities. The percentage of beneficial ownership reflected in the following table is based on 33,000,000 shares of common stock outstanding as of December 1, 2014. Pursuant to the stockholder’s and registration rights agreement, Cash America has agreed to vote our common stock that it retained in proportion to the votes cast by our other stockholders and granted us a proxy to vote its shares of our common stock in such proportion. The proxy is automatically revoked as to a particular share upon any sale or transfer of such share from Cash America to a person other than Cash America.
| Name and Address of Beneficial Owner |
Shares of Common Stock Beneficially Owned |
Percentage of Outstanding Shares Beneficially Owned |
||||||||||||||
| Before Offering | After Offering | Before Offering | After Offering | |||||||||||||
| Cash America International, Inc. |
6,596,926 | — | 20 | % | — | |||||||||||
| 1600 West 7th Street Fort Worth, Texas 76102 |
||||||||||||||||
For a description of our relationships with Cash America, please read “Certain Relationships and Related Party Transactions” included elsewhere in this prospectus. See also “Security Ownership of Certain Beneficial Owners and Management” for additional information regarding Cash America’s ownership of our common stock.
60
Table of Contents
We do not anticipate paying any dividends on our common stock in the foreseeable future. We currently intend to retain our future earnings for use in the operation and expansion of our business. The declaration and amount of any future dividends, however, will be determined by our Board of Directors and will depend on our financial condition, earnings and capital requirements, covenants associated with our debt obligations and any other factors that our Board of Directors believes are relevant. There can be no assurance, however, that we will pay any cash dividends on our common stock in the future. In addition, the terms of the indenture governing the Notes and our Credit Agreement limit our ability to pay future dividends. See “Management’s Discussion and Analysis of Financial Condition and Results of Operations—Liquidity and Capital Resources—Senior Notes” and “—Credit Agreement.”
61
Table of Contents
The following table sets forth our capitalization as of September 30, 2014. The information below does not necessarily reflect what our capitalization would have been had we operated as a separate, publicly traded company for the period presented and is not necessarily indicative of our future capitalization. You should read the information set forth below in conjunction with “Selected Historical Financial and Other Data,” “Management’s Discussion and Analysis of Financial Condition and Results of Operations” and the historical consolidated financial statements and the related notes included elsewhere in this prospectus (dollars in thousands).
| AS OF SEPTEMBER 30, 2014 | ||||
| Cash and cash equivalents |
$ | 104,241 | ||
|
|
|
|||
| Indebtedness: |
||||
| Credit Agreement (1) |
$ | — | ||
| Notes (2) |
500,000 | |||
| Unamortized discount on Notes (2) |
(5,979 | ) | ||
|
|
|
|||
| Total Indebtedness |
$ | 494,021 | ||
|
|
|
|||
| Equity: |
||||
| Total equity |
$ | 135,913 | ||
|
|
|
|||
| Total capitalization |
$ | 629,934 | ||
|
|
|
|||
| (1) | The revolving line of credit under the Credit Agreement was undrawn as of September 30, 2014, but we had $3.0 million of outstanding letters of credit thereunder as of such date. |
| (2) | The Notes have an aggregate principal amount of $500 million, but were issued at a $6.19 million discount from the principal amount. |
62
Table of Contents
UNAUDITED PRO FORMA CONSOLIDATED FINANCIAL STATEMENTS
The unaudited pro forma condensed consolidated financial data for the nine-month period ended September 30, 2014 and the year ended December 31, 2013 have been derived from our historical consolidated financial statements included elsewhere in this prospectus. The unaudited pro forma condensed consolidated financial statements reported below should be read in conjunction with the information under “Selected Historical Financial and Other Data,” “Management’s Discussion and Analysis of Financial Condition and Results of Operations” and the historical consolidated financial statements and the related notes thereto included in this prospectus. The summary unaudited pro forma condensed consolidated statement of operations data for the nine-month period ended September 30, 2014 and the year ended December 31, 2013 have been adjusted to give effect to the issuance of the Notes and Credit Agreement and the resulting repayment of all of our intercompany indebtedness due to Cash America and the payment of the Cash America Dividend as if these transactions had occurred as of January 1, 2014 and 2013, respectively. No material pro forma adjustments were necessary for the unaudited consolidated balance sheet at September 30, 2014.
Prior to the distribution, Cash America assessed us an overhead allocation charge for certain administrative services. These services included executive oversight, insurance and risk management, government relations, internal audit, treasury, licensing, and to a limited extent, finance, accounting, tax, legal, human resources, compensation and benefits, compliance and support for certain information systems related to financial reporting that may be different from the comparable expenses that we would have incurred had we operated as a stand-alone company. Our historical and pro forma financial statements include overhead allocation charges related to these services totaled $7.9 million for the nine months ended September 30, 2014 and $10.0 million for the year ended December 31, 2013. Management believes that these costs are not necessarily indicative of our ongoing administrative costs as a separate, stand-alone public company, however we have not included an adjustment for estimated overhead costs in the pro forma financial statements provided below.
The unaudited pro forma consolidated financial information set forth below is for illustrative purposes only and does not reflect what our results of operations would have been had the issuance of the Notes and the Credit Agreement and the use of proceeds therefrom, or the distribution, occurred on the dates indicated. Before the distribution, we operated as a division of Cash America. Therefore, our historical and pro forma consolidated financial information may not be representative of the results we would have achieved as a stand-alone public company and may not be a reliable indicator of our future results.
The unaudited pro forma consolidated financial information constitutes forward-looking information and is subject to certain risks and uncertainties that could cause actual results to differ materially from those anticipated. See “Cautionary Note Regarding Forward-Looking Statements.”
63
Table of Contents
ENOVA INTERNATIONAL, INC.
UNAUDITED PRO FORMA CONSOLIDATED STATEMENTS OF INCOME
Year Ended December 31, 2013
(in thousands)
| HISTORICAL AS REPORTED YEAR ENDED DECEMBER 31, 2013 |
PRO FORMA ADJUSTMENTS |
PRO FORMA YEAR ENDED DECEMBER 31, 2013 |
||||||||||
| Revenue |
$ | 765,323 | $ | — | $ | 765,323 | ||||||
| Cost of Revenue |
315,052 | — | 315,052 | |||||||||
|
|
|
|
|
|
|
|||||||
| Gross Profit |
450,271 | — | 450,271 | |||||||||
|
|
|
|
|
|
|
|||||||
| Expenses |
||||||||||||
| Marketing |
135,336 | — | 135,336 | |||||||||
| Operations and technology |
70,776 | — | 70,776 | |||||||||
| General and administrative |
84,420 | — | 84,420 | |||||||||
| Depreciation and amortization |
17,143 | — | 17,143 | |||||||||
|
|
|
|
|
|
|
|||||||
| Total Expenses |
307,675 | — | 307,675 | |||||||||
|
|
|
|
|
|
|
|||||||
| Income from Operations |
142,596 | — | 142,596 | |||||||||
| Interest expense |
(19,788 | ) | (32,224 | )(a) | (52,012 | ) | ||||||
| Foreign currency transaction loss |
(1,176 | ) | — | (1,176 | ) | |||||||
|
|
|
|
|
|
|
|||||||
| Income before Income Taxes |
121,632 | (32,224 | ) | 89,408 | ||||||||
| Provision for income taxes |
43,594 | (11,278 | )(b) | 32,316 | ||||||||
|
|
|
|
|
|
|
|||||||
| Net Income |
$ | 78,038 | $ | (20,946 | ) | $ | 57,092 | |||||
|
|
|
|
|
|
|
|||||||
| Diluted earnings per share |
$ | 2.36 | $ | (0.63 | ) | $ | 1.73 | |||||
|
|
|
|
|
|
|
|||||||
| (a) | Represents the elimination of affiliate interest expense resulting from the application of a portion of the net proceeds of the Notes issued and sold on May 30, 2014 to pay off the outstanding balance of our intercompany indebtedness due to Cash America with the corresponding addition of interest expense of $48.8 million and amortization of deferred debt issuance costs and debt discount of $3.2 million resulting from the issuance of the Notes and entry into the Credit Agreement. The pro forma interest expense is based on a coupon rate of 9.75% and an effective yield to maturity of 10.0% for the notes. No pro forma interest expense adjustment is made for our Credit Agreement. |
| (b) | Represents the tax effect of pro forma adjustments to income before income taxes using a statutory rate of 35% for the periods presented. |
64
Table of Contents
ENOVA INTERNATIONAL, INC.
UNAUDITED PRO FORMA CONSOLIDATED STATEMENTS OF INCOME
Nine Months Ended September 30, 2014
(in thousands)
| HISTORICAL AS REPORTED NINE MONTHS ENDED SEPTEMBER 30, 2014 |
PRO FORMA ADJUSTMENTS |
PRO FORMA NINE MONTHS ENDED SEPTEMBER 30, 2014 |
||||||||||
| Revenue |
$ | 615,115 | $ | — | $ | 615,115 | ||||||
| Cost of Revenue |
206,195 | — | 206,195 | |||||||||
|
|
|
|
|
|
|
|||||||
| Gross Profit |
408,920 | — | 408,920 | |||||||||
|
|
|
|
|
|
|
|||||||
| Expenses |
||||||||||||
| Marketing |
92,699 | — | 92,699 | |||||||||
| Operations and technology |
54,370 | — | 54,370 | |||||||||
| General and administrative |
82,525 | — | 82,525 | |||||||||
| Depreciation and amortization |
13,772 | — | 13,772 | |||||||||
|
|
|
|
|
|
|
|||||||
| Total Expenses |
243,366 | — | 243,366 | |||||||||
|
|
|
|
|
|
|
|||||||
| Income from Operations |
165,554 | — | 165,554 | |||||||||
| Interest expense |
(25,201 | ) | (13,935 | )(a) | (39,136 | ) | ||||||
| Foreign currency transaction loss |
(555 | ) | — | (555 | ) | |||||||
|
|
|
|
|
|
|
|||||||
| Income before Income Taxes |
139,798 | (13,935 | ) | 125,863 | ||||||||
| Provision for income taxes |
50,629 | (4,877 | )(b) | 45,752 | ||||||||
|
|
|
|
|
|
|
|||||||
| Net Income |
$ | 89,169 | $ | (9,058 | ) | $ | 80,111 | |||||
|
|
|
|
|
|
|
|||||||
| Diluted earnings per share |
$ | 2.70 | $ | (0.27 | ) | $ | 2.43 | |||||
|
|
|
|
|
|
|
|||||||
| (a) | Represents the elimination of affiliate interest expense resulting from the application of a portion of the net proceeds of the Notes issued and sold on May 30, 2014 to pay off the outstanding balance of our intercompany indebtedness due to Cash America with the corresponding addition of interest expense of $36.6 million and amortization of deferred debt issuance costs and debt discount of $2.5 million resulting from the issuance of the Notes and entry into the Credit Agreement. The pro forma interest expense is based on a coupon rate of 9.75% and an effective yield to maturity of 10.0% for the Notes. No pro forma interest expense adjustment is made for our Credit Agreement. |
| (b) | Represents the tax effect of pro forma adjustments to income before income taxes using a statutory rate of 35% for the periods presented. |
65
Table of Contents
SELECTED HISTORICAL FINANCIAL AND OTHER DATA
The following table sets forth a summary of our consolidated historical financial data as of and for the periods presented. The historical financial information as of December 31, 2013 and 2012 and for each of the years ended December 31, 2013, 2012 and 2011 has been derived from our audited consolidated financial statements included elsewhere in this prospectus. The historical financial information as of December 31, 2011, 2010 and 2009 and for each of the years ended December 31, 2010 and 2009 has been derived from our audited consolidated financial statements that are not included in this prospectus. The historical financial information as of and for each of the nine-month periods ended September 30, 2014 and 2013 has been derived from our unaudited interim consolidated financial statements included elsewhere in this prospectus. The unaudited interim consolidated financial statements included elsewhere in this prospectus have been prepared on substantially the same basis as the audited consolidated financial statements incorporated by reference in this prospectus. In the opinion of management, the unaudited interim financial data includes all adjustments, consisting of only normal nonrecurring adjustments, considered necessary for a fair presentation of this information. The results of operations for interim periods are not necessarily indicative of the results that may be expected for the entire year or any future interim period.
66
Table of Contents
SELECTED HISTORICAL FINANCIAL AND OTHER DATA
| (In thousands, except per share) | ||||||||||||||||||||||||||||
| NINE MONTHS ENDED SEPTEMBER 30, |
YEAR ENDED DECEMBER 31, | |||||||||||||||||||||||||||
| 2014 | 2013 | 2013 | 2012 | 2011 | 2010 | 2009 | ||||||||||||||||||||||
| (Unaudited) | (Unaudited) | |||||||||||||||||||||||||||
| Statement of Income Data: |
||||||||||||||||||||||||||||
| Revenue |
$ | 615,115 | $ | 556,553 | $ | 765,323 | $ | 660,928 | $ | 480,340 | $ | 378,317 | $ | 254,977 | ||||||||||||||
| Cost of Revenue |
206,195 | 228,547 | 315,052 | 288,474 | 201,687 | 164,957 | 109,174 | |||||||||||||||||||||
|
|
|
|
|
|
|
|
|
|
|
|
|
|
|
|||||||||||||||
| Gross Profit |
408,920 | 328,006 | 450,271 | 372,454 | 278,653 | 213,360 | 145,803 | |||||||||||||||||||||
|
|
|
|
|
|
|
|
|
|
|
|
|
|
|
|||||||||||||||
| Expenses |
||||||||||||||||||||||||||||
| Marketing |
92,699 | 94,592 | 135,336 | 108,810 | 73,329 | 59,197 | 32,775 | |||||||||||||||||||||
| Operations and technology |
54,370 | 52,505 | 70,776 | 63,505 | 52,371 | 40,983 | 29,915 | |||||||||||||||||||||
| General and administrative |
82,525 | 61,879 | 84,420 | 72,690 | 65,401 | 50,252 | 36,094 | |||||||||||||||||||||
| Depreciation and amortization |
13,772 | 12,986 | 17,143 | 13,272 | 11,263 | 8,559 | 7,297 | |||||||||||||||||||||
|
|
|
|
|
|
|
|
|
|
|
|
|
|
|
|||||||||||||||
| Total Expenses |
243,366 | 221,962 | 307,675 | 258,277 | 202,364 | 158,991 | 106,081 | |||||||||||||||||||||
|
|
|
|
|
|
|
|
|
|
|
|
|
|
|
|||||||||||||||
| Income from Operations |
165,554 | 106,044 | 142,596 | 114,177 | 76,289 | 54,369 | 39,722 | |||||||||||||||||||||
| Interest expense |
(25,201 | ) | (14,738 | ) | (19,788 | ) | (20,996 | ) | (17,420 | ) | (15,505 | ) | (11,852 | ) | ||||||||||||||
| Investment interest income |
— | — | — | — | — | 296 | — | |||||||||||||||||||||
| Foreign currency transaction gain (loss) |
(555 | ) | (1,023 | ) | (1,176 | ) | (342 | ) | (487 | ) | (156 | ) | 38 | |||||||||||||||
|
|
|
|
|
|
|
|
|
|
|
|
|
|
|
|||||||||||||||
| Income before Income Taxes |
139,798 | 90,283 | 121,632 | 92,839 | 58,382 | 39,004 | 27,908 | |||||||||||||||||||||
| Provision for income taxes |
50,629 | 31,959 | 43,594 | 33,967 | 21,350 | 14,183 | 10,205 | |||||||||||||||||||||
|
|
|
|
|
|
|
|
|
|
|
|
|
|
|
|||||||||||||||
| Net Income |
$ | 89,169 | $ | 58,324 | $ | 78,038 | $ | 58,872 | $ | 37,032 | $ | 24,821 | $ | 17,703 | ||||||||||||||
|
|
|
|
|
|
|
|
|
|
|
|
|
|
|
|||||||||||||||
| Earnings per share |
||||||||||||||||||||||||||||
| Earnings per common share, basic and diluted |
$ | 2.70 | $ | 1.77 | $ | 2.36 | $ | 1.78 | $ | 1.12 | $ | 0.75 | $ | 0.54 | ||||||||||||||
| Weighted average common shares outstanding, basic and diluted |
33,000 | 33,000 | 33,000 | 33,000 | 33,000 | 33,000 | 33,000 | |||||||||||||||||||||
| Other Financial Data: |
||||||||||||||||||||||||||||
| Adjusted EBITDA (a) |
$ | 179,326 | $ | 119,030 | $ | 162,239 | $ | 131,328 | $ | 87,552 | $ | 62,928 | $ | 47,019 | ||||||||||||||
| Capital expenditures |
$ | 9,858 | $ | 11,544 | $ | 14,872 | $ | 17,872 | $ | 15,073 | $ | 12,687 | $ | 12,360 | ||||||||||||||
| Gross profit margin |
66.5 | % | 58.9 | % | 58.8 | % | 56.4 | % | 58.0 | % | 56.4 | % | 57.2 | % | ||||||||||||||
| Adjusted EBITDA margin (a) |
29.2 | % | 21.4 | % | 21.2 | % | 19.9 | % | 18.2 | % | 16.6 | % | 18.4 | % | ||||||||||||||
| Domestic revenue |
$ | 344,003 | $ | 284,132 | $ | 395,549 | $ | 334,066 | $ | 254,752 | $ | 276,295 | $ | 214,479 | ||||||||||||||
| International revenue |
$ | 271,112 | $ | 272,421 | $ | 369,774 | $ | 326,862 | $ | 225,588 | $ | 102,022 | $ | 40,498 | ||||||||||||||
| Number of employees (at period end) |
1,096 | 995 | 1,027 | 993 | 872 | 756 | 593 | |||||||||||||||||||||
| Balance Sheet Data (at period end): |
||||||||||||||||||||||||||||
| Cash and cash equivalents (b) |
$ | 104,241 | $ | 61,381 | $ | 47,480 | $ | 37,548 | $ | 34,411 | $ | 17,653 | $ | 25,717 | ||||||||||||||
| Consumer loans, net (b) |
303,694 | 272,001 | 303,467 | 228,390 | 162,985 | 89,193 | 59,617 | |||||||||||||||||||||
| Total assets (b) |
760,438 | 676,847 | 692,152 | 612,868 | 529,740 | 419,071 | 373,022 | |||||||||||||||||||||
| Long-term debt (c) |
494,021 | 437,397 | 424,133 | 427,889 | 410,964 | 270,839 | 255,799 | |||||||||||||||||||||
| Total stockholder’s equity (c) |
135,913 | 151,804 | 173,048 | 97,416 | 41,849 | 79,577 | 55,352 | |||||||||||||||||||||
| Other Operating Data: |
||||||||||||||||||||||||||||
| Combined consumer loan balances, gross |
||||||||||||||||||||||||||||
| Short-term loans (d) |
$ | 86,211 | $ | 131,633 | $ | 122,165 | $ | 194,679 | $ | 182,939 | $ | 138,309 | $ | 106,587 | ||||||||||||||
| Installment loans |
194,636 | 162,944 | 179,230 | 121,570 | 60,213 | 14,892 | 3,017 | |||||||||||||||||||||
| Line of credit accounts |
128,275 | 99,606 | 125,802 | 42,700 | 21,648 | 10,963 | 11,553 | |||||||||||||||||||||
|
|
|
|
|
|
|
|
|
|
|
|
|
|
|
|||||||||||||||
| Total combined consumer loan balances, gross (d) |
$ | 409,122 | $ | 394,183 | $ | 427,197 | $ | 358,949 | $ | 264,800 | $ | 164,164 | $ | 121,157 | ||||||||||||||
|
|
|
|
|
|
|
|
|
|
|
|
|
|
|
|||||||||||||||
67
Table of Contents
| (a) | The table below shows a reconciliation of Adjusted EBITDA, a non-GAAP measure, to Net Income and Adjusted EBITDA as a percentage of total revenue, which is Adjusted EBITDA margin (dollars in thousands): |
| NINE MONTHS ENDED SEPTEMBER 30, |
YEAR ENDED DECEMBER 31, | |||||||||||||||||||||||||||
| 2014 | 2013 | 2013 | 2012 | 2011 | 2010 | 2009 | ||||||||||||||||||||||
| (Unaudited) | (Unaudited) | |||||||||||||||||||||||||||
| Net income |
$ | 89,169 | $ | 58,324 | $ | 78,038 | $ | 58,872 | $ | 37,032 | $ | 24,821 | $ | 17,703 | ||||||||||||||
| Regulatory penalty (1) |
— | — | 2,500 | — | — | — | — | |||||||||||||||||||||
| Withdrawn IPO (2) |
— | — | — | 3,879 | — | — | — | |||||||||||||||||||||
| Interest expense, net |
25,201 | 14,738 | 19,788 | 20,996 | 17,420 | 15,209 | 11,852 | |||||||||||||||||||||
| Provision for income taxes |
50,629 | 31,959 | 43,594 | 33,967 | 21,350 | 14,183 | 10,205 | |||||||||||||||||||||
| Depreciation and amortization |
13,772 | 12,986 | 17,143 | 13,272 | 11,263 | 8,559 | 7,297 | |||||||||||||||||||||
| Foreign currency transaction loss |
555 | 1,023 | 1,176 | 342 | 487 | 156 | (38 | ) | ||||||||||||||||||||
|
|
|
|
|
|
|
|
|
|
|
|
|
|
|
|||||||||||||||
| Adjusted EBITDA |
$ | 179,326 | $ | 119,030 | $ | 162,239 | $ | 131,328 | $ | 87,552 | $ | 62,928 | $ | 47,019 | ||||||||||||||
|
|
|
|
|
|
|
|
|
|
|
|
|
|
|
|||||||||||||||
| Revenue |
$ | 615,115 | $ | 556,553 | $ | 765,323 | $ | 660,928 | $ | 480,340 | $ | 378,317 | $ | 254,977 | ||||||||||||||
| Adjusted EBITDA |
$ | 179,326 | $ | 119,030 | 162,239 | 131,328 | 87,552 | 62,928 | 47,019 | |||||||||||||||||||
|
|
|
|
|
|
|
|
|
|
|
|
|
|
|
|||||||||||||||
| Adjusted EBITDA as a percentage of total revenue |
29.2 | % | 21.4 | % | 21.2 | % | 19.9 | % | 18.2 | % | 16.6 | % | 18.4 | % | ||||||||||||||
|
|
|
|
|
|
|
|
|
|
|
|
|
|
|
|||||||||||||||
| (1) | For the year ended December 31, 2013, represents the amount paid in connection with the Regulatory Penalty, which is nondeductible for tax purposes. |
| (2) | For the year ended December 31, 2012, represents costs related to our withdrawn Registration Statement in July 2012 in connection with efforts in pursuit of an initial public offering of $3.9 million, net of tax benefit of $1.5 million. |
| (b) | Cash and cash equivalents, Consumer loans, net, and Total assets as of December 31, 2011, 2010, and 2009 were revised to correct the classification of cash and accounts payable and to correct for consumer loans that had not funded as of the balance sheet date. The correction resulted in a decrease in cash and cash equivalents of $3.7 million, $1.5 million and $1.5 million, a decrease in consumer loans, net of $1.0 million, $1.2 million and $1.2 million, and a decrease in accounts payable and accrued expenses of $4.7 million, $2.7 million, and $2.7 million as of December 31, 2011, 2010 and 2009, respectively. Management determined that the impact on previously issued financial statements was immaterial; however, management determined it was appropriate to correct the December 31, 2011, 2010 and 2009 financial statement amounts. |
| (c) | Long-term debt and total stockholder’s equity as of December 31, 2011 and 2010 were revised to correct the classification of certain net equity transactions with Cash America. Management determined that the impact on previously issued financial statements was immaterial; however, management determined it was appropriate to correct the presentation herein. The correction resulted in increases of $0.1 million and $0.6 million to long-term debt as of December 31, 2011 and 2010, respectively, and an increase of $0.3 million and a decrease of $0.3 million to total stockholder’s equity as of December 31, 2011 and 2010, respectively. |
| (d) | See “Management’s Discussion and Analysis of Financial Condition and Results of Operations—Non-GAAP Disclosure—Combined Consumer Loans” for additional information about combined consumer loans. The table below shows combined consumer loan balances, a non-GAAP measure, which is composed of Company-owned consumer loan balances as reported on our consolidated balance sheets and consumer loans originated by third party lenders through the CSO programs that are not included in our financial statements but are disclosures required by GAAP. The amounts in the table below reflect the revision amounts from (b) above (in thousands): |
| NINE MONTHS ENDED SEPTEMBER 30, |
YEAR ENDED DECEMBER 31, | |||||||||||||||||||||||||||
| 2014 | 2013 | 2013 | 2012 | 2011 | 2010 | 2009 | ||||||||||||||||||||||
| (Unaudited) | (Unaudited) | |||||||||||||||||||||||||||
| Short-term loan balances, gross: |
||||||||||||||||||||||||||||
| Company owned |
$ | 50,822 | $ | 96,505 | $ | 80,753 | $ | 146,472 | $ | 140,178 | $ | 99,360 | $ | 68,413 | ||||||||||||||
| Guaranteed by the Company |
35,389 | 35,128 | 41,412 | 48,207 | 42,761 | 38,949 | 38,174 | |||||||||||||||||||||
|
|
|
|
|
|
|
|
|
|
|
|
|
|
|
|||||||||||||||
| Combined |
$ | 86,211 | $ | 131,633 | $ | 122,165 | $ | 194,679 | $ | 182,939 | $ | 138,309 | $ | 106,587 | ||||||||||||||
|
|
|
|
|
|
|
|
|
|
|
|
|
|
|
|||||||||||||||
| Total consumer loan balances, gross: |
||||||||||||||||||||||||||||
| Company owned |
$ | 373,693 | $ | 359,055 | $ | 385,785 | $ | 310,742 | $ | 222,039 | $ | 125,215 | $ | 82,983 | ||||||||||||||
| Guaranteed by the Company |
35,429 | 35,128 | 41,412 | 48,207 | 42,761 | 38,949 | 38,174 | |||||||||||||||||||||
|
|
|
|
|
|
|
|
|
|
|
|
|
|
|
|||||||||||||||
| Combined |
$ | 409,122 | $ | 394,183 | $ | 427,197 | $ | 358,949 | $ | 264,800 | $ | 164,164 | $ | 121,157 | ||||||||||||||
|
|
|
|
|
|
|
|
|
|
|
|
|
|
|
|||||||||||||||
68
Table of Contents
MANAGEMENT’S DISCUSSION AND ANALYSIS OF FINANCIAL CONDITION
AND RESULTS OF OPERATIONS
The following discussion should be read in conjunction with the consolidated financial statements and the related notes included elsewhere in this prospectus. This Management’s Discussion and Analysis of Financial Condition and Results of Operations contains forward-looking statements. The matters discussed in these forward-looking statements are subject to risk, uncertainties, and other factors that could cause actual results to differ materially from those made, projected or implied in the forward-looking statements. Please see “Risk Factors” and “Cautionary Statement Concerning Forward-Looking Statements” for a discussion of the uncertainties, risks and assumptions associated with these statements.
SEPARATION FROM CASH AMERICA
On April 10, 2014, the Board of Directors of Cash America International, Inc., or Cash America, authorized management to review potential strategic alternatives, including a tax-free spin-off, for our separation. After evaluating alternatives for Enova, Cash America’s management recommended that Cash America’s Board of Directors pursue a tax-free spin-off for the separation. On October 22, 2014, after receiving a private letter ruling from the Internal Revenue Service, an opinion from Cash America’s tax counsel and a solvency opinion from an independent financial advisor, Cash America’s Board of Directors approved the spin-off. The distribution occurred at 12:01 am ET on November 13, 2014 (the “Spin-off”). Cash America’s shareholders received 0.915 shares of our stock for every one share of Cash America common stock held at the close of business November 3, 2014, which was the record date for the distribution. Following the Spin-off, we became an independent, publicly traded company, and our shares of common stock are listed on the New York Stock Exchange under the symbol “ENVA.”
Since 2011, we have owned all of the assets and incurred all of the liabilities related to Cash America’s e-commerce business, with some limited exceptions, in which case such assets were transferred to us and such liabilities were assumed by us pursuant to a Separation and Distribution Agreement upon completion of the Spin-off. On the Spin-off date, we entered into several other agreements with Cash America that govern the relationship between us and Cash America after completion of the Spin-off and provide for the allocation between us and Cash America of various assets, liabilities, rights and obligations (including insurance and tax-related assets and liabilities). Our guarantees of Cash America’s long-term indebtedness were also released on such date. These agreements also include arrangements with respect to transitional services to be provided by Cash America to us and vice versa.
RECENT REGULATORY DEVELOPMENTS
Consumer Financial Protection Bureau
On November 20, 2013, Cash America consented to the issuance of a Consent Order by the Consumer Financial Protection Bureau, or the CFPB, pursuant to which it agreed, without admitting or denying any of the facts or conclusions made by the CFPB from its 2012 review of Cash America and us, to pay a civil money penalty of $5 million, of which we and Cash America agreed to allocate $2.5 million of this penalty to us, or the Regulatory Penalty. The Consent Order also relates to issues self-disclosed to the CFPB during its 2012 examination of Cash America and us, including the making of a limited number of loans to consumers who may have been active duty members of the military at the time of the loan at rates in excess of the military annual percentage rate permitted by the federal Military Lending Act due in part to system errors, and for which we have made refunds of approximately $33,500; and for certain failures to timely provide and preserve records and information in connection with the CFPB’s examination of us and Cash America. In addition, as a result of the CFPB’s review, we are in the process of enhancing our compliance management programs and implementing additional procedures to address the issues identified by the CFPB. We are also required to provide periodic reports to the CFPB. We are subject to the restrictions and obligations of the Consent Order, including the CFPB’s order that we ensure compliance with federal consumer financial laws and develop more robust compliance policies and procedures.
69
Table of Contents
Financial Conduct Authority
During the nine-month periods ended September 30, 2014 and September 30, 2013, our U.K. operations generated 42.8% and 47.7%, respectively, of our consolidated total revenue. Recent regulatory changes in the United Kingdom will significantly affect future results from our U.K. operations as described below.
In the United Kingdom, supervision of consumer credit was transferred on April 1, 2014 to the Financial Conduct Authority, or the FCA, and pursuant to new legislation, the FCA is authorized to adopt prescriptive rules and regulations. On February 28, 2014, the Consumer Credit Sourcebook was issued under the FCA Handbook and incorporates prescriptive regulations for lenders such as us, including mandatory affordability assessments on borrowers, limiting the number of rollovers to two, restricting how lenders can advertise, banning advertisements it deems misleading, and introducing a limit of two unsuccessful attempts on the use of continuous payment authority (which provides a creditor the ability to directly debit a customer’s account for payment when authorized by the customer to do so) to pay off a loan. We are in frequent communication with the FCA in an effort to demonstrate that we satisfy the expectations of the FCA, and we have made and are continuing to make significant modifications to many of our business practices to address the FCA’s requirements. These modifications included adjustments to our affordability assessment practices and underwriting standards that govern who will qualify for a loan from us, reductions in certain maximum loan amounts, alterations to advertising practices and adjustments to collections processes (including our practices related to continuous payment authority) and debt forbearance processes (or our practices regarding customers who have indicated they are experiencing financial difficulty). In addition, we previously have not had a physical presence in the United Kingdom as business functions have been performed remotely from our facilities in the United States. In order to alleviate concerns in relation to our ability to presently demonstrate to the FCA that we are capable of being effectively supervised, we have established an office in the United Kingdom.
In connection with implementing these changes to our U.K. business, we expect a significant year-over-year decrease in our U.K. loan volume, U.K. loan balances and U.K. revenue for the remainder of 2014 and into 2015 as a result of adapting our U.K. business practices in response to the requirements of the FCA. The implementation of stricter affordability assessments and underwriting standards will result in a decrease in the number of consumer loans written, the average consumer loan amount and the total amount of consumer loans written to new and returning customers. Additionally, we will experience an increase in compliance- and administrative-related costs for the United Kingdom, but the overall expenses of our U.K. business (including our cost of revenue) are expected to decrease as our U.K. business contracts. The ultimate impact of the changes we have made and are continuing to make to our U.K. operations will be dependent on a number of factors (some of which may be unforeseen), including the effectiveness of our execution of the operational changes, the impact the FCA’s requirements may have on our competitors that could result in a potential increase in our market share, and consumer reaction to the changes occurring to our services, among other things. The impact potentially could also be offset by an improved performance of our U.K. consumer loan portfolio as a result of stricter affordability assessments and underwriting standards being implemented, which is expected to result in lower consumer loan loss rates, and by continued strong demand for the online loan products we offer in the United States and other markets. We are still assessing the potential impact of the changes we have made and are continuing to make to our U.K. operations and what effect such changes may have on our business, but the impact of these changes is likely to be significant for the balance of 2014 and into 2015.
On July 15, 2014, the FCA issued a consultation paper that proposed a cap on the total cost of high-cost short-term credit and requested comments on the proposal. The consultation paper proposed a maximum rate of 0.8% of principal per day, and the proposal limits the total fees, interest (including post-default interest) and charges (including late fees which are capped at £15) to an aggregate amount not to exceed 100% of the principal amount loaned. The FCA requested comments on the proposal and issued its final rule on November 11, 2014. The final rule was largely the same as the proposed rule except for additional language governing line of credit products and will likely require us to make changes to all of our high-cost short-term products in the United Kingdom. We are still assessing the impact of the final rule and what additional changes to our products will be necessary. The final rule will become effective on January 2, 2015, as required by the 2013 amendment to the Financial Services
70
Table of Contents
and Markets Act 2000. It is possible that the rule change could have a significant effect on the results of our U.K. operations.
The results for the three- and nine-month periods ended September 30, 2014 do not include the full impact of the changes described above, and the results for the three- and nine-month periods ended September 30, 2013 do not include any impact of the changes described above. The results for each of these periods are not indicative of our future results of operations and cash flows from our operations in the United Kingdom.
BASIS OF PRESENTATION AND CRITICAL ACCOUNTING POLICIES
Enova International, Inc. was formed on September 7, 2011 by Cash America to hold the assets of Cash America’s online lending business. On September 13, 2011, Cash America contributed to Enova International, Inc. all of the stock of its wholly-owned subsidiary, Enova Online Services, Inc., in exchange for 33 million shares of our common stock. As of September 30, 2014, Enova offered or arranged loans through a number of its subsidiaries to customers in 34 states in the United States, United Kingdom, Australia, Canada, Brazil and China.
Prior to the Spin-off, we operated as a division of Cash America and not as a stand-alone company. Our historical consolidated financial statements include the assets, liabilities, revenue and expenses directly attributable to our operations carved out of Cash America’s consolidated financial statements. In addition, the historical financial statements include allocations of costs relating to certain functions historically provided by Cash America, including corporate services such as executive oversight, insurance and risk management, government relations, internal audit, treasury, licensing, and to a limited extent finance, accounting, tax, legal, human resources, compensation and benefits, compliance and support for certain information systems related to financial reporting. The expense allocations have been determined on a basis that Cash America and we consider to be reasonable reflections of the utilization of services provided by Cash America.
The amounts recorded for these transactions and allocations are not, however, necessarily representative of the amounts that would have been incurred had we been a separate, stand-alone entity that operated independently of Cash America. As a separate stand-alone public company, our future results of operations will include costs and expenses for us to operate as a stand-alone company, and, consequently, these costs may be materially different than as reflected in our historical results of operations. Accordingly, the financial statements for these years may not be indicative of our future results of operations, financial position and cash flows.
Upon our separation from Cash America, we entered into a transition services agreement with Cash America. The expiration date of the agreement varies by service provided but is generally no longer than 12 months from the separation date. Under the agreement, Cash America provides support for certain information systems related to financial reporting and payment processing to us for a period of time following the completion of the Spin-off for which we will compensate Cash America. In addition, we will reimburse Cash America for all out-of-pocket costs and expenses it pays or incurs in connection with providing such services. See “—Separation From Cash America” for discussion of the separation.
Revenue Recognition
We recognize revenue based on the loan products and services we offer. “Revenue” in the consolidated statements of income includes: interest income, finance charges, fees for services provided through the CSO programs, or CSO fees, service charges, draw fees, minimum fees, late fees, nonsufficient funds fees and any other fees or charges permitted by applicable laws and pursuant to the agreement with the borrower. For short-term loans that we offer, interest and finance charges are recognized on an effective yield basis over the term of the loan, and fees are recognized when assessed to the customer. CSO fees are recognized on an effective yield basis over the term of the loan. For line of credit accounts, interest is recognized over the reporting period based upon the balance outstanding and the contractual interest rate, and fees are recognized when assessed to the customer. For installment loans, interest is recognized on an effective yield basis over the term of the loan and fees are recognized when assessed to the customer. Unpaid and accrued interest and fees are included in “Consumer loans, net” in the consolidated balance sheets.
71
Table of Contents
Current and Delinquent Consumer Loans
We classify our consumer loans as either current or delinquent. Short-term loans are considered delinquent when payment of an amount due is not made as of the due date. If a line of credit account or installment loan customer misses one payment, that payment is considered delinquent and the balance of the loan is considered current. We do not accrue interest on the delinquent payment portion of the loan but do continue to accrue interest on the remaining portion of the loan. If a line of credit account or installment loan customer does not make two consecutive payments, the entire loan or account is classified as delinquent. We allow for normal payment processing time before considering a payment or a loan delinquent but do not provide for any additional grace period.
Where permitted by law and as long as a loan is not considered delinquent, a customer may choose to renew a short-term loan or installment loan or extend the due date on a short-term loan. In order to renew or extend a short-term loan, a customer must agree to pay the current finance charge for the right to make a later payment of the outstanding principal balance plus an additional finance charge. In order to renew an installment loan, the customer enters into a new installment loan contract and agrees to pay the principal balance and finance charge in accordance with the terms of the new loan contract. If a short-term loan is renewed, but the customer fails to pay that loan’s current finance charge as of the due date, the unpaid finance charge is classified as delinquent. References throughout Management’s Discussion and Analysis of Financial Condition and Results of Operations to renewed consumer loans include both renewals and extensions made by customers to their existing loans as discussed above.
We generally do not accrue interest on delinquent consumer loans and do not resume accrual of interest on a delinquent loan unless it is returned to current status. In addition, delinquent consumer loans generally may not be renewed, and if, during an attempt to collect on a delinquent consumer loan, we allow additional time for payment through a payment plan or a promise to pay, it is still considered delinquent. Generally, all payments received are first applied against accrued but unpaid interest and fees and then against the principal balance of the loan.
Allowance and Liability for Estimated Losses on Consumer Loans
We monitor the performance of our consumer loan portfolio and maintain either an allowance or liability for estimated losses on consumer loans (including fees and interest) at a level estimated to be adequate to absorb credit losses inherent in the portfolio. The allowance for losses on our owned consumer loans reduces the outstanding loan balance in the consolidated balance sheets. The liability for estimated losses related to loans guaranteed under the CSO programs is included in “Accounts payable and accrued expenses” in the consolidated balance sheets.
In determining the allowance or liability for estimated losses on consumer loans, we apply a documented systematic methodology. In calculating the allowance or liability for loan losses, outstanding loans are divided into discrete groups of short-term loans, line of credit accounts and installment loans and are analyzed as current or delinquent. Increases in either the allowance or the liability, net of charge-offs and recoveries, are recorded as a “Cost of revenue” in the consolidated statements of income.
The allowance or liability for short-term loans classified as current is based on historical loss rates adjusted for recent default trends for current loans. For delinquent short-term loans, the allowance or liability is based on a six month rolling average of loss rates by stage of collection. For line of credit account and installment loan portfolios, we generally use a migration analysis to estimate losses inherent in the portfolio. The allowance calculation under the migration analysis is based on historical charge-off experience and the loss emergence period, which represents the average amount of time between the first occurrence of a loss event to the charge-off of a loan. The factors we consider to assess the adequacy of the allowance or liability include past due performance, historical behavior of monthly vintages, underwriting changes and recent trends in delinquency in the migration analysis.
72
Table of Contents
We fully reserve and generally charge off consumer loans once the loan or a portion of the loan has been classified as delinquent for 60 consecutive days. If a loan is deemed uncollectible before it is fully reserved, it is charged off at that point. Consumer loans classified as delinquent generally have an age of one to 59 days from the date any portion of the loan became delinquent, as defined above. Recoveries on loans previously charged to the allowance are credited to the allowance when collected.
Goodwill
Goodwill represents the excess of the purchase price over the fair value of the net tangible and identifiable intangible assets acquired in each business combination. In accordance with Accounting Standards Codification, or ASC, 350, Goodwill, we test goodwill and intangible assets with an indefinite life for potential impairment annually as of June 30 and between annual tests if an event occurs or circumstances change that would more likely than not reduce the fair value below its carrying amount.
We use the income approach to complete our annual goodwill assessment. The income approach uses future cash flows and estimated terminal values for us that are discounted using a market participant perspective to determine the fair value, which is then compared to the carrying value to determine if there is impairment. The income approach includes assumptions about revenue growth rates, operating margins and terminal growth rates discounted by an estimated weighted-average cost of capital derived from other publicly-traded companies that are similar but not identical from an operational and economic standpoint. We completed our annual assessment of goodwill as of June 30, 2014 and determined that the fair value of our goodwill exceeded carrying value, and, as a result, no impairment existed at that date. A 10% decrease in the estimated fair value for the June 2014 assessment would not have resulted in a goodwill impairment. Although no goodwill impairment was noted, there can be no assurances that future goodwill impairments will not occur.
Long-lived Assets Other Than Goodwill
An evaluation of the recoverability of property and equipment and intangible assets subject to amortization is performed whenever the facts and circumstances indicate that the carrying value may be impaired. An impairment loss is recognized if the future undiscounted cash flows associated with the asset and the estimated fair value of the asset are less than the asset’s corresponding carrying value. The amount of the impairment loss, if any, is the excess of the asset’s carrying value over its estimated fair value.
We amortize finite-lived intangible assets subject to amortization on the basis of their expected periods of benefit, generally three to five years. The costs of start-up activities and organization costs are charged to expense as incurred.
Marketing Expenses
Marketing expenses consist of online marketing costs such as sponsored search and advertising on social networking sites, and offline marketing costs such as television, radio and print advertising. In addition, marketing expenses include lead purchase costs paid to lead providers and marketing affiliates in exchange for providing information or applications from potential customers interested in using our services. Online marketing and lead purchase costs are expensed as incurred. The production costs associated with offline marketing are expensed as incurred. Other marketing costs are expensed as incurred. We also have an agreement with an independent third party pursuant to which we pay a portion of the net revenue received on the customers referred to us by such third party. We also had an arrangement with Cash America pursuant to which we paid either a lead purchase fee or a portion of the net revenue received on loans made to or arranged for the customers referred to us by Cash America. These referral fees were expensed as incurred and included in “Marketing” in the consolidated statements of income.
73
Table of Contents
Operations and Technology Expenses
Operations and technology expenses include all expenses related to the direct operations and technology infrastructure related to loan underwriting and processing. This includes call center and operations personnel costs, software maintenance expense, underwriting data from third-party vendors, and telephony costs.
General and Administrative Expenses
General and Administrative expenses primarily include corporate personnel costs, as well as legal, occupancy, and other related costs. We allocate these expenses between domestic and international operations on the basis of revenue. In addition, general and administrative expenses included expense allocations for certain corporate service functions historically provided by Cash America, such as executive oversight, insurance and risk management, government relations, internal audit, treasury, licensing, and to a limited extent finance, accounting, tax, legal, human resources, compensation and benefits, compliance and support for certain information systems related to financial reporting. Cash America allocated these expenses to us based on our share of Cash America’s corporate services expenses incurred for the consolidated entity.
Income Taxes
We account for income taxes under ASC 740, Income Taxes, or ASC 740. Accordingly, income tax expense and the deferred income tax balances in the consolidated financial statements have been calculated on a separate tax return basis although our operations have historically been included as part of consolidated and unitary tax returns with Cash America and its affiliated companies. We maintained an income taxes payable to/from account with Cash America. With the exception of certain entities outside of the US, we settled our current tax balances with Cash America on a quarterly basis through an adjustment to “Related party payable, net” in the consolidated balance sheets. Prior to May 30, 2014 we settled our current tax balances with Cash America on a quarterly basis through an adjustment to our affiliate line of credit with Cash America.
As part of the process of preparing our consolidated financial statements, we are required to estimate income taxes in each of the jurisdictions in which we operate. This process involves estimating the actual current tax expense together with assessing temporary differences in recognition of income for tax and accounting purposes. These differences result in deferred tax assets and liabilities and are included within the consolidated balance sheets. Management must then assess the likelihood that the deferred tax assets will be recovered from future taxable income and, to the extent it believes that recovery is not likely, it must establish a valuation allowance. An expense or benefit is included within the tax provision in the statement of operations for any increase or decrease in the valuation allowance for a given period.
We perform an evaluation of the recoverability of our deferred tax assets on a quarterly basis. We establish a valuation allowance if it is more-likely-than-not (greater than 50 percent) that all or some portion of the deferred tax asset will not be realized. We analyze several factors, including the nature and frequency of operating losses, our carryforward period for any losses, the reversal of future taxable temporary differences, the expected occurrence of future income or loss and the feasibility of available tax planning strategies to protect against the loss of deferred tax assets.
We account for uncertainty in income taxes in accordance with ASC 740, which requires that a more-likely-than-not threshold be met before the benefit of a tax position may be recognized in the consolidated financial statements and prescribes how such benefit should be measured. Management must evaluate tax positions taken on our tax returns for all periods that are open to examination by taxing authorities and make a judgment as to whether and to what extent such positions are more likely than not to be sustained based on merit.
Management’s judgment is required in determining the provision for income taxes, the deferred tax assets and liabilities and any valuation allowance recorded against deferred tax assets. Management’s judgment is also required in evaluating whether tax benefits meet the more-likely-than-not threshold for recognition under ASC 740.
74
Table of Contents
Recent Accounting Pronouncements
See Note 1 in the Notes to Unaudited Consolidated Financial Statements for a discussion of recent accounting pronouncements.
RESULTS OF OPERATIONS
HIGHLIGHTS
The Company’s financial results for the three months ended September 30, 2014, or the current quarter, are summarized below.
| • | Consolidated total revenue increased $7.1 million, or 3.6%, to $205.2 million in the current quarter compared to $198.1 million for the three months ended September 30, 2013, or the prior year quarter. |
| • | Consolidated gross profit increased $24.5 million to $132.2 million in the current quarter compared to $107.7 million in the prior year quarter. |
| • | Consolidated income from operations was $43.0 million in the current quarter, compared to $31.3 million in the prior year quarter. |
| • | Consolidated net income was $18.5 million in the current quarter compared to $17.1 million in the prior year quarter. Consolidated diluted earnings per share was $0.56 in the current quarter compared to $0.52 in the prior year quarter. |
The Company’s financial results for the year ended December 31, 2013, or 2013, are summarized below.
| • | Consolidated total revenue increased $104.4 million, or 15.8%, to $765.3 million in 2013 compared to $660.9 million for the year ended December 31, 2012, or 2012. |
| • | Consolidated gross profit increased $77.8 million, or 20.9%, to $450.3 million in 2013 compared to $372.5 million in 2012, primarily due to higher consumer loan balances, which is attributable to the success of the expansion of our line of credit accounts and installment loan products. In addition, we benefitted from an improvement in loan loss experience, resulting in an increase in gross profit from consumer loans. |
| • | Consolidated income from operations was $142.6 million in 2013, compared to $114.2 million in 2012. The increase in income from operations includes the effect of certain expense items in both periods as discussed further below: |
| • | Consolidated income from operations for 2013 includes $2.5 million for the Regulatory Penalty. Excluding this item, non-generally accepted accounting principles in the United States, or non-GAAP, adjusted income from operations would have been $145.1 million in 2013. |
| • | Consolidated income from operations for 2012 includes $3.9 million of costs related to our withdrawn Registration Statement in July 2012 in connection with efforts in pursuit of an initial public offering, or the Withdrawn IPO. Excluding this item, non-GAAP adjusted income from operations would have been $118.1 million in 2012. |
| • | Consolidated net income was $78.0 million in 2013 compared to $58.9 million in 2012. Consolidated diluted net income per share was $2.36 in 2013 compared to $1.78 in 2012. The increases in net income and diluted net income per share include certain income and expense items in both periods as discussed further below: |
| • | Consolidated net income for 2013 includes $2.5 million related to the Regulatory Penalty. Excluding this item, non-GAAP adjusted net income would have been $80.5 million in 2013 and non-GAAP adjusted diluted earnings per share would have been $2.44. See “Overview—Non-GAAP Disclosure—Adjusted Earnings Measures” for further discussion. |
| • | Consolidated net income for 2012 includes $2.4 million related to the Withdrawn IPO. Excluding this item, non-GAAP adjusted net income would have been $61.3 million in 2012 and consolidated diluted earnings per share for 2012 would have been $1.86. See “Overview—Non-GAAP Disclosure—Adjusted Earnings Measures” for further discussion. |
75
Table of Contents
Management believes that the adjustments shown above for 2013 and 2012, such as the adjustments for the Regulatory Penalty and the Withdrawn IPO, are useful to investors in order to allow them to compare the Company’s financial results during the periods shown without the effect of these expense items.
Our results from operations for the three- and nine-month periods ended September 30, 2014 do not include the full impact of changes and expected changes in our U.K. operations resulting from recent regulatory and legislative changes and our results from operations for the three- and nine-month periods ended September 30, 2013 do not include any impact of these changes. As a result, such results are not indicative of our future results of operations and cash flow from our U.K. operations. We expect our future results of operations will be adversely affected as a result of modifying many of our business practices to satisfy the requirements of the FCA, including stricter underwriting and affordability assessment guidelines, changes to our collection practices and increased compliance costs, including the cost of establishing and operating an office in the United Kingdom. See “—Recent Regulatory Developments—Financial Conduct Authority” above for further information.
76
Table of Contents
OVERVIEW
The following tables reflect our results of operations for the periods indicated, both in dollars and as a percentage of total revenue (dollars in thousands, except per share data):
| Three Months Ended September 30, |
Nine Months Ended September 30, |
Year Ended December 31, | ||||||||||||||||||||||||||
| 2014 | 2013 | 2014 | 2013 | 2013 | 2012 | 2011 | ||||||||||||||||||||||
| Revenue |
||||||||||||||||||||||||||||
| Consumer loan fees |
$ | 204,604 | $ | 197,780 | $ | 614,466 | $ | 555,410 | $ | 764,126 | $ | 659,569 | $ | 479,454 | ||||||||||||||
| Other |
564 | 318 | 649 | 1,143 | 1,197 | 1,359 | 886 | |||||||||||||||||||||
|
|
|
|
|
|
|
|
|
|
|
|
|
|
|
|||||||||||||||
| Total Revenue |
205,168 | 198,098 | 615,115 | 556,553 | 765,323 | 660,928 | 480,340 | |||||||||||||||||||||
| Cost of Revenue |
72,919 | 90,389 | 206,195 | 228,547 | 315,052 | 288,474 | 201,687 | |||||||||||||||||||||
|
|
|
|
|
|
|
|
|
|
|
|
|
|
|
|||||||||||||||
| Gross Profit |
132,249 | 107,709 | 408,920 | 328,006 | 450,271 | 372,454 | 278,653 | |||||||||||||||||||||
| Expenses |
||||||||||||||||||||||||||||
| Marketing |
33,393 | 36,523 | 92,699 | 94,592 | 135,336 | 108,810 | 73,329 | |||||||||||||||||||||
| Operations and technology |
19,362 | 17,959 | 54,370 | 52,505 | 70,776 | 63,505 | 52,371 | |||||||||||||||||||||
| General and administrative |
31,167 | 17,991 | 82,525 | 61,879 | 84,420 | 72,690 | 65,401 | |||||||||||||||||||||
| Depreciation and amortization |
5,338 | 3,958 | 13,772 | 12,986 | 17,143 | 13,272 | 11,263 | |||||||||||||||||||||
|
|
|
|
|
|
|
|
|
|
|
|
|
|
|
|||||||||||||||
| Total Expenses |
89,260 | 76,431 | 243,366 | 221,962 | 307,675 | 258,277 | 202,364 | |||||||||||||||||||||
|
|
|
|
|
|
|
|
|
|
|
|
|
|
|
|||||||||||||||
| Income from Operations |
42,989 | 31,278 | 165,554 | 106,044 | 142,596 | 114,177 | 76,289 | |||||||||||||||||||||
| Interest expense, net |
(13,136 | ) | (4,909 | ) | (25,201 | ) | (14,738 | ) | (19,788 | ) | (20,996 | ) | (17,420 | ) | ||||||||||||||
| Foreign currency transaction loss |
(155 | ) | (737 | ) | (555 | ) | (1,023 | ) | (1,176 | ) | (342 | ) | (487 | ) | ||||||||||||||
|
|
|
|
|
|
|
|
|
|
|
|
|
|
|
|||||||||||||||
| Income before Income Taxes |
29,698 | 25,632 | 139,798 | 90,283 | 121,632 | 92,839 | 58,382 | |||||||||||||||||||||
| Provision for income taxes |
11,213 | 8,544 | 50,629 | 31,959 | 43,594 | 33,967 | 21,350 | |||||||||||||||||||||
|
|
|
|
|
|
|
|
|
|
|
|
|
|
|
|||||||||||||||
| Net Income |
18,485 | 17,088 | 89,169 | 58,324 | $ | 78,038 | $ | 58,872 | $ | 37,032 | ||||||||||||||||||
|
|
|
|
|
|
|
|
|
|
|
|
|
|
|
|||||||||||||||
| Diluted earnings per share |
$ | 0.56 | $ | 0.52 | $ | 2.70 | $ | 1.77 | $ | 2.36 | $ | 1.78 | $ | 1.12 | ||||||||||||||
| Revenue |
||||||||||||||||||||||||||||
| Consumer loan fees |
99.7 | % | 99.8 | % | 99.9 | % | 99.8 | % | 99.8 | % | 99.8 | % | 99.8 | % | ||||||||||||||
| Other |
0.3 | 0.2 | 0.1 | 0.2 | 0.2 | 0.2 | 0.2 | |||||||||||||||||||||
|
|
|
|
|
|
|
|
|
|
|
|
|
|
|
|||||||||||||||
| Total Revenue |
100.0 | 100.0 | 100.0 | 100.0 | 100.0 | 100.0 | 100.0 | |||||||||||||||||||||
| Cost of Revenue |
35.5 | 45.6 | 33.5 | 41.1 | 41.2 | 43.6 | 42.0 | |||||||||||||||||||||
|
|
|
|
|
|
|
|
|
|
|
|
|
|
|
|||||||||||||||
| Gross Profit |
64.5 | 54.4 | 66.5 | 58.9 | 58.8 | 56.4 | 58.0 | |||||||||||||||||||||
|
|
|
|
|
|
|
|
|
|
|
|
|
|
|
|||||||||||||||
| Expenses |
||||||||||||||||||||||||||||
| Marketing |
16.3 | 18.4 | 15.1 | 17.0 | 17.7 | 16.5 | 15.3 | |||||||||||||||||||||
| Operations and technology |
9.4 | 9.1 | 8.8 | 9.4 | 9.3 | 9.6 | 10.9 | |||||||||||||||||||||
| General and administrative |
15.2 | 9.1 | 13.4 | 11.1 | 11.0 | 11.0 | 13.6 | |||||||||||||||||||||
| Depreciation and amortization |
2.6 | 2.0 | 2.3 | 2.3 | 2.2 | 2.0 | 2.3 | |||||||||||||||||||||
|
|
|
|
|
|
|
|
|
|
|
|
|
|
|
|||||||||||||||
| Total Expenses |
43.5 | 38.6 | 39.6 | 39.8 | 40.2 | 39.1 | 42.1 | |||||||||||||||||||||
|
|
|
|
|
|
|
|
|
|
|
|
|
|
|
|||||||||||||||
| Income from Operations |
21.0 | 15.8 | 26.9 | 19.1 | 18.6 | 17.3 | 15.9 | |||||||||||||||||||||
| Interest expense, net |
(6.4 | ) | (2.5 | ) | (4.1 | ) | (2.7 | ) | (2.6 | ) | (3.2 | ) | (3.6 | ) | ||||||||||||||
| Foreign currency transaction loss |
(0.1 | ) | (0.4 | ) | (0.1 | ) | (0.2 | ) | (0.1 | ) | (0.1 | ) | (0.1 | ) | ||||||||||||||
|
|
|
|
|
|
|
|
|
|
|
|
|
|
|
|||||||||||||||
| Income before Income Taxes |
14.5 | 12.9 | 22.7 | 16.2 | 15.9 | 14.0 | 12.2 | |||||||||||||||||||||
| Provision for income taxes |
5.5 | 4.3 | 8.2 | 5.7 | 5.7 | 5.1 | 4.5 | |||||||||||||||||||||
|
|
|
|
|
|
|
|
|
|
|
|
|
|
|
|||||||||||||||
| Net Income |
9.0 | % | 8.6 | % | 14.5 | % | 10.5 | % | 10.2 | % | 8.9 | % | 7.7 | % | ||||||||||||||
|
|
|
|
|
|
|
|
|
|
|
|
|
|
|
|||||||||||||||
77
Table of Contents
NON-GAAP DISCLOSURE
In addition to the financial information prepared in conformity with generally accepted accounting principles, or GAAP, we provide historical non-GAAP financial information. Management believes that presentation of non-GAAP financial information is meaningful and useful in understanding the activities and business metrics of our operations. Management believes that these non-GAAP financial measures reflect an additional way of viewing aspects of our business that, when viewed with its GAAP results, provide a more complete understanding of factors and trends affecting its business.
Management provides non-GAAP financial information for informational purposes and to enhance understanding of our GAAP consolidated financial statements. Readers should consider the information in addition to, but not instead of or superior to, its financial statements prepared in accordance with GAAP. This non-GAAP financial information may be determined or calculated differently by other companies, limiting the usefulness of those measures for comparative purposes.
Adjusted Earnings Measures
In addition to reporting financial results in accordance with GAAP, we have provided adjusted earnings and adjusted earnings per share, or, collectively, the Adjusted Earnings Measures, which are non-GAAP measures. Management believes that the presentation of these measures provides investors with greater transparency and facilitates comparison of operating results across a broad spectrum of companies with varying capital structures, compensation strategies, derivative instruments and amortization methods, which provides a more complete understanding of our financial performance, competitive position and prospects for the future. Management also believes that investors regularly rely on non-GAAP financial measures, such as the Adjusted Earnings Measures, to assess operating performance and that such measures may highlight trends in the Company’s business that may not otherwise be apparent when relying on financial measures calculated in accordance with GAAP. In addition, management believes that the adjustments shown below are useful to investors in order to allow them to compare the Company’s financial results during the periods shown without the effect of each of these expense items.
The following tables provide reconciliations between net income and diluted earnings per share calculated in accordance with GAAP to the Adjusted Earnings Measures, which are shown net of tax (in thousands, except per share data):
| Three Months Ended September 30, |
Nine Months Ended September 30, |
|||||||||||||||
| 2014 | 2013 | 2014 | 2013 | |||||||||||||
| Net Income |
$ | 18,485 | $ | 17,088 | $ | 89,169 | $ | 58,324 | ||||||||
| Adjustments (net of tax): |
||||||||||||||||
| Intangible asset amortization |
4 | 18 | 23 | 71 | ||||||||||||
| Non-cash equity-based compensation |
55 | 57 | 164 | 106 | ||||||||||||
| Foreign currency transaction loss |
97 | 479 | 354 | 661 | ||||||||||||
|
|
|
|
|
|
|
|
|
|||||||||
| Adjusted earnings |
$ | 18,641 | $ | 17,642 | $ | 89,710 | $ | 59,162 | ||||||||
|
|
|
|
|
|
|
|
|
|||||||||
| Diluted earnings per share |
$ | 0.56 | $ | 0.52 | $ | 2.70 | $ | 1.77 | ||||||||
| Adjustments (net of tax): |
||||||||||||||||
| Intangible asset amortization |
— | — | — | — | ||||||||||||
| Non-cash equity-based compensation |
— | — | 0.01 | — | ||||||||||||
| Foreign currency transaction loss |
— | 0.01 | 0.01 | 0.02 | ||||||||||||
|
|
|
|
|
|
|
|
|
|||||||||
| Adjusted earnings per share |
$ | 0.56 | $ | 0.53 | $ | 2.72 | $ | 1.79 | ||||||||
|
|
|
|
|
|
|
|
|
|||||||||
78
Table of Contents
| Year Ended December 31, | ||||||||||||
| 2013 | 2012 | 2011 | ||||||||||
| Net Income |
$ | 78,038 | $ | 58,872 | $ | 37,032 | ||||||
| Adjustments (net of tax): |
||||||||||||
| Regulatory Penalty (a) |
2,500 | — | — | |||||||||
| Withdrawn IPO (b) |
— | 2,424 | — | |||||||||
| Intangible asset amortization |
88 | 175 | 878 | |||||||||
| Non-cash equity-based compensation |
160 | 92 | 116 | |||||||||
| Foreign currency transaction loss |
755 | 217 | 309 | |||||||||
|
|
|
|
|
|
|
|||||||
| Adjusted earnings |
$ | 81,541 | $ | 61,780 | $ | 38,335 | ||||||
|
|
|
|
|
|
|
|||||||
| Diluted earnings per share |
$ | 2.36 | $ | 1.78 | $ | 1.12 | ||||||
| Adjustments (net of tax): |
||||||||||||
| Regulatory Penalty (a) |
0.08 | — | — | |||||||||
| Withdrawn IPO (b) |
— | 0.08 | — | |||||||||
| Intangible asset amortization |
— | — | 0.03 | |||||||||
| Non-cash equity-based compensation |
0.01 | — | — | |||||||||
| Foreign currency transaction loss |
0.02 | 0.01 | 0.01 | |||||||||
|
|
|
|
|
|
|
|||||||
| Adjusted earnings per share |
$ | 2.47 | $ | 1.87 | $ | 1.16 | ||||||
|
|
|
|
|
|
|
|||||||
| (a) | For the year ended December 31, 2013, represents the amount paid in connection with the Regulatory Penalty, which is nondeductible for tax purposes. |
| (b) | For the year ended December 31, 2012, represents charges directly related to the withdrawn IPO of $3.9 million, net of tax benefit of $1.5 million. |
Adjusted EBITDA
The tables below show Adjusted EBITDA, which is a non-GAAP measure that we define as earnings excluding depreciation, amortization, interest, foreign currency transaction gains or losses and taxes, and Adjusted EBITDA margin, which is a non-GAAP measure that we define as Adjusted EBITDA as a percentage of total revenue. Management believes Adjusted EBITDA and Adjusted EBITDA margin are used by investors to analyze operating performance and evaluate our ability to incur and service debt and our capacity for making capital expenditures. Adjusted EBITDA and Adjusted EBITDA margin are also useful to investors to help assess our estimated enterprise value. The computation of Adjusted EBITDA and Adjusted EBITDA margin as presented below may differ from the computation of similarly-titled measures provided by other companies (in thousands):
| Three Months Ended September 30, |
Nine Months Ended September 30, |
|||||||||||||||
| 2014 | 2013 | 2014 | 2013 | |||||||||||||
| Net Income |
$ | 18,485 | $ | 17,088 | $ | 89,169 | $ | 58,324 | ||||||||
| Adjustments: |
||||||||||||||||
| Depreciation and amortization expenses |
5,338 | 3,958 | 13,772 | 12,986 | ||||||||||||
| Interest expense, net |
13,136 | 4,909 | 25,201 | 14,738 | ||||||||||||
| Foreign currency transaction loss (gain) |
155 | 737 | 555 | 1,023 | ||||||||||||
| Provision for income taxes |
11,213 | 8,544 | 50,629 | 31,959 | ||||||||||||
|
|
|
|
|
|
|
|
|
|||||||||
| Adjusted EBITDA |
$ | 48,327 | $ | 35,236 | $ | 179,326 | $ | 119,030 | ||||||||
|
|
|
|
|
|
|
|
|
|||||||||
| Adjusted EBITDA margin calculated as follows: |
||||||||||||||||
| Total Revenue |
205,168 | 198,098 | 615,115 | 556,553 | ||||||||||||
| Adjusted EBITDA |
48,327 | 35,236 | 179,326 | 119,030 | ||||||||||||
| Adjusted EBITDA as a percentage of total revenue |
23.6 | % | 17.8 | % | 29.2 | % | 21.4 | % | ||||||||
79
Table of Contents
| Year Ended December 31, | ||||||||||||
| 2013 | 2012 | 2011 | ||||||||||
| Net Income |
$ | 78,038 | $ | 58,872 | $ | 37,032 | ||||||
| Adjustments: |
||||||||||||
| Regulatory Penalty (a) |
2,500 | — | — | |||||||||
| Withdrawn IPO (b) |
— | 3,879 | — | |||||||||
| Interest expense, net |
19,788 | 20,996 | 17,420 | |||||||||
| Foreign currency transaction loss |
1,176 | 342 | 487 | |||||||||
| Depreciation and amortization expenses |
17,143 | 13,272 | 11,263 | |||||||||
| Provision for income taxes |
43,594 | 33,967 | 21,350 | |||||||||
|
|
|
|
|
|
|
|||||||
| Adjusted EBITDA |
$ | 162,239 | $ | 131,328 | $ | 87,552 | ||||||
|
|
|
|
|
|
|
|||||||
| Adjusted EBITDA margin calculated as follows: |
||||||||||||
| Total Revenue |
$ | 765,323 | $ | 660,928 | $ | 480,340 | ||||||
| Adjusted EBITDA |
162,239 | 131,328 | 87,552 | |||||||||
| Adjusted EBITDA as a percentage of total revenue |
21.2 | % | 19.9 | % | 18.2 | % | ||||||
| (a) | For the year ended December 31, 2013, represents the amount paid in connection with the Regulatory Penalty, which is nondeductible for tax purposes. |
| (b) | For the year ended December 31, 2012, represents charges directly related to the withdrawn IPO of $3.9 million. |
Combined Consumer Loans
Combined consumer loans is a non-GAAP measure that includes both consumer loans we own and consumer loans we guarantee, which are either GAAP items or disclosures required by GAAP. See “—Basis of Presentation and Critical Accounting Policies—Allowance and Liability for Estimated Losses on Consumer Loans.”
Management believes this non-GAAP measure provides investors with important information needed to evaluate the magnitude of potential loan losses and the opportunity for revenue performance of the consumer loan portfolio on an aggregate basis. Management also believes that the comparison of the aggregate amounts from period to period is more meaningful than comparing only the amounts reflected on our balance sheet since both revenue and cost of revenue for loans are impacted by the aggregate amount of loans we own and those we guarantee as reflected in our financial statements.
80
Table of Contents
THREE MONTHS ENDED SEPTEMBER 30, 2014 COMPARED TO THREE MONTHS ENDED SEPTEMBER 30, 2013
Revenue and Gross Profit
Revenue increased $7.1 million, or 3.6%, to $205.2 million for the current quarter as compared to $198.1 million for the prior year quarter. The increase in revenue is primarily due to growth in domestic consumer loan balances, with revenue from domestic operations increasing by $20.9 million. The increase in revenue from domestic operations was partially offset by a decrease in revenue of $13.8 million from our international operations, primarily in the United Kingdom.
Our gross profit increased by $24.5 million to $132.2 million for the current quarter from $107.7 million for the prior year quarter. Our consolidated gross profit as a percentage of revenue, or our gross profit margin, increased to 64.5% for the current quarter, from 54.4% for the prior year quarter. The increase in gross profit was primarily due to higher revenue and lower loss experience from our line of credit account and installment loan products, mainly as a result of a lower percentage of delinquent loans, increased collections and a higher percentage mix of customers with established payment histories during the current quarter as compared to the prior year quarter. New customers tend to have a higher risk of default than customers with a history of successfully repaying loans. Line of credit account and installment loan products comprised 78.9% of the combined gross consumer loan balance at September 30, 2014 compared to 66.6% at September 30, 2013. While the short-term consumer loan product was a less significant portion of the aggregate portfolio, loss experience for the product also decreased in the current quarter compared to the prior year quarter, contributing to the increase in gross profit margin for the period. In addition, we recently made refinements to our underwriting models partially as a result of the changes made to our U.K. business in response to the requirements of the FCA, which we believe also contributed to the increase in gross profit. Additional discussion of the specific factors influencing each product is included in “—Consumer Loan Loss Experience by Product” below. Our historical results from operations do not include the full impact of changes and expected changes in our U.K. operations resulting from recent regulatory and legislative changes and are not indicative of our future results of operations and cash flows from our U.K. operations. See “—Recent Regulatory Developments—Financial Conduct Authority” above for further information. Management expects the consolidated gross profit margin will continue to be influenced by the mix of loans to new and returning customers, the mix of outstanding loan products as product design and underwriting rules vary, and changes to our U.K. business.
The following table sets forth the components of revenue and gross profit, separated between domestic and international for the current quarter and the prior year quarter (in thousands):
| Three Months Ended September 30, | ||||||||||||||||||||||||
| 2014 | 2013 | |||||||||||||||||||||||
| Domestic | International | Total | Domestic | International | Total | |||||||||||||||||||
| Short-term loans |
$ | 46,125 | $ | 15,760 | $ | 61,885 | $ | 48,552 | $ | 43,956 | $ | 92,508 | ||||||||||||
| Line of credit accounts |
41,723 | 39,186 | 80,909 | 32,374 | 18,132 | 50,506 | ||||||||||||||||||
| Installment loans |
38,275 | 23,535 | 61,810 | 24,024 | 30,742 | 54,766 | ||||||||||||||||||
| Other |
7 | 557 | 564 | 249 | 69 | 318 | ||||||||||||||||||
|
|
|
|
|
|
|
|
|
|
|
|
|
|||||||||||||
| Revenue |
126,130 | 79,038 | 205,168 | 105,199 | 92,899 | 198,098 | ||||||||||||||||||
| Cost of Revenue |
55,058 | 17,861 | 72,919 | 50,232 | 40,157 | 90,389 | ||||||||||||||||||
|
|
|
|
|
|
|
|
|
|
|
|
|
|||||||||||||
| Gross Profit |
$ | 71,072 | $ | 61,177 | $ | 132,249 | $ | 54,967 | $ | 52,742 | $ | 107,709 | ||||||||||||
|
|
|
|
|
|
|
|
|
|
|
|
|
|||||||||||||
| Year-over-year change—$ |
$ | 16,105 | $ | 8,435 | $ | 24,540 | ||||||||||||||||||
| Year-over-year change—% |
29.3 | % | 16.0 | % | 22.8 | % | ||||||||||||||||||
| Gross profit margin |
56.3 | % | 77.4 | % | 64.5 | % | 52.3 | % | 56.8 | % | 54.4 | % | ||||||||||||
Consumer Loan Balances
The outstanding combined portfolio balance of consumer loans, net of allowance and liability for estimated losses, increased $32.5 million, or 10.6%, to $337.7 million as of September 30, 2014 from $305.2 million as of
81
Table of Contents
September 30, 2013, primarily due to increased demand for the line of credit account and domestic installment loan products, partially offset by a reduction in international short-term and installment loan balances due to changes made in our U.K. business as a result of new regulatory requirements. Our domestic installment loan product intended to serve a near-prime customer base was a significant contributor to the growth in our consumer loan portfolio for the current quarter. Management expects the loan balances in the line of credit account and installment loan products to continue to comprise a larger percentage of the total consumer loan portfolio, due to customer’s preference for these products. See “—Non-GAAP Disclosure—Combined Consumer Loans” above for additional information related to combined consumer loans.
The combined consumer loan balance includes $373.7 million and $359.1 million as of September 30, 2014 and 2013, respectively, of our consumer loan balances before the allowance for losses of $70.0 million and $87.1 million provided in the consolidated financial statements for September 30, 2014 and 2013, respectively. The combined consumer loan balance also includes $35.4 million and $35.1 million as of September 30, 2014 and 2013, respectively, of consumer loan balances that are guaranteed by us, which are not included in our financial statements, before the liability for estimated losses of $1.4 million and $1.9 million provided in “Accounts payable and accrued expenses” in the consolidated financial statements for September 30, 2014 and 2013, respectively.
The following table summarizes consumer loan balances outstanding as of September 30, 2014 and 2013 (in thousands):
| As of September 30, | ||||||||||||||||||||||||
| 2014 | 2013 | |||||||||||||||||||||||
| Company Owned (a) |
Guaranteed by the Company (a) |
Combined (b) | Company Owned (a) |
Guaranteed by the Company (a) |
Combined (b) | |||||||||||||||||||
| Ending consumer loan balances: |
||||||||||||||||||||||||
| Domestic |
||||||||||||||||||||||||
| Short-term loans |
$ | 34,113 | $ | 35,389 | $ | 69,502 | $ | 33,229 | $ | 35,107 | $ | 68,336 | ||||||||||||
| Line of credit accounts |
72,648 | — | 72,648 | 59,341 | — | 59,341 | ||||||||||||||||||
| Installment loans |
135,664 | 40 | 135,704 | 61,801 | — | 61,801 | ||||||||||||||||||
|
|
|
|
|
|
|
|
|
|
|
|
|
|||||||||||||
| Total domestic, gross |
242,425 | 35,429 | 277,854 | 154,371 | 35,107 | 189,478 | ||||||||||||||||||
|
|
|
|
|
|
|
|
|
|
|
|
|
|||||||||||||
| International |
||||||||||||||||||||||||
| Short-term loans |
16,709 | — | 16,709 | 63,276 | 22 | 63,298 | ||||||||||||||||||
| Line of credit accounts |
55,627 | — | 55,627 | 40,265 | — | 40,265 | ||||||||||||||||||
| Installment loans |
58,932 | — | 58,932 | 101,143 | — | 101,143 | ||||||||||||||||||
|
|
|
|
|
|
|
|
|
|
|
|
|
|||||||||||||
| Total international, gross |
131,268 | — | 131,268 | 204,684 | 22 | 204,706 | ||||||||||||||||||
|
|
|
|
|
|
|
|
|
|
|
|
|
|||||||||||||
| Total ending loan balance, gross |
373,693 | 35,429 | 409,122 | 359,055 | 35,129 | 394,184 | ||||||||||||||||||
|
|
|
|
|
|
|
|
|
|
|
|
|
|||||||||||||
| Less: Allowance and liabilities for losses (a) |
(69,999 | ) | (1,444 | ) | (71,443 | ) | (87,054 | ) | (1,942 | ) | (88,996 | ) | ||||||||||||
|
|
|
|
|
|
|
|
|
|
|
|
|
|||||||||||||
| Total ending loan balance, net |
$ | 303,694 | $ | 33,985 | $ | 337,679 | $ | 272,001 | $ | 33,187 | $ | 305,188 | ||||||||||||
|
|
|
|
|
|
|
|
|
|
|
|
|
|||||||||||||
| (a) | GAAP measure. The consumer loan balances guaranteed by us relate to loans originated by third-party lenders through the CSO programs and are not included in our financial statements. |
| (b) | Except for allowance and liability for estimated losses, amounts represent non-GAAP measures. |
82
Table of Contents
Average Amount Outstanding per Consumer Loan
The average amount outstanding per consumer loan is calculated as the total combined consumer loans, gross balance at the end of the period divided by the total number of combined consumer loans outstanding at the end of the period. The following table shows the average amount outstanding per consumer loan by product at September 30, 2014 and 2013:
| As of September 30, | ||||||||
| 2014 | 2013 | |||||||
| Average amount outstanding per consumer loan (in ones) (a) |
||||||||
| Short-term loans (b) |
$ | 447 | $ | 525 | ||||
| Line of credit accounts |
734 | 732 | ||||||
| Installment loans (b) |
1,318 | 1,048 | ||||||
|
|
|
|
|
|||||
| Total consumer loans (b) |
$ | 794 | $ | 727 | ||||
| (a) | The disclosure regarding the average amount per consumer loan is statistical data that is not included in our financial statements. |
| (b) | Includes loans guaranteed by us, which represent loans originated by third-party lenders through the CSO programs and are not included in our financial statements. |
The average amount outstanding per consumer loan increased to $794 from $727 during the current quarter compared to the prior year quarter, mainly due to a greater mix in the current quarter of line of credit accounts and installment loans, which have higher average amounts per loan relative to short-term loans, in the current quarter compared to the prior year quarter. This increase was partially offset by a decrease in short-term loans, which have a lower average loan amount relative to line of credit accounts and installment loans.
Average Consumer Loan Amount
The average amount per consumer loan is calculated as the total amount of combined consumer loans written and renewed for the period divided by the total number of combined consumer loans written and renewed for the period. The following table shows the average amount per consumer loan by product for the current quarter compared to the prior year quarter:
| Three Months Ended September 30, |
||||||||
| 2014 | 2013 | |||||||
| Average amount per consumer loan (in ones) (a) |
||||||||
| Short-term loans (b) |
$ | 502 | $ | 515 | ||||
| Line of credit accounts (c) |
263 | 315 | ||||||
| Installment loans (b) |
1,576 | 1,187 | ||||||
|
|
|
|
|
|||||
| Total consumer loans (b) |
$ | 488 | $ | 524 | ||||
| (a) | The disclosure regarding the average amount per consumer loan is statistical data that is not included in our financial statements. |
| (b) | Includes loans guaranteed by us, which represent loans originated by third-party lenders through the CSO programs and are not included in our financial statements. |
| (c) | Represents the average amount of each incremental draw on line of credit accounts. |
The average amount per consumer loan decreased to $488 from $524 during the current quarter compared to the prior year quarter, mainly due to a greater mix in the current quarter of line of credit accounts, which have lower average amounts per loan relative to short-term loans, and stricter underwriting standards for our U.K. business in the current quarter compared to the prior year quarter. This decrease was partially offset by an increase in installment loans, which have a higher average loan amount relative to short-term loans.
83
Table of Contents
CONSUMER LOAN LOSS EXPERIENCE
The allowance and liability for estimated losses as a percentage of combined consumer loans and fees receivable decreased to 17.5% as of September 30, 2014 from 22.6% as of September 30, 2013, primarily due to improved performance across all products in our consumer loan portfolio, partially related to the maturing of our product offerings, such as line of credit accounts and installment loans, to include a higher percentage of customers with established payment histories and partially related to stricter underwriting standards for our U.K. business.
The cost of revenue in the current quarter was $72.9 million, which was composed of $73.0 million related to our owned consumer loans offset by a $0.1 million decrease in the liability for estimated losses related to loans we guaranteed through the CSO programs. The cost of revenue in the prior year quarter was $90.4 million, which was composed of $90.6 million related to our owned consumer loans, offset by a $0.2 million decrease in the liability for estimated losses related to loans we guaranteed through the CSO programs. Total charge-offs, net of recoveries, were $69.5 million and $83.2 million in the current quarter and the prior year quarter, respectively.
The following tables show consumer loan balances and fees receivable and the relationship of the allowance and liability for losses to the combined balances of consumer loans for each of the last five quarters (in thousands):
| 2013 | 2014 | |||||||||||||||||||
| Third Quarter |
Fourth Quarter |
First Quarter |
Second Quarter |
Third Quarter |
||||||||||||||||
| Consumer loan balances and fees receivable: |
||||||||||||||||||||
| Gross—Company owned |
$ | 359,055 | $ | 385,785 | $ | 354,466 | $ | 359,760 | $ | 373,693 | ||||||||||
| Gross—Guaranteed by the Company (a) |
35,128 | 41,412 | 29,643 | 34,915 | 35,429 | |||||||||||||||
|
|
|
|
|
|
|
|
|
|
|
|||||||||||
| Combined consumer loans and fees receivable, gross (b) |
394,183 | 427,197 | 384,109 | 394,675 | 409,122 | |||||||||||||||
| Allowance and liability for losses on consumer loans |
88,996 | 84,365 | 75,479 | 69,375 | 71,443 | |||||||||||||||
|
|
|
|
|
|
|
|
|
|
|
|||||||||||
| Combined consumer loans and fees receivable, net (b) |
$ | 305,187 | $ | 342,832 | $ | 308,630 | $ | 325,300 | $ | 337,679 | ||||||||||
|
|
|
|
|
|
|
|
|
|
|
|||||||||||
| Allowance and liability for losses as a % of combined consumer loans and fees receivable, gross (b) |
22.6 | % | 19.7 | % | 19.7 | % | 17.6 | % | 17.5 | % | ||||||||||
| (a) | Represents loans originated by third-party lenders through the CSO programs, which are not included in our financial statements. |
| (b) | Non-GAAP measure. |
Consumer Loan Loss Experience by Product
Management evaluates loss rates for all consumer loan products in our portfolio to determine credit quality and evaluate trends. For our products, we evaluate consumer loan losses as a percentage of the average consumer loan balance outstanding or the average combined consumer loan balance outstanding, whichever is applicable, for each portfolio. We expect future loss rates to continue to be affected by changes to our U.K. business. See “—Recent Regulatory Developments—Financial Conduct Authority.”
Short-term Loans
Demand for our short-term loan product in the United States has historically been highest in the third and fourth quarters of each year, corresponding to the holiday season, and lowest in the first quarter of each year, corresponding to our customers’ receipt of income tax refunds. Typically, our gross profit margin is highest in the first quarter of each year, corresponding to the seasonal decline in consumer loan balances outstanding. The cost of revenue as a percentage of the average combined consumer loan balance for short-term loans outstanding is typically lower in the first quarter and generally peaks in the second half of the year with higher loan demand. This seasonal trend was not evident during 2013, primarily due to a significant decline in demand for short-term loans in the United Kingdom when we began offering a line of credit account product. This trend continued in
84
Table of Contents
the United Kingdom during the nine-month period ended September 30, 2014, or the current nine-month period. The cost of revenue as a percentage of the average combined consumer loan balance of short-term loans was also impacted by increased collections as well as recent refinements made to our consumer loan underwriting models, primarily as a result of changes in business practices in the U.K. The average short-term combined consumer loan balance outstanding for short-term consumer loans declined during 2013 and the current nine-month period, primarily due to a decrease in demand for short-term loans and customers’ preference for the line of credit account product.
The following table includes information related only to short-term consumer loans and shows our loss experience trends for short-term consumer loans for each of the last five quarters (in thousands):
| 2013 | 2014 | |||||||||||||||||||
| Third Quarter |
Fourth Quarter |
First Quarter |
Second Quarter |
Third Quarter |
||||||||||||||||
| Short-term consumer loans: |
||||||||||||||||||||
| Cost of revenue |
$ | 33,606 | $ | 25,678 | $ | 16,316 | $ | 19,670 | $ | 18,936 | ||||||||||
| Charge-offs (net of recoveries) |
42,922 | 35,863 | 19,156 | 19,755 | 19,630 | |||||||||||||||
| Average short-term combined consumer loans and fees receivable, gross: |
||||||||||||||||||||
| Company owned (a) |
108,032 | 84,651 | 71,686 | 62,404 | 55,296 | |||||||||||||||
| Guaranteed by the Company (a)(b) |
35,951 | 36,369 | 34,321 | 32,022 | 35,594 | |||||||||||||||
|
|
|
|
|
|
|
|
|
|
|
|||||||||||
| Average short-term combined consumer loans and fees receivable, gross (a)(c) |
$ | 143,983 | $ | 121,020 | $ | 106,007 | $ | 94,426 | $ | 90,890 | ||||||||||
|
|
|
|
|
|
|
|
|
|
|
|||||||||||
| Ending short-term combined consumer loans and fees receivable, gross: |
||||||||||||||||||||
| Company owned |
$ | 96,505 | $ | 80,753 | $ | 65,910 | $ | 60,140 | $ | 50,822 | ||||||||||
| Guaranteed by the Company (b) |
35,128 | 41,412 | 29,643 | 34,915 | 35,389 | |||||||||||||||
|
|
|
|
|
|
|
|
|
|
|
|||||||||||
| Ending short-term combined consumer loans and fees receivable, gross (c) |
$ | 131,633 | $ | 122,165 | $ | 95,553 | $ | 95,055 | $ | 86,211 | ||||||||||
|
|
|
|
|
|
|
|
|
|
|
|||||||||||
| Ending allowance and liability for losses |
$ | 32,514 | $ | 22,513 | $ | 19,726 | $ | 19,829 | $ | 18,857 | ||||||||||
|
|
|
|
|
|
|
|
|
|
|
|||||||||||
| Short-term consumer loan ratios: |
||||||||||||||||||||
| Cost of revenue as a % of average short-term combined consumer loans and fees receivable, gross (a)(c) |
23.3 | % | 21.2 | % | 15.4 | % | 20.8 | % | 20.8 | % | ||||||||||
| Charge-offs (net of recoveries) as a % of average short-term combined consumer loans and fees receivable, gross (a)(c) |
29.8 | % | 29.6 | % | 18.1 | % | 20.9 | % | 21.6 | % | ||||||||||
| Gross profit margin |
63.7 | % | 67.6 | % | 77.6 | % | 70.1 | % | 69.4 | % | ||||||||||
| Allowance and liability for losses as a % of combined consumer loans and fees receivable, gross (c)(d) |
24.7 | % | 18.4 | % | 20.6 | % | 20.9 | % | 21.9 | % | ||||||||||
| (a) | The average short-term combined consumer loans and fees receivable is the average of the month-end balances during the period. |
| (b) | Represents loans originated by third-party lenders through the CSO programs, which are not included in our financial statements. |
| (c) | Non-GAAP measure. |
| (d) | Allowance and liability for losses as a % of combined consumer loans and fees receivable, gross, is determined using period-end balances. |
Line of Credit Accounts
The cost of revenue as a percentage of average consumer loan balance for line of credit accounts exhibits a similar quarterly seasonal trend to short-term consumer loan loss rates as the ratio is typically lower in the first quarter and increases throughout the remainder of the year, peaking in the second half of the year with higher loan demand.
85
Table of Contents
The gross profit margin is generally lower for line of credit accounts because the highest levels of default are exhibited in the early stages of the account, while the revenue is recognized over the term of the account. As a result, particularly in periods of higher growth for line of credit account portfolios, which has been the case in recent years, the gross profit margin will be lower for this product than for our short-term loan products. The year over year decrease in the allowance for losses as a percentage of consumer loan balance was primarily due to the maturing of the line of credit portfolio reflected in a lower percentage of the portfolio in a delinquent status, and, as a result, the typical seasonal trend was not evidenced during the current nine-month period. During the third quarter of 2014 we experienced a seasonal sequential increase in the average line of credit account balance; however, this increase was moderated by the sequential decline from the second quarter of 2014 in the average line of credit account balance in the United Kingdom, primarily as a result of changes in business practices. We expect that this trend may continue as we comply with current and future regulatory changes in that market. See “—Recent Regulatory Developments—Financial Conduct Authority” for further discussion.
The following table includes information related only to line of credit accounts and shows our loss experience trends for line of credit accounts for each of the last five quarters (in thousands):
| 2013 | 2014 | |||||||||||||||||||
| Third Quarter |
Fourth Quarter |
First Quarter |
Second Quarter |
Third Quarter |
||||||||||||||||
| Line of credit accounts: |
||||||||||||||||||||
| Cost of revenue |
$ | 26,152 | $ | 29,682 | $ | 23,913 | $ | 21,786 | $ | 25,913 | ||||||||||
| Charge-offs (net of recoveries) |
14,211 | 25,159 | 26,602 | 27,211 | 24,292 | |||||||||||||||
| Average consumer loan balance (a) |
79,757 | 110,439 | 121,457 | 120,228 | 126,908 | |||||||||||||||
| Ending consumer loan balance |
99,606 | 125,802 | 119,004 | 122,409 | 128,275 | |||||||||||||||
| Ending allowance for losses balance |
$ | 24,405 | $ | 29,244 | $ | 26,669 | $ | 21,579 | $ | 22,672 | ||||||||||
| Line of credit account ratios: |
||||||||||||||||||||
| Cost of revenue as a % of average consumer loan |
32.8 | % | 26.9 | % | 19.7 | % | 18.1 | % | 20.4 | % | ||||||||||
| Charge-offs (net of recoveries) as a % of average consumer loan balance (a) |
17.8 | % | 22.8 | % | 21.9 | % | 22.6 | % | 19.1 | % | ||||||||||
| Gross profit margin |
48.2 | % | 56.7 | % | 67.3 | % | 70.9 | % | 68.0 | % | ||||||||||
| Allowance for losses as a % of consumer loan |
24.5 | % | 23.2 | % | 22.4 | % | 17.6 | % | 17.7 | % | ||||||||||
| (a) | The average consumer loan balance for line of credit accounts is the average of the month-end balances during the period. |
| (b) | Allowance for losses as a % of consumer loan balance is determined using period-end balances. |
Installment Loans
For installment loans, the cost of revenue as a percentage of average consumer loan balance is typically more consistent throughout the year. Due to the scheduled monthly or bi-weekly payments that are inherent with installment loans, we do not experience the higher level of repayments in the first quarter for these loans as we experience with short-term loans and, to a lesser extent, line of credit accounts.
The gross profit margin is generally lower for the installment loan product than for other loan products, primarily because the highest levels of default are exhibited in the early stages of the loan, while revenue is recognized over the term of the loan. In addition, installment loans typically have a higher average amount per loan. As a result, particularly in periods of higher growth for the installment loan portfolio, which has been the case in recent years, the gross profit margin is typically lower for this product than for our short-term consumer loan products. Another factor contributing to the lower gross profit margin is that the loan yield for installment loans is typically lower than the other loan products we offer. During the current quarter, we experienced higher gross
86
Table of Contents
profit margin than we experienced in the prior year quarter, primarily due to the maturing of the installment loan product and the growth of our near-prime installment loan products as well as a decrease in new customer activity in the United Kingdom due to recent changes initiated in that market. The higher gross profit margin was also partially a result of lower allowance and liability for losses in the current quarter compared to the prior year quarter because the installment loan portfolio includes a higher percentage of customers with established payment histories in the current quarter compared to the prior year quarter. New customers tend to have a higher risk of default than customers with a history of successfully repaying loans.
The following table includes information related only to our installment loans and shows our loss experience trends for installment loans for each of the last five quarters (in thousands):
| 2013 | 2014 | |||||||||||||||||||
| Third Quarter |
Fourth Quarter |
First Quarter |
Second Quarter |
Third Quarter |
||||||||||||||||
| Installment loans: |
||||||||||||||||||||
| Cost of revenue |
$ | 30,631 | $ | 31,145 | $ | 26,203 | $ | 25,384 | $ | 28,070 | ||||||||||
| Charge-offs (net of recoveries) |
26,089 | 30,866 | 29,899 | 26,818 | 25,620 | |||||||||||||||
| Average installment combined consumer loans and fees receivable, gross: |
||||||||||||||||||||
| Company owned (a) |
146,142 | 168,588 | 175,198 | 171,043 | 186,298 | |||||||||||||||
| Guaranteed by the Company (a)(b) |
— | — | — | — | 10 | |||||||||||||||
|
|
|
|
|
|
|
|
|
|
|
|||||||||||
| Average installment combined consumer loans and fees receivable, gross (a)(c) |
146,142 | 168,588 | 175,198 | 171,043 | 186,308 | |||||||||||||||
|
|
|
|
|
|
|
|
|
|
|
|||||||||||
| Ending installment combined consumer loans and fees receivable, gross: |
||||||||||||||||||||
| Company owned |
162,944 | 179,230 | 169,552 | 177,211 | 194,596 | |||||||||||||||
| Guaranteed by the Company (b) |
— | — | — | — | 40 | |||||||||||||||
|
|
|
|
|
|
|
|
|
|
|
|||||||||||
| Ending installment combined consumer loans and fees receivable, gross (c) |
162,944 | 179,230 | 169,552 | 177,211 | 194,636 | |||||||||||||||
|
|
|
|
|
|
|
|
|
|
|
|||||||||||
| Ending allowance and liability for losses |
$ | 32,077 | $ | 32,608 | $ | 29,084 | $ | 27,967 | $ | 29,914 | ||||||||||
|
|
|
|
|
|
|
|
|
|
|
|||||||||||
| Installment loan ratios: |
||||||||||||||||||||
| Cost of revenue as a % of average installment combined consumer loans and fees receivable, gross (a)(c) |
21.0 | % | 18.5 | % | 15.0 | % | 14.8 | % | 15.1 | % | ||||||||||
| Charge-offs (net of recoveries) as a % of average installment combined consumer loans and fees receivable, gross (a)(c) |
17.9 | % | 18.3 | % | 17.0 | % | 15.7 | % | 13.8 | % | ||||||||||
| Gross profit margin |
44.1 | % | 49.0 | % | 58.0 | % | 58.3 | % | 54.6 | % | ||||||||||
| Allowance and liability for losses as a % of combined consumer loans and fees receivable, gross (c)(d) |
19.7 | % | 18.2 | % | 17.2 | % | 15.8 | % | 15.4 | % | ||||||||||
| (a) | The average installment combined consumer loan and fees receivable is the average of the month-end balances during the period. |
| (b) | Represents loans originated by third-party lenders through the CSO programs, which are not included in our financial statements. |
| (c) | Non-GAAP measure. |
| (d) | Allowance and liability for losses as a % of combined consumer loans and fees receivable, gross, is determined using period-end balances. |
87
Table of Contents
Total Expenses
Total expenses increased $12.9 million, or 16.8%, to $89.3 million in the current quarter, compared to $76.4 million in the prior year quarter.
Marketing expense decreased to $33.4 million in the current quarter compared to $36.5 million in the prior year quarter. Lower lead generation costs, lower domestic advertising costs and other marketing costs in our international operations were offset by higher domestic direct mail and other marketing costs.
Operations and technology expense increased to $19.4 million in the current quarter compared to $18.0 million in the prior year quarter, primarily due to increased personnel costs in our domestic operations resulting from higher loan volume.
General and administrative expense increased $13.2 million, or 73.2%, to $31.2 million in the current quarter compared to $18.0 million in the prior year quarter, primarily due to higher incentive accruals resulting from our strong financial performance and the addition of new personnel to support our growth, an increase in expenses allocated from Cash America reflecting higher allocated corporate services costs, higher accounting and legal professional services expenses incurred in the current quarter in conjunction with Cash America’s decision to review strategic alternatives for our separation and certain other matters (see “—Separation from Cash America”) and higher regulatory expenses related to our U.K. operations (see “—Recent Regulatory Developments—Financial Conduct Authority”).
Depreciation and amortization expense increased $1.4 million, or 34.9%, in the current quarter compared to the prior year quarter, primarily due to the acceleration of depreciation resulting from our planned office relocation of our headquarters in 2015.
Interest Expense, Net
On May 30, 2014, we issued and sold $500.0 million in aggregate principal amount of senior notes, or the Notes, in a private offering and terminated our credit agreement with Cash America. The Notes bear interest at a rate of 9.75% and were sold at a discount of the principal amount thereof to yield 10.0% to maturity. We used all of the net proceeds, or $479.0 million, of the Notes offering to repay all of our intercompany indebtedness due to Cash America, which was $361.4 million as of May 30, 2014, and the remaining net proceeds were used to pay a significant portion of a $122.4 million cash dividend to Cash America, of which $120.7 million was paid on May 30, 2014 and $1.7 million was paid on June 30, 2014. Prior to issuing the Notes, we utilized affiliate borrowing agreements with Cash America for all borrowing arrangements. Pursuant to these agreements, interest was charged at a base rate plus an applicable margin.
Interest expense, net increased $8.2 million, or 167.6%, to $13.1 million in the current quarter compared to $4.9 million in the prior year quarter. The increase was due to an increase in the weighted average interest rate on our outstanding debt to 10.00% in the current quarter from 4.71% in the prior year quarter, and an increase in the average amount of debt outstanding, which increased $85.1 million to $494.0 million during the current quarter from $408.9 million during the prior year quarter. We expect our interest expense for the remainder of 2014 to increase to reflect the higher interest rate and debt outstanding.
Provision for Income Taxes
Provision for income taxes increased $2.7 million, or 31.2%, to $11.2 million in the current quarter compared to $8.5 million in the prior year quarter. The increase was primarily due to a 15.9% increase in income before income taxes and an increase in the effective tax rate to 37.8% in the current quarter from 33.3% in the prior year quarter, primarily due to nondeductible expenses related to the Spin-off.
88
Table of Contents
NINE MONTHS ENDED SEPTEMBER 30, 2014 COMPARED TO NINE MONTHS ENDED SEPTEMBER 30, 2013
Revenue and Gross Profit
Revenue increased $58.6 million, or 10.5%, to $615.1 million for the current nine-month period as compared to $556.5 million for the nine-month period ended September 30, 2013, or the prior year nine-month period. Domestic operations contributed $59.9 million to the increase, primarily due to growth in domestic consumer loan balances, mainly resulting from the expansion of our line of credit account and installment loan portfolios in the United States. The increase in domestic operations was partially offset by a decrease of $1.3 million in our international operations, primarily in the United Kingdom.
Our gross profit increased by $80.9 million to $408.9 million in the current nine-month period from $328.0 million in the prior year nine-month period, primarily due to the growth and the composition of the consumer loan portfolio in our domestic and international operations. Our consolidated gross profit margin increased to 66.5% in the current nine-month period from 58.9% in the prior year nine-month period, primarily because our consumer loan portfolios had a higher percentage mix of customers with established payment histories during the current nine-month period as compared to the prior year nine-month period and increased collections resulting in a lower percentage of delinquent loans. Line of credit account and installment loan products comprised 78.9% of the combined gross consumer loan balance at September 30, 2014 compared to 66.6% at September 30, 2013. While the short-term consumer loan product was a less significant portion of the aggregate portfolio, loss experience for the product also decreased in the current nine-month period compared to the prior year nine-month period, contributing to the increase in gross profit margin for the period. In addition, we recently made refinements to our consumer loan underwriting models, as a result of changes in business practices in the United Kingdom, which we believe also contributed to the recent improvements in gross profit margin, but were also a cause of the decreased revenue in the United Kingdom. Additional discussion of the specific factors influencing each product is included in “—Consumer Loan Loss Experience—Consumer Loan Loss Experience by Product” above and below. Our historical results from operations do not include the full impact of changes and expected changes in our U.K. operations resulting from recent regulatory and legislative changes and are not indicative of our future results of operations and cash flows from our U.K. operations. See “—Recent Regulatory Developments—Financial Conduct Authority” above for further information.
The following table sets forth the components of revenue and gross profit, separated between domestic and international, for the current and prior year nine-month periods (dollars in thousands):
| Nine Months Ended September 30, | ||||||||||||||||||||||||
| 2014 | 2013 | |||||||||||||||||||||||
| Domestic | International | Total | Domestic | International | Total | |||||||||||||||||||
| Short-term loans |
$ | 131,911 | $ | 68,659 | $ | 200,570 | $ | 138,547 | $ | 172,003 | $ | 310,550 | ||||||||||||
| Line of credit accounts |
112,805 | 116,034 | 228,839 | 82,073 | 19,949 | 102,022 | ||||||||||||||||||
| Installment loans |
99,206 | 85,851 | 185,057 | 62,461 | 80,377 | 142,838 | ||||||||||||||||||
| Other |
81 | 568 | 649 | 1,051 | 92 | 1,143 | ||||||||||||||||||
|
|
|
|
|
|
|
|
|
|
|
|
|
|||||||||||||
| Revenue |
344,003 | 271,112 | 615,115 | 284,132 | 272,421 | 556,553 | ||||||||||||||||||
| Cost of Revenue |
122,892 | 83,303 | 206,195 | 113,391 | 115,156 | 228,547 | ||||||||||||||||||
|
|
|
|
|
|
|
|
|
|
|
|
|
|||||||||||||
| Gross Profit |
$ | 221,111 | $ | 187,809 | $ | 408,920 | $ | 170,741 | $ | 157,265 | $ | 328,006 | ||||||||||||
|
|
|
|
|
|
|
|
|
|
|
|
|
|||||||||||||
| Year-over-year change—$ |
$ | 50,370 | $ | 30,544 | $ | 80,914 | ||||||||||||||||||
| Year-over-year change—% |
29.5 | % | 19.4 | % | 24.7 | % | ||||||||||||||||||
| Gross profit margin |
64.3 | % | 69.3 | % | 66.5 | % | 60.1 | % | 57.7 | % | 58.9 | % | ||||||||||||
89
Table of Contents
Average Consumer Loan Amount
The following table shows the average amount per consumer loan by product for the current nine-month period compared to the prior year nine-month period:
| Nine Months Ended September 30, |
||||||||
| 2014 | 2013 | |||||||
| Average amount per consumer loan (in ones) (a) |
||||||||
| Short-term loans (b) |
$ | 515 | $ | 530 | ||||
| Line of credit accounts (c) |
273 | 301 | ||||||
| Installment loans (b) |
1,399 | 1,154 | ||||||
|
|
|
|
|
|||||
| Total consumer loans (b) |
$ | 489 | $ | 535 | ||||
| (a) | The disclosure regarding the average amount per consumer loan is statistical data that is not included in our financial statements. |
| (b) | Includes loans guaranteed by us, which represent loans originated by third-party lenders through the CSO programs and are not included in our financial statements. |
| (c) | Represents the average amount of each incremental draw on line of credit accounts. |
The average amount per consumer loan decreased to $489 from $535 during the current nine-month period compared to the prior year nine-month period, mainly due to a greater mix of line of credit accounts, which have lower average amounts per loan relative to short-term loans in the current nine-month period compared to the prior year nine-month period. This decrease was partially offset by an increase in installment loans, which have a higher average loan amount relative to short-term loans.
Consumer Loan Loss Experience
The allowance and liability for estimated losses as a percentage of combined consumer loans and fees receivable decreased to 17.5% as of September 30, 2014 from 22.6% as of September 30, 2013, primarily due to improved performance across all products in our consumer loan portfolio, partially related to the maturing of our product offerings, such as line of credit accounts and installment loans, to include a higher percentage of customers with established payment histories and partially related to stricter underwriting standards for our U.K. business.
The cost of revenue in the current nine-month period was $206.2 million, which was composed of $206.8 million related to our owned consumer loans, offset by a $0.6 million decrease in the liability for estimated losses related to loans we guaranteed through the CSO programs. The cost of revenue in the prior year nine-month period was $228.5 million, which was composed of $229.2 million related to our owned consumer loans, offset by a $0.7 million decrease in the liability for estimated losses related to loans we guaranteed through the CSO programs. Total charge-offs, net of recoveries, were $219.0 million and $224.4 million in the current nine-month period and the prior year nine-month period, respectively.
Total Expenses
Total expenses increased $21.4 million, or 9.6%, to $243.4 million in the current nine-month period compared to $222.0 million in the prior year nine-month period.
Marketing expenses decreased $1.9 million, or 2.0%, to $92.7 million in the current nine-month period compared to $94.6 million in the prior year nine-month period, primarily due to lower lead generation costs and other marketing costs in our international operations that were partially offset by higher domestic direct mail and pay-per-click advertising costs.
Operations and technology expense increased $1.9 million, or 3.6%, to $54.4 million in the current nine-month period compared to $52.5 million in the prior year nine-month period, primarily due to increased personnel costs in our domestic operations resulting from higher loan volume.
90
Table of Contents
General and administrative expense increased $20.6 million, or 33.4%, to $82.5 million in the current nine-month period compared to $61.9 million in the prior year nine-month period, primarily due to higher incentive accruals resulting from our strong financial performance, the addition of new personnel to support our growth, higher regulatory expenses related to our U.K. operations (see “—Recent Regulatory Developments—Financial Conduct Authority”) and higher accounting and legal professional services expenses incurred in the current nine-month period in conjunction with Cash America’s decision to review strategic alternatives for our separation and certain other matters (see “—Separation from Cash America”).
Depreciation and amortization expense increased $0.8 million, or 6.1%, in the current nine-month period compared to the prior year nine-month period, primarily due to the acceleration of depreciation in the current nine-month period related to the planned relocation of our headquarters in 2015, partially offset by the acceleration of depreciation related to the phase-out of certain loan platforms in the prior year nine-month period.
Interest Expense, Net
Interest expense, net increased $10.5 million, or 71.0%, to $25.2 million in the current nine-month period, compared to $14.7 million in the prior year nine-month period. The increase was primarily due to an increase in the weighted average interest rate on our outstanding debt to 7.36% in the current nine-month period from 4.74% in the prior year nine-month period and a $26.4 million increase in the average amount of debt outstanding to $438.3 million during the current nine-month period from $411.9 million during the prior year nine-month period.
Provision for Income Taxes
Provision for income taxes increased $18.6 million, or 58.4%, to $50.6 million in the current nine-month period compared to $32.0 million in the prior year nine-month period. The increase was primarily due to a 54.8% increase in income before income taxes and an increase in the effective tax rate to 36.2% in the current nine-month period from 35.4% in the prior year nine-month period, primarily due to nondeductible expenses related to the Spin-off.
YEAR ENDED 2013 COMPARED TO YEAR ENDED 2012
Revenue and Gross Profit
Revenue increased $104.4 million, or 15.8%, to $765.3 million for 2013 as compared to $660.9 million for 2012. The increase in revenue is primarily due to the expansion of our installment loan and line of credit portfolios in the United States and the United Kingdom.
Our gross profit increased by $77.8 million to $450.3 million in 2013 from $372.5 million in 2012, primarily due to the growth and the composition of the consumer loan portfolio in our domestic and international operations. Our consolidated gross profit margin increased to 58.8% in 2013 from 56.4% in 2012, primarily because our consumer loan portfolios had a higher percentage of customers with established payment histories during 2013 as compared to 2012.
91
Table of Contents
The following table sets forth the components of revenue and gross profit, separated between domestic and international, in 2013 and 2012 (in thousands):
| Year Ended December 31, | ||||||||||||||||||||||||
| 2013 | 2012 | |||||||||||||||||||||||
| Domestic | International | Total | Domestic | International | Total | |||||||||||||||||||
| Short-term loans |
$ | 185,524 | $ | 204,182 | $ | 389,706 | $ | 202,581 | $ | 257,254 | $ | 459,835 | ||||||||||||
| Installment loans |
89,967 | 113,957 | 203,924 | 56,627 | 69,575 | 126,202 | ||||||||||||||||||
| Line of credit accounts |
118,963 | 51,533 | 170,496 | 73,532 | — | 73,532 | ||||||||||||||||||
| Other |
1,095 | 102 | 1,197 | 1,326 | 33 | 1,359 | ||||||||||||||||||
|
|
|
|
|
|
|
|
|
|
|
|
|
|||||||||||||
| Revenue |
395,549 | 369,774 | 765,323 | 334,066 | 326,862 | 660,928 | ||||||||||||||||||
| Cost of Revenue |
157,344 | 157,708 | 315,052 | 144,455 | 144,019 | 288,474 | ||||||||||||||||||
|
|
|
|
|
|
|
|
|
|
|
|
|
|||||||||||||
| Gross Profit |
$ | 238,205 | $ | 212,066 | $ | 450,271 | $ | 189,611 | $ | 182,843 | $ | 372,454 | ||||||||||||
|
|
|
|
|
|
|
|
|
|
|
|
|
|||||||||||||
| Year-over-year change—$ |
$ | 48,594 | $ | 29,223 | $ | 77,817 | — | — | — | |||||||||||||||
| Year-over-year change—% |
25.6 | % | 16.0 | % | 20.9 | % | — | — | — | |||||||||||||||
| Gross profit margin |
60.2 | % | 57.4 | % | 58.8 | % | 56.8 | % | 55.9 | % | 56.4 | % | ||||||||||||
Consumer Loan Balances
The outstanding combined portfolio balance of consumer loans, net of allowances and liabilities for losses, increased $68.8 million, or 25.1%, to $342.8 million at December 31, 2013 from $274.0 million at December 31, 2012, primarily due to increased demand for installment loan and line of credit account products in both domestic and international markets, partially offset by a decrease in demand for short-term loans.
The combined consumer loan balance includes $385.8 million and $310.7 million at December 31, 2013 and 2012, respectively, of our owned consumer loan balances, before the allowance for losses of $82.3 million and $82.4 million, respectively, which have both been provided in the consolidated financial statements at December 31, 2013 and 2012, respectively. The combined consumer loan balance also includes $41.4 million and $48.2 million at December 31, 2013 and 2012, respectively, of consumer loan balances that are guaranteed by us and are not included in our financial statements. The liability for estimated losses related to the consumer loan balances we guarantee of $2.0 million and $2.6 million has been included in “Accounts payable and accrued expenses” in the consolidated financial statements at December 31, 2013 and 2012, respectively.
92
Table of Contents
The following table summarizes the consumer loan balances as of December 31, 2013 and 2012 (in thousands):
| As of December 31, | ||||||||||||||||||||||||
| 2013 | 2012 | |||||||||||||||||||||||
| Company Owned (a) |
Guaranteed by the Company (a) |
Combined (b) | Company Owned (a) |
Guaranteed by the Company (a) |
Combined (b) | |||||||||||||||||||
| Ending consumer loan balances: |
||||||||||||||||||||||||
| Domestic |
||||||||||||||||||||||||
| Short-term loans |
$ | 32,867 | $ | 41,412 | $ | 74,279 | $ | 37,734 | $ | 44,261 | $ | 81,995 | ||||||||||||
| Installment loans |
76,195 | — | 76,195 | 45,713 | — | 45,713 | ||||||||||||||||||
| Line of credit accounts |
66,247 | — | 66,247 | 42,700 | — | 42,700 | ||||||||||||||||||
|
|
|
|
|
|
|
|
|
|
|
|
|
|||||||||||||
| Total domestic, gross |
175,309 | 41,412 | 216,721 | 126,147 | 44,261 | 170,408 | ||||||||||||||||||
|
|
|
|
|
|
|
|
|
|
|
|
|
|||||||||||||
| International |
||||||||||||||||||||||||
| Short-term loans |
47,886 | — | 47,886 | 108,738 | 3,946 | 112,684 | ||||||||||||||||||
| Installment loans |
103,035 | — | 103,035 | 75,857 | — | 75,857 | ||||||||||||||||||
| Line of credit accounts |
59,555 | — | 59,555 | — | — | — | ||||||||||||||||||
|
|
|
|
|
|
|
|
|
|
|
|
|
|||||||||||||
| Total international, gross |
210,476 | — | 210,476 | 184,595 | 3,946 | 188,541 | ||||||||||||||||||
|
|
|
|
|
|
|
|
|
|
|
|
|
|||||||||||||
| Total ending loan balance, gross |
385,785 | 41,412 | 427,197 | 310,742 | 48,207 | 358,949 | ||||||||||||||||||
|
|
|
|
|
|
|
|
|
|
|
|
|
|||||||||||||
| Less: Allowance and liability for losses (a) |
(82,318 | ) | (2,047 | ) | (84,365 | ) | (82,352 | ) | (2,624 | ) | (84,976 | ) | ||||||||||||
|
|
|
|
|
|
|
|
|
|
|
|
|
|||||||||||||
| Total ending loan balance, net |
$ | 303,467 | $ | 39,365 | $ | 342,832 | $ | 228,390 | $ | 45,583 | $ | 273,973 | ||||||||||||
|
|
|
|
|
|
|
|
|
|
|
|
|
|||||||||||||
| (a) | GAAP measure. The consumer loan balances guaranteed by us relate to loans originated by third-party lenders through the CSO programs and are not included in our financial statements. |
| (b) | Except for allowance and liability for estimated losses, amounts represent non-GAAP measures. |
Average Consumer Loan Amount
The following table shows the average amount per consumer loan by product for 2013 compared to 2012:
| Year Ended December 31, |
||||||||
| 2013 | 2012 | |||||||
| Average amount per consumer loan (in ones) (a) |
||||||||
| Short-term loans (b) |
$ | 529 | $ | 541 | ||||
| Installment loans |
1,173 | 1,100 | ||||||
| Line of credit accounts (c) |
299 | 279 | ||||||
|
|
|
|
|
|||||
| Total consumer loans (b) |
$ | 529 | $ | 542 | ||||
| (a) | The disclosure regarding the average amount per consumer loan is statistical data that is not included in our financial statements. |
| (b) | Includes loans guaranteed by us, which represent loans originated by third-party lenders through the CSO programs and are not included in our financial statements. |
| (c) | Represents the average amount of each incremental draw on line of credit accounts. |
The average amount per consumer loan decreased to $529 from $542 during 2013 compared to 2012, mainly due to a greater mix in 2013 of line of credit accounts, which have lower average amounts per loan relative to short-term loans. This decrease was partially offset by an increase in installment loans, which have a higher average loan amount relative to short-term loans.
93
Table of Contents
CONSUMER LOAN LOSS EXPERIENCE
The allowance and liability for estimated losses as a percentage of combined consumer loans and fees receivable decreased to 19.7% in 2013 from 23.7% in 2012, primarily due to improved performance of the consumer loan portfolios, partially related to the maturing of our product offerings, such as installment loans and line of credit accounts, to include a higher percentage of customers with established payment histories.
The cost of revenue in 2013 was $315.0 million, which was composed of $315.6 million related to our owned consumer loans, offset by a $0.6 million decrease in the liability for estimated losses related to loans we guaranteed through the CSO programs. The cost of revenue in 2012 was $288.5 million, which was composed of $288.1 million related to our owned consumer loans and $0.4 million related to loans we guaranteed through the CSO programs. Total charge-offs, net of recoveries, were $316.3 million and $266.6 million in 2013 and 2012, respectively.
The following tables show consumer loan balances and fees receivable and the relationship of the allowance and liability for losses to the combined balances of consumer loans by quarter for the years ended December 31, 2013 and 2012 (in thousands):
| 2013 | ||||||||||||||||
| First Quarter |
Second Quarter |
Third Quarter |
Fourth Quarter |
|||||||||||||
| Consumer loan balances and fees receivable: |
||||||||||||||||
| Gross—Company owned |
$ | 281,947 | $ | 310,178 | $ | 359,055 | $ | 385,785 | ||||||||
| Gross—Guaranteed by the Company (a) |
30,002 | 35,416 | 35,128 | 41,412 | ||||||||||||
|
|
|
|
|
|
|
|
|
|||||||||
| Combined consumer loans and fees receivable, gross (b) |
311,949 | 345,594 | 394,183 | 427,197 | ||||||||||||
| Allowance and liability for losses on consumer loans |
77,231 | 79,436 | 88,996 | 84,365 | ||||||||||||
|
|
|
|
|
|
|
|
|
|||||||||
| Combined consumer loans and fees receivable, net (b) |
$ | 234,718 | $ | 266,158 | $ | 305,187 | $ | 342,832 | ||||||||
|
|
|
|
|
|
|
|
|
|||||||||
| Allowance and liability for losses as a % of combined consumer loans and fees receivable, gross (b) |
24.8 | % | 23.0 | % | 22.6 | % | 19.7 | % | ||||||||
|
|
|
|
|
|
|
|
|
|||||||||
| (a) | Represents loans originated by third-party lenders through the CSO programs, which are not included in our financial statements. |
| (b) | Non-GAAP measure. |
| 2012 | ||||||||||||||||
| First Quarter |
Second Quarter |
Third Quarter |
Fourth Quarter |
|||||||||||||
| Consumer loan balances and fees receivable: |
||||||||||||||||
| Gross—Company owned |
$ | 212,363 | $ | 241,083 | $ | 280,832 | $ | 310,742 | ||||||||
| Gross—Guaranteed by the Company (a) |
32,220 | 40,634 | 41,660 | 48,207 | ||||||||||||
|
|
|
|
|
|
|
|
|
|||||||||
| Combined consumer loans and fees receivable, gross (b) |
244,583 | 281,717 | 322,492 | 358,949 | ||||||||||||
| Allowance and liability for losses on consumer loans |
58,026 | 70,016 | 81,110 | 84,976 | ||||||||||||
|
|
|
|
|
|
|
|
|
|||||||||
| Combined consumer loans and fees receivable, net (b) |
$ | 186,557 | $ | 211,701 | $ | 241,382 | $ | 273,973 | ||||||||
|
|
|
|
|
|
|
|
|
|||||||||
| Allowance and liability for losses as a % of combined consumer loans and fees receivable, gross (b) |
23.7 | % | 24.9 | % | 25.2 | % | 23.7 | % | ||||||||
|
|
|
|
|
|
|
|
|
|||||||||
| (a) | Represents loans originated by third-party lenders through the CSO programs, which are not included in our financial statements. |
| (b) | Non-GAAP measure. |
94
Table of Contents
Consumer Loan Loss Experience by Product
Management evaluates loss rates for all consumer loan products in our portfolio to determine credit quality and evaluate trends. For our products, we evaluate consumer loan losses as a percentage of the average consumer loan balance outstanding or the average combined consumer loan balance outstanding, whichever is applicable, for each portfolio.
Short-term Loans
The following tables include information related only to short-term consumer loans and show our loss experience trends for short-term consumer loans for 2013 and 2012 (in thousands):
| 2013 | ||||||||||||||||
| First Quarter |
Second Quarter |
Third Quarter |
Fourth Quarter |
|||||||||||||
| Short-term consumer loans: |
||||||||||||||||
| Cost of revenue |
$ | 39,604 | $ | 37,069 | $ | 33,606 | $ | 25,678 | ||||||||
| Charge-offs (net of recoveries) |
41,267 | 37,656 | 42,922 | 35,863 | ||||||||||||
| Average short-term combined consumer loans and fees receivable, gross: |
||||||||||||||||
| Company owned (a) |
136,087 | 125,106 | 108,032 | 84,651 | ||||||||||||
| Guaranteed by the Company (a)(b) |
39,520 | 32,457 | 35,951 | 36,369 | ||||||||||||
|
|
|
|
|
|
|
|
|
|||||||||
| Average short-term combined consumer loans and fees receivable, gross (a)(c) |
$ | 175,607 | $ | 157,563 | $ | 143,983 | $ | 121,020 | ||||||||
|
|
|
|
|
|
|
|
|
|||||||||
| Ending short-term combined consumer loans and fees receivable, gross: |
||||||||||||||||
| Company owned |
$ | 128,100 | $ | 121,890 | $ | 96,505 | $ | 80,753 | ||||||||
| Guaranteed by the Company (b) |
30,002 | 35,416 | 35,128 | 41,412 | ||||||||||||
|
|
|
|
|
|
|
|
|
|||||||||
| Ending short-term combined consumer loans and fees receivable, gross (c) |
$ | 158,102 | $ | 157,306 | $ | 131,633 | $ | 122,165 | ||||||||
|
|
|
|
|
|
|
|
|
|||||||||
| Ending allowance and liability for losses |
$ | 41,346 | $ | 40,772 | $ | 32,514 | $ | 22,513 | ||||||||
|
|
|
|
|
|
|
|
|
|||||||||
| Short-term consumer loan ratios: |
||||||||||||||||
| Cost of revenue as a % of average short-term combined consumer loans and fees receivable, gross (a)(c) |
22.6 | % | 23.5 | % | 23.3 | % | 21.2 | % | ||||||||
| Charge-offs (net of recoveries) as a % of average short-term combined consumer loans and fees receivable, gross (a)(c) |
23.5 | % | 23.9 | % | 29.8 | % | 29.7 | % | ||||||||
| Gross profit margin |
65.6 | % | 64.0 | % | 63.7 | % | 67.6 | % | ||||||||
| Allowance and liability for losses as a % of combined consumer loans and fees receivable, gross (c)(d) |
26.2 | % | 25.9 | % | 24.7 | % | 18.4 | % | ||||||||
| (a) | The average short-term combined consumer loans and fees receivable is the average of the month-end balances during the period. |
| (b) | Represents loans originated by third-party lenders through the CSO programs, which are not included in our financial statements. |
| (c) | Non-GAAP measure. |
| (d) | Allowance and liability for losses as a % of combined consumer loans and fees receivable, gross, is determined using period-end balances. |
95
Table of Contents
| 2012 | ||||||||||||||||
| First Quarter |
Second Quarter |
Third Quarter |
Fourth Quarter |
|||||||||||||
| Short-term consumer loans: |
||||||||||||||||
| Cost of revenue |
$ | 40,786 | $ | 44,692 | $ | 44,428 | $ | 47,146 | ||||||||
| Charge-offs (net of recoveries) |
47,427 | 39,565 | 46,346 | 45,444 | ||||||||||||
| Average short-term combined consumer loans and fees receivable, gross: |
||||||||||||||||
| Company owned (a) |
132,183 | 126,464 | 132,083 | 134,997 | ||||||||||||
| Guaranteed by the Company (a)(b) |
37,392 | 36,991 | 41,800 | 43,670 | ||||||||||||
|
|
|
|
|
|
|
|
|
|||||||||
| Average short-term combined consumer loans and fees receivable, gross (a)(c) |
$ | 169,575 | $ | 163,455 | $ | 173,883 | $ | 178,667 | ||||||||
|
|
|
|
|
|
|
|
|
|||||||||
| Ending short-term combined consumer loans and fees receivable, gross: |
||||||||||||||||
| Company owned |
$ | 124,971 | $ | 130,058 | $ | 133,396 | $ | 146,472 | ||||||||
| Guaranteed by the Company (b) |
32,220 | 40,634 | 41,660 | 48,207 | ||||||||||||
|
|
|
|
|
|
|
|
|
|||||||||
| Ending short-term combined consumer loans and fees receivable, gross (c) |
$ | 157,191 | $ | 170,692 | $ | 175,056 | $ | 194,679 | ||||||||
|
|
|
|
|
|
|
|
|
|||||||||
| Ending allowance and liability for losses |
$ | 39,366 | $ | 43,785 | $ | 42,995 | $ | 44,566 | ||||||||
|
|
|
|
|
|
|
|
|
|||||||||
| Short-term consumer loan ratios: |
||||||||||||||||
| Cost of revenue as a % of average short-term combined consumer loans and fees receivable, gross (a)(c) |
24.1 | % | 27.3 | % | 25.6 | % | 26.4 | % | ||||||||
| Charge-offs (net of recoveries) as a % of average short-term combined consumer loans and fees receivable, gross (a)(c) |
28.0 | % | 24.2 | % | 26.7 | % | 25.4 | % | ||||||||
| Gross profit margin |
62.8 | % | 60.1 | % | 62.2 | % | 60.9 | % | ||||||||
| Allowance and liability for losses as a % of combined consumer loans and fees receivable, gross (c)(d) |
25.0 | % | 25.7 | % | 24.6 | % | 22.9 | % | ||||||||
| (a) | The average short-term combined consumer loans and fees receivable is the average of the month-end balances during the period. |
| (b) | Represents loans originated by third-party lenders through the CSO programs, which are not included in our financial statements. |
| (c) | Non-GAAP measure. |
| (d) | Allowance and liability for losses as a % of combined consumer loans and fees receivable, gross, is determined using period-end balances. |
96
Table of Contents
Installment Loans
The following tables include information related only to installment loans and show our loss experience trends for installment loans for 2013 and 2012 (in thousands):
| 2013 | ||||||||||||||||
| First Quarter |
Second Quarter |
Third Quarter |
Fourth Quarter |
|||||||||||||
| Installment loans: |
||||||||||||||||
| Cost of revenue |
$ | 21,884 | $ | 23,127 | $ | 30,631 | $ | 31,145 | ||||||||
| Charge-offs (net of recoveries) |
22,329 | 23,025 | 26,089 | 30,866 | ||||||||||||
| Average consumer loan balance (a) |
120,035 | 122,339 | 146,142 | 168,588 | ||||||||||||
| Ending consumer loan balance |
116,727 | 130,217 | 162,944 | 179,230 | ||||||||||||
| Ending allowance for losses balance |
$ | 26,403 | $ | 26,555 | $ | 32,077 | $ | 32,608 | ||||||||
| Installment loan ratios: |
||||||||||||||||
| Cost of revenue as a % of average consumer loan balance (a) |
18.2 | % | 18.9 | % | 21.0 | % | 18.5 | % | ||||||||
| Charge-offs (net of recoveries) as a % of average consumer loan balance (a) |
18.6 | % | 18.8 | % | 17.9 | % | 18.3 | % | ||||||||
| Gross profit margin |
49.8 | % | 48.0 | % | 44.1 | % | 49.0 | % | ||||||||
| Allowance for losses as a % of consumer loan balance (b) |
22.6 | % | 20.4 | % | 19.7 | % | 18.2 | % | ||||||||
| (a) | The average consumer loan balance for installment loans is the average of the month-end balances during the period. |
| (b) | Allowance for losses as a % of consumer loan balance is determined using period-end balances. |
| 2012 | ||||||||||||||||
| First Quarter |
Second Quarter |
Third Quarter |
Fourth Quarter |
|||||||||||||
| Installment loans: |
||||||||||||||||
| Cost of revenue |
$ | 13,707 | $ | 15,913 | $ | 22,137 | $ | 23,425 | ||||||||
| Charge-offs (net of recoveries) |
11,623 | 11,098 | 15,498 | 22,100 | ||||||||||||
| Average consumer loan balance (a) |
64,327 | 73,860 | 94,078 | 111,479 | ||||||||||||
| Ending consumer loan balance |
67,281 | 80,430 | 105,074 | 121,570 | ||||||||||||
| Ending allowance for losses balance |
$ | 14,844 | $ | 19,322 | $ | 26,577 | $ | 27,845 | ||||||||
| Installment loan ratios: |
||||||||||||||||
| Cost of revenue as a % of average consumer loan balance (a) |
21.3 | % | 21.5 | % | 23.5 | % | 21.0 | % | ||||||||
| Charge-offs (net of recoveries) as a % of average consumer loan balance (a) |
18.1 | % | 15.0 | % | 16.5 | % | 19.8 | % | ||||||||
| Gross profit margin |
37.9 | % | 38.4 | % | 38.6 | % | 44.5 | % | ||||||||
| Allowance for losses as a % of consumer loan balance (b) |
22.1 | % | 24.0 | % | 25.3 | % | 22.9 | % | ||||||||
| (a) | The average consumer loan balance for installment loans is the average of the month-end balances during the period. |
| (b) | Allowance for losses as a % of consumer loan balance is determined using period-end balances. |
97
Table of Contents
Line of Credit Accounts
The following tables include information related only to line of credit accounts and show our loss experience trends for line of credit accounts for 2013 and 2012 (in thousands):
| 2013 | ||||||||||||||||
| First Quarter |
Second Quarter |
Third Quarter |
Fourth Quarter |
|||||||||||||
| Line of credit accounts: |
||||||||||||||||
| Cost of revenue |
$ | 6,510 | $ | 9,964 | $ | 26,152 | $ | 29,682 | ||||||||
| Charge-offs (net of recoveries) |
9,596 | 7,321 | 14,211 | 25,159 | ||||||||||||
| Average consumer loan balance (a) |
39,558 | 45,629 | 79,757 | 110,439 | ||||||||||||
| Ending consumer loan balance |
37,120 | 58,071 | 99,606 | 125,802 | ||||||||||||
| Ending allowance for losses balance |
$ | 9,479 | $ | 12,109 | $ | 24,405 | $ | 29,244 | ||||||||
| Line of credit account ratios: |
||||||||||||||||
| Cost of revenue as a % of average consumer loan balance (a) |
16.5 | % | 21.8 | % | 32.8 | % | 26.9 | % | ||||||||
| Charge-offs (net of recoveries) as a % of average consumer loan balance (a) |
24.3 | % | 16.0 | % | 17.8 | % | 22.8 | % | ||||||||
| Gross profit margin |
72.0 | % | 64.8 | % | 48.2 | % | 56.7 | % | ||||||||
| Allowance for losses as a % of consumer loan balance (b) |
25.5 | % | 20.9 | % | 24.5 | % | 23.2 | % | ||||||||
| (a) | The average consumer loan balance for line of credit accounts is the average of the month-end balances during the period. |
| (b) | Allowance for losses as a % of consumer loan balance is determined using period-end balances. |
| 2012 | ||||||||||||||||
| First Quarter |
Second Quarter |
Third Quarter |
Fourth Quarter |
|||||||||||||
| Line of credit accounts: |
||||||||||||||||
| Cost of revenue |
$ | 3,718 | $ | 6,554 | $ | 11,363 | $ | 14,616 | ||||||||
| Charge-offs (net of recoveries) |
3,625 | 3,460 | 6,736 | 13,588 | ||||||||||||
| Average consumer loan balance (a) |
20,892 | 25,115 | 37,207 | 42,485 | ||||||||||||
| Ending consumer loan balance |
20,112 | 30,595 | 42,362 | 42,700 | ||||||||||||
| Ending allowance for losses balance |
$ | 3,815 | $ | 6,909 | $ | 11,537 | $ | 12,565 | ||||||||
| Line of credit account ratios: |
||||||||||||||||
| Cost of revenue as a % of average consumer loan balance (a) |
17.8 | % | 26.1 | % | 30.5 | % | 34.4 | % | ||||||||
| Charge-offs (net of recoveries) as a % of average consumer loan balance (a) |
17.4 | % | 13.8 | % | 18.1 | % | 32.0 | % | ||||||||
| Gross profit margin |
68.1 | % | 54.1 | % | 52.3 | % | 38.6 | % | ||||||||
| Allowance for losses as a % of consumer loan balance (b) |
19.0 | % | 22.6 | % | 27.2 | % | 29.4 | % | ||||||||
| (a) | The average consumer loan balance for line of credit accounts is the average of the month-end balances during the period. |
| (b) | Allowance for losses as a % of consumer loan balance is determined using period-end balances. |
Total Expenses
Total expenses increased $49.4 million, or 19.1%, to $307.7 million in 2013, compared to $258.3 million in 2012.
Marketing expenses increased $26.5 million, or 24.4%, to $135.3 million in 2013 compared to $108.8 million in 2012, primarily due to continuing efforts to expand our customer base in both domestic and international markets.
98
Table of Contents
Operations and technology expense increased $7.3 million, or 11.4%, to $70.8 million in 2013 compared to $63.5 million in 2012, primarily due to increased personnel, software maintenance and loan underwriting and processing expenses.
General and administrative expense increased $11.7 million, or 16.1%, to $84.4 million in 2013 compared to $72.7 million in 2012, primarily due to the addition of new personnel to support our growth, higher incentive accruals due to strong financial performance and higher legal expenses. These increases were partially offset by a $0.6 million decrease in expenses allocated from Cash America reflecting lower allocated corporate services costs.
Depreciation and amortization expense increased $3.8 million, or 29.2%, in 2013 compared to 2012, primarily due to increased expenditures for capitalized software and equipment to support product innovations and the acceleration of depreciation related to the phase-out of certain loan platforms in 2013.
Interest Expense, Net
Interest expense, net decreased $1.2 million, or 5.8%, to $19.8 million in 2013, compared to $21.0 million in 2012. The decrease was mainly due to a decrease in our weighted-average interest rate to 4.7% in 2013 from 5.0% in 2012 and, to a lesser extent, a decrease in the average amount of debt outstanding to $411.5 million in 2013 from $416.2 million in 2012. See “Unaudited Pro Forma Consolidated Financial Statements.”
Provision for Income Taxes
Provision for income taxes increased $9.6 million, or 28.3%, to $43.6 million in 2013 compared to $34.0 million in 2012. The increase was primarily due to a 31.0% increase in income before income taxes, partially offset by a decrease in the effective tax rate to 35.8% in 2013 from 36.6% in 2012.
Net Income
Net income increased $19.1 million, or 32.6%, to $78.0 million in 2013 compared to $58.9 million in 2012. The increase was primarily due to the growth of our installment loan and line of credit account products in the United States and United Kingdom.
YEAR ENDED 2012 COMPARED TO YEAR ENDED 2011
Revenue and Gross Profit
Revenue increased $180.6 million, or 37.6%, to $660.9 million in 2012 as compared to $480.3 million for the year ended December 31, 2011, or 2011. The increase in revenue is primarily due to growth in consumer loan balances. The percentage of revenue from international operations to total consolidated revenue increased in 2012 compared to 2011 as our business continued to experience growth primarily in the United Kingdom. In 2012, international revenue was 49.5% of total revenue, up from 47.0% in 2011.
Our gross profit increased by $93.8 million to $372.5 million in 2012 from $278.7 million in 2011, primarily due to higher loan balances in 2012 compared to 2011. Also contributing to the increase in gross profit was the expansion of our installment loan and line of credit account products in the United States, which resulted in an increase in new customers. Our consolidated gross profit margin decreased to 56.4% in 2012 from 58.0% in 2011, primarily due to a greater mix of installment loans and line of credit accounts as a percentage of the total consumer loan portfolio. The gross profit margin for our international operations increased to 55.9% in 2012 from 50.7% in 2011, mainly because of the continuing maturation of the portfolio. Despite the improvement in the international gross profit margin, the heavier concentration of international loans in the portfolio and their lower gross profit margin compared to our domestic operations contributed to the slight decline in our consolidated gross profit margin in 2012.
99
Table of Contents
The following table sets forth the components of revenue and gross profit, separated between domestic and international, in 2012 and 2011 (in thousands):
| Year Ended December 31, | ||||||||||||||||||||||||
| 2012 | 2011 | |||||||||||||||||||||||
| Domestic | International | Total | Domestic | International | Total | |||||||||||||||||||
| Short-term loans |
$ | 202,581 | $ | 257,254 | $ | 459,835 | $ | 199,258 | $ | 201,552 | $ | 400,810 | ||||||||||||
| Installment loans |
56,627 | 69,575 | 126,202 | 24,304 | 23,750 | 48,054 | ||||||||||||||||||
| Line of credit accounts |
73,532 | — | 73,532 | 30,590 | — | 30,590 | ||||||||||||||||||
| Other |
1,326 | 33 | 1,359 | 600 | 286 | 886 | ||||||||||||||||||
|
|
|
|
|
|
|
|
|
|
|
|
|
|||||||||||||
| Revenue |
334,066 | 326,862 | 660,928 | 254,752 | 225,588 | 480,340 | ||||||||||||||||||
| Cost of Revenue |
144,455 | 144,019 | 288,474 | 90,535 | 111,152 | 201,687 | ||||||||||||||||||
|
|
|
|
|
|
|
|
|
|
|
|
|
|||||||||||||
| Gross Profit |
$ | 189,611 | $ | 182,843 | $ | 372,454 | $ | 164,217 | $ | 114,436 | $ | 278,653 | ||||||||||||
|
|
|
|
|
|
|
|
|
|
|
|
|
|||||||||||||
| Year-over-year change—$ |
$ | 25,394 | $ | 68,407 | $ | 93,801 | — | — | — | |||||||||||||||
| Year-over-year change—% |
15.5 | % | 59.8 | % | 33.7 | % | — | — | — | |||||||||||||||
| Gross profit margin |
56.8 | % | 55.9 | % | 56.4 | % | 64.5 | % | 50.7 | % | 58.0 | % | ||||||||||||
Consumer Loan Balances
The outstanding combined portfolio balance of consumer loans, net of allowances and liabilities for losses, increased $70.5 million, or 34.7%, to $274.0 million at December 31, 2012 from $203.5 million at December 31, 2011, primarily due to increased demand for all consumer loan products in both domestic and international markets.
The combined consumer loan balance includes $310.7 million and $222.0 million at December 31, 2012 and 2011, respectively, of our owned consumer loan balances, before the allowance for losses of $82.4 million and $59.1 million, respectively, which have both been provided in the consolidated financial statements at December 31, 2012 and 2011, respectively. The combined consumer loan balance also includes $48.2 million and $42.8 million at December 31, 2012 and 2011, respectively, of consumer loan balances, which are guaranteed by us and are not included in our financial statements. The liability for estimated losses related to the consumer loan balances we guarantee of $2.6 million and $2.3 million has been included in “Accounts payable and accrued expenses” in the consolidated financial statements at December 31, 2012 and 2011, respectively. The following table summarizes the consumer loan balances as of December 31, 2012 and 2011 (in thousands):
| As of December 31, | ||||||||||||||||||||||||
| 2012 | 2011 | |||||||||||||||||||||||
| Company Owned (a) |
Guaranteed by the Company (a) |
Combined (b) | Company Owned (a) |
Guaranteed by the Company (a) |
Combined (b) | |||||||||||||||||||
| Ending consumer loan balances: |
||||||||||||||||||||||||
| Domestic |
||||||||||||||||||||||||
| Short-term loans |
$ | 37,734 | $ | 44,261 | $ | 81,995 | $ | 38,455 | $ | 39,341 | $ | 77,796 | ||||||||||||
| Installment loans |
45,713 | — | 45,713 | 24,411 | — | 24,411 | ||||||||||||||||||
| Line of credit accounts |
42,700 | — | 42,700 | 21,648 | — | 21,648 | ||||||||||||||||||
|
|
|
|
|
|
|
|
|
|
|
|
|
|||||||||||||
| Total domestic, gross |
126,147 | 44,261 | 170,408 | 84,514 | 39,341 | 123,855 | ||||||||||||||||||
|
|
|
|
|
|
|
|
|
|
|
|
|
|||||||||||||
| International |
||||||||||||||||||||||||
| Short-term loans |
108,738 | 3,946 | 112,684 | 101,723 | 3,420 | 105,143 | ||||||||||||||||||
| Installment loans |
75,857 | — | 75,857 | 35,802 | — | 35,802 | ||||||||||||||||||
|
|
|
|
|
|
|
|
|
|
|
|
|
|||||||||||||
| Total international, gross |
184,595 | 3,946 | 188,541 | 137,525 | 3,420 | 140,945 | ||||||||||||||||||
|
|
|
|
|
|
|
|
|
|
|
|
|
|||||||||||||
| Total ending loan balance, gross |
310,742 | 48,207 | 358,949 | 222,039 | 42,761 | 264,800 | ||||||||||||||||||
|
|
|
|
|
|
|
|
|
|
|
|
|
|||||||||||||
| Less: Allowance and liability for losses (a) |
(82,352 | ) | (2,624 | ) | (84,976 | ) | (59,054 | ) | (2,284 | ) | (61,338 | ) | ||||||||||||
|
|
|
|
|
|
|
|
|
|
|
|
|
|||||||||||||
| Total ending loan balance, net |
$ | 228,390 | $ | 45,583 | $ | 273,973 | $ | 162,985 | $ | 40,477 | $ | 203,462 | ||||||||||||
|
|
|
|
|
|
|
|
|
|
|
|
|
|||||||||||||
100
Table of Contents
| (a) | GAAP measure. The consumer loan balances guaranteed by us relate to loans originated by third-party lenders through the CSO programs and are not included in our financial statements. |
| (b) | Except for allowance and liability for estimated losses, amounts represent non-GAAP measures. |
Average Consumer Loan Amount
The following table shows the average amount per consumer loan by product for 2012 compared to 2011:
| Year Ended December 31, |
||||||||
| 2012 | 2011 | |||||||
| Average amount per consumer loan (in ones) (a) |
||||||||
| Short-term loans (b) |
$ | 541 | $ | 522 | ||||
| Installment loans |
1,100 | 1,157 | ||||||
| Line of credit accounts (c) |
279 | 282 | ||||||
|
|
|
|
|
|||||
| Total consumer loans (b) |
$ | 542 | $ | 525 | ||||
|
|
|
|
|
|||||
| (a) | The disclosure regarding the average amount per consumer loan is statistical data that is not included in our financial statements. |
| (b) | Includes loans guaranteed by us, which represent loans originated by third-party lenders through the CSO programs and are not included in our financial statements. |
| (c) | Represents the average amount of each incremental draw on line of credit accounts. |
The average amount per consumer loan increased to $542 from $525 during 2012 compared to 2011, due largely to an increase in longer-term installment loans, which typically have a larger average loan amount than short-term loans, and an increase in the average amount of short-term loans.
CONSUMER LOAN LOSS EXPERIENCE
The allowance and liability for estimated losses as a percentage of combined consumer loans and fees receivable increased to 23.7% in 2012 compared to 23.2% in 2011, primarily due to the change in the mix of loans, as discussed in the “Revenue and Gross Profit” section above.
The cost of revenue was $288.5 million in 2012, which was composed of $288.1 million related to our owned consumer loans and $0.4 million related to loans we guaranteed through the CSO programs. The cost of revenue in 2011 was $201.7 million, which was composed of $201.7 million related to our owned consumer loans and an immaterial amount related to loans we guaranteed through the CSO programs. Total charge-offs, net of recoveries, were $266.6 million and $178.0 million in 2012 and 2011, respectively.
The following tables show consumer loan balances and fees receivable and the relationship of the allowance and liability for losses to the combined balances of consumer loans by quarter for the years ended December 31, 2012 and 2011 (in thousands):
| 2012 | ||||||||||||||||
| First Quarter |
Second Quarter |
Third Quarter |
Fourth Quarter |
|||||||||||||
| Consumer loan balances and fees receivable: |
||||||||||||||||
| Gross—Company owned |
$ | 212,363 | $ | 241,083 | $ | 280,832 | $ | 310,742 | ||||||||
| Gross—Guaranteed by the Company (a) |
32,220 | 40,634 | 41,660 | 48,207 | ||||||||||||
|
|
|
|
|
|
|
|
|
|||||||||
| Combined consumer loans and fees receivable, gross (b) |
244,583 | 281,717 | 322,492 | 358,949 | ||||||||||||
| Allowance and liability for losses on consumer loans |
58,026 | 70,016 | 81,110 | 84,976 | ||||||||||||
|
|
|
|
|
|
|
|
|
|||||||||
| Combined consumer loans and fees receivable, net (b) |
$ | 186,557 | $ | 211,701 | $ | 241,382 | $ | 273,973 | ||||||||
|
|
|
|
|
|
|
|
|
|||||||||
| Allowance and liability for losses as a % of combined consumer loans and fees receivable, gross (b) |
23.7 | % | 24.9 | % | 25.2 | % | 23.7 | % | ||||||||
|
|
|
|
|
|
|
|
|
|||||||||
101
Table of Contents
| (a) | Represents loans originated by third-party lenders through the CSO programs, which are not included in our financial statements. |
| (b) | Non-GAAP measure. |
| 2011 | ||||||||||||||||
| First Quarter |
Second Quarter |
Third Quarter |
Fourth Quarter |
|||||||||||||
| Consumer loan balances and fees receivable: |
||||||||||||||||
| Gross—Company owned |
$ | 118,665 | $ | 142,102 | $ | 181,602 | $ | 222,039 | ||||||||
| Gross—Guaranteed by the Company (a) |
28,272 | 34,073 | 36,356 | 42,739 | ||||||||||||
|
|
|
|
|
|
|
|
|
|||||||||
| Combined consumer loans and fees receivable, gross (b) |
146,937 | 176,175 | 217,958 | 264,778 | ||||||||||||
| Allowance and liability for losses on consumer loans |
34,343 | 35,093 | 45,269 | 61,332 | ||||||||||||
|
|
|
|
|
|
|
|
|
|||||||||
| Combined consumer loans and fees receivable, net (b) |
$ | 112,594 | $ | 141,082 | $ | 172,689 | $ | 203,446 | ||||||||
|
|
|
|
|
|
|
|
|
|||||||||
| Allowance and liability for losses as a % of combined consumer loans and fees receivable, gross (b) |
23.4 | % | 19.9 | % | 20.8 | % | 23.2 | % | ||||||||
|
|
|
|
|
|
|
|
|
|||||||||
| (a) | Represents loans originated by third-party lenders through the CSO programs, which are not included in our financial statements. |
| (b) | Non-GAAP measure. |
Consumer Loan Loss Experience by Product
Management evaluates loss rates for all consumer loan products in our portfolio to determine credit quality and evaluate trends. For our products, we evaluate consumer loan losses as a percentage of the average consumer loan balance outstanding or the average combined consumer loan balance outstanding, whichever is applicable, for each portfolio.
102
Table of Contents
Short-term Loans
The following tables include information related only to short-term consumer loans and show our loss experience trends for short-term consumer loans for 2012 and 2011 (in thousands):
| 2012 | ||||||||||||||||
| First Quarter |
Second Quarter |
Third Quarter |
Fourth Quarter |
|||||||||||||
| Short-term consumer loans: |
||||||||||||||||
| Cost of revenue |
$ | 40,786 | $ | 44,692 | $ | 44,428 | $ | 47,146 | ||||||||
| Charge-offs (net of recoveries) |
47,427 | 39,565 | 46,346 | 45,444 | ||||||||||||
| Average short-term combined consumer loans and fees receivable, gross: |
||||||||||||||||
| Company owned (a) |
132,183 | 126,464 | 132,083 | 134,997 | ||||||||||||
| Guaranteed by the Company (a)(b) |
37,392 | 36,991 | 41,800 | 43,670 | ||||||||||||
|
|
|
|
|
|
|
|
|
|||||||||
| Average short-term combined consumer loans and fees receivable, gross (a)(c) |
$ | 169,575 | $ | 163,455 | $ | 173,883 | $ | 178,667 | ||||||||
|
|
|
|
|
|
|
|
|
|||||||||
| Ending short-term combined consumer loans and fees receivable, gross: |
||||||||||||||||
| Company owned |
$ | 124,971 | $ | 130,058 | $ | 133,396 | $ | 146,472 | ||||||||
| Guaranteed by the Company (b) |
32,220 | 40,634 | 41,660 | 48,207 | ||||||||||||
|
|
|
|
|
|
|
|
|
|||||||||
| Ending short-term combined consumer loans and fees receivable, gross (c) |
$ | 157,191 | $ | 170,692 | $ | 175,056 | $ | 194,679 | ||||||||
|
|
|
|
|
|
|
|
|
|||||||||
| Ending allowance and liability for losses |
$ | 39,366 | $ | 43,785 | $ | 42,995 | $ | 44,566 | ||||||||
|
|
|
|
|
|
|
|
|
|||||||||
| Short-term consumer loan ratios: |
||||||||||||||||
| Cost of revenue as a % of average short-term combined consumer loans and fees receivable, gross (a)(c) |
24.1 | % | 27.3 | % | 25.6 | % | 26.4 | % | ||||||||
| Charge-offs (net of recoveries) as a % of average short-term combined consumer loans and fees receivable, gross (a)(c) |
28.0 | % | 24.2 | % | 26.7 | % | 25.4 | % | ||||||||
| Gross profit margin |
62.8 | % | 60.1 | % | 62.2 | % | 60.9 | % | ||||||||
| Allowance and liability for losses as a % of combined consumer loans and fees receivable, gross (c)(d) |
25.0 | % | 25.7 | % | 24.6 | % | 22.9 | % |
| (a) | The average short-term combined consumer loans and fees receivable is the average of the month-end balances during the period. |
| (b) | Represents loans originated by third-party lenders through the CSO programs, which are not included in our financial statements. |
| (c) | Non-GAAP measure. |
| (d) | Allowance and liability for losses as a % of combined consumer loans and fees receivable, gross, is determined using period-end balances. |
103
Table of Contents
| 2011 | ||||||||||||||||
| First Quarter |
Second Quarter |
Third Quarter |
Fourth Quarter |
|||||||||||||
| Short-term consumer loans: |
||||||||||||||||
| Cost of revenue |
$ | 30,328 | $ | 32,824 | $ | 41,732 | $ | 54,698 | ||||||||
| Charge-offs (net of recoveries) |
35,596 | 33,721 | 34,417 | 44,144 | ||||||||||||
| Average short-term combined consumer loans and fees receivable, gross: |
||||||||||||||||
| Company owned (a) |
96,969 | 98,595 | 117,010 | 132,091 | ||||||||||||
| Guaranteed by the Company (a)(b) |
33,356 | 31,223 | 36,614 | 38,887 | ||||||||||||
|
|
|
|
|
|
|
|
|
|||||||||
| Average short-term combined consumer loans and fees receivable, gross (a)(c) |
$ | 130,325 | $ | 129,818 | $ | 153,624 | $ | 170,978 | ||||||||
|
|
|
|
|
|
|
|
|
|||||||||
| Ending short-term combined consumer loans and fees receivable, gross: |
||||||||||||||||
| Company owned |
$ | 91,963 | $ | 103,883 | $ | 123,036 | $ | 140,178 | ||||||||
| Guaranteed by the Company (b) |
28,272 | 34,073 | 36,356 | 42,739 | ||||||||||||
|
|
|
|
|
|
|
|
|
|||||||||
| Ending short-term combined consumer loans and fees receivable, gross (c) |
$ | 120,235 | $ | 137,956 | $ | 159,392 | $ | 182,917 | ||||||||
|
|
|
|
|
|
|
|
|
|||||||||
| Ending allowance and liability for losses |
$ | 29,081 | $ | 28,246 | $ | 34,904 | $ | 45,164 | ||||||||
|
|
|
|
|
|
|
|
|
|||||||||
| Short-term consumer loan ratios: |
||||||||||||||||
| Cost of revenue as a % of average short-term combined consumer loans and fees receivable, gross (a)(c) |
23.3 | % | 25.3 | % | 27.2 | % | 32.0 | % | ||||||||
| Charge-offs (net of recoveries) as a % of average short-term combined consumer loans balance and fees receivable, gross (a)(c) |
27.3 | % | 26.0 | % | 22.4 | % | 25.8 | % | ||||||||
| Gross profit margin |
64.3 | % | 63.6 | % | 61.4 | % | 53.4 | % | ||||||||
| Allowance and liability for losses as a % of combined consumer loans and fees receivable, gross (c)(d) |
24.2 | % | 20.5 | % | 21.9 | % | 24.7 | % | ||||||||
| (a) | The average short-term combined consumer loans and fees receivable is the average of the month-end balances during the period. |
| (b) | Represents loans originated by third-party lenders through the CSO programs, which are not included in our financial statements. |
| (c) | Non-GAAP measure. |
| (d) | Allowance and liability for losses as a % of combined consumer loans and fees receivable, gross, is determined using period-end balances. |
104
Table of Contents
Installment Loans
The following tables include information related only to installment loans and show our loss experience trends for installment loans for 2012 and 2011 (in thousands):
| 2012 | ||||||||||||||||
| First Quarter |
Second Quarter |
Third Quarter |
Fourth Quarter |
|||||||||||||
| Installment loans: |
||||||||||||||||
| Cost of revenue |
$ | 13,707 | $ | 15,913 | $ | 22,137 | $ | 23,425 | ||||||||
| Charge-offs (net of recoveries) |
11,623 | 11,098 | 15,498 | 22,100 | ||||||||||||
| Average consumer loan balance (a) |
64,327 | 73,860 | 94,078 | 111,479 | ||||||||||||
| Ending consumer loan balance |
67,281 | 80,430 | 105,074 | 121,570 | ||||||||||||
| Ending allowance for losses balance |
$ | 14,844 | $ | 19,322 | $ | 26,577 | $ | 27,845 | ||||||||
| Installment loan ratios: |
||||||||||||||||
| Cost of revenue as a % of average consumer loan balance (a) |
21.3 | % | 21.5 | % | 23.5 | % | 21.0 | % | ||||||||
| Charge-offs (net of recoveries) as a % of average consumer loan balance (a) |
18.0 | % | 15.0 | % | 16.5 | % | 19.8 | % | ||||||||
| Gross profit margin |
37.9 | % | 38.4 | % | 38.6 | % | 44.5 | % | ||||||||
| Allowance for losses as a % of consumer loan balance (b) |
22.1 | % | 24.0 | % | 25.3 | % | 22.9 | % | ||||||||
| (a) | The average consumer loan balance for installment loans is the average of the month-end balances during the period. |
| (b) | Allowance for losses as a % of consumer loan balance is determined using period-end balances. |
| 2011 | ||||||||||||||||
| First Quarter |
Second Quarter |
Third Quarter |
Fourth Quarter |
|||||||||||||
| Installment loans: |
||||||||||||||||
| Cost of revenue |
$ | 4,650 | $ | 6,429 | $ | 8,785 | $ | 13,729 | ||||||||
| Charge-offs (net of recoveries) |
3,174 | 5,228 | 6,509 | 8,883 | ||||||||||||
| Average consumer loan balance (a) |
16,834 | 22,201 | 35,102 | 52,239 | ||||||||||||
| Ending consumer loan balance |
18,357 | 26,290 | 42,786 | 60,213 | ||||||||||||
| Ending allowance for losses balance |
$ | 4,386 | $ | 5,568 | $ | 7,721 | $ | 12,451 | ||||||||
| Installment loan ratios: |
||||||||||||||||
| Cost of revenue as a % of average consumer loan balance (a) |
27.6 | % | 29.0 | % | 25.0 | % | 26.3 | % | ||||||||
| Charge-offs (net of recoveries) as a % of average consumer loan balance (a) |
18.9 | % | 23.5 | % | 18.5 | % | 17.0 | % | ||||||||
| Gross profit margin |
33.8 | % | 22.4 | % | 33.5 | % | 29.7 | % | ||||||||
| Allowance for losses as a % of consumer loan balance (b) |
23.9 | % | 21.2 | % | 18.0 | % | 20.7 | % | ||||||||
| (a) | The average consumer loan balance for installment loans is the average of the month-end balances during the period. |
| (b) | Allowance for losses as a % of consumer loan balance is determined using period-end balances. |
105
Table of Contents
Line of Credit Accounts
The following tables include information related only to line of credit accounts and show our loss experience trends for line of credit accounts for 2012 and 2011 (in thousands):
| 2012 | ||||||||||||||||
| First Quarter |
Second Quarter |
Third Quarter |
Fourth Quarter |
|||||||||||||
| Line of credit accounts: |
||||||||||||||||
| Cost of revenue |
$ | 3,718 | $ | 6,554 | $ | 11,363 | $ | 14,616 | ||||||||
| Charge-offs (net of recoveries) |
3,625 | 3,460 | 6,736 | 13,580 | ||||||||||||
| Average consumer loan balance (a) |
20,892 | 25,115 | 37,207 | 42,485 | ||||||||||||
| Ending consumer loan balance |
20,112 | 30,595 | 42,362 | 42,700 | ||||||||||||
| Ending allowance for losses balance |
$ | 3,815 | $ | 6,909 | $ | 11,537 | $ | 12,565 | ||||||||
| Line of credit account ratios: |
||||||||||||||||
| Cost of revenue as a % of average consumer loan balance (a) |
17.8 | % | 26.1 | % | 30.5 | % | 34.4 | % | ||||||||
| Charge-offs (net of recoveries) as a % of average consumer loan balance (a) |
17.4 | % | 13.6 | % | 18.1 | % | 32.0 | % | ||||||||
| Gross profit margin |
68.1 | % | 54.1 | % | 52.3 | % | 38.6 | % | ||||||||
| Allowance for losses as a % of consumer loan balance (b) |
19.0 | % | 22.6 | % | 27.2 | % | 29.4 | % | ||||||||
| (a) | The average consumer loan balance for line of credit accounts is the average of the month-end balances during the period. |
| (b) | Allowance for losses as a % of consumer loan balance is determined using period-end balances. |
| 2011 | ||||||||||||||||
| First Quarter |
Second Quarter |
Third Quarter |
Fourth Quarter |
|||||||||||||
| Line of credit accounts: |
||||||||||||||||
| Cost of revenue |
$ | 1,339 | $ | 1,118 | $ | 2,546 | $ | 3,509 | ||||||||
| Charge-offs (net of recoveries) |
1,976 | 716 | 1,181 | 2,431 | ||||||||||||
| Average consumer loan balance (a) |
10,170 | 9,987 | 13,903 | 18,097 | ||||||||||||
| Ending consumer loan balance |
8,345 | 11,929 | 15,780 | 21,648 | ||||||||||||
| Ending allowance for losses balance |
$ | 876 | $ | 1,279 | $ | 2,644 | $ | 3,723 | ||||||||
| Line of credit account ratios: |
||||||||||||||||
| Cost of revenue as a % of average consumer loan balance (a) |
13.2 | % | 11.2 | % | 18.3 | % | 19.4 | % | ||||||||
| Charge-offs (net of recoveries) as a % of average consumer loan balance (a) |
19.4 | % | 7.2 | % | 8.5 | % | 13.5 | % | ||||||||
| Gross profit margin |
75.0 | % | 82.9 | % | 71.4 | % | 64.2 | % | ||||||||
| Allowance for losses as a % of consumer loan balance (b) |
10.5 | % | 10.7 | % | 16.8 | % | 17.2 | % | ||||||||
| (a) | The average consumer loan balance for line of credit accounts is the average of the month-end balances during the period. |
| (b) | Allowance for losses as a % of consumer loan balance is determined using period-end balances. |
Total Expenses
Total expenses increased $55.9 million, or 27.6%, to $258.3 million in 2012, compared to $202.4 million in 2011.
Marketing expenses increased $35.5 million, or 48.4%, to $108.8 million in 2012 compared to $73.3 million in 2011, primarily due to increased efforts to expand our customer base domestically and internationally. Referral fee expenses also increased $1.7 million, primarily due to increased loan volume from our existing referral programs.
106
Table of Contents
Operations and technology expense increased $11.1 million, or 21.3%, to $63.5 million in 2012 compared to $52.4 million in 2011, primarily due to increases in call center personnel and underwriting expenses to support growth and new business initiatives during the year.
General and administrative expense increased $7.3 million, or 11.1%, to $72.7 million in 2012 compared to $65.4 million in 2011, primarily due to increases in personnel expenses related to personnel additions and merit increases and $3.9 million in costs related to the Withdrawn IPO. These increases were partially offset by a $7.3 million decrease in expenses allocated from Cash America due primarily to the assumption of certain corporate services functions from Cash America.
Depreciation and amortization expense increased $2.0 million, or 17.8%, in 2012 compared to 2011, mainly due to additional depreciation on capital additions for systems development in support of new products, as well as normal system upgrades.
Interest Expense, Net
Interest expense, net increased $3.6 million, or 20.5%, to $21.0 million in 2012, compared to $17.4 million in 2011. The increase was primarily due to an increase in the average amount of debt outstanding, which increased $105.9 million to $416.2 million during 2012 from $310.3 million during 2011, partially offset by a decrease in our weighted-average interest rate to 5.0% in 2012 from 5.8% in 2011. A $75.0 million declared dividend in September of 2011 contributed to the increase in average borrowings outstanding. See “Certain Relationships and Related-Party Transactions.”
Provision for Income Taxes
Provision for income taxes increased $12.6 million, or 59.1%, to $34.0 million in 2012 compared to $21.4 million in 2011. The increase was primarily due to a 59.0% increase in income before income taxes. The effective tax rate was flat at 36.6%.
Net Income
Net income increased $21.9 million, or 59.0%, to $58.9 million in 2012 compared to $37.0 million in 2011. The increase was primarily due to higher revenue as a result of increased year-over-year consumer loan balances.
LIQUIDITY AND CAPITAL RESOURCES
Capital Funding Strategy
Historically, we have generated significant cash flow through normal operating activities for funding both long-term and short-term needs. Our near-term liquidity is managed to ensure that adequate resources are available to fund our seasonal working capital growth, which is driven by demand for our loan products. In addition to operating cash flows, liquidity was historically provided by affiliate advances from Cash America that were evidenced through borrowings under an intercompany credit agreement with Cash America. Our credit agreement with Cash America, which has been terminated, permitted us to borrow, repay and re-borrow funds from Cash America on a revolving credit basis in a maximum amount equal to $450 million. On May 30, 2014 we issued and sold the Notes, as further discussed below under “Senior Notes.” On May 14, 2014, we entered into our credit agreement as further described below under “Credit Agreement.” As of September 30, 2014, our available borrowings under the Credit Agreement were $72.0 million. We expect that our operating needs will be satisfied by a combination of cash flows from operations and borrowings under our Credit Agreement.
As of September 30, 2014, we were in compliance with all financial ratios, covenants and other requirements set forth in our debt agreements. Unexpected changes in our financial condition or other unforeseen factors may result in our inability to obtain third-party financing or could increase our borrowing costs in the future. To the
107
Table of Contents
extent we experience short-term or long-term funding disruptions, we have the ability to adjust our volume of lending to consumers that would reduce cash outflow requirements while increasing cash inflows through repayments of consumer loans. Additional alternatives may include the securitization or sale of assets and reductions in capital spending which could be expected to generate additional liquidity.
Senior Notes
On May 30, 2014, we issued and sold the Notes. The Notes were sold to qualified institutional buyers in accordance with Rule 144A under the Securities Act of 1933, as amended, or the Securities Act, and outside the United States pursuant to Regulation S under the Securities Act.
We used all of the net proceeds, or $479.0 million, of the Notes offering to repay all of our intercompany indebtedness due to Cash America, which was $361.4 million as of May 30, 2014, and the remaining net proceeds were used to pay a significant portion of $122.4 million in cash dividends we paid to Cash America, of which $120.7 million was paid on May 30, 2014 and $1.7 million was paid on June 30, 2014.
The Notes are governed by an Indenture, or the Indenture, dated May 30, 2014, between us, our domestic subsidiaries, as Guarantors, and the trustee. The Notes bear interest at a rate of 9.75% per year on the principal amount of the Notes, payable semi-annually in arrears on June 1 and December 1 of each year, beginning on December 1, 2014. The Notes will mature on June 1, 2021. The Notes are senior unsecured debt obligations of Enova and are unconditionally guaranteed by our domestic subsidiaries. Neither Cash America nor any of its other subsidiaries that are not also our subsidiaries guarantee the Notes.
The Indenture contains certain covenants that, among other things, limit our and certain of our subsidiaries’ ability to incur additional debt, acquire or create new subsidiaries, create liens, engage in certain transactions with affiliates and consolidate or merge with or into other companies. The Indenture generally restricts the issuance of dividends other than those made pursuant to a $35 million restricted payment basket and except to the extent the pro forma fixed charge coverage ratio (as defined in the Indenture) would be at least 2.0 to 1.0. In addition, we will be entitled to pay dividends in an amount generally equal to 50% of our consolidated net income (as defined in the Indenture) from April 1, 2014 plus any contribution to equity or proceeds from sales of equity; provided that such amount will be reduced to the extent of certain other restricted payments.
The Notes are redeemable at our option, in whole or in part, (i) at any time prior to June 1, 2017 at 100% of the aggregate principal amount of Notes redeemed plus the applicable “make whole” redemption price specified in the Indenture, plus accrued and unpaid interest, if any, to the redemption date and (ii) at any time on or after June 1, 2017 at a premium specified in the Indenture that will decrease over time as described in the Indenture, plus accrued and unpaid interest, if any, to the redemption date. In addition, prior to June 1, 2017, we may redeem from time to time up to 35% of the aggregate principal amount of the Notes at a redemption price equal to 109.75% of the principal amount thereof, plus accrued and unpaid interest, if any, to the redemption date with the proceeds from certain equity offerings as described in the Indenture. If a change of control occurs, as that term is defined in the Indenture, the holders of the Notes will have the right, subject to certain conditions, to require Enova to repurchase their Notes at a purchase price equal to 101% of the aggregate principal amount of Notes repurchased plus accrued and unpaid interest, if any, as of the date of repurchase. The Spin-off did not constitute a change of control under the Indenture.
In addition, on May 30, 2014, we entered into a registration rights agreement with the initial purchaser of the Notes, or the Registration Rights Agreement, pursuant to which we agreed to use commercially reasonable efforts to cause a registration statement to be declared effective on or prior to the 360th day following the closing date relating to an exchange offer of the Notes for identical new notes registered under the Securities Act. In certain circumstances, we may be required to file a shelf registration statement to cover resales of the Notes. If we do not comply with certain covenants set forth in the Registration Rights Agreement, we must pay liquidated
108
Table of Contents
damages to holders of the Notes. If we fail to satisfy any of our registration obligations, we may be required to pay the holders of the Notes additional interest ranging from 0.25% to 0.50% per annum until we satisfy our registration obligations.
The Indenture provides for customary events of default, including nonpayment and failure to comply with covenants or other agreements in the Indenture.
Credit Agreement
On May 14, 2014, we and certain of our domestic subsidiaries, as guarantors, entered into a credit agreement with Jefferies Finance LLC, as administrative agent, and Jefferies Group LLC, as lender, or the Credit Agreement. The Credit Agreement provides for our unsecured revolving line of credit in an aggregate principal amount of up to $75.0 million. The Credit Agreement contains customary representations and warranties and covenants (including financial maintenance covenants) and permits dividends only if certain conditions are met, including that the aggregate amount of certain restricted payments under the Credit Agreement (including dividends on our common stock) may not exceed $35 million plus 50% of our cumulative net income (as defined in the Credit Agreement) after June 30, 2014. Loans under the revolving line of credit may be made in dollars or in designated foreign currencies.
Our revolving line of credit may be used for our and our subsidiaries’ general corporate purposes, including possible acquisitions. Interest on the loans borrowed under the Credit Agreement will be charged, at our option, at either LIBOR for one week or one-, two-, three- or six-month periods, as selected by us, plus a margin varying from 2.50% to 3.75% or at the agent’s base rate plus a margin varying from 1.50% to 2.75%. The margin for the Credit Agreement borrowings is dependent on our cash flow leverage ratios. We will also be required to pay a fee on the unused portion of the line of credit ranging from 0.25% to 0.50% (0.50% as of September 30, 2014) based on our cash flow leverage ratios. Our Credit Agreement will mature on June 30, 2017. The revolving line of credit under the Credit Agreement was undrawn as of September 30, 2014.
The Credit Agreement also includes a sub-limit of up to $20.0 million for standby or commercial letters of credit. In the event that an amount is paid by the issuing bank under a letter of credit, it will be due and payable by us on demand. Pursuant to the terms of the Credit Agreement, we agree to pay fees equal to the LIBOR margin per annum on the undrawn amount of each outstanding standby letter of credit plus a one-time commercial letter of credit fee of 0.20% of the face amount of each commercial letter of credit plus 0.25% per annum on the average daily amount of the total letter of credit exposure. We had standby letters of credit of $3.0 million under our Credit Agreement as of September 30, 2014.
Financial Conduct Authority
See “—Recent Regulatory Developments—Financial Conduct Authority” for a discussion of changes we have made and will continue to make to our U.K business practices in response to the requirements of the FCA and the cap on the total cost of credit in the United Kingdom. We are still assessing the impact of the changes we have made and are making in response to the requirements of the FCA, but our U.K. operations have experienced a decline in working capital necessary to operate our U.K. consumer loan business as consumer loans outstanding, revenue and cost of revenue declined during 2014 and as we adjusted our business practices. In addition, we are still assessing the full impact of the cost of credit cap changes and what additional changes to our products will be necessary based on the final rule issued on November 11, 2014, which will become effective on January 2, 2015. It is possible that the rule change could have a significant effect on the results of our U.K. operations.
109
Table of Contents
Cash Flows
Our cash flows and other key indicators of liquidity are summarized as follows (dollars in thousands):
| Nine Months Ended September 30, | Year Ended December 31, | |||||||||||||||||||
| 2014 | 2013 | 2013 | 2012 | 2011 | ||||||||||||||||
| Cash flows provided by operating activities (a) |
$ | 357,800 | $ | 315,870 | $ | 438,298 | $ | 375,508 | $ | 255,933 | ||||||||||
| Cash flows used in investing activities |
||||||||||||||||||||
| Consumer loans |
(209,071 | ) | (271,128 | ) | (388,867 | ) | (346,467 | ) | (266,427 | ) | ||||||||||
| Property and equipment additions |
(9,858 | ) | (11,544 | ) | (14,872 | ) | (17,872 | ) | (15,073 | ) | ||||||||||
| Investment in non-marketable securities |
— | — | — | (1,000 | ) | — | ||||||||||||||
| Other investing activities |
8 | — | — | (178 | ) | — | ||||||||||||||
|
|
|
|
|
|
|
|
|
|
|
|||||||||||
| Total cash flows used in investing activities (a) |
(218,921 | ) | $ | (282,672 | ) | (403,739 | ) | (365,517 | ) | (281,500 | ) | |||||||||
| Cash flows provided by (used in) financing activities |
(78,674 | ) | (10,534 | ) | (28,567 | ) | (9,008 | ) | 43,130 | |||||||||||
| Working capital (a) |
362,503 | 331,012 | 340,933 | 261,068 | 186,790 | |||||||||||||||
| Current ratio |
5.3x | 8.6x | 7.9x | 6.5x | 5.3x | |||||||||||||||
| Total debt to Adjusted EBITDA (b) |
2.6x | 3.3x | 4.7x | |||||||||||||||||
| (a) | Net cash provided by operating activities and net cash used in investing activities for 2011 and working capital as of December 31, 2011 were revised to correct the classification of cash and accounts payable and to correct for consumer loans that had not funded as of the balance sheet date. Management determined that the impact on previously issued financial statements was immaterial; however, management determined it was appropriate to correct the presentation herein. The correction resulted in a $2.0 million decrease in net cash provided by operating activities, a $0.2 million decrease in net cash used in investing activities for 2011 and a $0.5 million increase to working capital as of December 31, 2011. |
| (b) | Total debt to Adjusted EBITDA, a non-GAAP measure, is calculated using Adjusted EBITDA for the twelve months ended for the respective period indicated. |
Cash Flows from Operating Activities
Net cash provided by operating activities increased $41.9 million, or 13.3%, to $357.8 million for the current nine-month period from $315.9 million for the prior year nine-month period. The increase was primarily driven by a $30.8 million increase in net income during the current nine-month period, partially offset by a $22.4 million decrease in cost of revenue, a non-cash expense, primarily because our consumer loan portfolios had a higher percentage of customers with established payment histories during the current nine-month period as compared to the prior year nine-month period and also due to stricter underwriting standards in our U.K. business.
Other significant changes in net cash provided by operating activities for the current nine-month period compared to the prior year nine-month period included cash flows from the following activities:
| • | changes in accounts payable and accrued expenses resulted in a $23.4 million increase in net cash provided by operating activities, primarily due to accrued interest expense on the Notes in the current nine-month period and higher incentive accruals for the current nine-month period compared to the prior year nine-month period resulting from our strong financial performance; and |
| • | the addition of related party payables, net resulted in a $13.4 million increase in net cash provided by operating activities, primarily due to income taxes paid by Cash America on our behalf. |
Net cash provided by operating activities increased $62.8 million, or 16.7%, to $438.3 million for 2013 from $375.5 million for 2012. The increase was primarily driven by a $19.2 million increase in net income during
110
Table of Contents
2013 and a $26.6 million increase in the cost of revenue, a non-cash expense, primarily as a result of increased lending activity. Increases in outstanding customer loan balances immediately require an increase in the balance sheet reserve for potential loan losses and generate the cost of revenue, a non-cash expense, during the period. The related cash expense for uncollectible loans is captured as the difference in consumer loans originated or acquired and consumer loans repaid for those loans that are uncollectible. These amounts are reflected in the cash flows from investing activities.
Other significant changes in net cash provided by operating activities for 2013 compared to 2012 included cash flows from the following activities:
| • | changes in deferred income taxes, net, resulted in a $7.7 million increase in net cash provided by operating activities, primarily due to increases in deferred tax liabilities related to amortizable intangible assets; |
| • | depreciation and amortization expense increased $3.9 million in 2013 compared to 2012, primarily due to increased expenditures for capitalized software and equipment to support product innovations and the acceleration of depreciation related to the phase-out of certain loan platforms in 2013; and |
| • | changes in accounts payable and accrued expenses resulted in a $3.1 million increase in net cash provided by operating activities, primarily due to the timing of payments of marketing and lead purchase costs. |
Net cash provided by operating activities for 2012 increased $119.6 million, or 46.7%, to $375.5 million from $255.9 million for 2011. The increase was primarily driven by a $21.8 million increase in net income during 2012 and an $86.8 million increase in the cost of revenue, a non-cash expense, primarily as a result of increased lending activity.
Other significant changes in net cash provided by operating activities for 2012 compared to 2011 included cash flows from the following activities:
| • | changes in current intercompany income taxes resulted in an $11.0 million decrease in net cash provided by operating activities in 2011 when we began paying Cash America for the full balance of intercompany income taxes payable; and |
| • | changes in accounts payable and accrued expenses resulted in a $5.0 million decrease in net cash provided by operating activities, primarily due to timing of payments of marketing, legal and lead purchase costs. |
Management believes cash flows from operations and available cash balances and borrowings will be sufficient to fund our future operating liquidity needs, including in the case of our separation from Cash America.
Cash Flows from Investing Activities
Net cash used in investing activities decreased $63.8 million, or 22.6%, for the current nine-month period compared to the prior year nine-month period, primarily due to a $62.1 million decrease in net cash invested in consumer loans due to a higher rate of increase in consumer loans repaid compared to consumer loans originated or acquired. The implementation of stricter affordability assessments and underwriting standards in the United Kingdom also contributed to this decrease in net cash used in investing activities.
Net cash used in investing activities increased $38.2 million, or 10.5%, for 2013 compared to 2012, primarily due to a $42.4 million increase in consumer loans originated or acquired, net of consumer loans repaid, primarily resulting from growth in our installment loan and line of credit account products.
Net cash used in investing activities increased $84.0 million, or 29.8%, for 2012 compared to 2011, primarily due to an $80.0 million increase in consumer loans originated or acquired, net of consumer loans repaid. This increase was primarily due to the increase in demand for all consumer loan products in domestic and international markets.
111
Table of Contents
Expenditures for property and equipment decreased $1.7 million to $9.8 million in the current nine-month period compared to $11.5 million in the prior year nine-month period, primarily related to decreases in computer hardware expenditures. Expenditures for property and equipment used $14.9 million of cash in 2013 compared to $17.9 million in 2012. The $3.0 million year-over-year decrease primarily related to reduced spending on leasehold improvements. Expenditures for property and equipment used $17.9 million in 2012 compared to $15.1 million in 2011. The $2.8 million year-over-year increase primarily related to increases in technology development costs to support our growth, the purchase of computer hardware and for leasehold improvements. Management anticipates that total expenditures for property and equipment for the twelve months ended December 31, 2014 will be between $14 million and $15 million, primarily for continued development activities related to our technology platform and the purchase of computer hardware.
Cash flows from investing activities in 2011 exclude a $5.0 million purchase from Cash America of preferred stock representing a minority interest in an early-stage privately-held developing consumer financial services entity, which is included in “Other assets” in the consolidated balance sheets, because this is a non-cash item. See Note 15 in the Notes to Consolidated Financial Statements.
Cash Flows from Financing Activities
Net cash used in financing activities increased $68.2 million to $78.7 million in the current nine-month period from $10.5 million in the prior year nine-month period.
During the current nine-month period, we issued the Notes and entered into the Credit Agreement. We used all of the net proceeds of the Notes offering, or $479.0 million, to repay all of our intercompany indebtedness due to Cash America, which was $361.4 million as of May 30, 2014, and the remaining net proceeds were used to pay a significant portion of $122.4 million in cash dividends we paid to Cash America, of which $120.7 million was paid on May 30, 2014 and $1.7 million was paid on June 30, 2014. Also, we incurred $16.3 million of debt issuance costs in the current nine-month period resulting from the issuance of the Notes and the Credit Agreement. See “—Senior Notes” and “—Credit Facility” above for additional information about the Notes and Credit Agreement, respectively. In addition, cash flows used in financing activities for the current nine-month period reflects $70.3 million of net payments to Cash America (excluding the $361.4 million repayment on May 30, 2014) compared to $5.2 million of net payments in the prior year nine-month period.
Net cash used in financing activities increased $19.6 million to $28.6 million in 2013 from $9.0 million in 2012. The increase was due to an increase in payments to Cash America on the affiliate line of credit primarily driven by the increase in net cash provided by operating activities.
Net cash used in financing activities was $9.0 million in 2012 compared to net cash provided by financing activities of $43.1 million in 2011. The difference of $52.1 million for these respective years was primarily due to reduced borrowings from Cash America as our cash flow from operations increased over these periods. Cash provided by financing activities in 2011 excludes a $75.0 million dividend paid on September 6, 2011 to Cash America in the form of a promissory note. See Note 15 in the Notes to Consolidated Financial Statements.
CONTRACTUAL OBLIGATIONS AND COMMITMENTS
On July 25, 2014, we entered into a new office lease agreement for approximately 160,000 square feet of office space for our headquarters in Chicago, Illinois. The lease term is 12 years, with options to renew for two five-year terms. Under the terms of the lease, we were provided $9.8 million in tenant improvement allowances and $8.5 million in rent abatements. For the new office lease agreement, we are responsible for paying our proportionate share of the increase in actual operating expenses and real estate taxes over the defined lease year.
112
Table of Contents
The following table summarizes our contractual obligations at September 30, 2014 and the effect such obligations are expected to have on our liquidity and cash flows in future periods (in thousands):
| 2014 | 2015 | 2016 | 2017 | 2018 | Thereafter | Total | ||||||||||||||||||||||
| Long-term debt (a) |
$ | — | $ | — | $ | — | $ | — | $ | — | $ | 500,000 | $ | 500,000 | ||||||||||||||
| Interest on long-term debt (b) |
24,375 | 48,750 | 48,750 | 48,750 | 48,750 | 121,875 | 341,250 | |||||||||||||||||||||
| Non-cancelable leases (c) |
825 | 3,351 | 3,324 | 5,864 | 5,023 | 47,883 | 66,270 | |||||||||||||||||||||
|
|
|
|
|
|
|
|
|
|
|
|
|
|
|
|||||||||||||||
| Total |
$ | 25,200 | $ | 52,101 | $ | 52,074 | $ | 54,614 | $ | 53,773 | $ | 669,758 | $ | 907,520 | ||||||||||||||
|
|
|
|
|
|
|
|
|
|
|
|
|
|
|
|||||||||||||||
| (a) | Represents obligations under the Notes. See “Liquidity and Capital Resources—Senior Notes.” |
| (b) | Represents cash payments for interest on the Notes. See “Liquidity and Capital Resources—Senior Notes.” |
| (c) | Represents obligations due under long-term operating leases. See Note 6 in the Notes to Consolidated Financial Statements for further discussion of our operating lease obligations. |
OFF-BALANCE SHEET ARRANGEMENTS
In certain markets, we arrange for consumers to obtain consumer loan products from independent third-party lenders through our CSO programs. For consumer loan products originated by third-party lenders under the CSO programs, each lender is responsible for providing the criteria by which the customer’s application is underwritten and, if approved, determining the amount of the consumer loan. We are responsible for assessing whether or not we will guarantee such loan. When a customer executes an agreement with us under our CSO programs, we agree, for a fee payable to us by the customer, to provide certain services to the customer, one of which is to guarantee the customer’s obligation to repay the loan received by the customer from the third-party lender if the customer fails to do so. The guarantee represents an obligation to purchase specific loans if they go into default, which generally occurs after one payment is missed. As of September 30, 2014 and 2013 and December 31, 2013, the outstanding amount of active consumer loans originated by third-party lenders under the CSO programs was $35.4 million, $35.1 million and $41.4 million, respectively, which were guaranteed by us.
As of September 30, 2014, we and our domestic subsidiaries participated jointly and severally with certain subsidiaries of Cash America and guaranteed Cash America’s $196.5 million in aggregate principal amount of 5.75% Senior Notes due May 15, 2018 that were issued on May 15, 2013 and Cash America’s domestic and multi-currency line of credit due 2018. Under the provisions of Cash America’s debt agreements, we had liability in the event Cash America defaulted in its payment obligations or failed to comply with the covenants under the debt agreements or upon the occurrence of specified events contained in the debt agreements, including the event of bankruptcy, insolvency or reorganization of Cash America. These guarantees of Cash America’s debt agreements were released in connection with the consummation of the Spin-off, which occurred on November 13, 2014.
113
Table of Contents
QUANTITATIVE AND QUALITATIVE DISCLOSURES ABOUT MARKET RISK
Market risks relating to our operations result primarily from changes in foreign currency exchange rates. Currently, we periodically use forward currency exchange contracts to minimize risk of foreign currency exchange rate fluctuations in the United Kingdom and Australia. Our forward currency exchange contracts are non-designated derivatives. Any gain or loss resulting from these contracts is recorded as income or loss and is included in “Foreign currency transaction gain (loss)” in our consolidated statements of income. The following table sets forth, by each foreign currency hedged, the notional amounts of forward currency exchange contracts as of December 31, 2013, the total gains or losses recorded in 2013, and sensitivity analysis of hypothetical 10% declines in the exchange rates of the currencies (U.S. dollars in thousands).
| Notional amount of outstanding contracts as of December 31, 2013 |
Gain/(loss) recorded in 2013 (a) |
Sensitivity Analysis (b) |
||||||||||
| British Pound |
$ | 76,760 | $ | (2,212 | ) | $ | (4,988 | ) | ||||
| Australian dollar |
4,786 | 399 | (312 | ) | ||||||||
|
|
|
|
|
|
|
|||||||
| Total |
$ | 81,546 | $ | (1,813 | ) | $ | (5,300 | ) | ||||
|
|
|
|
|
|
|
|||||||
| (a) | The gains (losses) on these derivatives substantially offset the (losses) gains on the hedged portion of international intercompany balances. |
| (b) | Represents the decrease to net income attributable to us due to a hypothetical 10% weakening of the foreign currency against the U.S. dollar. |
114
Table of Contents
Overview
We are a leading provider of online financial services. In 2013, we extended approximately $2.6 billion in credit to borrowers. We currently offer or arrange loans to customers in 34 states in the United States and in the United Kingdom, Australia and Canada. In June 2014 and July 2014 we launched pilot programs in Brazil and China, respectively, where we have begun arranging loans for borrowers through a third party lender in each country. In addition, in late July 2014, we also introduced a pilot program for a new line of credit product in the United States to serve the needs of small businesses. We use our proprietary technology, analytics and customer service capabilities to quickly evaluate, underwrite and fund loans, allowing us to offer consumers credit when and how they want it. Our customers include the large and growing number of consumers who have bank accounts but use alternative financial services because of their limited access to more traditional consumer credit from banks, credit card companies and other lenders. We were an early entrant into online lending, launching our online business in 2004, and through September 30, 2014, we have completed over 30 million customer transactions and collected approximately nine terabytes of currently accessible consumer behavior data since launch, allowing us to better analyze and underwrite our specific customer base. We have significantly diversified our business over the past several years and currently offer or arrange multiple loan products in the United States, the United Kingdom, Australia, Canada, Brazil and China. These loan products include short-term loans, installment loans and line of credit accounts.
We believe our customers highly value our services as an important component of their personal finances because our products are convenient, quick and often less expensive than other available alternatives. We attribute the success of our business to our advanced and innovative technology systems, the proprietary analytical models we use to predict loan performance, our sophisticated customer acquisition programs, our dedication to customer service and our talented employees.
We have developed a proprietary underwriting system based on data we have collected over our ten years of online lending experience. This system employs advanced risk analytics to decide whether to approve loan transactions, to structure the amount and terms of the loans we offer pursuant to jurisdiction-specific regulations and to provide customers with their funds quickly and efficiently. Our systems closely monitor loan collection and portfolio performance data that we use to continually refine the analytical models and statistical measures used in making our credit, marketing and collection decisions.
Our flexible and scalable technology platform allows us to process and complete customers’ transactions quickly and efficiently. In 2013, we processed approximately 4.9 million transactions, and we continue to grow our loan portfolio and increase the number of customers we serve through both desktop and mobile platforms. Our highly customizable technology platform allows us to efficiently develop and deploy new products to adapt to evolving regulatory requirements and consumer preference, and to enter new markets quickly. In 2012 we launched a new product in the United States designed to serve near-prime customers, and recently we introduced a similar product in the United Kingdom. In June 2014 and July 2014 we launched pilot programs in Brazil and China, respectively, where we have begun arranging loans for borrowers through a third party lender in each country. In addition, in late July 2014, we also introduced a pilot program for a new line of credit product in the United States to serve the needs of small businesses. These products are intended to allow us to further diversify our product offerings, customer base and geographic scope. In 2013, we derived 51.7% of our total revenue from the United States and 48.3% of our total revenue internationally, with 97.4% of international revenue (representing 47.1% of our total revenue) generated in the United Kingdom. See “Management’s Discussion and Analysis of Financial Condition and Results of Operations—Recent Regulatory Developments—Financial Conduct Authority” included elsewhere in this prospectus for a discussion about our expectations for our U.K. business going forward.
We have been able to consistently acquire new customers and successfully generate repeat business from customers when they need a loan. We believe our customers are loyal to us because they are satisfied with our products and services. We acquire new customers from a variety of sources, including visits to our own websites,
115
Table of Contents
mobile sites or applications, and through direct marketing, affiliate marketing, lead providers and relationships with other lenders. We believe that the online convenience of our products and our availability 24/7 to accept loan applications with quick results are important to our customers.
Once a potential new customer submits an application, we provide a quick credit decision. If a loan is approved we typically fund the loan the next business day or, in some cases, the same day. During the entire process, from application through payment, we provide access to our in-house and well-trained customer service team. All of our operations, from customer acquisition through collections, are structured to build customer satisfaction and loyalty, in the event that a customer has a need for our products in the future. We have developed a series of sophisticated proprietary scoring models to support our various loan products. We believe that these models are an integral component of our operations and they allow us to complete a high volume of customer transactions while actively managing risk and the related credit quality of our loan portfolios. We believe our successful application of these technology innovations differentiates our capabilities relative to competitive platforms as evidenced by our history of strong growth and stable credit quality.
Products and Services
Our online loans provide customers with a deposit of funds to their bank account or debit card in exchange for a commitment to repay the amount deposited plus fees and/or interest. We originate, arrange, guarantee or purchase short-term consumer loans, installment loans and line of credit accounts. We have only one reportable segment that includes all of our online financial services.
Short-term consumer loans. Short-term loans are unsecured loans written by us or by a third-party lender through our CSO programs that we arrange and guarantee. We offer or arrange short-term consumer loans in 24 states in the United States, the United Kingdom and Canada. Short-term loans generally have terms of seven to 90 days, with proceeds promptly deposited in the customer’s bank account or on a debit card in exchange for a pre-authorized debit from their account. Our short-term consumer loans contributed approximately 32.6% of our total revenue for the nine months ended September 30, 2014, 50.9% in 2013, 69.6% in 2012 and 83.4% in 2011.
Due to the credit risk and high transaction costs of serving our customer segment, the fees we charge are generally considered to be higher than the fees charged to consumers with superior credit histories by banks and similar lenders who are typically unwilling to make unsecured loans to alternative credit consumers.
Through our CSO programs, we provide services related to third-party lenders’ short-term consumer loan products by acting as a credit services organization or credit access business on behalf of consumers in accordance with applicable state laws. Services offered under our CSO programs include credit-related services such as arranging loans with independent third-party lenders and assisting in the preparation of loan applications and loan documents, or CSO loans. Under our CSO programs, we guarantee consumer loan payment obligations to the third party lender in the event the customer defaults on the loan. When a consumer executes an agreement with us under our CSO programs, we agree, for a fee payable to us by the consumer, to provide certain services to the consumer, one of which is to guarantee the consumer’s obligation to repay the loan received by the consumer from the third-party lender if the consumer fails to do so. For CSO loans, each lender is responsible for providing the criteria by which the consumer’s application is underwritten and, if approved, determining the amount of the consumer loan. We in turn are responsible for assessing whether or not we will guarantee such loan. The guarantee represents an obligation to purchase specific loans, which generally have terms of less than 90 days, if they go into default. As of September 30, 2014 and December 31, 2013 and 2012, the outstanding amount of active consumer loans originated by third-party lenders under the CSO programs was $35.4 million, $41.4 million and $48.2 million, respectively, which were guaranteed by us.
Installment loans. Installment loans are longer-term multi-payment unsecured loans that generally require the pay-down of portions of the outstanding principal balance in multiple installments. We offer or arrange, through our CSO Programs, multi-payment, unsecured installment loan products in the United Kingdom, Australia and in 15 states in the United States. In September 2014, we began arranging and guaranteeing installment loans written
116
Table of Contents
by a third-party lender through our CSO programs in one state in the United States. Generally, terms for our installment loan products are between two and 12 months, but certain loans have available terms up to 60 months. These loans generally have higher principal amounts than short term loans and are repaid in installments over the term of the loan. The loan may be repaid early at any time with no prepayment charges. Our installment loans contributed approximately 30.1% of our total revenue for the nine months ended September 30, 2014, 26.6% in 2013, 19.1% in 2012 and 10.0% in 2011.
Line of credit accounts. Line of credit accounts consist of draws made through our unsecured line of credit products. We offer line of credit accounts in seven states in the United States and in the United Kingdom, which allow customers to draw on the line of credit in increments of their choosing up to their credit limit. Customers may pay off their account balance in full at any time or make required minimum payments in accordance with their terms of the line of credit account. As long as the customer’s account is in good standing and has credit available, customers may continue to borrow on their line of credit. Our line of credit accounts contributed approximately 37.2% of our total revenue for the nine months ended September 30, 2014, 22.3% in 2013, 11.1% in 2012 and 6.4% in 2011.
Pilot Programs. In June 2014 and July 2014 we launched pilot programs in Brazil and China, respectively, where we have begun arranging loans for borrowers through a third party lender in each country as described below. In addition, in late July 2014, we also introduced a pilot program for a new line of credit product to serve the needs of small businesses, which is now offered in seven states in the United States and is included under “line of credit accounts.”
Our Markets
We currently provide our services in the following countries:
United States. We began our online business in the United States in May 2004. As of the date of this prospectus, we provide services in 34 states under the names CashNetUSA at www.cashnetusa.com, NetCredit at www.netcredit.com and Headway Capital at www.headwaycapital.com. In 2013, we originated, guaranteed or purchased $1.3 billion in loans and acquired more than 340,000 new customers in the United States. The United States represented 55.9% of our total revenue for the nine months ended September 30, 2014 and 51.7% of our total revenue in 2013.
United Kingdom. We provide services in the United Kingdom under the names QuickQuid at www.quickquid.co.uk, QuickQuid FlexCredit at www.quickquidflexcredit.co.uk, Pounds to Pocket at www.poundstopocket.co.uk and OnStride Financial at www.onstride.co.uk. We began our QuickQuid short-term consumer loan business in July 2007, our Pounds to Pocket installment loan business in September 2010, our QuickQuid FlexCredit line of credit account business in March 2013 and our OnStride near-prime installment loan business in April 2014. In 2013, we originated $1.2 billion in loans and acquired more than 240,000 new customers in the United Kingdom. The United Kingdom represented 42.8% of our total revenue for the nine months ended September 30, 2014 and 47.1% of our total revenue in 2013. Our results from operations for the nine-month period ended September 30, 2014 and for the year ended December 31, 2013 do not include the full impact of changes and expected changes in our U.K. operations resulting from recent regulatory and legislative changes. As a result, such results are not indicative of our future results of operations and cash flow from our U.K. operations. See “Management’s Discussion and Analysis of Financial Condition and Results of Operations—Recent Regulatory Developments—Financial Conduct Authority” included elsewhere in this prospectus for a discussion about our expectations for our U.K. business going forward.
Australia. We provide services under the name DollarsDirect at www.dollarsdirect.com.au in Australia, and we began providing services there in May 2009. Australia represented 0.5% of our total revenue for the nine months ended September 30, 2014 and 0.7% of our total revenue in 2013.
117
Table of Contents
Canada. We began providing services in Canada in October 2009. As of the date of this prospectus, we provide services in the provinces of Ontario, British Columbia, Alberta and Saskatchewan under the name DollarsDirect at www.dollarsdirect.ca. Canada represented 0.6% of our total revenue for the nine months ended September 30, 2014 and 0.5% of our total revenue in 2013.
Brazil. On June 30, 2014, we launched a pilot program in Brazil where we arrange loans for a third-party lender in accordance with applicable law under the name Simplic at www.simplic.com.br. We also guarantee the payment of these loans by agreeing to purchase the loans from the third-party lender under certain circumstances. The loans may be repaid in one payment or in two or three equal installments, depending on the loan terms selected by the customer, with loan durations ranging from 15 days for loans repaid in a single payment up to 105 days for loans payable in three installments. We will receive fees and interest on these loans in connection with the services we provide. Our future plans for Brazil will largely depend on our results from this pilot program.
China. We launched a pilot program in China in late July 2014, where we have entered into a joint venture with a third party lender where the third party lender makes loans in accordance with applicable laws under the name YouXinYi at www.youxinyi.cn. The loans are installment loans that have a period of 12 months. Our future plans for China will largely depend on our results from this pilot program.
Key Financial and Operating Metrics
We have achieved significant growth since we began our online business as we have expanded both our product offerings and the geographic markets we serve. We measure our business using several financial and operating metrics. Our key metrics include domestic and international combined consumer loans outstanding, in addition to other measures described under “Management’s Discussion and Analysis of Financial Condition and Results of Operations.”
This growth in product offerings and geographic markets has resulted in significant revenue diversification, as set forth below:
|
|
|
Additional financial information regarding our operating segment and each of the geographic areas in which we do business is provided in “Note 16. Operating Segment Information” to our Audited Financial Statements and “Note 4. Operating Segment Information” to our Unaudited Financial Statements. See “Management’s Discussion and Analysis of Financial Condition and Results of Operations—Recent Regulatory Developments—Financial Conduct Authority” included elsewhere in this prospectus for a discussion about our expectations for our U.K. business going forward.
118
Table of Contents
Our Industry
The Internet has transformed how consumers shop for and acquire products and services. According to International Data Corporation, global Internet usage increased 51% from 2009 to 2013, from 1.8 billion to 2.7 billion users, and is expected to increase an additional 33%, to 3.5 billion users, by 2017. As Internet accessibility has grown, a number of traditional financial services such as banking, bill payment and investing have become widely available online. A recent study by CFI Group found that approximately 82% of bank customers in a U.S. sample used their bank’s website at least once in the last 30 days. This level of use highlights the extent to which consumers now accept the Internet for conducting their financial transactions and are willing to entrust their financial information to online companies. Moreover, the CFI Group study suggests that bank customers are actually more likely to bank online than at a branch. We believe the increased acceptance of online financial services has led to an increased demand for online lending, the benefits of which include customer privacy, easy access, security, 24/7 availability, speed of funding and transparency of fees and interest.
We use the Internet to serve the large and growing number of underbanked consumers who have bank accounts but use alternative financial services because of their limited access to more traditional consumer credit from banks, credit card companies and other lenders. Demand from these consumers has been fueled by several demographic and socioeconomic trends, including an overall increase in the population and stagnant to declining growth in the household income for working-class individuals. The necessity for alternative financial services was highlighted by a 2011 report from The National Bureau of Economic Research, which found that half of the Americans surveyed reported that it is unlikely that they would be able to gather $2,000 to cover a financial emergency, even if given a month to obtain funds.
We believe that consumers seek online lending services for numerous reasons, including because they often:
| • | prefer the simplicity, transparency and convenience of these services; |
| • | require access to financial services outside of normal banking hours; |
| • | have an immediate need for cash for financial challenges and unexpected expenses; |
| • | have been unable to access certain traditional lending or other credit services; |
| • | seek an alternative to the high cost of bank overdraft fees, credit card and other late payment fees and utility late payment fees or disconnect and reconnection fees; and |
| • | wish to avoid potential negative credit consequences of missed payments with traditional creditors. |
Our Customers
Our customer base is comprised largely of individuals living in households that earn between $25,000 and $50,000 annually in the United States and between £15,000 and £25,000 annually in the United Kingdom, most of whom are considered sub-prime borrowers. Based on our analysis of industry data, we believe our addressable markets are approximately 51 million and 15 million households in the United States and the United Kingdom, respectively. The short-term lending market is sizable in both the United States and the United Kingdom. The Center for Financial Services Innovation has estimated that the short-term and installment lending market in the United States represented approximately $58 billion in loan volume in 2012. The U.K. Parliamentary Commission on Banking Standards recently estimated that the high-cost credit market, which includes short-term lending, represented over £10 billion in loan volume as of June 2013.
Our Competitive Strengths
We believe that the following competitive strengths position us well for continued growth:
| • | Significant operating history and first mover advantage. As an early entrant in the online lending sector, we have accumulated approximately nine terabytes of currently accessible consumer behavior data from more than 30 million transactions during the past ten years. This database allows us to |
119
Table of Contents
| market to a customer base with an established borrowing history as well as to better evaluate and underwrite new customers, leading to better loan performance. In order to develop a comparable database, we believe that competitors would need to incur high marketing and customer acquisition costs, overcome consumer brand loyalties and have sufficient capital to withstand higher early losses associated with unseasoned loan portfolios. Additionally, we are licensed in all jurisdictions which require licensing and believe that it would be difficult and time consuming for a new entrant to obtain such licenses. We have also created strong brand recognition over our ten year operating history and we continue to invest in our brands, such as CashNetUSA, NetCredit, Pounds to Pocket, QuickQuid, DollarsDirect, QuickQuid FlexCredit, OnStride Financial, Headway Capital, Simplic and YouXinYi, to further increase our visibility. |
| • | Proprietary analytics, data and underwriting. We have developed a fully integrated decision engine that evaluates and rapidly makes credit and other determinations throughout the customer relationship, including automated decisions regarding marketing, underwriting, customer contact and collections. Our decision engine currently handles more than 100 algorithms and over 1,000 variables. These algorithms are constantly monitored, validated, updated and optimized to continuously improve our operations. Our proprietary models are built on ten years of lending history, using advanced statistical methods that take into account our experience with the millions of transactions we have processed during that time and the use of data from multiple third-party sources. Since we designed our system specifically for our specialized products, we believe our system provides more predictive assessments of future loan behavior than traditional credit assessments, such as FICO, and therefore, results in better evaluation of our customer base. |
| • | Scalable and flexible technology platform. Our proprietary technology platform is designed to be powerful enough to handle the large volume of data required to evaluate customer applications and flexible enough to capitalize on changing customer preferences, market trends and regulatory requirements. This platform has enabled us to achieve significant growth over the last ten years as we have expanded both our product offerings and the geographic markets we serve. We began offering installment loans in the United States and United Kingdom in 2008 and 2010, respectively, and added line of credit products in the United States and United Kingdom in 2010 and 2013, respectively. We have experienced significant growth in these products, with revenue contribution from installment and line of credit products increasing from 11.7% of total revenue in 2010 to 48.9% of total revenue in 2013 and 67.3% of total revenue for the nine months ended September 30, 2014. Similarly, total revenue contribution from our international operations, primarily in the United Kingdom, has grown at a compound annual growth rate of 73.8%, from $40.5 million, or 15.9% of total revenue in 2009, to $369.8 million, or 48.3% of total revenue in 2013. Our results from operations for the nine-month period ended September 30, 2014 and for the year ended December 31, 2013 do not include the full impact of changes and expected changes in our U.K. operations resulting from recent regulatory and legislative changes. As a result, such results are not indicative of our future results of operations and cash flow from our U.K. business. See “Management’s Discussion and Analysis of Financial Condition and Results of Operations—Recent Regulatory Developments—Financial Conduct Authority” included elsewhere in this prospectus for a discussion about our expectations for our U.K. business going forward. Due to the scalability of our platform, we were able to achieve this growth without significant investment in additional infrastructure, and over the past three years capital expenditures have averaged only 2.6% of revenue per year. We expect our advanced technology and underwriting platform to help continue to drive significant growth in our business. |
| • | Focus on consumer experience. We believe that alternative credit consumers are not adequately served by traditional lenders. To better serve these consumers, we use customer-focused business practices, including 24/7 customer service by phone, email, fax and web chat. We continuously work to improve customer satisfaction by evaluating information from website analytics, customer surveys, call center feedback and focus groups. Our call center teams receive training on a regular basis and are monitored by quality assurance managers. We believe customers who wish to access credit again often |
120
Table of Contents
| return to us because of our dedication to customer service, the transparency of our fees and interest charges and our adherence to trade association “best practices.” |
| • | Diligent regulatory compliance. We conduct our business in a highly regulated industry. We are focused on regulatory compliance and have devoted significant resources to comply with laws that apply to us, while we believe many of our online competitors have not. We tailor our lending products and services to comply with the specific requirements of each of the jurisdictions in which we operate, including laws and regulations relating to fees, loan durations and renewals or extensions, loan amounts, disclosures and underwriting requirements. Our compliance experience and proprietary technology platform allow us to launch new products and to enter new geographic regions with a focus on compliance with applicable laws and customer protection. We are members of industry trade groups, including the Online Lenders Alliance in the United States and the Consumer Finance Association in the United Kingdom, which have promulgated “best practices” for our industry that we have adopted. The flexibility of our online platform enables us to rapidly adapt our products as necessary to comply with changes in regulation, without the need for costly and time consuming retraining of store-based employees and other expenses faced by our storefront competitors. |
| • | Proven history of growth and profitability. Over the last five years, we grew our net consumer loans, which are the gross outstanding balances for our consumer loans carried in the consolidated balance sheets net of the allowance for estimated loan losses, at a compound annual growth rate of 49.5%, from $60.8 million as of December 31, 2009 to $303.5 million as of December 31, 2013. Over the same period, our revenue grew at a compound annual growth rate of 31.6%, from $255.0 million in 2009 to $765.3 million in 2013, while Adjusted EBITDA grew at a compound annual growth rate of 36.3%, from $47.0 million to $162.2 million. Adjusted EBITDA has further improved to $222.5 million during the LTM Period. Adjusted EBITDA margin has likewise improved, increasing over 800 basis points from 18.4% of revenue in 2009 to 27.0% of revenue for the LTM Period. Our results from operations for the nine-month period ended September 30, 2014 and for the year ended December 31, 2013 do not include the full impact of changes and expected changes in our U.K. operations resulting from recent regulatory and legislative changes. As a result, such results are not indicative of our future results of operations and cash flow from our U.K. business. See “Management’s Discussion and Analysis of Financial Condition and Results of Operations—Recent Regulatory Developments—Financial Conduct Authority” included elsewhere in this prospectus for a discussion about our expectations for our U.K. business going forward. |
| • | Talented, highly educated employees. We believe we have one of the most skilled and talented teams of professionals in the industry. Our employees have exceptional educational backgrounds, with numerous post-graduate and undergraduate degrees in science, technology, engineering and mathematics fields. We hire and develop top talent from graduate and undergraduate programs at institutions such as Carnegie Mellon University, Northwestern University and the University of Chicago. The extensive education of our team is complemented by the experience our leadership team obtained at leading technology firms and financial services companies such as Intel, optionsXpress, First American Bank and JPMorgan Chase. |
Our Growth Strategy
| • | Increase penetration in existing markets through direct marketing. We believe that we have reached only a small number of the potential customers for our products and services in the markets in which we currently operate. We continue to focus on our direct customer acquisition channels, with direct marketing (traditional and digital) generating more than 52% of our new customer transactions in 2013, as compared to 32% in 2009. We believe these channels will ultimately allow us to reach a larger customer base at a lower acquisition cost than the traditional online lead purchasing model. Additionally, as our smaller and less sophisticated competitors, both online and storefront, struggle to adapt to both regulatory developments and evolving consumer preference, we believe we have the opportunity to gain significant market share. |
121
Table of Contents
| • | Expand globally to reach new markets. We are building on our global reach by entering new markets, particularly in Latin America and Asia. In June 2014 and July 2014 we launched pilot programs in Brazil and China, respectively, where we have begun arranging loans for borrowers through a third party lender in each country. We believe that these countries have significant populations of underserved consumers. When pursuing geographic expansion, factors we consider include, among others, whether there is (i) widespread Internet usage, (ii) an established and interconnected banking system and (iii) government policy that promotes the extension of credit. Our recent launches in Brazil and China, as well as our launches into the United Kingdom in 2007 and Australia and Canada in 2009, demonstrate that we can quickly and efficiently enter new markets. Our revenue from international operations has increased from $1.6 million in 2007, or 0.9% of our total revenue, to $369.8 million in 2013, or 48.3% of our total revenue. Our results from operations for the nine-month period ended September 30, 2014 and for the year ended December 31, 2013 do not include the full impact of changes and expected changes in our U.K. operations resulting from recent regulatory and legislative changes. As a result, such results are not indicative of our future results of operations and cash flow from our U.K. business. See “Management’s Discussion and Analysis of Financial Condition and Results of Operations—Recent Regulatory Developments—Financial Conduct Authority” included elsewhere in this prospectus for a discussion about our expectations for our U.K. business going forward. |
| • | Introduce new products and services. We plan to attract new categories of consumers not served by traditional lenders through the introduction of new products and services. We have introduced new products to expand our businesses from solely single-payment consumer loans to installment loans and line of credit accounts, using our analytics expertise and our flexible and scalable technology platform. In 2012, we launched NetCredit, a longer duration installment loan product for near-prime consumers in the United States, and we launched OnStride Financial, a similar near-prime product, in the United Kingdom in April 2014. In late July 2014 we launched Headway Capital, a pilot program for a new line of credit product in the United States that serves the needs of small businesses. In addition, we intend to continue to evaluate and offer new products and services that complement our online specialty financial services in order to meet the growing needs of our consumers. |
Online Loan Process
When a customer takes out a new loan, loan proceeds are promptly deposited in the customer’s bank account or on to a debit card in exchange for a pre-authorized debit for repayment of the loan from the customer’s account. Where permitted by law and approved by us, a customer may choose to renew a loan before payment becomes due by agreeing to pay an additional finance charge. If a loan is renewed, the renewal is considered a new loan.
We have created a quick and simple process for customers to apply for an online loan, as shown below:
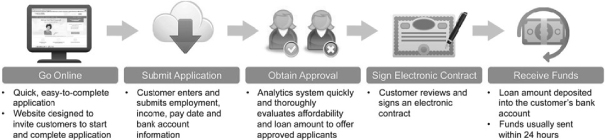
Technology Platform
Our proprietary technology platform is built for scalability and flexibility and is based on proven open source software. The technology platform was designed to be powerful enough to handle the large volumes of data
122
Table of Contents
required to evaluate customer applications and flexible enough to capitalize on changing customer preferences, market trends and regulatory changes. The scalability and flexibility of our technology platform allows us to enter new markets and launch new products quickly, typically within three to six months from conception to launch.
We continually employ technological innovations to improve our technology platform, which performs a variety of integrated and core functions, including:
| • | Front-end system, which includes external websites, landing pages and mobile sites and applications that customers use when applying for loans and managing their accounts; |
| • | Back-end and customer relationship management, or CRM, systems, which maintain customer-level data and are used by our call center employees to provide real-time information for all inquiries. Our back-end system and CRM system includes, among other things, our contact management system, operational and marketing management system, automated phone system, Interactive Voice Response and call center performance management system; |
| • | Decision engine, which rapidly evaluates and makes credit decisions throughout the customer relationship; and |
| • | Financial system, which manages the external interface for funds transfers and provides daily accounting, reconciliation and reporting functions. |
The key elements of our technology platform include:
| • | Scalable Information Technology infrastructure. Our Information Technology infrastructure allows us to meet customer demand and accommodate business growth. Our services rely on accessing, evaluating and creating large volumes of data including, for example, information collected from approximately 14 million credit reports during 2013. This rich dataset has grown significantly over our ten year history and will continue to grow as our business expands. We believe that our scalable IT infrastructure enables us to meet substantial growth demands. |
| • | Flexible software and integration systems. Our software system is designed to allow us to enter new markets and launch new products rapidly, modify our business operations quickly and account for complex regulatory requirements imposed by the jurisdictions in which we operate. We have developed a proprietary software solution that allows us to innovate faster and to improve the customer experience. Our integration system allows us to easily interface with banks and other strategic partners in order to deliver the best financial products possible. Our software and integration systems and their flexibility allow us much more control over the continually evolving aspects of our business. |
| • | Rapid development processes. Our software development life cycle is rapid and iterative to increase the efficiency of our platform. We are able to implement software updates while maintaining our system stability. |
| • | Security. We collect and store personally identifiable customer information, including names, addresses, social security numbers and bank account information. We have safeguards designed to protect this information. We also created controls to limit employee access to that information and to monitor that access. Our safeguards and controls have been independently verified through regular and recurring audits and assessments. |
| • | Redundant disaster recovery. Our technology platform is distributed across two different locations. This provides redundancy, fault tolerance and disaster recovery functionality in case of a catastrophic outage. |
123
Table of Contents
Proprietary Data and Analytics
Decision Engine
We have developed a fully integrated decision engine that evaluates and rapidly makes credit and other determinations throughout the customer relationship, including automated decisions regarding marketing, underwriting, customer contact and collections. Our decision engine currently handles more than 100 algorithms and over 1,000 variables. The algorithms in use are constantly monitored, validated, updated and optimized to continuously improve our operations. In order to support the daily running and ongoing improvement of our decision engine, we have assembled a highly skilled team of more than 50 data and analytics professionals.
Proprietary Data, Models and Underwriting
Our proprietary models are built on ten years of history, using advanced statistical methods that take into account our experience with the millions of transactions we have processed during that time and the use of data from multiple third-party sources. We continually update our underwriting models to manage risk of defaults and to structure loan terms. Our system completes these assessments within seconds of receiving the customer’s data.
Our underwriting system is able to assess risks associated with each customer individually based on specific customer information and historical trends in our portfolio. We use a combination of numerous factors when evaluating a potential customer, which can include a customer’s income, rent or mortgage payment amount, employment history, external credit bureau scores, amount and status of outstanding debt and other recurring expenditures, fraud reports, repayment history, charge-off history and the length of time the customer has lived at his or her current address. While the relative weight or importance of the specific variables that we consider when underwriting a loan changes from product to product, generally, the key factors that we consider include monthly gross income, disposable income, length of employment, duration of residency, credit report history, and prior loan performance history if the applicant is a returning customer. Our customer base is predominantly in the low to fair FICO range with scores generally between 500 and 680. We generally do not take into account a potential customer’s FICO score when deciding whether to make a loan. Since we designed our system specifically for our specialized products, we believe our system provides more predictive assessments of future loan behavior and results in better evaluation of our customer base when compared to traditional credit assessments, such as FICO.
Fraud Prevention
Our robust fraud prevention system is built from in-depth analysis of previous fraud incidences and information from third party data sources. We continuously develop and implement ongoing improvements to reduce losses due to fraudulent activity. Our fraud prevention system incorporates algorithms to differentiate customers in an effort to identify suspected fraudulent activity and to reduce our risks of loss from fraud.
Our fraud prevention team has implemented systems that systematically monitor indicators of fraudulent activity and are positioned to respond to suspicious activity quickly. While no system can completely protect against losses from fraud, we believe our systems provide protection against significant fraud losses.
Marketing
We use a multi-channel approach to marketing, with both broad-reach and highly-targeted channels, including television, digital, direct mail, telemarketing and partner marketing (which includes lead providers and marketing affiliates). The goal of our marketing is to promote our brands and products in the online lending marketplace and to directly acquire new customers at low cost. Our marketing has successfully built strong awareness of and preference for our brands, as our products have achieved market leadership through the following:
| • | Traditional advertising. We use television, direct mail, radio and outdoor advertisements, supported by technology infrastructure and key vendors, to drive and optimize website traffic and loan volume. We believe our investments through these channels have helped create strong brand awareness and preference in the consumer segments and markets we serve. |
124
Table of Contents
| • | Digital acquisition. Our online marketing efforts include pay-per-click, keyword advertising, search engine optimization, marketing affiliate partnerships, social media programs and mobile advertising integrated with our operating systems and technology from vendors that allow us to optimize customer acquisition tactics within the daily operations cycle. |
| • | Partner Marketing. We purchase qualified leads for prospective new customers from a number of online lead providers and through marketing affiliate partnerships. We believe that our rapid decision-making on lead purchases, strong customer conversion rate and significant scale in each of our markets make us a preferred partner for lead providers and affiliates while at the same time our technology and analytics help us determine the right price for the right leads. |
| • | User experience and conversion. We measure and monitor website visitor usage metrics and regularly test website design strategies to improve customer experience and conversion rates. |
Our brand, technology and analytics powered approach to marketing has enabled us to increase the percentage of customers sourced through direct marketing (where we have more visibility and control than in the lead purchase or affiliate channels) from approximately 32% in 2009 to 52% in 2013, and we believe we have also improved customer brand loyalty during the same period.
Customer Service
We believe that our in-house call center and our emphasis on superior customer service are significant contributors to our growth in annual customer transactions. To best serve our consumers, we use customer oriented business practices, such as offering 24/7 customer service. We continuously work to improve our customers’ experience and satisfaction by evaluating information from website analytics, customer satisfaction surveys, call center feedback, call monitoring and focus groups. Our call center teams receive training on a regular basis, are monitored by quality assurance managers and adhere to rigorous internal service-level agreements. We do not outsource our call center operations. We have two call center facilities, one in our corporate offices in Chicago and another in Gurnee, Illinois, a Chicago suburb. As of December 31, 2013, we had 615 employees in our call centers supporting our customers.
Collections
We operate centralized collection teams within our two call centers to coordinate a consistent approach. We have implemented payment and loan collection policies and practices designed to optimize regulatory compliant loan repayment, while also providing excellent customer service. Our collections employees are trained to help the customer understand available payment alternatives and make arrangements to repay the loan. We use a variety of collection strategies to satisfy a delinquent loan, such as settlements and payment plans.
Call center employees contact customers following the first missed payment and periodically thereafter. Our primary methods of contacting past due customers are through phone calls, letters and emails. At times, we sell loans that we are unable to collect to debt collection companies or place the debt for collection with debt collection companies.
Competition
We have many competitors. Our principal competitors are consumer loan companies, CSOs, online lenders, credit card companies, consumer finance companies, pawnshops and other financial institutions that offer similar financial services. Many of our U.S. competitors operate using other business models, including a “tribal model” where the lender follows the laws of a Native American tribe regardless of the state in which the customer resides and a “single-state model” where the lender is generally licensed in one state and follows only the laws and regulations of that state regardless of the state in which the customer resides.
125
Table of Contents
We believe that the principal competitive factors in the consumer loan industry consist of the ability to provide sufficient loan size to meet consumers’ loan requests, speed of funding, customer privacy, ease of access, transparency of fees and interest and customer service. We believe we have a significant competitive advantage as an early mover in many of the markets that we serve. New entrants face obstacles typical to launching new lending operations, such as successfully implementing underwriting and fraud prevention processes, incurring high marketing and customer acquisition costs, overcoming consumer brand loyalty and having or obtaining sufficient capital to withstand early losses associated with unseasoned loan portfolios. In addition, there are substantial regulatory and compliance costs, including the need for expertise to customize products and obtain licenses to lend in various states in the United States and in many international jurisdictions. Our proprietary technology, analytics expertise, scale, international reach, brand recognition and regulatory compliance would be difficult for a new competitor to duplicate.
Because numerous competitors offer consumer loan products and services, and many of our competitors are privately held, it is difficult for us to determine our exact competitive position in the market. However, we believe our principal online competitors in the United States include Advantage Cash Services, Think Finance, and Elevate. Storefront consumer loan lenders that offer loans online or in storefronts are also a source of competition in some of the markets where we offer consumer loans, including Advance America, Ace Cash Express, Check ‘n Go, Dollar Financial and Check Into Cash. In the United Kingdom, we believe that our principal online competitors include PaydayUK, Wonga, Lending Stream, Mr. Lender and Sunny. In Australia, we believe our main online competitors are Nimble, Cash Converters and First Stop Money. In Canada, the industry has been dominated by storefront lenders, and as a result, our principal competitors are not online lenders but storefront lenders, such as Money Mart, The Cash Store and Cash Money.
Our products also compete with those of other financial institutions, such as banks, credit unions, pawn shops, credit services organizations, auto title lenders and consumer finance companies, which can offer loans on an unsecured as well as a secured basis. We believe that there is also indirect competition to some of our products, including bank overdraft facilities and banks’ and retailers’ insufficient funds policies, many of which may be more expensive alternative approaches for consumers to cover their bills and expenses than the consumer loan products we offer.
Intellectual Property
Protecting our rights to our intellectual property is critical, as it enhances our ability to offer distinctive services and products to our customers, which differentiates us from our competitors. We rely on a combination of trademark laws and trade secret protections in the United States and other jurisdictions, as well as confidentiality procedures and contractual provisions, to protect the intellectual property rights related to our proprietary analytics, predictive underwriting models and software systems. We have several registered trademarks, including CashNetUSA, QuickQuid, DollarsDirect and our “e” logo. These trademarks have varying expiration dates, and we believe they are materially important to us and we anticipate maintaining them and renewing them.
Seasonality
Demand for our short-term consumer loan products and services in the United States has historically been highest in the third and fourth quarters of each year, corresponding to the holiday season, and lowest in the first quarter of each year, corresponding to our customers’ receipt of income tax refunds. Typically, our cost of revenue for our short term consumer loan products, which represents our loan loss provision, is lowest as a percentage of revenue in the first quarter of each year, corresponding to our customers’ receipt of income tax refunds, and increases as a percentage of revenue for the remainder of each year. Consequently, we experience seasonal fluctuations in our domestic operating results and cash needs.
Employees
As of December 31, 2013, we had 1,027 employees.
126
Table of Contents
Properties
We lease our corporate headquarters, which are located in Chicago, Illinois. In addition, in early 2015 we will relocate our headquarters to a new leased Chicago, Illinois location. We also maintain a leased office in Gurnee, Illinois for one of our call center operations. We believe that our leased facilities are adequate to support our operations and that, as needed, we will be able to obtain suitable additional facilities on commercially reasonable terms. As discussed under “Regulation and Legal Proceedings—Foreign Regulation—United Kingdom,” we have established an office in the United Kingdom consistent with U.K. supervisory requests.
Corporate Information
Enova was incorporated under the laws of the State of Delaware on September 7, 2011. On September 13, 2011, Cash America contributed to us all of the capital stock of the subsidiaries owned by it through which Cash America has engaged in its e-commerce business prior to the contribution in exchange for 33 million shares of our common stock. Our principal executive offices are located at 200 W. Jackson Blvd., Suite 2400, Chicago, Illinois 60606, and our telephone number is (312) 568-4200. Our corporate website is located at www.enova.com. The information contained on or accessible from our websites is not incorporated by reference into this prospectus, and you should not consider information on our websites as part of this prospectus.
Market and Industry Data
The market and industry data contained in this prospectus, including trends in our markets and our position within such markets, are based on a variety of sources, including our good faith estimates, which are derived from our review of internal surveys, information obtained from customers and publicly available information, as well as from independent industry publications, reports by market research firms and other published independent sources. Although we believe these sources are reliable, we have not independently verified the information. None of the independent industry publications used in this prospectus were prepared on our or Cash America’s behalf.
127
Table of Contents
REGULATION AND LEGAL PROCEEDINGS
U.S. Federal Regulation
Consumer Lending Laws. Our consumer loan business is subject to the federal Truth in Lending Act, or TILA, and its underlying regulations, known as Regulation Z, and the Fair Credit Reporting Act, or FCRA. These laws require us to provide certain disclosures to prospective borrowers and protect against unfair credit practices. The principal disclosures required under TILA are intended to promote the informed use of consumer credit. Under TILA, when acting as a lender, we are required to disclose certain material terms related to a credit transaction, including, but not limited to, the annual percentage rate, finance charge, amount financed, total of payments, the number and amount of payments and payment due dates to repay the indebtedness. The FCRA regulates the collection, dissemination and use of consumer information, including consumer credit information. The federal Equal Credit Opportunity Act prohibits us from discriminating against any credit applicant on the basis of any protected category, such as race, color, religion, national origin, sex, marital status or age, and requires us to notify credit applicants of any action taken on the individual’s credit application.
Consumer Reports and Information. The use of consumer reports and other personal data used in credit underwriting is governed by the FCRA and similar state laws governing the use of consumer credit information. The FCRA establishes requirements that apply to the use of “consumer reports” and similar data, including certain notifications to consumers where their loan application has been denied because of information contained in their consumer report. The FCRA requires us to promptly update any credit information reported to a credit reporting agency about a consumer and to allow a process by which consumers may inquire about credit information furnished by us to a consumer reporting agency.
Information-Sharing Laws. We are also subject to the federal Fair and Accurate Credit Transactions Act, which limits the sharing of information with affiliates for marketing purposes and requires us to adopt written guidance and procedures for detecting, preventing and responding appropriately to mitigate identity theft and to adopt various policies and procedures and provide training and materials that address the importance of protecting non-public personal information and aid us in detecting and responding to suspicious activity, including suspicious activity that may suggest a possible identity theft red flag, as appropriate.
Marketing Laws. Our advertising and marketing activities are subject to several federal laws and regulations including the FTC Act, which prohibits unfair or deceptive acts or practices and false or misleading advertisements in all aspects of our business. As a financial services company, any advertisements related to our products must also comply with the advertising requirements set forth in TILA. Also, any of our telephone marketing activities must comply with the Telephone Consumer Protection Act, or the TCPA, and the Telephone Sales Rule, or the TSR. The TCPA prohibits the use of automatic telephone dialing systems for communications with wireless phone numbers without express consent of the consumer, and the TSR established the Do Not Call Registry and sets forth standards of conduct for all telemarketing. Our advertising and marketing activities are also subject to the CAN-SPAM Act of 2003 which establishes certain requirements for commercial email messages and specifies penalties for the transmission of commercial email messages that are intended to deceive the recipient as to the source of content.
Protection of Military Members and Dependents. Federal law also limits the annual percentage rate to 36% on certain consumer loans made to active duty members of the U.S. military, reservists and members of the National Guard and their immediate families. This 36% annual percentage rate cap applies to a variety of consumer loan products, including short-term consumer loans. Therefore, due to these rate restrictions, we are unable to offer certain short-term consumer loans to active duty military personnel, active reservists and members of the National Guard and their immediate dependents. Federal law also limits the annual percentage rate on existing loans when the consumer becomes an active-duty member of the military during the life of a loan, or the spouse or dependent of an active duty member of the military during the life of the loan. Pursuant to federal law, the interest rate must be reduced to 6% per year on amounts outstanding during the time in which the servicemember is on active duty.
128
Table of Contents
Funds Transfer and Signature Authentication Laws. The consumer loan business is also subject to the federal Electronic Funds Transfer Act and various other laws, rules and guidelines relating to the procedures and disclosures required in debiting or crediting a debtor’s bank account relating to a consumer loan (i.e., ACH funds transfer). Furthermore, we are subject to various state and federal e-signature rules mandating that certain disclosures be made and certain steps be followed in order to obtain and authenticate e-signatures.
Debt Collection Practices. Additionally, our CSO programs are required to comply with the federal Fair Debt Collection Practices Act, or FDCPA, and we also use the FDCPA as a guide in connection with operating our other collection activities. We are also required to comply with all applicable state collection practices laws.
Privacy and Security of Non-Public Customer Information. We are also subject to various federal and state laws and regulations relating to privacy and data security. Under these laws, including the federal Gramm-Leach-Bliley Act, we must disclose to consumers our privacy policy and practices, including those policies relating to the sharing of consumers’ nonpublic personal information with third parties. This disclosure must be made to consumers when the customer relationship is established and, in some cases, at least annually thereafter. These regulations also require us to ensure that our systems are designed to protect the confidentiality of consumers’ nonpublic personal information. These regulations also dictate certain actions that we must take to notify consumers if their personal information is disclosed in an unauthorized manner.
Anti-Money Laundering and Economic Sanctions. We are also subject to certain provisions of the USA PATRIOT Act and the Bank Secrecy Act under which we must maintain an anti-money laundering compliance program covering certain of our business activities. In addition, OFAC prohibits us from engaging in financial transactions with specially designated nationals. Certain of our subsidiaries are also registered as money services businesses with the U.S. Treasury Department and must re-register with the Treasury Department’s Financial Crimes Enforcement Network, or FinCEN, at least every two years. Such subsidiaries must also maintain a list of names and addresses of, and other information about, their businesses and must make that list available to any requesting law enforcement agency. This list must be updated at least annually.
Anticorruption. We are also subject to the U.S. Foreign Corrupt Practices Act, or the FCPA, which generally prohibits companies and their agents or intermediaries from making improper payments to foreign officials for the purpose of obtaining or keeping business and/or other benefits.
CFPB
In July 2010, the U.S. Congress passed the Dodd-Frank Act and Title X of the Dodd-Frank Act created the CFPB, which regulates consumer financial products and services, including consumer loans that we offer. The CFPB has regulatory, supervisory and enforcement powers over providers of consumer financial products and services, including explicit supervisory authority to examine and require registration of such providers.
On November 20, 2013, Cash America consented to the issuance of a Consent Order by the CFPB pursuant to which it agreed, without admitting or denying any of the facts or conclusions made by the CFPB from its 2012 review of Cash America and us, to pay a civil money penalty of $5 million and to set aside $8 million for a period of 180 days to fund any further payments to eligible Ohio customers in connection with Cash America’s Ohio Reimbursement Program. The Consent Order also relates to issues self-disclosed to the CFPB during its 2012 examination of Cash America and us, including the making of a limited number of loans to consumers who may have been active-duty members of the military at the time of the loan at rates in excess of the military annual percentage rate permitted by the federal Military Lending Act, and for which we have made refunds of approximately $33,500; for certain failures to timely provide and preserve records and information in connection with the CFPB’s examination of us and Cash America; for certain conduct in the examination process; and certain conduct giving rise to the Ohio Reimbursement Program initiated by Cash America. In addition, as a result of the CFPB’s review, we are in the process of enhancing our compliance management programs and implementing additional policies and procedures to address the issues identified by the CFPB. These new
129
Table of Contents
policies, procedures and other initiatives are in many cases subject to review and potential objection by the CFPB. We are also required to provide periodic reports to the CFPB. We are subject to the restrictions and obligations of the Consent Order, including the CFPB’s order that we ensure compliance with federal consumer financial laws and develop more robust compliance policies and procedures.
On April 24, 2013, the CFPB issued a report entitled “Payday Loans and Deposit Advance Products: A White Paper of Initial Findings,” indicating that it had “engaged in an in-depth review of short-term small dollar loans, including payday loans.” The report discusses the initial findings of the CFPB regarding short-term payday loans, a category which the CFPB and some other regulators use to include certain of our short-term loan products, provided by non-bank financial institutions at storefront locations and deposit account advances offered by depository institutions. While the CFPB’s study stated that “these products may work for some consumers for whom an expense needs to be deferred for a short period of time,” the CFPB also stated that its “findings raised substantial consumer protection concerns” related to the sustained use of payday loans and deposit account advances. The report also indicated that the CFPB planned to analyze the effectiveness of limitations such as cooling-off periods between payday loans, “in curbing sustained use and other harms.” In furtherance of that report, on March 25, 2014, the CFPB held a hearing on payday lending and issued a report entitled “CFPB Data Point: Payday Lending,” presenting “the results of several analyses of consumers’ use of payday loans.” The report presents the CFPB’s findings as to borrowers’ loan sequences, which refers to a series of loans a borrower may take out following an initial loan. The CFPB found that payday borrowing typically involves multiple renewals following an initial loan, rather than distinct loans separated by at least 15 days. The report states that for the majority of loan sequences that last for more than one loan, there is no reduction in the principal amount between the first and last loan in the sequence. In the reports and subsequent statements, the CFPB reiterated its commitment to use its various tools to protect consumers from unlawful acts and practices in connection with the offering of consumer financial products and services. Both the April 24, 2013 white paper and the March 25, 2014 report indicated that the CFPB did not include online payday loans as part of its analysis, but the CFPB has indicated that it is currently analyzing borrowing activity by consumers using online payday loans. The CFPB has announced that it is in the late stages of considering the formulation of rules regarding short-term consumer loans that will ensure that consumers can get the credit they need without long-term impact to their financial futures. These rules will likely impose limitations on payday lending. We do not currently know the nature and extent of the rules that the CFPB will adopt or when proposed rules will be published, but the CFPB could propose and adopt rules during 2015.
For further discussion of the CFPB and its regulatory, supervisory and enforcement powers, see “Risk Factors—Risks Related to Our Business and Industry—The Consumer Financial Protection Bureau has examination authority over our U.S. business that could have a significant impact on our U.S. business.”
U.S. State Regulation
Our business is regulated under a variety of enabling state statutes, all of which are subject to change and which may impose significant costs or limitations on the way we conduct or expand our business. As of the date of this prospectus, we operate in 34 states that have specific statutes and regulations that enable us to offer economically viable products. We currently do not conduct business in the remaining states or in the District of Columbia because we do not believe it is economically feasible to operate in those jurisdictions due to specific statutory or regulatory restrictions, such as interest rate ceilings, caps on the fees that may be charged, or costly operational requirements. However, we may later offer our products or services in any of these states or the District of Columbia if we believe doing so may become economically viable because of changes in applicable statutes or regulations or if we determine we can broaden our product offerings to operate under existing laws and regulations.
The scope of state regulation, including the fees and terms of our products and services, varies from state to state. The terms of our products and services vary from state to state in order to comply with the laws and regulations of the states in which we operate. In addition, our advertising and marketing activities and disclosures are subject to review under various state consumer protection laws and other applicable laws and regulations.
130
Table of Contents
The states with laws that specifically regulate our products and services typically limit the principal amount of a consumer loan and set maximum fees or interest rates that customers may be charged. Some states also limit a customer’s ability to renew a short-term consumer loan and require various disclosures to consumers. State statutes often specify minimum and maximum maturity dates for consumer loans such as ours and, in some cases, specify mandatory cooling-off periods between transactions. Our collection activities regarding past due amounts are subject to consumer protection laws and state regulations relating to debt collection practices. In addition, some states require certain disclosures or content to accompany our advertising or marketing materials. Also, some states require us to report loan activity to state-wide databases and restrict the number and/or principal amount of loans a consumer may have outstanding at any particular time or over the course of a particular period of time, typically twelve months.
In Texas and Ohio where we offer our CSO programs, we comply with that jurisdiction’s Credit Services Organization Act or a similar statute. These laws generally define the services that we can provide to consumers and require us to provide a contract to the customer outlining our services and the cost of those services to the customer. In addition, these laws may require additional disclosures to consumers and may require us to be registered with the jurisdiction and/or be bonded.
We must also comply with state restrictions on the use of lead providers. In 2013, California began enforcing its short-term lending statute to require lead providers to be licensed in order to provide leads to licensed lenders, causing us to discontinue the use of lead providers in California. In April 2014, the Attorney General of the State of Illinois filed a lawsuit against a lead provider, alleging that the lead provider offered and arranged payday loans without a license. As a result, we recently discontinued the use of lead providers in Illinois. Although we cannot predict what measures will be taken, we expect that other states may propose or enact similar restrictions on lead providers in the future.
Over the last few years, legislation that prohibits or severely restricts our products and services has been introduced or adopted in a number of states. As a result, we have ceased doing business in five states where we formerly conducted business, and we have also modified our business operations in other states where restrictive legislation has been enacted. Additional regulations targeting or otherwise directly affecting our products and services have also been passed recently in Idaho, Louisiana, Utah and Wyoming and proposed recently in Alabama, Minnesota, Missouri, Rhode Island, Texas and Wisconsin. In addition, other states may debate and, in the future, adopt legislation that could adversely impact our products and services.
Local Regulation—United States
In addition to state and federal laws and regulations, our industry is subject to various local rules and regulations. These local rules and regulations are subject to change and vary widely from city to city. Local jurisdictions’ efforts to restrict short-term lending have been increasing. Typically, these local ordinances apply to storefront operations, however, local jurisdictions could attempt to enforce certain business conduct and registration requirements on online lenders lending to residents of that jurisdiction, even though no such attempt has been made previously. Actions taken in the future by local governing bodies to impose other restrictions on consumer lenders such as us could impact our business.
Foreign Regulation
United Kingdom
In the United Kingdom, we are subject to regulation by the Financial Conduct Authority, or the FCA, and must comply with the FCA’s rules and regulations set forth in the FCA Handbook, the Financial Services and Markets Act 2000, or the FSMA, the Consumer Credit Act 1974, as amended, or the CCA, and secondary legislation passed under the CCA, among other rules and regulations. We must also follow the Irresponsible Lending Guidance, or the Guidance, of the Office of Fair Trading, or the OFT, which provides greater clarity for lenders as to business practices that the OFT (and now the FCA) believes constitute irresponsible lending under the CCA.
131
Table of Contents
In December 2012, the U.K. Parliament passed the Financial Services Act 2012, or the FSA Act 2012, which created a new regulatory framework for the supervision and regulation of the consumer credit industry in the United Kingdom. The FSA Act 2012 mandated that, in April 2014, the FCA take over responsibility for regulating consumer credit from the OFT, and it also made changes to the CCA and the FSMA. We have obtained interim permission from the FCA to provide consumer credit and to perform related activities and must apply to become approved for full authorization from the FCA to continue to provide consumer credit, which will require that we satisfy, and continue to satisfy, certain minimum standards set out in the FSMA, which will result in additional costs to us. The FCA is expected to complete the process of reviewing applications for full authorization by April 1, 2016, and there is no guarantee that we will receive full authorization. As a “threshold condition” to full authorization and the current interim permissions that we hold, the FCA must be satisfied that we can be effectively supervised. Our business functions for the United Kingdom have historically been performed remotely from our facilities in the United States. In order to alleviate the FCA’s concerns about effective supervision, we have established an office in the United Kingdom. Furthermore, the FCA must approve certain persons conducting “controlled functions” with respect to the operation and supervision of our U.K. business.
The FCA regulates consumer credit and related activities in accordance with the guidance of the FSMA and the FCA Handbook, which includes prescriptive regulations and carries across many of the standards set out in the CCA and its secondary legislation as well as the Guidance. The FSMA gives the FCA the power to authorize, supervise, examine and bring enforcement actions against providers of consumer credit such as us, as well as to make rules for the regulation of consumer credit. On February 28, 2014, the FCA issued the Consumer Credit Sourcebook, or the CONC, contained in the FCA Handbook; the CONC incorporates prescriptive regulations for lenders such as us, including mandatory affordability checks on borrowers, limiting the number of rollovers to two, restricting how lenders can advertise, banning advertisements it deems misleading, and introducing a limit of two unsuccessful attempts on the use of continuous payment authority (which provides a creditor the ability to directly debit a customer’s account for payment when authorized by the customer to do so) to pay off a loan. Certain provisions of the CONC took effect on April 1, 2014, and other provisions for high cost short-term credit providers such as us, such as the limits on rollovers, continuous payment authority and advertising, took effect on July 1, 2014. Due to the transfer of the consumer credit regime to the FCA, we have made significant modifications to many of our business practices to address the FCA’s requirements. These modifications include adjustments to our affordability assessment practices and underwriting standards that govern who will qualify for a loan from us, reductions in certain maximum loan amounts, alterations to our advertising practices and adjustments to our collections processes (including our practices relating to continuous payment authority) and debt forbearance processes (or our practices regarding customers who have indicated that they are experiencing financial difficulties), all of which we believe will result in a significant year-over-year decrease in our U.K. consumer loan volume, U.K. loan balances and U.K. revenue for the remainder of 2014 and into 2015 as a result of our adapting our U.K. business practices in response to the requirements of the FCA. The implementation of stricter affordability assessments and underwriting standards will result in a decrease in the number of consumer loans written, the average consumer loan amount and the total amount of consumer loans written to new and returning customers. Additionally, the changes we made to our collections and debt forbearance practices in the United Kingdom could result in lower collection rates, and we will experience an increase in compliance- and administrative-related costs for our U.K. operations. In addition, the FCA could require us to make additional changes to our business that could further negatively affect future results for our U.K. operations. We are still assessing the potential impact of the changes we have made and are continuing to make to our U.K. operations and what effect such changes may have on our business, but the impact of these changes is likely to be significant for the balance of 2014 and into 2015 and could result in a material adverse effect on our U.K. business and our prospects, results of operations, financial condition and cash flows.
In addition, on December 18, 2013, the U.K. passed the Financial Services (Banking Reform) Act, which includes an amendment that requires the FCA to introduce rules “with a view to securing an appropriate degree of protection for borrowers against excessive charges” on “high-cost short-term” consumer loans by January 2, 2015. On July 15, 2014, the FCA issued a consultation paper that proposed a cap on the total cost of high-cost
132
Table of Contents
short-term credit and requested comments on the proposal. The consultation paper proposed a maximum rate of 0.8% of principal per day, and the proposal limits the total fees, interest (including post-default interest) and charges (including late fees which are capped at £15) to an aggregate amount not to exceed 100% of the principal amount loaned. The FCA requested comments on the proposal and issued its final rule on November 11, 2014. The final rule was largely the same as the proposed rule except for additional language governing line of credit products and will likely require us to make changes to all of our high-cost short-term products in the United Kingdom. We are still assessing the impact of the final rule and what additional changes to our products will be necessary. The final rule will become effective on January 2, 2015, as required by the 2013 amendment to the FSMA. It is possible that the rule change could have a significant effect on the results of our U.K. operations. The rule change and any changes we make to our U.K. operations as a result of the final rule could have a material adverse effect on our business, prospects, results of operations, financial condition and cash flows.
In the United Kingdom, we are also subject to the requirements of the Data Protection Act 1988, or the DPA, and are required to be fully registered as a data-controller under the DPA. We are also required to be certified under the European Union Safe Harbor provisions, which allow European Union data to be passed to non-European Union countries.
The FCA has stated that previous and upcoming measures regarding the payday loan industry will likely force about a quarter of the firms out of the industry. For recent developments related to the FCA, including serious concerns that have been expressed by the FCA regarding our compliance with U.K. legal and regulatory requirements, such as the requirement that our business be capable of being effectively supervised by the FCA and compliance with FCA rules and principles and our affordability assessment and debt forbearance practices, see “Risk Factors—Risks Related to Our Business and Industry—Our primary regulators in the United Kingdom have expressed and continue to express serious concerns about our compliance with applicable U.K. regulations, which has caused and will continue to cause us to make significant changes to our U.K. business that will negatively impact our operations and results, and this impact will likely be significant,” “—Due to restructuring of the consumer credit regulatory framework in the United Kingdom, we are required to obtain full authorization from our U.K. regulators to continue providing consumer credit and perform related activities in the United Kingdom, and there is no guarantee that we will receive full authorization to continue offering consumer loans in the United Kingdom.,” “—The United Kingdom has imposed, and continues to impose, increased regulation of the short-term high-cost credit industry with the stated expectation that some firms will exit the market,” “—Competition regulators in the United Kingdom are currently reviewing our industry and could order remedial action, which could materially adversely affect our business or even impair our ability to continue our current operations in the United Kingdom.” and “—Many U.K. regulatory matters are subject to increased uncertainty because supervision of the U.K. consumer credit regime has recently been transferred to the FCA, which previously did not hold such authority.”
In June 2013, the OFT referred the payday lending industry in the United Kingdom to the Competition Commission, which is now the Competition & Markets Authority, or the CMA, for a market investigation. The CMA has been gathering data from industry participants, including us, in connection with its review of the U.K. payday lending industry to determine whether certain features of the payday lending industry prevent, restrict or distort competition (which is also referred to as having an adverse effect on competition) and, if so, what remedial action should be taken. On June 11, 2014, the CMA released a provisional findings report in which it indicated that it believes that many payday lenders fail to compete on price and indicated that it will look at potential ways to increase price competition. The CMA also announced the expansion of its review of the payday lending industry to include lead generators. The CMA announced its provisional decision on remedies on October 9, 2014, which include the establishment of independent price comparison websites, requiring more clear upfront disclosure of borrowing costs if a loan is not paid back in full and on time, requiring lenders to assist customers in assessing their own creditworthiness and likelihood of obtaining a loan, requiring periodic account statements to be provided to borrowers and requiring greater transparency about the role played by lead generators. The CMA is required to complete its report by June 26, 2015, although it has stated publicly that it expects to publish its final report in December 2014 or January 2015. If the investigation’s final conclusions indicate that remedial action is necessary for the payday loan industry, the CMA will decide whether to order
133
Table of Contents
such remedial action itself or whether it should recommend certain actions or remedies be taken by the FCA, or other government bodies or organizations.
Furthermore, we are subject to the Bribery Act, which prohibits the giving or receiving of a bribe to any person, including but not limited to public officials, and makes failing to prevent bribery by relevant commercial organizations a criminal offense. This offense applies when any person associated with the organization offers or accepts bribes anywhere in the world intending to obtain or retain a business advantage for the organization or in the conduct of business. The Bribery Act is applicable to businesses that operate in the United Kingdom such as us. The Bribery Act is broader in scope than the U.S. FCPA in that it directly addresses commercial bribery in addition to bribery of government officials and it does not recognize certain exceptions, notably facilitation payments that are permitted by the U.S. FCPA.
In the United Kingdom, we are also subject to specific anti-money laundering and counter terrorist financing requirements that require us to develop and maintain anti-money laundering and counter terrorist financing policies and procedures including reporting suspicious activity to the Serious Organised Crime Agency pursuant to the Proceeds of Crime Act 2002 and the Terrorism Act 2000.
Australia
In Australia, we must comply with the responsible lending guidelines under the National Consumer Credit Protection Act (2010), or the NCCPA, which was amended in 2012. The amendment includes limitations on permissible fees and interest charged on certain consumer loans, including consumer loans made by us. We have altered the product we offer in Australia and expect the product offering will be less profitable. For discussion of the adverse impact that the amendment to the NCCPA may have on our operations in Australia, see “Risk Factors—Risks Related to Our Business and Industry—Our business in Australia has become less profitable due to compliance with new regulations there, and if our new product offering is not sustainable, this could require us to exit the Australian market” and “—We are subject to anticorruption laws including the U.S. Foreign Corrupt Practices Act and the U.K. Bribery Act 2010, anti-money laundering laws and economic sanctions laws, and our failure to comply therewith, particularly as we continue to expand internationally, could result in penalties that could harm our reputation and have a material adverse effect on our business, prospects, results of operations, financial condition and cash flows.”
Canada
In Canada, regulation of the short-term consumer lending industry is conducted at the provincial level. In general, the regulations require lenders to be licensed, set maximum fees, prohibit rollovers and regulate collection practices.
In foreign jurisdictions where we operate, our advertising and marketing activities and disclosures are subject to regulation under various consumer protection laws and other applicable laws and regulations.
Legal Proceedings
On March 8, 2013, Flemming Kristensen, on behalf of himself and others similarly situated, filed a purported class action lawsuit in the U.S. District Court of Nevada against us and other unaffiliated lenders and lead providers. The lawsuit alleges that the lead provider defendants sent unauthorized text messages to consumers on behalf of us and the other lender defendants in violation of the Telephone Consumer Protection Act. The complaint seeks class certification, statutory damages, an injunction against “wireless spam activities,” and attorneys’ fees and costs. We filed an answer to the complaint denying all liability. On March 26, 2014, the Court granted class certification. On October 24, 2014, we filed a motion for summary judgment, and the court has not yet ruled on this motion. Neither the likelihood of an unfavorable ruling nor the ultimate liability, if any, with respect to this matter can be determined at this time, and we are currently unable to estimate a range of reasonably possible losses, as defined by ASC 450-20-20, for this litigation. We believe that the plaintiff’s claims in the complaint are without merit and intend to vigorously defend this lawsuit.
134
Table of Contents
We are also a defendant in certain routine litigation matters encountered in the ordinary course of our business. Certain of these matters are covered to an extent by insurance. In the opinion of management, the resolution of these matters is not expected to have a material adverse effect on our financial position, results of operations or liquidity.
135
Table of Contents
CORPORATE GOVERNANCE AND MANAGEMENT
Executive Officers
The following table sets forth information regarding the individuals who serve as our executive officers.
| NAME |
POSITION WITH ENOVA |
AGE AS OF DECEMBER 1, 2014 | ||
| David A. Fisher |
President & Chief Executive Officer | 45 | ||
| Arad Levertov |
Executive Vice President—Chief Operating Officer | 37 | ||
| Kirk Chartier |
Senior Vice President—Chief Marketing Officer | 51 | ||
| Alex T. King |
Senior Vice President—Operations | 42 | ||
| Robert S. Clifton |
Vice President—Chief Financial Officer and Treasurer | 51 | ||
| Joseph DeCosmo |
Vice President—Chief Analytics Officer | 49 | ||
| Sean Rahilly |
Vice President—Chief Compliance Officer | 41 | ||
| Daniel Shteyn |
Vice President—Operations | 45 | ||
| Lisa M. Young |
Vice President—General Counsel & Secretary | 48 |
There are no family relationships among any of the officers named above. Each officer of Enova holds office from the date of election until removal or termination of employment with Enova. Set forth below is additional information regarding the executive officers identified above.
David A. Fisher has served as our President and Chief Executive Officer since March 29, 2013. Mr. Fisher served as our Chief Executive Officer since January 29, 2013 when he joined Enova. Mr. Fisher has also served as our Director since February 11, 2013. Prior to joining the Company, Mr. Fisher was Chief Executive Officer of optionsXpress Holdings, Inc., or optionsXpress, from October 2007 until The Charles Schwab Corporation, or Schwab, acquired the business in September 2011. Following the acquisition, Mr. Fisher served as President of optionsXpress until March 2012. Mr. Fisher also served as the President of optionsXpress from March 2007 to October 2007 and as the Chief Financial Officer of optionsXpress from August 2004 to March 2007. Prior to joining optionsXpress, Mr. Fisher served as Chief Financial Officer of Potbelly Sandwich Works from February 2001 to July 2004, and before that in the roles of Chief Financial Officer and General Counsel for Prism Financial Corporation. In addition, Mr. Fisher has served on the Board of Directors of InnerWorkings, Inc., since November 2011 and has served on the Board of Directors of GrubHub, Inc. since May 2012. Mr. Fisher also served on the Boards of Directors of optionsXpress from October 2007 until September 2011 and CBOE Holdings, Inc. from January 2007 until October 2011. Mr. Fisher received a Bachelor of Science degree in Finance from the University of Illinois and a law degree from Northwestern University School of Law.
Arad Levertov has served as our Executive Vice President—Chief Operating Officer since October 14, 2014, and from January 2014 through October 14, 2014, he served as our Senior Vice President—Operations. Mr. Levertov joined Enova in June 2010 as a U.K. Strategy and Operations Senior Associate and served as our Vice President—Operations from November 2011 until January 2014. From August 2005 to June 2008, Mr. Levertov worked as a production manager at Intel Corporation. From August 2003 to August 2005, Mr. Levertov was a systems developer for Intel Corporation. Prior to that, Mr. Levertov served in the Israel Defense Forces. Mr. Levertov received a Bachelor of Science degree in Industrial Engineering and Management from Ben-Gurion University and a Master of Business Administration from Duke University.
Kirk Chartier has served as our Senior Vice President—Chief Marketing Officer since he joined Enova in April 2013. Prior to joining Enova, Mr. Chartier was the Executive Vice President & Chief Marketing Officer of optionsXpress Holdings from January 2010 until Schwab acquired the business in September 2011. Following the acquisition, Mr. Chartier served as Vice President of Schwab through May 2012. From 2004 to 2010, Mr. Chartier was the Senior Managing Principal and Business Strategy Practice Leader for the Zyman Group, a
136
Table of Contents
marketing and strategy consultancy owned by MDC Partners, where he also served in interim senior marketing executive roles for Fortune 500 companies, including Safeco Insurance. Mr. Chartier has held executive roles at technology companies including as Senior Vice President of Business Services & eCommerce for CommerceQuest, as Vice President of Online Marketing & Strategy for THINK New Ideas and as a Corporate Auditor for the General Electric Company. He started his career as a combat pilot with the U.S. Marine Corps and is a veteran of Desert Storm. Mr. Chartier received a Master in Business Administration from Syracuse University, a Bachelor of Arts in Economics from the College of the Holy Cross, and a Bachelor of Science in Engineering from Worcester Polytechnic Institute.
Alex T. King has served as our Senior Vice President—Operations since September 2011. Mr. King joined Enova (then known as CashNetUSA) in September 2006 as Director of Program/Product Management. Mr. King served as Vice President—Program Management from September 2007 to July 2008 and Vice President—United Kingdom Operations from July 2008 to August 2011, when he became Senior Vice President—Operations. From January 2004 to September 2006, Mr. King was involved in the management of a start-up company and responsible for preparation of the business plan, raising start-up capital and managing operations. Prior to that, Mr. King was a consultant for McKinsey & Company and a Commercial Lending Officer with DBS Bank in Singapore. Mr. King received a Bachelor of Science degree in Business Administration, with a dual major in finance and economics, from the University of Florida and a Master of Business Administration from The University of Chicago.
Robert S. Clifton has served as our Vice President—Chief Financial Officer and Treasurer since July 2014. Mr. Clifton joined Enova in December 2011 as Vice President—Accounting. From February 2011 until November 2011, Mr. Clifton served as Vice President—Accounting of Ignite Restaurant Group, Inc., operator of Joe’s Crab Shack and Brick House Tavern + Tap restaurant brands. Prior to that, Mr. Clifton served as Senior Vice President—Operations Development—Retail Services Division for Cash America from January 2009 until July 2010. He served as Cash America’s Senior Vice President—Finance—Retail Services Division from October 2007 until January 2009 and as Vice President—Corporate Development and Strategic Activities from September 2005 until October 2007. Mr. Clifton also held multiple positions in Cash America’s accounting department from the time he joined Cash America in December 1991 until September 2005. Mr. Clifton began his career with Coopers & Lybrand and is a certified public accountant. Mr. Clifton received a Bachelor of Business Administration degree in Accounting from Texas Christian University and a Master of Business Administration from Southern Methodist University.
Joseph DeCosmo has served as our Vice President—Chief Analytics Officer since joining Enova in January of 2014. Prior to joining Enova, from October 2012 until January 2014, Mr. DeCosmo served as a Director of West Monroe Partners, a management and technology consulting firm, where he led their Advanced Analytics practice. From September 2011 until October 2012, Mr. DeCosmo was Vice President of Analytics for HAVI Global Solutions located in suburban Chicago. Mr. DeCosmo also served as Executive Vice President of Analytics and Consulting Services for The Allant Group from 2005 to September 2011. Prior to The Allant Group, Mr. DeCosmo founded and led an independent analytics firm called DeCosmo and Associates from 1995 to 2005, when the business was acquired by The Allant Group. Mr. DeCosmo began his career in 1987 at Argonne National Laboratory, spent three years in regulatory and business research at Illinois Bell, and three years at Donnelley Marketing. Mr. DeCosmo is a current board member and President-Elect of the Chicago Chapter of the American Statistical Association, a Past-President of The Chicago Association of Direct Marketing, and a member of the Advisory Board of the University of Illinois at Chicago’s College of Business Administration. Mr. DeCosmo holds a Bachelor of Arts in Economics from Lewis University and a Master of Arts in Economics from The University of Illinois at Chicago.
Sean Rahilly has served as our Vice President—Chief Compliance Officer since joining Enova in October 2013. Mr. Rahilly previously served as Assistant General Counsel and Compliance Officer of First American Bank from September 2006 to September 2013. He also served as First American Bank’s Vice President—Community Reinvestment Act and Compliance Officer from January 2006 to September 2006, Vice President—Compliance Manager from November 2003 to January 2006 and Assistant Vice President—Compliance and Community
137
Table of Contents
Reinvestment Act from July 2002 to November 2003. Prior to joining First American Bank, Mr. Rahilly served as an attorney with the Law Offices of Victor J. Cacciatore, a project assistant with Schiff Hardin & Waite and in various roles with Pullman Bank and Trust Company. He received a Bachelor of Science in Accountancy from DePaul University College of Commerce and a Juris Doctor from DePaul University College of Law.
Daniel Shteyn has served as our Vice President—Operations since September 2011. Mr. Shteyn joined Enova (then known as CashNetUSA) in October 2009 as Senior Director—Canadian Operations, became responsible for Australian Operations in May 2010 and became Vice President in July 2011. From September 2008 to February 2009, Mr. Shteyn was a partner at Morgan Geare, a boutique Canadian merchant bank. From May 2005 until September 2008, Mr. Shteyn worked as an equity research analyst with Desjardins Securities Inc., a Canadian full-service investment dealer. Prior to that, Mr. Shteyn was an investment banker with TD Securities Inc., the investment banking arm of TD Bank Financial Group. Mr. Shteyn is a member of the Order of Chartered Professional Accountants of Québec, and he received a Bachelor of Commerce, a Graduate Diploma in Public Accountancy and a Master of Business Administration from McGill University in Montréal, Québec, Canada.
Lisa M. Young has served as our Vice President—General Counsel and Secretary since September 2011. Ms. Young joined Enova (then known as CashNetUSA) in June 2009 as General Counsel and became Vice President—General Counsel in August 2011. Ms. Young previously served as Vice President—Assistant General Counsel of JPMorgan Chase following the merger of Bank One and JPMorgan Chase in July 2004, and she served in this position until she joined us in 2009. From May 2003 to June 2004, she served as Senior Counsel with Bank One. Prior to joining Bank One, Ms. Young served as an attorney in the Consumer Financial Services Litigation practice groups of McGuireWoods LLP and Lovells LLP (currently known as Hogan Lovells US LLP) and as a litigation attorney at Goldberg Kohn Ltd. She received a Bachelor of Science degree in Electrical Engineering from the University of Notre Dame and a Juris Doctor from Northwestern University.
Board of Directors
The following table sets forth information with respect to our Board of Directors.
| NAME |
AGE AS OF |
|||
| Daniel R. Feehan |
63 | |||
| David A. Fisher |
45 | |||
| William M. Goodyear |
66 | |||
| James A. Gray |
49 | |||
| David C. Habiger |
45 | |||
| Gregg A. Kaplan |
44 | |||
| Mark A. Tebbe |
53 | |||
Set forth below is additional information regarding the directors identified above, as well as a description of the specific skills and qualifications they provide our Board of Directors.
Daniel R. Feehan has been on our Board of Directors since September 13, 2011. Mr. Feehan has served as the Chief Executive Officer and President of Cash America since February 2000. He served as Cash America’s President and Chief Operating Officer from January 1990 until February 2000, except that he served as Chairman and Co-Chief Executive Officer of one of Cash America’s subsidiaries from February 1998 to February 1999 before returning to the position of President and Chief Operating Officer of Cash America. Mr. Feehan joined Cash America in 1988, serving as its Chief Financial Officer before becoming President and Chief Operating Officer in 1990. Mr. Feehan currently serves as a director at Cash America, AZZ incorporated and RadioShack Corporation where he has served since 1984, 2000 and 2003, respectively. Mr. Feehan has announced his intent to retire from the role of President and Chief Executive Officer of Cash America at the end of April 2015 and his intent to remain on the Cash America Board of Directors following his retirement. Mr. Feehan received a
138
Table of Contents
Bachelor of Business Administration degree in Accounting from Texas A&M University. We believe Mr. Feehan’s qualifications to sit on our board of directors include, among other things, his leadership experience, specifically his experience as Chief Executive Officer of Cash America, his knowledge of the consumer finance industry and its regulatory environment, his experience and background in finance and accounting and his experience as a director of multiple publicly traded companies, which has given him a strong understanding of public company corporate governance.
Mr. Feehan will serve on our Board of Directors for an initial period not to exceed two years from the date of the distribution so that we can rely on his industry experience, leverage his relationships with banking and regulatory groups and to provide a sense of business continuity. Mr. Feehan will be eligible to continue to serve on our Board of Directors after the expiration of this initial two year period if at that time Mr. Feehan is no longer serving as an executive officer of Cash America.
David A. Fisher has served as our Chief Executive Officer since January 29, 2013 when he joined Enova. Mr. Fisher became our Chief Executive Officer and President on March 29, 2013. Mr. Fisher has also served as our Director since February 11, 2013. We believe Mr. Fisher’s qualifications to sit on our board of directors include, among other things, his leadership experience, specifically his experience as Chief Executive Officer of the Company and of optionsXpress, his knowledge of the consumer finance industry and his experience in leading highly-regulated international companies gained through his tenure at the Company and at optionsXpress, his experience and background in finance, legal and compliance matters, and his experience as a director of multiple companies, which has given him a strong understanding of public company corporate governance.
William M. Goodyear has been on our Board of Directors since October 1, 2014. Mr. Goodyear currently serves as a director for Exterran Holdings, Inc., a natural gas compression products and services company, where he has served since April 2013. Mr. Goodyear served as Executive Chairman of the Board and as a director of Navigant Consulting, Inc., a specialized global consulting firm, from 2000 and 1999, respectively, until he retired from each position in April 2014 and May 2014, respectively. Mr. Goodyear served as Chief Executive Officer of Navigant from May 2000 through March 2012. Prior to 1999, Mr. Goodyear served as Chairman and Chief Executive Officer of Bank of America Illinois and was President of Bank of America’s Global Private Bank. Mr. Goodyear also held a variety of assignments with Continental Bank, subsequently Bank of America, including corporate finance, corporate lending, trading and distribution, and was stationed in London for five years of his tenure to manage Continental Bank’s European and Asian Operations. Mr. Goodyear also served as a director, including as the Vice Chairman of the Board of Directors, of Continental Bank from 1991 through 1994. Mr. Goodyear is a trustee and member of the Executive Committee of the Board of Trustees for the Chicago Museum of Science and Industry and a member of the Board of Trustees of the University of Notre Dame and serves on the Rush University Medical Center Board, where he is Chairman and a member of the Executive Committee and Chair of the Finance Committee. Mr. Goodyear received a Master’s degree in Business Administration, with Honors, from the Amos Tuck School of Business at Dartmouth College, and a Bachelor’s degree in Business Administration, with Honors, from the University of Notre Dame. We believe Mr. Goodyear’s qualifications to sit on our board of directors include, among other things, his experience in the finance industry, including his domestic and international experience and his regulatory knowledge of the industry, his executive leadership experience, and his experience as a director of other publicly-traded companies, which has given him a strong understanding of public company corporate governance and financial reporting and business controls.
James A. Gray has been on our Board of Directors since October 1, 2014. Mr. Gray is Chief Executive Officer of G-Bar Limited Partnership, an independent proprietary options and futures trading firm, and he has served in that position since 1996. Mr. Gray has held various positions with G-Bar Limited Partnership since 1987. Mr. Gray was a cofounder and served as the Chairman of the Board of optionsXpress from 2000 through 2012. Mr. Gray holds a Bachelor of Science degree in Finance and Economics from the University of Iowa. We believe Mr. Gray’s qualifications to sit on our board of directors include, among other things, his service as Chairman of the Board of optionsXpress, formerly a publicly-traded company, his entrepreneurial and executive leadership experience in growing businesses, and his knowledge and experience in the technology industry.
139
Table of Contents
David C. Habiger has been on our Board of Directors since October 1, 2014. Mr. Habiger is a senior advisor to Silver Lake Partners and a venture partner at the Pritzker Group, where he has served since January 2013. From June 2011 to July 2012, Mr. Habiger served as Chief Executive Officer of NDS Group Ltd., a provider of video software and content security solutions that was acquired by Cisco Systems. Mr. Habiger served in various roles at Sonic Solutions, a digital media software company, from 1992 to 2011, most recently as President and Chief Executive Officer from 2005 to 2011. Mr. Habiger also served as a director of Sonic Solutions from October 2010 through March 2011. Mr. Habiger has served as a member of the board of directors of Immersion Corporation, a company that develops, licenses, and markets digital touch technology and products, since September 2014, DTS, Inc., an audio solutions provider, since March 2014, Control4 Corp, a provider of personalized automation and control solutions, since 2012, Echo Global Logistics, Inc., a provider of technology-enabled transportation and supply chain management solutions, since 2012, Textura Corporation, a software company for the commercial construction industry, since 2012, and RealD Inc., a 3D and other visual technologies company, since 2011. Mr. Habiger also serves on the board of directors of several private companies. Mr. Habiger holds a Master’s degree in Business Administration from the University of Chicago and a Bachelor’s degree in Business Administration from St. Norbert College. We believe Mr. Habiger’s qualifications to sit on our board of directors include, among other things, his service as a director on other public company boards, which has given him a strong understanding of public company corporate governance and financial reporting and business controls, his executive leadership experience and his experience in and knowledge of the technology industry.
Gregg A. Kaplan has been on our Board of Directors since October 1, 2014. Mr. Kaplan is currently an Advisor at Hyde Park Venture Partners, where he has served since March 2013. Mr. Kaplan served as President and Chief Operating Officer of Coinstar, Inc. from April 2009 through March 2013. Prior to that, Mr. Kaplan served as Chief Executive Officer of Redbox Automated Retail, LLC, or Redbox, from December 2005 to March 2009. Mr. Kaplan served as senior director of strategy for McDonald’s Corporation from 2002 to 2005 and as director of strategy from 2001 to 2002, and he led the Redbox venture while it was part of McDonald’s Corporation. Mr. Kaplan was a partner in Divine interVentures, a venture capital group specializing in business-to-business exchanges and infrastructure software opportunities, from 1999 to 2001, and Mr. Kaplan also served as director of interactive marketing for Streamline.com, a web-based grocery delivery company, from 1996 to 1999. Mr. Kaplan received a Master’s degree in Business Administration from Harvard Business School and a Bachelor’s degree in Philosophy from the University of Michigan. We believe Mr. Kaplan’s qualifications to sit on our board of directors include, among other things, his leadership experience as an executive officer of a publicly traded company, his experience expanding and running a high-growth company and his business acumen and strategic insight.
Mark A. Tebbe has been on our Board of Directors since October 1, 2014. Mr. Tebbe currently serves as an Adjunct Professor of Entrepreneurship at University of Chicago’s Booth School of Business where he has served since 2011. Mr. Tebbe also currently serves as an operating executive for Lake Capital, a private equity firm, where he has served since 2008. Prior to his association with Lake Capital, Mr. Tebbe was the founder and chairman of Techra Networks, a consulting firm that assists companies in better leveraging technology to enhance their business results, where he worked from 2002 to 2008. Mr. Tebbe founded Answers Corporation, a company that owns and operates advertising-supported public websites and was listed on the NASDAQ, in 2005 and served as a director from 1998 until the company was sold to a portfolio company of Summit Partners in 2011. From 1984 to 2002, Mr. Tebbe served as Chairman of Lante Corporation, a technology consulting firm he founded. Mr. Tebbe graduated with a Bachelor of Science degree in Computer Science from the University of Illinois at Urbana/Champaign. Mr. Tebbe has been a consultant to executive management of many leading companies including American Express, Dell and Microsoft as well as non-profit organizations such as National Park Service, United Nations and World Economic Forum. We believe Mr. Tebbe’s qualifications to sit on our board of directors include, among other things, his service as a director on other public company boards, which has given him a strong understanding of public company corporate governance and financial reporting and business controls, his extensive entrepreneurial background and his many years of senior management experience in the technology industry.
140
Table of Contents
Director Independence
Our common stock is listed on the NYSE. Under the rules of the NYSE, independent directors must comprise a majority of our Board of Directors within a specified period following the completion of the distribution. In addition, the rules of the NYSE require that, subject to specified exceptions, each member of a listed company’s audit, compensation, and nominating and governance committees must be independent within a specified period following the completion of the distribution. Audit committee members must also satisfy the independence criteria set forth in Rule 10A-3 under the Securities Exchange Act of 1934, as amended, or Exchange Act. Under the rules of the NYSE, a director will only qualify as an “independent director” if, in the opinion of that company’s Board of Directors, that person does not have a relationship that would interfere with the exercise of independent judgment in carrying out the responsibilities of a director. In order to be considered independent for purposes of Rule 10A-3, a member of an audit committee of a listed company may not, other than in his or her capacity as a member of the audit committee, the Board of Directors, or any other board committee: (1) accept, directly or indirectly, any consulting, advisory, or other compensatory fee from the listed company or any of its subsidiaries; or (2) be an affiliated person of the listed company or any of its subsidiaries. Each member of our management development and compensation committee, or the Compensation Committee, must also qualify as a “non-employee director” as defined in Rule 16b-3 under the Exchange Act and as an “outside director” as defined for purposes of Section 162(m) of the Code, or Section 162(m).
Our Board of Directors has determined that none of Messrs. Goodyear, Gray, Habiger, Kaplan and Tebbe, representing five (5) of our seven (7) directors, has a relationship that would interfere with the exercise of independent judgment in carrying out the responsibilities of a director and that each of these directors is “independent” as that term is defined under the rules of the NYSE. Our Board of Directors also determined that each of Messrs. Goodyear (chair), Gray and Tebbe, who comprise our audit committee, Messrs. Habiger (chair), Kaplan and Tebbe, who comprise our Compensation Committee, and Messrs. Goodyear, Gray (chair), Habiger, Kaplan and Tebbe, who comprise our nominating and governance committee, satisfy the independence standards for those committees established by the rules of the NYSE and applicable SEC rules. In making these determinations, our Board of Directors considered the relationships that each non-employee director has with our company and all other facts and circumstances our Board of Directors deemed relevant in determining their independence, including the beneficial ownership of our capital stock by each non-employee director.
Board Leadership Structure
The Board of Directors is responsible for establishing and maintaining the most effective leadership structure for Enova. To retain flexibility in carrying out this responsibility, our Corporate Governance Guidelines provide that the roles of Chairman of the Board, or the Chairman, and Chief Executive Officer, or CEO, may be separated or combined.
Our Board of Directors has appointed Mr. Fisher as our CEO and Chairman. In addition, our Board of Directors appointed Mr. Gray to serve as the presiding outside director, and Mr. Gray is also the chair of the nominating and corporate governance committee.
The presiding outside director’s responsibilities include:
| • | presiding over all meetings of the Board of Directors at which the Chairman is not present, including executive sessions of the independent directors; |
| • | communicating to the Chairman feedback from executive sessions as appropriate; |
| • | serving as liaison between senior management and the Board of Directors; |
| • | reviewing Board of Directors and committee agendas and schedules to confirm that appropriate topics are reviewed and sufficient time is allocated to each; |
| • | calling meetings of the independent directors, if desired; |
141
Table of Contents
| • | supervising the Board of Director’s determination of the independence of its directors; and |
| • | such other responsibilities as the independent directors may designate from time to time. |
The Board of Directors combined the role of Chairman and CEO, coupled with a presiding outside director. We believe that this is the leadership structure that will best serve our stockholders, in light of our separation from Cash America, by promoting strong and consistent leadership for our company as we transition from being a wholly-owned subsidiary of Cash America to becoming a stand-alone new public company. The combined role enables a single voice setting the tone and having primary responsibility for the management of our company during this important transition period and beyond. As a new public company, our CEO is the person most familiar with our business and is in the best position to effectively identify strategic priorities and opportunities, leading the Board of Directors in the discussion of the execution of our strategy and facilitating the flow of information between the Board of Directors and management.
We believe that the designation of a presiding outside director with substantive responsibilities, a board comprised of a majority of members who are independent directors and our strong corporate governance policies and procedures achieves the appropriate balance for the combined role of Chairman and CEO.
The Board of Directors will regularly review its leadership structure and will take into account the responsibilities of the leadership positions and the directors qualified to hold such positions. In conducting this review, the Board of Directors will consider, among other things: (i) the policies and practices in place that provide independent board oversight; (ii) our performance and the effect a particular leadership structure may have on that performance; (iii) the structure that serves the best interests of our stockholders and (iv) any relevant legislative or regulatory developments.
Risk Management and Oversight
Our full Board of Directors oversees our risk management process. Our Board of Directors oversees a company-wide approach to risk management, carried out by our management. Our full Board of Directors determines the appropriate risk for us generally, assesses the specific risks faced by us, and reviews the steps taken by management to manage those risks.
While the full Board of Directors maintains the ultimate oversight responsibility for the risk management process, its committees oversee risks in certain specified areas. In particular, our Compensation Committee is responsible for overseeing the management of risks relating to our executive compensation plans and arrangements, and the incentives created by the compensation awards it administers. Our audit committee oversees management of enterprise risks as well as financial and regulatory compliance risks. Effective upon the listing of our common stock on the NYSE, our nominating and corporate governance committee will be responsible for overseeing the management of risks associated with the independence of our Board of Directors. Pursuant to our Board of Directors’ instruction, management regularly reports on applicable risks to the relevant committee or the full Board of Directors, as appropriate, with additional review or reporting on risks conducted as needed or as requested by our board and its committees.
Qualification of Directors
Our Board of Directors consists of individuals with appropriate skills and experiences to meet board governance responsibilities and contribute effectively to our company. Under its charter, the Nominating and Governance Committee will seek to ensure the Board of Directors reflects a range of talents, ages, skills, diversity and expertise, particularly in the areas of accounting and finance, management, domestic and international markets, governmental/regulatory matters, leadership and e-commerce industries, sufficient to provide sound and prudent guidance with respect to our operations and interests. Our Board of Directors will seek to maintain a diverse membership, but does not have a separate policy on diversity.
142
Table of Contents
Committees of the Board of Directors
Our Board of Directors has established an audit committee, a Compensation Committee, and a nominating and corporate governance committee, each of which operates pursuant to a charter that was adopted by our Board of Directors on October 14, 2014. The charters for each committee of our Board of Directors are available on our website at http://ir.enova.com. Information on, or accessible through, our websites is not part of this prospectus. The composition and functioning of all of our committees comply with all applicable requirements of the Sarbanes-Oxley Act of 2002, the requirements of the NYSE and SEC rules and regulations.
Audit Committee
The primary responsibilities of our audit committee are to oversee the accounting and financial reporting processes of our company as well as our affiliated and subsidiary companies, and to oversee the internal and external audit processes. The audit committee also assists the Board of Directors in fulfilling its oversight responsibilities by reviewing the financial information that is provided to stockholders and others, and the system of internal controls which management and the Board of Directors have established. The audit committee oversees the independent auditors, including their independence and objectivity. In addition, our internal audit and compliance functions report directly to the audit committee. Audit committee members are not acting as professional accountants or auditors, and their functions are not intended to duplicate or substitute for the activities of management and the independent auditors. The audit committee is empowered to retain independent legal counsel and other advisors as it deems necessary or appropriate to assist the audit committee in fulfilling its responsibilities, and to approve the fees and other retention terms of the advisors.
Compensation Committee
The primary responsibilities of our Compensation Committee are to periodically review and approve the compensation and other benefits for our employees, officers and independent directors, including reviewing and approving corporate goals and objectives relevant to the compensation of our Chief Executive Officer and our other executive officers in light of those goals and objectives, setting compensation for these officers based on those evaluations and reviewing the succession planning for our executive officers. Our Compensation Committee also administers and has discretionary authority over the issuance of stock awards under our stock compensation plans.
Nominating and Corporate Governance Committee
Our nominating and corporate governance committee oversees all aspects of our corporate governance functions. The nominating and corporate governance committee is responsible for, among other things, assisting our Board of Directors in identifying prospective director nominees and recommending nominees for each annual meeting of stockholders to the Board of Directors (the first of which will occur in 2016), reviewing developments in corporate governance practices and developing and recommending governance principles applicable to our Board of Directors, overseeing the evaluation of our Board of Directors, overseeing our related party transaction policy, and recommending members for each board committee to our Board of Directors.
Director Compensation
We provide competitive compensation to our directors who are not employed by us, or non-employee directors, that enables us to attract and retain high quality directors, provide them with compensation at a level that is consistent with our compensation objectives and encourage their ownership of our stock to further align their interests with those of our stockholders. Our directors who are full-time employees of us receive no additional compensation or stock awards for service on our board of directors, although we may reimburse them for travel and other expenses. While Mr. Feehan is an employee of Cash America, Mr. Feehan is not an employee of Enova and is compensated as a non-employee director. We pay an annual retainer fee of $50,000 to each non-employee
143
Table of Contents
director. Messrs. Feehan, Goodyear, Gray, Habiger, Kaplan and Tebbe will each receive $12,500 for their service on our board of directors for the months of October, November and December of 2014. We pay an annual retainer fee of $25,000 to the non-employee director chairs of each of the audit committee and Compensation Committee and to the independent director serving as the presiding outside director, and we also pay an annual retainer fee of $10,000 to the non-employee director chair of the nominating and corporate governance committee. These retainers will be paid in quarterly installments on the date of each regularly scheduled quarterly board meeting and may be payable in cash or vested shares of our common stock.
Non-employee directors will each receive an annual grant of restricted stock units. The first grant will be made 30 days following the distribution date, will have a value of $100,000 and will vest twelve months from the grant date. The number of restricted stock units to be granted following the distribution date will be determined based on the average closing price of our stock during the period starting with the first trading date of our stock, which will be the distribution date, and ending with the closing price on the day before the grant date. Our annual restricted stock unit grants to our non-employee directors will be made on or shortly following the date of each annual meeting of stockholders. The number of restricted stock units for our annual grants will be based upon the fair market value of our common stock on the date immediately preceding the grant date.
Decision-Making Process to Determine Director Compensation
Director compensation will be reviewed annually by the Compensation Committee with the assistance of such third-party consultants as the Compensation Committee deems advisable, and will be set by action of our Board of Directors. Following the distribution, we may re-evaluate and, if appropriate, adjust the retainers and stock awards granted to directors as compensation in order to ensure that our director compensation is commensurate with that of similarly situated public companies.
Executive Compensation
Our executive compensation program is described in “Executive Compensation” and “Compensation Discussion and Analysis” included elsewhere in this prospectus.
Corporate Governance Guidelines
Our Board of Directors has adopted corporate governance guidelines to assist the board in the exercise of its duties and responsibilities and to serve the best interests of us and our stockholders. A copy of this policy is available on our website at http://ir.enova.com. Information on, or accessible through, our websites is not part of this prospectus. These guidelines, which provide a framework for the conduct of the board’s business, provide, among other things, that:
| • | directors are responsible for attending board meetings and meetings of committees on which they serve and to review in advance of meetings material distributed for such meetings; |
| • | the board’s principal responsibility is to oversee and direct our management; |
| • | at least a majority of the board shall be independent directors; |
| • | our nominating and corporate governance committee is responsible for nominating members for election to our Board of Directors and will consider candidates submitted by stockholders; |
| • | our Board of Directors believes that it is important for each director to have a financial stake in us to help align the director’s interests with those of our stockholders; |
| • | our directors may serve on other public company boards, but our Board of Directors expects that each member be fully committed to devoting adequate time to his or her duties to us; |
| • | the independent directors meet in executive session on a regular basis, but not less than quarterly; |
| • | each of our audit committee, Compensation Committee, and nominating and corporate governance committee must consist solely of independent directors; |
144
Table of Contents
| • | our Compensation Committee must consist solely of “outside directors” as defined for purposes of Section 162(m); |
| • | new directors participate in an orientation program and all directors are required to periodically attend, at our expense, continuing educational programs to further their understanding of our business and enhance their performance on our board; and |
| • | our Board of Directors and its committees will sponsor annual self-evaluations to determine whether members of the board are functioning effectively. |
Code of Business Conduct and Ethics
Our Board of Directors has adopted a code of business conduct and ethics that applies to all of our employees, officers, and directors, including our CEO, chief financial officer, and those officers responsible for financial reporting. The code of business conduct and ethics is available on our website at http://ir.enova.com. Information on, or accessible through, our websites is not part of this prospectus. We expect that any amendments to the code, or any waivers of its requirements, will be disclosed on our website.
Compensation Committee Interlocks and Insider Participation
During the fiscal year ended December 31, 2013, we did not have a compensation committee. However, the Cash America Compensation Committee served that function with respect to our executive compensation. Now that we are a separate stand-alone public company, decisions regarding the compensation of our executive officers will be made by our Compensation Committee. See “Compensation Discussion and Analysis” included elsewhere in this prospectus.
Communications with the Board of Directors
Stockholders and interested parties may write or call our Board of Directors by contacting our Corporate Secretary as provided below:
| Mailing Address: |
Enova International, Inc. 200 West Jackson Blvd., Suite 2400 Chicago, Illinois 60606 Attention: General Counsel & Secretary | |
| Phone Number: | (312) 568-4200 | |
Relevant communications will be distributed to the Board of Directors or to any individual director or directors, as appropriate, depending on the facts and circumstances outlined in the communication. In that regard, certain items unrelated to the duties and responsibilities of the Board of Directors will be excluded, such as: business solicitations or advertisements; junk mail and mass mailings; new product suggestions; product complaints; product inquiries; resumes and other forms of job inquiries; spam; and surveys. In addition, material that is unduly hostile, threatening, illegal or similarly unsuitable may be excluded. Any communication that is filtered out will be made available to any outside director upon request.
145
Table of Contents
Our named executive officers include the following:
| Name |
Position | |
| David A. Fisher (1) |
President and Chief Executive Officer (Principal Executive Officer) | |
| Robert S. Clifton |
Vice President—Chief Financial Officer and Treasurer (Principal Financial and Accounting Officer) | |
| Arad Levertov |
Executive Vice President—Chief Operating Officer | |
| Alex T. King |
Senior Vice President—Operations | |
| Daniel Shteyn |
Vice President—Operations | |
| Timothy S. Ho (2) |
Former President (Former Principal Executive Officer) |
| (1) | Mr. Fisher joined Enova on January 29, 2013. |
| (2) | Mr. Ho left Enova on March 29, 2013. |
These individuals are our principal executive officer, our principal accounting/financial officer and our three (3) most highly compensated executive officers (other than our principal executive officer and principal accounting/financial officer) and our former principal executive officer. For purposes of the executive compensation discussion in this prospectus, we refer to these individuals collectively as our “named executive officers.” References in this prospectus to Cash America’s named executive officers refer to the executive officers listed in the summary compensation table of Cash America’s proxy statement in connection with its 2014 annual meeting of shareholders.
146
Table of Contents
COMPENSATION DISCUSSION AND ANALYSIS
Overview of Compensation Program
Prior to the separation and distribution, we operated as the E-Commerce Division of Cash America, or the E-Commerce Division; therefore, the historical compensation of our named executive officers included in this prospectus reflects the design and objectives of the executive compensation programs of Cash America that were ultimately overseen by the Cash America Compensation Committee. Now that we are a separate stand-alone public company, our Compensation Committee will oversee our executive compensation policies and practices and will seek to ensure that our executive officers’ total compensation is fair, reasonable and competitive. For more information about our Compensation Committee, its authority and responsibilities, see “Corporate Governance and Management—Committees of the Board of Directors—Compensation Committee” in this prospectus.
This Compensation Discussion and Analysis describes how Cash America’s compensation program is designed and how it has historically operated with respect to our named executive officers. This Compensation Discussion and Analysis also describes how we anticipate our compensation program will be designed and how it will operate after the separation and distribution.
2013 Compensation
Letter Agreement with Mr. Fisher.
In connection with Mr. Fisher’s appointment as Chief Executive Officer—E-Commerce Division, Cash America entered into a letter agreement with Mr. Fisher, or the Fisher Letter Agreement, when he joined Enova on January 29, 2013. The Fisher Letter Agreement set forth Mr. Fisher’s employment and compensation package and was not an employment agreement. Mr. Fisher’s 2013 compensation package, which was established in accordance with the Fisher Letter Agreement, is detailed below under “2013 Compensation” and in the compensation tables that follow. In connection with the separation and distribution, Mr. Fisher’s Letter Agreement was terminated, as he is no longer an executive officer of Cash America.
Retention Bonus Agreement with Mr. King.
On December 30, 2013, we entered into a retention bonus agreement, or the Retention Bonus Agreement, with Mr. King. The Retention Bonus Agreement provides Mr. King with the opportunity to receive retention bonuses over a three-year period in the aggregate amount of $700,000. The retention bonuses vest and become payable as follows: $233,334 on December 31, 2013; $233,333 on December 31, 2014 and $233,333 on December 31, 2015. Each portion of the retention bonuses will vest if Mr. King remains employed through the applicable vesting date or if he (i) is involuntarily terminated without cause, (ii) voluntarily terminates his employment for good reason, (iii) dies or (iv) becomes disabled prior to the applicable vesting date.
Cash America Severance Agreements and Severance Pay Plan.
Prior to 2013, Cash America entered into Executive Change-in-Control Severance Agreements with certain of its executive officers, including Mr. Ho (whose agreement terminated when he left Enova in March 2013). Cash America entered into such an agreement with Mr. Fisher when he joined Enova in January 2013 (and his agreement with Cash America was terminated in connection with the separation and distribution). These agreements were designed to promote stability and continuity of senior management in the event of a potential change-in-control of Cash America.
In addition, Cash America has a Severance Pay Plan for Executives that covered our named executive officers prior to the separation and distribution. While severance agreements are generally handled on a case-by-case basis and are subject to the discretion of Cash America’s Chief Executive Officer and the Cash America Compensation Committee, the Severance Pay Plan for Executives provides compensation guidance in the case of involuntary termination of our executive officers.
147
Table of Contents
Information about payments that could have been made to Mr. Fisher and our other named executive officers prior to the separation and distribution upon termination or a change-in-control of Cash America is provided under the heading “Potential Payments Upon Termination or Change-in-Control.”
Continued Employment and Separation Agreement for Mr. Ho.
On January 29, 2013, we entered into an agreement with Mr. Ho detailing the terms of his continued employment through the date of his separation, which occurred on March 29, 2013, and his separation, or the Continued Employment and Separation Agreement. The Continued Employment and Separation Agreement was to provide Mr. Ho with two years of base salary continuation to be paid through March 2015 in the aggregate amount of $860,000 (before any applicable withholding), two years of medical benefits and a lump sum cash payment of $24,808 to cover vacation pay less the value of any vacation taken prior to his separation date. The Continued Employment and Separation Agreement included certain releases and non-disclosure, non-solicitation and non-competition covenants, among other terms and conditions. When Mr. Ho left Enova on March 29, 2013, all of his outstanding short- and long-term incentive awards expired and/or were forfeited on that date.
On January 7, 2014, we entered into a letter agreement with Mr. Ho and Springleaf Holdings, Inc., or Springleaf, which amended the terms of the Continued Employment and Separation Agreement, or the Springleaf Amendment. Under the Springleaf Amendment, Mr. Ho agreed to (i) an extension of the period covered by certain non-solicitation and non-competition covenants and (ii) a $265,000 reduction in the aggregate amount of base salary continuation payable from the date of the Springleaf Amendment through March 2015. As a result of the Springleaf Amendment, the aggregate amount of base salary continuation payable under the Continued Employment and Separation Agreement was reduced to $595,000.
Determination of 2013 Compensation Elements.
2013 Compensation for the Executive Officers of Cash America. In 2013, Mr. Fisher, who was Chief Executive Officer—E-Commerce Division, was a named executive officer of Cash America and, therefore, the Cash America Compensation Committee was responsible for determining his compensation during 2013. In determining compensation for each of Cash America’s named executive officers, including our Chief Executive Officer for 2013, the Cash America Compensation Committee considered each element of the executive officers’ compensation and how that element fit into each officer’s compensation package as a whole. The Cash America Compensation Committee designed the 2013 compensation packages for its executive officers with a goal of balancing short-term compensation, including base compensation and short-term incentive compensation, with long-term compensation. In assessing each executive officer’s compensation package, the Cash America Compensation Committee considered how much of the overall compensation package is subject to achieving certain financial targets on both a short-term basis and a long-term basis. The Cash America Compensation Committee utilized both short-term incentive compensation and long-term incentive compensation that is tied to financial performance to link the compensation of Cash America’s named executive officers to shareholder interests so that its executives can receive pay commensurate with financial performance on both a short- and long-term basis.
2013 Compensation for our Named Executive Officers. The 2013 compensation levels for Messrs. Clifton, King, Levertov and Shteyn were determined by Cash America’s Chief Executive Officer in consultation with Mr. Ho and the E-Commerce Division’s People Resources team at the beginning of 2013. In addition, Mr. King received compensation adjustments in March 2013 that were determined by Cash America’s Chief Executive Officer in consultation with Mr. Fisher and the E-Commerce Division’s People Resources team. While general industry survey data, individual performance and internal equity criteria were taken into account, the final compensation levels were based primarily on Mr. Ho’s and Mr. Fisher’s qualitative review and recommendations, as applicable, to Cash America’s Chief Executive Officer.
148
Table of Contents
Compensation Consultant and Peer Group. In late 2012, the Cash America Compensation Committee engaged Mercer, LLC, or Mercer, to review and update the Cash America peer group to be used by the Cash America Compensation Committee in determining future compensation for the Cash America named executive officers. The following publicly traded companies were identified as the Cash America peer group:
Peer Companies
| • Aaron’s, Inc. |
• Global Payments, Inc. | |
| • Aéropostale, Inc. |
• Heartland Payment Systems, Inc. | |
| • Ascena Retail Group, Inc. |
• Jos A Bank Clothiers, Inc. | |
| • Brown Shoe Company, Inc. |
• Pier 1 Imports, Inc. | |
| • Chico’s FAS, Inc. |
• Rent-A-Center, Inc. | |
| • DFC Global Corp. |
• Stage Stores, Inc. | |
| • DSW, Inc. |
• Ulta Salon Cosmetics & Fragrance, Inc. | |
| • Equinix, Inc. |
• United Online, Inc. | |
| • EZCORP, Inc. |
• World Acceptance Corporation | |
| • First Cash Financial Services, Inc. |
• Zale Corporation | |
Cash America’s Compensation Committee did not engage in benchmarking in 2013 and did not establish named executive officer compensation to fall within a certain percentile of the competitive group for 2013. Rather, the Cash America Compensation Committee referred to the publicly-available compensation information of peer companies as a general reference.
In late 2012, the Cash America Compensation Committee also engaged Mercer to review the potential compensation package of our Chief Executive Officer, Mr. Fisher, who was hired in January 2013. The Cash America Compensation Committee considered the information provided by Mercer in determining Mr. Fisher’s compensation package when he was hired, but they did not establish his compensation to fall within a certain percentile of our competitive group. Mr. Fisher’s compensation was set at a level that the Cash America Compensation Committee believed to be competitive in the market where we compete for talent.
The Cash America Compensation Committee did not engage Mercer to perform any services during 2013, and Mercer did not determine or recommend the amount or form of compensation for any of our named executive officers in 2013 in connection with any of the services they provided during 2012.
Base Salary
Mr. Fisher’s base salary for 2013 was set by the Cash America Compensation Committee when he joined Enova in January 2013 at a level believed to be competitive in the market where we compete for talent (as described above). In determining the 2013 salary for Messrs. Clifton, King, Levertov and Shteyn, Cash America’s Chief Executive Officer took into consideration the overall performance of the E-Commerce Division, each officer’s breadth of responsibilities, impact on financial and operational results over the prior year, leadership, and accomplishments that affected the performance and achievement of goals throughout the year. Cash America’s Chief Executive Officer also considered a qualitative assessment made by Mr. Ho of each of these items and by Mr. Fisher with regard to Mr. King’s compensation adjustments in March 2013.
149
Table of Contents
The annual salaries for our named executive officers in 2013, including their percentage increase over their 2012 salaries, if any, were as follows:
| Name |
2013 Annual Salary |
2012 Annual Salary |
Percentage Increase from 2013 to 2012 |
|||||||||
| Mr. Fisher |
$ | 525,000 | $ | — | — | % | ||||||
| Mr. Clifton |
233,500 | 215,000 | 8.6 | |||||||||
| Mr. King (1) |
350,000 | 300,000 | 16.7 | |||||||||
| Mr. Levertov |
275,000 | 260,000 | 5.8 | |||||||||
| Mr. Shteyn (2) |
242,868 | 242,868 | — | |||||||||
| Mr. Ho (3) |
430,000 | 430,000 | — | |||||||||
| (1) | Mr. King received a 3.5% salary increase in February 2013 to $310,500. Mr. King also received an additional 12.7% increase in March 2013 for a total 16.7% salary increase in 2013 compared to 2012 to reflect his ability and leadership in materially increasing the financial contributions of Enova in addition to his work in key business development initiatives. |
| (2) | Mr. Shteyn lives in Canada and splits his time between offices in Montreal, Canada and our offices in Chicago, Illinois. Since Mr. Shteyn lives in Canada, his salary is paid in Canadian dollars, or CAD. Mr. Shteyn’s salary reflected in the table is shown in U.S. dollars, converted using an exchange rate of $0.97147 per CAD, which is the average of the daily exchange rates for each month used to translate the 2013 results of our Canadian operations to U.S. dollars for U.S. financial reporting. |
| (3) | Mr. Ho left Enova on March 29, 2013. |
Short-Term Incentive Compensation and Bonuses
Overview. The Cash America Compensation Committee annually approves short-term incentive, or STI, plans, which are broad-based incentive plans that provide our named executive officers and certain other employees the opportunity to earn annual short-term incentive-based cash awards, or STI awards, primarily based on our annual performance.
2013 STI Plans. The 2013 STI plan for Mr. Fisher was administered under Cash America’s Senior Executive Bonus Plan. The 2013 STI plan for Messrs. Clifton, King, Levertov, and Shteyn was administered under an STI plan for our officers and certain other of our employees. None of our employees, except Mr. Fisher, was guaranteed a payment under the 2013 STI plans. In addition, the 2013 STI plans contained a “clawback” provision that allows us to recoup all or some of the payments made pursuant to the STI plans under certain circumstances when there is a material restatement of our financial results.
The target STI award amounts for 2013 expressed as a percentage of base salary, or Target Awards, for our named executive officers for the 2013 STI plans were as follows:
| Name |
Target Percentage of Base Salary |
|||
| Mr. Fisher |
75 | % | ||
| Mr. Clifton |
30 | % | ||
| Mr. King (1) |
47 | % | ||
| Mr. Levertov |
30 | % | ||
| Mr. Shteyn |
30 | % | ||
| Mr. Ho (2) |
— | |||
| (1) | Mr. King received an increase in his base salary on March 17, 2013, and his Target Award increased from 35% to 50% of his base salary. His 2013 STI Target Award for the portion of the year before the increase was calculated at 35% of base salary, and his 2013 STI Target Award for the balance of the year following the increase was calculated at 50% of base salary. Using a daily proration based on a 365-day year, this resulted in a blended average of approximately 47%. |
150
Table of Contents
| (2) | Mr. Ho left Enova on March 29, 2013. Because we entered into the Continued Employment and Separation Agreement with Mr. Ho on January 29, 2013, Mr. Ho was not eligible to participate in the 2013 STI plan. |
Our 2013 STI plans were based on our earnings before interest, income taxes, depreciation and amortization expenses, or EBITDA, adjusted for certain items, which is a non-GAAP financial measure, or STI Adjusted EBITDA, for 2013, or 2013 STI Adjusted EBITDA, and had the following requirements in order for potential STI awards to be earned and paid pursuant to the STI plan:
| • | Earnings Threshold: Potential STI awards began to accrue based on a formula set forth in the STI plans once a certain earnings threshold established for the 2013 STI Adjusted EBITDA was exceeded, or the Earnings Threshold. |
| • | Earnings Target: If a certain earnings target for the 2013 STI Adjusted EBITDA was achieved, then the named executive officer was eligible to receive a cash payment equal to 100% of his Target Award, or the Earnings Target. If the Earnings Target was exceeded, each named executive officer was eligible to receive a cash payment in excess of his Target Award calculated in accordance with the STI plans. |
The Earnings Threshold for the 2013 STI plans was $135.4 million, and the Earnings Target for the 2013 STI plans was $155.9 million. Our actual 2013 STI Adjusted EBITDA was $165.6 million, which is comprised of $152.6 million of income from operations of the Cash America E-Commerce Division (which is included in footnote 20 to Cash America’s Consolidated Audited Financial Statements filed with its Annual Report on Form 10-K for the year ended December 31, 2013), increased by a net adjustment in accordance with the 2013 STI plans in the amount of $13.0 million. Thus, the 2013 STI Adjusted EBITDA significantly exceeded the Earnings Target.
2013 Bonuses
Additional discretionary bonus awards were also considered for each named executive officer to reflect their individual contributions during 2013 that significantly impacted our financial results, and discretionary bonuses were awarded to certain of our named executive officers as set forth below.
Payments under the 2013 STI Plan and Discretionary Bonus Payments.
The 2013 STI payment for Mr. Fisher was based solely on our 2013 STI Adjusted EBITDA, and the 2013 STI payments for Messrs. Clifton, King, Levertov, and Shteyn were based on a combination of financial results and individual performance. A comprehensive individual performance review of all of our employees was completed at the end of the year with each employee designated into one of six individual performance categories, or Categories. The Target Awards were adjusted by an individual performance factor applied to each Category where Category 1 was assigned a 0% individual performance factor, Category 2 was 44%, Category 3 was 74%, Category 4 was 100%, Category 5 was 140% and Category 6 was 150%. By using this distribution of individual performance factors we were able to differentiate and reward for individual performance while not exceeding the final STI award pool, which was equal to 143.9% of the Target Award and based solely on the financial performance of Enova.
The 2013 STI payments and bonus payments were as follows:
| Name |
Payment under the 2013 STI Plan |
Bonus | Total | |||||||||
| David A. Fisher |
$ | 523,141 | (1) | — | $ | 523,141 | ||||||
| Robert S. Clifton |
$ | 73,636 | (2) | — | $ | 73,636 | ||||||
| Alex T. King |
$ | 230,411 | (3) | $ | 53,701 | (3) | $ | 284,112 | ||||
| Arad Levertov |
$ | 164,440 | (4) | $ | 46,984 | (4) | $ | 211,424 | ||||
| Daniel Shteyn |
$ | 77,462 | (2) | — | $ | 77,462 | ||||||
151
Table of Contents
| (1) | Represents a payment that was 143.9% of the 2013 Target Award for Mr. Fisher and was based solely on the performance of Enova, as Mr. Fisher’s 2013 STI award was based 100% on the 2013 STI Adjusted EBITDA. Because Enova exceeded its Earning Target for the 2013 STI Adjusted EBITDA, Mr. Fisher’s payment exceeded his Target Award amount and was calculated in accordance with the 2013 STI plan. |
| (2) | Messrs. Clifton and Shteyn received payments equal to 106% of their 2013 Target Awards, which are comprised of (i) a 143.9% financial performance factor; and (ii) a 74% individual performance factor. |
| (3) | Mr. King received a payment equal to 176% of his 2013 Target Award, which is comprised of (i) a 143.9% financial performance factor; (ii) a 100% individual performance factor; and (iii) a $53,701 discretionary bonus reflecting his ability and leadership in materially increasing the financial contributions of Enova in addition to his work in key business development initiatives. Mr. King also received a retention bonus for 2013 as described further below. |
| (4) | Mr. Levertov received a payment equal to 258% of his 2013 Target Award, which is comprised of (i) a 143.9% financial performance factor; (ii) a 140% individual performance factor; and (iii) a $46,984 discretionary bonus reflecting his leadership in materially increasing the financial contributions of the U.K. business of Enova. |
The 2013 STI plan for Mr. Fisher provided that, consistent with the Fisher Letter Agreement that was entered into with Mr. Fisher when he accepted employment on January 29, 2013, Mr. Fisher would receive the greater of the actual short-term incentive earned according to the terms of the 2013 STI plan or 75% of his 2013 Target Award. Because Enova exceeded its Earnings Target, Mr. Fisher’s payment exceeded his Target Award amount and he received a payment that was 143.9% of his Target Award, which was calculated in accordance with the 2013 STI plan.
All STI award and bonus payments were paid in 2014 and were based on our 2013 performance and related considerations, as applicable. The STI award and bonus payments are reflected in the Summary Compensation Table in the “Non-Equity Incentive Plan Compensation” column and the “Bonus” column, respectively and as applicable.
Payment under Retention Bonus Agreement with Mr. King.
Mr. King vested in the first portion of his bonus payable under the Retention Bonus Agreement on December 31, 2013, and he received a payment of $233,334 in January 2014.
Long-Term Incentive Compensation
Performance Units.
In order to ensure that our employees have long-term incentive compensation tied to our performance, the Cash America Compensation Committee has, for our officers and certain of our employees, historically utilized grants of cash-based performance units, or Performance Units, under the Cash America International, Inc. First Amended and Restated 2004 Long-Term Incentive Plan, as amended, or the Cash America LTIP, the vesting and payment of which are tied solely to our performance. Grants of Performance Units are typically approved by the Cash America Compensation Committee at the beginning of each year.
In March 2013, the Cash America Compensation Committee approved a grant of Performance Units to Messrs. Fisher, Clifton, King, Levertov and Shteyn. The material terms of the Performance Unit grant are as follows:
| • | Subject to continued employment with Cash America or an affiliate and the achievement of a certain compound annual growth rate, or CAGR, in the EBITDA of Enova, adjusted for certain items, or LTI Adjusted EBITDA, on each of the vesting dates, or the EBITDA Growth Requirement, the Performance Units were scheduled to vest as follows: 12.5% of the award on January 1, 2014, 37.5% of the award on January 1, 2015 and 50% of the award on January 1, 2016. For purposes of the 2016 |
152
Table of Contents
| vesting date, Mr. Fisher’s employment was to be treated as continuing through the vesting date if he voluntarily terminated his employment between February 1, 2015 and December 31, 2015 and met certain notice requirements. |
| • | If the EBITDA Growth Requirement is not met on each vesting date, the Performance Units scheduled to vest on that date are forfeited. |
| • | The Performance Unit award agreement provided that the portion of the Performance Units that were scheduled to vest in 2014, 2015 and 2016 are to be valued based on the increase in LTI Adjusted EBITDA for 2013, 2014 and 2015, respectively compared with LTI Adjusted EBITDA for 2012. |
| • | Payments for all Performance Units that vested are to be made within a reasonable period of time each year following the Cash America Compensation Committee’s certification that the vesting requirements have been met. |
| • | In addition, the grant is subject to a “clawback” provision that allows us to recoup all or some of the payments made pursuant to the award under certain circumstances when there is a material restatement of our financial results. |
The following table shows the number and the targeted value (in dollars and as a percentage of base salary) of Performance Units granted to each of our named executive officers in March 2013, which the Cash America Compensation Committee determined in consultation with Cash America’s chief executive officer for Mr. Fisher and with Mr. Fisher and Cash America’s chief executive officer for each of our other named executive officers:
| Name |
Number of Performance Units Granted (#) |
Targeted Value of the Performance Unit Grant (1) |
Targeted Value as a Percentage of Base Salary (1) |
|||||||||
| Mr. Fisher |
13,668 | $ | 787,500 | 150 | % | |||||||
| Mr. Clifton |
3,445 | $ | 198,475 | 85 | % | |||||||
| Mr. King |
10,631 | $ | 612,500 | 175 | % | |||||||
| Mr. Levertov |
7,159 | $ | 412,500 | 150 | % | |||||||
| Mr. Shteyn |
2,388 | $ | 137,602 | 57 | % | |||||||
| (1) | Assumes target performance. The maximum amount that may be paid under these Performance Unit grants is 300% of the target amount. |
The payments made under the 2013 Performance Units that vested on January 1, 2014 are included in the Non-Equity Incentive Compensation column of the 2013 Summary Compensation Table. See “Certain Relationships and Related-Party Transactions—Related-Party Transactions” for additional information regarding treatment of all unvested Performance Units at the time of the separation and distribution.
Restricted Stock Units.
In addition, in January 2013, the Cash America Compensation Committee elected to award a special one-time grant of time-based RSUs under the Cash America LTIP to Mr. Fisher when he joined Enova as its Chief Executive Officer. The Cash America Compensation Committee awarded Mr. Fisher this one-time RSU grant as a sign-on bonus in order to be competitive when hiring Mr. Fisher. In addition, this grant is consistent with Cash America’s compensation philosophy of encouraging stock ownership in Cash America by its executive officers and is aligned with shareholder interests.
Mr. Fisher’s special one-time RSU grant was comprised of 14,260 RSUs that were scheduled to vest on the earlier of January 29, 2015 or the date, if ever, that our stock would become publicly traded. The number of RSUs granted to Mr. Fisher was determined by dividing $600,000 by the average closing price of Cash America common stock for the 20 trading-day period ending on the day before the grant date. Under the terms of the RSU
153
Table of Contents
award agreement, Mr. Fisher is entitled to receive one share of Cash America common stock for each RSU upon vesting. In addition, under the terms of the RSU award agreement, if Mr. Fisher leaves Cash America for any reason he will forfeit any unvested portion of his RSU award, except in the event of certain changes-in-control. In addition, the RSU award agreement for Mr. Fisher contains a “clawback” provision that allows Cash America to recoup all or some of the RSUs under certain circumstances in the event that there is a material restatement of Cash America’s financial results.
On the date of the separation and distribution, all of Mr. Fisher’s outstanding RSUs vested. See “Certain Relationships and Related-Party Transactions—Related Party Transactions” for additional information regarding Mr. Fisher’s RSUs.
Retirement and Other Benefits
Prior to July 1, 2012, our officers were eligible to participate in a 401(k) savings plan, a nonqualified savings plan and a supplemental executive retirement plan sponsored by Cash America. On July 1, 2012, we established and now sponsor our own 401(k) Savings Plan, or the Enova 401(k), our own nonqualified savings plan, or the Enova NQSP, and our own supplemental executive retirement plan, or the Enova SERP, in which most of our named executive officers and other eligible employees may now participate.
Enova 401(k) and Enova NQSP.
Substantially all of our employees and those of our U.S. subsidiaries are eligible to participate in the Enova 401(k). Certain of our highly-compensated employees, including our named executive officers other than Mr. Shteyn, are also eligible to participate in the Enova NQSP. Because Mr. Shteyn performs services for us in Canada, he participates in a Canada Group Registered Retirement Savings Plan rather than the Enova 401(k) and the Enova NQSP.
We match 50% of the first 5% of pay that each employee contributes to the Enova 401(k). All employee contributions are fully vested upon contribution. Our matching contributions vest ratably over an employee’s first five years of service with us or Cash America and also become fully vested if an employee dies, becomes disabled or reaches age 59 1/2 during employment. Employees may select from among several mutual funds when investing their 401(k) account funds.
The Enova NQSP is a nonqualified retirement savings plan into which participants may contribute portions of their salary in excess of the 401(k) contribution limits. Enova NQSP participants can also defer up to 80% of their STI awards and annual bonuses into the Enova NQSP. If a participant’s pay exceeds the IRS limit on amounts that can be taken into account for contributions to the Enova 401(k), we match 50% of the first 5% of compensation deferred to the Enova NQSP in excess of the 401(k) compensation limit; however, if a participant participates in both the Enova 401(k) and the Enova NQSP, the combined match to both plans will be limited to 50% of the first 5% of the participant’s pay. Our matching contributions in the NQSP vest under the same vesting schedule that applies to the Enova 401(k) plan. This plan generally offers the same investment options as the Enova 401(k).
We generally distribute each participant’s Enova NQSP account in a lump sum shortly after the participant’s separation from service with us and all of our affiliates. Alternatively, a participant can elect to receive his or her Enova NQSP account at a later date or receive payments in up to 10 annual installments. Most officers cannot receive a distribution of any portion of their account during the first six months after their separation from service. A participant generally may not receive any portion of his or her Enova NQSP account while employed, unless the participant makes an in-service distribution election before the deferred compensation is earned or suffers a severe financial hardship. We may pay Enova NQSP distributions from a Rabbi trust associated with the Enova NQSP or from the general assets of the entity that is the participant’s employer. A participant would have the rights of a general unsecured creditor of the entity that is his or her employer for any Enova NQSP benefits he or she is owed.
154
Table of Contents
Canada Group Registered Retirement Savings Plan.
We match 100% of Mr. Shteyn’s regular payroll contributions made to a Canadian Group Registered Retirement Savings Plan, up to a maximum company contribution of 9%, for services performed in Canada. All contributions are fully vested when made. Mr. Shteyn is the only named executive officer who participates in this Canadian plan.
Supplemental Executive Retirement Plan.
We provide supplemental executive retirement plan benefits to our officers, other than Mr. Shteyn, as a supplement to their retirement benefits under the Enova SERP. After the end of each plan year, we make discretionary supplemental contributions that are credited to the Enova SERP account of each named executive officer who was employed by us on the last day of the plan year. The rate of return of a participant’s Enova SERP account is determined by the rate of return on deemed investments in mutual funds that a participant selects. Enova SERP participants’ deemed investment options are generally the same as the investment options available under the Enova 401(k). Participants vest in their Enova SERP accounts over their first five years of service with us or Cash America and are fully vested in their Enova SERP accounts and new contributions to those accounts after that five year period.
We generally distribute each participant’s Enova SERP account as a lump sum soon after the participant’s separation from service with us and all of our affiliates. An Enova SERP participant may, however, elect to defer receipt of the Enova SERP account for at least an additional five years beyond his separation from service and may also elect to receive the Enova SERP account in up to ten annual installments. Most officers cannot receive a distribution of any portion of their account during the first six months after their separation from service. A participant generally may not withdraw any portion of his Enova SERP account during employment, except in the case of a severe financial hardship. We may pay Enova SERP benefits from a Rabbi trust associated with the Enova SERP or from the general assets of the entity that is the participant’s employer. A participant would have the rights of a general unsecured creditor of the entity that is his or her employer for any Enova SERP benefits he or she is owed.
Prior to the separation and distribution, the Cash America Compensation Committee annually determined the amount of the supplemental contribution to be made for each of our officers for the plan year. Following the separation and distribution, our Compensation Committee will administer the Enova SERP and annually determine the supplemental contributions for each of our named executive officers. The targeted (but non-binding) amount of the supplemental contribution for each plan year is a percentage of each officer’s compensation. The compensation on which the supplemental contribution is based is the base salary, plus the lesser of (a) the officer’s target STI award payable during the plan year for the preceding year’s performance and (b) the actual STI award paid during the plan year based on the preceding year’s performance. The contribution amounts are prorated for the portion of the year that an officer was eligible to participate in the Enova SERP, and are credited to the officer’s Enova SERP account in February of the following year. For 2013, the supplemental contributions for each of our named executive officers, reflected as a percentage of the combined base salary paid during the year and the target STI award for the 2012 year, are listed below.
| Name |
SERP Contribution | |||
| Mr. Fisher |
10.5 | % | ||
| Mr. Clifton |
4.5 | |||
| Mr. King |
7.5 | |||
| Mr. Levertov |
4.5 | |||
| Mr. Shteyn (1) |
— | |||
| Mr. Ho (2) |
— | |||
| (1) | Mr. Shteyn was not eligible to receive a 2013 Enova SERP contribution because his employer is a Canadian subsidiary that does not participate in the Enova SERP. |
155
Table of Contents
| (2) | Mr. Ho was not eligible to receive a 2013 Enova SERP contribution because he left Enova before the end of 2013. |
For each of the Enova 401(k), the Enova NQSP and the Enova SERP, Mr. Fisher was not vested in any portion of our contributions at the end of 2013 because he joined Enova in January 2013. Mr. Clifton and Mr. King had more than five years of service, including service with Cash America, and were fully vested at the end of 2013. Mr. Levertov was 80% vested at the end of 2013. Mr. Ho had more than five years of service and was fully vested when he left Enova in March 2013.
Perquisites and Other Personal Benefits
Enova provides perquisites and other personal benefits to its officers that it believes are reasonable and consistent with its overall compensation program. A description of these perquisites and personal benefits, including the attributed costs, for our named executive officers for the year ended December 31, 2013 are included in the “All Other Compensation” column of the Summary Compensation Table and described in the notes to that table.
Compensation Prior to 2013
January 2012 Performance Unit Grant.
In January 2012, it was expected that a proposed initial public offering of Enova common stock which was subsequently withdrawn in July 2012, or the Withdrawn IPO, would be completed during 2012, and it was expected that had the Withdrawn IPO been completed, Messrs. King, Levertov, Shteyn and Ho would have received long-term incentive compensation from Enova. Since the Withdrawn IPO was expected to be completed during 2012, the Cash America Compensation Committee decided not to make a grant of Performance Units in January 2012 to Messrs. King, Levertov, Shteyn and Ho.
Since Mr. Clifton was hired in 2011 after the 2011 annual Performance Unit grant date, the Cash America Compensation Committee approved a special one-time grant of 5,000 Performance units to Mr. Clifton in January 2012 based on recommendations made by Mr. Ho and Cash America’s chief executive officer. The Performance Units granted to Mr. Clifton in January 2012 vested equally over a two-year period with one-half of the Performance Units vesting on each of January 1, 2013 and 2014, subject to continued employment with Cash America or an affiliate and the satisfaction of certain conditions related to an increase in LTI Adjusted EBITDA of Enova each year over a two-year period ending December 31, 2013. The unit value of each Performance Unit was based on a percentage of the yearly increase in LTI Adjusted EBITDA divided by 33,333 for the first vesting date and 33,334 for second vesting date. The actual amount paid to Mr. Clifton in 2014 for Performance Units vesting January 1, 2014 based on Enova’s financial performance in 2013 is included in the “Non-Equity Incentive Plan Compensation” column of the Summary Compensation Table.
July 2012 Performance Unit Grants
On July 25, 2012, the Cash America Compensation Committee approved the grant of Performance Units to Messrs. Clifton, King, Levertov, Shteyn and Ho. This performance unit grant was approved following the withdrawal of the Withdrawn IPO. The Cash America Compensation Committee chose to award our executive officers with Performance Units to incentivize the achievement of sustained incremental annual growth in earnings in the E-Commerce Division. The material terms of the Performance Unit grant are as follows:
| • | Each one-third of the Performance Units were to be valued based on the year-over-year increase in LTI Adjusted EBITDA for 2012, 2013 and 2014, with the 2012 valuation based only on the last six months of 2012 compared to the last six months of 2011 and the 2013 and 2014 valuations based on fiscal years 2013 and 2014, respectively, compared to each of their previous years. |
| • | Subject to continued employment with Cash America or an affiliate and the achievement of a certain EBITDA Growth Requirement on each of the vesting dates, the Performance Units were scheduled to vest as follows: 16 2/3% of the award on January 1, 2013, 16 2/3% of the award on January 1, 2014 |
156
Table of Contents
| and 66 2/3% of the award on January 1, 2015. If the EBITDA Growth Requirement was not met on each vesting date, the Performance Units scheduled to vest on that date would remain unvested and would again be eligible to vest on subsequent vesting dates, if any, subject to continued employment with Cash America or an affiliate and the achievement of the EBITDA Growth Requirement on such subsequent vesting date. |
| • | Payments for all Performance Units that vested were to be made within a reasonable period of time each year following the Cash America Compensation Committee’s certification that the vesting requirements have been met. |
| • | In addition, Mr. Ho’s grant is subject to a “clawback” provision that allows us to recoup all or some of the payments made pursuant to the award under certain circumstances when there is a material restatement of our financial results. |
The number of Performance Units granted to each named executive officer was based on the officer’s position with Enova and on individual recommendations made by Cash America’s chief executive officer for Mr. Ho and by Mr. Ho and Cash America’s chief executive officer for each other named executive officer. The award agreements for the Performance Units did not specify target values, and the Performance Units do not have a maximum payout. The following table shows the number of the Performance Units and the estimated total dollar value of the July 2012 grant, as estimated at the time of grant, for each of our named executive officers:
| Name |
Number of Performance Units Granted (#) |
Estimated Total Value of the Performance Unit Grant ($) (1) |
||||||
| Mr. Fisher (2) |
— | — | ||||||
| Mr. Clifton |
2,901 | $ | 216,000 | |||||
| Mr. King |
7,002 | $ | 520,000 | |||||
| Mr. Levertov |
5,502 | $ | 409,000 | |||||
| Mr. Shteyn |
2,901 | $ | 216,000 | |||||
| Mr. Ho (3) |
9,501 | $ | 706,000 | |||||
| (1) | The amounts in this column were the total estimated values of the Performance Units on the date of grant, which assumed a hypothetical level of year-over-year increase in EBITDA of Enova for each of the 2012, 2013 and 2014 valuation periods. These amounts were only estimates and did not reflect future earnings projections for Enova. |
| (2) | Mr. Fisher joined Enova on January 29, 2013. |
| (3) | Mr. Ho left Enova on March 29, 2013. All outstanding unvested Performance Units under this grant expired and were forfeited on that date. |
In addition, in 2011 the Cash America Compensation Committee also made grants of Performance Units to certain of our named executive officers, the final vesting for which occurred on January 1, 2014. The payments for the Performance Units granted in 2011 and 2012 that vested on January 1, 2014 were based on our EBITDA performance and are included in the “Non-Equity Incentive Compensation” column of the Summary Compensation Table. See “Certain Relationships and Related-Party Transactions—Related-Party Transactions” for additional information regarding treatment of all unvested Performance Units at the time of the separation and distribution.
Our Compensation Philosophy and Objectives after the Distribution
Now that we are a separate stand-alone public company, our Compensation Committee will determine the design of our executive compensation program. While we are still in the process of determining specific details of our compensation program, we anticipate that our compensation program will generally be similar to Cash America’s compensation program. In particular, we anticipate that our Compensation Committee will implement the executive compensation policy described below setting out our compensation philosophy and objectives.
157
Table of Contents
Executive Compensation Practices after the Separation and Distribution
General
We believe compensation provided to our executives should be performance-based, competitive in the markets and industries in which we compete for talent, closely linked to our stockholders’ interests and reflect each executive’s contribution in enhancing our stockholders’ investment in us.
Primary Objectives
The primary objectives of our executive compensation program are as follows:
| • | Support Enova’s core values; |
| • | Attract, motivate and retain the best executive talent; |
| • | Encourage and reward high performance and results, while aligning executive short- and long-term interests with those of our stockholders; |
| • | Reinforce our strategy to innovate, execute and diversify our business; and |
| • | Support the appropriate amount of risk to be taken by our executives to achieve sustained long-term growth while discouraging short-term high risk activities. |
Competitive Reference Points
Competitive market reference points with which we compare ourselves, will be selected by our Compensation Committee from time to time with guidance from our management team.
We will utilize a peer group of publicly-traded companies in a broad range of industries to capture the uniqueness of our business, customers, industry, technology and regulatory environment. Specifically, we will identify companies of a similar size in high-tech, internet retail, online-focused consumer finance, and other companies who operate in highly regulated industries. These reference points will be used to assess the competiveness of our pay programs relative to the following criteria:
| • | Establish competitive base salary ranges. In general, this will be between the 50th percentile and 75th percentile of our competitive group but in some instances may be outside this range for excellent results, or in the case of new hires, if exceptional results are expected; |
| • | Target competitive short-term incentives at the 50th percentile of our competitive group and paid at or above the 75th percentile for excellent results; and |
| • | Target competitive long-term incentives for executives at the 50th percentile of our competitive group and paid at or above the 75th percentile for excellent results. |
Principal Elements of Executive Compensation
When making decisions on executive compensation, we expect that our Compensation Committee will review the overall compensation we deliver, consider the competitive market for executive talent and review the compensation levels and components available for companies with whom we compete for talent or business. In general, the proportion of an executive’s compensation at risk will increase with seniority, scope and responsibility while total rewards will increase with the achievement of exceptional results.
Elements of executive compensation include:
| • | Base salary; |
| • | A performance-based annual incentive award, intended to increase stockholder value and our success by motivating executives to perform at their best and meet and exceed objectives. |
| • | The goal of the annual incentive award is to provide executives with motivating incentives based on the achievement of goals relating to Enova or Enova’s individual business units, |
158
Table of Contents
| • | Clear and objective performance goals are established to provide an opportunity for increased rewards for exceptional results, and |
| • | At the Compensation Committee’s direction, amounts paid under the plan may qualify as performance-based compensation under Section 162(m) in certain circumstances; |
| • | Long-term incentive compensation awards that are both performance- and time-based. The purpose of our long-term incentives is to promote Enova’s long-term business strategy and the interests of our stockholders by: |
| • | providing a line of sight to the long-term strategic goals of Enova, |
| • | attracting and retaining executive talent, |
| • | enabling executives to participate in our long-term growth and develop a sense of ownership by acquiring a proprietary interest in Enova, and |
| • | providing long-term incentives with aggressive upside earnings opportunity for exceptional performance; |
| • | Retirement Benefits, including a 401(k) plan, a non-qualified savings plan, a Supplemental Executive Retirement Plan, and a Severance Pay Plan for executives; |
| • | Health and other benefits also available to employees generally; and |
| • | Certain additional benefits available to executives may include: |
| • | Employment contracts, retention agreements and other similar benefits, which are not expected to be utilized frequently but may be used selectively and only if and when appropriate, and |
| • | A supplemental Medical Expense Reimbursement Plan, when available, may be made available to our executives and other senior management personnel. |
In addition to our Compensation Committee, from time to time our Board may also review and approve executive compensation philosophy or elements thereof and other matters related thereto when necessary or appropriate.
Compensation Committee’s Role in Establishing Executive Compensation
Our Compensation Committee approves, or recommends to the independent members of our Board for approval, all compensation decisions, including grants of short- and long-term incentive awards, including cash- and equity-based awards, for our executives including our named executive officers. Key functions of our Compensation Committee are to ensure;
| • | Executives are fairly compensated based upon results and contributions to our growth and profitability; |
| • | Executives are incentivized to achieve exceptional performance and reward executive top talent for outstanding results; |
| • | Executive compensation decisions support our compensation philosophy and our strategic and risk objectives, as well as stockholder interests; |
| • | Oversee our executives’ compliance with our stock ownership guidelines; and |
| • | Assess the risks associated with our executive compensation programs. |
Management’s Role in Establishing Compensation
Our Chief Executive Officer will be the primary management contact with our Compensation Committee. Our Chief Executive Officer will recommend to the Compensation Committee changes in compensation for other
159
Table of Contents
executives, including our other named executives, based on an assessment of each individual’s responsibilities and contributions to our results and the individual’s potential for future contributions to our success. Neither the Chief Executive Officer nor any other executive officers will be involved in recommendations for changes in the Chief Executive Officer’s compensation.
Compensation Consultants
Prior to the separation and distribution, the Cash America Compensation Committee engaged an independent compensation consultant, Towers Watson, to perform a formal review of base salaries, short-term incentives and long-term incentives for each of our named executive officers compared to persons holding comparable positions with similar duties at other publicly-traded companies. Our Compensation Committee has approved the selection of Towers Watson as our independent compensation consultant and has assumed the engagement with them. We expect the compensation consultant to develop a group of peer companies that it determines to be of similar size and scope to us and would provide appropriate comparisons for establishing competitive compensation levels. In addition, we expect the compensation consultant to refer to compensation practices and levels implemented at companies that were recently spun off from parent companies or that recently completed an initial public offering. We expect the compensation consultant to recommend a range of base salary levels, a percentage of salary to which short-term incentive compensation should be targeted, and target long-term incentive values for each of our executives, including our named executive officers. When determining compensation following the separation and distribution, we expect that our Compensation Committee will consider the review performed by the compensation consultant.
As discussed under “Compensation Actions Taken in Connection with the Separation and Distribution—Enova LTIP Grants,” our Compensation Committee has approved grants under the Enova LTIP in anticipation of the distribution. In connection with these long-term incentive awards, Towers Watson reviewed long-term incentive program information from the peer companies set forth below and made recommendations as to the types of awards and the amount of awards that should be granted. The following peer companies were reviewed:
Our Compensation Committee reviewed the information and recommendations provided by Towers Watson when it approved the long-term incentive awards for our named executive officers. While our Compensation Committee considered the long-term incentive programs of these peer companies as competitive reference points for these awards, the Compensation Committee did not use the comparison information to establish the long-term incentive awards within a certain percentile of these peer companies and did not engage in strict benchmarking. Rather, the Compensation Committee referred to the information and recommendations provided by Towers Watson as a general reference.
Deductibility of Executive Compensation
Our Compensation Committee will review and consider the deductibility of executive compensation under Code Section 162(m), which provides that we may not deduct compensation of more than $1 million that is paid to certain individuals. This limitation does not apply to certain performance-based pay. Our Compensation
160
Table of Contents
Committee may, in certain situations, approve compensation that will not meet these deductibility requirements in order to ensure competitive levels of compensation for our executive officers, including our named executive officers.
Equity Ownership
Our Compensation Committee has established stock ownership guidelines that require ownership of our stock that is five times base salary for our chief executive officer, three times base salary for our other executive officers and two times the annual retainer for directors. Our executive officers and directors will have up to five years following the distribution to achieve the applicable stock ownership guidelines that are adopted.
Plans We Have Adopted
Short-Term Incentive Compensation
In January 2014, the Cash America Compensation Committee approved cash-based STI plans for (i) our Chief Executive Officer and (ii) certain of our other employees, including our executive officers, that are based on our 2014 performance. These STI plans are now administered by our Compensation Committee. While we do not intend to adjust the terms of the outstanding STI plans for 2014, which is based on our performance in 2014, certain adjustments to the financial targets may be made to reflect the different costs and expenses associated with operating as a separate company.
We have adopted STI plans that will be used as the foundation for establishing the terms and conditions of annual STI award programs for plan years following 2014, or the Post-2014 STI Plans. The Post-2014 STI Plans are intended to increase stockholder value and our success by motivating certain of our employees, including our executives, (a) to perform to the best of their abilities, and (b) to achieve our objectives. These plans are intended to provide executives, including our named executive officers, and certain other employees with the opportunity to earn STI based on the achievement of goals relating to the performance of us and our individual business units and relating to individual performance. One of the STI plans is a Senior Executive Bonus Plan, which is described below, that allows our Compensation Committee to designate certain amounts payable under the plan as payments intended to qualify as performance-based compensation under Code Section 162(m).
We also have adopted a Discretionary Bonus Plan. The Discretionary Bonus Plan is intended to increase stockholder value and our success by providing our officers and other employees with discretionary bonus awards based on exceptional individual achievement or exceptional performance by us or our individual business units.
In addition, during 2014, Messrs. King and Levertov received discretionary bonuses in the amounts of $100,000 and $300,000, respectively, for exceptional performance. Each bonus was a one-time bonus that was paid in cash. We expect that any similar bonuses that we may pay in the future will be under our Discretionary Bonus Plan.
Senior Executive Bonus Plan
Prior to the distribution, we adopted, and our sole stockholder, Cash America, approved, a Senior Executive Bonus Plan that will become effective on January 1, 2015, which will allow us to make annual cash-based incentive payments, or STI awards, that could potentially qualify as performance-based compensation under Section 162(m). Section 162(m) generally places a $1 million annual limit on the income tax deductibility of compensation paid to a company’s chief executive officer and each of the three most highly compensated executive officers other than the chief executive officer and the chief financial officer. This limit does not apply to compensation defined in Section 162(m) as “performance-based compensation.” Payments made under the Senior Executive Bonus Plan after our first meeting of stockholders held more than 12 months after the separation and distribution will not qualify as performance-based compensation under Section 162(m) if the
161
Table of Contents
Senior Executive Bonus Plan is not approved by our public stockholders before the date the terms and conditions of such payments are established unless the payments are contingent upon such stockholder approval.
The summary of the Senior Executive Bonus Plan set forth below is qualified in its entirety by the full text of the Senior Executive Bonus Plan, which has been filed as an exhibit to the registration statement of which this prospectus is a part.
Purpose
The Senior Executive Bonus Plan is intended to increase stockholder value and our success by linking a portion of the key executives’ compensation to our financial performance, providing rewards for improving financial performance and motivating our key executives to perform to the best of their abilities to achieve our objectives.
Administration of the Plan and Eligible Employees
All of our executive officers following the separation and distribution, or nine people, are eligible to participate in our Senior Executive Bonus Plan. The Compensation Committee will administer the Senior Executive Bonus Plan and will determine which officers will participate in the Senior Executive Bonus Plan. In selecting participants in the plan each year, the Compensation Committee will choose those officers who are likely to have a significant impact on our performance.
Target Awards and Performance Goals
Under the Senior Executive Bonus Plan, the Compensation Committee may annually establish: (i) a target award for each participant, (ii) the performance goals that must be achieved in order for the participant to be paid the target award, and (iii) a payout formula to determine the actual amount of the award, which could be less than or more than the target amount, based on a comparison of actual performance to the pre-established performance goals. Each participant’s target award will be expressed as a percentage of his or her base salary.
Under the Senior Executive Bonus Plan, the Compensation Committee may use various performance measures in setting performance goals set forth in the plan for awards to be made under the plan for any year. The Compensation Committee has the discretion to select from among these measures when setting performance goals for a particular year. The Compensation Committee may choose performance goals that apply on either a Company, division or department basis, as deemed appropriate in light of the participant’s responsibilities.
Determination and Payment of Actual Awards
After the end of each year, the Compensation Committee must certify the extent to which the performance goals applicable to each participant were achieved or exceeded. The actual award (if any) for each participant will be determined by applying the formula to the level of actual performance that the Compensation Committee certifies. However, the Compensation Committee retains discretion to eliminate or reduce the actual award payable to any participant below that which otherwise would be payable under the applicable formula. No participant’s actual award under the Senior Executive Bonus Plan may exceed $3.0 million for any year.
The Senior Executive Bonus Plan requires that the participant be continuously employed by us, and if a participant terminates employment with us before a certain date set by the Compensation Committee each year when they set the terms of the plan for that year, which date may be no earlier than December 31 of that plan year and no later than March 15 of the calendar year following the plan year, he or she generally will not be entitled to receive an award for that plan year. The Compensation Committee has the discretion, however, to waive the requirement that the participant be employed by us on the last day of the plan year and to pay a terminated participant all or part of the award actually earned for the year of termination. Awards will be payable
162
Table of Contents
in cash or its equivalent after the end of the year during which the award was earned, subject to the Compensation Committee’s discretion to reduce or eliminate the award. The Compensation Committee may, however, establish programs, procedures and payment mechanisms to permit selected participants to defer receipt of their actual awards. If a participant dies after earning an award for a particular year, but before the award is actually paid, the award will be paid to his or her estate.
We have not yet made any awards under our Senior Executive Bonus Plan, and payments that could potentially be made under the Senior Executive Bonus Plan cannot be determined. The STI awards that were made to our named executive officers during 2013 are included in the Summary Compensation table.
Amendment and Termination
The Board of Directors or the Compensation Committee may amend or terminate the Senior Executive Bonus Plan at any time and for any reason, but in accordance with Section 162(m) of the Internal Revenue Code, and certain material amendments to the Senior Executive Bonus Plan will be subject to stockholder approval. We expect to submit the Senior Executive Bonus Plan to stockholders from time to time as may be deemed necessary to comply with Section 162(m) requirements.
Clawback
In addition, the Senior Executive Bonus Plan also contains a clawback provision that would allow us to recoup certain compensation and awards paid to our officers in certain circumstances in the event that there is a material restatement of our financial results.
Material Federal Income Taxes
The following is a brief description of the federal income tax consequences generally arising with respect to annual incentive awards paid under the Senior Executive Bonus Plan. This summary does not address the effects of other federal taxes or taxes imposed under state, local or foreign tax laws. The summary is general in nature and is not intended to cover all tax consequences that may apply to a particular employee or to us. The provisions of Section 162(m) and related regulations concerning these matters are complicated and their impact in any one case may depend upon the particular circumstances.
Section 162(m) generally places a $1 million annual limit on the deductibility for federal income tax purposes of compensation paid to a company’s chief executive officer and the three most highly compensated executive officers other than the chief executive officer and the chief financial officer. This limit does not apply to compensation defined in Section 162(m) as “performance-based compensation.” The Senior Executive Bonus Plan provides a means for us to pay “performance-based” annual incentives to certain of our officers while preserving our tax deduction with respect to the payment of such incentives.
Under present federal income tax law, a participant will generally realize ordinary income upon receipt of incentive payments under the Senior Executive Bonus Plan. We will generally receive a tax deduction for such amounts, provided that the participant’s total compensation is below the limit established by Section 162(m) or the Senior Executive Bonus Plan award satisfies the requirements of the “performance-based” exception of Section 162(m).
Long-Term Incentive Plan
Prior to the distribution, we adopted, and our sole stockholder, Cash America, approved, the Enova LTIP that is administered by our Compensation Committee.
163
Table of Contents
Purpose
The purpose of the Enova LTIP is to promote the interests of Enova and its stockholders by giving us a competitive advantage in attracting, retaining and motivating employees, officers, consultants and directors capable of assuring our future success, to offer such persons incentives that are directly linked to the profitability of our business and increases in stockholder value, to afford such persons an opportunity to acquire a proprietary interest in Enova.
The summary of the Enova LTIP set forth below is qualified in its entirety by reference to the full text of the Enova LTIP, which has been filed as an exhibit to the registration statement of which this prospectus is a part.
Administration of the Enova LTIP
The Enova LTIP is administered by the Compensation Committee or other subcommittee of our Board of Directors designated by the Board of Directors or the Compensation Committee to administer the plan. For awards that are intended to be qualified performance-based awards under Section 162(m), such awards will be approved and administered by a committee or subcommittee of “outside directors” within the meeting of Section 162(m). For awards that are intended to be qualified under Rule 16b-3 promulgated by the SEC under the Exchange Act, or Rule 16b-3, such awards will be approved and administered by a committee or subcommittee of non-employee directors within the meaning of Rule 16b-3.
Except to the extent prohibited by applicable laws, the Compensation Committee may delegate all or any part of its duties and powers under the Enova LTIP to one or more persons, including directors, a committee of directors or to an officer under Rule 16a-1 of the Exchange Act, or Section 16 Officer, subject to such terms, conditions and limitations as the Compensation Committee may establish in its sole discretion. However, the Compensation Committee may not delegate its powers and duties under the Enova LTIP (i) with regard to directors or Section 16 Officers or (ii) in a manner that would cause an award designated as a Qualified Performance-Based Award (discussed below) not to qualify for, or to cease to qualify for, the Section 162(m) exemption.
Eligibility
The Compensation Committee will select grantees from among the employees, officers, directors and consultants of our Company and our affiliates (such as our subsidiaries). As of December 31, 2013, we had approximately 1,027 employees. As of the date of this prospectus we have seven directors. In determining the eligible individuals to be granted awards, we expect that the Compensation Committee will select those who, in its opinion, have the capacity for contributing in a substantial measure to our successful performance.
Shares Subject to the Enova LTIP
Subject to adjustment as described below, a maximum of 3,600,000 shares of common stock may be issued under the Enova LTIP. In addition, the Enova LTIP has the following limits:
| • | The aggregate number of shares of common stock available for granting options that are considered “incentive stock options” under Code Section 422, or Incentive Stock Options, may not exceed 475,000; |
| • | A maximum of 350,000 shares of common stock may be subject to Qualified Performance-Based Awards granted to any eligible person in any calendar year; |
| • | A maximum of 350,000 shares of common stock may be subject to options or stock appreciation rights, or SARs, granted to any eligible person in any calendar year; |
| • | The amount of compensation that may be earned by any eligible person under performance units granted in any one calendar year that are intended to be Qualified Performance-Based Awards may not exceed $6,000,000; and |
164
Table of Contents
| • | The maximum grant date fair market value (as defined in the plan) of all shares covered by awards granted during any calendar year to any director who is not an employee on the grant date of each such award (including director annual grant values described below) shall not exceed $500,000; provided, however, the Compensation Committee has the authority to grant up to an additional $750,000 in excess of the foregoing $500,000 limitation if the Compensation Committee determines that such director has provided, or is expected to provide extraordinary services during that calendar year. |
The individual award limitations set forth above are subject to adjustment in the event of a change in our capitalization (including, but not limited to, a change in the number of shares of our common stock outstanding), such as a stock split or stock dividend, a recapitalization, a combination or exchange of shares of common stock or a corporate transaction, such as any merger, consolidation, separation, including a spin-off, or other distribution of stock or property of Enova (including any extraordinary cash or stock dividend), any reorganization or any partial or complete liquidation of our Company, which we collectively refer to as a Corporate Change.
The shares of common stock that may be issued under the Enova LTIP may be authorized and unissued shares or treasury shares. Shares of common stock surrendered for the payment of the purchase price relating to an award or for the satisfaction of tax obligations relating to an award may not again be made available for granting future awards under the Enova LTIP. Also, if an award terminates without shares of common stock being issued, then the shares that were subject to the award will not be available for granting future awards under the Enova LTIP. In the event of a Corporate Change, the Compensation Committee shall make appropriate adjustments to the number of shares available for grants and to the number of shares and price under outstanding grants made before the event, which must be consistent with the restrictions of Section 409A.
Awards Under the Enova LTIP
General
The Compensation Committee will select persons to receive grants and determine the types of grants and number of shares or units covered by awards to grantees and set the terms, conditions and provisions of the grants consistent with the Enova LTIP. The Compensation Committee is authorized to grant awards in any of the following forms under the Enova LTIP:
| • | Stock Options. Stock options would allow the holder to purchase shares of our common stock at a price not less than the fair market value of the shares as of the grant date, or the exercise price. Stock options may be designated under the Code as nonqualified stock options (which may be granted to all participants) or “incentive stock options” under Code Section 422 (which may be granted to qualifying employees, but not to non–employee directors or prospective employees). The maximum term of each stock option under the Enova LTIP is ten years. |
| • | Stock Appreciation Rights. SARs may be granted as separate awards or in tandem with stock options, would give the holder the right to receive the difference (payable in cash, shares of common stock or a combination thereof) between the fair market value per share of common stock on the date of exercise, or if specified under the terms of the grant, the average selling price per share of common stock during a period of up to 30 days before the date of exercise, and the grant price of the award (which cannot be less than the fair market value of the underlying stock as of the grant date). The maximum term of SARs under the Enova LTIP is ten years. |
| • | Performance Units. Performance units are denominated in cash and vesting would be contingent upon the achievement of certain performance goals over a period of time established by our Compensation Committee at the time of grant. |
| • | Restricted Stock and Restricted Stock Units. Restricted stock is common stock that is issued subject to specified restrictions and RSUs represent the right to receive common stock or cash, measured by the value of our common stock, in the future. The grant or vesting of restricted stock or RSUs may be performance-based, time-based or both. |
165
Table of Contents
| • | Other Share Based or Share-Related Awards. Other share-based or share-related awards that are consistent with the purpose of the Enova LTIP and the interests of Enova are also permitted under the Enova LTIP. |
The terms and conditions of any awards granted under the Enova LTIP, including, as applicable, the nature and extent of restrictions on the awards, the duration of such restrictions, and any circumstance which could cause the forfeiture of such awards are to be determined by the Compensation Committee and set forth in a written award agreement. In addition, the award agreement will specify if dividends or dividend equivalents will be payable with respect to an equity-based award other than stock options and SARs, which shall be determined at the discretion of the Compensation Committee. The Enova LTIP does not permit the payment of dividends or dividend equivalents with respect to stock options or SARs. The award agreement will also specify the effect of termination of employment of an award recipient (by reason of death, retirement, disability or otherwise) during any applicable vesting period.
If permitted by the Compensation Committee for a given award, all or part of an award may be deferred (and paid in a form permitted by the Compensation Committee) at the election of a participant, provided that the deferral elections comply with Section 409A. To the extent that an award provides for deferred compensation subject to Section 409A, any cash payments made in lieu of the award may not change the timing of payment of such award.
Qualified Performance-Based Awards
Restricted stock, RSUs and performance units granted under the Enova LTIP may be designated by the Compensation Committee at the time of grant as “Qualified Performance-Based Awards” to “Covered Employees,” currently defined under Section 162(m) as the chief executive officer and the three highest compensated executive officers of a publicly traded corporation other than the chief executive officer and the chief financial officer. In general, Section 162(m) limits our deduction for compensation paid to each Covered Employee to an annual dollar limitation ($1,000,000), but permits certain performance-based pay to be deductible without regard to the dollar limitation. If the Compensation Committee grants Qualified Performance-Based Awards, payments under such awards would be intended to qualify as performance-based pay that could be deductible by us without regard to the annual dollar limitation of Section 162(m). The Compensation Committee has the sole discretion to determine whether to grant Qualified Performance-Based Awards, and deductibility will be only one of the factors considered in making that determination.
If Qualified Performance-Based Awards are granted, then the Compensation Committee will establish performance goals based on the attainment of certain specified measures set forth in the Enova LTIP with respect to our Company or our affiliates, or any division or department of the Company or an affiliate. These goals may be based on attaining specified levels of Company performance under one or more of the measures described in the Enova LTIP in absolute terms or relative to a base period or the performance of other companies.
The Compensation Committee will establish the relevant goals at a time when the outcome is substantially uncertain, and the Compensation Committee will certify whether the goals have been attained. This process of establishing goals and confirming their attainment is intended to comply with Section 162(m) so that payments under such awards may qualify as deductible performance-based pay.
Awards of stock options and SARs having a value based solely on the increase in the fair market value of the underlying shares of common stock after the date of grant will also qualify as performance-based pay under Section 162(m) without regard to whether the exercise of such stock options or SARs is conditioned on the attainment of one or more of the performance measures permitted by the Enova LTIP.
Stock options and SARs granted under the Enova LTIP after our first meeting of stockholders held more than 12 months after the separation and distribution will not qualify as performance-based compensation under Section 162(m) if the Enova LTIP is not approved by our public stockholders before the date they are granted.
166
Table of Contents
Payments made or shares of common stock issued under other types of performance-based awards after such stockholder’s meeting will not qualify as performance-based compensation under Section 162(m) if the Enova LTIP is not approved by our public stockholders before the awards are granted unless the payments or share issuances are conditioned upon such stockholder approval.
See “Compensation Actions Taken in Connection with the Separation and Distribution” for information regarding grants we expect to make to our executive officers under the Enova LTIP in connection with the distribution.
Change-in-Control
In the event of a change-in-control, which, unless otherwise specifically defined in the applicable award agreement, is an event that qualifies under Section 409A as a change in ownership, change in effective control or change in the ownership of a substantial portion of the assets of our Company or our applicable affiliate(s), or an Enova LTIP Change-in-Control, the Compensation Committee in its discretion may, at the time a grant is made or at any time thereafter, take one or more of the following actions, subject to the requirements of Section 409A: (i) provide for the acceleration of any time period relating to the exercise or vesting of an award, (ii) provide for the purchase or termination of the award for an amount of cash or other property that could have been received upon the exercise or realization of the award had the award been currently exercisable or payable, (iii) adjust the terms of the award in a manner determined by the Compensation Committee to reflect the Enova LTIP Change-in-Control, (iv) cause the award to be assumed, or new rights substituted therefore, by another entity, or (v) make such other provisions as the Compensation Committee may consider equitable and in the best interests of our Company.
Directors
Directors’ Restricted Stock Units
Unless otherwise determined by the Compensation Committee, each director who is a member of the Board of Directors and is not considered a Section 16 Officer will automatically be granted RSUs on the date of our annual meeting. The number of shares of common stock underlying each such award will be determined by dividing the grant value, which is the annual grant dollar value authorized by the Board of Directors not to exceed $250,000 per year, by the closing price of the common stock on the NYSE on the last trading day before the date of the annual meeting. See “Corporate Governance and Management—Director Compensation” for information regarding RSU grants that we will make to our directors shortly following the distribution.
The Enova LTIP provides that upon an Enova LTIP Change-in-Control, all unvested director RSUs will automatically vest, and each director who had received such RSU grants will be entitled to receive shares for such vested RSUs as of the date of the Enova LTIP Change-in-Control. The other terms and conditions of the RSU awards, including the circumstances that could cause the forfeiture of such awards and the vesting conditions are to be determined by the Compensation Committee and set forth in a written award agreement. The Compensation Committee will also determine the effect of the termination of board service of a recipient of RSUs (by reason of retirement, disability, death or otherwise) prior to the lapse of any applicable restrictions.
Directors’ Shares
Under the Enova LTIP, directors who are not also our employees may elect, on an annual basis, to have the payment of all or part (in 10% increments) of their annual retainers and any meeting (if any) fees deferred and credited to a bookkeeping account that is deemed invested in shares of common stock. As fees are deferred, we deposit an amount equal to the deferred fees into a Rabbi trust, which will be invested in shares of common stock. All dividends paid on the shares in the Rabbi trust will also be reinvested in shares of common stock and credited to the director’s bookkeeping account. The shares deposited into the Rabbi trust and other amounts
167
Table of Contents
credited to a director’s bookkeeping account will remain subject to the claims of our creditors, and the interests of the outside directors in the trust may not be sold, assigned, transferred or encumbered, except by will or by the laws of descent and distribution.
Amendment and Termination
The Compensation Committee generally has authority to amend awards and to accelerate vesting and/or exercisability of awards. However, the Compensation Committee may not amend an outstanding award without the consent of the holder of such award if it would adversely affect the rights of the holder of the award. In addition, the Compensation Committee may not adjust upward the amount payable to covered employees who have received awards that are considered to be Qualified Performance-Based Awards or waive or alter the performance goals associated with such an award in a manner that would cause the award to cease to qualify for an exemption from the application of Section 162(m). The Compensation Committee also cannot, except in the case of certain Corporate Changes, amend an outstanding stock option or SAR to reduce its exercise price or grant price, cancel an outstanding stock option or SAR and replace it with a new stock option or SAR having a lower exercise price or a lower grant price, respectively, exchange or authorize the repurchase of any existing stock option or SAR for cash or other awards if it would constitute a repricing or take any other action that would be treated as a repricing of the stock option or SAR unless approved by shareholders as required by applicable law. Any such adjustments to outstanding stock options or SARs must be in accordance with applicable restrictions of Section 409A.
The Board of Directors may amend, alter, suspend, discontinue or terminate the Enova LTIP or any portion thereof at any time, except that no such change may be made that would cause a participant to become subject to tax under Section 409A(a)(1) and no such change may be made without shareholder approval if the change (i) is required to be approved by shareholders to comply with applicable laws or rules, (ii) increases the number of shares of common stock reserved for issuance under the Enova LTIP, except for adjustments permitted by the Enova LTIP in connection with certain corporate transactions, or (iii) would cause us to be unable to grant Incentive Stock Options.
Clawback
The Enova LTIP contains a clawback provision that would allow us, in the event that there is a material restatement of our financial results, to (i) cancel part or all of the outstanding portion of any award, whether or not vested, and/or (ii) require a participant to repay an amount equal to all or any portion of the value of shares of common stock that have been issued and other payments that have been made to the participant pursuant to any award within the two years preceding the date on which we are required to prepare an accounting restatement, to the extent that such value or payment amount was based on the erroneous data and exceeded the value or amount that would have been paid to the participant under the accounting restatement. The Enova LTIP also permits us, to the extent required to comply with applicable laws and/or any compensation recovery or clawback policy adopted by us after the date the Enova LTIP is approved by our shareholders, to unilaterally amend the clawback provision in the Enova LTIP and such amendment shall be binding on all participants.
Federal Income Tax Consequences
Under current U.S. federal tax law, the following are the U.S. federal income tax consequences generally arising with respect to awards made under the Enova LTIP.
Exercise of Incentive Stock Option and Subsequent Sale of Shares
A participant who is granted an Incentive Stock Option does not realize taxable income at the time of the grant or at the time of exercise. If the participant holds the shares acquired through the exercise of an Incentive Stock
168
Table of Contents
Option until the later of two years after the date of grant or one year after the date of exercise, or the statutory holding period, any gain (or loss) realized on the disposition will be recognized as a long-term capital gain (or loss). Under such circumstances, we will not be entitled to any deduction for federal income tax purposes.
However, if the participant disposes of the shares during the statutory holding period, that will be considered a disqualifying disposition. If the amount realized in a disqualifying disposition exceeds the exercise price, the participant will recognize ordinary income from the disposition. The participant’s ordinary income generally will be the lesser of (i) the excess of the amount realized over the exercise price, or (ii) the excess of the fair market value of the shares at the time of the exercise over the exercise price. We generally will be entitled to a deduction for the amount of ordinary income recognized by the participant. We are not required to withhold, or pay employment taxes, on ordinary income that a participant recognizes upon a disqualifying disposition. If the amount realized from the disposition exceeds the fair market value of the shares at the time of exercise, the participant’s additional gain will be a capital gain. The capital gain will be long-term or short-term, depending on how long the participant holds the shares following the exercise.
Special tax rules apply when all or a portion of the exercise price of an Incentive Stock Option is paid by the delivery of shares the participant already owns, but generally it does not materially change the tax consequences described above. However, payment of the exercise price with shares that were acquired through the exercise of an Incentive Stock Option before such shares have satisfied the statutory holding period generally will result in the disqualifying disposition of the shares surrendered.
Exercise of Nonqualified Stock Option and Subsequent Sale of Shares
A participant who is granted a nonqualified stock option does not realize taxable income at the time of the grant, but does recognize ordinary income upon exercise of the option in an amount equal to the excess of the fair market value of the shares acquired over the exercise price. We generally will be entitled to a deduction for the amount of ordinary income recognized by such participant. The ordinary income recognized by the participant is considered supplemental wages and we are required to withhold, and we and the participant are required to pay, applicable employment taxes on that ordinary income.
When a participant disposes of shares acquired through the exercise of a nonqualified stock option, any gain (or loss) realized on such disposition will be recognized as a long-term, or short-term, capital gain (or loss) depending on how long the participant holds the shares following the exercise.
Lapse of Restrictions on Restricted Stock and Subsequent Sale of Shares
A participant who has been granted an award of restricted stock generally does not realize taxable income at the time of the grant. When the restrictions lapse, the participant will recognize ordinary income in an amount equal to the excess of the fair market value of the shares at such time over the amount, if any, paid for such shares, and we generally will be entitled to a deduction for the amount of ordinary income recognized by such participant. The ordinary income recognized by the participant is considered supplemental wages and we are required to withhold, and we and the participant are required to pay, applicable employment taxes on such ordinary income. Upon the subsequent disposition of the formerly restricted shares, any gain (or loss) realized on such disposition will be recognized as a long-term, or short-term, capital gain (or loss) depending on the participant’s holding period for the shares after their restrictions lapse.
Restricted Stock Units
A participant who has been awarded RSUs generally does not realize taxable income at the time of the grant. When shares are issued under the award, the participant will recognize ordinary income in an amount equal to the fair market value of the shares delivered at the time they are delivered and we generally will be entitled to a deduction for the amount of ordinary income recognized by such participant. The ordinary income recognized by
169
Table of Contents
the participant is considered supplemental wages and we are required to withhold, and we and the participant are required to pay, applicable employment taxes on such ordinary income. Upon disposition of the shares, any gain (or loss) realized on such disposition will be recognized as a long-term, or short-term, capital gain (or loss) depending on the participant’s holding period for the shares following their delivery.
SARs and Performance Units
A participant who is granted a SAR does not realize taxable income at the time of the grant, but does recognize ordinary income at the time of exercise of the SAR in an amount equal to the cash or fair market value of the shares (if any) received upon exercise of the SAR, and we generally will be entitled to a deduction for the amount of ordinary income recognized by such participant.
A participant who has been awarded a performance unit does not realize taxable income at the time of the grant, but does recognize ordinary income at the time the award is paid equal to the cash or the fair market value of shares (if any) delivered. We generally will be entitled to a deduction for the amount of ordinary income recognized by such participant.
The ordinary income recognized by a participant in connection with a SAR or performance unit award is considered supplemental wages and we are required to withhold, and we and the participant are required to pay, applicable employment taxes on such ordinary income.
To the extent, if any, that shares are delivered to a participant upon exercise of a SAR or in payment of amounts earned under a performance unit award, the participant’s gain (or loss) on the subsequent disposition of such shares will be recognized as a long-term, or short-term, capital gain (or loss) depending on the participant’s holding period for the shares following their delivery.
Directors’ Shares
A director who elects to have payment of his fees deferred and paid in the form of common stock does not realize taxable income at the time the fees are earned, but does recognize ordinary income at the time the common stock is distributed equal to the amount of the fair market value of shares delivered. We generally will be entitled to a deduction at that time for the amount of ordinary income recognized by the outside director.
Code Section 409A
Code Section 409A governs the tax treatment of nonqualified deferred compensation arrangements. Awards that provide for deferred compensation must comply with the requirements of Code Section 409A regarding the timing of participants’ elections to defer compensation, the events that can trigger the payment of deferred compensation and the timing of such payments. Certain officers may not begin to receive deferred compensation that is payable by reason of separation from service until six months after the officer separates from service.
Retirement and Other Benefits
On July 1, 2012, we established and now sponsor the Enova 401(k), the Enova NQSP, and the Enova SERP, in which our named executive officers and other eligible employees may now participate.
Severance Arrangements for Executives
On November 13, 2014 in connection with distribution, we entered into an Executive Change-in-Control Severance and Restrictive Covenant Agreement, or the CIC Agreements, with certain of our executive officers, including Mr. Fisher, Mr.Clifton, Mr. King, and Mr. Shteyn.
170
Table of Contents
The term, or the Term, of each CIC Agreement will continue in effect through November 13, 2016, with an automatic one-year extension at the end of the Term unless we or the relevant executive officer provides notice not to extend the Term on or before May 13, 2016. The Term will automatically be extended for subsequent one-year periods unless we or the executive officer provide notice not to extend the Term at least six months prior to the scheduled extension date. In addition, the Term will automatically be extended for two years following a Change-in-Control (as defined in the CIC Agreements).
The CIC Agreements provide the relevant executive officers with severance payments and certain benefits in the event of his termination by us without Cause (as defined in the CIC Agreements) or by the relevant executive officers for Good Reason (as defined in the CIC Agreements) during the twelve months following a Change-in-Control (as defined in the CIC Agreements). Such payments and benefits include the following: (i) a lump sum payment equal to the executive officer’s unpaid base salary, accrued vacation pay and unreimbursed business expenses, as well as all certain other items earned by and owed to such executive officer through the termination date; (ii) a lump sum payment equal to the pro rata portion of the executive officer’s annual target bonus amount for the year in which the termination occurs; (iii) a lump sum payment equal to (A) for Mr. Fisher, two times the higher of (1) his base salary in effect at the termination date and (2) his base salary in effect on the date of the Change-in-Control and (B) for all other executive officers, one times the higher of (1) his base salary in effect at the termination date and (2) his base salary in effect on the date of the Change-in-Control; (iv) a lump sum amount equal to (A) for Mr. Fisher, two times the higher of (1) his annual target bonus for the year in which the termination occurs and (2) the actual annual bonus payments made to Mr. Fisher for the year preceding the year in which the termination occurs and (B) for all other executive officers, one times the higher of (1) his annual target bonus for the year in which the termination occurs and (2) the actual annual bonus payments made to such executive officer for the year preceding the year in which the termination occurs; (v) the immediate vesting of any outstanding cash-based long term incentive awards held by the executive officer, including a lump sum payment for any vested awards (the value of which to be determined after the termination date in accordance with the CIC Agreements); (vi) the immediate vesting and lapse of all restrictions on any outstanding stock-based awards held by the executive officer to the extent not already provided for in the related grant agreement(s); (vii) equivalent payment for continued medical coverage under our group health plan and/or under our supplemental executive medical expense reimbursement plan for the executive and the executive’s dependents for a period of twenty-four months for Mr. Fisher or twelve months for all other executive officers following the termination date in accordance with the terms of the relevant CIC Agreement; and (ix) up to $50,000 for Mr. Fisher or $25,000 for all other executive officers for reimbursement of amounts paid by the executive officer for reasonable outplacement services from an executive search firm to the extent such expenses are incurred as a direct result of the separation from service and within twenty-four months for Mr. Fisher or twelve months for all other executive officers after the termination date.
Additionally, the CIC Agreements contain certain restrictive covenants to which the executive officers are subject. These include confidentiality, non-disclosure, non-solicitation and non-competition provisions. The term of the non-competition provision applies during the term of the executive officer’s employment through the twenty-four month period for Mr. Fisher or twelve month period for all other executive officers following termination, or the Subject Period. Such provision restricts the executive officer from competing with us or any of our subsidiaries or affiliates (including former subsidiaries or affiliates, which is collectively referred to as the Enterprise), by providing employment (other than to the Enterprise), management or consulting services, similar to those provided by the executive officer to the Enterprise with respect to any products or services similar to those offered or under development by the Company or any of its affiliates or subsidiaries anywhere within the Territory (as defined in the CIC Agreements) during the Subject Period.
The summaries of the material terms of these agreements are qualified in their entirety by reference to the full text of the applicable agreements, which are incorporated by reference into this prospectus.
In addition, we have adopted a severance pay plan for executives that provides guidance for severance pay, continued medical and health benefits, payment of accrued but unused paid time off and an allowance for outplacement services for our executive officers following certain terminations not related to a change-in-control.
171
Table of Contents
Compensation Actions Taken in Connection with the Separation and Distribution
Performance Unit Vesting
Prior to the distribution, we had cash-based performance unit awards outstanding that were granted by Cash America to our officers and certain other employees in 2012, 2013 and 2014. Any of the cash-based performance units granted in 2013 and 2014 that were scheduled to vest within twelve months from the date of separation vested on the effective date of the separation, with the vested value to be paid in cash. In addition, the cash-based performance unit awards that were granted to our officers and certain other employees in July 2012 that were scheduled to vest on January 1, 2015, which is their final vesting date, vested on the effective date of the separation and distribution, with the vested value to be paid in cash. See “See Certain Relationships and Related-Party Transactions—Related-Party Transactions” for information regarding the payments to be made to our executive officers in connection with the vesting of these performance units.
Enova LTIP Grants
Our Compensation Committee has approved long-term incentive awards under the Enova LTIP to be made to our executive officers, including our named executive officers. These awards will include (a) restricted stock units and (b) a special one-time grant of options to purchase Enova stock. These awards will be granted on the 30th day following the distribution date.
These awards are intended to replace the value of the outstanding performance units held by our named executive officers that are unvested and that will terminate (and will not be paid) on the date of the separation and distribution. In addition, while we expect that in the future we will grant annual long-term incentive awards under the Enova LTIP, we do not do not expect to grant annual long-term incentive awards to our named executive officers during 2015 in addition to these grants. These awards are also intended to be retention awards that are designed to minimize the risk of loss of our executive officers.
The value of the awards to our named executive officers will be comprised of 50% restricted stock units and 50% options to purchase Enova stock. The value of the awards to be made to our named executive officers are as follows:
| Name |
Value of Restricted Stock Unit Award (1) |
Value of Stock Option Award (2) |
||||||
| David A. Fisher |
$ | 3,390,975 | $ | 3,390,975 | ||||
| Robert S. Clifton |
$ | 549,809 | $ | 549,809 | ||||
| Alex T. King |
$ | 1,002,079 | $ | 1,002,079 | ||||
| Arad Levertov |
$ | 1,602,647 | $ | 1,602,647 | ||||
| Daniel Shteyn |
$ | 447,377 | $ | 447,377 | ||||
| (1) | The restricted stock units will vest in 25% increments on each of the first four anniversaries of the grant date. The number of restricted stock units to be granted will be determined based on the average closing price of our stock during the period starting with the first trading date of our stock, which will be the distribution date, and ending with the closing price on the day before the grant date. The grant date for the restricted stock unit awards will be the 30th day following the distribution date. |
| (2) | The special one-time grant of options will vest in 33% increments on each of the first three anniversaries of the grant date and will expire on the seventh anniversary of the grant date. The number of options to be granted will be determined using the Black Scholes pricing model, and the exercise price of the options will be the closing price on the day before the grant date. The grant date for the option awards will be the 30th day following the distribution date. The options will be granted with a limited stock appreciation right. |
172
Table of Contents
2013 Summary Compensation Table
The following table and footnotes discuss the compensation of our named executive officers:
| Name and Principal Position |
Year | Salary (1) | Bonus (1) (2) | Stock Awards (3) |
Non-Equity Incentive Plan Compensation (1) (4) (5) (6) |
All Other Compensation (7) |
Total | |||||||||||||||||||||
| David A. Fisher (8) |
2013 | $ | 472,500 | $ | — | $ | 687,189 | $ | 641,659 | $ | 77,008 | $ | 1,878,356 | |||||||||||||||
| President and Chief Executive Officer (Principal Executive Officer) |
||||||||||||||||||||||||||||
| Robert S. Clifton |
2013 | $ | 231,365 | $ | — | $ | — | $ | 487,753 | $ | 79,192 | $ | 798,310 | |||||||||||||||
| Vice President—Chief Financial Officer and Treasurer (Principal Financial Officer) |
||||||||||||||||||||||||||||
| Alex T. King |
2013 | $ | 339,673 | $ | 287,035 | $ | — | $ | 997,387 | $ | 84,701 | $ | 1,708,796 | |||||||||||||||
| Senior Vice President—Operations |
||||||||||||||||||||||||||||
| Arad Levertov |
2013 | $ | 273,525 | $ | 46,984 | $ | — | $ | 377,978 | $ | 54,000 | $ | 752,487 | |||||||||||||||
| Executive Vice President—Chief Operating Officer |
||||||||||||||||||||||||||||
| Daniel Shteyn (9) |
2013 | $ | 242,868 | $ | — | $ | — | $ | 209,124 | $ | 57,011 | $ | 509,003 | |||||||||||||||
| Vice President—Operations |
||||||||||||||||||||||||||||
| Timothy S. Ho (10) |
2013 | $ | 115,769 | $ | — | $ | — | $ | — | $ | 650,504 | $ | 766,273 | |||||||||||||||
| Former President (Former Principal Executive Officer) |
2012 | 428,846 | — | — | 1,233,122 | 107,707 | 1,769,675 | |||||||||||||||||||||
| 2011 | 411,539 | — | 616,634 | 1,193,033 | 97,258 | 2,318,464 | ||||||||||||||||||||||
| (1) | Portions of the amounts in these columns have been deferred under the Enova 401(k) plan or the Enova NQSP for certain of our named executive officers. |
| (2) | The amount in this column for Mr. King includes $233,334 that vested on December 31, 2013 under his Retention Bonus Agreement and was paid in January 2014. See “—Compensation Discussion and Analysis—2013 Compensation—Retention Bonus Agreement with Mr. King” for additional information. The other amounts in this column are discretionary bonuses based on individual contributions during 2013 and paid in January 2014 as follows: Mr. King: $53,701 and Mr. Levertov: $46,984. See “—Compensation Discussion and Analysis—2013 Compensation—Short-Term Incentive Compensation and Bonuses” for additional information regarding these bonus payments. |
| (3) | Mr. Fisher’s special one-time RSU grant consisted only of time-based RSUs granted under the Cash America LTIP. The amount shown represents the grant date fair value in compliance with ASC 718, for this RSU award. In accordance with ASC 718, the amount in this column was calculated by multiplying the number of RSUs granted by the closing stock price of Cash America’s common stock on the last trading day preceding the grant date, which was $48.19. |
| (4) | The 2013 amounts shown in this column reflect payments made in 2014 based on 2013 performance and are detailed in the following table: |
| Name |
2013 Actual STI Paid in 2014 (a) |
Paid in 2014 Based on 2013 Performance under the Terms of Performance Units Granted in February 2011 and January 2012 (b) |
Paid in 2014 Based on 2013 Performance under the Terms of Performance Units Granted in July 2012 (c) |
Paid in 2014 Based on 2013 Performance under the Terms of Performance Units Granted in March 2013 (d) |
Total | |||||||||||||||
| Mr. Fisher |
$ | 523,141 | $ | — | $ | — | $ | 118,518 | $ | 641,659 | ||||||||||
| Mr. Clifton |
73,636 | 340,560 | 40,943 | 32,614 | 487,753 | |||||||||||||||
| Mr. King |
230,411 | 567,510 | 98,821 | 100,645 | 997,387 | |||||||||||||||
| Mr. Levertov |
164,440 | 68,112 | 77,651 | 67,775 | 377,978 | |||||||||||||||
| Mr. Shteyn |
77,462 | 68,112 | 40,943 | 22,607 | 209,124 | |||||||||||||||
| Mr. Ho |
— | — | — | — | — | |||||||||||||||
| (a) | Reflects cash awards earned in 2013 and paid in 2014 under the Cash America 2013 STI plans. |
| (b) | The amount for Mr. Clifton reflects the payment made in 2014 for 50% of the Performance Units granted to Mr. Clifton in January 2012 that vested on January 1, 2014. The amounts for Messrs. King, Levertov and Shteyn reflect the payments made in 2014 for the portion of the Performance Units granted in February 2011 that vested on January 1, 2014 (which is 33 1/3% of the number of Performance Units granted to each executive). The final vesting date for these awards was January 1, 2014. See “—Compensation Discussion and Analysis—Compensation Prior to 2013” for additional information regarding these Performance Unit grants. |
| (c) | Reflects payments made in 2014 for the portion of the Performance Units granted in July 2012 that vested on January 1, 2014 (which is 16 2/3% of the number of Performance Units granted to each executive). See “—Compensation Discussion and Analysis—Compensation Prior to 2013” for additional information regarding this Performance Unit grant. |
| (d) | Reflects payments made in 2014 for the portion of the Performance Units granted in 2013 that vested on January 1, 2014 (which is 12.5% of the number of Performance Units granted to each executive). See “—Compensation Discussion and Analysis—2013 Compensation —Long-Term Incentive Compensation—Performance Units” for additional information. |
173
Table of Contents
| (5) | The 2012 amount shown in this column for Mr. Ho reflects payments made in 2013 based on 2012 performance and are detailed in the following schedule: |
| Name |
2012 Actual STI Paid in 2013 (a) |
Paid in 2013 Based on 2012 Performance under the Terms of Performance Units Granted in 2011 (b) |
Paid in 2013 Based on July— December 2012 Performance under the Terms of Performance Units Granted in July 2012 (c) |
Total | ||||||||||||
| Mr. Ho |
$ | 315,046 | $ | 815,208 | $ | 102,868 | $ | 1,233,122 | ||||||||
| (a) | Reflects amount earned in 2012 and paid in 2013 under the Cash America 2012 STI plan. |
| (b) | Reflects a payment made in 2013 for the portion of the Performance Units granted in February 2011 that vested on January 1, 2013 (which is 33 1/3% of the number of Performance Units granted to Mr. Ho). See “—Compensation Discussion and Analysis—Compensation Prior to 2013” for additional information. |
| (c) | Reflects a payment made in 2013 for the portion of the Performance Units granted in July 2012 that vested on January 1, 2013 (which is 16 2/3% of the number of Performance Units granted to Mr. Ho in July 2012). See “—Compensation Discussion and Analysis—Compensation Prior to 2013” for additional information. |
| (6) | The 2011 amount shown in this column for Mr. Ho reflects payments made in 2012 based on 2011 performance and are detailed in the following schedule: |
| Name |
2011 Actual STI Paid in 2012 (a) |
Paid in 2012 Based on 2011 Performance under the Terms of Performance Units Granted in 2011 (b) |
Total | |||||||||
| Mr. Ho |
$ | 521,028 | $ | 672,005 | $ | 1,193,033 | ||||||
| (a) | Reflects amount earned in 2011 and paid in 2012 under the Cash America 2011 STI plan. |
| (b) | Reflects a payment made in 2012 for the portion of the Performance Units granted in February 2011 that vested on January 1, 2012 (which is 33 1/3% of the number of Performance Units granted to Mr. Ho). |
| (7) | The 2013 amounts shown include the following: |
| Name |
Nonqualified Savings Plan Contributions by Enova |
SERP Contributions by Enova (a) |
401(k) Contributions by Enova |
Canada Retirement Savings Plan Contributions by Enova |
Perquisites, Personal Benefits and Other (b) |
Total | ||||||||||||||||||
| Mr. Fisher |
$ | — | $ | 49,613 | $ | 4,712 | $ | — | $ | 22,683 | $ | 77,008 | ||||||||||||
| Mr. Clifton |
— | 13,024 | 3,825 | — | 62,343 | 79,192 | ||||||||||||||||||
| Mr. King |
6,261 | 33,350 | 6,375 | — | 38,715 | 84,701 | ||||||||||||||||||
| Mr. Levertov |
— | 15,634 | — | — | 38,366 | 54,000 | ||||||||||||||||||
| Mr. Shteyn |
— | — | — | 27,728 | 29,283 | 57,011 | ||||||||||||||||||
| Mr. Ho |
4,395 | — | 6,375 | — | 639,734 | (c) | 650,504 | |||||||||||||||||
| (a) | Includes contributions made by Enova in 2014 that were earned in 2013. |
| (b) | Consists of supplemental health care and insurance benefits for all of the named executive officers, an auto allowance for all of our named executive officers other than Mr. Fisher and Mr. Ho, allowances for club dues and / or professional financial services for Messrs. Clifton, King, Levertov, and Shteyn, relocation costs paid on behalf of Mr. Clifton (including $7,544 of related tax gross-up), an employee recognition award paid to Mr. Ho (including $5 of related tax gross-up), and amounts paid or payable under Mr. Ho’s Continued Employment and Separation Agreement and the Springleaf Amendment. The amount of supplemental health care and insurance benefits for each of Messrs. Clifton and Levertov is $25,224. Except as noted below with respect to Mr. Ho, none of the other individual amounts exceed the greater of $25,000 or 10% of the total amount of perquisites and personal benefits for the applicable named executive officer. |
| (c) | In addition to Mr. Ho’s supplemental health care and insurance benefits for 2013, this amount includes $595,000 payable to Mr. Ho over the 24-month period following Mr. Ho’s separation and a lump sum payment made in 2013 for Mr. Ho’s accrued and unused paid time off. See “—Compensation Discussion and Analysis—2013 Compensation—Continued Employment and Separation Agreement for Mr. Ho” for additional information. |
| (8) | Mr. Fisher joined Enova on January 29, 2013. |
| (9) | Mr. Shteyn’s cash-based Performance Units and $12,000 of Mr. Shteyn’s perquisites were denominated in U.S. dollars. All other payments to Mr. Shteyn were denominated in CAD. All CAD-denominated payments made to Mr. Shteyn have been converted into U.S. dollars at a rate of $0.971470 per CAD, which is the average of the daily exchange rates for each month used to translate the 2013 results of our Canadian operations to U.S. dollars for U.S. financial reporting. |
| (10) | Mr. Ho left Enova on March 29, 2013. |
174
Table of Contents
Grants of Plan-based Awards for 2013
The following table provides information about the equity and non-equity awards made to our named executive officers under the Cash America LTIP and our STI plans during 2013.
| Name |
Grant Date | Performance Units Granted (#) |
Estimated Possible Payouts under Non-Equity Incentive Plan Awards |
All Other Stock Awards: Number of Shares of Stock or Units (#) (1) |
Grant Date Fair Value of Stock and Option Awards ($) (2) |
|||||||||||||||||||||||
| Threshold ($) | Target ($) | Maximum ($) | ||||||||||||||||||||||||||
| David A. Fisher |
2/14/13 | (3) | — | $ | 272,659 | $ | 363,545 | $ | 727,090 | — | — | |||||||||||||||||
| 3/28/13 | (4) | 13,668 | $ | 65,637 | $ | 787,500 | $ | 2,362,500 | — | — | ||||||||||||||||||
| 1/29/13 | — | — | — | — | 14,260 | $ | 687,189 | |||||||||||||||||||||
| Robert S. Clifton |
2/14/13 | (3) | — | — | $ | 69,548 | $ | 278,192 | — | — | ||||||||||||||||||
| 3/28/13 | (4) | 3,445 | $ | 16,544 | $ | 198,475 | $ | 595,425 | — | — | ||||||||||||||||||
| Alex T. King |
2/14/13 | (3) | — | — | $ | 161,039 | $ | 644,156 | — | — | ||||||||||||||||||
| 3/28/13 | (4) | 10,631 | $ | 51,052 | $ | 612,500 | $ | 1,837,500 | — | — | ||||||||||||||||||
| Arad Levertov |
2/14/13 | (3) | — | — | $ | 82,093 | $ | 328,372 | — | — | ||||||||||||||||||
| 3/28/13 | (4) | 7,159 | $ | 34,379 | $ | 412,500 | $ | 1,237,500 | — | — | ||||||||||||||||||
| Daniel Shteyn |
2/14/13 | (3) | — | — | $ | 72,861 | $ | 291,444 | — | — | ||||||||||||||||||
| 3/28/13 | (4) | 2,388 | $ | 11,468 | $ | 137,602 | $ | 412,806 | — | — | ||||||||||||||||||
| Timothy S. Ho (5) |
— | — | — | — | — | — | — | |||||||||||||||||||||
| (1) | A time-based RSU award was made to Mr. Fisher under the Cash America LTIP in 2013. See “—Compensation Discussion and Analysis—2013 Compensation—Long-Term Incentive Compensation—Restricted Stock Units,” for further information. |
| (2) | The amount shown represents the grant date fair value in compliance with ASC 718 for RSU awards that were granted under the Cash America LTIP. In accordance with ASC 718, the grant date fair value is based on the closing stock price of Cash America common stock on the last trading day before the grant date, which was $48.19 for the RSUs granted to Mr. Fisher. |
| (3) | The amounts shown represent potential cash-based payments under our 2013 STI plans. See “—Compensation Discussion and Analysis—2013 Compensation—Short-Term Incentive Compensation and Bonuses” for additional information regarding our 2013 STI plans, including a description of the Earnings Threshold and Earnings Target under the plans covering our named executive officers. The threshold amount shown for Mr. Fisher represents 75% of his 2013 STI Target Award in accordance with the Fisher Letter Agreement. The actual payments that our named executive officers received under the Cash America 2013 STI plans are included in the “Non-Equity Incentive Compensation” column of the Summary Compensation Table. Mr. Shteyn’s 2013 STI award was denominated in CAD and has been converted into U.S. dollars at a rate of $0.971470 per CAD, as described in footnote 9 of the Summary Compensation Table. |
| (4) | Represent grants of cash-based Performance Units made during 2013 under the Cash America LTIP. The threshold values were not specified in the Performance Unit award agreements, but the E-Commerce Division must achieve the EBITDA Growth Requirement through each applicable vesting date for any portion of the awards to vest on that date. The threshold amounts represent the minimum amount that would be paid to each named executive officer if the minimum EBITDA Growth Requirement that is required for vesting were achieved only as of the first vesting date of the award. The targeted value assumes target performance over the three-year term of the grant, and the maximum amount that may be paid under these Performance Unit grants is 300% of the target amount. See “—Compensation Discussion and Analysis—2013 Compensation—Long-Term Incentive Compensation—Performance Units” for additional information regarding these Performance Units. The actual payments that our named executive officers received in February 2014 for the portion of their 2013 Performance Unit awards that vested on January 1, 2014 is included in the “Non-Equity Incentive Plan Compensation” column in the Summary Compensation Table. |
| (5) | Mr. Ho left Enova on March 29, 2013 and did not participate in the 2013 Cash America STI plan or receive grants under the Cash America LTIP during 2013. |
175
Table of Contents
Outstanding Equity Awards at 2013 Year End
The following table provides information on our named executive officers’ holdings of unvested RSUs of Cash America as of December 31, 2013. All shares refer to shares of Cash America common stock.
| Stock Awards | ||||||||
| Name |
Number of Shares or Units of Stock That Have Not Vested (1) |
Market Value of Shares or Units of Stock That Have Not Vested (2) |
||||||
| David A. Fisher |
14,260 | $ | 546,158 | |||||
| Robert S. Clifton |
— | — | ||||||
| Alex T. King |
— | — | ||||||
| Arad Levertov |
— | — | ||||||
| Daniel Shteyn |
— | — | ||||||
| Timothy S. Ho (3) |
— | — | ||||||
| (1) | Includes a grant of time-based RSUs to Mr. Fisher on January 29, 2013 under the Cash America LTIP that vested on the date of the distribution. See “—Compensation Discussion and Analysis—2013 Compensation—Long-Term Incentive Compensation—Restricted Stock Units” for additional information regarding Mr. Fisher’s RSU grant in 2013. |
| (2) | The market value of the unvested RSUs is based on the closing price of Cash America’s common stock as of December 30, 2013, which was $38.30. |
| (3) | Mr. Ho’s unvested RSUs, all of which were granted on January 26, 2011, were forfeited when he left Enova on March 29, 2013. The number forfeited consisted of 4,663 time-based RSUs and a maximum of 6,219 performance-based RSUs. |
Option Exercises and Stock Vested in 2013
The following table provides information on the aggregate number of shares acquired in 2013 upon the vesting of RSUs and the value realized, each before payment of any applicable withholding tax and broker commissions. All shares refer to shares of Cash America common stock.
| Stock Awards | ||||||||
| Name |
Number of Shares Acquired on Vesting (1) |
Value Realized on Vesting (2) |
||||||
| David A. Fisher |
— | — | ||||||
| Robert S. Clifton |
— | — | ||||||
| Alex T. King |
— | — | ||||||
| Arad Levertov |
— | — | ||||||
| Daniel Shteyn |
— | — | ||||||
| Timothy S. Ho |
2,333 | $ | 112,474 | |||||
| (1) | Reflects the number of shares acquired by Mr. Ho in 2013 upon the vesting on January 31, 2013 of time-based RSUs that were granted on January 26, 2011 under the Cash America LTIP. |
| (2) | Value reflects the closing price of Cash America common stock on the last trading day preceding the vesting date. |
176
Table of Contents
Nonqualified Deferred Compensation for 2013
The following table shows compensation deferred by each named executive officer under the Enova NQSP and the Enova SERP and, with respect to Mr. Clifton, amounts previously deferred under the Cash America Nonqualified Savings Plan, or the Cash America NQSP. Additional information about the Enova NQSP and the Enova SERP is included under “—Compensation Discussion and Analysis—2013 Compensation—Retirement and Other Benefits.”
| Name |
Plan | Executive Contributions in 2013 (1) |
Company Contributions in 2013 (2) |
Aggregate Earnings in 2013 (3) |
Aggregate Withdrawals/ Distributions (4) |
Aggregate Balance at 12/31/2013 (5) (6) |
||||||||||||||||
| David A. Fisher |
Enova NQSP | $ | — | $ | — | $ | — | $ | — | $ | — | |||||||||||
| Enova SERP | — | 49,613 | — | — | 49,613 | |||||||||||||||||
| Robert S. Clifton |
Enova NQSP and Cash America NQSP |
— | — | 11,304 | 44,398 | 54,045 | ||||||||||||||||
| Enova SERP | — | 13,024 | 1,976 | — | 25,329 | |||||||||||||||||
| Alex T. King |
Enova NQSP | 25,271 | 6,261 | 17,003 | — | 96,318 | ||||||||||||||||
| Enova SERP | — | 33,350 | 21,369 | — | 145,294 | |||||||||||||||||
| Arad Levertov |
Enova NQSP | — | — | — | — | — | ||||||||||||||||
| Enova SERP | — | 15,634 | 2,543 | — | 31,494 | |||||||||||||||||
| Daniel Shteyn (7) |
Enova NQSP | — | — | — | — | — | ||||||||||||||||
| Enova SERP | — | — | — | — | — | |||||||||||||||||
| Timothy S. Ho (8) |
Enova NQSP | 21,541 | 4,395 | 6,494 | 189,760 | — | ||||||||||||||||
| Enova SERP | — | — | 12,574 | 318,914 | — | |||||||||||||||||
| (1) | All executive contributions to the Enova NQSP described in this column are included within amounts reported in the “Salary” and “Non-Equity Incentive Plan Compensation” columns of the Summary Compensation Table for 2013. |
| (2) | All Company contributions to the Enova NQSP and the Enova SERP described in this column are included within the “All Other Compensation” column of the Summary Compensation Table for 2013. The contributions to the Enova SERP specified in this column reflect the contributions that were earned in 2013 and made in February 2014. |
| (3) | The amounts in this column, which are not included in the Summary Compensation Table, reflect the rate of return on hypothetical investments that each named executive officer has selected for his Enova NQSP and Enova SERP accounts from an array of investment options that may be changed by the participant in each plan at any time and that generally mirrors the funds in the Enova 401(k) plan. The 2013 annual rates of return for the investment options available for all or most of the calendar year ended December 31, 2013, as reported by the record keeper of the plans, were as follows: |
| Name of Fund |
Rate of Return |
Name of Fund |
Rate of Return |
|||||||
| PIMCO Total Return Admin |
(2.17 | )% | Artisan Mid Cap Inv |
37.39 | % | |||||
| Oakmark Equity & Income 1 |
24.25 | T. Rowe Price Small Cap Value |
32.74 | |||||||
| BlackRock Equity Dividend A |
24.35 | Thornburg International Value R5 |
15.63 | |||||||
| Fidelity Spartan 500 Index Advantage |
32.33 | Vanguard Money Market |
0.02 | |||||||
| Harbor Capital Appreciation Adm. |
37.30 | |||||||||
177
Table of Contents
On December 18, 2013 two of the investment options available under the Enova NQSP and the Enova SERP were replaced. The BlackRock Equity Dividend A fund was replaced with the Invesco Comstock fund and the Thornburg International Value R5 fund was replaced with the Oakmark International fund. The 2013 annual rates of return for the replacement investment options, as reported by the record keeper of the plans, were as follows:
| Name of Fund |
Rate of Return |
Name of Fund |
Rate of Return |
|||||||
| Invesco Comstock |
35.24 | % | Oakmark International |
29.34 | % | |||||
| (4) | The amount shown for Mr. Clifton represents a distribution from the Cash America NQSP. Mr. Clifton previously was employed by Cash America and participated in the Cash America NQSP until he left Cash America in July 2010. He had elected to receive a portion of his Cash America NQSP account balance in annual installments following his separation from service. As required by tax regulations, that election remained in effect after Mr. Clifton joined Enova in December 2011. |
| (5) | Includes the 2013 Enova SERP contributions shown under the “Company Contributions in 2013” column that were made in February 2014 for the named executive officers that were employed as of December 31, 2013. |
| (6) | Mr. Fisher was not vested in any portion of his Enova SERP balance at December 31, 2013. Messrs. Clifton and King were fully vested in their Enova NQSP and Enova SERP balances at December 31, 2013. The vested portion of Mr. Levertov’s Enova SERP balance at December 31, 2013 was $25,195. |
| (7) | Mr. Shteyn does not participate in the Enova NQSP or the Enova SERP. |
| (8) | Mr. Ho was fully vested when he left Enova on March 29, 2013. |
Potential Payments upon Termination or Change-in-Control
The following includes information regarding potential payments that could have been made to our named executive officers in connection with a termination or upon a change-in-control prior to the distribution. On the date of the distribution, we entered into the CIC Agreements with certain of our executive officers, including Mr. Fisher, Mr.Clifton, Mr. King, and Mr. Shteyn. In connection with the distribution, we also adopted a severance pay plan for executives that we may follow in the case of an involuntary termination. See “—Plans We Have Adopted—Severance Arrangements for Executives” for additional information. The information regarding the Enova SERP and Enova NQSP will continue to be applicable to our named executive officers, as these are Enova plans that were adopted prior to the distribution and will continue to be used following the distribution.
Payments Made Upon Resignation, Retirement, Termination, Death or Disability
Severance Pay Plan for Executives. While Cash America severance agreements are generally handled on a case-by-case basis and are subject to the discretion of Cash America’s Chief Executive Officer and the Cash America Compensation Committee, Cash America’s Severance Pay Plan for Executives provides compensation guidance in the case of an involuntary termination of our officers. Under Cash America’s Severance Pay Plan for Executives each of our named executive officers could have received severance pay or benefits if his employment was involuntarily terminated due to restructuring, job elimination or other circumstances that Cash America determines warrant the provision of severance benefits. Upon termination of employment for any of these reasons, if the executive agreed to a general release of Cash America and its affiliates related to employment claims arising from the termination and a promise to comply with confidentiality, noncompetition and/or nonsolicitation provisions, the executive generally would have been be entitled to severance pay equal to the number of months of base salary and payable over the period reflected in the table below:
| Years of Employment |
Vice President | Senior Vice President | President or CEO of a Division of Cash America |
|||||||||
| 1 but less than 5 |
4 months | 6 months | 12 months | |||||||||
| 5 but less than 10 |
6 months | 9 months | 18 months | |||||||||
| 10 but less than 15 |
9 months | 12 months | 24 months | |||||||||
| 15 or more |
12 months | 18 months | 24 months | |||||||||
178
Table of Contents
In addition, each executive would have received:
| • | Continued medical and health care benefits for the shorter of the period set forth in the table above or the period during which the former executive is covered by COBRA, with our continuing to pay the portion of COBRA premiums that exceed the portion of health care premiums that current employees are required to pay, or Employer COBRA Premiums, and for the costs of supplemental health care benefits in excess of the amount current executives are required to pay, or Employer Supplemental Executive Health Care Premiums; and |
| • | A lump sum equal to all accrued but unpaid vacation and paid time off. |
Other benefits and perquisites would cease on the officer’s termination date.
Regardless of whether a named executive officer’s employment terminates due to retirement, resignation, involuntary termination, death or disability, he is entitled to receive amounts earned during his term of employment. Such amounts include: unpaid non-equity incentive compensation earned during the previous year under the STI plan; vested grants under the Cash America LTIP or any previous incentive plan; and vested contributions and earnings under the Enova 401(k) plan, the Enova NQSP and the Enova SERP. In addition, if the named executive officer dies, his estate would receive payments under the group life insurance plan.
Each named executive officer would have forfeited any unvested Cash America RSUs or cash-based Performance Units granted under the Cash America LTIP upon his resignation, retirement or any termination, including by reason of his disability or death, except as described below for terminations during specified periods following a change-in-control. Under the Cash America LTIP the Cash America Compensation Committee has the discretion to amend an award agreement so as to allow for vesting of unvested RSUs, unless such amendment would (a) adversely affect the rights of the holder of such award without such holder’s consent, (b) cause the award to cease to qualify, if applicable, for an exemption under Code Section 162(m) or (c) cause the recipient to become subject to tax under Code Section 409A(a)(1).
In all cases Cash America had complete discretionary authority to award greater or lesser amounts of severance pay and benefits.
Retention Bonus Agreement with Mr. King.
Under the Retention Bonus Agreement, Mr. King is entitled to receive any unvested portion of his retention bonuses if he (i) is involuntarily terminated without cause, (ii) voluntarily terminates his employment for good reason (including a reduction in his duties or compensation or certain changes in his place of employment), (iii) dies or (iv) becomes disabled prior to the applicable vesting date for that portion of the retention bonus. See “—Compensation Discussion and Analysis—2013 Compensation—Retention Bonus Agreement with Mr. King” for additional information.
Payments made Upon a Change-in-Control
Cash America’s Executive Change-in-Control Severance Agreements with Cash America’s named executive officers other than its chief executive officer, including Mr. Fisher, specify the payments that Cash America’s named executive officers are to receive if they are terminated in connection with or during a specified period following a change-in-control.
Cash America’s Executive Change-in-Control Severance Agreements.
Cash America’s Executive Change-in-Control Severance Agreement with Mr. Fisher provided that if, within 24 months after a “change-in-control” of Cash America, Cash America terminated Mr. Fisher without cause or if Mr. Fisher voluntarily terminated his employment with good reason (including a reduction in his duties or compensation or relocation of place of employment), then Mr. Fisher would have been entitled to:
| • | earned and unpaid salary; |
179
Table of Contents
| • | a pro-rated portion of the target annual bonus (or short-term incentive compensation) under the existing bonus (or short-term incentive compensation) plan based on the number of months employed during the year; |
| • | a lump sum equal to all accrued but unpaid vacation and paid time off; |
| • | a lump sum equal to two times the higher of Mr. Fisher’s annual rate of base salary on the date of termination or on the date of change-in-control; |
| • | a lump sum equal to two times the greater of (i) the target bonus (or short-term incentive compensation) for the year, or (ii) the actual bonus (or short-term incentive compensation) for the preceding year; |
| • | immediate vesting of any outstanding unvested cash-based and equity-based long-term incentive awards with the amount paid with respect to (i) cash-based awards to be equal to the greater of (A) the amount calculated under the award agreement based on the higher of the target or the actual achievement of the performance goals or (B) the amount to which Mr. Fisher would be entitled under the provisions of the award agreement, and (ii) performance-based equity awards to be equal to the maximum amount available under each award; |
| • | continued medical and health care benefits for 24 months, consisting of Employer COBRA Premiums to be paid over an 18-month period and an amount equal to (i) six times the first monthly Employer COBRA Premium and (ii) 24 times the first monthly Employer Supplemental Executive Health Care Premium, paid in a lump sum; and |
| • | executive placement services from an executive search/placement firm of up to $50,000. |
Certain payments under Cash America’s Executive Change-in-Control Severance Agreements will be delayed for six months if required by Code Section 409A of the Internal Revenue Code. In addition, Cash America’s Executive Change-in-Control Severance Agreements provide that a change-in-control is deemed to occur under the circumstances described below under “Change-in-Control Definitions.”
In connection with the separation and distribution, Mr. Fisher’s Executive Change-in-Control Severance Agreement with Cash America was terminated, as he is no longer an executive officer of Cash America. Mr. Fisher and certain of our other executive officers entered into a CIC Agreement with us on the distribution date, as further described under “Plans We Have Adopted—Severance Arrangements for Executives.”
Accelerated Vesting of Awards under the Cash America Long-Term Incentive Plan.
The agreements relating to the RSUs granted under the Cash America LTIP provided that the vesting and payment of RSUs would be accelerated if there is a change-in-control. The agreements related to the cash-based Performance Units granted under the Cash America LTIP provided that accelerated vesting and payment of the Performance Units that are scheduled to vest within twelve months of the change-in-control would be accelerated if there is a change-in-control, provided that the CAGR growth requirements under the award agreements were met as of the date of the change-in-control. In addition, the agreements related to the cash-based Performance Units granted in July 2012 provided for accelerated vesting and payment (subject to CAGR requirements) of the outstanding portion of the July 2012 awards for which the payment value is based on performance through a year ending before the date of the change-in-control.
Accelerated Vesting under the Enova SERP and the Enova NQSP. The Enova SERP provides that the vesting under the Enova SERP would be accelerated if there is a change-in-control or if the executive’s employment is terminated as a result of his job being abolished. The Enova NQSP provides that the vesting of the unvested portion of Enova’s matching amounts contributed to a named executive officer’s Enova NQSP account would accelerate in the event of a change-in-control or if the executive’s employment is terminated as a result of death or disability or of his job being abolished. The accelerated vesting provisions for the Enova SERP and Enova NQSP continue to be applicable to our named executive officers following the distribution.
180
Table of Contents
Change-in-Control Definitions.
Cash America’s Change-in-Control Severance Agreement with Mr. Fisher and the RSU awards and Performance Unit awards granted under the Cash America LTIP each provided that a change-in-control would have been deemed to occur:
| • | if any person or group acquired ownership of Cash America stock that, together with all other Cash America stock held by that person or group, constituted more than 50% of the total voting power or total fair market value of the stock of Cash America; |
| • | if, during any 12-month period, any person or group acquired ownership of Cash America stock with at least 35% of the total voting power; |
| • | if, during any 12-month period, a majority of the Cash America directors at the beginning of such period were replaced, other than in specific circumstances; or |
| • | if, during any 12-month period, any person or group acquired assets of Cash America with an aggregate fair market value of at least 50% of the fair market value of all of Cash America’s gross assets immediately prior to such acquisition or acquisitions. |
The Enova SERP and the Enova NQSP both provide that a change-in-control is deemed to occur:
| • | if any person or group acquires ownership of Enova stock that, together with all of Enova’s other stock held by that person or group, constitutes more than 50% of the total voting power or total fair market value of Enova stock; |
| • | if, during any 12-month period, any person or group acquires ownership of Enova stock with at least 30% of the total voting power; |
| • | if, during any 12-month period, a majority of the Enova directors at the beginning of such period are replaced, other than in specific circumstances; or |
| • | if, during any 12-month period, any person or group acquires Enova’s assets with an aggregate fair market value of at least 40% of the fair market value of all of Enova’s gross assets immediately prior to such acquisition or acquisitions. Cash America’s change in ownership of our stock, through a public offering or otherwise, is not considered a change-in-control under the Enova SERP or the Enova NQSP. |
Distribution of Nonqualified Deferred Compensation
Our named executive officers are entitled to receive the vested amounts in their accounts under the Enova NQSP and the Enova SERP if their employment with us and with Cash America terminates. The last column in the Nonqualified Deferred Compensation Table reports each named executive officer’s aggregate balance at December 31, 2013 under each plan. All of our named executive officers except for Mr. Fisher and Mr. Levertov were fully vested in their Enova SERP balances at December 31, 2013. Mr. Levertov’s vested Enova SERP balance is shown in footnote 6 of the Nonqualified Deferred Compensation Table. Mr. Fisher was not vested in any of his Enova SERP balance at December 31, 2013. All of our named executive officers who had balances in the Enova NQSP at December 31, 2013 were fully vested. The account balances continue to be credited with increases or decreases reflecting changes in the value of the investments against which the account balances are calculated, and to accrue interest income or dividend payments, as applicable, between the termination event and the date distributions are made. Therefore, amounts that the named executive officer would actually receive would differ from those shown in the Nonqualified Deferred Compensation Table or, in Mr. Levertov’s case, in footnote 6 to the Nonqualified Deferred Compensation Table.
Potential Payments
The following tables and disclosures show potential payments to our named executive officers, except Mr. Ho, under Cash America’s contracts, agreements, plans or arrangements, whether written or unwritten, for various scenarios involving a change-in-control or termination of employment, assuming a December 31, 2013
181
Table of Contents
termination date (which was prior to consummation of the distribution and entry into the new Enova CIC Agreements (as discussed above in “—Severance Agreements for Executives”)) and, where applicable, using the closing price of Cash America’s common stock of $38.30 (as reported on the NYSE as of December 31, 2013), and assuming that the applicable named executive officers had met requirements under our or Cash America’s incentive compensation plans that the executive be employed as of year-end to receive benefits relating to the year. As of December 31, 2013, each executive had received all of the base salary earned during 2013, except for the portion earned in the final payroll period that began in 2013 and ended in 2014.
Mr. Ho left Enova on March 29, 2013. See “2013 Compensation—Continued Employment and Separation Agreement for Mr. Ho” and the Summary Compensation Table for information regarding amounts paid to Mr. Ho in connection with his separation from Enova.
David A. Fisher
| Retirement, Death or Disability |
Involuntary Termination Other than for Cause (1) |
Involuntary Termination Other than for Cause/ Voluntary Termination with Good Reason Following a Change-in- Control |
||||||||||
| Severance |
$ | — | $ | $ | 1,777,090 | (2) | ||||||
| Short-term incentive compensation |
523,141 | (3) | 523,141 | (3) | 363,545 | (4) | ||||||
| Accelerated vesting of Cash America LTIP RSU awards |
— | — | 546,158 | (5) | ||||||||
| Accelerated vesting of Cash America LTIP Performance Unit Awards |
— | — | 948,144 | (6) | ||||||||
| Accelerated vesting of SERP balance |
— | — | 49,613 | (7) | ||||||||
| Continued health benefits |
— | — | 70,145 | (8) | ||||||||
| Accrued & unused paid time off |
42,404 | (9)(10) | 42,404 | (9) | 42,404 | (9) | ||||||
| Outplacement benefits |
— | — | 50,000 | |||||||||
|
|
|
|
|
|
|
|||||||
| Total |
$ | 565,545 | $ | 565,545 | $ | 3,847,099 | ||||||
|
|
|
|
|
|
|
|||||||
| (1) | Mr. Fisher was employed for less than one year as of December 31, 2013 and would not have been eligible for payments under our Severance Pay Plan for Executives if his employment had been involuntarily terminated on that date. |
| (2) | This amount is (a) two times Mr. Fisher’s base salary as of December 31, 2013 and (b) two times his target STI award that would be payable under the terms of Cash America’s 2013 STI plan. To be paid as a lump sum. |
| (3) | This amount is the actual 2013 STI award paid to Mr. Fisher. |
| (4) | This amount is the target award under the 2013 STI plan. |
| (5) | Includes all unvested time-based RSUs. |
| (6) | This is the value, based on the actual performance of the e-commerce segment, as of December 31, 2013, of all unvested 13,668 cash-based Performance Units granted to Mr. Fisher under the Cash America LTIP during 2013. |
| (7) | Represents the unvested portion of Mr. Fisher’s Enova SERP balance at December 31, 2013. |
| (8) | Consists of Employer COBRA Premiums to be paid over an 18-month period and an amount equal to (i) six times the first monthly Employer COBRA Premium and (ii) 24 times the first monthly Employer Supplemental Executive Health Care Premium, paid in a lump sum. |
| (9) | Calculated based on Mr. Fisher’s salary at December 31, 2013. Assumes none of Mr. Fisher’s 168 hours of accrued paid time off available for the 2013 year had been used. |
| (10) | Under certain circumstances, the state where Mr. Fisher is employed requires payment of accrued and unused vacation. |
182
Table of Contents
Robert S. Clifton
| Resignation, Retirement, Death or Disability |
Involuntary Termination Other than for Cause |
Involuntary Termination Other than for Cause Following a Change- in- Control |
Voluntary Termination Following a Change- in-Control |
|||||||||||||
| Severance |
$ | — | $ | 77,833 | (1) | $ | 77,833 | (1) | $ | — | ||||||
| Short-term incentive compensation |
73,636 | (2) | 73,636 | (2) | 73,636 | (2) | 73,636 | (2) | ||||||||
| Accelerated vesting of Cash America LTIP RSU awards |
— | — | — | — | ||||||||||||
| Accelerated vesting of Cash America LTIP Performance Unit Awards |
— | — | 486,469 | (3) | 486,469 | (3) | ||||||||||
| Continued health benefits |
— | 11,864 | (4) | 11,864 | (4) | — | ||||||||||
| Accrued & unused paid time off |
18,860 | (5)(6) | 18,860 | (5) | 18,860 | (5) | 18,860 | (5) | ||||||||
| Outplacement benefits |
— | — | — | — | ||||||||||||
| Tax gross-ups |
— | — | — | — | ||||||||||||
|
|
|
|
|
|
|
|
|
|||||||||
| Total |
$ | 92,496 | $ | 182,193 | $ | 668,662 | $ | 578,965 | ||||||||
|
|
|
|
|
|
|
|
|
|||||||||
| (1) | Includes four months base salary payable over a four-month period following termination. |
| (2) | This amount is the actual 2013 STI award paid to Mr. Clifton. |
| (3) | This is the value as of December 31, 2013 of (a) 2,500 cash-based Performance Units granted to Mr. Clifton on January 25, 2012; (b) 1,451 cash-based Performance Units granted to Mr. Clifton on July 25, 2012 and (c) 431 cash-based Performance Units granted to Mr. Clifton during 2013, all of which were granted under the Cash America LTIP. See “—Compensation Discussion and Analysis—2013 Compensation—Long-Term Incentive Compensation—Performance Units” and “—Compensation Discussion and Analysis—Compensation Prior to 2013” for additional information. |
| (4) | Consists of Employer COBRA Premiums to be paid over a four-month period and Employer Supplemental Executive Health Care Premiums to be paid over a four-month period. |
| (5) | Calculated based on Mr. Clifton’s salary at December 31, 2013. Assumes none of Mr. Clifton’s 168 hours of accrued paid time off available for the 2013 year had been used. |
| (6) | Under certain circumstances, the state where Mr. Clifton is employed requires payment of accrued and unused vacation. |
183
Table of Contents
Alex T. King
| Resignation or Retirement |
Death, Disability or Voluntary Termination with Good Reason |
Involuntary Termination Other than for Cause |
Involuntary Termination Other than for Cause Following a Change-in- Control |
Voluntary Termination with Good Reason Following a Change-in- Control |
Voluntary Termination Following a Change-in- Control |
|||||||||||||||||||
| Severance |
$ | — | — | $ | 262,500 | (1) | $ | 262,500 | (1) | $ | — | $ | — | |||||||||||
| Short-term incentive compensation |
284,112 | (2) | 284,112 | (2) | 284,112 | (2) | 284,112 | (2) | 284,112 | (2) | 284,112 | (2) | ||||||||||||
| Accelerated vesting of Cash America LTIP RSU awards |
— | — | — | — | — | — | ||||||||||||||||||
| Accelerated vesting of Cash America LTIP Performance Unit Awards |
— | — | — | 941,609 | (3) | 941,609 | (3) | 941,609 | (3) | |||||||||||||||
| Continued health benefits |
— | — | 26,499 | (4) | 26,499 | (4) | — | — | ||||||||||||||||
| Accrued & unused paid time off |
28,269 | (5)(6) | 28,269 | (5) | 28,269 | (5) | 28,269 | (5) | 28,269 | (5) | 28,269 | (5) | ||||||||||||
| Outplacement benefits |
— | — | — | — | — | — | ||||||||||||||||||
| Retention bonus |
233,334 | (7) | 700,000 | (8) | 700,000 | (8) | 700,000 | (8) | 700,000 | (8) | 233,334 | (7) | ||||||||||||
|
|
|
|
|
|
|
|
|
|
|
|
|
|||||||||||||
| Total |
$ | 545,715 | $ | 1,012,381 | $ | 1,301,380 | $ | 2,242,989 | $ | 1,953,990 | $ | 1,487,324 | ||||||||||||
|
|
|
|
|
|
|
|
|
|
|
|
|
|||||||||||||
| (1) | Includes nine months base salary payable over a nine-month period following termination. |
| (2) | This amount is the actual 2013 STI award and discretionary bonus paid to Mr. King. |
| (3) | This is the value as of December 31, 2013 of (a) 4,166 cash-based Performance Units granted to Mr. King during 2011; (b) 3,501 cash-based Performance Units granted to Mr. King during 2012 and (c) 1,329 cash-based Performance Units granted to Mr. King during 2013, all of which were granted under the Cash America LTIP. See “—Compensation Discussion and Analysis—2013 Compensation—Long-Term Incentive Compensation—Performance Units” and “—Compensation Discussion and Analysis—Compensation Prior to 2013” for additional information. |
| (4) | Consists of Employer COBRA Premiums to be paid over a nine-month period and Employer Supplemental Executive Health Care Premiums to be paid over a nine-month period. |
| (5) | Calculated based on Mr. King’s salary at December 31, 2013. Assumes none of Mr. King’s 168 hours of accrued paid time off available for the 2013 year had been used. |
| (6) | Under certain circumstances, the state where Mr. King is employed requires payment of accrued and unused vacation. |
| (7) | This amount is the portion of Mr. King’s retention bonus that actually vested on December 31, 2013 under the terms of Mr. King’s Retention Bonus Agreement. |
| (8) | Includes $466,000 of Mr. King’s retention bonus for which payment would be accelerated under the terms of the Retention Bonus Agreement. |
184
Table of Contents
Arad Levertov
| Resignation, Retirement, Death or Disability |
Involuntary Termination Other than for Cause |
Involuntary Termination Other than for Cause Following a Change- in-Control |
Voluntary Termination Following a Change- in-Control |
|||||||||||||
| Severance |
$ | — | $ | 91,667 | (1) | $ | 91,667 | (1) | $ | — | ||||||
| Short-term incentive compensation |
211,424 | (2) | 211,424 | (2) | 211,424 | (2) | 211,424 | (2) | ||||||||
| Accelerated vesting of Cash America LTIP RSU awards |
— | — | — | — | ||||||||||||
| Accelerated vesting of Cash America LTIP Performance Unit Awards |
— | — | 350,761 | (3) | 350,761 | (3) | ||||||||||
| Continued health benefits |
— | 11,864 | (4) | 11,864 | (4) | — | ||||||||||
| Accrued & unused paid time off |
22,212 | (5)(6) | 22,212 | (5) | 22,212 | (5) | 22,212 | (5) | ||||||||
| Outplacement benefits |
— | — | — | — | ||||||||||||
| Accelerated vesting of SERP balance |
— | — | 6,299 | (7) | 6,299 | (7) | ||||||||||
|
|
|
|
|
|
|
|
|
|||||||||
| Total |
$ | 233,636 | $ | 337,167 | $ | 694,227 | $ | 590,696 | ||||||||
|
|
|
|
|
|
|
|
|
|||||||||
| (1) | Includes four months base salary payable over a four-month period following termination. Mr. Levertov was Vice President—Operations as of December 31, 2013. |
| (2) | This amount is the actual 2013 STI award and discretionary bonus paid to Mr. Levertov. |
| (3) | This is the value as of December 31, 2013 of (a) 500 cash-based Performance Units granted to Mr. Levertov during 2011; (b) 2,751 cash-based Performance Units granted to Mr. Levertov during 2012 and (c) 895 cash-based Performance Units granted to Mr. Levertov during 2013, all of which were granted under the Cash America LTIP. See “—Compensation Discussion and Analysis—2013 Compensation—Long-Term Incentive Compensation—Performance Units” and “—Compensation Discussion and Analysis—Compensation Prior to 2013” for additional information. |
| (4) | Consists of Employer COBRA Premiums to be paid over a four-month period and Employer Supplemental Executive Health Care Premiums to be paid over a four-month period. |
| (5) | Calculated based on Mr. Levertov’s salary at December 31, 2013. Assumes none of Mr. Levertov’s 168 hours of accrued paid time off available for the 2013 year had been used. |
| (6) | Under certain circumstances, the state where Mr. Levertov is employed requires payment of accrued and unused vacation. |
| (7) | Represents the unvested portion of Mr. Levertov’s Enova SERP balance at December 31, 2013. |
185
Table of Contents
Daniel Shteyn
| Resignation, Retirement, Death or Disability |
Involuntary Termination Other than for Cause |
Involuntary Termination Other than for Cause Following a Change- in-Control |
Voluntary Termination Following a Change- in-Control |
|||||||||||||
| Severance (7) |
$ | — | $ | 80,956 | (1) | $ | 80,956 | (1) | $ | — | ||||||
| Short-term incentive compensation (7) |
77,462 | (2) | 77,462 | (2) | 77,462 | (2) | 77,462 | (2) | ||||||||
| Accelerated vesting of Cash America LTIP RSU awards |
— | — | — | — | ||||||||||||
| Accelerated vesting of Cash America LTIP Performance Unit Awards |
— | — | 204,014 | (3) | 204,014 | (3) | ||||||||||
| Continued health benefits (7) |
— | 1,967 | (4) | 1,967 | (4) | — | ||||||||||
| Accrued & unused paid time off (7) |
19,616 | (5)(6) | 19,616 | (5) | 19,616 | (5) | 19,616 | (5) | ||||||||
| Outplacement benefits |
— | — | — | — | ||||||||||||
|
|
|
|
|
|
|
|
|
|||||||||
| Total |
$ | 97,078 | $ | 180,001 | $ | 384,015 | $ | 301,092 | ||||||||
|
|
|
|
|
|
|
|
|
|||||||||
| (1) | Includes four months base salary payable over a four-month period following termination. |
| (2) | This amount is the actual 2013 STI award paid to Mr. Shteyn. |
| (3) | This is the value as of December 31, 2013 of (a) 500 cash-based Performance Units granted to Mr. Shteyn during 2011; (b) 1,451 cash-based Performance Units granted to Mr. Shteyn during 2012 and (c) 298 cash-based Performance Units granted to Mr. Shteyn during 2013, all of which were granted under the Cash America LTIP. See “—Compensation Discussion and Analysis—2013 Compensation—Long-Term Incentive Compensation—Performance Units” and “—Compensation Discussion and Analysis—Compensation Prior to 2013” for additional information. |
| (4) | Consists of Employer Supplemental Executive Health Care Premiums to be paid over a four-month period. |
| (5) | Calculated based on Mr. Shteyn’s salary at December 31, 2013. Assumes none of Mr. Shteyn’s 168 hours of accrued paid time off available for the 2013 year had been used. |
| (6) | Under certain circumstances, the state where Mr. Shteyn is employed while in the U.S. requires payment of accrued and unused vacation. |
| (7) | These amounts are denominated in CAD and have been converted into U.S. dollars at a rate of $0.971470 per CAD, as described in footnote 9 of the Summary Compensation Table. |
186
Table of Contents
SECURITY OWNERSHIP OF CERTAIN BENEFICIAL OWNERS AND MANAGEMENT
For a description of certain voting arrangements relating to the shares of our common stock retained by Cash America following the distribution, see “Certain Relationships and Related-Party Transactions—Agreements Between Us and Cash America—Stockholder’s and Registration Rights Agreement” included elsewhere in this prospectus. The following table provides information with respect to the beneficial ownership of our common stock immediately after the distribution by (1) each stockholder who is a beneficial owner of more than 5 percent of our outstanding common stock based on publicly available information, (2) each of our directors, (3) each executive officer named in the Summary Compensation Table and (4) all of our executive officers and directors as a group. Except as otherwise noted above or in the footnotes below, each person or entity identified below has sole voting and investment power with respect to such securities. The mailing address for each of the directors and executive officers listed below is 200 W. Jackson Blvd., Suite 2400, Chicago, Illinois 60606.
We have based the percentages below on each person’s beneficial ownership of our common stock as of December 1, 2014 unless we indicate some other basis for the share amounts. As of December 1, 2014, we had 33,000,000 shares of common stock outstanding.
| Principal Stockholders and Address |
Number of Shares Beneficially Owned |
Percent of Common Stock Outstanding |
||||||
| Cash America International, Inc. 1600 W. 7th Street Fort Worth, TX 76102 |
|
6,596,926 |
(1)(2) |
20 | % | |||
| Daniel R. Feehan |
276,067 | (3) | * | |||||
| David A. Fisher |
13,048 | (4) | * | |||||
| William M. Goodyear |
0 | * | ||||||
| James A. Gray |
15,000 | (5) | * | |||||
| David C. Habiger |
0 | * | ||||||
| Gregg A. Kaplan |
0 | * | ||||||
| Mark A. Tebbe |
0 | * | ||||||
| Alex T. King |
1,347 | * | ||||||
| Arad Levertov |
0 | * | ||||||
| Robert S. Clifton |
3,180 | * | ||||||
| Daniel Shteyn |
1,582 | (6) | * | |||||
| All directors and executive officers as a group (7) |
310,224 | * | ||||||
| * | Indicates ownership of less than 1.0% of our common stock. |
| (1) | Includes 28,893 deferred shares of Enova that could become deliverable to certain of Cash America’s directors within 60 days following December 1, 2014. Certain of Cash America’s directors have deferred some of their director fees under Cash America’s long-term incentive plans to be paid in the form of Cash America common stock upon separation from service as a director or until a later date that may be specified by the director, and these deferred shares were entitled to receive shares of Enova on the distribution date in the same ratio of the shareholders of Cash America. Cash America has the right to vote these deferred shares but does not have investment power over these shares. Also includes up to 656,194 shares of our common stock that may be delivered by Cash America to holders of certain outstanding unvested RSUs, vested deferred RSUs, and unvested deferred RSUs that were granted by Cash America to certain of Cash America’s officers, directors and employees relating to Cash America common stock under Cash America’s long-term incentive plans. Such RSU awards will be payable by Cash America in both shares of Cash America common stock and our common stock, subject to the terms of Cash America’s long-term incentive plans and the applicable award agreement. See “Description of Cash America Long-Term Incentive Plan Shares and Awards” for additional information. |
187
Table of Contents
| (2) | For a description of certain voting arrangements relating to the shares of our common stock retained by Cash America following the distribution, see “Certain Relationships and Related-Party Transactions—Agreements Between Us and Cash America—Stockholder’s and Registration Rights Agreement” included elsewhere in this prospectus. |
| (3) | Includes shares that will be payable under deferred vested RSUs relating to Cash America common stock that could become deliverable to Mr. Feehan within 60 days following December 1, 2014 due to the termination of his employment. Also includes 51,814 shares held in an irrevocable trust of which Mr. Feehan is sole trustee. The payout of certain amounts shown for Mr. Feehan may be subject to delay pursuant to Section 409A of the Code. Any such delay has not been considered for purposes of this table. |
| (4) | Includes shares that will be payable under RSUs granted to Mr. Fisher by Cash America that vested on the distribution date. |
| (5) | All shares are held by an irrevocable trust of which Mr. Gray is the sole trustee and sole beneficiary. |
| (6) | Includes 256 shares owned by Mr. Shteyn’s wife over which he shares voting and investment power. |
| (7) | Includes all of our directors and executive officers as of December 1, 2014. |
188
Table of Contents
We have been advised that the shares may be offered and sold by or for the account of Cash America (or its pledgees, donees, transferees, or successors in interest), from time to time as market conditions permit, on the New York Stock Exchange, any other exchange on which the shares may be listed, over the counter, or otherwise, at prices and on terms then prevailing or in negotiated transactions, and that the shares may be sold by one or more of the following methods, without limitation:
| • | purchases by underwriters, brokers, dealers, and agents who may receive compensation in the form of underwriting discounts, concessions, or commissions from the selling stockholder and/or the purchasers of the shares for whom they may act as agent; |
| • | one or more block trades in which a broker or dealer so engaged will attempt to sell the shares as agent, but may position and resell a portion of the block as principal to facilitate the transaction or, in crosses, in which the same broker acts as agent on both sides; |
| • | purchases by a broker or dealer (including a specialist or market maker) as principal and resale by such broker or dealer for its account pursuant to this prospectus; |
| • | ordinary brokerage transactions and transactions in which the broker solicits purchasers; |
| • | face-to-face transactions between sellers and purchasers without a broker-dealer; |
| • | the pledge of shares as security for any loan or obligation, including pledges to brokers or dealers who may from time to time effect distributions of the shares or other interests in the shares; |
| • | short sales or transactions to cover short sales relating to the shares; |
| • | distributions to creditors and equity holders of the selling shareholder; |
| • | transactions in options, swaps, or other derivatives (whether exchange listed or otherwise); |
| • | sales in other ways not involving market makers or established trading markets, including direct sales to institutions or individual purchasers; and |
| • | any combination of the foregoing, or by any other legally available means. |
Cash America may enter into sale, forward sale, and derivative transactions with third parties, or sell securities not covered by this prospectus to third parties in privately negotiated transactions. In connection with those sale, forward sale or derivative transactions, the third parties may sell securities covered by this prospectus, including in short sale transactions and by issuing securities that are not covered by this prospectus but are exchangeable for or represent beneficial interests in the shares covered by this prospectus. The third parties may use shares received under those sale, forward sale, or derivative arrangements or shares pledged by Cash America or borrowed from Cash America or others to settle such third party sales or to close out any related open borrowings of shares. The third parties may deliver this prospectus in connection with any such transactions. Any third party in such sale transactions will be an underwriter and will be identified in the applicable prospectus supplement (or a post-effective amendment to the registration statement of which this prospectus forms a part). In addition, Cash America may enter into hedging transactions with broker-dealers in connection with distributions of shares or otherwise. In those transactions, broker-dealers may engage in short sales of shares in the course of hedging the positions they assume with Cash America. Cash America also may sell shares short and redeliver shares to close out such short positions. Cash America may also enter into option or other transactions with broker-dealers that require the delivery to such broker-dealers of the shares, which shares may be resold thereafter pursuant to this prospectus. Cash America also may loan or pledge shares, and the borrower or pledgee may sell or otherwise transfer the shares so loaned or pledged pursuant to this prospectus. Such borrower or pledgee also may transfer those shares to investors in our securities or Cash America’s securities or in connection with the offering of other securities not covered by this prospectus. From time to time, Cash America may also transfer or donate their shares and each transferee, or donee will be deemed to be a selling stockholder for purposes of this prospectus. Any pledgee, secured party, transferee, or donee that Cash America intends to offer or sell shares to through this prospectus will be named in a prospectus supplement, if required.
189
Table of Contents
Further, in connection with the separation and distribution, the holders of outstanding unvested RSUs, vested deferred RSUs, unvested deferred RSUs and certain deferred shares payable by Cash America to Cash America’s directors relating to Cash America common stock under Cash America’s long-term incentive plans will be entitled to receive, in addition to shares of Cash America, shares of Enova on or after the distribution date in the same ratio of the shareholders of Cash America with vesting and payment schedules consistent with the terms underlying the applicable Cash America equity awards. Cash America has reserved up to 685,087 shares of our common stock from the 20% of our common stock that it retained, representing approximately 2.08% of our outstanding shares, for delivery to holders of such awards or rights to deferred shares. If any RSUs outstanding on the distribution date are subsequently forfeited in accordance with the provisions of Cash America’s long-term incentive plans and award agreements, the shares of our common stock reserved by Cash America to meet the payment obligations of Enova shares under the forfeited RSU awards will instead be offered and sold by Cash America in the manner otherwise described in this Plan of Distribution. See “Description of Cash America Long-Term Incentive Plan Shares and Awards” for additional information.
In addition, any shares of Enova covered by this prospectus which qualify for sale pursuant to Rule 144 under the Securities Act may be sold in open market transactions under Rule 144 rather than pursuant to this prospectus.
Underwriters, brokers, dealers, or agents may receive compensation in the form of commissions, discounts, or concessions from the selling shareholder. Underwriters, broker-dealers, or agents may also receive compensation from the purchasers of shares for whom they act as agents or to whom they sell as principals, or both. Compensation as to a particular underwriter, broker-dealer, or agent might be in excess of customary commissions and will be in amounts to be negotiated in connection with transactions involving shares. In effecting sales, brokers or dealers engaged by Cash America may arrange for other brokers or dealers to participate.
At the time a particular offer of shares is made by Cash America, a prospectus supplement, if required, will be distributed to set forth the terms of the specific offering of the shares, including:
| • | the name of the selling stockholder and other participating broker-dealer(s); |
| • | the number of shares offered; |
| • | the price at which such shares are being sold; |
| • | the proceeds to the selling stockholder from the sale of such shares; |
| • | the specific plan of distribution for such shares; |
| • | the names of the underwriters or agents, if any; |
| • | any underwriting discounts, agency fees, or other compensation to underwriters or agents; |
| • | any discounts or concessions allowed or paid to dealers; and |
| • | any other facts material to the transaction. |
In connection with the sale of the shares, Cash America and such brokers and dealers and any other participating brokers or dealers may be deemed to be “underwriters” within the meaning of the Securities Act in connection with such sales. Accordingly, any profits realized by Cash America and any compensation earned by such broker-dealers or agents may be deemed to be underwriting discounts and commissions. Because a selling stockholder may be deemed to be an “underwriter” within the meaning of Section 2(11) of the Securities Act, Cash America will be subject to the prospectus delivery requirements of that act. We will make copies of this prospectus (as it may be amended or supplemented from time to time) available to Cash America for the purpose of satisfying any prospectus delivery requirements.
Subject to the limitations in the stockholder’s and registration rights agreement, Cash America may sell the shares covered by this prospectus from time to time. Cash America will act independently of us in making
190
Table of Contents
decisions regarding the timing, manner, and size of each sale. We know of no existing arrangements between Cash America and any broker, dealer, finder, underwriter, or agent relating to the sale or distribution of the shares.
We will not receive any of the proceeds of any sale of shares by Cash America. We will bear all of the expenses of the registration of this offering under the Securities Act including, without limitation, registration and filing fees, printing expenses, fees and disbursements of our counsel and independent public accountants, transfer taxes, fees of transfer agents and registrars, and costs of insurance, if any. All underwriting discounts, selling commissions, and broker’s fees applicable to the sale of any shares will be borne by Cash America or by such persons other than us as agreed by and among Cash America and such other persons.
We and Cash America have agreed to indemnify each other against certain liabilities under the Securities Act. In addition, we or Cash America may agree to indemnify any underwriters, brokers, dealers or agents against, or contribute to any payments the underwriters, brokers, dealers or agents may be required to make, with respect to, civil liabilities, including liabilities under the Securities Act. Underwriters, brokers, dealers and agents and their affiliates are permitted to be customers of, engage in transactions with, or perform services for us and our affiliates or Cash America and its affiliates in the ordinary course of business.
Cash America will be subject to applicable provisions of the Exchange Act and the associated rules and regulations under the Exchange Act, including Regulation M, which provisions may limit the timing of purchases and sales of our shares by Cash America. These restrictions may affect the marketability of such shares.
In order to comply with applicable securities laws of some states, the shares may be sold in those jurisdictions only through registered or licensed brokers or dealers. In addition, in certain states the shares may not be sold unless they have been registered or qualified for sale in the applicable state or an exemption from the registration or qualification requirements is available.
In connection with an underwritten offering of shares under this prospectus, the underwriters may purchase and sell securities in the open market. These transactions may include short sales, stabilizing transactions and purchases to cover positions created by short sales. Short sales involve the sale by the underwriters of a greater number of securities than they are required to purchase in an offering. Stabilizing transactions consist of certain bids or purchases made for the purpose of preventing or retarding a decline in the market price of the securities while an offering is in progress. The underwriters also may impose a penalty bid. This occurs when a particular underwriter repays to the underwriters a portion of the underwriting discount received by it because the underwriters have repurchased securities sold by or for the account of that underwriter in stabilizing or short-covering transactions.
These activities by the underwriters may stabilize, maintain or otherwise affect the market price of the shares offered under this prospectus. As a result, the price of the shares may be higher than the price that otherwise might exist in the open market. If these activities are commenced, they may be discontinued by the underwriters at any time. These transactions may be effected on an automated quotation system or in the over-the-counter market or otherwise.
To the extent permitted by applicable law, this plan of distribution may be modified in a prospectus supplement or otherwise.
191
Table of Contents
DESCRIPTION OF CASH AMERICA LONG-TERM INCENTIVE PLAN SHARES AND AWARDS
Under Cash America’s long-term incentive plans, Cash America’s non-management directors have been permitted to annually elect to defer receipt of a portion of their fees earned for board service, with such deferred fees payable in shares of Cash America common stock, or deferred shares, at the time of separation from service as a director or until a later date that may be specified by the director. Upon the deferral of such shares, shares of Cash America stock have been transferred to a rabbi trust, or the directors’ shares trust, to be held until the deferred shares are required to be distributed to the applicable director. As of the date of this prospectus, 31,577 deferred shares of Cash America common stock are held in the directors’ shares trust.
In addition, under Cash America’s long-term incentive plans, Cash America has previously made grants of long-term incentive awards in the form of RSUs to certain employees, officers and members of the Cash America Board of Directors. Each RSU entitles its holder to one share of Cash America common stock upon vesting of the RSU or, in some circumstances, upon a later date after vesting, or deferred RSUs. If an RSU holder leaves Cash America’s employment or ceases to serve as a director prior to the RSU vesting, if applicable, he or she forfeits the RSUs and underlying stock. Cash America has 301,747 vested deferred RSUs outstanding as of December 1, 2014. Cash America also has 401,141 RSUs that are not vested as of December 1, 2014 that are scheduled to vest after such date, subject to forfeiture if the vesting requirements for each award are not met.
The shares of Cash America common stock relating to the deferred shares and the RSUs were registered under the Securities Act by Cash America. The registration statement of which this prospectus forms a part does not cover any awards granted under Cash America’s long-term incentive plans relating to the shares of Cash America.
In connection with the distribution and pursuant to Cash America’s long-term incentive plans and award agreements, the Cash America Compensation Committee determined that all outstanding RSU holders on the date of the distribution would be treated the same as shareholders of Cash America, and upon vesting and lapse of any applicable deferral period, if any, payment of such RSUs will be settled in shares of Cash America stock as evidenced by the RSUs plus the applicable number of shares of our common stock determined in the same proportion allocated to other shareholders of Cash America in connection with the distribution. As a result, outstanding RSUs that were held by directors, officers and employees of Cash America as of the date of the distribution are payable in both Cash America common stock and in shares of our common stock by applying the distribution ratio applicable to the distribution in the same way as if the shares of Cash America subject to these awards were fully vested outstanding shares of Cash America common stock on the distribution date. The distribution ratio was 0.915 shares of Enova common stock for each one share of Cash America common stock. The RSUs that are payable in Cash America shares and our shares are subject to substantially the same terms, vesting conditions and other restrictions and conditions immediately following the distribution date as in effect immediately prior to the distribution date.
In addition, on the date of the distribution, the deferred shares received 0.915 shares of Enova common stock for each one share of Cash America common stock, or 28,893 shares of our common stock. These shares were transferred into the directors’ shares trust.
In connection with the distribution, Cash America retained 20% of our outstanding shares, and Cash America will use a portion of the shares retained by it to meet the payment obligations of Enova shares under the deferred shares and the RSU awards, if such RSU awards vest and when shares become payable under the applicable long-term incentive plan and applicable award agreements. The registration statement of which this prospectus is a part covers up to 685,087 shares of our common stock from the 20% of our common stock that Cash America retained, representing approximately 2.08% of our outstanding shares, for delivery to holders of outstanding unvested RSUs, vested deferred RSUs and unvested deferred RSUs which were granted by Cash America to certain of Cash America’s officers, directors and employees if they become payable under Cash America’s incentive plans and the deferred shares payable to Cash America’s directors relating to our common stock deposited into the directors’ shares trust.
192
Table of Contents
THE SEPARATION AND THE DISTRIBUTION
General
Substantially all assets and liabilities related to the e-commerce business that were not held by Enova or its subsidiaries were transferred to Enova or its subsidiaries in 2011 and 2012. Since that time, we have owned all of the assets and incurred all of the liabilities related to Cash America’s e-commerce business, with some limited exceptions, in which case such assets were transferred to us pursuant to the Separation and Distribution Agreement.
For a description of our financing arrangements, see “Financing Arrangements” included elsewhere in this prospectus.
The separation and distribution was effected on the distribution date by way of a pro rata distribution of 80 percent of the outstanding shares of Enova common stock to Cash America’s shareholders of record as of 5:00 p.m. Eastern Time on November 3, 2014, the record date for the distribution.
The Number of Shares to be Distributed by Cash America in the Distribution
Each Cash America shareholder of record received 0.915 shares of Enova common stock for every one share of Cash America common stock held on the record date for the distribution. Fractional shares were not distributed in connection with the distribution. Instead, the transfer agent aggregated fractional shares into whole shares, sold the whole shares in the open market at prevailing market prices and distributed the aggregate cash proceeds from the sales, net of brokerage fees and other costs, pro rata to each holder who would otherwise have been entitled to receive a fractional share in the distribution. Cash America shareholders were not entitled to interest on any cash payment made in lieu of fractional shares.
Results of the Separation and the Distribution
After the separation and the distribution, we became an independent, publicly traded company. Immediately following the distribution, we had approximately 489 stockholders of record, based on the number of registered shareholders of Cash America common stock on October 20, 2014, and 33,000,000 shares of Enova common stock outstanding. The actual number of shares distributed was determined on the record date and reflected any vesting of Cash America equity-based awards prior to the record date for the distribution.
Before the distribution, we entered into the Separation and Distribution Agreement and several other agreements with Cash America to effect the separation and provide a framework for our relationship with Cash America after the separation. These agreements provide for the allocation between Cash America and Enova of certain of Cash America’s assets, liabilities, and obligations subsequent to the separation and distribution, including with respect to transition matters, employee matters, intellectual property matters, tax matters and other commercial relationships. We also entered into a Stockholder’s and Registration Rights Agreement with Cash America pursuant to which, among other things, we agreed that, upon the request of Cash America, we will use our best efforts to effect the registration under applicable federal and state securities laws of the shares of common stock retained by Cash America after the distribution. For a description of these agreements, see “Certain Relationships and Related-Party Transactions—Agreements Between Us and Cash America” included elsewhere in this prospectus.
The distribution did not affect the number of outstanding shares of Cash America common stock or any rights of Cash America shareholders, except that the trading price of Cash America shares changed as a result of the distribution.
Distribution
For the distribution of the Enova stock to Cash America shareholders to qualify as a tax-free distribution under Section 355(a) of the Code, Cash America has to establish to the satisfaction of the IRS that the retention of 20%
193
Table of Contents
of Enova’s stock was not in pursuant to a plan having as one of its principal purposes the avoidance of federal income tax. Cash America received a private letter ruling from the IRS, to the effect that the retention by Cash America of up to 20% of Enova’s stock was not in pursuant to a plan having as one of its principal purposes the avoidance of U.S. federal income tax within the meaning of Section 355(d)(1)(D)(ii) of the Code. Cash America also received an opinion from the law firm of Hunton & Williams LLP, substantially to the effect that the distribution qualified as a transaction that is described in Section 355(a) of the Code.
On the basis the distribution so qualified, in general, for U.S. federal income tax purposes: (i) the distribution did not result in any taxable income, gain or loss to Cash America; (ii) no gain or loss was recognized by (and no amount was included in the income of) U.S. Holders of Cash America common stock upon their receipt of shares of Enova common stock in the distribution, except with respect to cash received in lieu of fractional shares measured by the difference between the cash received for such fractional share and the U.S. Holder’s basis in that fractional share, as determined below; (iii) the aggregate basis of the Cash America common stock and the Enova common stock (including any fractional share interests in Enova common stock for which cash was received) in the hands of each U.S. Holder of Cash America common stock after the distribution equaled the aggregate basis of Cash America common stock held by the U.S. Holder immediately before the distribution, allocated between the Cash America common stock and the Enova common stock in proportion to the relative fair market value of each on the date of the distribution; and (iv) the holding period of the Enova common stock received by each U.S. Holder of Cash America common stock (including any fractional share interests in Enova common stock for which cash was received) included the holding period for the Cash America common stock on which the distribution was made as of the time of the distribution, provided that the Cash America common stock was held as a capital asset on the date of the distribution.
Although the IRS Ruling generally will be binding on the IRS, if the factual representations or assumptions made in the request for the IRS Ruling are untrue or incomplete in any material respect, we will not be able to rely on the IRS Ruling. Furthermore, the IRS Ruling is only with respect to the retention of Enova shares and does not address whether a distribution satisfies other requirements necessary to obtain tax-free treatment under Section 355 of the Code or whether the overall distribution should be treated as satisfying the requirements of Section 355 of the Code. In addition, the IRS Ruling with respect to the retention of Enova shares is based upon representations by Cash America that these conditions have been satisfied, and any inaccuracy in such representations could invalidate the ruling.
Cash America also received an opinion from the law firm of Hunton & Williams LLP substantially to the effect that the distribution qualified as a reorganization for U.S. federal income tax purposes under Section 355 of the Code. The opinion relied on the IRS Ruling as to matters covered by the IRS Ruling. In addition, the opinion was based on, among other things, certain assumptions and representations made by Cash America and us, which if incorrect or inaccurate in any material respect would jeopardize the conclusions reached by the law firm in its opinion. The tax opinion is not binding on the IRS or the courts.
Notwithstanding receipt by Cash America of the IRS Ruling and the opinion from legal counsel, the IRS could assert that the distribution does not qualify for tax-free treatment for U.S. federal income tax purposes. If the IRS were successful in taking this position, Cash America’s shareholders and Cash America could be subject to significant U.S. federal income tax liability. In general, Cash America would be subject to tax as if it had sold the Enova common stock in a taxable sale for its fair market value and Cash America shareholders who receive shares of Enova common stock in the distribution would be subject to tax as if they had received a taxable distribution equal to the fair market value of such shares. In addition, even if the distribution was otherwise to qualify under Section 355 of the Code, it may be taxable to Cash America (but not to Cash America shareholders) under Section 355(e) of the Code, if the distribution was later deemed to be part of a plan (or series of related transactions) pursuant to which one or more persons acquires, directly or indirectly, stock representing a 50 percent or greater interest in Cash America or us. For this purpose, any acquisitions of Cash America stock or of our common stock within the period beginning two years before the distribution and ending two years after the distribution are presumed to be part of such a plan, although we or Cash America may be able to rebut that presumption.
194
Table of Contents
Tax Matters Agreement
In connection with the distribution, we and Cash America entered into a Tax Matters Agreement pursuant to which we agreed to be responsible for certain liabilities and obligations following the distribution. In general, under the terms of the Tax Matters Agreement, in the event the distribution were to fail to qualify for U.S. federal income tax purposes under Section 355 of the Code (including as a result of Section 355(e) of the Code) and if such failure were the result of actions taken after the distribution by Cash America or us, the party responsible for such failure would be responsible for all taxes imposed on Cash America to the extent such taxes result from such actions. However, if such failure was the result of any acquisition of our shares or assets or any of our representations or undertakings being incorrect or breached, we would be responsible for all taxes imposed on Cash America as a result of such acquisition or our representations and warranties being incorrect or breached. For a more detailed discussion, see “Certain Relationships and Related-Party Transactions—Agreements Between Us and Cash America—Tax Matters Agreement.” Our indemnification obligations to Cash America and its subsidiaries, officers and directors will not be limited in amount or subject to any cap. If we are required to indemnify Cash America and its subsidiaries and their respective officers and directors under the circumstances set forth in the Tax Matters Agreement, we may be subject to substantial liabilities.
Manner of Effecting the Separation and the Distribution
The general terms and conditions relating to the separation and the distribution are set forth in the Separation and Distribution Agreement that we entered into with Cash America. For a description of the terms of that agreement, see “Certain Relationships and Related-Party Transactions—Agreements Between Us and Cash America—Separation and Distribution Agreement” included elsewhere in this prospectus.
195
Table of Contents
MATERIAL U.S. FEDERAL INCOME TAX CONSEQUENCES
Cash America’s officers and employees that receive shares of Enova stock as payment for their incentive awards will be subject to withholding of federal, state and local employment taxes, or Employment Taxes, on the delivery of such Enova stock by Cash America. Consistent with the terms of the applicable incentive plan, the award holder may elect, prior to delivery by Cash America of the Enova stock, to have the required Employment Taxes be withheld in the form of a portion of such Enova stock. Pursuant to such an election, Cash America will immediately sell such portion of the Enova stock in an open market disposition and use the proceeds received to pay the withheld Employment Taxes to the appropriate taxing authorities.
196
Table of Contents
Our outstanding indebtedness consists of:
| • | an unsecured revolving credit facility in an aggregate principal amount of up to $75 million, or the revolving line of credit; and |
| • | $500 million in aggregate principal amount of 9.75% Senior Notes due 2021, or the Notes. |
Credit Agreement
On May 14, 2014, we and certain of our domestic subsidiaries, as guarantors, entered into a credit agreement with Jefferies Finance LLC, as administrative agent, and Jefferies Group LLC, as lender, or the Credit Agreement. The Credit Agreement provides for our unsecured revolving line of credit in an aggregate principal amount of up to $75.0 million. The Credit Agreement contains customary representations and warranties and covenants (including financial maintenance covenants). Loans under the revolving line of credit may be made in dollars or in designated foreign currencies. Neither Cash America nor any of its other subsidiaries that are not subsidiaries of Enova guarantee the revolving line of credit.
Our revolving line of credit may be used for our and our subsidiaries’ general corporate purposes, including possible acquisitions. Interest on the loans borrowed under the Credit Agreement will be charged, at our option, at either LIBOR for one week or one-, two-, three- or six-month periods, as selected by us, plus a margin varying from 2.50% to 3.75% or at the agent’s base rate plus a margin varying from 1.50% to 2.75%. The margin for the Credit Agreement borrowings is dependent on our cash flow leverage ratios. We will also be required to pay a fee on the unused portion of the line of credit ranging from 0.25% to 0.50% based on our cash flow leverage ratios. The revolving line of credit under the Credit Agreement was undrawn as of September 30, 2014.
The Credit Agreement also includes a sub-limit of up to $20.0 million for standby or commercial letters of credit. In the event that an amount is paid by the issuing bank under a letter of credit, it will be due and payable by us on demand. Pursuant to the terms of the Credit Agreement, we agree to pay fees equal to the LIBOR margin per annum on the undrawn amount of each outstanding standby letter of credit plus a one-time commercial letter of credit fee of 0.20% of the face amount of each commercial letter of credit plus 0.25% per annum on the average daily amount of the total letter of credit exposure. We had $3.0 million of outstanding letters of credit as of September 30, 2014. Our Credit Agreement will mature on June 30, 2017.
The Credit Agreement contains certain covenants, including restrictions on the payment of dividends, as described in “Management’s Discussion and Analysis of Financial Condition and Results of Operations—Liquidity and Capital Resources—Credit Agreement.”
This description of the material terms of the revolving line of credit is qualified in its entirety by reference to the full text of the Credit Agreement, which is incorporated by reference into this prospectus.
Senior Notes
On May 30, 2014, we issued and sold the Notes. The Notes bear interest at a rate of 9.75% and were sold at a discount of the principal amount thereof to yield 10.0% to maturity. The Notes were sold to qualified institutional buyers in accordance with Rule 144A under the Securities Act and outside the United States pursuant to Regulation S under the Securities Act.
We used all of the net proceeds of the Notes offering, or $479.0 million, to repay all of our intercompany indebtedness due to Cash America, which was $361.4 million as of May 30, 2014, and the remaining net proceeds were used to pay a significant portion of the Cash America Dividend. See “Certain Relationships and Related-Party Transactions—Historical Relationship with Cash America” for additional information regarding the Cash America Dividend.
197
Table of Contents
The Notes are governed by an Indenture, or the Indenture, dated May 30, 2014, between us, our domestic subsidiaries, as Guarantors, and U.S. Bank National Association, as trustee. The Notes bear interest at a rate of 9.75% per year on the principal amount of the Notes, payable semi-annually in arrears on June 1 and December 1 of each year, beginning on December 1, 2014. The Notes will mature on June 1, 2021. The Notes are senior unsecured debt obligations of Enova and are unconditionally guaranteed by our domestic subsidiaries. Neither Cash America nor any of its other subsidiaries that are not also our subsidiaries guarantee the Notes.
The Indenture contains certain covenants that, among other things, limit our and certain of our subsidiaries’ ability to incur additional debt, acquire or create new subsidiaries, create liens, engage in certain transactions with affiliates and consolidate or merge with or into other companies. See “Management’s Discussion and Analysis of Financial Condition and Results of Operations—Liquidity and Capital Resources—Senior Notes” for a description of restrictions in the Indenture regarding restricted payments.
The Notes are redeemable at our option, in whole or in part, (i) at any time prior to June 1, 2017 at 100% of the aggregate principal amount of Notes redeemed plus the applicable “make whole” redemption price specified in the Indenture, plus accrued and unpaid interest, if any, to the redemption date and (ii) at any time on or after June 1, 2017 at a premium specified in the Indenture that will decrease over time as described in the Indenture, plus accrued and unpaid interest, if any, to the redemption date. In addition, prior to June 1, 2017, we may redeem from time to time up to 35% of the aggregate principal amount of the Notes at a redemption price equal to 109.75% of the principal amount thereof, plus accrued and unpaid interest, if any, to the redemption date with the proceeds from certain equity offerings as described in the Indenture. If a change of control occurs, as that term is defined in the Indenture, the holders of Notes will have the right, subject to certain conditions, to require Enova to repurchase their Notes at a purchase price equal to 101% of the aggregate principal amount of Notes repurchased plus accrued and unpaid interest, if any, as of the date of repurchase. The proposed separation and distribution do not constitute a change of control under the Indenture.
The Indenture provides for customary events of default, including nonpayment, failure to comply with covenants or other agreements in the Indenture, any subsidiary guarantee ceasing to be in full force and effect or any guarantor denying or disaffirming its obligations under its subsidiary guarantee, and certain events of bankruptcy or insolvency. If any event of default occurs and is continuing, the trustee or the holders of at least 25% in principal amount of the then outstanding Notes may declare all the Notes to be due and payable immediately.
In addition, on May 30, 2014, we entered into a registration rights agreement with the initial purchaser, or the Registration Rights Agreement, pursuant to which we agreed to use commercially reasonable efforts to cause a registration statement to be declared effective on or prior to the 360th day following the closing date relating to an exchange offer of the Notes for identical new notes registered under the Securities Act. In certain circumstances, we may be required to file a shelf registration statement to cover resales of the Notes. If we do not comply with certain covenants set forth in the Registration Rights Agreement, we must pay liquidated damages to holders of the Notes. If we fail to satisfy any of our registration obligations, we will be required to pay the holders of the Notes additional interest of 0.25% to 0.50% per annum until we satisfy our registration obligations.
This description of the material terms of the Notes is qualified in its entirety by reference to the full text of the Indenture and the Registration Rights Agreement, which are incorporated by reference into this prospectus.
Previous Credit Agreement with Cash America
Prior to entering into our Credit Agreement and issuing the Notes, we historically funded our strategic and operating capital needs through a combination of cash flows from operating activities and intercompany loans from Cash America. Our credit agreement with Cash America permitted us to borrow, repay and re-borrow funds from Cash America on a revolving credit basis in a maximum amount equal to $450 million. We used all of the net proceeds from the Notes offering to repay all of our outstanding intercompany indebtedness owed to Cash America, which was $361.4 million as of May 30, 2014, and we have terminated our revolving credit agreement with Cash America.
198
Table of Contents
General
The following is a summary of the rights of our capital stock and certain provisions of our certificate of incorporation and bylaws. For more detailed information, please see our amended and restated certificate of incorporation and amended and restated bylaws filed as exhibits to the registration statement of which this prospectus is a part.
Our authorized capital stock consists of 275,000,000 shares, with a par value of $0.00001 per share, of which:
| • | 250,000,000 shares are designated as common stock; and |
| • | 25,000,000 shares are designed as preferred stock. |
As of December 1, 2014, there were 33,000,000 shares of our common stock outstanding.
Common Stock
With the exception of the shares retained by Cash America (for which Cash America granted us a proxy to vote its shares in proportion to the votes cast by our other stockholders), each holder of common stock is entitled to one vote for each share on all matters to be voted upon by the stockholders and there are no cumulative voting rights. Subject to preferences to which holders of preferred stock may be entitled, holders of common stock are entitled to receive ratably those dividends, if any, that may be declared from time to time by our Board of Directors out of funds legally available for the payment of dividends. See “Dividend Policy” for additional information. In the event of a liquidation, dissolution or winding up of us, holders of our common stock would be entitled to share in our assets remaining after the payment of liabilities and the satisfaction of any liquidation preference granted to holders of any outstanding shares of preferred stock. Holders of our common stock have no preemptive or conversion rights or other subscription rights and there are no redemption or sinking fund provisions applicable to our common stock. The rights, preferences and privileges of the holders of common stock are subject to, and may be adversely affected by, the rights of holders of shares of any series of preferred stock that we may designate in the future.
Preferred Stock
No shares of preferred stock are outstanding. Pursuant to our amended and restated certificate of incorporation, our Board of Directors has the authority, without further action by our stockholders, to issue from time to time up to 25,000,000 shares of preferred stock in one or more series. Our Board of Directors may designate the rights, preferences, privileges and restrictions of the preferred stock, including dividend rights, conversion rights, voting rights, terms of redemption, liquidation preference, sinking fund terms and the number of shares constituting any series or the designation of any series. The issuance of preferred stock could have the effect of restricting dividends on our common stock, diluting the voting power of our common stock, impairing the liquidation rights of our common stock or delaying, deterring or preventing a change in control. Such issuance could have the effect of decreasing the market price of the common stock. The issuance of preferred stock or even the ability to issue preferred stock could also have the effect of delaying, deterring or preventing a change in control.
Registration Rights
Cash America is entitled to certain rights with respect to the registration of our common stock under the Securities Act, under the terms of the stockholder’s and registration rights agreement between us and Cash America. See “Certain Relationships and Related-Party Transactions—Agreements Between Us and Cash America—Stockholder’s and Registration Rights Agreement.”
Anti-Takeover Provisions
Our certificate of incorporation and our bylaws contain certain provisions that could have the effect of delaying, deterring or preventing another party from acquiring control of us. These provisions and certain provisions of
199
Table of Contents
Delaware law, which are summarized below, are expected to discourage coercive takeover practices and inadequate takeover bids. These provisions are also designed, in part, to encourage persons seeking to acquire control of us to negotiate first with our Board of Directors. We believe that the benefits of increased protection of our potential ability to negotiate more favorable terms with an unfriendly or unsolicited acquirer outweigh the disadvantages of discouraging a proposal to acquire us.
Authorized but Unissued Shares
Our authorized but unissued shares of common stock and preferred stock will be available for future issuance without stockholder’s approval. We may use additional shares for a variety of corporate purposes, including future public offerings to raise additional capital, corporate acquisitions and employee benefit plans. In addition, as discussed above, our Board of Directors has the ability to issue preferred stock with voting or other rights or preferences that could impede the success of any attempt to change control of us. The existence of authorized but unissued shares of common stock and preferred stock could render more difficult or discourage an attempt to obtain control of us by means of a proxy contest, tender offer, merger or otherwise.
No Stockholder Action by Written Consent
Our certificate of incorporation provides that our stockholders may act only at an annual or special meeting of stockholders and may not act by written consent.
Special Meetings of Stockholders
Our bylaws provide that special meetings of stockholders may be called only by a majority of our Board of Directors, the Chairman of our Board of Directors, our President or our Secretary. Stockholders may not call special meetings.
Advance Notice of Nominations and Proposals
Our bylaws include advance notice procedures with respect to stockholder proposals and the nomination of candidates for election as directors, other than nominations made by or at the direction of our Board of Directors or a committee of our Board of Directors. Our bylaws may have the effect of precluding the conduct of certain business at a meeting if the proper procedures are not followed. These provisions may also discourage or deter a potential acquirer from conducting a solicitation of proxies to elect the acquirer’s own slate of directors or otherwise attempting to obtain control of our company.
Filling of Board Vacancies
Our bylaws include advance notice procedures with respect to stockholder proposals and the nomination of candidates for election as directors, other than nominations made by or at the direction of our Board of Directors or a committee of our Board of Directors. Our bylaws may have the effect of precluding the conduct of certain business at a meeting if the proper procedures are not followed. These provisions may also discourage or deter a potential acquirer from conducting a solicitation of proxies to elect the acquirer’s own slate of directors or otherwise attempting to obtain control of our company.
No Cumulative Voting
Our certificate of incorporation and bylaws do not permit cumulative voting in the election of directors. Cumulative voting allows a stockholder to vote a portion or all of its shares for one or more candidates for seats on the Board of Directors. Without cumulative voting, a minority stockholder may not be able to gain as many seats on our Board of Directors as the stockholder would be able to gain if cumulative voting were permitted. The absence of cumulative voting makes it more difficult for a minority stockholder to gain a seat on our Board of Directors to influence our board’s decision regarding a takeover.
200
Table of Contents
Amendment of our Governing Documents
Our certificate of incorporation provides that the affirmative vote of the holders of at least 80 percent of our voting stock then outstanding is required to amend certain provisions of the certificate of incorporation, including those relating to the voting rights of stockholders, the number and classification of the Board of Directors, indemnification of our Board of Directors, term and removal of directors, the calling of special meetings of stockholders, the limitation on stockholders to act by written consent and exclusive venue for specified disputes. Our certificate of incorporation also provides that the affirmative vote of holders of at least 80 percent of the voting power of the voting stock then outstanding is required to amend certain provisions of our bylaws. Our certificate of incorporation also confers upon our Board of Directors the right to amend our bylaws.
Exclusive Forum
Our certificate of incorporation provides that, unless our Board of Directors otherwise determines, the Court of Chancery of the State of Delaware will be the sole and exclusive forum for any derivative action or proceeding brought on our behalf, any action asserting a claim of breach of a fiduciary duty owed by any of our directors or officers to us or our stockholders, creditors or other constituents, any action asserting a claim against us or any of our directors or officers arising pursuant to any provision of the DGCL or our certificate of incorporation or bylaws (as either may be amended from time to time) or any action asserting a claim against us or any of our directors or officers governed by the internal affairs doctrine.
Section 203 of the Delaware General Corporation Law
In general, Section 203 of the DGCL, referred to as Section 203, prohibits a Delaware corporation from engaging in any business combination with any interested stockholder for a period of three years following the date that the stockholder became an interested stockholder unless:
| • | prior to that date, the Board of Directors of the corporation approved either the business combination or the transaction that resulted in the stockholder becoming an interested stockholder; |
| • | upon consummation of the transaction that resulted in the stockholder becoming an interested stockholder, the interested stockholder owned at least 85.0% of the voting stock of the corporation outstanding at the time the transaction commenced, excluding for purposes of determining the number of shares outstanding those shares owned by persons who are directors and also officers and by excluding employee stock plans in which employee participants do not have the right to determine confidentially whether shares held subject to the plan will be tendered in a tender or exchange offer; or |
| • | on or subsequent to that date, the business combination is approved by the Board of Directors of the corporation and authorized at an annual or special meeting of stockholders, and not by written consent, by the affirmative vote of at least 66 2/3% of the outstanding voting stock that is not owned by the interested stockholder. |
In general, Section 203 defines an interested stockholder as any entity or person beneficially owning 15.0% or more of the outstanding voting stock of the corporation and any entity or person affiliated with or controlling or controlled by such entity or person. Section 203 defines “business combination” to include: (i) any merger or consolidation involving the corporation and the interested stockholder; (ii) any sale, transfer, pledge or other disposition of 10.0% or more of the assets of the corporation involving the interested stockholder; (iii) subject to certain exceptions, any transaction that results in the issuance or transfer by the corporation of any stock of the corporation to the interested stockholder; (iv) any transaction involving the corporation that has the effect of increasing the proportionate share of the stock of any class or series of the corporation beneficially owned by the interested stockholder; or (v) the receipt by the interested stockholder of the benefit of any loans, advances, guarantees, pledges or other financial benefits provided by or through the corporation.
While a Delaware corporation may opt out of Section 203 either by an express provision in its original certificate of incorporation or in an amendment to its certificate of incorporation or bylaws approved by its stockholders, we have not elected to opt out of Section 203.
201
Table of Contents
Anti-Takeover Effect
The provisions of Delaware law and the provisions of our amended and restated certificate of incorporation and amended and restated bylaws could have the effect of discouraging others from attempting hostile takeovers and, as a consequence, they might also inhibit temporary fluctuations in the market price of our common stock that often result from actual or rumored hostile takeover attempts. These provisions might also have the effect of preventing changes in our management. It is possible that these provisions could make it more difficult to accomplish transactions that stockholders might otherwise deem to be in their best interests.
Limitation on Liability of Directors, Indemnification of Directors and Officers, and Insurance
The DGCL authorizes corporations to limit or eliminate the personal liability of directors to corporations and their stockholders for monetary damages for breaches of directors’ fiduciary duties as directors, and our certificate of incorporation includes such an exculpation provision. Our certificate of incorporation provides that no director will be liable to us or our stockholders for monetary damages for breach of fiduciary duty as a director, except to the extent such exemption from liability or limitation on liability is not permitted under the DGCL, as now in effect or as amended. Currently, Section 102(b)(7) of the DGCL requires that liability be imposed for the following:
| • | Any breach of the director’s duty of loyalty to our company or our stockholders |
| • | Any act or omission not in good faith or which involved intentional misconduct or a knowing violation of law |
| • | Unlawful payments of dividends or unlawful stock repurchases or redemptions as provided in Section 174 of the DGCL. |
| • | Any transaction from which the director derived an improper personal benefit |
Additionally, Section 145 of the DGCL provides that a corporation may indemnify directors and officers as well as other employees and individuals against expenses (including attorneys’ fees), judgments, fines and amounts paid in settlement in connection with any threatened, pending or completed action, suit or proceeding, whether civil, criminal, administrative or investigative, in which such person is made a party by reason of the fact that the person is or was a director, officer, employee or agent of the corporation (other than an action by or in the right of the corporation—a “derivative action”), if such person acted in good faith and in a manner such person reasonably believed to be in or not opposed to the best interests of the corporation and, with respect to any criminal action or proceeding, had no reasonable cause to believe such person’s conduct was unlawful. A similar standard is applicable in the case of derivative actions, except that indemnification only extends to expenses (including attorneys’ fees) incurred in connection with the defense or settlement of such action, and the statute requires court approval before there can be any indemnification where the person seeking indemnification has been found liable to the corporation. The statute provides that it is not exclusive of other indemnification that may be granted by a corporation’s bylaws, disinterested director vote, stockholder vote, agreement or otherwise. Our certificate of incorporation and bylaws provide that, to the fullest extent authorized or permitted by the DGCL, as now in effect or as amended, we will indemnify any person who was or is a party or is threatened to be made a party to any threatened, pending or completed action, suit or proceeding by reason of the fact that such person, or a person of whom he or she is the legal representative, is or was our director or officer, or by reason of the fact that our director or officer is or was serving, at our request, as a director, officer, employee or agent of another corporation or of a partnership, joint venture, trust or other enterprise, including service with respect to employee benefit plans maintained or sponsored by us. We will indemnify such persons against expenses (including attorneys’ fees), judgments, fines and amounts paid in settlement actually and reasonably incurred in connection with such action if such person acted in good faith and in a manner reasonably believed to be in our best interests and, with respect to any criminal proceeding, had no reason to believe their conduct was unlawful. A similar standard will be applicable in the case of derivative actions, except that indemnification will only extend to expenses (including attorneys’ fees) incurred in connection with the defense or settlement of such
202
Table of Contents
actions, and court approval will be required before there can be any indemnification where the person seeking indemnification has been found liable to us. Any amendment of this provision will not reduce our indemnification obligations relating to actions taken before an amendment.
We have obtained insurance policies that insure our directors and officers and those of our subsidiaries against certain liabilities they may incur in their capacity as directors and officers. The insurance provides coverage, subject to its terms and conditions, if the company is unable to (e.g., due to bankruptcy) or unwilling to indemnify the directors and officers for a covered act.
Exchange Listing
Our common stock trades on the New York Stock Exchange under the symbol “ENVA.”
Transfer Agent and Registrar
The transfer agent and registrar for our common stock is Computershare. The transfer agent’s address is:
Computershare
211 Quality Circle
Suite 210
College Station, TX 77845
-or-
P.O. Box 30170
College Station, TX 77842-3170
(800) 546-5141 or (201) 680-6578
203
Table of Contents
WHERE YOU CAN FIND MORE INFORMATION
We have filed a registration statement on Form S-1 with the SEC with respect to the shares of our common stock to be issued as contemplated by this prospectus. This prospectus is a part of, and does not contain all of the information set forth in, the registration statement and the exhibits and schedules to the registration statement. For further information with respect to us and our common stock, please refer to the registration statement, including its exhibits and schedules. Statements made in this prospectus relating to any contract or other document are not necessarily complete, and you should refer to the exhibits attached to the registration statement for copies of the actual contract or document. You may review a copy of the registration statement, including its exhibits and schedules, at the SEC’s public reference room, located at 100 F Street, N.E., Washington, D.C. 20549, by calling the SEC at 1-800-SEC-0330 as well as on the Internet website maintained by the SEC at www.sec.gov. Information contained on any website referenced in this prospectus is not incorporated by reference in this prospectus.
We are subject to the information and reporting requirements of the Exchange Act and, in accordance with the Exchange Act, as required, we will file periodic reports, proxy statements and other information with the SEC.
We intend to furnish holders of our common stock with annual reports containing consolidated financial statements prepared in accordance with U.S. generally accepted accounting principles and audited and reported on, with an opinion expressed, by an independent registered public accounting firm.
You should rely only on the information contained in this prospectus. We have not authorized any person, including any salesman or broker, to provide information other than that provided in this prospectus. We have not authorized anyone to provide you with different information. We are not making an offer of the securities in any jurisdiction where the offer is not permitted. You should assume that the information in this prospectus is accurate only as of the date on its cover page.
204
Table of Contents
Hunton & Williams LLP has passed upon the validity of the common stock on behalf of the issuer.
205
Table of Contents
The financial statements as of December 31, 2013 and 2012 and for each of the three years in the period ended December 31, 2013, included in this prospectus, have been so included in reliance on the report of PricewaterhouseCoopers LLP, an independent registered public accounting firm, given on the authority of said firm as experts in auditing and accounting.
206
Table of Contents
F-1
Table of Contents
REPORT OF INDEPENDENT REGISTERED PUBLIC ACCOUNTING FIRM
To the Board of Directors and Shareholders of
Cash America International, Inc.:
In our opinion, the accompanying consolidated balance sheets and the related consolidated statements of income, comprehensive income, stockholder’s equity, and cash flows present fairly, in all material respects, the financial position of Enova International, Inc. and its subsidiaries at December 31, 2013 and 2012, and the results of their operations and their cash flows for each of the three years in the period ended December 31, 2013 in conformity with accounting principles generally accepted in the United States of America. These financial statements are the responsibility of the Company’s management. Our responsibility is to express an opinion on these financial statements based on our audits. We conducted our audits of these statements in accordance with the standards of the Public Company Accounting Oversight Board (United States). Those standards require that we plan and perform the audit to obtain reasonable assurance about whether the financial statements are free of material misstatement. An audit includes examining, on a test basis, evidence supporting the amounts and disclosures in the financial statements, assessing the accounting principles used and significant estimates made by management, and evaluating the overall financial statement presentation. We believe that our audits provide a reasonable basis for our opinion.
/s/ PricewaterhouseCoopers LLP
Fort Worth, Texas
April 30, 2014
F-2
Table of Contents
CONSOLIDATED BALANCE SHEETS
(dollars in thousands, except per share data)
| DECEMBER 31, | ||||||||
| 2013 | 2012 | |||||||
| Assets |
||||||||
| Current assets: |
||||||||
| Cash and cash equivalents |
$ | 47,480 | $ | 37,548 | ||||
| Consumer loans, net |
303,467 | 228,390 | ||||||
| Prepaid expenses and other assets |
8,686 | 10,860 | ||||||
| Deferred tax assets |
30,914 | 31,990 | ||||||
|
|
|
|
|
|||||
| Total current assets |
390,547 | 308,788 | ||||||
| Property and equipment, net |
39,405 | 41,759 | ||||||
| Goodwill |
255,869 | 255,875 | ||||||
| Intangible assets, net |
45 | 168 | ||||||
| Other assets |
6,286 | 6,278 | ||||||
|
|
|
|
|
|||||
| Total Assets |
$ | 692,152 | $ | 612,868 | ||||
|
|
|
|
|
|||||
| Liabilities and Stockholder’s Equity |
||||||||
| Current liabilities: |
||||||||
| Accounts payable and accrued expenses |
$ | 49,614 | $ | 47,720 | ||||
|
|
|
|
|
|||||
| Total current liabilities |
49,614 | 47,720 | ||||||
| Deferred tax liabilities |
45,306 | 39,843 | ||||||
| Other liabilities |
51 | — | ||||||
| Affiliate line of credit |
424,133 | 427,889 | ||||||
|
|
|
|
|
|||||
| Total Liabilities |
$ | 519,104 | $ | 515,452 | ||||
|
|
|
|
|
|||||
| Commitments and Contingencies |
||||||||
| Stockholder’s Equity: |
||||||||
| Common stock, $0.00001 par value, 250,000,000 shares authorized, 33,000,000 shares issued and outstanding |
— | — | ||||||
| Preferred stock, $0.00001 par value, 25,000,000 shares authorized, no shares issued and outstanding |
— | — | ||||||
| Retained earnings |
169,947 | 96,682 | ||||||
| Accumulated other comprehensive income |
3,101 | 734 | ||||||
|
|
|
|
|
|||||
| Total Stockholder’s Equity |
173,048 | 97,416 | ||||||
|
|
|
|
|
|||||
| Total Liabilities and Stockholder’s Equity |
$ | 692,152 | $ | 612,868 | ||||
|
|
|
|
|
|||||
See Notes to Consolidated Financial Statements
F-3
Table of Contents
CONSOLIDATED STATEMENTS OF INCOME
(amounts in thousands, except per share data)
| YEAR ENDED DECEMBER 31, | ||||||||||||
| 2013 | 2012 | 2011 | ||||||||||
| Revenue |
$ | 765,323 | $ | 660,928 | $ | 480,340 | ||||||
| Cost of Revenue |
315,052 | 288,474 | 201,687 | |||||||||
|
|
|
|
|
|
|
|||||||
| Gross Profit |
450,271 | 372,454 | 278,653 | |||||||||
| Expenses |
||||||||||||
| Marketing |
135,336 | 108,810 | 73,329 | |||||||||
| Operations and technology |
70,776 | 63,505 | 52,371 | |||||||||
| General and administrative |
84,420 | 72,690 | 65,401 | |||||||||
| Depreciation and amortization |
17,143 | 13,272 | 11,263 | |||||||||
|
|
|
|
|
|
|
|||||||
| Total Expenses |
307,675 | 258,277 | 202,364 | |||||||||
|
|
|
|
|
|
|
|||||||
| Income from Operations |
142,596 | 114,177 | 76,289 | |||||||||
| Affiliate interest expense |
(19,788 | ) | (20,996 | ) | (17,420 | ) | ||||||
| Foreign currency transaction loss |
(1,176 | ) | (342 | ) | (487 | ) | ||||||
|
|
|
|
|
|
|
|||||||
| Income before Income Taxes |
121,632 | 92,839 | 58,382 | |||||||||
| Provision for income taxes |
43,594 | 33,967 | 21,350 | |||||||||
|
|
|
|
|
|
|
|||||||
| Net Income |
$ | 78,038 | $ | 58,872 | $ | 37,032 | ||||||
|
|
|
|
|
|
|
|||||||
| Earnings per share |
||||||||||||
| Earnings per common share, basic and diluted |
$ | 2.36 | $ | 1.78 | $ | 1.12 | ||||||
| Weighted average shares outstanding, basic and diluted |
33,000 | 33,000 | 33,000 | |||||||||
See Notes to Consolidated Financial Statements
F-4
Table of Contents
CONSOLIDATED STATEMENTS OF COMPREHENSIVE INCOME
(dollars in thousands)
| YEAR ENDED DECEMBER 31, | ||||||||||||
| 2013 | 2012 | 2011 | ||||||||||
| Net Income |
$ | 78,038 | $ | 58,872 | $ | 37,032 | ||||||
| Other comprehensive income (loss), net of tax: |
||||||||||||
| Foreign currency translation gain (loss) (1) |
2,367 | 1,487 | (547 | ) | ||||||||
|
|
|
|
|
|
|
|||||||
| Total other comprehensive income (loss), net of tax |
2,367 | 1,487 | (547 | ) | ||||||||
|
|
|
|
|
|
|
|||||||
| Comprehensive Income |
$ | 80,405 | $ | 60,359 | $ | 36,485 | ||||||
|
|
|
|
|
|
|
|||||||
| (1) | Net of tax (provision) benefit of $(1,322), $(836) and $305 for the years ended December 31, 2013, 2012 and 2011, respectively. |
See Notes to Consolidated Financial Statements
F-5
Table of Contents
CONSOLIDATED STATEMENTS OF STOCKHOLDER’S EQUITY
(amounts in thousands)
|
COMMON STOCK |
RETAINED EARNINGS |
ACCUMULATED OTHER COMPREHENSIVE INCOME (LOSS) |
TOTAL STOCKHOLDER’S EQUITY |
|||||||||||||||||
| SHARES | AMOUNT | |||||||||||||||||||
| Balance at December 31, 2010 |
33,000 | $ | — | $ | 79,783 | $ | (206 | ) | $ | 79,577 | ||||||||||
| Net equity transactions with parent |
787 | — | 787 | |||||||||||||||||
| Net income |
37,032 | — | 37,032 | |||||||||||||||||
| Dividends paid to Cash America ($2.27 per share) |
(75,000 | ) | — | (75,000 | ) | |||||||||||||||
| Foreign currency translation loss, net of tax |
— | (547 | ) | (547 | ) | |||||||||||||||
|
|
|
|
|
|
|
|
|
|
|
|||||||||||
| Balance at December 31, 2011 |
33,000 | — | 42,602 | (753 | ) | 41,849 | ||||||||||||||
| Net equity transactions with parent |
(4,792 | ) | — | (4,792 | ) | |||||||||||||||
| Net income |
58,872 | — | 58,872 | |||||||||||||||||
| Foreign currency translation gain, net of tax |
— | 1,487 | 1,487 | |||||||||||||||||
|
|
|
|
|
|
|
|
|
|
|
|||||||||||
| Balance at December 31, 2012 |
33,000 | — | 96,682 | 734 | 97,416 | |||||||||||||||
| Net equity transactions with parent |
(4,773 | ) | — | (4,773 | ) | |||||||||||||||
| Net income |
78,038 | — | 78,038 | |||||||||||||||||
| Foreign currency translation gain, net of tax |
— | 2,367 | 2,367 | |||||||||||||||||
|
|
|
|
|
|
|
|
|
|
|
|||||||||||
| Balance at December 31, 2013 |
33,000 | $ | — | $ | 169,947 | $ | 3,101 | $ | 173,048 | |||||||||||
|
|
|
|
|
|
|
|
|
|
|
|||||||||||
See Notes to Consolidated Financial Statements
F-6
Table of Contents
CONSOLIDATED STATEMENTS OF CASH FLOWS
(dollars in thousands)
| YEAR ENDED DECEMBER 31, | ||||||||||||
| 2013 | 2012 | 2011 | ||||||||||
| Cash Flows from Operating Activities |
||||||||||||
| Net Income |
$ | 78,038 | $ | 58,872 | $ | 37,032 | ||||||
| Adjustments to reconcile net income to net cash provided by operating activities: |
||||||||||||
| Depreciation and amortization |
17,143 | 13,272 | 11,263 | |||||||||
| Cost of revenue |
315,052 | 288,474 | 201,687 | |||||||||
| Non-cash affiliate interest expense |
19,788 | 20,996 | 17,420 | |||||||||
| Stock-based compensation |
250 | 146 | 176 | |||||||||
| Deferred income taxes, net |
5,238 | (2,425 | ) | 2,446 | ||||||||
| Other |
261 | 5 | 18 | |||||||||
| Changes in operating assets and liabilities, net of assets acquired Finance and service charges receivable on consumer loans |
(5,697 | ) | (6,900 | ) | (9,068 | ) | ||||||
| Prepaid expenses and other assets |
1,842 | (200 | ) | (2,244 | ) | |||||||
| Accounts payable, accrued expenses and other liabilities |
6,378 | 3,257 | 8,230 | |||||||||
| Current intercompany income taxes payable |
5 | 11 | (11,027 | ) | ||||||||
|
|
|
|
|
|
|
|||||||
| Net cash provided by operating activities |
438,298 | 375,508 | 255,933 | |||||||||
|
|
|
|
|
|
|
|||||||
| Cash Flows from Investing Activities |
||||||||||||
| Consumer loans originated or acquired |
(1,344,851 | ) | (1,140,215 | ) | (857,029 | ) | ||||||
| Consumer loans repaid |
955,984 | 793,748 | 590,602 | |||||||||
| Purchases of property and equipment |
(14,872 | ) | (17,872 | ) | (15,073 | ) | ||||||
| Investment in non-marketable securities |
— | (1,000 | ) | — | ||||||||
| Other investing activities |
— | (178 | ) | — | ||||||||
|
|
|
|
|
|
|
|||||||
| Net cash used in investing activities |
(403,739 | ) | (365,517 | ) | (281,500 | ) | ||||||
|
|
|
|
|
|
|
|||||||
| Cash Flows from Financing Activities |
||||||||||||
| Net equity transactions with parent |
(5,023 | ) | (4,938 | ) | 425 | |||||||
| (Payments to) borrowings from affiliates |
(23,544 | ) | (4,070 | ) | 42,705 | |||||||
|
|
|
|
|
|
|
|||||||
| Net cash (used in) provided by financing activities |
(28,567 | ) | (9,008 | ) | 43,130 | |||||||
|
|
|
|
|
|
|
|||||||
| Effect of exchange rates on cash |
3,940 | 2,154 | (805 | ) | ||||||||
|
|
|
|
|
|
|
|||||||
| Net increase in cash and cash equivalents |
9,932 | 3,137 | 16,758 | |||||||||
| Cash and cash equivalents at beginning of year |
37,548 | 34,411 | 17,653 | |||||||||
|
|
|
|
|
|
|
|||||||
| Cash and cash equivalents at end of year |
$ | 47,480 | $ | 37,548 | $ | 34,411 | ||||||
|
|
|
|
|
|
|
|||||||
See Notes to Consolidated Financial Statements
F-7
Table of Contents
Enova International, Inc. (the “Company”) operates an Internet-based lending platform to serve customers in need of cash to fulfill their financial responsibilities. Through a network of direct and indirect marketing activities, the Company offers funds to its customers through a variety of unsecured consumer loan products. The business is operated strictly through the Internet to provide a convenient, fully-automated financial solution to its customers. As of December 31, 2013, the Company offered consumer loans under the names “CashNetUSA” and “NetCredit” in 32 states in the United States, under the names “QuickQuid,” “QuickQuid FlexCredit” and “Pounds to Pocket” in the United Kingdom and under the name “DollarsDirect” in Australia and Canada. As of December 31, 2013, the Company is a wholly-owned subsidiary of Cash America International, Inc. (“Cash America”).
The Company originates, guarantees or purchases consumer loans (collectively referred to as “consumer loans” throughout this discussion). Consumer loans provide customers with cash in their account, typically in exchange for an obligation to repay the amount advanced plus fees and/or interest. Consumer loans include short-term loans, line of credit accounts and installment loans.
Short-term loans include unsecured short-term loans written by the Company or by a third-party lender through the Company’s credit services organization and credit access business programs (“CSO programs” as further described below) that the Company guarantees. Line of credit accounts include draws made through the Company’s line of credit product. Installment loans are longer-term multi-payment loans that generally require the pay-down of portions of the outstanding principal balance in multiple installments.
Through the Company’s CSO programs the Company provides services related to a third-party lender’s consumer loan products in some markets by acting as a credit services organization or credit access business on behalf of consumers in accordance with applicable state laws. Services offered under the CSO programs include credit-related services such as arranging loans with independent third-party lenders and assisting in the preparation of loan applications and loan documents (“CSO loans”). Under the CSO programs, the Company guarantees consumer loan payment obligations to the third-party lender in the event that the customer defaults on the loan. CSO loans are not included in the Company’s financial statements, but the Company has established a liability for the estimated losses in support of the guarantee on these loans in its consolidated balance sheets.
2. Significant Accounting Policies
Basis of Presentation
On September 7, 2011, Cash America formed a new company, Enova International, Inc. On September 13, 2011, Cash America contributed to Enova International, Inc. all of the stock of its wholly-owned subsidiary, Enova Online Services, Inc., in exchange for 33 million shares of the Company’s common stock. The consolidated financial information presented reflects the retrospective application of this contribution.
The consolidated financial statements of the Company reflect the historical results of operations and cash flows of the Company during each respective period. The financial statements include goodwill and intangible assets arising from businesses previously acquired. The financial statements also include the allocation of certain assets and liabilities that have historically been held at the Cash America corporate level but which are specifically identifiable or allocable to Enova. All intercompany transactions between Enova and Cash America are considered to be effectively settled in the financial statements at the time the transaction is recorded. The net effect of the settlement of these transactions is primarily reflected as a change in “Affiliate line of credit” on the consolidated balance sheets. Certain other transactions with Cash America, such as stock-based compensation, foreign currency transactions and settlement of certain intercompany allocations from Cash America, are settled as net equity transactions with parent in “Retained earnings” on the consolidated balance sheets. In addition, the historical financial statements include allocations of costs relating to certain functions historically provided by
F-8
Table of Contents
Cash America, including corporate services such as executive oversight, insurance and risk management, government relations, internal audit, treasury, licensing, and to a limited extent finance, accounting, tax, legal, human resources, compensation and benefits, compliance and support for certain information systems related to financial reporting. The expense allocations have been determined on a basis that Cash America and the Company consider to be reasonable reflections of the utilization of services provided by Cash America. See “General and Administrative Expenses” for an explanation of this allocation method. Also see Note 14 for additional information on the Company’s relationship with Cash America. The financial information included herein may not be indicative of the consolidated financial position, operating results, changes in stockholder’s equity and cash flows of the Company in the future, or if the Company had been a separate company during the periods presented.
Reclassifications
Certain operating expense amounts reported for prior periods have been reclassified to conform to the current year’s presentation.
Revision of Prior Period Financial Statements
Cash and cash equivalents, consumer loans, net, and accounts payable and accrued expenses as of December 31, 2011 and 2010 were revised to correct the classification of cash and accounts payable and to correct for consumer loans that had not been funded as of the balance sheet date. The correction resulted in a decrease in cash and cash equivalents of $3.7 million and $1.5 million, a decrease in consumer loans, net of $1.0 million and $1.2 million and a decrease in accounts payable and accrued expenses of $4.7 million and $2.7 million as of December 31, 2011 and 2010, respectively. In the consolidated statement of cash flows for the year ended December 31, 2011, the correction resulted in a decrease in net cash provided by operating activities of $2.0 million, a decrease in net cash used in investing activities of $0.2 million, a decrease in cash and cash equivalents at beginning of year of $1.5 million and a decrease in cash and cash equivalents at end of year of $3.7 million. Management determined that the impact on previously issued financial statements was immaterial, however, management determined it was appropriate to correct the presentation of the consolidated statement of cash flows for the year ended December 31, 2011.
Use of Estimates
The preparation of these financial statements requires management to make estimates and assumptions that affect the reported amounts of assets and liabilities, and disclosure of contingent assets and liabilities, at the dates of the consolidated financial statements and the reported amounts of revenue and expenses during the reporting periods. On an on-going basis, management evaluates its estimates and judgments, including those related to revenue recognition, allowance for losses on consumer loans, goodwill, long-lived and intangible assets, income taxes, contingencies and litigation. Management bases its estimates on historical experience, empirical data and on various other assumptions that are believed to be reasonable under the circumstances, the results of which form the basis for making judgments about the carrying values of assets and liabilities. Actual results may differ from these estimates.
Foreign Currency Translations
The functional currencies for the Company’s subsidiaries that serve residents of the United Kingdom, Australia and Canada are the British pound, the Australian dollar and the Canadian dollar, respectively. The assets and liabilities of these subsidiaries are translated into U.S. dollars at the exchange rates in effect at each balance sheet date, and the resulting adjustments are recorded in “Accumulated other comprehensive income (loss)” (“AOCI”) as a separate component of stockholder’s equity. Revenue and expenses are translated at the monthly average exchange rates occurring during each period.
F-9
Table of Contents
Cash and Cash Equivalents
The Company considers deposits in banks and short-term investments with original maturities of 90 days or less as cash and cash equivalents.
Revenue Recognition
The Company recognizes consumer loan fees as revenue for each of the loan products it offers. “Revenue” in the consolidated statements of income include: interest income, finance charges, fees for services provided through the CSO programs (“CSO fees”), service charges, draw fees, minimum fees, late fees, nonsufficient funds fees and any other fees or charges permitted by applicable laws and pursuant to the agreement with the borrower. For short-term loans that the Company offers, interest and finance charges are recognized on an effective yield basis over the term of the loan, and fees are recognized when assessed to the customer. CSO fees are recognized on an effective yield basis over the term of the loan. For line of credit accounts, interest is recognized during the period based upon the balance outstanding and the contractual interest rate, and fees are recognized when assessed to the customer. For installment loans, revenue is recognized on an effective yield basis over the term of the loan and fees are recognized when assessed to the customer. Unpaid and accrued interest and fees are included in “Consumer loans, net” in the consolidated balance sheets.
Current and Delinquent Consumer Loans
The Company classifies its consumer loans as either current or delinquent. Short-term loans are considered delinquent when payment of an amount due is not made as of the due date. If a line of credit account or installment loan customer misses one payment, that payment is considered delinquent and the balance of the loan is considered current. The Company does not accrue interest on the delinquent payment portion of the loan but does continue to accrue interest on the remaining portion of the loan. If a line of credit account or installment loan customer does not make two consecutive payments, the entire account or loan is classified as delinquent. The Company allows for normal payment processing time before considering a loan delinquent but does not provide for any additional grace period.
The Company generally does not accrue interest on delinquent consumer loans and does not resume accrual of interest on a delinquent loan unless it is returned to current status. In addition, delinquent consumer loans generally may not be renewed, and if, during its attempt to collect on a delinquent consumer loan, the Company allows additional time for payment through a payment plan or a promise to pay, it is still considered delinquent. All payments received are first applied against accrued but unpaid interest and fees and then against the principal balance of the loan.
Allowance and Liability for Estimated Losses on Consumer Loans
The Company monitors the performance of its consumer loan portfolio and maintains either an allowance or liability for estimated losses on consumer loans (including fees and interest) at a level estimated to be adequate to absorb credit losses inherent in the portfolio. The allowance for losses on the Company’s owned consumer loans reduces the outstanding loan balance in the consolidated balance sheets. The liability for estimated losses related to loans guaranteed under the CSO programs is initially recorded at fair value and is included in “Accounts payable and accrued expenses” in the consolidated balance sheets.
In determining the allowance or liability for estimated losses on consumer loans, the Company applies a documented systematic methodology. In calculating the allowance or liability for loan losses, outstanding loans are divided into discrete groups of short-term loans, line of credit accounts and installment loans and are analyzed as current or delinquent. Increases in either the allowance or the liability, net of charge-offs and recoveries, are recorded as a “Cost of revenue” in the consolidated statements of income.
The allowance or liability for short-term loans classified as current is based on historical loss rates adjusted for recent default trends for current loans. For delinquent short-term loans, the allowance or liability is based on a six-month rolling average of loss rates by stage of collection. For line of credit accounts and installment loan
F-10
Table of Contents
portfolios, the Company generally uses a migration analysis to estimate losses inherent in the portfolio. The allowance or liability calculation under the migration analysis is based on historical charge-off experience and the loss emergence period, which represents the average amount of time between the first occurrence of a loss event to the charge-off of a loan. The factors the Company considers to assess the adequacy of the allowance or liability include past due performance, historical behavior of monthly vintages, underwriting changes and recent trends in delinquency in the migration analysis.
The Company fully reserves and generally charges off consumer loans once the loan or a portion of the loan has been classified as delinquent for 60 consecutive days. If a loan is deemed uncollectible before it is fully reserved, it is charged off at that point. Consumer loans classified as delinquent generally have an age of one to 59 days from the date any portion of the loan became delinquent, as defined above. Recoveries on loans previously charged to the allowance are credited to the allowance when collected.
Property and Equipment
Property and equipment is recorded at cost. The cost of property retired or sold and the related accumulated depreciation are removed from the accounts, and any resulting gain or loss is recognized in the consolidated statements of income. Costs associated with repair and maintenance activities are expensed as incurred. Depreciation expense is generally provided on a straight-line basis, using the following estimated useful lives:
| Computer hardware and software |
2 to 5 years | |||
| Furniture, fixtures and equipment |
3 to 7 years | |||
| Leasehold improvements (1) |
2 to 10 years |
| (1) | Leasehold improvements are depreciated over the lesser of the estimated useful life, remaining lease term, or 10 years. |
Software Development Costs
The Company applies Accounting Standards Codification (“ASC”) 350-40, Internal Use Software (“ASC 350-40”), to its software purchase and development activities. Under ASC 350-40, eligible internal and external costs incurred for the development of computer applications, as well as for upgrades and enhancements that result in additional functionality of the applications, are capitalized to “Property and equipment” on the consolidated balance sheets. Internal and external training and maintenance costs are charged to expense as incurred or over the related service period. When a software application is placed in service, the Company begins amortizing the related capitalized software costs using the straight-line method based on its estimated useful life, which currently ranges from two to five years.
Goodwill
Goodwill represents the excess of the purchase price over the fair value of the net tangible and identifiable intangible assets acquired in each business combination. In accordance with ASC 350, Intangibles—Goodwill and Other (“ASC 350”), the Company tests goodwill and intangible assets with an indefinite life for potential impairment annually as of June 30 and between annual tests if an event occurs or circumstances change that would more likely than not reduce the fair value of a reporting unit below its carrying amount.
The Company uses the income approach to complete its annual goodwill assessment. The income approach uses future cash flows and estimated terminal values for the Company that are discounted using a market participant perspective to determine the fair value, which is then compared to the carrying value to determine if there is impairment. The income approach includes assumptions about revenue growth rates, operating margins and terminal growth rates discounted by an estimated weighted-average cost of capital derived from other publicly-traded companies that are similar but not identical from an operational and economic standpoint. The Company completed its annual assessment of goodwill as of June 30, 2013 and determined that the fair value of its goodwill exceeded carrying value, and, as a result, no impairment existed at that date.
F-11
Table of Contents
As of December 31, 2013, the Company had $255.9 million of goodwill, all of which is expected to be deductible for tax purposes.
Long-Lived Assets Other Than Goodwill
An evaluation of the recoverability of property and equipment and intangible assets subject to amortization is performed whenever the facts and circumstances indicate that the carrying value may be impaired. An impairment loss is recognized if the future undiscounted cash flows associated with the asset and the estimated fair value of the asset are less than the asset’s corresponding carrying value. The amount of the impairment loss, if any, is the excess of the asset’s carrying value over its estimated fair value.
The Company amortizes intangible assets subject to amortization on the basis of their expected periods of benefit, generally three to five years. The costs of start-up activities and organization costs are charged to expense as incurred.
Hedging and Derivatives Activity
Cash America periodically uses foreign currency forward contracts, which are considered derivative instruments, to minimize the effects of foreign currency risk in the United Kingdom and Australia related to the operations of the Company. The Company participates in Cash America’s derivative and hedging programs, which are coordinated through a centralized treasury function; therefore, the assets and liabilities related to derivative instruments are not recorded in the Company’s financial statements. The forward contracts are not designated as hedges as defined by ASC 815, Derivatives and Hedging; therefore, any changes in the fair value of the forward contracts are recognized in “Foreign currency transaction loss” in the consolidated statements of income. See Note 13.
Non-Marketable Equity Securities
The Company accounts for its non-marketable equity securities in accordance with ASC 325, Investments—Other. Non-marketable equity securities are recorded on a cost basis. The Company evaluates non-marketable equity securities for impairment on a quarterly basis. If an impairment of an equity security is determined to be other than temporary, the cost basis of the investment will be reduced and the resulting loss recognized in net income in the period the other-than-temporary-impairment is identified. Non-marketable equity securities are held in “Other assets” on the consolidated balance sheets.
As of December 31, 2013, the Company owned a $6.0 million investment in the preferred stock of an early-stage privately-held developing consumer financial services entity. The entity is not currently profitable and has historically funded its operations through a series of capital contributions from investors. The Company’s impairment evaluation of this investment as of December 31, 2013 determined that an impairment loss was not probable as of that date. The Company will continue to evaluate the impairment risk of this entity by monitoring and assessing the entity’s ability to raise capital or generate profits to fund its future operations.
Marketing Expenses
Marketing expenses consist of online marketing costs such as sponsored search and advertising on social networking sites, and offline marketing costs such as television, radio and print advertising. In addition, marketing expenses include lead purchase costs paid to marketers in exchange for providing information or applications from potential customers interested in using the Company’s services. Online marketing and lead purchase costs are expensed as incurred. The production costs associated with offline marketing are expensed as incurred. Other marketing costs are expensed as incurred.
The Company also has an agreement with an independent third party pursuant to which the Company pays a portion of the net revenue received from the customers referred to the Company by such third party. The Company also has an arrangement with Cash America pursuant to which the Company pays either a lead purchase fee or a portion of the net revenue received from the customers referred to the Company by Cash America. These referral fees are expensed as incurred and included in “Marketing” in the consolidated statements of income.
F-12
Table of Contents
Operations and Technology Expenses
Operations and technology expenses include all expenses related to the direct operations and technology infrastructure related to loan underwriting and processing. This includes call center and operations personnel costs, software maintenance expense, underwriting data from third-party vendors, and telephony costs.
General and Administrative Expenses
General and Administrative expenses primarily include the Company’s corporate personnel costs, as well as legal, occupancy, and other related costs. In addition, general and administrative expenses include expense allocations for certain corporate service functions historically provided by Cash America, such as executive oversight, insurance and risk management, government relations, internal audit, treasury, licensing, and to a limited extent finance, accounting, tax, legal, human resources, compensation and benefits, compliance and support for certain information systems related to financial reporting. Cash America allocates these expenses to the Company based on the Company’s share of Cash America’s corporate services expenses incurred for the consolidated entity. Actual corporate services costs that may have been incurred if the Company had been a stand-alone company would depend on a number of factors, including the chosen organizational structure, what functions were outsourced or performed by employees, and strategic decisions made in areas such as information technology and infrastructure. The Company believes that the expenses in these financial statements are reported on a basis that fairly represents the utilization of the services provided. These financial statements do not necessarily reflect the financial position or results of operations that would have existed if the Company had been operated as a stand-alone entity during the periods covered and may not be indicative of future results of operations and financial position. See Note 14 for additional information.
Stock-Based Compensation
During the periods presented, certain employees received stock-based compensation in the form of restricted stock units from Cash America. The Company accounts for its stock-based employee compensation plans in accordance with ASC 718, Compensation—Stock Compensation (“ASC 718”). In accordance with ASC 718, the Company recognizes compensation expense over the remaining vesting periods for stock-based awards. These awards are reflected as a net equity transaction with parent in the Company’s statement of stockholder’s equity. During the years ended December 31, 2011 and 2012, certain employees received performance-based stock awards. For these awards, compensation expense is originally based on the number of shares that would vest if the Company achieved the level of performance that management estimates is the most probable outcome at the grant date. Throughout the requisite service period, management monitors the probability of achievement of the performance condition and adjusts stock-based compensation expense if necessary. See Note 12.
Income Taxes
The provision for income taxes is based on income before income taxes as reported for financial statement purposes. Deferred income taxes are provided for in accordance with the assets and liability method of accounting for income taxes in order to recognize the tax effects of temporary differences between financial statement and income tax accounting.
In the Company’s financial statements, income tax expense and deferred tax balances have been calculated on a separate tax return basis although Enova’s operations have historically been included as part of consolidated and unitary tax returns with Cash America and its affiliated companies. With the exception of certain entities outside of the United States, Enova settles its current tax balances with Cash America on a quarterly basis through an adjustment to its affiliate line of credit with Cash America.
The Company accounts for uncertainty in income taxes in accordance with ASC 740, Income Taxes (“ASC 740”). ASC 740 requires that a more-likely-than-not threshold be met before the benefit of a tax position may be recognized in the consolidated financial statements and prescribes how such benefit should be measured. It also provides guidance on recognition adjustment, classification, accrual of interest and penalties, accounting in interim periods, disclosure and transition.
F-13
Table of Contents
The Company performs an evaluation of the recoverability of its deferred tax assets on a quarterly basis. The Company establishes a valuation allowance if it is more likely than not (greater than 50 percent) that all or some portion of the deferred tax asset will not be realized. The Company analyzes several factors, including the nature and frequency of operating losses, the Company’s carryforward period for any losses, the reversal of future taxable temporary differences, the expected occurrence of future income or loss and the feasibility of available tax planning strategies to protect against the loss of deferred tax assets. See Note 9 for further discussion.
It is the Company’s policy to classify interest and penalties on income tax liabilities as interest expense and general and administrative expense, respectively.
Earnings Per Share
Basic earnings per share is computed by dividing net income by the weighted average number of common shares outstanding during the year. Diluted earnings per share is calculated by giving effect to the potential dilution that could occur if securities or other contracts to issue common shares were exercised and converted into common shares during the year.
Adopted Accounting Standards
In February 2013, the Financial Accounting Standards Board (the “FASB”) issued Accounting Standards Update (“ASU”) No. 2013-02, Comprehensive Income (Topic 220)—Reporting of Amounts Reclassified Out of Accumulated Other Comprehensive Income (“ASU 2013-02”), which improves the reporting of reclassifications out of AOCI. ASU 2013-02 requires an entity to report the effect of significant reclassifications out of AOCI by the respective line items on the consolidated statements of income that compose net income if the amount being reclassified is required under GAAP to be reclassified in its entirety to net income. For other amounts that are not required under GAAP to be reclassified in their entirety from AOCI to net income in the same reporting period, an entity is required to cross-reference other disclosures required under GAAP that provide additional detail about those amounts. The Company adopted ASU 2013-02 on January 1, 2013, and the adoption did not have a material effect on its financial position, results of operations or other comprehensive income.
In July 2012, the FASB issued ASU 2012-02, Intangibles—Goodwill and Other (Topic 350): Testing Indefinite-Lived Intangible Assets for Impairment (“ASU 2012-02”). ASU 2012-02 provides companies with the option to assess qualitative factors to determine whether the existence of events and circumstances indicates that it is more likely than not (a likelihood of more than 50 percent) that the indefinite-lived intangible asset is impaired. If a company concludes that it is more likely than not that the asset is impaired, it is required to determine the fair value of the intangible asset and perform the quantitative impairment test by comparing the fair value with the carrying value in accordance with ASC 350. If a company concludes otherwise, no further quantitative assessment is required. ASU 2012-02 is effective for annual and interim impairment tests performed for fiscal years beginning after September 15, 2012, although early adoption is permitted. The Company adopted ASU 2012-02 on January 1, 2013, and the adoption did not have a material effect on its financial position or results of operations.
In December 2011, the FASB issued ASU No. 2011-11, Disclosures about Offsetting Assets and Liabilities (Topic 210) (“ASU 2011-11”). ASU 2011-11 requires a company to provide enhanced disclosures about financial instruments and derivative instruments that are either presented on a net basis on the balance sheet or are subject to an enforceable master netting or similar arrangement. In January 2013, the FASB issued ASU No. 2013-01, Clarifying the Scope of Disclosures about Offsetting Assets and Liabilities (“ASU 2013-01”), which limits the scope of ASU 2011-11 by requiring additional disclosure about financial instruments and derivative instruments that are either offset in the statement of financial position or subject to an enforceable master netting arrangement. ASU 2013-01 requires retrospective disclosure for all comparative periods. ASU 2011-11 and ASU 2013-01 are effective for annual and interim reporting periods beginning January 1, 2013. The Company adopted ASU 2011-11 and ASU 2013-01 on January 1, 2013, and the adoption of these standards did not have a material effect on its financial position or results of operations. See Note 17 for further discussion.
F-14
Table of Contents
In September 2011, the FASB issued ASU No. 2011-08, Testing Goodwill for Impairment (“ASU 2011-08”). This update is intended to simplify goodwill impairment testing by adding an optional qualitative review step to assess whether the required quantitative impairment analysis that exists under GAAP is necessary. Under ASU 2011-08, a company will not be required to calculate the fair value of a reporting unit that contains recorded goodwill unless it concludes, based on the qualitative assessment, that it is more likely than not (a likelihood of more than 50 percent) that the fair value of that reporting unit is less than its book value. If such a decline in fair value is deemed more likely than not to have occurred, then the quantitative goodwill impairment test that exists under current GAAP must be completed. If not, goodwill is deemed not impaired and no further testing is required until the next annual test date, unless conditions or events before that date raise concerns of potential impairment. The amended goodwill impairment guidance does not affect the manner in which a company estimates fair value. The Company adopted ASU 2011-08 on January 1, 2012 and exercised its option to bypass the qualitative assessment and utilized only a quantitative assessment in its annual goodwill assessment, which was completed in June 2012, and its additional goodwill assessment completed in September 2012. See Notes 4 and 22. The adoption of ASU 2011-08 did not have a material effect on the Company’s financial position or results of operations.
In June 2011, the FASB issued ASU No. 2011-05, Presentation of Comprehensive Income (“ASU 2011-05”), which enhances comparability between entities that report under GAAP and those that report under International Financial Reporting Standards (“IFRS”). ASU 2011-05 requires companies to present the components of net income and other comprehensive income either as one continuous statement or as two consecutive statements. It eliminates the option to present components of other comprehensive income as part of the statement of equity. ASU 2011-05 is effective for the Company’s interim and annual periods beginning after December 15, 2011 and must be applied retrospectively. In December 2011, the FASB issued ASU No. 2011-12, Comprehensive Income (Topic 220): Deferral of the Effective Date for Amendments to the Presentation of Reclassifications of Items Out of Accumulated Other Comprehensive Income in Accounting Standards Update No. 2011-05 (“ASU 2011-12”). ASU 2011-12 effectively defers only those changes in ASU 2011-05 that relate to the presentation of reclassification adjustments out of accumulated other comprehensive income. The Company adopted ASU 2011-05 and ASU 2011-12 on January 1, 2012 and the adoption did not have a material effect on its financial position or results of operations.
In May 2011, the FASB issued ASU No. 2011-04, Amendments to Achieve Common Fair Value Measurement and Disclosure Requirements in U.S. GAAP and International Financial Reporting Standards (“ASU 2011-04”), which amends ASC 820, Fair Value Measurement (“ASC 820”). ASU 2011-04 provides a consistent definition and measurement of fair value, as well as similar disclosure requirements between GAAP and IFRS. ASU 2011-04 changes certain fair value measurement principles, clarifies the application of existing fair value measurement and expands the ASC 820 disclosure requirements, particularly for Level 3 fair value measurements. ASU 2011-04 is effective for the Company prospectively for interim and annual periods beginning after December 15, 2011. The Company adopted ASU 2011-04 on January 1, 2012 and the adoption did not have a material effect on its financial position or results of operations.
Accounting Standards to be Adopted in Future Periods
In July 2013, the FASB issued ASU No. 2013-11, Presentation of an Unrecognized Tax Benefit When a Net Operating Loss Carryforward, a Similar Tax Loss, or a Tax Credit Carryforward Exists (“ASU 2013-11”), which provides guidance on the presentation of unrecognized tax benefits when net operating loss carryforwards, similar tax losses, or tax credit carryforwards exist. The amendments in this update are effective for fiscal years (and interim periods within those years) beginning after December 15, 2013. Early adoption is permitted. The amendments should be applied prospectively to all unrecognized tax benefits that exist at the effective date. Retrospective application is permitted. The Company does not expect ASU 2013-11 to have a material effect on the Company’s financial condition or results of operations.
In March 2013, the FASB issued ASU No. 2013-05, Foreign Currency Matters (Topic 830): Parent’s Accounting for the Cumulative Translation Adjustment upon Derecognition of Certain Subsidiaries or Groups of
F-15
Table of Contents
Assets within a Foreign Entity or of an Investment in a Foreign Entity (a consensus of the FASB Emerging Issues Task Force) (“ASU 2013-05”), which applies to the release of the cumulative translation adjustment into net income when a parent either sells all or a part of its investment in a foreign entity or no longer holds a controlling financial interest in a subsidiary or group of assets that is a business (other than a sale of in substance real estate or conveyance of oil and gas mineral rights) within a foreign entity. ASU 2013-05 is effective prospectively for fiscal years (and interim reporting periods within those years) beginning after December 15, 2013. The Company does not expect ASU 2013-05 to have a material effect on the Company’s financial condition or results of operations.
In February 2013, the FASB issued ASU 2013-04, Obligations Resulting from Joint and Several Liability Arrangements for Which the Total Amount of the Obligation Is Fixed at the Reporting Date. ASU 2013-04 requires an entity to measure obligations resulting from joint and several liability arrangements for which the total amount of the obligation is fixed at the reporting date as the amount the reporting entity agreed to pay plus additional amounts the reporting entity expects to pay on behalf of its co-obligors. The guidance further provides for disclosure of the nature and amount of the obligation. ASU 2013-04 is effective for interim and annual reporting periods beginning after December 15, 2013. The Company does not expect ASU 2013-04 to have a material effect on the Company’s financial condition or results of operations.
3. Consumer Loans, Credit Quality Information and Allowances and Liabilities for Estimated Losses
Consumer loan fee revenue generated from the Company’s consumer loans for the years ended December 31, 2013, 2012 and 2011 was as follows (dollars in thousands):
| YEAR ENDED DECEMBER 31, | ||||||||||||
| 2013 | 2012 | 2011 | ||||||||||
| Interest and fees on short-term loans |
$ | 389,706 | $ | 459,835 | $ | 400,810 | ||||||
| Interest and fees on line of credit accounts |
170,496 | 73,532 | 30,590 | |||||||||
| Interest and fees on installment loans |
203,924 | 126,202 | 48,054 | |||||||||
|
|
|
|
|
|
|
|||||||
| Total consumer loan fees |
$ | 764,126 | $ | 659,569 | $ | 479,454 | ||||||
| Other |
1,197 | 1,359 | 886 | |||||||||
|
|
|
|
|
|
|
|||||||
| Total Revenue |
$ | 765,323 | $ | 660,928 | $ | 480,340 | ||||||
|
|
|
|
|
|
|
|||||||
The components of Company-owned consumer loan portfolio receivables at December 31, 2013 and 2012 were as follows (dollars in thousands):
| AS OF DECEMBER 31, | ||||||||||||||||||||||||||||||||
| 2013 | 2012 | |||||||||||||||||||||||||||||||
| SHORT- TERM LOANS |
LINE OF CREDIT ACCOUNTS |
INSTALLMENT LOANS |
TOTAL | SHORT- TERM LOANS |
LINE OF CREDIT ACCOUNTS |
INSTALLMENT LOANS |
TOTAL | |||||||||||||||||||||||||
| Current loans |
$ | 57,368 | $ | 112,969 | $ | 160,585 | $ | 330,922 | $ | 101,186 | $ | 35,023 | $ | 108,545 | $ | 244,754 | ||||||||||||||||
| Delinquent loans: |
||||||||||||||||||||||||||||||||
| Delinquent payment amounts (1) |
— | 4,146 | 1,724 | 5,870 | — | 952 | 1,244 | 2,196 | ||||||||||||||||||||||||
| Loans on non-accrual status |
23,385 | 8,687 | 16,921 | 48,993 | 45,286 | 6,725 | 11,781 | 63,792 | ||||||||||||||||||||||||
|
|
|
|
|
|
|
|
|
|
|
|
|
|
|
|
|
|||||||||||||||||
| Total delinquent loans |
23,385 | 12,833 | 18,645 | 54,863 | 45,286 | 7,677 | 13,025 | 65,988 | ||||||||||||||||||||||||
|
|
|
|
|
|
|
|
|
|
|
|
|
|
|
|
|
|||||||||||||||||
| Total consumer loans, gross |
$ | 80,753 | $ | 125,802 | $ | 179,230 | $ | 385,785 | $ | 146,472 | $ | 42,700 | $ | 121,570 | $ | 310,742 | ||||||||||||||||
| Less: Allowance for losses |
(20,466 | ) | (29,244 | ) | (32,608 | ) | (82,318 | ) | (41,942 | ) | (12,565 | ) | (27,845 | ) | (82,352 | ) | ||||||||||||||||
|
|
|
|
|
|
|
|
|
|
|
|
|
|
|
|
|
|||||||||||||||||
| Consumer loans, net |
$ | 60,287 | $ | 96,558 | $ | 146,622 | $ | 303,467 | $ | 104,530 | $ | 30,135 | $ | 93,725 | $ | 228,390 | ||||||||||||||||
|
|
|
|
|
|
|
|
|
|
|
|
|
|
|
|
|
|||||||||||||||||
F-16
Table of Contents
| (1) | Represents the delinquent portion of installment loans and line of credit account balances for customers that have only missed one payment. See Note 2, Significant Accounting Policies—Current and Delinquent Consumer Loans for additional information. |
Changes in the allowance for losses for the Company-owned loans and the liability for estimated losses on the Company’s guarantees of third-party lender-owned loans through the CSO programs for the years ended December 31, 2013, 2012 and 2011 were as follows (dollars in thousands):
| YEAR ENDED DECEMBER 31, 2013 | ||||||||||||||||
| SHORT- TERM LOANS |
LINE OF CREDIT ACCOUNTS |
INSTALLMENT LOANS |
TOTAL | |||||||||||||
| Allowance for losses for Company-owned consumer loans: |
||||||||||||||||
| Balance at beginning of period |
$ | 41,942 | $ | 12,565 | $ | 27,845 | $ | 82,352 | ||||||||
| Cost of revenue |
136,534 | 72,308 | 106,787 | 315,629 | ||||||||||||
| Charge-offs |
(192,504 | ) | (63,001 | ) | (116,853 | ) | (372,358 | ) | ||||||||
| Recoveries |
34,796 | 6,714 | 14,544 | 56,054 | ||||||||||||
| Effect of foreign currency translation |
(302 | ) | 658 | 285 | 641 | |||||||||||
|
|
|
|
|
|
|
|
|
|||||||||
| Balance at end of period |
$ | 20,466 | $ | 29,244 | $ | 32,608 | $ | 82,318 | ||||||||
|
|
|
|
|
|
|
|
|
|||||||||
| Liability for third-party lender-owned consumer loans: |
||||||||||||||||
| Balance at beginning of period |
$ | 2,624 | $ | — | $ | — | $ | 2,624 | ||||||||
| Decrease in liability |
(577 | ) | — | — | (577 | ) | ||||||||||
|
|
|
|
|
|
|
|
|
|||||||||
| Balance at end of period |
$ | 2,047 | $ | — | $ | — | $ | 2,047 | ||||||||
|
|
|
|
|
|
|
|
|
|||||||||
| YEAR ENDED DECEMBER 31, 2012 | ||||||||||||||||
| SHORT- TERM LOANS |
LINE OF CREDIT ACCOUNTS |
INSTALLMENT LOANS |
TOTAL | |||||||||||||
| Allowance for losses for Company-owned consumer loans: |
||||||||||||||||
| Balance at beginning of period |
$ | 42,880 | $ | 3,723 | $ | 12,451 | $ | 59,054 | ||||||||
| Cost of revenue |
176,701 | 36,251 | 75,182 | 288,134 | ||||||||||||
| Charge-offs |
(210,557 | ) | (31,399 | ) | (65,493 | ) | (307,449 | ) | ||||||||
| Recoveries |
31,675 | 3,990 | 5,174 | 40,839 | ||||||||||||
| Effect of foreign currency translation |
1,243 | — | 531 | 1,774 | ||||||||||||
|
|
|
|
|
|
|
|
|
|||||||||
| Balance at end of period |
$ | 41,942 | $ | 12,565 | $ | 27,845 | $ | 82,352 | ||||||||
|
|
|
|
|
|
|
|
|
|||||||||
| Liability for third-party lender-owned consumer loans: |
||||||||||||||||
| Balance at beginning of period |
$ | 2,284 | $ | — | $ | — | $ | 2,284 | ||||||||
| Increase in liability |
340 | — | — | 340 | ||||||||||||
|
|
|
|
|
|
|
|
|
|||||||||
| Balance at end of period |
$ | 2,624 | $ | — | $ | — | $ | 2,624 | ||||||||
|
|
|
|
|
|
|
|
|
|||||||||
F-17
Table of Contents
| YEAR ENDED DECEMBER 31, 2011 | ||||||||||||||||
| SHORT- TERM LOANS |
LINE OF CREDIT ACCOUNTS |
INSTALLMENT LOANS |
TOTAL | |||||||||||||
| Allowance for losses for Company-owned consumer loans: |
||||||||||||||||
| Balance at beginning of period |
$ | 30,104 | $ | 3,023 | $ | 2,895 | $ | 36,022 | ||||||||
| Cost of revenue |
160,280 | 7,825 | 33,594 | 201,699 | ||||||||||||
| Charge-offs |
(168,107 | ) | (7,877 | ) | (24,807 | ) | (200,791 | ) | ||||||||
| Recoveries |
21,060 | 752 | 1,012 | 22,824 | ||||||||||||
| Effect of foreign currency translation |
(457 | ) | — | (243 | ) | (700 | ) | |||||||||
|
|
|
|
|
|
|
|
|
|||||||||
| Balance at end of period |
$ | 42,880 | $ | 3,723 | $ | 12,451 | $ | 59,054 | ||||||||
|
|
|
|
|
|
|
|
|
|||||||||
| Liability for third-party lender-owned consumer loans: |
||||||||||||||||
| Balance at beginning of period |
$ | 2,296 | $ | — | $ | — | $ | 2,296 | ||||||||
| Decrease in liability |
(12 | ) | — | — | (12 | ) | ||||||||||
|
|
|
|
|
|
|
|
|
|||||||||
| Balance at end of period |
$ | 2,284 | $ | — | $ | — | $ | 2,284 | ||||||||
|
|
|
|
|
|
|
|
|
|||||||||
In connection with its CSO programs, the Company guarantees consumer loan payment obligations to unrelated third-party lenders for short-term loans and is required to purchase any defaulted loans it has guaranteed. The guarantee represents an obligation to purchase specific loans that go into default. As of December 31, 2013 and 2012, the amount of consumer loans guaranteed by the Company was $41.4 million and $48.2 million, respectively, representing amounts due under consumer loans originated by third-party lenders under the CSO programs. The estimated fair value of the liability for estimated losses on consumer loans guaranteed by the Company of $2.0 million and $2.6 million as of December 31, 2013 and 2012, respectively, is included in “Accounts payable and accrued expenses” in the consolidated balance sheets.
4. Property and Equipment
As an online financial services provider, a significant amount of capital is invested in developing computer software and systems infrastructure. Major classifications of property and equipment at December 31, 2013 and 2012 were as follows (dollars in thousands):
| AS OF DECEMBER 31, | ||||||||||||||||||||||||
| 2013 | 2012 | |||||||||||||||||||||||
| COST | ACCUMULATED DEPRECIATION |
NET | COST | ACCUMULATED DEPRECIATION |
NET | |||||||||||||||||||
| Computer software |
$ | 56,511 | $ | (35,014 | ) | $ | 21,497 | $ | 50,379 | $ | (25,383 | ) | $ | 24,996 | ||||||||||
| Furniture, fixtures and equipment |
25,077 | (14,034 | ) | 11,043 | 18,103 | (9,697 | ) | 8,406 | ||||||||||||||||
| Leasehold improvements |
14,287 | (7,422 | ) | 6,865 | 13,969 | (5,612 | ) | 8,357 | ||||||||||||||||
|
|
|
|
|
|
|
|
|
|
|
|
|
|||||||||||||
| Total |
$ | 95,875 | $ | (56,470 | ) | $ | 39,405 | $ | 82,451 | $ | (40,692 | ) | $ | 41,759 | ||||||||||
|
|
|
|
|
|
|
|
|
|
|
|
|
|||||||||||||
The Company capitalized internal software development costs of $6.6 million, $8.1 million and $7.2 million during 2013, 2012 and 2011, respectively.
The Company recognized depreciation expense of $17.0 million, $13.0 million and $9.9 million during 2013, 2012 and 2011, respectively.
F-18
Table of Contents
5. Goodwill and Other Intangible Assets
Goodwill is tested for impairment at least annually. See Note 2 for further discussion.
Goodwill
Changes in the carrying value of goodwill for the years ended December 31, 2013 and 2012 were as follows (dollars in thousands):
| Balance as of January 1, 2013 |
$ | 255,875 | ||
| Effect of foreign currency translation |
(6 | ) | ||
|
|
|
|||
| Balance as of December 31, 2013 |
$ | 255,869 | ||
|
|
|
|||
| Balance as of January 1, 2012 |
$ | 255,786 | ||
| Acquisitions |
88 | |||
| Effect of foreign currency translation |
1 | |||
|
|
|
|||
| Balance as of December 31, 2012 |
$ | 255,875 | ||
|
|
|
Acquired Intangible Assets
Acquired intangible assets that are subject to amortization as of December 31, 2013 and 2012, were as follows (dollars in thousands):
| AS OF DECEMBER 31, | ||||||||||||||||||||||||
| 2013 | 2012 | |||||||||||||||||||||||
| COST | ACCUMULATED AMORTIZATION |
NET | COST | ACCUMULATED AMORTIZATION |
NET | |||||||||||||||||||
| Customer relationships |
$ | 2,743 | $ | (2,727 | ) | $ | 16 | $ | 2,746 | $ | (2,713 | ) | $ | 33 | ||||||||||
| Lead provider relationships |
2,489 | (2,489 | ) | — | 2,489 | (2,489 | ) | — | ||||||||||||||||
| Trademarks |
372 | (343 | ) | 29 | 359 | (259 | ) | 100 | ||||||||||||||||
| Non-competition agreements |
— | — | — | 270 | (235 | ) | 35 | |||||||||||||||||
|
|
|
|
|
|
|
|
|
|
|
|
|
|||||||||||||
| Total |
$ | 5,604 | $ | (5,559 | ) | $ | 45 | $ | 5,864 | $ | (5,696 | ) | $ | 168 | ||||||||||
|
|
|
|
|
|
|
|
|
|
|
|
|
|||||||||||||
Non-competition agreements are amortized over the applicable terms of the contract. Customer and lead provider relationships are generally amortized over three to five years based on the pattern of economic benefits provided. Trademarks are generally amortized over three years on a straight-line basis.
Amortization
Amortization expense for acquired intangible assets was $0.1 million, $0.3 million and $1.4 million for the years ended December 31, 2013, 2012 and 2011, respectively.
Estimated future amortization expense for the years ended December 31, is as follows (dollars in thousands):
| YEAR |
AMOUNT | |||
| 2014 |
$ | 43 | ||
| 2015 |
2 | |||
|
|
|
|||
| Total |
$ | 45 | ||
|
|
|
|||
F-19
Table of Contents
6. Accounts Payable and Accrued Expenses
Accounts payable and accrued expenses at December 31, 2013 and 2012, were as follows (dollars in thousands):
| AS OF DECEMBER 31, | ||||||||
| 2013 | 2012 | |||||||
| Trade accounts payable |
$ | 18,660 | $ | 16,001 | ||||
| Accrued payroll and fringe benefits |
17,874 | 14,394 | ||||||
| Accrual for consumer loan payments rejected for non-sufficient funds |
4,971 | 8,546 | ||||||
| Deferred fees on third-party consumer loans |
4,573 | 4,476 | ||||||
| Liability for losses on third-party lender-owned consumer loans |
2,047 | 2,624 | ||||||
| Other accrued liabilities |
1,489 | 1,679 | ||||||
|
|
|
|
|
|||||
| Total |
$ | 49,614 | $ | 47,720 | ||||
|
|
|
|
|
|||||
7. Marketing Expenses
Marketing expenses for the years ended December 31, 2013, 2012 and 2011 were as follows (dollars in thousands):
| YEAR ENDED DECEMBER 31, | ||||||||||||
| 2013 | 2012 | 2011 | ||||||||||
| Advertising |
$ | 74,294 | $ | 50,776 | $ | 23,259 | ||||||
| Customer procurement expense including lead purchase costs |
52,418 | 49,381 | 43,074 | |||||||||
| Customer referral and revenue sharing expense |
8,624 | 8,653 | 6,996 | |||||||||
|
|
|
|
|
|
|
|||||||
| Total |
$ | 135,336 | $ | 108,810 | $ | 73,329 | ||||||
|
|
|
|
|
|
|
|||||||
See Note 2 for further discussion.
8. Affiliate Line of Credit
The Company depends on Cash America’s support for its financing requirements and has in place an affiliate revolving credit agreement related to amounts outstanding with Cash America (the “Credit Agreement”). On April 12, 2012, the Company entered into a $450 million credit agreement with Cash America to refinance and replace its outstanding affiliate notes payable and to fund its operating needs. Borrowings under the Credit Agreement are unsecured and are evidenced by a promissory note payable to Cash America. Borrowings bear interest at a fluctuating interest rate equal to the prevailing LIBOR rate per annum (based upon a one month interest period) plus 4.5%, or in certain circumstances equal to the prevailing alternate base rate per annum plus 2.0%. The alternate base rate is equal to the greater of (a) the U.S. prime rate, (b) the federal funds effective rate plus 0.5%, and (c) the sum of the one-month LIBOR plus 1.0%. Interest accruing on borrowings made under the revolving line of credit are payable to Cash America and are settled through an adjustment to its affiliate line of credit with Cash America on a monthly basis. At December 31, 2013 and 2012, the Company had outstanding amounts payable under the Credit Agreement of $424.1 million and $427.9 million, respectively.
Subject to the terms and conditions set forth in the Credit Agreement, the Company is permitted to borrow, repay and re-borrow funds from Cash America on a revolving credit basis in a maximum amount equal to $450 million. The Credit Agreement contains a number of covenants that restrict the Company’s ability to incur additional indebtedness, create liens on assets, sell assets, make investments, and pay dividends and distributions. In addition, the Company is required to comply with certain financial covenants, including a maximum leverage ratio and a minimum fixed charge coverage ratio. The Company is required to apply the net proceeds received from each public or private offering of the Company’s common stock, other equity or debt instruments, and from the disposition of assets outside the ordinary course of business, to reduce the outstanding balance of the Company’s obligations under the Credit Agreement, and, except in the case of an initial public offering, the maximum available borrowings under the Credit Agreement will be reduced by the amount of each such
F-20
Table of Contents
payment. The Credit Agreement, however, provides that Cash America is not obligated to make any advances to the Company if Cash America is, or by virtue of such advance would be, in default under any of its obligations in its credit facility. The borrowings under the Credit Agreement will mature on the earlier to occur of June 1, 2015 or such time as Cash America ceases to beneficially own shares of the Company’s common stock representing 50% or more of the total voting power of the outstanding shares generally entitled to elect directors, at which time all principal and accrued and unpaid interest becomes due and payable to Cash America.
Interest rates on the Credit Agreement ranged from 4.69% to 4.75% during the twelve months ended December 31, 2013, and from April 12, 2012 to December 31, 2012 interest on the Credit Agreement was 4.75%.
As of December 31, 2013 and 2012, the Company was in compliance with all covenants and other requirements set forth in the Credit Agreement.
As of December 31, 2013, annual maturities of the Credit Agreement for each of the five years after December 31, 2013 and thereafter are as follows (dollars in thousands):
| YEAR |
AMOUNT | |||
| 2014 |
$ | — | ||
| 2015 |
424,133 | |||
| 2016 |
— | |||
| 2017 |
— | |||
| 2018 |
— | |||
| Thereafter |
— | |||
|
|
|
|||
| Total |
$ | 424,133 | ||
|
|
|
|||
9. Income Taxes
The components of the Company’s deferred tax assets and liabilities as of December 31, 2013 and 2012 were as follows (dollars in thousands):
| AS OF DECEMBER 31, | ||||||||
| 2013 | 2012 | |||||||
| Deferred tax assets: |
||||||||
| Consumer loans, net |
$ | 31,649 | $ | 31,890 | ||||
| Compensation and benefits |
2,535 | 2,644 | ||||||
| Net operating loss |
— | 457 | ||||||
| Other |
837 | 718 | ||||||
|
|
|
|
|
|||||
| Total deferred tax assets |
$ | 35,021 | $ | 35,709 | ||||
|
|
|
|
|
|||||
| Deferred tax liabilities: |
||||||||
| Amortizable intangible assets |
$ | 39,334 | $ | 33,004 | ||||
| Property and equipment |
9,085 | 10,024 | ||||||
| Other |
994 | 77 | ||||||
|
|
|
|
|
|||||
| Total deferred tax liabilities |
$ | 49,413 | $ | 43,105 | ||||
|
|
|
|
|
|||||
| Net deferred tax liabilities before valuation allowance |
$ | (14,392 | ) | $ | (7,396 | ) | ||
| Valuation allowance: |
— | (457 | ) | |||||
|
|
|
|
|
|||||
| Net deferred tax liabilities |
$ | (14,392 | ) | $ | (7,853 | ) | ||
|
|
|
|
|
|||||
| Balance sheet classification: |
||||||||
| Current deferred tax assets, net |
$ | 30,914 | $ | 31,990 | ||||
| Non-current deferred tax liabilities, net |
(45,306 | ) | (39,843 | ) | ||||
|
|
|
|
|
|||||
| Net deferred tax liabilities |
$ | (14,392 | ) | $ | (7,853 | ) | ||
|
|
|
|
|
|||||
F-21
Table of Contents
The components of the provision for income taxes and the income to which it relates for the years ended December 31, 2013, 2012 and 2011 are shown below (dollars in thousands):
| YEAR ENDED DECEMBER 31, | ||||||||||||
| 2013 | 2012 | 2011 | ||||||||||
| Income (loss) before income taxes: |
||||||||||||
| Domestic |
$ | 119,974 | $ | 94,349 | $ | 58,404 | ||||||
| International |
1,658 | (1,510 | ) | (22 | ) | |||||||
|
|
|
|
|
|
|
|||||||
| Income before income taxes |
$ | 121,632 | $ | 92,839 | $ | 58,382 | ||||||
|
|
|
|
|
|
|
|||||||
| Current provision (benefit): |
||||||||||||
| Federal |
$ | 37,639 | $ | 35,327 | $ | 18,491 | ||||||
| International |
56 | 17 | (4 | ) | ||||||||
| State and local |
682 | 1,049 | 417 | |||||||||
|
|
|
|
|
|
|
|||||||
| Total current provision for income taxes |
$ | 38,377 | $ | 36,393 | $ | 18,904 | ||||||
|
|
|
|
|
|
|
|||||||
| Deferred provision (benefit): |
||||||||||||
| Federal |
$ | 5,122 | $ | (2,399 | ) | $ | 2,548 | |||||
| International |
— | — | — | |||||||||
| State and local |
95 | (27 | ) | (102 | ) | |||||||
|
|
|
|
|
|
|
|||||||
| Total deferred provision for income taxes |
$ | 5,217 | $ | (2,426 | ) | $ | 2,446 | |||||
|
|
|
|
|
|
|
|||||||
| Total provision for income taxes |
$ | 43,594 | $ | 33,967 | $ | 21,350 | ||||||
|
|
|
|
|
|
|
|||||||
The Company has no uncertain income tax positions as defined by ASC 740 for the years ended December 31, 2013, 2012 or 2011. The effective tax rate on income differs from the federal statutory rate of 35% for the following reasons (dollars in thousands):
| YEAR ENDED DECEMBER 31, | ||||||||||||
| 2013 | 2012 | 2011 | ||||||||||
| Tax provision computed at the federal statutory income tax rate |
$ | 42,571 | $ | 32,494 | $ | 20,434 | ||||||
| State and local income taxes, net of federal tax benefits |
505 | 664 | 205 | |||||||||
| Tax effect of Regulatory Penalty (1) |
871 | — | — | |||||||||
| Valuation allowance |
(457 | ) | 470 | — | ||||||||
| Other |
104 | 339 | 711 | |||||||||
|
|
|
|
|
|
|
|||||||
| Total provision |
$ | 43,594 | $ | 33,967 | $ | 21,350 | ||||||
|
|
|
|
|
|
|
|||||||
| Effective tax rate |
35.8 | % | 36.6 | % | 36.6 | % | ||||||
| (1) | Represents the tax effect of the $2.5 million CFPB penalty paid in 2013, which is nondeductible for tax purposes, in connection with the Regulatory Penalty. See Note 10 for further information. |
As of December 31, 2012, a valuation allowance was established against deferred tax assets for net operating losses, totaling $0.5 million, related to its Mexico subsidiary which the Company did not expect to realize. In 2013, the $0.5 million valuation allowance was decreased due to the recognition of taxable income by the Mexico subsidiary, causing full utilization of the net operating losses.
As of December 31, 2013, the Company’s 2010 through 2012 tax years were open to examination by the Internal Revenue Service and major state taxing jurisdictions, and the 2011 through 2012 tax years of the Company’s Mexican subsidiary were open to examination by the Mexican taxing authorities.
F-22
Table of Contents
10. Commitments and Contingencies
Leases
The Company leases its headquarters in Chicago, Illinois and a call center facility in Gurnee, Illinois under operating leases with remaining terms ranging from one to six years and certain rights to extend for additional periods. The Company is responsible for paying its proportionate share of the actual operating expenses and real estate taxes under certain of these arrangements. The operating expenses and real estate taxes are not included in the table below. Future minimum rentals due under non-cancelable leases are as follows for each of the years ending December 31 (dollars in thousands):
| YEAR |
AMOUNT | |||
| 2014 |
$ | 2,791 | ||
| 2015 |
2,824 | |||
| 2016 |
2,833 | |||
| 2017 |
1,665 | |||
| 2018 |
469 | |||
| Thereafter |
351 | |||
|
|
|
|||
| Total |
$ | 10,933 | ||
|
|
|
|||
Rent expense was $2.7 million, $2.4 million and $2.2 million for the years ended December 31, 2013, 2012 and 2011, respectively.
Guarantees
In connection with its CSO programs, the Company guarantees consumer loan payment obligations to unrelated third-party lenders and is required to purchase the loan should a customer not make payments as required by the contract. The guarantee represents an obligation to purchase specific loans that go into default, which generally have terms of less than 60 days. At December 31, 2013 and 2012, the amount of consumer loans guaranteed by the Company was $41.4 million and $48.2 million, respectively, representing amounts due under consumer loans originated by third-party lenders under the CSO programs. The liability related to these guarantees of $2.0 million and $2.6 million at December 31, 2013 and 2012 is included in “Accounts payable and accrued expenses” in the accompanying consolidated balance sheets.
The Company and its domestic subsidiaries participate jointly and severally with other subsidiaries of Cash America and guarantee long-term debt of Cash America of $638.2 million and $468.1 million, at December 31, 2013 and 2012, respectively. The debt matures at various dates occurring through 2022. Under the provisions of the debt agreements, the Company has liability in the event Cash America defaults in its payment obligations or fails to comply with the covenants under the various debt agreements or upon the occurrence of specified events contained in the various debt agreements, including the event of bankruptcy, insolvency or reorganization of Cash America. The Company believes it will not have to make any payments under these guarantees; therefore, no liability has been reflected on the accompanying consolidated balance sheets.
Litigation
On January 6, 2014, Elizabeth Burger, on behalf of herself and others similarly situated, filed a purported class action lawsuit in the U.S. District Court for the Southern District of Ohio against the Company’s subsidiary, CNU Online Holdings, LLC, the Company’s parent company, Cash America, and other unaffiliated lenders. The lawsuit alleges, among other things, that the Company’s credit service organization activities in Ohio violate various laws in Ohio, including the Short-Term Loan Act, the Consumer Sales Practices Act, and the General Usury Act. The complaint seeks class certification, an unspecified amount of actual damages, statutory damages not to exceed $5,000 for each putative class member, an unspecified amount of punitive damages, pre-judgment interest, a declaration that the Company’s activities violate the Short-Term Loan Act and the Consumer Sales Practices Act, and attorneys’ fees and costs. On January 23, 2014, the parties filed a joint motion to stay the
F-23
Table of Contents
litigation pending a decision from the Ohio Supreme Court in the case captioned Ohio Neighborhood Finance, Inc. v. Scott, which will impact the issues alleged in the case. On January 28, 2014, the court granted the joint motion to stay and stayed the litigation pending a decision from the Ohio Supreme Court. Neither the likelihood of an unfavorable ruling nor the ultimate liability, if any, with respect to this matter can be determined at this time, and the Company is currently unable to estimate a range of reasonably possible losses, as defined by ASC 450-20-20, Contingencies—Loss Contingencies—Glossary (“ASC 450-20-20”), for this litigation. We believe that the plaintiff’s claims in the complaint are without merit and intend to vigorously defend this lawsuit.
On March 8, 2013, Flemming Kristensen, on behalf of himself and others similarly situated, filed a purported class action lawsuit in the U.S. District Court of Nevada against the Company and other unaffiliated lenders and lead providers. The lawsuit alleges that the lead provider defendants sent unauthorized text messages to consumers on behalf of the Company and the other lender defendants in violation of the Telephone Consumer Protection Act. The complaint seeks class certification, statutory damages, an injunction against “wireless spam activities,” and attorneys’ fees and costs. The Company filed an answer to the complaint denying all liability. On March 26, 2014, the Court granted class certification. Discovery is ongoing. Neither the likelihood of an unfavorable ruling nor the ultimate liability, if any, with respect to this matter can be determined at this time, and the Company is currently unable to estimate a range of reasonably possible losses, as defined by ASC 450-20-20, for this litigation. The Company believes that the plaintiff’s claims in the complaint are without merit and intends to vigorously defend this lawsuit.
The Company is also a defendant in certain routine litigation matters encountered in the ordinary course of its business. Certain of these matters are covered to an extent by insurance. In the opinion of management, the resolution of these matters will not have a material adverse effect on the Company’s financial position, results of operations or liquidity.
Consumer Financial Protection Bureau (“CFPB”)
On November 20, 2013, Cash America consented to the issuance of a Consent Order by the CFPB pursuant to which it agreed, without admitting or denying any of the facts or conclusions made by the CFPB from its 2012 review of Cash America and the Company, to pay a civil money penalty of $5.0 million, which is non-deductible for tax purposes. The Company and Cash America agreed to allocate $2.5 million of this penalty to the Company (the “Regulatory Penalty”).
11. Employee Benefit Plans
Prior to July 1, 2012, substantially all employees of the Company were eligible to participate in the Cash America International, Inc. 401(k) Savings Plan. Effective on July 1, 2012, the Company established the Enova International, Inc. 401(k) Savings Plan, which is open to substantially all employees of the Company and its subsidiaries. New employees are automatically enrolled in this plan unless they elect not to participate. Prior to July 1, 2012, the Cash America International, Inc. Nonqualified Savings Plan was available to certain members of Company management. The Enova International, Inc. Nonqualified Savings Plan was established effective July 1, 2012 and is available in lieu of the Cash America International, Inc. Nonqualified Savings Plan to certain members of Company management. Participants may contribute up to 75% of their earnings to the 401(k) Savings Plan subject to regulatory and other plan restrictions. Nonqualified Savings Plan participants may contribute up to 80% of their annual bonus and up to 50% of their other eligible compensation to the Nonqualified Savings Plan. The Company makes matching cash contributions of 50% of each participant’s contributions, based on participant contributions of up to 5% of compensation. Company contributions vest at the rate of 20% each year after one year of service; thus a participant is 100% vested after five years of service. The Company’s consolidated contributions to the 401(k) Savings Plan and the Nonqualified Savings Plan were $1.1 million, $1.0 million and $0.8 million for the years ended December 31, 2013, 2012 and 2011, respectively.
In addition to the plans mentioned above, certain officers of the Company participated prior to 2012 in Cash America’s Supplemental Executive Retirement Plan (“CAI SERP”), which was established in 2003. Effective on January 1, 2012, the Company established the Enova International, Inc. Supplemental Executive Retirement Plan
F-24
Table of Contents
(“SERP”) in which certain officers and certain other employees of the Company participate. Under this defined contribution plan, the Company makes an annual supplemental cash contribution to the SERP based on the objectives of the plan as approved by the Company’s Board of Directors and the Management Development and Compensation Committee of the Board of Directors of Cash America. Prior to 2012, the Company made such contributions to the CAI SERP. The Company recorded compensation expense of $0.2 million for SERP contributions for each of the years ended December 31, 2013, 2012 and 2011.
The Nonqualified Savings Plan and the SERP are non-qualified deferred compensation plans. Benefits under the Nonqualified Savings Plan and the SERP are unfunded. As of December 31, 2013, 2012 and 2011, the Company held securities in rabbi trusts to pay benefits under these plans, including benefits accrued under the corresponding Cash America plans. These securities are classified as trading securities, and the unrealized gains and losses on these securities are netted with the costs of the plans in “General and administrative expenses” in the consolidated statements of income. The SERP and the Nonqualified Savings Plan do not provide for accelerated vesting as a result of the separation of the Company into a separate publicly traded company.
Amounts included in the consolidated balance sheets relating to the Nonqualified Savings Plan and the SERP were as follows (dollars in thousands):
| AS OF DECEMBER 31, | ||||||||
| 2013 | 2012 | |||||||
| Prepaid expenses and other assets |
$ | 559 | $ | 869 | ||||
| Accounts payable and accrued expenses |
$ | 723 | $ | 1,065 | ||||
In 2013, 2012 and 2011, Cash America’s Board of Directors approved grants of Performance Units under the Cash America International, Inc. First Amended and Restated 2004 Long-Term Incentive Plan, as Amended (“Cash America LTIP”) that, upon vesting, are paid solely in cash to the Company’s officers and certain of its other employees. Generally, each grant of Performance Units vests over a three-year period, subject to continued employment with Cash America and the satisfaction of certain conditions related to an increase in the Company’s earnings before interest, taxes, depreciation and amortization (“EBITDA”) over the periods specified at the time of grant. The unit value of each award is based on a percentage of the increase in EBITDA over the prior year EBITDA. Payments for all Performance Units that vest will be made within a reasonable period of time each year following certification of the applicable performance results by the Management Development and Compensation Committee of the Cash America Board of Directors. In addition, the Performance Unit award agreements are subject to a “clawback” provision that allows Cash America to recoup all or some of the payments made under certain circumstances when there is a material restatement of Cash America’s financial results. The agreements provide for immediate vesting and payment of awards that are outstanding and scheduled to vest within 12 calendar months following the date of a change in control of Cash America. For awards granted in 2013 and in July 2012, the agreements provide similar vesting and payment provisions in the event of a change in control of the Company or the Company’s stock becomes publicly traded. The Company’s EBITDA must achieve certain thresholds before payments will be made under any Performance Units outstanding as of December 31, 2013.
Prior to the Cash America LTIP awards in January 2011, Cash America awarded units to the Company’s officers and certain other employees under other similar long term incentive plans it had established in 2007 and 2008. No awards were outstanding under these plans as of December 31, 2013.
The Company recorded compensation expense of $6.2 million, $6.4 million and $3.9 million related to all Performance Unit awards for the years ended December 31, 2013, 2012 and 2011, respectively.
12. Stock-Based Compensation
In 2013, Cash America’s Board of Directors approved a grant of RSU’s to the Company’s Chief Executive Officer under the Cash America LTIP. Each vested RSU entitles the holder to receive a share of common stock of Cash America. This grant vests over a two year period, but is subject to continued employment with Cash America.
F-25
Table of Contents
In 2011, Cash America’s Board of Directors approved a grant of Performance-Based Restricted Stock Units (“Performance RSUs”) to the Company’s President under the Cash America LTIP. This grant of Performance RSU’s was scheduled to vest in a lump sum in 2014. Also in 2011, Cash America’s Board of Directors approved a grant of Restricted Stock Units (“RSUs”) to the Company’s President. This grant of RSU’s vested over a three year period and each vested RSU entitled the holder to receive a share of common stock of Cash America. Both grants were subject to continued employment with Cash America. On March 29, 2013, the President left the Company and all outstanding unvested Performance RSU’s and RSU’s were forfeited on that date.
In accordance with ASC 718, the grant date fair value of RSUs is based on Cash America’s closing stock price on the day before the grant date and is amortized to expense over the vesting periods. The agreements relating to awards granted under the Cash America LTIP provide that the vesting and payment of awards would be accelerated if there is a change in control of Cash America. In addition, vesting of the RSU award outstanding at December 31, 2013 will accelerate if any of the Company’s common stock becomes publicly traded.
The following table summarizes the restricted stock unit activity during 2013, 2012 and 2011:
| YEAR ENDED DECEMBER 31, | ||||||||||||||||||||||||
| 2013 | 2012 | 2011 | ||||||||||||||||||||||
| UNITS | WEIGHTED AVERAGE FAIR VALUE AT DATE OF GRANT |
UNITS | WEIGHTED AVERAGE FAIR VALUE AT DATE OF GRANT |
UNITS | WEIGHTED AVERAGE FAIR VALUE AT DATE OF GRANT |
|||||||||||||||||||
| Outstanding at beginning of year |
13,215 | $ | 39.66 | 16,667 | $ | 38.97 | 3,680 | $ | 32.05 | |||||||||||||||
| Units granted |
14,260 | 48.19 | — | — | 15,548 | 39.66 | ||||||||||||||||||
| Shares issued |
(2,333 | ) | 39.66 | (3,452 | ) | 36.34 | (2,197 | ) | 33.82 | |||||||||||||||
| Units forfeited |
(10,882 | ) | 39.66 | — | — | (364 | ) | 29.43 | ||||||||||||||||
|
|
|
|
|
|
|
|
|
|
|
|
|
|||||||||||||
| Outstanding at end of year |
14,260 | $ | 48.19 | 13,215 | $ | 39.66 | 16,667 | $ | 38.97 | |||||||||||||||
|
|
|
|
|
|
|
|
|
|
|
|
|
|||||||||||||
| Units vested at end of year |
— | — | — | — | — | — | ||||||||||||||||||
|
|
|
|
|
|
|
|
|
|
|
|
|
|||||||||||||
Compensation expense related to RSUs totaling $0.2 million ($0.2 million net of related taxes), $0.1 million ($92 thousand net of related taxes) and $0.2 million ($0.1 million net of related taxes) was recognized for the years ended December 31, 2013, 2012 and 2011, respectively. Total unrecognized compensation cost related to RSUs at December 31, 2013 was $0.4 million, which will be recognized over a weighted average period of approximately 1.1 years. The outstanding RSUs had an aggregate intrinsic value of $0.5 million at December 31, 2013.
13. Derivative Instruments
Cash America uses forward currency exchange contracts to minimize the effects of foreign currency risk in the United Kingdom and Australia. The forward currency exchange contracts are non-designated derivatives. Any gain or loss resulting from these contracts is recorded as income or loss and is included in “Foreign currency transaction loss” in the Company’s consolidated statements of income. The Company participates in Cash America’s derivative and hedging programs, which are coordinated through a centralized treasury function; therefore, the assets and liabilities related to derivative instruments are not recorded in the Company’s financial statements; however, the gains and losses associated with Cash America’s foreign currency forward contracts that relate to the Company’s business are included as “Foreign currency transaction loss” in the consolidated statements of income. The notional amounts recorded by Cash America were $81.5 million and $93.8 million at December 31, 2013 and 2012, respectively. Neither Cash America nor the Company currently manages its exposure to risk from foreign currency exchange rate fluctuations through the use of forward currency exchange contracts in Canada.
F-26
Table of Contents
The following table presents information on the effect of derivative instruments on the consolidated results of operations and AOCI for the years ended December 31, 2013, 2012 and 2011 (dollars in thousands):
| GAINS (LOSSES) RECOGNIZED IN INCOME YEAR ENDED DECEMBER 31, |
GAINS (LOSSES) RECOGNIZED IN AOCI YEAR ENDED DECEMBER 31, |
GAINS (LOSSES) RECLASSIFIED FROM AOCI INTO INCOME YEAR ENDED DECEMBER 31, |
||||||||||||||||||||||||||||||||||
| 2013 | 2012 | 2011 | 2013 | 2012 | 2011 | 2013 | 2012 | 2011 | ||||||||||||||||||||||||||||
| Non-designated derivatives: |
||||||||||||||||||||||||||||||||||||
| Forward currency exchange contracts (1) |
$ | (1,813 | ) | $ | (4,794 | ) | $ | 1,856 | $ | — | $ | — | $ | — | $ | — | $ | — | $ | — | ||||||||||||||||
|
|
|
|
|
|
|
|
|
|
|
|
|
|
|
|
|
|
|
|||||||||||||||||||
| Total |
$ | (1,813 | ) | $ | (4,794 | ) | $ | 1,856 | $ | — | $ | — | $ | — | $ | — | $ | — | $ | — | ||||||||||||||||
|
|
|
|
|
|
|
|
|
|
|
|
|
|
|
|
|
|
|
|||||||||||||||||||
| (1) | The gains (losses) on these derivatives substantially offset the (losses) gains on the hedged portion of international intercompany balances. |
14. Related Party Transactions
Cash America provides certain corporate service functions, such as executive oversight, insurance and risk management, government relations, internal audit, treasury, licensing, and to a limited extent finance, accounting, tax, legal, human resources, compensation and benefits, compliance and support for certain information systems related to financial reporting. The costs of such services were allocated to the Company based on the Company’s share of Cash America’s corporate services expenses incurred for the consolidated entity. Actual corporate services costs that may have been incurred if the Company had been a stand-alone company would depend on a number of factors, including the chosen organizational structure, what functions were outsourced or performed by employees, and strategic decisions made in areas such as information technology and infrastructure. The Company believes that the expenses in these financial statements are reported on a basis that fairly represents the utilization of the services provided. These financial statements do not necessarily reflect the financial position or results of operations that would have existed if the Company had been operated as a stand-alone entity during the periods covered and may not be indicative of future results of operations and financial position. General and administrative expenses include allocations by Cash America of $10.0 million, $10.6 million and $18.0 million for 2013, 2012 and 2011, respectively.
Cash America provides financing, some cash management, and other treasury services to the Company. The Company receives funding from Cash America for operating and investing cash needs. The Company also pays Cash America for its share of income taxes as though the Company had been taxed separately from Cash America and had prepared separate tax returns. Cash America periodically uses forward currency exchange contracts and foreign debt instruments to minimize risk of foreign currency exchange rate fluctuations in the United Kingdom and Australia. The Company participates in Cash America’s derivative and hedging programs, which are coordinated through a centralized treasury function. See Note 13 for further discussion on derivative instruments.
The Company pays Cash America compensation for loans made to or arranged for customers who were referred from Cash America. The Company paid $1.2 million for each of the years ended December 31, 2013, 2012 and 2011, pursuant to this arrangement. In addition, the Company administers the consumer loan underwriting model utilized by Cash America’s Retail Services Division in exchange for the reimbursement of the Company’s direct third party costs incurred in providing the service. The Company received $0.9 million, $1.5 million and $1.4 million for the years ended December 31, 2013, 2012 and 2011, respectively, pursuant to this arrangement.
On December 22, 2011, the Company purchased from Cash America preferred stock representing a minority interest in an early-stage privately-held developing consumer financial services entity. The purchase price
F-27
Table of Contents
represents the amount Cash America paid to originally purchase the minority interest in March 2011. The Company purchased the investment from Cash America, in part, to more effectively align this asset with other assets held by the Company.
Payments the Company owes Cash America for all of these transactions, offset by any credits or fees Cash America may owe the Company in connection with these transactions, are made through the borrowing agreements between Cash America and certain subsidiaries of the Company. The amount due to Cash America has been classified as “Affiliate line of credit” on the consolidated balance sheets. At December 31, 2013 and 2012, respectively, the Company had outstanding unsecured Credit Agreement obligations of $424.1 million and $427.9 million. See Note 8 for further discussion of the Credit Agreement.
The Company and its domestic subsidiaries participate jointly and severally with other subsidiaries of Cash America and guarantee long-term debt of Cash America. See Note 10.
15. Supplemental Disclosures of Cash Flow Information
The following table sets forth certain cash and non-cash activities for the years ended December 31 (dollars in thousands):
| YEAR ENDED DECEMBER 31, | ||||||||||||
| 2013 | 2012 | 2011 | ||||||||||
| Cash paid during the year for: |
||||||||||||
| Income taxes remitted through affiliate line of credit |
$ | 34,829 | $ | 33,619 | $ | 37,045 | ||||||
| Non-cash investing and financing activities: |
||||||||||||
| Consumer loans renewed |
$ | 599,227 | $ | 620,097 | $ | 562,014 | ||||||
| Investment in non-marketable equity securities |
$ | — | $ | — | $ | 5,000 | ||||||
| Dividend to Cash America |
$ | — | $ | — | $ | 75,000 | ||||||
| Affiliate interest expense |
$ | 19,788 | $ | 20,996 | $ | 17,420 | ||||||
16. Operating Segment Information
The Company provides online financial services to alternative credit consumers in the United States, United Kingdom, Australia and Canada and has one reportable segment, which is composed of the Company’s domestic and international operations. The Company has aggregated all components of its business into a single reportable segment based on the similarities of the economic characteristics, the nature of the products and services, the nature of the production and distribution methods, the type of customer and the nature of the regulatory environment.
F-28
Table of Contents
The Company allocates certain corporate expenses (primarily general and administrative expenses and to a lesser extent, marketing and operations and technology) between the domestic and international components based on revenue. The following tables present information on the Company’s domestic and international operations for the years ended December 31, 2013, 2012 and 2011 (dollars in thousands).
| YEAR ENDED DECEMBER 31, | ||||||||||||
| 2013 | 2012 | 2011 | ||||||||||
| Revenue |
||||||||||||
| Domestic |
$ | 395,549 | $ | 334,066 | $ | 254,752 | ||||||
| International |
369,774 | 326,862 | 225,588 | |||||||||
|
|
|
|
|
|
|
|||||||
| Total revenue |
$ | 765,323 | $ | 660,928 | $ | 480,340 | ||||||
|
|
|
|
|
|
|
|||||||
| Income from operations |
||||||||||||
| Domestic |
$ | 73,858 | $ | 55,011 | $ | 52,550 | ||||||
| International |
68,738 | 59,166 | 23,739 | |||||||||
|
|
|
|
|
|
|
|||||||
| Total income from operations |
$ | 142,596 | $ | 114,177 | $ | 76,289 | ||||||
|
|
|
|
|
|
|
|||||||
| Depreciation and amortization |
||||||||||||
| Domestic |
$ | 14,536 | $ | 11,988 | $ | 10,413 | ||||||
| International |
2,607 | 1,284 | 850 | |||||||||
|
|
|
|
|
|
|
|||||||
| Total depreciation and amortization |
$ | 17,143 | $ | 13,272 | $ | 11,263 | ||||||
|
|
|
|
|
|
|
|||||||
| Expenditures for property and equipment |
||||||||||||
| Domestic |
$ | 12,527 | $ | 15,628 | $ | 13,866 | ||||||
| International |
2,345 | 2,244 | 1,207 | |||||||||
|
|
|
|
|
|
|
|||||||
| Total expenditures for property and equipment |
$ | 14,872 | $ | 17,872 | $ | 15,073 | ||||||
|
|
|
|
|
|
|
|||||||
| DECEMBER 31, | ||||||||
| 2013 | 2012 | |||||||
| Property and equipment, net |
||||||||
| Domestic |
$ | 34,091 | $ | 36,595 | ||||
| International |
5,314 | 5,164 | ||||||
|
|
|
|
|
|||||
| Total property and equipment, net |
$ | 39,405 | $ | 41,759 | ||||
|
|
|
|
|
|||||
| Assets |
||||||||
| Domestic |
$ | 475,050 | $ | 433,770 | ||||
| International |
217,102 | 179,098 | ||||||
|
|
|
|
|
|||||
| Total assets |
$ | 692,152 | $ | 612,868 | ||||
|
|
|
|
|
|||||
Geographic Information
The following table presents the Company’s revenue and long-lived assets by geographic region for the years ended December 31, 2013, 2012 and 2011 (dollars in thousands):
| YEAR ENDED DECEMBER 31, | ||||||||||||
| 2013 | 2012 | 2011 | ||||||||||
| Revenue |
||||||||||||
| United States |
$ | 395,549 | $ | 334,066 | $ | 254,752 | ||||||
| United Kingdom |
360,186 | 308,415 | 211,915 | |||||||||
| Other international countries |
9,588 | 18,447 | 13,673 | |||||||||
|
|
|
|
|
|
|
|||||||
| Total revenue |
$ | 765,323 | $ | 660,928 | $ | 480,340 | ||||||
|
|
|
|
|
|
|
|||||||
F-29
Table of Contents
The Company’s long-lived assets, which consist of the Company’s property and equipment, were $39.4 million and $41.8 million at December 31, 2013 and 2012, respectively. The operations for the Company’s domestic and international businesses are primarily located within the United States, and the value of any long-lived assets located outside of the United States is immaterial.
17. Fair Value Measurements
Recurring Fair Value Measurements
In accordance with ASC 820, certain of the Company’s assets and liabilities, which are carried at fair value, are classified in one of the following three categories:
Level 1: Quoted market prices in active markets for identical assets or liabilities.
Level 2: Observable market based inputs or unobservable inputs that are corroborated by market data.
Level 3: Unobservable inputs that are not corroborated by market data.
The Company’s financial assets that are measured at fair value on a recurring basis as of December 31, 2013 and 2012 are as follows (dollars in thousands):
| DECEMBER 31, 2013 |
FAIR VALUE MEASUREMENTS USING | |||||||||||||||
| LEVEL 1 | LEVEL 2 | LEVEL 3 | ||||||||||||||
| Financial assets: |
||||||||||||||||
| Nonqualified savings plan assets (1) |
$ | 559 | $ | 559 | $ | — | $ | — | ||||||||
|
|
|
|
|
|
|
|
|
|||||||||
| Total |
$ | 559 | $ | 559 | $ | — | $ | — | ||||||||
|
|
|
|
|
|
|
|
|
|||||||||
| DECEMBER 31, 2012 |
FAIR VALUE MEASUREMENTS USING | |||||||||||||||
| LEVEL 1 | LEVEL 2 | LEVEL 3 | ||||||||||||||
| Financial assets |
||||||||||||||||
| Nonqualified savings plan assets (1) |
$ | 869 | $ | 869 | $ | — | $ | — | ||||||||
|
|
|
|
|
|
|
|
|
|||||||||
| Total |
$ | 869 | $ | 869 | $ | — | $ | — | ||||||||
|
|
|
|
|
|
|
|
|
|||||||||
| (1) | The non-qualified savings plan assets have an offsetting liability of equal amount, which is included in “Accounts payable and accrued expenses” in the Company’s consolidated balance sheets. |
The fair value of the nonqualified savings plan assets is measured under a Level 1 input. These assets are publicly traded equity securities for which market prices are readily observable. During the years ended December 31, 2013 and 2012, there were no transfers of assets in or out of Level 1 fair value measurements. The Company participates in Cash America’s derivative and hedging programs, which are coordinated through a centralized treasury function; therefore, the assets and liabilities related to derivative instruments are not recorded in the Company’s financial statements; however, the gains and losses associated with Cash America’s foreign currency forward contracts that relate to the Company’s business are included as “Foreign currency transaction loss” in the consolidated statements of income.
Fair Value Measurements on a Non-Recurring Basis
The Company measures non-financial assets and liabilities such as property and equipment and intangible assets at fair value on a nonrecurring basis or when events or circumstances indicate that the carrying amount of the assets may be impaired. At December 31, 2013 and 2012, there were no assets or liabilities recorded at fair value on a nonrecurring basis.
F-30
Table of Contents
Financial Assets and Liabilities Not Measured at Fair Value
The Company’s financial assets and liabilities as of December 31, 2013 and 2012 that are not measured at fair value in the consolidated balance sheets are as follows (dollars in thousands):
| DECEMBER 31, 2013 |
FAIR VALUE MEASUREMENTS USING | |||||||||||||||
| LEVEL 1 | LEVEL 2 | LEVEL 3 | ||||||||||||||
| Financial assets: |
||||||||||||||||
| Cash and cash equivalents |
$ | 47,480 | $ | 47,480 | $ | — | $ | — | ||||||||
| Short-term loans and line of credit accounts, net (1) |
156,845 | — | — | 156,845 | ||||||||||||
| Installment loans, net (1) |
146,622 | — | — | 146,622 | ||||||||||||
|
|
|
|
|
|
|
|
|
|||||||||
| Total |
$ | 350,947 | $ | 47,480 | $ | — | $ | 303,467 | ||||||||
|
|
|
|
|
|
|
|
|
|||||||||
| Financial liabilities: |
||||||||||||||||
| Liability for estimated losses on consumer loans guaranteed by the Company |
$ | 2,047 | $ | — | $ | — | $ | 2,047 | ||||||||
| Affiliate line of credit |
424,133 | — | 429,978 | — | ||||||||||||
|
|
|
|
|
|
|
|
|
|||||||||
| Total |
$ | 426,180 | $ | — | $ | 429,978 | $ | 2,047 | ||||||||
|
|
|
|
|
|
|
|
|
|||||||||
| DECEMBER 31, 2012 |
FAIR VALUE MEASUREMENTS USING | |||||||||||||||
| LEVEL 1 | LEVEL 2 | LEVEL 3 | ||||||||||||||
| Financial assets: |
||||||||||||||||
| Cash and cash equivalents |
$ | 37,548 | $ | 37,548 | $ | — | $ | — | ||||||||
| Short-term loans and line of credit accounts, net (1) |
134,665 | — | — | 134,665 | ||||||||||||
| Installment loans, net (1) |
93,725 | — | — | 93,725 | ||||||||||||
|
|
|
|
|
|
|
|
|
|||||||||
| Total |
$ | 265,938 | $ | 37,548 | $ | — | $ | 228,390 | ||||||||
|
|
|
|
|
|
|
|
|
|||||||||
| Financial liabilities: |
||||||||||||||||
| Liability for estimated losses on consumer loans guaranteed by the Company |
$ | 2,624 | $ | — | $ | — | $ | 2,624 | ||||||||
| Affiliate line of credit |
427,889 | — | 437,759 | — | ||||||||||||
|
|
|
|
|
|
|
|
|
|||||||||
| Total |
$ | 430,513 | $ | — | $ | 437,759 | $ | 2,624 | ||||||||
|
|
|
|
|
|
|
|
|
|||||||||
| (1) | Short-term loans, line of credit accounts and installment loans are included in “Consumer loans, net” on the consolidated balance sheets. |
Cash and cash equivalents bear interest at market rates and have maturities of less than 90 days.
Short-term loans, line of credit accounts and installment loans are carried in the consolidated balance sheet net of the allowance for estimated loan losses, which is calculated by applying historical loss rates combined with recent default trends to the gross consumer loan balance. The unobservable inputs used to calculate the fair value of these loans include historical loss rates, recent default trends and estimated remaining loan terms; therefore, the carrying value approximates the fair value. Short-term loans and line of credit accounts have relatively short maturity periods that are generally 12 months or less. The fair value of installment loans is estimated using a discounted cash flow analysis, which considers interest rates offered for loans with similar terms to borrowers of similar credit quality. The carrying values of the Company’s installment loans approximate the fair value of these loans. Unsecured installment loans typically have terms between two and 12 months, but may have available terms up to 36 months.
In connection with its CSO programs, the Company guarantees consumer loan payment obligations to unrelated third-party lenders for short-term loans and is required to purchase any defaulted loans it has guaranteed. The estimated fair value of the liability for estimated losses on consumer loans guaranteed by the Company was $2.0 million and $2.6 million as of December 31, 2013 and 2012, respectively. The Company measures the fair
F-31
Table of Contents
value of its liability for third-party lender-owned consumer loans under Level 3 inputs. The fair value of these liabilities is calculated by applying historical loss rates combined with recent default trends to the gross consumer loan balance. The unobservable inputs used to calculate the fair value of these loans include historical loss rates, recent default trends and estimated remaining loan terms; therefore, the carrying value of these liabilities approximates the fair value.
The Company measures the fair value of its affiliate line of credit using Level 2 inputs. The fair value of the Company’s affiliate line of credit is estimated based on market values for debt issues with similar characteristics or rates currently available for debt with similar terms. As of December 31, 2013 and 2012, the Company’s affiliate line of credit had a higher fair market value than the carrying value due to the difference in yield when compared to similar types of credit.
18. Withdrawal of Proposed Initial Public Offering of Enova International, Inc.
On September 15, 2011, Enova International, Inc. (“Enova”) filed a registration statement on Form S-1 (“Registration Statement”) with the SEC in connection with a proposed initial public offering (“IPO”) of its common stock. On July 25, 2012, Enova filed an Application for Withdrawal of Registration Statement with the SEC to withdraw its Registration Statement, together with all exhibits and amendments. The Registration Statement had not been declared effective by the SEC, and no securities have been sold in connection with the offering pursuant to the Registration Statement.
During the year ended December 31, 2012, expenses that were previously capitalized totaling $3.9 million were recognized in earnings due to the withdrawal of the Registration Statement and are included in “General and administrative expenses” in the consolidated statements of income.
19. Quarterly Financial Data (Unaudited)
The Company’s operations are subject to seasonal fluctuations. Demand has historically been highest in the third and fourth quarters of each year, corresponding to the holiday season, and lowest in the first quarter of each year, corresponding to customers’ receipt of income tax refunds in the United States. Typically, the Company’s cost of revenue, which represents its loan loss provision, is lowest as a percentage of revenue in the first quarter of each year. The following is a summary of the quarterly results of operations for the years ended December 31, 2013 and 2012 (dollars in thousands, except per share data):
| FIRST QUARTER |
SECOND QUARTER |
THIRD QUARTER |
FOURTH QUARTER |
|||||||||||||
| 2013 |
||||||||||||||||
| Total Revenue |
$ | 182,312 | $ | 176,143 | $ | 198,098 | $ | 208,770 | ||||||||
| Cost of Revenue |
67,998 | 70,160 | 90,389 | 86,505 | ||||||||||||
|
|
|
|
|
|
|
|
|
|||||||||
| Gross Profit |
$ | 114,314 | $ | 105,983 | $ | 107,709 | $ | 122,265 | ||||||||
|
|
|
|
|
|
|
|
|
|||||||||
| Net Income |
$ | 22,808 | $ | 18,428 | $ | 17,088 | $ | 19,714 | ||||||||
| Diluted earnings per share (1) |
$ | 0.69 | $ | 0.56 | $ | 0.52 | $ | 0.60 | ||||||||
| Diluted weighted average common shares (2) |
33,000 | 33,000 | 33,000 | 33,000 | ||||||||||||
| 2012 |
||||||||||||||||
| Total Revenue |
$ | 143,622 | $ | 152,436 | $ | 177,774 | $ | 187,096 | ||||||||
| Cost of Revenue |
58,210 | 67,157 | 77,928 | 85,179 | ||||||||||||
|
|
|
|
|
|
|
|
|
|||||||||
| Gross Profit |
$ | 85,412 | $ | 85,279 | $ | 99,846 | $ | 101,917 | ||||||||
|
|
|
|
|
|
|
|
|
|||||||||
| Net Income |
$ | 14,113 | $ | 13,484 | $ | 15,458 | $ | 15,817 | ||||||||
| Diluted earnings per share (1) |
$ | 0.43 | $ | 0.41 | $ | 0.47 | $ | 0.48 | ||||||||
| Diluted weighted average common shares (2) |
33,000 | 33,000 | 33,000 | 33,000 | ||||||||||||
F-32
Table of Contents
| (1) | The sum of the quarterly earnings per share amounts may not total to each full year amount presented in the Company’s financial statements because these computations are made independently for each quarter and for the full year and take into account the weighted average number of common shares outstanding for each period. |
| (2) | See Note 2 for Basis of Presentation. |
20. Subsequent Events
Subsequent events have been reviewed through April 30, 2014, the date these financial statements were available to be issued.
On April 10, 2014, Cash America announced that its Board of Directors has authorized its management to review potential strategic alternatives, including a tax-free distribution of the Company. While a final decision has not been made, if a distribution were to occur, Cash America would be separated into two independent public companies, one operating storefront lending businesses and the other, Enova International, Inc., operating an online lending business.
If Cash America’s Board of Directors approves a separation, a transaction could be completed in late 2014 or early 2015, subject to market, regulatory and other conditions, including, if the separation takes the form of a tax-free distribution, the receipt of a private letter ruling from the Internal Revenue Service and an opinion from Cash America’s tax counsel. The Company currently expects that any distribution would be in the form of a tax-free distribution of at least 80% of the Company’s common stock to Cash America’s shareholders. The separation is subject to a number of conditions, including final approval by Cash America’s Board of Directors of transaction specifics. In addition, external events beyond the control of the Company and Cash America could impact the timing or occurrence of a separation.
F-33
Table of Contents
ENOVA INTERNATIONAL, INC. AND SUBSIDIARIES
CONSOLIDATED BALANCE SHEETS
(dollars in thousands, except per share data)
(Unaudited)
| September 30, | December 31, | |||||||||||
| 2014 | 2013 | 2013 | ||||||||||
| Assets |
||||||||||||
| Current assets: |
||||||||||||
| Cash and cash equivalents |
$ | 104,241 | $ | 61,381 | $ | 47,480 | ||||||
| Consumer loans, net |
303,694 | 272,001 | 303,467 | |||||||||
| Income taxes receivable |
14 | — | — | |||||||||
| Prepaid expenses and other assets |
12,738 | 7,996 | 8,686 | |||||||||
| Deferred tax assets |
26,558 | 33,082 | 30,914 | |||||||||
|
|
|
|
|
|
|
|||||||
| Total current assets |
447,245 | 374,460 | 390,547 | |||||||||
| Property and equipment, net |
35,598 | 40,178 | 39,405 | |||||||||
| Goodwill |
255,865 | 255,869 | 255,869 | |||||||||
| Intangible assets, net |
18 | 71 | 45 | |||||||||
| Other assets |
21,712 | 6,269 | 6,286 | |||||||||
|
|
|
|
|
|
|
|||||||
| Total assets |
$ | 760,438 | $ | 676,847 | $ | 692,152 | ||||||
|
|
|
|
|
|
|
|||||||
| Liabilities and Stockholder’s Equity |
||||||||||||
| Current liabilities: |
||||||||||||
| Accounts payable and accrued expenses |
$ | 71,373 | $ | 43,448 | $ | 49,614 | ||||||
| Related party payable, net |
13,369 | — | — | |||||||||
|
|
|
|
|
|
|
|||||||
| Total current liabilities |
84,742 | 43,448 | 49,614 | |||||||||
| Deferred tax liabilities |
45,657 | 44,191 | 45,306 | |||||||||
| Other liabilities |
105 | 7 | 51 | |||||||||
| Long-term debt |
494,021 | 437,397 | 424,133 | |||||||||
|
|
|
|
|
|
|
|||||||
| Total liabilities |
624,525 | 525,043 | 519,104 | |||||||||
|
|
|
|
|
|
|
|||||||
| Commitments and contingencies |
||||||||||||
| Stockholder’s equity: |
||||||||||||
| Common stock, $0.00001 par value, 250,000,000 shares authorized, 33,000,000 shares issued and outstanding |
— | — | — | |||||||||
| Preferred stock, $0.00001 par value, 25,000,000 shares authorized, no shares issued and outstanding |
— | — | — | |||||||||
| Retained earnings |
134,975 | 150,427 | 169,947 | |||||||||
| Accumulated other comprehensive income |
938 | 1,377 | 3,101 | |||||||||
|
|
|
|
|
|
|
|||||||
| Total stockholder’s equity |
135,913 | 151,804 | 173,048 | |||||||||
|
|
|
|
|
|
|
|||||||
| Total liabilities and stockholder’s equity |
$ | 760,438 | $ | 676,847 | $ | 692,152 | ||||||
|
|
|
|
|
|
|
|||||||
See notes to consolidated financial statements.
F-34
Table of Contents
ENOVA INTERNATIONAL, INC. AND SUBSIDIARIES
CONSOLIDATED STATEMENTS OF INCOME
(in thousands, except per share data)
(Unaudited)
| Three Months Ended September 30, |
Nine Months Ended September 30, |
|||||||||||||||
| 2014 | 2013 | 2014 | 2013 | |||||||||||||
| Revenue |
$ | 205,168 | $ | 198,098 | $ | 615,115 | $ | 556,553 | ||||||||
| Cost of Revenue |
72,919 | 90,389 | 206,195 | 228,547 | ||||||||||||
|
|
|
|
|
|
|
|
|
|||||||||
| Gross Profit |
132,249 | 107,709 | 408,920 | 328,006 | ||||||||||||
| Expenses |
||||||||||||||||
| Marketing |
33,393 | 36,523 | 92,699 | 94,592 | ||||||||||||
| Operations and technology |
19,362 | 17,959 | 54,370 | 52,505 | ||||||||||||
| General and administrative |
31,167 | 17,991 | 82,525 | 61,879 | ||||||||||||
| Depreciation and amortization |
5,338 | 3,958 | 13,772 | 12,986 | ||||||||||||
|
|
|
|
|
|
|
|
|
|||||||||
| Total Expenses |
89,260 | 76,431 | 243,366 | 221,962 | ||||||||||||
|
|
|
|
|
|
|
|
|
|||||||||
| Income from Operations |
42,989 | 31,278 | 165,554 | 106,044 | ||||||||||||
| Interest expense, net |
(13,136 | ) | (4,909 | ) | (25,201 | ) | (14,738 | ) | ||||||||
| Foreign currency transaction loss |
(155 | ) | (737 | ) | (555 | ) | (1,023 | ) | ||||||||
|
|
|
|
|
|
|
|
|
|||||||||
| Income before Income Taxes |
29,698 | 25,632 | 139,798 | 90,283 | ||||||||||||
| Provision for income taxes |
11,213 | 8,544 | 50,629 | 31,959 | ||||||||||||
|
|
|
|
|
|
|
|
|
|||||||||
| Net Income |
$ | 18,485 | $ | 17,088 | $ | 89,169 | $ | 58,324 | ||||||||
|
|
|
|
|
|
|
|
|
|||||||||
| Earnings Per Share: |
||||||||||||||||
| Earnings per common share, basic and diluted |
$ | 0.56 | $ | 0.52 | $ | 2.70 | $ | 1.77 | ||||||||
| Weighted average common shares outstanding, basic and diluted |
33,000 | 33,000 | 33,000 | 33,000 | ||||||||||||
See notes to consolidated financial statements.
F-35
Table of Contents
ENOVA INTERNATIONAL, INC. AND SUBSIDIARIES
CONSOLIDATED STATEMENTS OF COMPREHENSIVE INCOME
(in thousands)
(Unaudited)
| Three Months Ended September 30, |
Nine Months Ended September 30, |
|||||||||||||||
| 2014 | 2013 | 2014 | 2013 | |||||||||||||
| Net Income |
$ | 18,485 | $ | 17,088 | $ | 89,169 | $ | 58,324 | ||||||||
| Other comprehensive (loss) gain, net of tax: |
||||||||||||||||
| Foreign currency translation (loss) gain (a) |
(5,228 | ) | 3,501 | (2,163 | ) | 643 | ||||||||||
|
|
|
|
|
|
|
|
|
|||||||||
| Total other comprehensive (loss) gain, net of tax |
(5,228 | ) | 3,501 | (2,163 | ) | 643 | ||||||||||
|
|
|
|
|
|
|
|
|
|||||||||
| Comprehensive Income |
$ | 13,257 | $ | 20,589 | $ | 87,006 | $ | 58,967 | ||||||||
|
|
|
|
|
|
|
|
|
|||||||||
| (a) | Net of tax benefit (provision) of $2,927 and $(1,970) for the three months ended September 30, 2014 and 2013, respectively, and $1,211 and $(357) for the nine months ended September 30, 2014 and 2013, respectively. |
See notes to consolidated financial statements.
F-36
Table of Contents
ENOVA INTERNATIONAL, INC. AND SUBSIDIARIES
CONSOLIDATED STATEMENTS OF STOCKHOLDER’S EQUITY
(in thousands, except per share data)
(Unaudited)
|
Common Stock |
Retained Earnings |
Accumulated Other Comprehensive Income (Loss) |
Total Stockholder’s Equity |
|||||||||||||||||
| Shares | Amount | |||||||||||||||||||
| Balance at December 31, 2012 |
33,000 | $ | — | $ | 96,682 | $ | 734 | $ | 97,416 | |||||||||||
| Net equity transactions with parent |
(4,579 | ) | — | (4,579 | ) | |||||||||||||||
| Net income |
58,324 | — | 58,324 | |||||||||||||||||
| Foreign currency translation gain, net of tax |
— | 643 | 643 | |||||||||||||||||
|
|
|
|
|
|
|
|
|
|
|
|||||||||||
| Balance at September 30, 2013 |
33,000 | $ | — | $ | 150,427 | $ | 1,377 | $ | 151,804 | |||||||||||
|
|
|
|
|
|
|
|
|
|
|
|||||||||||
| Balance at December 31, 2013 |
33,000 | $ | — | $ | 169,947 | $ | 3,101 | $ | 173,048 | |||||||||||
| Net equity transactions with parent |
(1,757 | ) | — | (1,757 | ) | |||||||||||||||
| Net income |
89,169 | — | 89,169 | |||||||||||||||||
| Dividend paid to Cash America ($3.71 per share) |
(122,384 | ) | — | (122,384 | ) | |||||||||||||||
| Foreign currency translation loss, net of tax |
— | (2,163 | ) | (2,163 | ) | |||||||||||||||
|
|
|
|
|
|
|
|
|
|
|
|||||||||||
| Balance at September 30, 2014 |
33,000 | $ | — | $ | 134,975 | $ | 938 | $ | 135,913 | |||||||||||
|
|
|
|
|
|
|
|
|
|
|
|||||||||||
See notes to consolidated financial statements.
F-37
Table of Contents
ENOVA INTERNATIONAL, INC. AND SUBSIDIARIES
CONSOLIDATED STATEMENTS OF CASH FLOWS
(in thousands)
(Unaudited)
| Nine Months Ended September 30, |
||||||||
| 2014 | 2013 | |||||||
| Cash Flows from Operating Activities |
||||||||
| Net Income |
$ | 89,169 | $ | 58,324 | ||||
| Adjustments to reconcile net income to net cash provided by operating activities: |
||||||||
| Depreciation and amortization |
13,772 | 12,986 | ||||||
| Amortization of deferred loan costs and debt discount |
1,161 | — | ||||||
| Cost of revenue |
206,195 | 228,547 | ||||||
| Non-cash affiliate interest expense |
7,629 | 14,738 | ||||||
| Stock-based compensation |
257 | 378 | ||||||
| Deferred income taxes, net |
5,997 | 3,224 | ||||||
| Other |
313 | 261 | ||||||
| Changes in operating assets and liabilities: |
||||||||
| Finance and service charges on consumer loans |
1,773 | (4,351 | ) | |||||
| Prepaid expenses and other assets |
(4,256 | ) | 2,495 | |||||
| Accounts payable and accrued expenses |
22,550 | (853 | ) | |||||
| Related party payable, net |
13,369 | — | ||||||
| Current intercompany income taxes payable |
(129 | ) | 118 | |||||
| Other operating assets and liabilities |
— | 3 | ||||||
|
|
|
|
|
|||||
| Net cash provided by operating activities |
357,800 | 315,870 | ||||||
|
|
|
|
|
|||||
| Cash Flows from Investing Activities |
||||||||
| Consumer loans originated or acquired |
(987,575 | ) | (970,526 | ) | ||||
| Consumer loans repaid |
778,504 | 699,398 | ||||||
| Purchases of property and equipment |
(9,858 | ) | (11,544 | ) | ||||
| Other investing activities |
8 | — | ||||||
|
|
|
|
|
|||||
| Net cash used in investing activities |
(218,921 | ) | (282,672 | ) | ||||
|
|
|
|
|
|||||
| Cash Flows from Financing Activities |
||||||||
| Issuance of long-term debt |
493,810 | — | ||||||
| Dividend paid to parent |
(122,384 | ) | — | |||||
| Debt issuance costs paid |
(16,323 | ) | — | |||||
| Net equity transactions with parent |
(2,015 | ) | (5,303 | ) | ||||
| Payments for affiliate line of credit |
(431,762 | ) | (5,231 | ) | ||||
|
|
|
|
|
|||||
| Net cash used in financing activities |
(78,674 | ) | (10,534 | ) | ||||
|
|
|
|
|
|||||
| Effect of exchange rates on cash |
(3,444 | ) | 1,169 | |||||
|
|
|
|
|
|||||
| Net increase in cash and cash equivalents |
56,761 | 23,833 | ||||||
| Cash and cash equivalents at beginning of year |
47,480 | 37,548 | ||||||
|
|
|
|
|
|||||
| Cash and cash equivalents at end of period |
$ | 104,241 | $ | 61,381 | ||||
|
|
|
|
|
|||||
| Supplemental Disclosures |
||||||||
| Consumer loans renewed |
$ | 244,238 | $ | 453,371 | ||||
See notes to consolidated financial statements.
F-38
Table of Contents
ENOVA INTERNATIONAL, INC. AND SUBSIDIARIES
NOTES TO CONSOLIDATED FINANCIAL STATEMENTS (Unaudited)
1. Significant Accounting Policies
Basis of Presentation
On September 7, 2011, Cash America International, Inc. (“Cash America”) formed a new company, Enova International, Inc. (the “Company”). On September 13, 2011, Cash America contributed to the Company all of the stock of its wholly-owned subsidiary, Enova Online Services, Inc., in exchange for 33 million shares of the Company’s common stock.
On November 13, 2014, Cash America completed the tax-free spin-off of approximately 80% of the outstanding shares of the Company to holders of Cash America’s common stock (the “Spin-off”). Cash America’s shareholders received 0.915 shares of Company common stock for every one share of Cash America common stock held at the close of business November 3, 2014, which was the record date for the distribution. Following the Spin-off, the Company became an independent, publicly traded company, and the Company’s shares of common stock are listed on the New York Stock Exchange under the symbol “ENVA.”
The consolidated financial statements of the Company reflect the historical results of operations and cash flows of the Company during each respective period. The financial statements include goodwill and intangible assets arising from businesses previously acquired. The financial statements also include the allocation of certain assets and liabilities that have historically been held at the Cash America corporate level but which are specifically identifiable or allocable to the Company. Certain transactions with Cash America, such as stock-based compensation and foreign currency transactions, are considered to be effectively settled as net equity transactions with parent in “Retained earnings” in the consolidated balance sheets at the time the transaction is recorded. Certain other intercompany transactions between the Company and Cash America are reflected as a change in “Related party payable, net” in the consolidated balance sheets and are settled a month in arrears. Prior to May 30, 2014, all intercompany transactions between the Company and Cash America were considered to be effectively settled in the financial statements at the time the transaction is recorded. The net effect of the settlement of these transactions was primarily reflected as a change in “Long-term debt” in the consolidated balance sheets. In addition, the historical financial statements include allocations of costs relating to certain functions historically provided by Cash America, including corporate services such as executive oversight, insurance and risk management, government relations, internal audit, treasury, licensing, and to a limited extent finance, accounting, tax, legal, human resources, compensation and benefits, compliance and support for certain information systems related to financial reporting. The expense allocations have been determined on a basis that Cash America and the Company consider to be reasonable reflections of the utilization of services provided by Cash America. Also see Note 8 for additional information on the Company’s relationship with Cash America. The financial information included herein may not be indicative of the consolidated financial position, operating results, changes in stockholder’s equity and cash flows of the Company in the future, or if the Company had been a separate company during the periods presented.
The financial statements presented as of September 30, 2014 and 2013 and December 31, 2013 and for the three- and nine-month periods ended September 30, 2014 and 2013 are unaudited but, in management’s opinion, include all adjustments, consisting only of normal recurring adjustments, necessary for a fair statement of the results for such interim periods. Operating results for the three- and nine-month periods are not necessarily indicative of the results that may be expected for the full fiscal year.
These financial statements and related notes should be read in conjunction with the Company’s audited consolidated financial statements as of December 31, 2013 and 2012 and for the years ended December 31, 2013, 2012 and 2011 and related notes.
F-39
Table of Contents
Goodwill
Goodwill represents the excess of the purchase price over the fair value of the net tangible and identifiable intangible assets acquired in each business combination. In accordance with Accounting Standards Codification (“ASC”) 350-20-35, Goodwill—Subsequent Measurement, the Company tests goodwill for potential impairment annually as of June 30 and between annual tests if an event occurs or circumstances change that would more likely than not reduce the fair value of a reporting unit below its carrying amount.
The Company uses the income approach to complete its annual goodwill assessment. The income approach uses expected future cash flows and estimated terminal values for each of the Company’s reporting units that are discounted using a market participant perspective to determine the estimated fair value of each reporting unit, which is then compared to the carrying value of that reporting unit to determine if there is impairment. The income approach includes assumptions about revenue growth rates, operating margins and terminal growth rates discounted by an estimated weighted-average cost of capital derived from other publicly-traded companies that are similar but not identical from an operational and economic standpoint. The Company completed its annual assessment of goodwill as of June 30, 2014 and determined that the fair value of its goodwill is in excess of carrying value, and, as a result, no impairment existed at that date.
Adopted Accounting Standards
In April 2014, the Financial Accounting Standards Board (the “FASB”) issued Accounting Standards Update (“ASU”) 2014-08, Presentation of Financial Statements (Topic 205) and Property, Plant, and Equipment (Topic 360): Reporting Discontinued Operations and Disclosures of Disposals of Components of an Entity (“ASU 2014-08”). The amendments in ASU 2014-08 change the criteria for reporting discontinued operations and enhance disclosures in this area. The new guidance requires expanded disclosures about discontinued operations that will provide financial statement users with more information about the assets, liabilities, income, and expenses of discontinued operations. The new guidance also requires disclosure of the pre-tax income or loss attributable to a disposal of an individually significant component of an organization that does not qualify for discontinued operations presentation in the financial statements. The Company is required to adopt ASU 2014-08 prospectively for all disposals (or classifications as held for sale) of components of an entity that occur within annual periods beginning on or after December 15, 2014 and interim periods within those years. Early adoption is permitted. The Company adopted ASU 2014-08 on June 30, 2014, and the adoption did not have a material effect on its financial position or results of operations.
In July 2013, the FASB issued ASU No. 2013-11, Presentation of an Unrecognized Tax Benefit When a Net Operating Loss Carryforward, a Similar Tax Loss, or a Tax Credit Carryforward Exists (“ASU 2013-11”), which provides guidance on the presentation of unrecognized tax benefits when net operating loss carryforwards, similar tax losses, or tax credit carryforwards exist. The amendments in this update are effective for fiscal years (and interim periods within those years) beginning after December 15, 2013. The amendments should be applied prospectively to all unrecognized tax benefits that exist at the effective date. Retrospective application is permitted. The Company prospectively adopted ASU 2013-11 on January 1, 2014, and the adoption did not have a material effect on its financial condition or results of operations.
In March 2013, the FASB issued ASU No. 2013-05, Foreign Currency Matters (Topic 830): Parent’s Accounting for the Cumulative Translation Adjustment upon Derecognition of Certain Subsidiaries or Groups of Assets within a Foreign Entity or of an Investment in a Foreign Entity (a consensus of the FASB Emerging Issues Task Force) (“ASU 2013-05”), which applies to the release of the cumulative translation adjustment into net income when a parent either sells all or a part of its investment in a foreign entity or no longer holds a controlling financial interest in a subsidiary or group of assets that is a business (other than a sale of in substance real estate or conveyance of oil and gas mineral rights) within a foreign entity. ASU 2013-05 is effective prospectively for fiscal years (and interim reporting periods within those years) beginning after December 15, 2013. The Company adopted ASU 2013-05 on January 1, 2014, and the adoption did not have a material effect on its financial condition or results of operations.
F-40
Table of Contents
In February 2013, the FASB issued ASU No. 2013-04, Obligations Resulting from Joint and Several Liability Arrangements for Which the Total Amount of the Obligation Is Fixed at the Reporting Date (“ASU 2013-04”). ASU 2013-04 requires an entity to measure obligations resulting from joint and several liability arrangements for which the total amount of the obligation is fixed at the reporting date as the amount the reporting entity agreed to pay plus additional amounts the reporting entity expects to pay on behalf of its co-obligors. The guidance further provides for disclosure of the nature and amount of the obligation. ASU 2013-04 is effective for interim and annual reporting periods beginning after December 15, 2013. The Company adopted ASU 2013-04 on January 1, 2014, and the adoption did not have a material effect on its financial condition or results of operations.
Accounting Standards to be Adopted in Future Periods
In August 2014, the FASB issued ASU 2014-15, Disclosure of Uncertainties about an Entity’s Ability to Continue as a Going Concern (“ASU 2014-15”), which requires management to evaluate, in connection with financial statement preparation for each annual and interim reporting period, whether there are conditions or events that raise substantial doubt about the entity’s ability to continue as a going concern within one year after the date the financial statements are issued, and to provide related disclosures. ASU 2014-15 applies to all entities and is effective for annual periods ending after December 15, 2016, and interim periods thereafter, with early adoption permitted. The Company does not expect adoption of this guidance will have a material effect on its consolidated financial statements.
In May 2014, the FASB issued ASU No. 2014-09, Revenue from Contracts with Customers (Topic 606) (“ASU 2014-09”), which supersedes the revenue recognition requirements in Accounting Standards Codification 605, Revenue Recognition. ASU 2014-09 is based on the principle that revenue is recognized to depict the transfer of goods or services to customers in an amount that reflects the consideration to which the entity expects to be entitled in exchange for those goods or services. ASU 2014-09 also requires additional disclosure about the nature, amount, timing and uncertainty of revenue and cash flows arising from customer contracts, including significant judgments and changes in judgments and assets recognized from costs incurred to obtain or fulfill a contract. ASU 2014-09 is effective retrospectively for fiscal years, and interim periods within those years, beginning after December 15, 2016. Early adoption is not permitted. The Company is still assessing the potential impact of ASU 2014-09 on its financial position and results of operations.
2. Consumer Loans, Credit Quality Information and Allowances and Liabilities for Estimated Losses on Consumer Loans
Consumer loan fee revenue generated from the Company’s consumer loans for the three and nine months ended September 30, 2014 and 2013 was as follows (dollars in thousands):
| Three Months Ended September 30, |
Nine Months Ended September 30, |
|||||||||||||||
| 2014 | 2013 | 2014 | 2013 | |||||||||||||
| Interest and fees on short-term loans |
$ | 61,885 | $ | 92,508 | $ | 200,570 | $ | 310,550 | ||||||||
| Interest and fees on line of credit accounts |
80,909 | 50,506 | 228,839 | 102,022 | ||||||||||||
| Interest and fees on installment loans |
61,810 | 54,766 | 185,057 | 142,838 | ||||||||||||
|
|
|
|
|
|
|
|
|
|||||||||
| Total consumer loan revenue |
204,604 | 197,780 | 614,466 | 555,410 | ||||||||||||
| Other |
564 | 318 | 649 | 1,143 | ||||||||||||
|
|
|
|
|
|
|
|
|
|||||||||
| Total Revenue |
$ | 205,168 | $ | 198,098 | $ | 615,115 | $ | 556,553 | ||||||||
|
|
|
|
|
|
|
|
|
|||||||||
Current and Delinquent Consumer Loans
The Company classifies its consumer loans as either current or delinquent. Short-term loans are considered delinquent when payment of an amount due is not made as of the due date. If a line of credit account or installment loan customer misses one payment, that payment is considered delinquent and the balance of the loan
F-41
Table of Contents
is considered current. The Company does not accrue interest on the delinquent payment portion of the loan but does continue to accrue interest on the remaining portion of the loan. If a line of credit account or installment loan customer does not make two consecutive payments, the entire account or loan is classified as delinquent. The Company allows for normal payment processing time before considering a payment or a loan delinquent but does not provide for any additional grace period.
The Company generally does not accrue interest on delinquent consumer loans and does not resume accrual of interest on a delinquent loan unless it is returned to current status. In addition, delinquent consumer loans generally may not be renewed, and if, during its attempt to collect on a delinquent consumer loan, the Company allows additional time for payment through a payment plan or a promise to pay, it is still considered delinquent. Generally, all payments received are first applied against accrued but unpaid interest and fees and then against the principal balance of the loan.
Allowance and Liability for Estimated Losses on Consumer Loans
The Company monitors the performance of its consumer loan portfolio and maintains either an allowance or liability for estimated losses on consumer loans (including fees and interest) at a level estimated to be adequate to absorb credit losses inherent in the portfolio. The allowance for losses on the Company’s owned consumer loans reduces the outstanding loan balance in the consolidated balance sheets. The liability for estimated losses related to loans guaranteed under its credit services organization programs (“CSO programs”) is initially recorded at fair value and is included in “Accounts payable and accrued expenses” in the consolidated balance sheets.
In determining the allowance or liability for estimated losses on consumer loans, the Company applies a documented systematic methodology. In calculating the allowance or liability for loan losses, outstanding loans are divided into discrete groups of short-term loans, line of credit accounts and installment loans and are analyzed as current or delinquent. Increases in either the allowance or the liability, net of charge-offs and recoveries, are recorded as a “Cost of revenue” in the consolidated statements of income.
The allowance or liability for short-term loans classified as current is based on historical loss rates adjusted for recent default trends for current loans. For delinquent short-term loans, the allowance or liability is based on a six-month rolling average of loss rates by stage of collection. For line of credit accounts and installment loan portfolios, the Company generally uses a migration analysis to estimate losses inherent in the portfolio. The allowance or liability calculation under the migration analysis is based on historical charge-off experience and the loss emergence period, which represents the average amount of time between the first occurrence of a loss event to the charge-off of a loan. The factors the Company considers to assess the adequacy of the allowance or liability include past due performance, historical behavior of monthly vintages, underwriting changes and recent trends in delinquency in the migration analysis.
The Company fully reserves and generally charges off consumer loans once the loan or a portion of the loan has been classified as delinquent for 60 consecutive days. If a loan is deemed uncollectible before it is fully reserved, it is charged off at that point. Consumer loans classified as delinquent generally have an age of one to 59 days from the date any portion of the loan became delinquent, as defined above. Recoveries on loans previously charged to the allowance are credited to the allowance when collected.
F-42
Table of Contents
The components of Company-owned consumer loan portfolio receivables at September 30, 2014 and 2013 and December 31, 2013 were as follows (dollars in thousands):
| As of September 30, 2014 | ||||||||||||||||
| Short-term Loans |
Line of Credit Accounts |
Installment Loans |
Total | |||||||||||||
| Current loans |
$ | 32,509 | $ | 118,329 | $ | 176,651 | $ | 327,489 | ||||||||
| Delinquent loans: |
||||||||||||||||
| Delinquent payment amounts (1) |
— | 4,335 | 1,532 | 5,867 | ||||||||||||
| Loans on non-accrual status |
18,313 | 5,611 | 16,413 | 40,337 | ||||||||||||
|
|
|
|
|
|
|
|
|
|||||||||
| Total delinquent loans |
18,313 | 9,946 | 17,945 | 46,204 | ||||||||||||
|
|
|
|
|
|
|
|
|
|||||||||
| Total consumer loans, gross |
50,822 | 128,275 | 194,596 | 373,693 | ||||||||||||
| Less: Allowance for losses |
(17,415 | ) | (22,672 | ) | (29,912 | ) | (69,999 | ) | ||||||||
|
|
|
|
|
|
|
|
|
|||||||||
| Consumer loans, net |
$ | 33,407 | $ | 105,603 | $ | 164,684 | $ | 303,694 | ||||||||
|
|
|
|
|
|
|
|
|
|||||||||
| As of September 30, 2013 | ||||||||||||||||
| Short-term Loans |
Line of Credit Accounts |
Installment Loans |
Total | |||||||||||||
| Current loans |
$ | 62,075 | $ | 84,758 | $ | 146,536 | $ | 293,369 | ||||||||
| Delinquent loans: |
||||||||||||||||
| Delinquent payment amounts (1) |
— | 2,242 | 1,592 | 3,834 | ||||||||||||
| Loans on non-accrual status |
34,430 | 12,606 | 14,816 | 61,852 | ||||||||||||
|
|
|
|
|
|
|
|
|
|||||||||
| Total delinquent loans |
34,430 | 14,848 | 16,408 | 65,686 | ||||||||||||
|
|
|
|
|
|
|
|
|
|||||||||
| Total consumer loans, gross |
96,505 | 99,606 | 162,944 | 359,055 | ||||||||||||
| Less: Allowance for losses |
(30,572 | ) | (24,405 | ) | (32,077 | ) | (87,054 | ) | ||||||||
|
|
|
|
|
|
|
|
|
|||||||||
| Consumer loans, net |
$ | 65,933 | $ | 75,201 | $ | 130,867 | $ | 272,001 | ||||||||
|
|
|
|
|
|
|
|
|
|||||||||
| As of December 31, 2013 | ||||||||||||||||
| Short-term Loans |
Line of Credit Accounts |
Installment Loans |
Total | |||||||||||||
| Current loans |
$ | 57,368 | $ | 112,969 | $ | 160,585 | $ | 330,922 | ||||||||
| Delinquent loans: |
||||||||||||||||
| Delinquent payment amounts (1) |
— | 4,146 | 1,724 | 5,870 | ||||||||||||
| Loans on non-accrual status |
23,385 | 8,687 | 16,921 | 48,993 | ||||||||||||
|
|
|
|
|
|
|
|
|
|||||||||
| Total delinquent loans |
23,385 | 12,833 | 18,645 | 54,863 | ||||||||||||
|
|
|
|
|
|
|
|
|
|||||||||
| Total consumer loans, gross |
80,753 | 125,802 | 179,230 | 385,785 | ||||||||||||
| Less: Allowance for losses |
(20,466 | ) | (29,244 | ) | (32,608 | ) | (82,318 | ) | ||||||||
|
|
|
|
|
|
|
|
|
|||||||||
| Consumer loans, net |
$ | 60,287 | $ | 96,558 | $ | 146,622 | $ | 303,467 | ||||||||
|
|
|
|
|
|
|
|
|
|||||||||
| (1) | Represents the delinquent portion of installment loans and line of credit account balances for customers that have only missed one payment. See “Current and Delinquent Consumer Loans” above for additional information. |
F-43
Table of Contents
Changes in the allowance for losses for the Company-owned loans and the liability for losses on the Company’s guarantees of third-party lender-owned loans during the three and nine months ended September 30, 2014 and 2013 were as follows (dollars in thousands):
| Three Months Ended September 30, 2014 | ||||||||||||||||
| Short-term Loans |
Line of Credit Accounts |
Installment Loans |
Total | |||||||||||||
| Allowance for losses for Company-owned consumer loans: |
||||||||||||||||
| Balance at beginning of period |
$ | 18,248 | $ | 21,579 | $ | 27,967 | $ | 67,794 | ||||||||
| Cost of revenue |
19,075 | 25,913 | 28,068 | 73,056 | ||||||||||||
| Charge-offs |
(25,740 | ) | (29,316 | ) | (31,993 | ) | (87,049 | ) | ||||||||
| Recoveries |
6,110 | 5,024 | 6,373 | 17,507 | ||||||||||||
| Effect of foreign currency translation |
(278 | ) | (528 | ) | (503 | ) | (1,309 | ) | ||||||||
|
|
|
|
|
|
|
|
|
|||||||||
| Balance at end of period |
$ | 17,415 | $ | 22,672 | $ | 29,912 | $ | 69,999 | ||||||||
|
|
|
|
|
|
|
|
|
|||||||||
| Liability for third-party lender-owned consumer loans: |
||||||||||||||||
| Balance at beginning of period |
$ | 1,581 | $ | — | $ | — | $ | 1,581 | ||||||||
| (Decrease) increase in liability |
(139 | ) | — | 2 | (137 | ) | ||||||||||
|
|
|
|
|
|
|
|
|
|||||||||
| Balance at end of period |
$ | 1,442 | $ | — | $ | 2 | $ | 1,444 | ||||||||
|
|
|
|
|
|
|
|
|
|||||||||
| Three Months Ended September 30, 2013 | ||||||||||||||||
| Short-term Loans |
Line of Credit Accounts |
Installment Loans |
Total | |||||||||||||
| Allowance for losses for Company-owned consumer loans: |
||||||||||||||||
| Balance at beginning of period |
$ | 38,584 | $ | 12,109 | $ | 26,555 | $ | 77,248 | ||||||||
| Cost of revenue |
33,852 | 26,152 | 30,631 | 90,635 | ||||||||||||
| Charge-offs |
(51,413 | ) | (15,753 | ) | (30,085 | ) | (97,251 | ) | ||||||||
| Recoveries |
8,491 | 1,542 | 3,996 | 14,029 | ||||||||||||
| Effect of foreign currency translation |
1,058 | 355 | 980 | 2,393 | ||||||||||||
|
|
|
|
|
|
|
|
|
|||||||||
| Balance at end of period |
$ | 30,572 | $ | 24,405 | $ | 32,077 | $ | 87,054 | ||||||||
|
|
|
|
|
|
|
|
|
|||||||||
| Liability for third-party lender-owned consumer loans: |
||||||||||||||||
| Balance at beginning of period |
$ | 2,188 | $ | — | $ | — | $ | 2,188 | ||||||||
| Decrease in liability |
(246 | ) | — | — | (246 | ) | ||||||||||
|
|
|
|
|
|
|
|
|
|||||||||
| Balance at end of period |
$ | 1,942 | $ | — | $ | — | $ | 1,942 | ||||||||
|
|
|
|
|
|
|
|
|
|||||||||
| Nine Months Ended September 30, 2014 | ||||||||||||||||
| Short-term Loans |
Line of Credit Accounts |
Installment Loans |
Total | |||||||||||||
| Allowance for losses for Company-owned consumer loans: |
||||||||||||||||
| Balance at beginning of period |
$ | 20,466 | $ | 29,244 | $ | 32,608 | $ | 82,318 | ||||||||
| Cost of revenue |
55,531 | 71,612 | 79,655 | 206,798 | ||||||||||||
| Charge-offs |
(81,153 | ) | (90,904 | ) | (99,556 | ) | (271,613 | ) | ||||||||
| Recoveries |
22,612 | 12,800 | 17,218 | 52,630 | ||||||||||||
| Effect of foreign currency translation |
(41 | ) | (80 | ) | (13 | ) | (134 | ) | ||||||||
|
|
|
|
|
|
|
|
|
|||||||||
| Balance at end of period |
$ | 17,415 | $ | 22,672 | $ | 29,912 | $ | 69,999 | ||||||||
|
|
|
|
|
|
|
|
|
|||||||||
| Liability for third-party lender-owned consumer loans: |
||||||||||||||||
| Balance at beginning of period |
$ | 2,047 | $ | — | $ | — | $ | 2,047 | ||||||||
| (Decrease) increase in liability |
(605 | ) | — | 2 | (603 | ) | ||||||||||
|
|
|
|
|
|
|
|
|
|||||||||
| Balance at end of period |
$ | 1,442 | $ | — | $ | 2 | $ | 1,444 | ||||||||
|
|
|
|
|
|
|
|
|
|||||||||
F-44
Table of Contents
| Nine Months Ended September 30, 2013 | ||||||||||||||||
| Short-term Loans |
Line of Credit Accounts |
Installment Loans |
Total | |||||||||||||
| Allowance for losses for Company-owned consumer loans: |
||||||||||||||||
| Balance at beginning of period |
$ | 41,942 | $ | 12,565 | $ | 27,845 | $ | 82,352 | ||||||||
| Cost of revenue |
110,961 | 42,626 | 75,642 | 229,229 | ||||||||||||
| Charge-offs |
(148,445 | ) | (35,832 | ) | (81,402 | ) | (265,679 | ) | ||||||||
| Recoveries |
26,600 | 4,704 | 9,959 | 41,263 | ||||||||||||
| Effect of foreign currency translation |
(486 | ) | 342 | 33 | (111 | ) | ||||||||||
|
|
|
|
|
|
|
|
|
|||||||||
| Balance at end of period |
$ | 30,572 | $ | 24,405 | $ | 32,077 | $ | 87,054 | ||||||||
|
|
|
|
|
|
|
|
|
|||||||||
| Liability for third-party lender-owned consumer loans: |
||||||||||||||||
| Balance at beginning of period |
$ | 2,624 | $ | — | $ | — | $ | 2,624 | ||||||||
| Decrease in liability |
(682 | ) | — | — | (682 | ) | ||||||||||
|
|
|
|
|
|
|
|
|
|||||||||
| Balance at end of period |
$ | 1,942 | $ | — | $ | — | $ | 1,942 | ||||||||
|
|
|
|
|
|
|
|
|
|||||||||
Guarantees of Consumer Loans
In connection with its CSO programs, the Company guarantees consumer loan payment obligations to unrelated third-party lenders for short-term and installment loans the Company arranges for consumers on the third-party lenders’ behalf and is required to purchase any defaulted loans it has guaranteed. The guarantee represents an obligation to purchase specific loans that go into default, which generally occurs after one payment is missed. As of September 30, 2014 and 2013 and December 31, 2013, the amount of consumer loans guaranteed by the Company was $35.4 million, $35.1 million and $41.4 million, respectively, representing amounts due under consumer loans originated by third-party lenders under the CSO programs. The liability for estimated losses on consumer loans guaranteed by the Company of $1.4 million, $1.9 million and $2.0 million, as of September 30, 2014 and 2013 and December 31, 2013, respectively, is included in “Accounts payable and accrued expenses” in the accompanying consolidated balance sheets.
3. Investment in Unconsolidated Subsidiary
The Company records an investment in the preferred stock of an early-stage privately-held developing consumer financial services entity under the cost method. The carrying value of the Company’s investment in this unconsolidated subsidiary was $6.0 million as of September 30, 2014 and 2013 and December 31, 2013 and was held in “Other assets” in the Company’s consolidated balance sheets. The Company evaluates this investment for impairment if an event occurs or circumstances change that would more likely than not reduce the fair value of the investment below carrying value. Based on the Company’s impairment evaluation of this investment as of September 30, 2014, it determined that no impairment existed.
4. Long-term debt
$75.0 Million Revolving Credit Facility
On May 14, 2014, the Company and its domestic subsidiaries as guarantors, entered into a credit agreement among the Company, the guarantors, Jefferies Finance, LLC as administrative agent and Jefferies Group, LLC as lender (the “Credit Agreement”). The Credit Agreement provides for an unsecured revolving credit facility of up to $75.0 million, including a multi-currency sub-facility that gives the Company the ability to borrow up to $25.0 million that may be specified in foreign currencies subject to the terms and conditions of the Credit Agreement. Interest on the amounts borrowed will be charged, at the Company’s option, at either the London Interbank Offered Rate (“LIBOR”) for one week or one-, two-, three- or six-month periods, as selected by the Company, plus a margin varying from 2.50% to 3.75% or at the agent’s base rate plus a margin varying from 1.50% to 2.75%. The margin for the borrowings under the Credit Agreement is dependent on the Company’s cash flow leverage ratios. The Company will also be required to pay a fee on the unused portion of the line of credit
F-45
Table of Contents
ranging from 0.25% to 0.50% (0.50% as of September 30, 2014) based on the Company’s cash flow leverage ratios. The Credit Agreement will mature on June 30, 2017. There were no outstanding borrowings under the Credit Agreement as of September 30, 2014.
The Credit Agreement also includes a sub-limit of up to $20.0 million for standby or commercial letters of credit that is guaranteed by the Company’s domestic subsidiaries. In the event that an amount is paid by the issuing bank under a letter of credit, it will be due and payable by the Company on demand. Pursuant to the terms of the Credit Agreement, the Company agrees to pay fees equal to the LIBOR margin per annum on the undrawn amount of each outstanding standby letter of credit plus a one-time commercial letter of credit fee of 0.20% of the face amount of each commercial letter of credit plus 0.25% per annum on the average daily amount of the total letter of credit exposure. The Company had letters of credit of $3.0 million under its Credit Agreement as of September 30, 2014.
In connection with the issuance of the Credit Agreement, the Company incurred debt issuance costs of approximately $1.6 million in the nine months ended September 30, 2014, which primarily consisted of underwriting fees and legal expenses. The unamortized balance of these costs as of September 30, 2014 is included in “Other assets” in the consolidated balance sheets. These costs are being amortized to interest expense over a period of 37 months, the term of the Credit Agreement.
$500.0 Million 9.75% Senior Unsecured Notes
On May 30, 2014, the Company issued and sold $500.0 million in aggregate principal amount of 9.75% Senior Notes due 2021 (the “Senior Notes”). The Senior Notes bear interest at a rate of 9.75% annually on the principal amount payable semi-annually in arrears on June 1 and December 1 of each year, beginning on December 1, 2014. The Senior Notes were sold at a discount of the principal amount to yield 10.0% to maturity. The Senior Notes will mature on June 1, 2021. The Senior Notes are unsecured debt obligations of the Company, and are unconditionally guaranteed by all of the Company’s domestic subsidiaries. The Senior Notes were sold to qualified institutional buyers in accordance with Rule 144A under the Securities Act of 1933, as amended, or the Securities Act, and outside the United States pursuant to Regulation S under the Securities Act.
The Senior Notes are governed by an indenture (the “Senior Notes Indenture”), dated May 30, 2014, between the Company, the Company’s domestic subsidiaries, as guarantors, and the trustee. The Senior Notes Indenture contains certain covenants that, among other things, limit the Company’s, and certain of its subsidiaries, ability to incur additional debt, acquire or create new subsidiaries, create liens, engage in certain transactions with affiliates and consolidate or merge with or into other companies. The Senior Notes Indenture provides for customary events of default, including nonpayment and failure to comply with covenants or other agreements in the Senior Notes Indenture.
The Senior Notes are redeemable at the Company’s option, in whole or in part, (i) at any time prior to June 1, 2017 at 100% of the aggregate principal amount of Senior Notes redeemed plus the applicable “make whole” redemption price specified in the Senior Notes Indenture, plus accrued and unpaid interest, if any, to the redemption date and (ii) at any time on or after June 1, 2017 at a premium specified in the Senior Notes Indenture that will decrease over time, plus accrued and unpaid interest, if any, to the redemption date. In addition, prior to June 1, 2017, at its option, the Company may redeem up to 35% of the aggregate principal amount of the Senior Notes at a redemption price equal to 109.75% of the principal amount thereof, plus accrued and unpaid interest, if any, to the redemption date, with the proceeds of certain equity offerings as described in the Senior Notes Indenture. In addition, if the Company and its subsidiaries’ guarantee of certain indebtedness of Cash America as described in the Senior Notes Indenture is not released on or before March 31, 2015 then the Company may redeem all of the Senior Notes outstanding at a redemption price equal to 103% of the aggregate principal amount, plus accrued and unpaid interest, if any, to the redemption date (the “Special Redemption”), and if the Special Redemption does not occur, then the interest rate on the Senior Notes will increase 2.0% per annum until the Company and its subsidiaries no longer guarantee certain indebtedness of Cash America as described in the
F-46
Table of Contents
Senior Notes Indenture. If a change of control occurs, as that term is defined in the Senior Notes Indenture, the holders of the Senior Notes will have the right, subject to certain conditions, to require the Company to repurchase their Senior Notes at a purchase price equal to 101% of the aggregate principal amount, plus accrued and unpaid interest, if any, as of the date of repurchase. The Spin-off does not constitute a change of control under the Senior Notes Indenture. See Notes 1 and 10 for additional information on the Spin-off.
Additionally, on May 30, 2014, the Company entered into a registration rights agreement with Jefferies, LLC as the initial purchaser (the “Registration Rights Agreement”) of the Senior Notes, pursuant to which the Company agreed to use commercially reasonable efforts to cause a registration statement to be declared effective on or prior to the 360th day following the closing date relating to an exchange offer of the Senior Notes for identical new notes registered under the Securities Act. In certain circumstances, the Company may be required to file a shelf registration to cover resales of the Senior Notes. If the Company does not comply with certain covenants set forth in the Registration Rights Agreement, it must pay liquidated damages to holders of the Senior Notes. If the Company fails to satisfy any of its registration obligations, it may be required to pay the holders of the Senior Notes additional interest ranging from 0.25% to 0.50% per annum until the Company satisfies its registration obligations.
The Company used all of the net proceeds of the Senior Notes offering, or $479.0 million, to repay all of its intercompany indebtedness due to Cash America, which was $361.4 million as of May 30, 2014, and the remaining net proceeds were used to pay a significant portion of $122.4 million in cash dividends paid to Cash America, of which $120.7 million was paid on May 30, 2014 and $1.7 million was paid on June 30, 2014.
As of September 30, 2014, the carrying amount of the Senior Notes was $494.0 million, which included an unamortized discount of $6.0 million. The discount is being amortized to interest expense over a period of seven years, through the maturity date of June 1, 2021. The total interest expense recognized was $16.5 million for the nine months ended September 30, 2014, of which $0.2 million represented the non-cash amortization of the discount. In connection with the issuance of the Senior Notes, the Company incurred approximately $14.7 million for issuance costs, which primarily consisted of underwriting fees, legal and other professional expenses. These costs are being amortized to interest expense over seven years and are included in “Other assets” in the consolidated balance sheets.
Prior to issuing the Senior Notes, the Company depended on Cash America’s support for a significant portion of its financing requirements and had in place a $450 million affiliate revolving credit agreement related to amounts outstanding with Cash America (the “Affiliate Line of Credit”). Borrowings under the Affiliate Line of Credit bore interest at a fluctuating interest rate equal to the prevailing LIBOR rate per annum (based upon a one month interest period) plus 4.5%, or in certain circumstances equal to the prevailing alternate base rate per annum plus 2.0%. The alternate base rate was equal to the greater of (a) the U.S. prime rate, (b) the federal funds effective rate plus 0.5%, and (c) the sum of the one-month LIBOR plus 1.0%. Interest accruing on borrowings made under the revolving line of credit were payable to Cash America and were settled through an adjustment to its affiliate line of credit with Cash America on a monthly basis. At September 30, 2013 and December 31, 2013, the Company had outstanding unsecured amounts payable under the Affiliate Line of Credit of $437.4 million and $424.1 million, respectively.
Weighted-average interest rates on long-term debt were 7.36% and 4.74% during the nine months ended September 30, 2014 and 2013, respectively.
As of September 30, 2014 and 2013 and December 31, 2013, the Company was in compliance with all covenants and other requirements set forth in the prevailing long-term debt agreement(s).
5. Operating Segment Information
The Company provides online financial services to alternative credit consumers in the United States, United Kingdom, Australia, Canada, Brazil and China and has one reportable segment, which is composed of the
F-47
Table of Contents
Company’s domestic and international operations. The Company has aggregated all components of its business into a single reportable segment based on the similarities of the economic characteristics, the nature of the products and services, the nature of the production and distribution methods, the type of customer and the nature of the regulatory environment.
The Company allocates certain corporate expenses (primarily general and administrative expenses and, to a lesser extent, marketing and operations and technology expenses) between its domestic and international components based on revenue. The following tables present information on the Company’s domestic and international operations as of and for the three and nine months ended September 30, 2014 and 2013 (dollars in thousands).
| Three Months Ended September 30, |
Nine Months Ended September 30, |
|||||||||||||||
| 2014 | 2013 | 2014 | 2013 | |||||||||||||
| Revenue |
||||||||||||||||
| Domestic |
$ | 126,130 | $ | 105,199 | $ | 344,003 | $ | 284,132 | ||||||||
| International |
79,038 | 92,899 | 271,112 | 272,421 | ||||||||||||
|
|
|
|
|
|
|
|
|
|||||||||
| Total revenue |
$ | 205,168 | $ | 198,098 | $ | 615,115 | $ | 556,553 | ||||||||
|
|
|
|
|
|
|
|
|
|||||||||
| Income from operations |
||||||||||||||||
| Domestic |
$ | 15,297 | $ | 13,800 | $ | 83,295 | $ | 55,938 | ||||||||
| International |
27,692 | 17,478 | 82,259 | 50,106 | ||||||||||||
|
|
|
|
|
|
|
|
|
|||||||||
| Total income from operations |
$ | 42,989 | $ | 31,278 | $ | 165,554 | $ | 106,044 | ||||||||
|
|
|
|
|
|
|
|
|
|||||||||
| Depreciation and amortization |
||||||||||||||||
| Domestic |
$ | 4,737 | $ | 3,252 | $ | 12,089 | $ | 10,885 | ||||||||
| International |
601 | 706 | 1,683 | 2,101 | ||||||||||||
|
|
|
|
|
|
|
|
|
|||||||||
| Total depreciation and amortization |
$ | 5,338 | $ | 3,958 | $ | 13,772 | $ | 12,986 | ||||||||
|
|
|
|
|
|
|
|
|
|||||||||
| Expenditures for property and equipment |
||||||||||||||||
| Domestic |
$ | 2,974 | $ | 6,224 | $ | 9,057 | $ | 10,118 | ||||||||
| International |
56 | 474 | 801 | 1,426 | ||||||||||||
|
|
|
|
|
|
|
|
|
|||||||||
| Total expenditures for property and equipment |
$ | 3,030 | $ | 6,698 | $ | 9,858 | $ | 11,544 | ||||||||
|
|
|
|
|
|
|
|
|
|||||||||
| September 30, | ||||||||
| 2014 | 2013 | |||||||
| Property and equipment, net |
||||||||
| Domestic |
$ | 30,509 | $ | 34,740 | ||||
| International |
5,089 | 5,438 | ||||||
|
|
|
|
|
|||||
| Total property and equipment, net |
$ | 35,598 | $ | 40,178 | ||||
|
|
|
|
|
|||||
| Assets |
||||||||
| Domestic |
$ | 583,739 | $ | 461,415 | ||||
| International |
176,699 | 215,432 | ||||||
|
|
|
|
|
|||||
| Total assets |
$ | 760,438 | $ | 676,847 | ||||
|
|
|
|
|
|||||
F-48
Table of Contents
Geographic Information
The following table presents the Company’s revenue by geographic region for the three and nine months ended September 30, 2014 and 2013 (dollars in thousands):
| Three Months Ended September 30, |
Nine Months Ended September 30, |
|||||||||||||||
| 2014 | 2013 | 2014 | 2013 | |||||||||||||
| Revenue |
||||||||||||||||
| United States |
$ | 126,130 | $ | 105,199 | $ | 344,003 | $ | 284,132 | ||||||||
| United Kingdom |
76,072 | 91,347 | 263,468 | 265,650 | ||||||||||||
| Other international countries |
2,966 | 1,552 | 7,644 | 6,771 | ||||||||||||
|
|
|
|
|
|
|
|
|
|||||||||
| Total revenue |
$ | 205,168 | $ | 198,098 | $ | 615,115 | $ | 556,553 | ||||||||
|
|
|
|
|
|
|
|
|
|||||||||
The Company’s long-lived assets, which consist of the Company’s property and equipment, were $35.6 million and $40.2 million at September 30, 2014 and 2013, respectively. The operations for the Company’s domestic and international businesses are primarily located within the United States, and the value of any long-lived assets located outside of the United States is immaterial.
6. Commitments and Contingencies
Leases
On July 25, 2014, the Company entered into a new office lease agreement for approximately 160,000 square feet of office space for its headquarters in Chicago, Illinois. The lease term is 12 years, with options to renew for two five-year terms. Under the terms of the lease, the Company was provided $9.8 million in tenant improvement allowances and $8.5 million in rent abatements. For the new office lease agreement, the Company is responsible for paying its proportionate share of the increase in actual operating expenses and real estate taxes over the defined lease year. The operating expenses and real estate taxes are not included in the table below. Future minimum rentals due under non-cancelable leases as of September 30, 2014 are as follows for each of the years ending December 31 (dollars in thousands):
| YEAR |
AMOUNT | |||
| 2014 |
$ | 825 | ||
| 2015 |
3,351 | |||
| 2016 |
3,324 | |||
| 2017 |
5,864 | |||
| 2018 |
5,023 | |||
| Thereafter |
47,883 | |||
| Total |
$ | 66,270 | ||
Litigation
On March 8, 2013, Flemming Kristensen, on behalf of himself and others similarly situated, filed a purported class action lawsuit in the U.S. District Court of Nevada against the Company and other unaffiliated lenders and lead providers. The lawsuit alleges that the lead provider defendants sent unauthorized text messages to consumers on behalf of the Company and the other lender defendants in violation of the Telephone Consumer Protection Act. The complaint seeks class certification, statutory damages, an injunction against “wireless spam activities,” and attorneys’ fees and costs. The Company filed an answer to the complaint denying all liability. On March 26, 2014, the Court granted class certification. On October 24, 2014, the Company filed a motion for summary judgment, and the court has not yet ruled on this motion. Neither the likelihood of an unfavorable ruling nor the ultimate liability, if any, with respect to this matter can be determined at this time, and the Company is currently unable to estimate a range of reasonably possible losses, as defined by ASC 450-20-20, Contingencies–Loss Contingencies–Glossary, for this litigation. The Company believes that the plaintiff’s claims in the complaint are without merit and intends to vigorously defend this lawsuit.
F-49
Table of Contents
The Company is also a defendant in certain routine litigation matters encountered in the ordinary course of its business. Certain of these matters are covered to an extent by insurance. In the opinion of management, the resolution of these matters will not have a material adverse effect on the Company’s financial position, results of operations or liquidity.
7. Derivative Instruments
The Company periodically uses derivative instruments to manage risk from changes in market conditions that may affect the Company’s financial performance. The Company primarily uses derivative instruments to manage its primary market risks, which are interest rate risk and foreign currency exchange rate risk.
The Company uses forward currency exchange contracts to minimize the effects of foreign currency risk in the United Kingdom and Australia. The forward currency exchange contracts are non-designated derivatives. Any gain or loss resulting from these contracts is recorded as income or loss and is included in “Foreign currency transaction loss” in the Company’s consolidated statements of income. The Company currently does not manage its exposure to risk from foreign currency exchange rate fluctuations through the use of forward currency exchange contracts in Canada or Brazil.
The Company’s derivative instruments are presented in its financial statements on a net basis. The following table presents information related to the Company’s derivative instruments as of September 30, 2014 (dollars in thousands):
Non-designated derivatives:
| As of September 30, 2014 | ||||||||||||||||
| Forward currency exchange contracts |
Notional Amount |
Gross Amounts of Recognized Financial Instruments |
Gross Amounts Offset in the Consolidated Balance Sheets (1) |
Net Amounts of Assets Presented in the Consolidated Balance Sheets (2) |
||||||||||||
| Assets |
$ | 8,312 | $ | 29 | $ | — | $ | 29 | ||||||||
|
|
|
|
|
|
|
|
|
|||||||||
| Liabilities |
$ | — | $ | — | $ | — | $ | — | ||||||||
|
|
|
|
|
|
|
|
|
|||||||||
| (1) | As of September 30, 2014, the Company had no gross amounts of recognized derivative instruments that the Company makes an accounting policy election not to offset. In addition, there is no financial collateral related to the Company’s derivatives. The Company has no liabilities that are subject to an enforceable master netting agreement or similar arrangement. |
| (2) | Represents the fair value of forward currency contracts, which is recorded in “Prepaid expenses and other assets” in the consolidated balance sheets. |
Prior to June 2014, the Company participated in Cash America’s derivative and hedging programs, which are coordinated through a centralized treasury function; therefore, the assets and liabilities related to derivative instruments were not recorded in the Company’s financial statements, however, the gains and losses associated with Cash America’s foreign currency forward contracts that relate to the Company’s business were included as “Foreign currency transaction loss” in the consolidated statements of income. The notional amounts recorded by Cash America were $97.3 million and $81.5 million at September 30, 2013 and December 31, 2013, respectively.
F-50
Table of Contents
The following table presents information on the effect of derivative instruments on the consolidated results of operations and accumulated other comprehensive income (“AOCI”) for the three and nine months ended September 30, 2014 and 2013 (dollars in thousands):
| Gains (Losses) Recognized in Income |
Gains (Losses) Recognized in AOCI |
Gains (Losses) Reclassified From AOCI into Income |
||||||||||||||||||||||
| Three Months Ended September 30, |
Three Months Ended September 30, |
Three Months Ended September 30, |
||||||||||||||||||||||
| 2014 | 2013 | 2014 | 2013 | 2014 | 2013 | |||||||||||||||||||
| Non-designated derivatives: |
||||||||||||||||||||||||
| Forward currency exchange contracts (1) |
$ | 401 | $ | (5,432 | ) | $ | — | $ | — | $ | — | $ | — | |||||||||||
|
|
|
|
|
|
|
|
|
|
|
|
|
|||||||||||||
| Total |
$ | 401 | $ | (5,432 | ) | $ | — | $ | — | $ | — | $ | — | |||||||||||
|
|
|
|
|
|
|
|
|
|
|
|
|
|||||||||||||
| Gains (Losses) Recognized in Income |
Gains (Losses) Recognized in AOCI |
Gains (Losses) Reclassified From AOCI into Income |
||||||||||||||||||||||
| Nine Months Ended September 30, |
Nine Months Ended September 30, |
Nine Months Ended September 30, |
||||||||||||||||||||||
| 2014 | 2013 | 2014 | 2013 | 2014 | 2013 | |||||||||||||||||||
| Non-designated derivatives: |
||||||||||||||||||||||||
| Forward currency exchange contracts (1) |
$ | (1,354 | ) | $ | (181 | ) | $ | — | $ | — | $ | — | $ | — | ||||||||||
|
|
|
|
|
|
|
|
|
|
|
|
|
|||||||||||||
| Total |
$ | (1,354 | ) | $ | (181 | ) | $ | — | $ | — | $ | — | $ | — | ||||||||||
|
|
|
|
|
|
|
|
|
|
|
|
|
|||||||||||||
| (1) | The gains (losses) on these derivatives substantially offset the (losses) gains on the hedged portion of the foreign intercompany balances. |
8. Related Party Transactions
Cash America provided certain corporate service functions, such as executive oversight, insurance and risk management, government relations, internal audit, treasury, licensing, and to a limited extent finance, accounting, tax, legal, human resources, compensation and benefits, compliance and support for certain information systems related to financial reporting. The costs of such services were allocated to the Company based on the Company’s share of Cash America’s corporate services expenses incurred for the consolidated entity. Actual corporate services costs that may have been incurred if the Company had been a stand-alone company would depend on a number of factors, including the chosen organizational structure, what functions were outsourced or performed by employees, and strategic decisions made in areas such as information technology and infrastructure. The Company believes that the expenses in these financial statements were reported on a basis that fairly represents the utilization of the services provided. These financial statements do not necessarily reflect the financial position or results of operations that would have existed if the Company had been operated as a stand-alone entity during the periods covered and may not be indicative of future results of operations and financial position. General and administrative expenses include allocations by Cash America of $7.9 million for each of the nine months ended September 30, 2014 and 2013.
Cash America provided some cash management and other treasury services to the Company. The Company also paid Cash America for its share of income taxes as though the Company had been taxed separately from Cash America and had prepared separate tax returns.
The Company paid Cash America compensation for loans made to or arranged for customers who were referred from Cash America. The Company paid $1.1 million and $0.9 million for the nine months ended September 30, 2014 and 2013, respectively, pursuant to this arrangement. In addition, the Company administered the consumer loan underwriting model utilized by Cash America’s Retail Services Division in exchange for the reimbursement of the Company’s direct third-party costs incurred in providing the service. The Company received $0.5 million and $0.7 million for the nine months ended September 30, 2014 and 2013, respectively, pursuant to this arrangement.
F-51
Table of Contents
The cumulative effect of the transactions described above was reflected as a change in “Related party payable, net” in the consolidated balance sheets. The balance was settled a month in arrears. The balance of “Related party payable, net” at September 30, 2014 is $13.4 million.
The Company and its subsidiaries participated jointly and severally with all subsidiaries of Cash America and guaranteed long-term debt of Cash America of $206.0 million, $576.1 million and $638.2 million at September 30, 2014 and 2013 and December 31, 2013, respectively. Under the provisions of Cash America’s debt agreements, the Company had liability in the event Cash America defaulted in its payment obligations or failed to comply with the covenants under the various debt agreements or upon the occurrence of specified events contained in the various debt agreements, including the event of bankruptcy, insolvency or reorganization of Cash America. The Company is being released from liability under such guarantees in connection with the Spin-off. See Notes 1 and 10 for additional information on the Spin-off.
9. Fair Value Measurements
Recurring Fair Value Measurements
In accordance with ASC 820, Fair Value Measurements and Disclosures, certain of the Company’s assets and liabilities, which are carried at fair value, are classified in one of the following three categories:
Level 1: Quoted market prices in active markets for identical assets or liabilities.
Level 2: Observable market based inputs or unobservable inputs that are corroborated by market data.
Level 3: Unobservable inputs that are not corroborated by market data.
The Company’s financial assets and liabilities that are measured at fair value on a recurring basis as of September 30, 2014 and 2013 and December 31, 2013 are as follows (dollars in thousands):
| September 30, 2014 |
Fair Value Measurements Using | |||||||||||||||
| Level 1 | Level 2 | Level 3 | ||||||||||||||
| Financial assets (liabilities) |
||||||||||||||||
| Forward currency exchange contracts |
$ | 29 | $ | — | $ | 29 | $ | — | ||||||||
| Nonqualified savings plan assets (1) |
741 | 741 | — | — | ||||||||||||
|
|
|
|
|
|
|
|
|
|||||||||
| Total |
$ | 770 | $ | 741 | $ | 29 | $ | — | ||||||||
|
|
|
|
|
|
|
|
|
|||||||||
| September 30, 2013 |
Fair Value Measurements Using | |||||||||||||||
| Level 1 | Level 2 | Level 3 | ||||||||||||||
| Financial assets (liabilities) |
||||||||||||||||
| Nonqualified savings plan assets (1) |
$ | 505 | $ | 505 | $ | — | $ | — | ||||||||
|
|
|
|
|
|
|
|
|
|||||||||
| Total |
$ | 505 | $ | 505 | $ | — | $ | — | ||||||||
|
|
|
|
|
|
|
|
|
|||||||||
| December 31, 2013 |
Fair Value Measurements Using | |||||||||||||||
| Level 1 | Level 2 | Level 3 | ||||||||||||||
| Financial assets (liabilities) |
||||||||||||||||
| Nonqualified savings plan assets (1) |
$ | 559 | $ | 559 | $ | — | $ | — | ||||||||
|
|
|
|
|
|
|
|
|
|||||||||
| Total |
$ | 559 | $ | 559 | $ | — | $ | — | ||||||||
|
|
|
|
|
|
|
|
|
|||||||||
| (1) | The non-qualified savings plan assets have an offsetting liability of equal amount, which is included in “Accounts payable and accrued expenses” in the Company’s consolidated balance sheets. |
The Company measures the fair value of its forward currency exchange contracts under Level 2 inputs as defined by ASC 820. For these forward currency exchange contracts, current market rates are used to determine fair
F-52
Table of Contents
value. The significant inputs used in these models are derived from observable market rates. The fair value of the Company’s nonqualified savings plan assets are measured under a Level 1 input. These assets are publicly traded equity securities for which market prices are readily observable. During the nine months ended September 30, 2014 and 2013, there were no transfers of assets in or out of Level 1 fair value measurements. Prior to June 2014, the Company participated in Cash America’s derivative and hedging programs, which are coordinated through a centralized treasury function; therefore, the assets and liabilities related to derivative instruments were not recorded in the Company’s financial statements; however, the gains and losses associated with Cash America’s foreign currency forward contracts that relate to the Company’s business are included as “Foreign currency transaction loss” in the consolidated statements of income.
Financial Assets and Liabilities Not Measured at Fair Value
The Company’s financial assets and liabilities as of September 30, 2014 and 2013 and December 31, 2013 that are not measured at fair value in the consolidated balance sheets are as follows (dollars in thousands):
| September 30, 2014 |
Fair Value Measurements Using | |||||||||||||||
| Level 1 | Level 2 | Level 3 | ||||||||||||||
| Financial assets: |
||||||||||||||||
| Cash and cash equivalents |
$ | 104,241 | $ | 104,241 | $ | — | $ | — | ||||||||
| Short-term loans and line of credit accounts, net (1) |
139,010 | — | — | 139,010 | ||||||||||||
| Installment loans, net (1) |
164,684 | — | — | 164,684 | ||||||||||||
|
|
|
|
|
|
|
|
|
|||||||||
| Total |
$ | 407,935 | $ | 104,241 | $ | — | $ | 303,694 | ||||||||
|
|
|
|
|
|
|
|
|
|||||||||
| Financial liabilities: |
||||||||||||||||
| Liability for estimated losses on consumer loans guaranteed by the Company |
$ | 1,444 | $ | — | $ | — | $ | 1,444 | ||||||||
| Senior Notes |
494,021 | — | 500,000 | — | ||||||||||||
|
|
|
|
|
|
|
|
|
|||||||||
| Total |
$ | 495,465 | $ | — | $ | 500,000 | $ | 1,444 | ||||||||
|
|
|
|
|
|
|
|
|
|||||||||
| September 30, 2013 |
Fair Value Measurements Using | |||||||||||||||
| Level 1 | Level 2 | Level 3 | ||||||||||||||
| Financial assets: |
||||||||||||||||
| Cash and cash equivalents |
$ | 61,381 | $ | 61,381 | $ | — | $ | — | ||||||||
| Short-term loans and line of credit accounts, net (1) |
141,134 | — | — | 141,134 | ||||||||||||
| Installment loans, net (1) |
130,867 | — | — | 130,867 | ||||||||||||
|
|
|
|
|
|
|
|
|
|||||||||
| Total |
$ | 333,382 | $ | 61,381 | $ | — | $ | 272,001 | ||||||||
|
|
|
|
|
|
|
|
|
|||||||||
| Financial liabilities: |
||||||||||||||||
| Liability for estimated losses on consumer loans guaranteed by the Company |
$ | 1,942 | $ | — | $ | — | $ | 1,942 | ||||||||
| Affiliate Line of Credit |
437,397 | — | 444,037 | — | ||||||||||||
|
|
|
|
|
|
|
|
|
|||||||||
| Total |
$ | 439,339 | $ | — | $ | 444,037 | $ | 1,942 | ||||||||
|
|
|
|
|
|
|
|
|
|||||||||
F-53
Table of Contents
| December 31, 2013 |
Fair Value Measurements Using | |||||||||||||||
| Level 1 | Level 2 | Level 3 | ||||||||||||||
| Financial assets: |
||||||||||||||||
| Cash and cash equivalents |
$ | 47,480 | $ | 47,480 | $ | — | $ | — | ||||||||
| Short-term loans and line of credit accounts, net (1) |
156,845 | — | — | 156,845 | ||||||||||||
| Installment loans, net (1) |
146,622 | — | — | 146,622 | ||||||||||||
|
|
|
|
|
|
|
|
|
|||||||||
| Total |
$ | 350,947 | $ | 47,480 | $ | — | $ | 303,467 | ||||||||
|
|
|
|
|
|
|
|
|
|||||||||
| Financial liabilities: |
||||||||||||||||
| Liability for estimated losses on consumer loans guaranteed by the Company |
$ | 2,047 | $ | — | $ | — | $ | 2,047 | ||||||||
| Affiliate Line of Credit |
424,133 | — | 429,978 | — | ||||||||||||
|
|
|
|
|
|
|
|
|
|||||||||
| Total |
$ | 426,180 | $ | — | $ | 429,978 | $ | 2,047 | ||||||||
|
|
|
|
|
|
|
|
|
|||||||||
| (1) | Short-term loans, line of credit accounts and installment loans are included in “Consumer loans, net” in the consolidated balance sheets. |
Cash and cash equivalents bear interest at market rates and have original maturities of less than 90 days.
Short-term loans, line of credit accounts and installment loans are carried in the consolidated balance sheet net of the allowance for estimated loan losses, which is calculated by applying historical loss rates combined with recent default trends to the gross consumer loan balance. The unobservable inputs used to calculate the fair value of these loans include historical loss rates, recent default trends and estimated remaining loan terms; therefore, the carrying value approximates the fair value. Short-term loans and line of credit accounts have relatively short maturity periods that are generally 12 months or less. The fair value of installment loans is estimated using a discounted cash flow analysis, which considers interest rates offered for loans with similar terms to borrowers of similar credit quality. The carrying values of the Company’s installment loans approximate the fair value of these loans. Unsecured installment loans typically have terms between two and 12 months, but may have available terms up to 60 months.
In connection with its CSO programs, the Company guarantees consumer loan payment obligations to unrelated third-party lenders for short-term and installment loans the Company arranges for consumers on the third-party lenders’ behalf and is required to purchase any defaulted loans it has guaranteed. The estimated fair value of the liability for estimated losses on consumer loans guaranteed by the Company was $1.4 million, $1.9 million and $2.0 million as of September 30, 2014 and 2013 and December 31, 2013, respectively. The Company measures the fair value of its liability for third-party lender-owned consumer loans under Level 3 inputs. The fair value of these liabilities is calculated by applying historical loss rates combined with recent default trends to the gross consumer loan balance. The unobservable inputs used to calculate the fair value of these loans include historical loss rates, recent default trends and estimated remaining loan terms; therefore, the carrying value of these liabilities approximates the fair value.
The Company measures the fair value of its long-term debt using Level 2 inputs. The fair value of the Company’s long term debt is estimated based on quoted prices in markets that are not active. As of September 30, 2014 and 2013 and December 31, 2013, the Company’s Senior Notes and Affiliate Line of Credit had a higher fair market value than the carrying value due to the difference in yield when compared to similar types of credit.
10. Subsequent Events
The Company evaluates subsequent events through the date of filing this prospectus with the Securities and Exchange Commission (the “SEC”).
F-54
Table of Contents
Board Approval for Enova Spin-off
In April 2014, Cash America announced that its Board of Directors authorized management to review potential strategic alternatives, including a tax-free spin-off, for the separation of the Company. After evaluating separation alternatives for the Company, Cash America’s management recommended that Cash America’s Board of Directors pursue a tax-free spin-off to separate Cash America into two publicly traded companies: Enova International, Inc., which would own and operate Cash America’s online lending business, and Cash America International, Inc. which would own and operate Cash America’s storefront lending businesses. In July 2014, Cash America’s Board of Directors authorized the filing of a Registration Statement on Form 10 with the SEC by the Company in connection with the proposed spin-off.
On October 22, 2014, after receiving a private letter ruling from the Internal Revenue Service, an opinion from Cash America’s tax counsel and a solvency opinion from an independent financial advisor, Cash America’s Board of Directors approved the Spin-off. The distribution occurred at 12:01 am ET on November 13, 2014. Cash America’s shareholders received 0.915 shares of Company common stock for every one share of Cash America common stock held at the close of business November 3, 2014, which is the record date for the Spin-off. Following the distribution of Company common stock in the distribution, the Company became an independent, publicly traded company, and its shares of common stock are listed on the New York Stock Exchange under the symbol “ENVA.”
Long-Term Incentive Awards
On October 16, 2014, the Management Development and Compensation Committee of the Board of Directors of the Company approved long-term incentive awards to be made under the Enova International, Inc. 2014 Long-Term Incentive Plan (the “Enova LTIP”) to its executive officers and certain other employees if the distribution occurs. The awards to be granted in connection with the distribution will include (a) restricted stock units and (b) a special one-time grant of options to purchase Company stock, and these awards will be granted on the 30th day following the distribution date and will vest over a period of four years and three years, respectively. On October 16, 2014, the Company’s Management Development and Compensation Committee also approved an award of restricted stock units under the Enova LTIP with a value of $100,000 for each award to be made to each of the Company’s non-employee directors. These awards will be granted on the 30th day following the distribution date and will vest twelve months from the date of grant. The aggregate value of the awards is estimated to be $18.3 million for the restricted stock unit award and $11.1 million for the stock option award.
F-55
Table of Contents
Table of Contents
PART II
INFORMATION NOT REQUIRED IN PROSPECTUS
| ITEM 13. | OTHER EXPENSES OF ISSUANCE AND DISTRIBUTION. |
The following table sets forth the costs and expenses payable by the registrant in connection with the issuance of the securities being registered. All amounts are estimates except the Securities and Exchange Commission registration fee.
| Item |
Amount | |||
| Securities and Exchange Commission registration fee |
$ | 20,889 | ||
| Legal fees and expenses |
$ | 145,000 | ||
| Accounting fees and expenses |
$ | 65,000 | ||
| Printing expenses |
$ | 115,000 | ||
| Total |
$ | 345,889 | ||
| ITEM 14. | INDEMNIFICATION OF DIRECTORS AND OFFICERS. |
Section 145(a) of the Delaware General Corporation Law, or the DGCL, provides that a Delaware corporation may indemnify any person who was or is a party or is threatened to be made a party to any threatened, pending or completed action, suit or proceeding, whether civil, criminal, administrative or investigative, other than an action by or in the right of the corporation, by reason of the fact that such person is or was a director, officer, employee or agent of the corporation, or is or was serving at the request of the corporation as a director, officer, employee or agent of another corporation, partnership, joint venture, trust or other enterprise, against expenses (including attorneys’ fees), judgments, fines and amounts paid in settlement actually and reasonably incurred by the person in connection with such action, suit or proceeding if the person acted in good faith and in a manner the person reasonably believed to be in or not opposed to the best interests of the corporation, and, with respect to any criminal action or proceeding, had no reasonable cause to believe the person’s conduct was unlawful.
Section 145(b) of the DGCL provides that a Delaware corporation may indemnify any person who was or is a party or is threatened to be made a party to any threatened, pending or completed action or suit by or in the right of the corporation to procure a judgment in its favor by reason of the fact that such person acted in any of the capacities set forth above, against expenses (including attorneys’ fees) actually and reasonably incurred by such person in connection with the defense or settlement of such action or suit if the person acted in good faith and in a manner the person reasonably believed to be in or not opposed to the best interests of the corporation, except that no indemnification shall be made in respect of any claim, issue or matter as to which such person shall have been adjudged to be liable to the corporation, unless and only to the extent that the Court of Chancery or the court in which such action or suit was brought shall determine upon application that, despite the adjudication of liability but in view of all the circumstances of the case, such person is fairly and reasonably entitled to indemnity for such expenses which the court shall deem proper.
The DGCL also provides that indemnification under Section 145(d) can only be made upon a determination that indemnification of the present or former director, officer or employee or agent is proper in the circumstances because such person has met the applicable standard of conduct set forth in Section 145(a) and (b).
Section 145(g) of the DGCL also empowers a corporation to purchase and maintain insurance on behalf of any person who is or was a director, officer, employee or agent of the corporation, or is or was serving at the request of the corporation as a director, officer, employee or agent of another corporation, partnership, joint venture, trust or other enterprise against any liability asserted against such person and incurred by such person in any such capacity, or arising out of such person’s status as such, whether or not the corporation would have the power to indemnify such person against such liability under Section 145 of the DGCL.
II-1
Table of Contents
Section 102(b)(7) of the DGCL permits a corporation to provide for eliminating or limiting the personal liability of one of its directors for any monetary damages related to a breach of fiduciary duty as a director, as long as the corporation does not eliminate or limit the liability of a director for acts or omissions (1) which breached the director’s duty of loyalty to the corporation or its stockholders, (2) which were not in good faith or which involve intentional misconduct or knowing violation of law, (3) under Section 174 of the DGCL, or (4) from which the director derived an improper personal benefit.
Section 145 of the DGCL makes provision for the indemnification of officers and directors in terms sufficiently broad to indemnify officers and directors of each of the registrants incorporated in Delaware under certain circumstances from liabilities (including reimbursement for expenses incurred) arising under the Securities Act of 1933, as amended. Each of the registrants incorporated in Delaware may, in their discretion, similarly indemnify their employees and agents.
Our amended and restated certificate of incorporation, or our certificate of incorporation, provides that a director shall not be liable to us or our stockholders for monetary damages for breach of fiduciary duty as a director to the fullest extent permitted by the DGCL. Our certificate of incorporation also provides that each person who was or is a party or is threatened to be made a party to, or is involved in any threatened, pending or completed action, suit or proceeding, whether civil, criminal, administrative or investigative, by reason of the fact that such person is or was one of our directors, officers employees or agents or is or was serving at our request as a director, officer, employee or agent of another corporation, partnership, joint venture, trust or other enterprise, shall be indemnified and held harmless by us to the fullest extent permitted by the DGCL. This right to indemnification also includes the right to be paid the expenses incurred in connection with any such proceeding in advance of its final disposition to the fullest extent authorized by the DGCL.
Our certificate of incorporation provides that we have the power to purchase and maintain insurance on behalf of any person who is or was a director, officer, employee or agent of ours, or is or was serving at our request as a director, officer, employee or agent of another corporation, partnership, joint venture, trust or other enterprise against any expense, liability or loss incurred by such person in any such capacity or arising out of such person’s status as such, whether or not we would have the power to indemnify such person against such liability under the DGCL. We have obtained directors’ and officer’ insurance to cover our directors and officers for certain liabilities.
| ITEM 15. | RECENT SALES OF UNREGISTERED SECURITIES. |
On May 30, 2014, we issued and sold $500 million in aggregate principal amount of 9.75% Senior Notes due 2021, or the Notes. The Notes bear interest at a rate of 9.75% and were sold at a discount of the principal amount thereof to yield 10.0% to maturity. The Notes were sold to Jefferies LLC, as initial purchaser. The notes were resold to qualified institutional buyers in accordance with Rule 144A under the Securities Act and outside the United States pursuant to Regulation S under the Securities Act.
| ITEM 16. | EXHIBITS AND FINANCIAL STATEMENT SCHEDULES. |
| (a) | Exhibits |
See Exhibit Index.
| (b) | Financial Statement Schedules |
See page F-1 for an index of the financial statements and financial statement schedules included in the Registration Statement.
II-2
Table of Contents
| ITEM 17. | UNDERTAKINGS. |
The undersigned registrant hereby undertakes:
(1) To file, during any period in which offers or sales are being made, a post-effective amendment to this registration statement:
(i) To include any prospectus required by Section 10(a)(3) of the Securities Act of 1933;
(ii) To reflect in the prospectus any facts or events arising after the effective date of the registration statement (or the most recent post-effective amendment thereof) which, individually or in the aggregate, represent a fundamental change in the information set forth in the registration statement. Notwithstanding the foregoing, any increase or decrease in volume of securities offered (if the total dollar value of securities offered would not exceed that which was registered) and any deviation from the low or high end of the estimated maximum offering range may be reflected in the form of prospectus filed with the Commission pursuant to Rule 424(b) if, in the aggregate, the changes in volume and price represent no more than a 20% change in the maximum aggregate offering price set forth in the “Calculation of Registration Fee” table in the effective registration statement;
(iii) To include any material information with respect to the plan of distribution not previously disclosed in the registration statement or any material change to such information in the registration statement.
(2) That, for the purpose of determining any liability under the Securities Act of 1933, each such post-effective amendment shall be deemed to be a new registration statement relating to the securities offered therein, and the offering of such securities at that time shall be deemed to be the initial bona fide offering thereof.
(3) To remove from registration by means of a post-effective amendment any of the securities being registered which remain unsold at the termination of the offering.
(4) That, for the purpose of determining liability under the Securities Act of 1933 to any purchaser, if the registrant is subject to Rule 430C, each prospectus filed pursuant to Rule 424(b) as part of a registration statement relating to an offering, other than registration statements relying on Rule 430B or other than prospectuses filed in reliance on Rule 430A, shall be deemed to be part of and included in the registration statement as of the date it is first used after effectiveness. Provided, however, that no statement made in a registration statement or prospectus that is part of the registration statement or made in a document incorporated or deemed incorporated by reference into the registration statement or prospectus that is part of the registration statement will, as to a purchaser with a time of contract of sale prior to such first use, supersede or modify any statement that was made in the registration statement or prospectus that was part of the registration statement or made in any such document immediately prior to such date of first use.
(5) That, for the purpose of determining liability of the registrant under the Securities Act of 1933 to any purchaser in the initial distribution of the securities:
The undersigned registrant undertakes that in a primary offering of securities of the undersigned registrant pursuant to this registration statement, regardless of the underwriting method used to sell the securities to the purchaser, if the securities are offered or sold to such purchaser by means of any of the following communications, the undersigned registrant will be a seller to the purchaser and will be considered to offer or sell such securities to such purchaser:
(i) Any preliminary prospectus or prospectus of the undersigned registrant relating to the offering required to be filed pursuant to Rule 424;
(ii) Any free writing prospectus relating to the offering prepared by or on behalf of the undersigned registrant or used or referred to by the undersigned registrant;
(iii) The portion of any other free writing prospectus relating to the offering containing material information about the undersigned registrant or its securities provided by or on behalf of the undersigned registrant; and
II-3
Table of Contents
(iv) Any other communication that is an offer in the offering made by the undersigned registrant to the purchaser.
Insofar as indemnification for liabilities arising under the Securities Act of 1933 may be permitted to directors, officers and controlling persons of the registrant pursuant to the foregoing provisions, or otherwise, the registrant has been advised that in the opinion of the Securities and Exchange Commission such indemnification is against public policy as expressed in the Act and is, therefore, unenforceable. In the event that a claim for indemnification against such liabilities (other than the payment by the registrant of expenses incurred or paid by a director, officer or controlling person of the registrant in the successful defense of any action, suit or proceeding) is asserted by such director, officer or controlling person in connection with the securities being registered, the registrant will, unless in the opinion of its counsel the matter has been settled by controlling precedent, submit to a court of appropriate jurisdiction the question whether such indemnification by it is against public policy as expressed in the Act and will be governed by the final adjudication of such issue.
II-4
Table of Contents
SIGNATURES
Pursuant to the requirements of the Securities Act of 1933, the registrant has duly caused this Amendment No. 1 to the registration statement to be signed on its behalf by the undersigned, thereunto duly authorized in the City of Chicago, State of Illinois, on December 4, 2014.
| ENOVA INTERNATIONAL, INC. | ||
| By: |
/s/ David A. Fisher | |
| Name: David A. Fisher | ||
| Title: President and Chief Executive Officer | ||
Table of Contents
Pursuant to the requirements of the Securities Act of 1933, as amended, this Amendment No. 1 to the registration statement has been signed by the following persons in the capacities and on the dates indicated.
| Signature |
Title |
Date | ||
| /s/ David A. Fisher David A. Fisher |
Director, President, Chief Executive Officer and Chairman of the Board (Principal Executive Officer) | December 4, 2014 | ||
| /s/ Robert S. Clifton Robert S. Clifton |
Vice President—Chief Financial Officer and Treasurer (Principal Financial and Accounting Officer) | December 4, 2014 | ||
| /s/ Daniel R. Feehan Daniel R. Feehan |
Director | December 4, 2014 | ||
| * William M. Goodyear |
Director | December 4, 2014 | ||
| * James A. Gray |
Director | December 4, 2014 | ||
| * David C. Habiger |
Director | December 4, 2014 | ||
| * Gregg A. Kaplan |
Director | December 4, 2014 | ||
| * Mark A. Tebbe |
Director | December 4, 2014 | ||
| * By: |
/s/ Robert S. Clifton | |
| Robert S. Clifton | ||
| Attorney-in-fact |
Table of Contents
EXHIBIT INDEX
| Exhibit No. |
Exhibit Description | |
| 2.1 |
Separation and Distribution Agreement between Cash America International, Inc. and Enova International, Inc. (incorporated by reference to Exhibit 2.1 to the Current Report on Form 8-K filed on November 19, 2014) | |
| 3.1 |
Enova International, Inc. Amended and Restated Certificate of Incorporation (incorporated by reference to Exhibit 3.1 to the Current Report on Form 8-K filed on November 19, 2014) | |
| 3.2 |
Enova International, Inc. Amended and Restated Bylaws (incorporated by reference to Exhibit 3.2 to the Current Report on Form 8-K filed on November 19, 2014) | |
| 4.1 |
Specimen common stock certificate (incorporated by reference to Exhibit 4.1 to Amendment No. 2 to the Registration Statement on Form 10 filed on October 2, 2014) | |
| 4.2 |
Form of Stockholder’s and Registration Rights Agreement between Cash America International, Inc. and Enova International, Inc. (incorporated by reference to Exhibit 10.3 to the Current Report on Form 8-K filed on November 19, 2014) | |
| 4.3 |
Indenture, dated May 30, 2014, between Enova International, Inc., the U.S. subsidiaries of Enova International, Inc., as guarantors, and U.S. Bank National Association, as trustee (incorporated by reference to Exhibit 4.3 to the Registration Statement on Form 10 filed on July 31, 2014) | |
| 4.4 |
First Supplemental Indenture, dated as of October 1, 2014, between Enova International, Inc., NC Financial Solutions of Louisiana, LLC, NC Financial Solutions of Montana, LLC, and NC Financial Solutions of Rhode Island, LLC, each, as subsidiary guarantor, and U.S. Bank National Association, as trustee (incorporated by reference to Exhibit 4.4 to Amendment No. 2 to the Registration Statement on Form 10 filed on October 2, 2014) | |
| 5.1 |
Opinion of Hunton & Williams LLP | |
| 10.1 |
Transition Services Agreement between Cash America International, Inc. and Enova International, Inc. (incorporated by reference to Exhibit 10.2 to the Current Report on Form 8-K filed on November 19, 2014) | |
| 10.2 |
Tax Matters Agreement between Cash America International, Inc. and Enova International, Inc. (incorporated by reference to Exhibit 10.1 to the Current Report on Form 8-K filed on November 19, 2014) | |
| 10.3 |
Software Lease and Maintenance Agreement between Cash America International, Inc. and Enova International, Inc. (incorporated by reference to Exhibit 10.4 to the Current Report on Form 8-K filed on November 19, 2014) | |
| 10.4 |
Enova International, Inc. 2014 Long-Term Incentive Plan (incorporated by reference to Exhibit 10.1 to the Quarterly Report on Form 10-Q filed on November 14, 2014) | |
| 10.5 |
Enova International, Inc. Supplemental Executive Retirement Plan (incorporated by reference to Exhibit 10.5 to the Registration Statement on Form 10 filed on July 31, 2014) | |
| 10.6 |
Enova International, Inc. Nonqualified Savings Plan (incorporated by reference to Exhibit 10.6 to the Registration Statement on Form 10 filed on July 31, 2014) | |
| 10.7 |
Continued Employment and Separation Agreement between Enova Financial Holdings, LLC, a subsidiary of the Company, and Timothy S. Ho dated January 29, 2013 (incorporated by reference to Exhibit 10.7 to the Registration Statement on Form 10 filed on July 31, 2014) | |
| 10.8 |
Letter Agreement by and among Springleaf Holdings, Inc., Timothy S. Ho and Enova Financial Holdings, LLC dated January 7, 2014 (incorporated by reference to Exhibit 10.8 to the Registration Statement on Form 10 filed on July 31, 2014) | |
Table of Contents
| Exhibit No. |
Exhibit Description | |
| 10.9 |
Registration Rights Agreement, dated May 30, 2014, between Enova International, Inc., the U.S. subsidiaries of Enova International, Inc., and Jefferies LLC (incorporated by reference to Exhibit 10.9 to the Registration Statement on Form 10 filed on July 31, 2014) | |
| 10.10 |
Credit Agreement, dated as of May 14, 2014, by and among Enova International, Inc., as borrower, the U.S. subsidiaries of Enova International, Inc., as guarantors, Jefferies Finance LLC, as administrative agent, and Jefferies Group LLC, as lender (incorporated by reference to Exhibit 10.10 to the Registration Statement on Form 10 filed on July 31, 2014) | |
| 10.11 |
Lease Agreement, dated July 25, 2014, between 175 Jackson L.L.C. and Enova International, Inc. (incorporated by reference to Exhibit 10.11 to Amendment No. 4 to the Registration Statement on Form 10 filed on October 22, 2014) | |
| 10.12 |
Form of Enova International, Inc. Severance Pay Plan for Executives (incorporated by reference to Exhibit 10.12 to Amendment No. 2 to the Registration Statement on Form 10 filed on October 2, 2014) | |
| 10.13 |
Form of Enova International, Inc. Senior Executive Bonus Plan (incorporated by reference to Exhibit 10.13 to Amendment No. 2 to the Registration Statement on Form 10 filed on October 2, 2014) | |
| 10.14 |
Summary of 2014 Terms and Conditions of the Enova International, Inc. Short-Term Incentive Plan (incorporated by reference to Exhibit 10.14 to Amendment No. 2 to the Registration Statement on Form 10 filed on October 2, 2014) | |
| 10.15 |
Enova International, Inc. Executive Change-in-Control Severance and Restrictive Covenant Agreement for Chief Executive Officer (incorporated by reference to Exhibit 10.1 to the Current Report on Form 8-K filed on November 19, 2014) | |
| 10.16 |
Form of Enova International, Inc. Executive Change-in-Control Severance and Restrictive Covenant Agreement for Executive Officers (incorporated by reference to Exhibit 10.2 to the Current Report on Form 8-K filed on November 19, 2014) | |
| 10.17 |
Form of Enova International, Inc. 2014 Long-Term Incentive Plan Award Agreement for Special Grant of Restricted Stock Units for Directors (incorporated by reference to Exhibit 10.17 to Amendment No. 3 to the Registration Statement on Form 10 filed on October 17, 2014) | |
| 10.18 |
Form of Enova International, Inc. 2014 Long-Term Incentive Plan Award Agreement for Grant of Restricted Stock Units (for Officers) (incorporated by reference to Exhibit 10.18 to Amendment No. 3 to the Registration Statement on Form 10 filed on October 17, 2014) | |
| 10.19 |
Form of Enova International, Inc. 2014 Long-Term Incentive Plan Award Agreement for Special Grant of Nonqualified Stock Option with a Limited Stock Appreciation Right (for Officers) (incorporated by reference to Exhibit 10.19 to Amendment No. 3 to the Registration Statement on Form 10 filed on October 17, 2014) | |
| 10.20 |
Cash America International, Inc. 1994 Long-Term Incentive Plan (incorporated by reference to Exhibit 10.5 to Cash America International, Inc.’s Form 10-K filed on March 29, 1995) | |
| 10.21 |
Cash America International, Inc. First Amended and Restated 2004 Long-Term Incentive Plan, as amended (the “CSH LTIP”) (incorporated by reference to Exhibit 10.1 to Cash America International, Inc.’s Form 8-K filed on April 28, 2009) | |
| 10.22 |
Amendment to the CSH LTIP dated May 18, 2011 (incorporated by reference to Exhibit 10.2 to Cash America International, Inc.’s Form 10-Q filed on July 22, 2011) | |
| 10.23 |
Second Amendment to the CSH LTIP dated May 24, 2012 (incorporated by reference to Exhibit 10.2 to Cash America International, Inc.’s Form 10-Q filed on July 27, 2012) | |
Table of Contents
| Exhibit No. |
Exhibit Description | |
| 10.24 |
Cash America International, Inc. 2014 Long-Term Incentive Plan (incorporated by reference to Appendix A to Cash America International, Inc.’s proxy statement on Form DEF 14A filed on April 11, 2014) | |
| 21.1 |
Subsidiaries of Enova International, Inc.* | |
| 23.1 |
Consent of PricewaterhouseCoopers LLP | |
| 23.2 |
Consent of Hunton & Williams LLP (included in Exhibit 5.1) | |
| 24.1 |
Power of Attorney (included on signature page)* | |
| * | Previously filed. |