Attached files
| file | filename |
|---|---|
| EX-23.1 - EX-23.1 - Avaya Holdings Corp. | d784146dex231.htm |
Table of Contents
As filed with the Securities and Exchange Commission on December 5, 2014
Registration No. 333-174801
UNITED STATES
SECURITIES AND EXCHANGE COMMISSION
Washington, D.C. 20549
Amendment No. 7
to
Form S-1
REGISTRATION STATEMENT
UNDER
THE SECURITIES ACT OF 1933
AVAYA HOLDINGS CORP.
(Exact name of registrant as specified in its charter)
| Delaware | 3661 | 26-1119726 | ||
| (State or other jurisdiction of incorporation or organization) |
(Primary Standard Industrial Classification Code Number) |
(I.R.S. Employer Identification No.) |
4655 Great America Parkway
Santa Clara, California 95054
(908) 953-6000
(Address, including zip code, and telephone number, including area code, of registrant’s principal executive offices)
Amy Fliegelman Olli
Senior Vice President and General Counsel
Avaya Holdings Corp.
4655 Great America Parkway
Santa Clara, California 95054
(908) 953-6000
(Name, address, including zip code, and telephone number, including area code, of agent for service)
With copies to:
| Julie H. Jones, Esq. Thomas Holden, Esq. Ropes & Gray LLP |
Daniel J. Zubkoff, Esq. Douglas S. Horowitz, Esq. Cahill Gordon & Reindel LLP 80 Pine Street New York, NY 10005 Telephone (212) 701-3000 Fax (212) 269-5420 |
Approximate date of commencement of proposed sale to public: As soon as practicable after this Registration Statement becomes effective.
If any of the securities being registered on this Form are to be offered on a delayed or continuous basis pursuant to Rule 415 under the Securities Act of 1933 check the following box. ¨
If this Form is filed to register additional securities for an offering pursuant to Rule 462(b) under the Securities Act, please check the following box and list the Securities Act registration statement number of the earlier effective registration statement for the same offering. ¨
If this Form is a post-effective amendment filed pursuant to Rule 462(c) under the Securities Act, check the following box and list the Securities Act registration statement number of the earlier effective registration statement for the same offering. ¨
If this Form is a post-effective amendment filed pursuant to Rule 462(d) under the Securities Act, check the following box and list the Securities Act registration statement number of the earlier effective registration statement for the same offering. ¨
Indicate by check mark whether the registrant is a large accelerated filer, an accelerated filer, a non-accelerated filer, or a smaller reporting company. See the definitions of “large accelerated filer,” “accelerated filer” and “smaller reporting company” in Rule 12b-2 of the Exchange Act. (Check one):
| Large accelerated filer | ¨ | Accelerated filer | ¨ | |||||||
| Non-accelerated filer | x | (Do not check if a smaller reporting company) | Smaller reporting company | ¨ | ||||||
The Registrant hereby amends this Registration Statement on such date or dates as may be necessary to delay its effective date until the Registrant shall file a further amendment which specifically states that this Registration Statement shall thereafter become effective in accordance with Section 8(a) of the Securities Act of 1933, as amended, or until the Registration Statement shall become effective on such date as the Securities and Exchange Commission, acting pursuant to said Section 8(a), may determine.
Table of Contents
The information in this preliminary prospectus is not complete and may be changed. These securities may not be sold until the registration statement filed with the Securities and Exchange Commission is effective. This preliminary prospectus is not an offer to sell these securities and it is not soliciting an offer to buy these securities in any jurisdiction where the offer or sale is not permitted.
PROSPECTUS (Subject to Completion)
Issued December 5, 2014
Shares

COMMON STOCK
Avaya Holdings Corp. is offering shares of its common stock. This is the initial public offering of shares of our common stock and no public market currently exists for our shares. We expect the initial public offering price of our common stock to be between $ and $ per share.
After the completion of this offering, funds affiliated with our Sponsors (as defined herein) will continue to own a majority of the voting power of our outstanding common stock. As a result, we expect to be a “controlled company” within the meaning of the corporate governance standards of the New York Stock Exchange. See “Principal Stockholders.”
We have applied to list our common stock on the New York Stock Exchange under the symbol “AVYA.”
Investing in our common stock involves a high degree of risk. See “Risk Factors” beginning on page 18.
PRICE $ A SHARE
| Public Offering Price |
Underwriting |
Proceeds to Avaya | ||||
| Per Share |
$ | $ | $ | |||
| Total |
$ | $ | $ |
We have granted the underwriters the right to purchase up to an additional shares of common stock for a period of 30 days.
Neither the Securities and Exchange Commission nor any other regulatory body has approved or disapproved of these securities or passed upon the accuracy or adequacy of this prospectus. Any representation to the contrary is a criminal offense.
The underwriters expect to deliver the shares to purchasers on , 2014.
| MORGAN STANLEY | GOLDMAN, SACHS & CO. | J.P. MORGAN |
| CITI | DEUTSCHE BANK SECURITIES | |
| BofA MERRILL LYNCH | BARCLAYS UBS INVESTMENT BANK | CREDIT SUISSE | ||
, 2014
Table of Contents

Table of Contents

Table of Contents
Table of Contents
We have not authorized anyone to provide any information or to make any representations other than those contained in this prospectus or in any free writing prospectuses we file with the Securities and Exchange Commission, or the SEC. We take no responsibility for, and can provide no assurance as to the reliability of, any other information that others may give you. This prospectus is an offer to sell only the shares offered hereby, but only under circumstances and in jurisdictions where it is lawful to do so. The information contained in this prospectus is current only as of its date.
Until , (25 days after the commencement of this offering), all dealers that buy, sell or trade shares of our common stock, whether or not participating in this offering, may be required to deliver a prospectus. This delivery requirement is in addition to the obligation of dealers to deliver a prospectus when acting as underwriters and with respect to their unsold allotments or subscriptions.
For investors outside the United States: we have not and the underwriters have not done anything that would permit this offering or possession or distribution of this prospectus in any jurisdiction where action for that purpose is required, other than in the United States. Persons outside the United States who come into possession of this prospectus must inform themselves about, and observe any restrictions relating to, the offering of the shares of common stock and the distribution of this prospectus outside the United States.
When we use the terms “we,” “us,” “our,” “Avaya” or the “Company,” we mean Avaya Holdings Corp., a Delaware corporation, and its consolidated subsidiaries, including Avaya Inc., our principal U.S. operating subsidiary, taken as a whole, unless the context otherwise indicates.
Avaya Aura®, AvayaLive, Avaya Scopia® and other trademarks or service marks of Avaya are the property of Avaya Holdings Corp. and/or its affiliates. This prospectus also contains additional tradenames, trademarks or service marks belonging to us and to other companies. We do not intend our use or display of other parties’ trademarks, tradenames or service marks to imply, and such use or display should not be construed to imply, a relationship with, or endorsement or sponsorship of us by, these other parties.
i
Table of Contents
This summary highlights information contained elsewhere in this prospectus. This summary does not contain all of the information you should consider before investing in our common stock. You should read this entire prospectus carefully, especially the “Risk Factors” section of this prospectus and our Consolidated Financial Statements and related notes appearing at the end of this prospectus, before making an investment decision. This summary contains forward-looking statements that involve risks and uncertainties. Our actual results may differ significantly from the results discussed in the forward-looking statements as a result of certain factors, including those set forth in “Risk Factors” and “Special Note Regarding Forward-Looking Statements.”
Our Company
Avaya is a leading provider of contact center, unified communications and networking products and services designed to help enterprise and midmarket businesses increase workforce productivity, customer engagement, and customer lifetime value, with the ultimate objective of higher revenue and profitability for our customers. Through September 30, 2014, we had over 300,000 customers, including over 95% of the Fortune 500, with installations in over one million customer locations worldwide.
Our products and services portfolio spans software, hardware, professional and support services, and cloud services. These fall under three reporting segments:
| • | Global Communications Solutions, or GCS, encompass all of our real-time collaboration, contact center and unified communications software and hardware. Unified communications integrates real-time communication services including telephony, e-mail, instant messaging and video. Examples in GCS include audio conferencing systems; mobile video software, software that runs contact center operations such as call routing; software that enables mobile access to the company network for employees; and hardware such as phones, gateways, and servers. This reporting segment also includes a development platform, which allows our customers and third parties to adapt our technology by creating custom applications, workflows, and environments for their unique needs and allows them to integrate Avaya’s capabilities into their existing infrastructure. GCS also includes cloud-supporting software and hardware products, which make it possible to use our contact center and unified communications products via the cloud. |
| • | Avaya Networking includes our advanced fabric networking technology which offers a virtualized network designed to be simple to deploy, agile and resilient. This reporting segment also includes products such as Ethernet switches and routers; wireless networking; and access control products that enforce role- and policy- based access to the network. Our fabric networking technology is flexible and extensible to legacy network systems, which gives customers the option to upgrade to new contact center and unified communications technology while maintaining their existing infrastructure, if desired. |
| • | Avaya Global Services, or AGS, includes professional and support services designed to help our customers maximize the benefits of using our products and technology. Our services include support for implementation, deployment, monitoring, troubleshooting, optimization, and more. This reporting segment also includes our cloud and managed services, which enable customers to take advantage of our technology in a private, hybrid, or public cloud environment. The majority of our revenue in this reporting segment is recurring in nature, based on multi-year services contracts. |
With our products and services, packaged as solutions, we can address the needs of a diverse range of customers, including large multinational enterprises, small and medium-sized businesses, and government organizations. Our customers operate in a broad range of industries, including financial services, manufacturing, retail, transportation, energy, media and communications, healthcare, education and government. We employ a
1
Table of Contents
flexible go-to-market strategy with direct or indirect presence in over 160 countries. As of September 30, 2014, we had approximately 10,800 channel partners and for fiscal 2014, our product revenue from indirect sales through our channel partners represented approximately 75% of our total product revenue.
For fiscal 2014 and 2013, we generated revenue of $4,371 million and $4,578 million, respectively. For fiscal 2014, our total revenue was evenly split between product revenue and services revenue. For fiscal 2013, product revenue represented 51% of our total revenue and services revenue represented 49%. Revenue generated in the United States for fiscal 2014 and 2013 represented 52% and 53% of our total revenue, respectively. For fiscal 2014 and 2013 we had operating income from continuing operations of $197 million and $144 million, respectively. For fiscal 2014 and 2013, we had Adjusted EBITDA of $898 million and $922 million, respectively. See “Management’s Discussion and Analysis of Financial Condition and Results of Operations: EBITDA and Adjusted EBITDA” for a definition and explanation of Adjusted EBITDA and a reconciliation of net loss to Adjusted EBITDA.
Industry Background
As enterprise and midmarket businesses increasingly seek to improve customer experience and team engagement through the quality and efficiency of contact center and unified communications, they are confronted with several industry trends presenting emerging and varied challenges. We believe the most forceful among these trends are:
| • | the increasing mobility of the workforce; |
| • | shifting priorities of C-level business decision makers, including an increased preference for software-defined networking (SDN, or network virtualization), cloud delivery of applications, and management of multiple and varied devices, all of which must be handled with the security the business demands; |
| • | increasing demand for IT purchases under operating expense models over capital expense models; and |
| • | the rise of omni-channel customer service involving multiple modes of communications. |
We believe that the total available market for customer and team engagement solutions includes spending on unified communications, contact center applications and networking infrastructure equipment, as well as spending on one-time and recurring professional, managed/cloud, and support services to implement, maintain and manage these tools. We believe that in 2015, the portion of these markets that Avaya serves will have grown to approximately $60 billion of vendor spending, with approximately $36 billion of that amount coming from enterprises having 5,000 or more employees. In aggregate, we see unified communications accounting for $16 billion, contact center accounting for $4 billion, data networking infrastructure accounting for $18 billion and support, managed/cloud and professional recurring services accounting for the remaining $22 billion. These markets are impacted positively by the need for enterprises to increase productivity and upgrade their unified communications strategy to a more integrated approach, accounting for mobility, varied devices, and multiple communications channels. In response to this need, industry analysts expect that from 2014 through 2017 aggregate spending on unified communications, contact center, data networking and support, managed/cloud and professional services will grow.
Furthermore, the midmarket, which we define as companies with fewer than 5,000 employees, is a growing opportunity for Avaya’s products and services. We believe our communications market opportunity for the portion of the midmarket segment which Avaya serves is approximately $24 billion. Not only do we believe this segment is growing, but we believe it is underserved and willing to invest in IT enhancements. Avaya has a set of offerings that are specifically designed to address the needs of midmarket businesses, built around our Avaya IP Office, software and hardware designed to simplify processes and streamline information exchange within companies. It lets midmarket companies deliver a collaboration experience that integrates voice, video, and mobile device communications, at price points affordable to midmarket businesses.
2
Table of Contents
Our Solutions
We aim to be the leader in our industry in addressing the resulting customer needs and priorities in light of industry trends and emerging challenges. We have invested in open, mobile enterprise communication and collaboration platforms and are well poised to serve a broad range of needs, from servicing old phone systems to deploying leading edge call center technology via the cloud. While we remain committed to our legacy capabilities and the customers who rely on them, in the past several years we have also responded to the emerging landscape by evolving our market and product approach in three important ways.
| • | We have invested in research and development and new technologies to develop and provide more comprehensive contact center, unified communications, and networking products and services, continuing our focus on the enterprise while expanding the value we can provide to midmarket customers. |
| • | We have evolved our product design philosophy, anticipating demand for products that are cloud- and mobile- enabled. We also design our products to be flexible, extensible, secure and reliable. This allows our customers to transition from old communications and collaboration technology to newer technology in a way that is manageable and cost-effective. |
| • | We have increased our focus on packaging our products and services into “solutions” including Customer Engagement Solutions, Team Engagement Solutions and Networking Solutions. |
Avaya’s solutions are combinations of our products and services designed to help our customers address their customer and team engagement needs, before, during and after any transition they may make to a mobile- and cloud-enabled communications environment. We believe our unified communications, contact center, and networking technology can increase productivity and profitability for businesses of all sizes.
Customer Engagement Solutions
Our Customer Engagement Solutions are designed to facilitate long-lasting and successful relationships between companies and their customers. The objective is to increase customer lifetime value, revenue, and profitability for our customers – even as they evolve to integrate more communications channels and mobile devices into their customer service strategies. These solutions are predominately made up of our contact center products and services, and supported by our networking technology and development environment. Some of the benefits of Avaya Customer Engagement Solutions include:
| • | Improved customer experience: As businesses increasingly compete on customer experience, we offer products and services designed to incorporate multiple channels of communication, improve customer satisfaction and retention; increase referrals and customer acquisition; and increase cross-sell and upsell opportunities. For example, our intelligent routing and multi-modal integration software can help an enterprise or midmarket business deliver a seamless ongoing conversation with a customer, even if that conversation includes interactions by phone, chat, email, and social media. Our products and services are designed to drive consistency and increased satisfaction across touch points and enable better measurement of customer experience data for dispersion to other business units. |
| • | Contact center efficiency: We believe the contact center is at the heart of a successful customer engagement solution because it is a primary channel of communication between the customer and businesses, even as modes of contact expand to include social media, chat, and mobile apps. Our products and services are designed to help our customers achieve contact center efficiency through automation, by reducing operational costs and staffing impacts, eliminating resource constraints caused by repetitive requests and manual processes, and ensuring service level agreements as well as compliance requirements. For example, we might deploy our contact center platform with intelligent call routing and contact flow analytics software to help a customer better manage volume fluctuations and better match contact center resources to customer needs in real-time. |
3
Table of Contents
| • | Revenue growth: Our solutions are designed to help our customers increase revenue through stronger and longer lasting customer relationships. We believe our solutions address this challenge by reducing complexity within the contact center and facilitating better sell-through, sell-in and sell-up performance. For example, we might deploy our Avaya Customer Experience Portal with software for proactive consumer outreach, to help a customer increase the efficiency and effectiveness of increasing repeat purchases and order sizes, while allowing the customer’s end-consumer to use his or her preferred communications channel for the interaction. |
Team Engagement Solutions
Avaya Team Engagement Solutions are designed to offer businesses the simplicity of a single solution to address workforce communication and collaboration needs, including via mobile devices. These solutions are made up predominately of our real-time collaboration and unified communications products and services, and supported by our networking technology and development environment. Some of the benefits of Avaya Team Engagement Solutions include:
| • | Communications modernization: Avaya helps modernize communications ecosystems by centralizing, consolidating and virtualizing underlying technology infrastructures and making applications available via the cloud. This model is designed to account for mobile device usage, reduce total cost of ownership, or TCO, for the entire collaboration environment and allow firms to transition from a capital expenditure to operating expenditure model. For example, an Avaya private cloud solution can be implemented to integrate virtualized voice, email, video, messaging, chat and conferencing capabilities. This enables cloud access to communications tools for desk-based and remote workers and improves security, delivering TCO efficiencies and rapid payback. |
| • | Worker productivity: Our conferencing, messaging, and other unified communications products and services are designed to help our customers integrate products that equally support desk-workers, teleworkers, and frequent business travelers, thereby increasing the mobility and productivity of their workforce. Our customers are increasingly demanding that individual workers be able to communicate across device types, channels and geographic locations knowing that their devices, data and connections are reliable and secure. For example, our customers using the Avaya Session Border Control can securely extend the corporate unified communications capabilities to a remote user on a mobile device and to desk phones in their remote and home offices. |
| • | Team productivity: Our unified communications products and services are designed to help our customers improve team productivity by diminishing the complexity of team collaboration channels, enabling off-the-shelf and customizable application integration, providing omni-channel conferencing across audio, web, and video for room, desktop, and mobile platforms. It also provides the opportunity to simplify and expand by moving conferencing services into the cloud. For example, the Avaya Scopia platform can enable employees or remote workers to collaborate using high-definition, secure video conferencing accessed through on-premise conference rooms, desktop systems, and mobile devices. |
Networking Solutions
Our advanced fabric networking technology, based on open industry standards, is designed to deliver a virtualized network that is simple to deploy, agile to operate, and resilient. Many conventional networking technologies have complex architectures, layering protocols over protocols, making the network architecture fragile and significantly impeding the roll-out of real-time applications. Avaya’s Fabric Connect, our fabric networking technology, is designed to deliver the agility businesses need to focus on integrating customer and team engagement solutions into their existing IT infrastructures. Unified access and network virtualization capabilities form the foundation of Avaya Networking Solutions. Benefits include:
| • | Unified access: Our unified access solution is designed to securely extend both fixed and mobile “bring-your-own-device (BYOD)” policies and enable proactive provisioning, quality monitoring, and active application awareness and control. |
4
Table of Contents
| • | Network virtualization: Our network virtualization solutions are designed to optimize the physical network, decrease network complexity, eliminate complex protocols, and integrate security features for the safe segmentation of data. All of this is intended to accelerate application and user deployment. |
Our Competitive Strengths
We believe the following competitive strengths position us well to capitalize on the opportunities created by the market trends affecting our industry.
Leading position across our key end markets
We are a leader in business collaboration and communications, with leading market share in worldwide telephony systems1, contact center infrastructure2, voice maintenance services3 and enterprise messaging4, and a position in the Leader’s quadrant in each of Gartner’s Magic Quadrants for Corporate Telephony, Unified Communications and Contact Center Infrastructure5. Additionally, we believe we are a leading provider of cloud and managed services, which in fiscal 2014 grew revenues 19 percent over fiscal 2013 and has continued to be one of the fastest growing areas of our business. We also believe that our market leadership and our incumbent position within our customer base better enables us to cross-sell to existing customers and win new customers.
Open standards technology that supports multi-vendor environments
Our open standards-based technology is designed to accommodate customers with multi-vendor environments seeking to leverage existing investments. Providing enterprises with strong integration capabilities allows them to take advantage of new collaboration and contact center technology as it is introduced. It does not limit customers to a single vendor or add to the backlog of integration work. We also continue to invest in our developer ecosystem, Avaya DevConnect, which has grown to include over 24,000 members as of September 30, 2014. We believe Avaya DevConnect, together with our Agile Communication Environment, or ACE, toolkits, application programming interfaces, or APIs, and integration environments allow businesses to derive unique value from our architecture.
Leading service capabilities tied to a large recurring revenue stream
Avaya Global Services, or AGS, is a leading provider of recurring support services relating to business collaboration and communications products. Our worldwide services-delivery infrastructure and capabilities help
| 1 | Dell’Oro Group, Enterprise Telephony Report, 4Q13, March, 2014 |
| 2 | Gartner Inc. Market Share, Contact Center: Worldwide, 2013, Drew Kraus, 2014. Gartner ranks Avaya the leader in Contact Center Agent End-User Revenue by Manufacturer, Worldwide in 2013. |
| 3 | IntelliCom Analytics, Services Market Dashboard, Q4 2013 Global Lifecycle Services Market Workbook, June 2014. |
| 4 | T3i Group, InfoTrack for converged Applications, Messaging Systems Shipments, Revenue &Market Share Details, Full Year 2013, June 2014. |
| 5 | Gartner Magic Quadrants-Gartner Magic Quadrant for Corporate Telephony, Sorell Slaymaker, et al, October, 2014. |
- Gartner Magic Quadrant for Unified Communications, Bern Elliot et al, August 2014.
- Gartner Magic Quadrant for Contact Center Infrastructure, Drew Kraus, et al, May 2014.
Gartner, Inc. (Gartner) does not endorse any vendor, product or service depicted in our research publications, and does not advise technology users to select only those vendors with the highest ratings. Gartner research publications consist of the opinions of Gartner’s research organization and should not be construed as statements of fact. Gartner disclaims all warranties, expressed or implied, with respect to this research, including any warranties of merchantability or fitness for a particular purpose.
The Gartner Report(s) described herein, (the Gartner Report(s)) represent(s) data, research opinion or viewpoints published, as part of a syndicated subscription service, by Gartner, Inc. (Gartner), and are not representations of fact. Each Gartner Report speaks as of its original publication date (and not as of the date of this prospectus) and the opinions expressed in the Gartner Report(s) are subject to change without notice.
5
Table of Contents
customers address critical business collaboration and communications needs from initial planning and design through implementation, maintenance and day-to-day operation, monitoring and troubleshooting. We believe AGS is uniquely positioned as a result of close collaboration between our R&D and service planning teams in advance of new products being released. Customers can use “Ava”, our virtual agent, to get immediate answers online. They can also connect with one of our experts via web chat, web talk, or web video. Avaya Global Services can also directly access our research and development teams when necessary to quickly resolve customer issues. These capabilities allow Avaya to provide quality service for Avaya products.
In addition, AGS delivers cloud and managed services with a focus on customer performance and growth. These services can range from managing software releases to operating customer communication systems to helping customers migrate to next-generation business collaboration and communications environments. We believe that our deep understanding of application management supporting unified communications, contact center, video and networking uniquely position us to best manage and operate cloud-based communications systems for our customers.
Our service delivery is most often provided to customers through recurring contracts. In fiscal 2014, we generated 50% of our revenues from services with over 80% of service revenues from recurring contracts. Recurring contracts for support services typically have terms that range from one to five years, and contracts for cloud and managed services typically have terms that range from one to seven years. In fiscal 2014, the U.S. accounted for approximately 64% of our support revenue, with contract renewal rates of more than 83%. We believe our services relationships have provided us with a large recurring revenue base and significant visibility into our customers’ future collaboration needs.
Lower total cost of ownership (TCO)
Many vendors try to address customer demands by layering on more architectures and protocols. In the process, they frequently sacrifice simplicity, flexibility and total cost of ownership. In contrast, our products and services are specifically designed to address these needs - typically with less hardware - without sacrificing performance. We believe our product performance, deployment methods, and networking technology contribute to a lower total cost of ownership for customer and team engagement solutions.
Large, diverse and global customer installed base
Our products and services address the needs of a diverse range of customers from large multinational enterprises to small and medium-sized businesses in various industries, including financial services, manufacturing, retail, transportation, energy, media and communications, health care, education and government. Through September 30, 2014, we had over 300,000 customers, including over 95% of the Fortune 500 with installations in over one million customer locations worldwide. We believe our large and diverse customer base provides us with recurring revenue and the opportunity to further expand within our customer base.
Our Growth Strategy
We believe we are well-positioned worldwide and have a multi-faceted strategy to be a leading provider in delivering engagement and networking solutions.
Expand our cloud offerings and capabilities
In our experience, technology and business leaders are increasingly turning to cloud-based technologies and business models that allow enterprises to cut costs, increase productivity, simplify IT environments, and shift when possible to usage-based operating expense models.
6
Table of Contents
Avaya’s technologies that make up our Customer Engagement, Team Engagement, and Networking solutions are designed to be available both on-premise and as a cloud-based service to meet these demands.
Increase mobility offerings to customers
As global workforces change and demand mobile engagement solutions, we intend to meet these demands. For example, the Avaya Aura Platform is designed to support mobility, providing dynamic access to applications and services based on need, not location.
Invest in open standards and product differentiation and innovation
As potential customers look to migrate to our products and services, our open architecture can integrate with competitor systems and provide a path for gradual transition while still achieving cost savings and improved functionality. Our Fabric Networking technology is fundamental to this approach. Fabric networking represents a strong growth area for Avaya, as fabric networking deployments gain momentum.
During fiscal 2014, we delivered a total of 114 new product releases, which is more than 10% above the level from fiscal 2013. We also expect to continue to make investments in product innovation and research and development across the portfolio to create enhancements and breakthroughs. We believe this will encourage customers to upgrade their products more frequently. We also plan to continue to embrace the cloud computing and mobility opportunities, and to seek new ways to leverage the Virtual Desktop Integration, or VDI, trend to securely deliver business collaboration to users.
Increase our midmarket offerings, capabilities, and market share
We believe our communications market opportunity for the portion of the midmarket segment which Avaya serves is approximately $24 billion. We define the midmarket as firms with fewer than 5,000 employees. Not only do we believe this segment is growing, but we believe midmarket businesses are underserved and willing to invest in IT enhancements. With the most recent version of our IP Office product, version 9.0, we developed our first complete offering specifically tailored to the needs of midmarket businesses. We believe this offering increases the value we can provide to midmarket businesses and creates an opportunity for market share gain. During fiscal 2014, we made over 300 new strategic hires to key front line sales, specialist, and support roles to increase reach and accelerate our growth, particularly in the midmarket. We intend to continue to invest in our midmarket offerings and go-to-market resources to increase market share and meet the growing demands of this segment.
Increase sales to existing customers and pursue new customers
We believe that we have a significant opportunity to increase our sales to our existing customers by offering new solutions from our diverse product portfolio, including cloud, mobility, and networking solutions. This ability is supported by our market leadership, global scale and extensive customer interaction, including at the C-suite, and creates a strong platform from which to drive and shape the evolution of enterprise communications toward greater business collaboration. Our track record with our customers gives us the credibility that we believe provides us with a competitive advantage in helping them cope with this evolution.
Invest in sales and distribution capabilities
Our flexible go-to-market strategy, which consists of both a direct sales force and approximately 10,800 channel partners (as of September 30, 2014), allows us to reach customers across industries and around the globe while allowing them to interact with Avaya in a way that fits their organization. We intend to continue investing in our channel partners and sales force to optimize their market focus, enter new geographies and provide our channel partners with training, marketing programs, and technical support through our Avaya Connect program.
7
Table of Contents
We also leverage our sales and distribution channels to accelerate customer adoption and generate an increasing percentage of our revenue from our new high-value software products, data networking, video collaboration, midmarket offerings, and user experience-centric applications.
Expand margins and profitability
We have maintained our focus on profitability levels and implemented a number of cost savings initiatives. These initiatives, along with decreases in the amortization of acquired technology intangible assets, have contributed to improvements in our gross margin. Our gross margin has improved from 43.5% in fiscal 2010 to 57.2% in fiscal 2014. This improvement in gross margin along with other cost savings is also reflected in Adjusted EBITDA, a key metric management uses to evaluate the Company’s performance. Adjusted EBITDA as a percentage of revenues improved from 15.6% in fiscal 2010 to 20.5% in fiscal 2014. See “Management’s Discussion and Analysis of Financial Condition and Results of Operations: EBITDA and Adjusted EBITDA” for a definition and explanation of Adjusted EBITDA and a reconciliation of loss from continuing operations to Adjusted EBITDA.
We expect to pursue additional cost reduction opportunities which are likely to be more targeted and may include increased automation of our processes, headcount attrition, actions to address unproductive assets, real estate consolidation, sales back office and front line skill transformations, and balancing our professional services structure. Having delivered substantial cost structure reductions over the past several years, we believe the opportunities for additional savings and execution of our growth strategy can result in further margin and profitability expansion.
Risks Associated with Our Company
Our business is subject to a number of risks of which you should be aware before making an investment decision. These risks are discussed more fully in the “Risk Factors” section of this prospectus immediately following this prospectus summary. These risks include, but are not limited to, the following:
| • | Our revenues are dependent on general economic conditions and the willingness of enterprises to invest in technology. The impact of economic conditions on the willingness of enterprises to make capital investments, particularly in business collaboration technology and related services can significantly affect our operating results and we believe that enterprises continue to be cautious about sustained economic growth. |
| • | The market opportunity for business collaboration products and services may not develop in the ways that we anticipate. The demand for our products and services can change quickly and in ways that we may not anticipate because the market in which we operate is characterized by rapid, and sometimes disruptive, technological developments, evolving industry standards, frequent new product introductions and enhancements, changes in customer requirements and a limited ability to accurately forecast future customer demand. |
| • | We are dependent on our intellectual property. As a leader in technology and innovation in business collaboration and communications, we are dependent on the maintenance of our current intellectual property rights and the establishment of new intellectual property rights. If we are not able to protect our intellectual property rights or if those rights are invalidated or circumvented, our business may be adversely affected. |
| • | Our degree of leverage could adversely affect our ability to raise additional capital to fund our operations and limit our ability to react to changes in the economy or our industry. Our degree of leverage could have important consequences, including making it more difficult for us to make payments on our indebtedness and increasing our vulnerability to general economic and industry conditions. |
8
Table of Contents
| • | We face formidable competition from providers of unified communications, contact center and networking products and services; as these markets evolve, we expect competition to intensify. In addition to the competition we face from traditional enterprise voice communications products and providers of technology related to business collaboration and contact center products and services, we expect competition to intensify and expand to include companies that do not currently compete directly against us. |
| • | The Sponsors have significant influence over corporate transactions. Following the completion of this offering, funds affiliated with TPG Global LLC, or, together with its affiliates, TPG, and Silver Lake Partners, or Silver Lake, which are collectively referred to as our Sponsors, will have the ability to control the outcome of matters submitted for stockholder approval and may have interests that differ from those of our other stockholders. |
| • | We expect to be a “controlled company” within the meaning of the rules of the New York Stock Exchange. After completion of this offering, the Sponsors will continue to control a majority of the voting power of our outstanding common stock. As a result, we will qualify for, and intend to rely on, exemptions from certain corporate governance requirements. |
Company Information and Corporate Structure
Our principal executive offices are located at 4655 Great America Parkway, Santa Clara, CA 95054. Our telephone number is (908) 953-6000. Our website address is www.avaya.com. Information contained in, and that can be accessed through, our website is not incorporated into and does not form a part of this prospectus.
Avaya Holdings Corp., formerly known as Sierra Holdings Corp., was incorporated under the laws of the State of Delaware on June 1, 2007 by affiliates of the Sponsors. The Sponsors, through a subsidiary holding company, acquired Avaya Inc., our principal U.S. operating subsidiary, and each of its subsidiaries in a merger transaction that was completed on October 26, 2007, which we refer to in this prospectus as the Merger. Despite the fact that Avaya Inc.’s obligation to file periodic and current reports with the SEC ended on October 1, 2010, it voluntarily files such reports with the SEC to comply with the terms of the indenture governing its senior secured notes. Avaya Holdings Corp. is a holding company with no stand-alone operations and has no material assets other than its ownership interest in Avaya Inc. and its subsidiaries. All of Avaya Holdings Corp.’s operations are conducted through its various subsidiaries, which are organized and operated according to the laws of their jurisdiction of incorporation, and consolidated by Avaya Holdings Corp.
As of September 30, 2014, our total outstanding indebtedness was $6,044 million (excluding capital lease obligations and $21 million of debt discount due upon settlement of our indebtedness), of which $5,035 million was attributable to financing associated with the Merger and $1,009 million was attributable to financing associated with the acquisition of the enterprise business solutions business of Nortel Networks Corporation in 2009. For a complete discussion of our financing see Note 10, “Financing Arrangements,” to our audited Consolidated Financial Statements included elsewhere in this prospectus.
9
Table of Contents
The following chart shows our organizational structure immediately following the consummation of this offering:
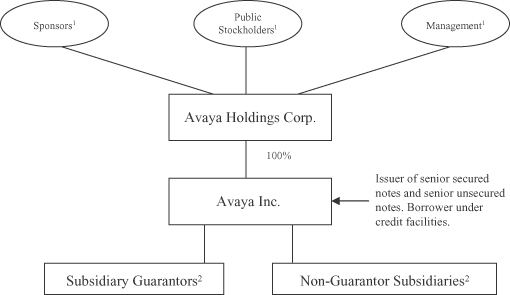
| (1) | Sponsors, public stockholders, and management, represents %, % and % of the total voting power in our company, respectively. |
| (2) | Substantially all of our domestic 100% owned subsidiaries as of September 30, 2014 guarantee our notes and our credit facilities. Other subsidiaries, including non-U.S. subsidiaries, do not guarantee our notes or our credit facilities. See “Description of Certain Outstanding Indebtedness” for more information. |
10
Table of Contents
THE OFFERING
| Common stock we are offering |
Shares | |
| Common stock to be outstanding after this offering |
Shares | |
| Option to purchase additional shares offered to underwriters |
Shares | |
| Use of proceeds |
We intend to use the net proceeds received by us in connection with this offering to pay certain amounts in connection with the termination of our management services agreement with affiliates of our Sponsors. | |
| We intend to use the remainder of the net proceeds, for working capital and other general corporate purposes, including repayment of a portion of our long-term indebtedness, the potential redemption of some or all of our Series A Preferred Stock and supporting our strategic growth opportunities in the future. | ||
| See “Use of Proceeds.” | ||
| Risk factors |
You should carefully read the “Risk Factors” section of this prospectus beginning on page 18 for a discussion of factors to consider carefully before deciding whether to purchase shares of our common stock. | |
| Proposed NYSE symbol |
“AVYA” | |
| Principal Stockholders |
Upon completion of this offering, the Sponsors will continue to beneficially own a controlling interest in us. As a result, we intend to avail ourselves of the “controlled company” exemption under the rules of the NYSE. | |
| In connection with this offering, in the event we decide to redeem some or all of our outstanding Series A Preferred Stock, the Sponsors will receive a total of up to $ million from the redemption of our outstanding Series A Preferred Stock held by them. In addition, we expect to pay management companies affiliated with the Sponsors a total of $ million in connection with the termination of our management services agreement with them pursuant to its terms. | ||
As of September 30, 2014, we had 489,459,943 shares of common stock outstanding. This excludes the following numbers of shares of our common stock issuable in connection with the exercise of warrants outstanding as of September 30, 2014, the conversion of our Series B Convertible Preferred Stock and equity awards under our Amended and Restated 2007 Equity Incentive Plan, or the 2007 Plan:
| • | 100,000,000 shares of common stock issuable upon the exercise of warrants held by affiliates of our Sponsors, which warrants are subject to the lock-up agreements described under “Underwriters” and |
11
Table of Contents
| exercisable at any time prior to December 18, 2019 at an exercise price of $3.25 per share (see “Description of Capital Stock—Warrants”); |
| • | 24,460,642 shares of common stock issuable upon the exercise of warrants held by affiliates of our Sponsors, which warrants are subject to the lock-up agreements described under “Underwriters” and exercisable at any time prior to May 29, 2022 at an exercise price of $4.00 per share (see “Description of Capital Stock—Warrants”); |
| • | shares of common stock issuable upon conversion of the Series B Convertible Preferred Stock held by affiliates of our Sponsors, and convertible at any time as such Series B Convertible Preferred Stock is outstanding at a conversion price equal to the lesser of (1) $4.00 per share (subject to certain anti-dilution provisions) or (2) the offering price per share in this offering, which shares if converted are subject to the lock-up agreements described under “Underwriters” (see “Description of Capital Stock—Preferred Stock—Series B Convertible Preferred Stock”); |
| • | 26,055,786 shares of common stock issuable upon the exercise of options with exercise prices ranging from $2.25 to $5.00 per share and a weighted average exercise price of $2.95 per share; |
| • | 16,172,848 shares of common stock issuable upon the vesting and distribution of restricted stock units, or RSUs; and |
| • | 4,530,864 additional shares of common stock as of September 30, 2014 reserved for future grants under the 2007 Plan. |
This also excludes additional shares of common stock reserved for future equity incentive plans to be effective upon the completion of this offering.
Unless otherwise indicated, all information in this prospectus:
| • | assumes the adoption of our amended and restated certificate of incorporation and our amended and restated bylaws to be effective upon the closing of this offering; |
| • | assumes no exercise by the underwriters of their option to purchase up to additional shares of our common stock in this offering; and |
| • | reflects, for all prior periods, a for reverse stock split of our common stock to be effected prior to the consummation of this offering. |
12
Table of Contents
SUMMARY HISTORICAL FINANCIAL DATA
Avaya Holdings Corp., was formed by affiliates of two private equity firms, Silver Lake Partners (“Silver Lake”) and TPG Capital (“TPG”) (collectively, the “Sponsors”). Avaya Holdings Corp., through a subsidiary holding corporation, acquired Avaya Inc. in a transaction that was completed on October 26, 2007 (the “Merger”) with Avaya Inc. continuing as the surviving entity and a wholly owned subsidiary of Avaya Holdings Corp. Avaya Holdings Corp. is a holding company and has no material assets or stand-alone operations other than the ownership in Avaya Inc. and its subsidiaries. See discussion in Note 1, “Description of Business,” to our audited Consolidated Financial Statements included elsewhere in this prospectus for further details.
The summary historical consolidated financial data set forth below as of September 30, 2014 and 2013 and for the years ended September 30, 2014, 2013 and 2012 have been derived from our audited Consolidated Financial Statements and related notes included elsewhere in this prospectus. The summary historical consolidated financial data set forth below as of September 30, 2012 and as of and for the years ended September 30, 2011 and 2010 has been derived from Consolidated Financial Statements that are not included in this prospectus.
The following summary should be read together with our Consolidated Financial Statements and the related notes appearing elsewhere in this prospectus and the “Management’s Discussion and Analysis of Financial Condition and Results of Operations” section of this prospectus.
13
Table of Contents
| Fiscal years ended September 30, |
||||||||||||||||||||
| 2014 | 2013 | 2012 | 2011 | 2010 | ||||||||||||||||
| (in millions, except per share amounts) | ||||||||||||||||||||
| STATEMENTS OF OPERATIONS DATA: |
||||||||||||||||||||
| REVENUE |
||||||||||||||||||||
| Products |
$ | 2,196 | $ | 2,337 | $ | 2,672 | $ | 2,976 | $ | 2,602 | ||||||||||
| Services |
2,175 | 2,241 | 2,347 | 2,398 | 2,300 | |||||||||||||||
|
|
|
|
|
|
|
|
|
|
|
|||||||||||
| 4,371 | 4,578 | 5,019 | 5,374 | 4,902 | ||||||||||||||||
|
|
|
|
|
|
|
|
|
|
|
|||||||||||
| COSTS |
||||||||||||||||||||
| Products: |
||||||||||||||||||||
| Costs (exclusive of amortization of acquired technology intangible assets) |
854 | 963 | 1,145 | 1,314 | 1,243 | |||||||||||||||
| Amortization of acquired technology intangible assets |
56 | 63 | 192 | 257 | 291 | |||||||||||||||
| Services |
962 | 1,022 | 1,134 | 1,214 | 1,237 | |||||||||||||||
|
|
|
|
|
|
|
|
|
|
|
|||||||||||
| 1,872 | 2,048 | 2,471 | 2,785 | 2,771 | ||||||||||||||||
|
|
|
|
|
|
|
|
|
|
|
|||||||||||
| GROSS PROFIT |
2,499 | 2,530 | 2,548 | 2,589 | 2,131 | |||||||||||||||
|
|
|
|
|
|
|
|
|
|
|
|||||||||||
| OPERATING EXPENSES |
||||||||||||||||||||
| Selling, general and administrative |
1,531 | 1,512 | 1,617 | 1,833 | 1,709 | |||||||||||||||
| Research and development |
379 | 445 | 464 | 461 | 407 | |||||||||||||||
| Amortization of acquired intangible assets |
227 | 228 | 227 | 227 | 219 | |||||||||||||||
| Restructuring and impairment charges, net |
165 | 200 | 147 | 189 | 187 | |||||||||||||||
| Acquisition-related costs |
— | 1 | 4 | 5 | 20 | |||||||||||||||
|
|
|
|
|
|
|
|
|
|
|
|||||||||||
| 2,302 | 2,386 | 2,459 | 2,715 | 2,542 | ||||||||||||||||
|
|
|
|
|
|
|
|
|
|
|
|||||||||||
| OPERATING INCOME (LOSS) |
197 | 144 | 89 | (126 | ) | (411 | ) | |||||||||||||
| Interest expense |
(459 | ) | (467 | ) | (432 | ) | (460 | ) | (487 | ) | ||||||||||
| Loss on extinguishment of debt |
(5 | ) | (6 | ) | — | (246 | ) | — | ||||||||||||
| Other income (expense), net |
3 | (25 | ) | (29 | ) | 5 | 15 | |||||||||||||
|
|
|
|
|
|
|
|
|
|
|
|||||||||||
| LOSS FROM CONTINUING OPERATIONS BEFORE INCOME TAXES |
(264 | ) | (354 | ) | (372 | ) | (827 | ) | (883 | ) | ||||||||||
| (Provision for) benefit from income taxes |
(51 | ) | 35 | 4 | (54 | ) | (4 | ) | ||||||||||||
|
|
|
|
|
|
|
|
|
|
|
|||||||||||
| LOSS FROM CONTINUING OPERATIONS |
(315 | ) | (319 | ) | (368 | ) | (881 | ) | (887 | ) | ||||||||||
| Income (loss) from discontinued operations, net of income taxes |
62 | (57 | ) | 14 | 18 | 16 | ||||||||||||||
|
|
|
|
|
|
|
|
|
|
|
|||||||||||
| NET LOSS |
(253 | ) | (376 | ) | (354 | ) | (863 | ) | (871 | ) | ||||||||||
| Less: net income attributable to noncontrolling interests |
— | — | — | — | 3 | |||||||||||||||
|
|
|
|
|
|
|
|
|
|
|
|||||||||||
| NET LOSS ATTRIBUTABLE TO AVAYA HOLDINGS CORP. |
(253 | ) | (376 | ) | (354 | ) | (863 | ) | (874 | ) | ||||||||||
| Less: Accretion of issuance costs and accrued dividends on Series A and Series B preferred stock |
(45 | ) | (43 | ) | (71 | ) | (7 | ) | (62 | ) | ||||||||||
|
|
|
|
|
|
|
|
|
|
|
|||||||||||
| NET LOSS ATTRIBUTABLE TO AVAYA HOLDINGS CORP. COMMON STOCKHOLDERS |
$ | (298 | ) | $ | (419 | ) | $ | (425 | ) | $ | (870 | ) | $ | (936 | ) | |||||
|
|
|
|
|
|
|
|
|
|
|
|||||||||||
| Basic and diluted earnings per share attributable to common stockholders: |
||||||||||||||||||||
| Loss from continuing operations per share - basic and diluted |
$ | (0.73 | ) | $ | (0.74 | ) | $ | (0.90 | ) | $ | (1.82 | ) | $ | (1.95 | ) | |||||
| Income (loss) from discontinued operations per share - basic and diluted |
0.13 | (0.12 | ) | 0.03 | 0.04 | 0.03 | ||||||||||||||
|
|
|
|
|
|
|
|
|
|
|
|||||||||||
| Net loss per share - basic and diluted |
$ | (0.60 | ) | $ | (0.86 | ) | $ | (0.87 | ) | $ | (1.78 | ) | $ | (1.92 | ) | |||||
|
|
|
|
|
|
|
|
|
|
|
|||||||||||
| Weighted average shares outstanding - basic and diluted |
495.4 | 489.8 | 489.6 | 489.0 | 488.6 | |||||||||||||||
|
|
|
|
|
|
|
|
|
|
|
|||||||||||
14
Table of Contents
| Fiscal years
ended September 30, |
||||||||||||||||||||
| 2014 | 2013 | 2012 | 2011 | 2010 | ||||||||||||||||
| (in millions) | ||||||||||||||||||||
| BALANCE SHEET DATA (at end of period): |
||||||||||||||||||||
| Cash and cash equivalents |
$ | 322 | $ | 289 | $ | 338 | $ | 415 | $ | 594 | ||||||||||
| Intangible assets, net |
1,224 | 1,497 | 1,787 | 2,142 | 2,617 | |||||||||||||||
| Goodwill |
4,047 | 4,048 | 4,055 | 3,946 | 3,942 | |||||||||||||||
| Total assets |
7,234 | 7,649 | 8,184 | 8,561 | 9,276 | |||||||||||||||
| Total debt (excluding capital lease obligations) |
6,023 | 6,086 | 6,121 | 6,157 | 5,928 | |||||||||||||||
| Equity awards on redeemable shares |
21 | 5 | — | — | — | |||||||||||||||
| Preferred stock, Series B |
300 | 263 | 227 | — | — | |||||||||||||||
| Preferred stock, Series A |
159 | 151 | 144 | 137 | 130 | |||||||||||||||
| Total Avaya Holdings Corp. stockholders’ deficiency |
(3,621 | ) | (3,138 | ) | (2,843 | ) | (2,500 | ) | (1,543 | ) | ||||||||||
| STATEMENT OF CASH FLOWS DATA: |
||||||||||||||||||||
| Net cash provided by (used in) continuing operations: |
||||||||||||||||||||
| Operating activities |
$ | 35 | $ | 131 | $ | 16 | $ | (335 | ) | $ | 12 | |||||||||
| Investing activities |
(33 | ) | (113 | ) | (283 | ) | (101 | ) | (864 | ) | ||||||||||
| Financing activities |
(60 | ) | (79 | ) | 155 | 228 | 853 | |||||||||||||
| OTHER FINANCIAL DATA: |
||||||||||||||||||||
| EBITDA |
$ | 627 | $ | 566 | $ | 622 | $ | 282 | $ | 291 | ||||||||||
| Adjusted EBITDA(1) |
898 | 922 | 946 | 940 | 766 | |||||||||||||||
| Capital expenditures |
134 | 110 | 92 | 83 | 79 | |||||||||||||||
| Capitalized software development costs |
1 | 14 | 35 | 42 | 43 | |||||||||||||||
| (1) | Adjusted EBITDA is calculated in accordance with Avaya Inc.’s debt agreements entered into in connection with the Merger. |
EBITDA is defined as net income (loss) before income taxes, interest expense, interest income and depreciation and amortization and excludes the results of discontinued operations. EBITDA provides us with a measure of operating performance that excludes items that are outside the control of management, which can differ significantly from company to company depending on capital structure, the tax jurisdictions in which companies operate and capital investments. Under Avaya Inc.’s debt agreements, its ability to draw on its revolving credit facilities or engage in activities such as incurring additional indebtedness, making investments and paying dividends is tied in part to ratios based on Adjusted EBITDA. As defined in Avaya Inc.’s debt agreements, Adjusted EBITDA is a non-GAAP measure of EBITDA further adjusted to exclude certain charges and other adjustments permitted in calculating covenant compliance under Avaya Inc.’s debt agreements. We believe that including supplementary information concerning Adjusted EBITDA is appropriate to provide additional information to investors to demonstrate compliance with Avaya Inc.’s debt agreements and because it serves as a basis for determining management compensation. In addition, we believe Adjusted EBITDA provides more comparability between our historical results and results that reflect purchase accounting and our new capital structure. Accordingly, Adjusted EBITDA measures our financial performance based on operational factors that management can impact in the short-term, namely the Company’s pricing strategies, volume, costs and expenses of the organization.
EBITDA and Adjusted EBITDA have limitations as analytical tools. Adjusted EBITDA does not represent net income (loss) or cash flow from operations as those terms are defined by GAAP and does not necessarily indicate whether cash flows will be sufficient to fund cash needs. While Adjusted EBITDA and similar measures are frequently used as measures of operations and the ability to meet debt service requirements, these terms are not necessarily comparable to other similarly titled captions of other companies due to the potential inconsistencies in the method of calculation. Adjusted EBITDA does not reflect the impact of earnings or charges resulting from matters that we consider not to be indicative of our ongoing operations. In particular, the
15
Table of Contents
definition of Adjusted EBITDA in Avaya Inc.’s debt agreements allows us to add back certain non-cash charges that are deducted in calculating net income (loss). Avaya Inc.’s debt agreements also allows us to add back restructuring charges, certain fees payable to our private equity investors or their affiliates and other specific cash costs and expenses as defined in the agreements and that portion of our pension costs, other post-employment benefit costs, and non-retirement post-employment benefit costs representing the amortization of prior service costs and actuarial gain or loss associated with these employment benefits. However, these are expenses that may recur, may vary and are difficult to predict. Further, Avaya Inc.’s debt agreements require that Adjusted EBITDA be calculated for the most recent four fiscal quarters. As a result, the measure can be disproportionately affected by a particularly strong or weak quarter. Further, it may not be comparable to the measure for any subsequent four-quarter period or any complete fiscal year.
The unaudited reconciliation of loss from continuing operations, which is a GAAP measure, to EBITDA and Adjusted EBITDA is presented below:
| Fiscal years ended September 30, |
||||||||||||||||||||
| 2014 | 2013 | 2012 | 2011 | 2010 | ||||||||||||||||
| (in millions) | ||||||||||||||||||||
| Loss from continuing operations |
$ | (315 | ) | $ | (319 | ) | $ | (368 | ) | $ | (881 | ) | $ | (887 | ) | |||||
| Interest expense |
459 | 467 | 432 | 460 | 487 | |||||||||||||||
| Interest income |
(2 | ) | (2 | ) | (3 | ) | (5 | ) | (5 | ) | ||||||||||
| Provision for (benefit from) income taxes |
51 | (35 | ) | (4 | ) | 54 | 4 | |||||||||||||
| Depreciation and amortization |
434 | 455 | 565 | 654 | 692 | |||||||||||||||
|
|
|
|
|
|
|
|
|
|
|
|||||||||||
| EBITDA |
627 | 566 | 622 | 282 | 291 | |||||||||||||||
| Impact of purchase accounting adjustments(a) |
— | 1 | 3 | — | 5 | |||||||||||||||
| Restructuring charges, net |
165 | 200 | 142 | 189 | 171 | |||||||||||||||
| Sponsors’ fees(b) |
7 | 7 | 7 | 7 | 7 | |||||||||||||||
| Acquisition-related costs(c) |
— | 1 | 4 | 5 | 20 | |||||||||||||||
| Integration-related costs(d) |
7 | 15 | 19 | 132 | 208 | |||||||||||||||
| Divestiture-related costs |
2 | — | — | — | — | |||||||||||||||
| Debt registration fees . |
— | — | — | — | 1 | |||||||||||||||
| Loss on extinguishment of debt(e) |
5 | 6 | — | 246 | — | |||||||||||||||
| Third-party fees expensed in connection with debt modification(f) |
2 | 18 | — | 9 | — | |||||||||||||||
| Strategic initiative costs(g) |
— | — | — | — | 6 | |||||||||||||||
| Non-cash share-based compensation |
25 | 11 | 8 | 12 | 19 | |||||||||||||||
| Write-down of held for sale assets to net realizable value |
— | — | 5 | 1 | — | |||||||||||||||
| (Gain) loss on investments and sale of long-lived assets, net |
— | (1 | ) | 3 | 1 | (4 | ) | |||||||||||||
| Gain on sale of TBU business |
(14 | ) | — | — | — | — | ||||||||||||||
| Change in certain tax indemnifications |
4 | — | — | — | — | |||||||||||||||
| Impairment of long-lived assets |
— | 1 | 6 | — | 16 | |||||||||||||||
| Reversal of contingent liability related to acquisition . |
— | — | (1 | ) | — | — | ||||||||||||||
| Change in fair value of Preferred Series B embedded derivative(h) |
22 | 11 | 6 | — | — | |||||||||||||||
| Venezuela hyperinflationary and devaluation charges |
2 | 1 | — | — | — | |||||||||||||||
| Securities registration fees(i) |
— | 1 | 3 | — | — | |||||||||||||||
| Net income of unrestricted subsidiaries, net of dividends received |
— | — | — | — | (6 | ) | ||||||||||||||
| Resolution of certain legal matters(j) |
8 | 10 | — | — | — | |||||||||||||||
| (Gain) loss on foreign currency transactions |
(18 | ) | (5 | ) | 21 | (12 | ) | 1 | ||||||||||||
| Pension/OPEB/nonretirement postemployment benefits and long-term disability costs(k) |
51 | 79 | 98 | 68 | 31 | |||||||||||||||
| Other |
3 | — | — | — | — | |||||||||||||||
|
|
|
|
|
|
|
|
|
|
|
|||||||||||
| Adjusted EBITDA |
$ | 898 | $ | 922 | $ | 946 | $ | 940 | $ | 766 | ||||||||||
|
|
|
|
|
|
|
|
|
|
|
|||||||||||
| (a) | Represents adjustments to eliminate the impact of certain purchase accounting adjustments recorded as a result of the acquisitions of NES, Radvision and Konftel AB, or Konftel, and the Merger, including the recognition of the |
16
Table of Contents
| amortization of business partner commissions, which were eliminated in purchase accounting, the recognition of revenue and costs that were deferred in prior periods and eliminated in purchase accounting and the elimination of the impact of estimated fair value adjustments for certain assets and liabilities, such as inventory. |
| (b) | Sponsors’ monitoring fees represent monitoring fees payable to affiliates of the Sponsors and their designees pursuant to a management services agreement entered into at the time of the Merger. See “Certain Relationships and Related Party Transactions.” |
| (c) | Acquisition-related costs include legal and other costs related to the acquisition of NES, Radvision and other acquisitions. |
| (d) | Integration-related costs primarily represent third-party consulting fees and other administrative costs associated with consolidating and coordinating the operations of Avaya with NES, Radvision and other acquisitions. These costs were incurred in connection with, among other things, the on-boarding of NES and Radvision personnel, developing compatible IT systems and internal processes and developing and implementing a strategic operating plan to help enable a smooth transition with minimal disruption to NES customers. Integration-related costs also include fees paid to certain Nortel-controlled entities for logistics and other support functions being performed on a temporary basis pursuant to a transition services agreement. |
| (e) | Loss on extinguishment of debt represents losses recognized in connection with certain debt refinancing transactions entered into during fiscal 2014, 2013 and 2011. The losses are based on the difference between the reacquisition price and the carrying value of the debt. See Note 10, “Financing Arrangements,” to our audited Consolidated Financial Statements located elsewhere in this prospectus. |
| (f) | The third-party fees expensed in connection with debt modification represents fees paid to third-parties in connection with certain debt refinancing transactions entered into during fiscal 2014, 2013 and 2011. See Note 10, “Financing Arrangements,” to our audited Consolidated Financial Statements located elsewhere in this prospectus. |
| (g) | Strategic initiative costs represent consulting fees in connection with management’s cost-savings actions, which commenced subsequent to the Merger. |
| (h) | Represents the loss (gain) on changes in the fair value of certain embedded derivative features of the Company’s Series B Convertible Preferred Stock. Under GAAP, these embedded derivative features must be recognized at fair value at each balance sheet date with the changes in the fair value recognized in operations. See Note 16, “Capital Stock,” to our audited Consolidated Financial Statements located elsewhere in this prospectus. |
| (i) | Represents third party fees incurred in connection with the Company’s registration statement. |
| (j) | Charges recognized in connection with the resolution of certain commercial and intellectual property legal disputes that, individually and in the aggregate, were not material to Avaya’s financial position. |
| (k) | Represents that portion of our pension costs, other post-employment benefit costs, non-retirement post-employment benefit costs representing the amortization of prior service costs and net actuarial gains/losses associated with these employment benefits. In fiscal 2013, the amount includes $9 million of net curtailment gains associated with the U.S. pension and postemployment plans. In fiscal 2012 and 2011, the amounts include a curtailment charge of $5 million associated with workforce reductions in Germany and the U.S. and $7 million associated with workforce reductions in Germany, respectively. |
17
Table of Contents
Investing in our common stock involves a high degree of risk. You should carefully consider the following risk factors, as well as the other information in this prospectus, before deciding to invest in our common stock. The occurrence of any of the following risks could harm our business, financial condition, results of operations or prospects. In that case, the trading price of our common stock could decline, and you may lose all or part of your investment.
Risks Related to Our Business
Our products and services may fail to keep pace with rapidly changing technology and evolving industry standards.
The market in which we operate is characterized by rapid, and sometimes disruptive, technological developments, evolving industry standards, frequent new product introductions and enhancements and changes in customer requirements. In addition, both traditional and new competitors are investing heavily in this market and competing for customers. As next-generation business collaboration technology continues to evolve, we must keep pace in order to maintain or expand our market leading position. We recently introduced a significant number of new product offerings and are increasingly focused on new, high value software products, as a revenue driver. If we are not able to successfully develop and bring these new products to market in a timely manner, achieve market acceptance of our products and services or identify new market opportunities for our products and services, our business and results of operations may be materially and adversely affected.
The market opportunity for business collaboration products and services may not develop in the ways that we anticipate.
The demand for our products and services can change quickly and in ways that we may not anticipate because the market in which we operate is characterized by rapid, and sometimes disruptive, technological developments, evolving industry standards, frequent new product introductions and enhancements, changes in customer requirements and a limited ability to accurately forecast future customer orders. Our operating results may be adversely affected if the market opportunity for our products and services does not develop in the ways that we anticipate or if other technologies become more accepted or standard in our industry or disrupt our technology platforms.
We face formidable competition from providers of unified communications, contact center and networking products and related services; as these markets evolve, we expect competition to intensify and expand to include companies that do not currently compete directly against us.
Our unified communications products and services compete with companies such as Cisco Systems, Inc., or Cisco, Microsoft Corporation, or Microsoft, NEC Corporation, or NEC, Unify GmbH & Co. Kg, or Unify, Alcatel-Lucent and Huawei Technologies Co., Ltd, or Huawei, in the enterprise segment; with companies such as ShoreTel, Inc., or ShoreTel, and Mitel Networks Corp., or Mitel, in the midmarket; and with companies such as Cisco, Broadsoft Inc., or Broadsoft, Microsoft, 8x8, Inc., or 8x8, RingCentral, Inc. or RingCentral and ShoreTel in cloud products and services. Our video products and services compete with companies such as Cisco, Polycom Inc., Huawei and LifeSize (now a division of Logitech International S.A.).
Our contact center products and services compete with companies such as Genesys Telecommunications Laboratories, Inc., or Genesys, Cisco, Huawei and Mitel in the enterprise segment and with companies such as Cisco, Genesys and Interactive Intelligence, Inc. or Interactive Intelligence, in the midmarket and cloud products and services.
Our networking products and services compete with companies such as Cisco, Hewlett-Packard Company, or HP, Huawei, Dell Inc., or Dell and Juniper Networks, Inc., or Juniper, primarily with respect to L2/L3 ethernet switching.
18
Table of Contents
We face competition in certain geographies with companies that have a particular strength and focus in these regions, such as Huawei in China, Intelbras in Latin America and Panasonic in Asia.
While we believe our global, in-house end-to-end services organization provides us with a competitive advantage, it faces competition from companies like those above offering services, either directly or indirectly through their channel partners, with respect to their own product offerings, as well as many value-added resellers, consulting and systems integration firms and network service providers.
In addition, because the business collaboration market continues to evolve and technology continues to develop rapidly, we may face competition in the future from companies that do not currently compete against us, but whose current business activities may bring them into competition with us in the future. In particular, this may be the case as business, information technology and communications applications deployed on converged networks become more integrated to support business collaboration. We may face increased competition from current leaders in information technology infrastructure, information technology, consumer products, personal and business applications and the software that connects the network infrastructure to those applications. With respect to services, we may also face competition from companies that seek to sell remotely hosted services or software as a service directly to the end customer. Competition from these potential market entrants may take many forms, including offering products and applications similar to those we offer as part of another offering. In addition, these technologies continue to move from a proprietary environment to an open standards-based environment.
Several of our existing competitors have, and many of our future competitors may have, greater financial, personnel, technical, research and development and other resources, more well-established brands or reputations and broader customer bases than we do and, as a result, these competitors may be in a stronger position to respond quickly to potential acquisitions and other market opportunities, new or emerging technologies and changes in customer requirements. Some of these competitors may have customer bases that are more geographically balanced than ours and, therefore, may be less affected by an economic downturn in a particular region. Other competitors may have deeper expertise in a particular stand-alone technology that develops more quickly than we anticipate. Competitors with greater resources also may be able to offer lower prices, additional products or services or other incentives that we cannot match or do not offer. Industry consolidations may also create competitors with broader and more geographic coverage and the ability to reach enterprises through communications service providers. Existing customers of data networking companies that compete against us may be inclined to purchase enterprise communications products and services from their current data networking or software vendors rather than from us. Also, as communications and data networks converge, we may face competition from systems integrators that traditionally have been focused on data network integration.
We cannot predict which competitors may enter our markets in the future, what form such competition may take or whether we will be able to respond effectively to the entry of new competitors into competition with us or the rapid evolution in technology and product development that has characterized our businesses. In addition, in order to effectively compete with any new market entrant, we may need to make additional investments in our business, use more capital resources than our business currently requires or reduce prices, any of which may materially and adversely affect our profitability.
Our revenues are dependent on general economic conditions and the willingness of enterprises to invest in technology.
We believe that enterprises continue to be cautious about sustained economic growth and have tried to maintain or improve profitability through cost control and constrained spending. That may include delaying or rejecting capital projects, including with respect to the implementation of our products and services. In addition, we believe there is a growing market trend around Cloud consumption preferences with more customers exploring operating expense models as opposed to capital expense models for procuring technology. We believe the market trend toward Cloud models will continue as customers seek ways of reducing their overhead and other costs. All of the foregoing may result in continued pressure on our ability to increase our revenue as well as create
19
Table of Contents
competitive pricing pressures and price erosion. If these or other conditions limit our ability to grow revenue or cause our revenue to decline our operating results may be materially and adversely affected. In addition, in the past a portion of our revenues which come from the U.S. federal government sector, were impacted because of government shutdowns. In the event of future shutdowns or uncertainties, there can be no assurance that that portion of our revenues will not be impacted.
Our strategy depends in part on our ability to rely on our indirect sales channel.
An important element of our go-to-market strategy to expand sales coverage and increase market absorption of new products is our global network of alliance partners, distributors, dealers, value-added resellers, telecommunications service providers and system integrators. Although the terms of individual channel partner agreements may deviate from our standard program terms, our standard program agreements for resellers generally provide for a term of one year with automatic renewal for successive one year terms and generally may be terminated by either party for convenience upon 30 days prior written notice. Our standard program agreements for distributors generally may be terminated by either party for convenience upon 90 days prior written notice. Certain of our contractual agreements with our largest distributors and resellers, however, permit termination of the relationship by either party for convenience upon prior notice of 180 days. See “Business—Alliances and Partnerships” for more information on our global business partner program and the standard terms of our program agreements. Our financial results could be adversely affected if our contracts with channel partners were terminated, if our relationships with channel partners were to deteriorate, if our support pricing or other services strategies conflict with those of our channel partners, if any of our competitors were to enter into strategic relationships with or acquire a significant channel partner, if channel partners do not become enabled to sell new products or if the financial condition of our channel partners were to weaken. In addition, we may expend time, money and other resources on developing and maintaining channel relationships that are ultimately unsuccessful. There can be no assurance that we will be successful in maintaining, expanding or developing relationships with channel partners. If we are not successful, we may lose sales opportunities, customers or market share.
We are dependent on our intellectual property. If we are not able to protect our proprietary rights or if those rights are invalidated or circumvented, our business may be adversely affected.
As a leader in technology and innovation in business collaboration and communications, we generally protect our intellectual property through patents, trademarks, trade secrets, copyrights, confidentiality and nondisclosure agreements and other measures. There can be no assurance that patents will be issued from pending applications that we have filed or that our patents will be sufficient to protect our key technology from misappropriation or falling into the public domain, nor can assurances be made that any of our patents, patent applications or our other intellectual property or proprietary rights will not be challenged, invalidated or circumvented. For example, our business is global and the level of protection of our proprietary technology will vary by country, particularly in countries that do not have well developed judicial systems or laws that adequately protect intellectual property rights. Patent litigation and other challenges to our patents and other proprietary rights are costly and unpredictable and may prevent us from marketing and selling a product in a particular geographic area. If we are unable to protect our proprietary rights, we may be at a disadvantage to others who did not incur the substantial time and expense we incurred to create our products.
Certain software we use is from open source code sources, which, under certain circumstances, may lead to unintended consequences and, therefore, could materially adversely affect our business, financial condition, operating results and cash flow.
Some of our products contain software from open source code sources. The use of such open source code may subject us to certain conditions, including the obligation to offer our products that use open source code for no cost. We monitor our use of such open source code to avoid subjecting our products to conditions we do not intend. However, the use of such open source code may ultimately subject some of our products to unintended
20
Table of Contents
conditions, which could require us to take remedial action that may divert resources away from our development efforts and, therefore, could materially adversely affect our business, financial condition, operating results and cash flow.
If we fail to retain or attract key employees, our business may be harmed.
The success of our business depends on the skill, experience and dedication of our employee base. If we are unable to retain and recruit sufficiently experienced and capable employees, especially in the key areas of product development, sales, services and management, our business and financial results may suffer. Experienced and capable employees in the technology industry remain in high demand, and there is continual competition for their talents. In addition, talented employees may choose to leave the Company because of our cost-reduction initiatives. When talented employees leave, we may have difficulty replacing them and our business may suffer. While we strive to maintain our competitiveness in the marketplace, there can be no assurance that we will be able to successfully retain and attract the employees that we need to achieve our business objectives.
We rely on third-party contract manufacturers and component suppliers, as well as warehousing and distribution logistics providers.
We have outsourced substantially all of our manufacturing operations to several contract manufacturers. Our contract manufacturers produce the vast majority of products in facilities located in southern China, with other products manufactured in facilities located in Israel, Mexico, Malaysia, Taiwan, United Kingdom, Ireland and the U.S. All manufacturing of our products is performed in accordance with detailed specifications and product designs furnished or approved by us and is subject to rigorous quality control standards. We periodically review our product manufacturing operations and consider changes we believe may be necessary or appropriate. Although we closely manage the transition process when manufacturing changes are required, we could experience disruption to our operations during any such transition. Any such disruption could negatively affect our reputation and our results of operations. We also purchase certain hardware components and license certain software components and resell them separately or as part of our products under the Avaya brand. In some cases, certain components are available only from a single source or from a limited source of suppliers. Delays or shortages associated with these components could cause significant disruption to our operations. We have also outsourced substantially all of our warehousing and distribution logistics operations to several providers of such services on a global basis, and any delays or material changes in such services could cause significant disruption to our operations.
As our business and operations relationships have expanded globally, certain operational and logistical challenges as well as changes in economic or political conditions and natural disasters, in a specific country or region, could negatively affect our revenue, costs, expenses and financial condition or those of our channel partners and distributors.
We conduct significant sales and customer support operations and significant amounts of our research and development activities in countries outside of the U.S. and also depend on non-U.S. operations of our contract manufacturers and our channel partners. For fiscal 2014 we derived 48% of our revenue from sales outside the U.S. The vast majority of our contract manufacturing also takes place outside the U.S., primarily in southern China. The transition of even a portion of our operations or functions to a foreign country involves a number of logistical and technical challenges, including:
| • | challenges in effectively managing operations in jurisdictions with lower cost structures as a result of several factors, including time zone differences and regulatory, legal, employment, cultural and logistical issues; |
| • | the potential negative impact on our existing employees as a result of the relocation of workforce resources; |
21
Table of Contents
| • | an inability to predict the extent of local government support; |
| • | the availability of qualified workers and the level of competition in offshore markets for qualified employees, including skilled design and technical employees, as companies expand their operations offshore; and |
| • | future political, monetary and economic conditions in any specific offshore location. |
If we are unable to effectively manage our offshore operations, we may be unable to produce the expected cost savings from any shifts of operations to offshore jurisdictions and our business and results of operations could be adversely affected.
In addition, our future operating results, including our ability to import our products from, export our products to, or sell our products in, various countries, could be adversely affected by a variety of uncontrollable and changing factors such as political conditions, economic conditions including trade sanctions, legal and regulatory constraints, protectionist legislation, difficulty in enforcing intellectual property rights such as against counterfeiting of our products, relationships with employees and works councils, unfavorable tax and currency regulations, health pandemics or similar issues, natural disasters and other matters in any of the countries or regions in which we and our contract manufacturers and business partners currently operate or intend to operate in the future. Our prospective effective tax rate could be adversely affected by, among others, an unfavorable geographical distribution of our earnings and losses, by changes in the valuation of our deferred tax assets or liabilities or by changes in tax laws, regulations, accounting principles, or interpretations thereof. The various risks inherent in doing business in the U.S. generally also exist when doing business outside of the U.S., and may be exaggerated by the difficulty of doing business in numerous sovereign jurisdictions due to differences in culture, laws and regulations.
Fluctuations in foreign currency exchange rates could negatively impact our operating results.
Foreign currency exchange rates and fluctuations may have an impact on our revenue, costs or cash flows from our international operations, which could adversely affect our financial performance. Our primary currency exposures are to the euro, British pound, Indian rupee, Canadian dollar, Brazilian real and the Australian dollar. These exposures may change over time as business practices evolve and as the geographic mix of our business changes. From time to time we enter into foreign exchange forward contracts to reduce the short-term impact of foreign currency fluctuations. However, any attempts to hedge against foreign currency fluctuation risks may be unsuccessful and result in an adverse impact to our operating results.
The Company could be subject to changes in its tax rates, the adoption of new U.S. or international tax legislation or exposure to additional tax liabilities.
The Company is subject to taxes in the U.S. and numerous foreign jurisdictions, including Ireland and Luxembourg, where a number of the Company’s subsidiaries are organized. Due to economic and political conditions, tax rates in various jurisdictions including the U.S. may be subject to significant change. the Company’s future effective tax rates could be affected by changes in the mix of earnings in countries with differing statutory tax rates, changes in the valuation of deferred tax assets and liabilities, or changes in tax laws or their interpretation. The Company is also subject to the examination of its tax returns and other tax matters by the Internal Revenue Service and other tax authorities and governmental bodies. The Company regularly assesses the likelihood of an adverse outcome resulting from these examinations to determine the adequacy of its provision for taxes. There can be no assurance as to the outcome of these examinations. If the Company’s effective tax rates were to increase, or if the ultimate determination of the Company’s taxes owed is for an amount in excess of amounts previously accrued, the Company’s operating results, cash flows, and financial condition could be adversely affected.
22
Table of Contents
If we are unable to integrate acquired businesses into ours effectively, our operating results may be adversely affected.
From time to time, we seek to expand our business through acquisitions. We may not be able to successfully integrate acquired businesses and, where desired, their product portfolios, into ours, and therefore we may not be able to realize the intended benefits from an acquisition. If we fail to successfully integrate acquisitions, or product portfolios, or if they fail to perform as we anticipate, our existing businesses and our revenue and operating results could be adversely affected. If the due diligence of the operations of acquired businesses performed by us and by third parties on our behalf is inadequate or flawed, or if we later discover unforeseen financial or business liabilities, acquired businesses and their assets may not perform as expected. Additionally, acquisitions could result in difficulties assimilating acquired operations and, where deemed desirable, transitioning overlapping products to be a single product line and the diversion of capital and management’s attention away from other business issues and opportunities. We may fail to retain employees acquired through acquisitions, which may negatively impact the integration efforts. For all the reasons set forth above, the failure to integrate acquired businesses effectively may adversely impact Avaya’s business, results of operations or financial condition.
We may be subject to litigation and infringement claims, which could cause us to incur significant expenses or prevent us from selling our products or services.
From time to time, we receive notices and claims from third parties asserting that our proprietary or licensed products, systems and software infringe their intellectual property rights. There can be no assurance that the number of these notices and claims will not increase in the future or that we do not in fact infringe those intellectual property rights. Irrespective of the merits of these claims, any resulting litigation could be costly and time consuming and could divert the attention of management and key personnel from other business issues. The complexity of the technology involved and the uncertainty of intellectual property litigation increase these risks. These matters may result in any number of outcomes for us, including entering into licensing agreements, redesigning our products to avoid infringement, being enjoined from selling products that are found to infringe, paying damages if products are found to infringe and indemnifying customers from infringement claims as part of our contractual obligations. Royalty or license agreements may be very costly and we may be unable to obtain royalty or license agreements on terms acceptable to us or at all. Such agreements may cause operating margins to decline. In addition, some of our employees previously have been employed at other companies that provide similar products and services. We may be subject to claims that these employees or we have inadvertently or otherwise used or disclosed trade secrets or other proprietary information of their former employers. These claims and other successful claims of patent or other intellectual property infringement against us could materially adversely affect our operating results. We have made and will likely continue to make investments to license and/or acquire the use of third-party intellectual property rights and technology as part of our strategy to manage this risk, but there can be no assurance that we will be successful or that any costs relating to such activity will not be material. We may also be subject to additional notice, attribution and other compliance requirements to the extent we incorporate open source software into our applications. In addition, third parties have claimed, and may in the future claim, that a customer’s use of our products, systems or software infringes the third party’s intellectual property rights. Under certain circumstances, we may be required to indemnify our customers for some of the costs and damages related to such an infringement claim. Any indemnification requirement could have a material adverse effect on our business and our operating results. See Note 21, “Commitments and Contingencies,” to our audited Consolidated Financial Statements included elsewhere in this prospectus for a description of certain legal proceedings regarding intellectual property.
A breach of the security of our information systems, products or services or of the information systems of our third party providers could adversely affect our operating results.
We rely on the security of our information systems and, in certain circumstances, those of our third party providers, such as vendors, consultants and contract manufacturers, to protect our proprietary information and information of our customers. In addition, the growth of BYOD programs has heightened the need for enhanced
23
Table of Contents
security measures. Information technology system failures, including a breach of our or our third party providers’ data security, could disrupt our ability to function in the normal course of business by potentially causing, among other things, delays in the fulfillment or cancellation of customer orders, disruptions in the manufacture or shipment of products or, delivery of services or an unintentional disclosure of customer, employee or our information. Additionally, despite our security procedures or those of our third party providers, information systems and our products and services may be vulnerable to threats such as computer hacking, cyber-terrorism or other unauthorized attempts by third parties to access, modify or delete our or our customers’ proprietary information. Any such breach could have a material adverse effect on our operating results and our reputation as a provider of mission critical business collaboration and communications products and services and could cause irreparable damage to us or our systems regardless of whether we or our third party providers are able to adequately recover critical systems following a systems failure.
We may be adversely affected by environmental, health and safety, laws, regulations, costs and other liabilities.
We are subject to a wide range of governmental requirements relating to safety, health and environmental protection. If we violate or fail to comply with these requirements, we could be fined or otherwise sanctioned by regulators, lose customers and damage our reputation, which could have an adverse effect on our business. We are subject to environmental laws governing the cleanup of soil and groundwater contamination that may impose joint and several liability for the costs of investigating and remediating releases of regulated materials at currently or formerly owned or operated sites and at third-party waste disposal sites. We are also subject to various local, federal and international laws and regulations regarding the material content and electrical design of our products that require us to be financially responsible for the collection, treatment, recycling and disposal of those products. For example, the European Union EU has adopted the Restriction on Hazardous Substances, or RoHS and Waste Electrical and Electronic Equipment WEEE Directive with similar laws and regulations being enacted in other regions. Effective in May 2014, the United States requires companies to begin publicly disclosing their use of conflict minerals that originated in the Democratic Republic of the Congo DRC or an adjoining country. Additionally, requirements such as the EU Energy Using Product EuP Directive are being imposed to address the operating characteristics of our products. Our failure or the undetected failure of our supply chain to comply with existing or future environmental, health and safety requirements could subject us to liabilities exceeding our reserves or adversely affect our business, results of operations or financial condition.
In addition, a number of climate change regulations and initiatives are either in force or pending at the local, federal and international levels. Our operations and our supply chain could face increased climate change-related regulations, modifications to transportation to meet lower emission requirements and changes to types of materials used for products and packaging to reduce emissions, increased utility costs to address cleaner energy technologies, increased costs related to severe weather events, and emissions reductions associated with operations, business travel or products. These yet-to-be defined costs and changes to operations could have a financial impact on our business.
Business collaboration products are complex, and design defects, errors, failures or “bugs” may be difficult to detect and correct.
Business collaboration products are complex, integrating hardware, software and many elements of a customer’s existing network and communications infrastructure. Despite testing conducted prior to the release of products to the market and quality assurance programs, hardware may malfunction and software may contain “bugs” that are difficult to detect and fix. Any such issues could interfere with the expected operation of a product, which might negatively impact customer satisfaction, reduce sales opportunities or affect gross margins.
Depending upon the size and scope of any such issue, remediation may have a material impact on our business. Our inability to cure an application or product defect, should one occur, could result in the failure of an application or product line, the temporary or permanent withdrawal from an application, product or market,
24
Table of Contents
damage to our reputation, inventory costs, an increase in warranty claims, lawsuits by customers or customers’ or channel partners’ end users, or application or product reengineering expenses. Our insurance may not cover or may be insufficient to cover claims that are successfully asserted against us.
Pension and postretirement healthcare and life insurance liabilities could impair our liquidity or financial condition.
We sponsor non-contributory defined benefit pension plans covering a portion of our U.S. employees and retirees, and postretirement benefit plans for a portion of our U.S. retirees that include healthcare benefits and life insurance coverage. We froze benefit accruals and additional participation in our plans for our U.S. management employees effective December 31, 2003, and amended the postretirement plan for U.S. management employees effective January 1, 2013, to terminate retiree dental coverage and to cease providing medical and prescription drug coverage to a retiree, dependent, or lawful spouse who has attained age 65. Certain of our non-U.S. operations also have various retirement benefit programs covering substantially all of their employees. Some of these programs are considered to be defined benefit pension plans for accounting purposes. If one or more of our U.S. pension plans were to be terminated without being fully funded on a termination basis, the Pension Benefit Guaranty Corporation, or PBGC, could obtain a lien on our assets for the amount of our liability, which would result in an event of default under each of our credit facilities. As a result, any such liens would have a material adverse effect on the Company, including our liquidity and financing arrangements. The measurement of our obligations, costs and liabilities associated with benefits pursuant to our pension and postretirement benefit plans requires that we estimate the present value of projected future payments to all participants, including assumptions related to discount rates, investment returns on designated plan assets, health care cost trends, and demographic experience. If future economic or demographic trends and results are different from our assumptions, then our obligations and cash flow requirements could be higher than we currently estimate. If our cash flows and capital resources are insufficient to meet required minimal funding of our defined benefit plans or to fund our other pension or postretirement healthcare and life insurance obligations, or if we are required or elect to fund any material portion of these obligations now or in the future, we could be forced to reduce or delay investments and capital expenditures, seek additional capital, or restructure or refinance our indebtedness. In addition, if our operating results and available cash are insufficient to meet our pension or postretirement healthcare and life insurance obligations, we could face substantial liquidity problems and may be required to dispose of material assets or operations in order to meet our obligations. We may not be able to consummate those dispositions or to obtain any proceeds on terms acceptable to us or at all, and any such proceeds may not be adequate to meet any such obligations then due. The PBGC has the authority under certain circumstances to petition a court to terminate an underfunded pension plan upon the occurrence of an event with respect to which the PBGC determines that the possible long-term loss of the PBGC with respect to the plan may reasonably be expected to increase unreasonably if the plan is not terminated. If our U.S. defined benefit pension plans were to be terminated, we would incur a liability to the plans or the PBGC equal to the amount by which the liabilities of the plans, calculated on a termination basis, exceed the assets of the plans, which amount would likely exceed the amount that we have estimated to be the underfunded amount as of September 30, 2014.
See Note 14, “Benefit Obligations,” to our audited Consolidated Financial Statements included elsewhere in this prospectus for further details on our pension and postretirement benefit plans, including funding status.
We may incur liabilities as a result of our obligation to indemnify, and to share certain liabilities with, Lucent Technologies Inc., or Lucent, in connection with our spin-off from Lucent in September 2000.
Pursuant to the Contribution and Distribution Agreement between Avaya Inc. and Lucent, a predecessor to Alcatel-Lucent, Lucent contributed to Avaya Inc. substantially all of the assets, liabilities and operations associated with its enterprise networking businesses and distributed all of the outstanding shares of Avaya Inc.’s common stock to its stockholders. The Contribution and Distribution Agreement, among other things, provides that, in general, Avaya Inc. will indemnify Lucent for all liabilities including certain pre-distribution tax obligations of Lucent relating to our businesses and all contingent liabilities accruing pre-distribution primarily
25
Table of Contents
relating to Avaya Inc.’s businesses or otherwise assigned to Avaya Inc. In addition, the Contribution and Distribution Agreement provides that certain contingent liabilities not directly identifiable with one of the parties accruing pre-distribution will be shared in the proportion of 90% by Lucent and 10% by Avaya Inc. The Contribution and Distribution Agreement also provides that contingent liabilities accruing pre-distribution in excess of $50 million that are primarily related to Lucent’s businesses shall be borne 90% by Lucent and 10% by Avaya Inc. and contingent liabilities accruing pre-distribution in excess of $50 million that are primarily related to Avaya Inc.’s businesses shall be borne equally by the parties. See Note 21, “Commitments and Contingencies,” to our audited Consolidated Financial Statements included elsewhere in this prospectus for a description of certain matters involving Lucent for which Avaya Inc. has assumed responsibility under the Contribution and Distribution Agreement. We cannot assure you that Lucent will not submit a claim for indemnification or cost sharing to us in connection with any future matter. In addition, our ability to assess the impact of matters for which Avaya Inc. may have to indemnify or share the cost with Lucent is made more difficult by the fact that we do not control the defense of these matters.
In addition, in connection with the distribution, Avaya Inc. and Lucent entered into a Tax Sharing Agreement that governs the parties’ respective rights, responsibilities and obligations after the distribution with respect to taxes for the periods ending on or before the distribution. Generally, pre-distribution taxes that are clearly attributable to the business of one party will be borne solely by that party, and other pre-distribution taxes will be shared by the parties based on a formula set forth in the Tax Sharing Agreement. Costs borne by Avaya under the Tax Sharing Agreement could have an adverse impact on our business, results of operations or financial condition.
We may not realize the benefits we expect from our cost-reduction initiatives.
As discussed in “Management’s Discussion & Analysis of Financial Condition and Results of Operations-Continued Focus on Cost Structure,” we have initiated costs savings programs designed to streamline operations and we continue to evaluate additional similar opportunities. These types of cost-reduction activities are complex. Even if we carry out these strategies in the manner we expect, we may not be able to achieve the efficiencies or savings we anticipate, or on the timetable we anticipate, and any expected efficiencies and benefits might be delayed or not realized, and our operations and business could be disrupted. Our ability to realize the gross margin improvements and other efficiencies expected to result from these initiatives is subject to many risks, including delays in the anticipated timing of activities related to these initiatives, lack of sustainability in cost savings over time and unexpected costs associated with operating our business, our success in reinvesting the savings arising from these initiatives, time required to complete planned actions, absence of material issues associated with workforce reductions and avoidance of unexpected disruptions in service. A failure to implement our initiatives or realize expected benefits could have an adverse effect on our financial condition that could be material.
Risks Related to Our Debt
Our degree of leverage could adversely affect our ability to raise additional capital to fund our operations, limit our ability to react to changes in the economy or our industry, expose us to interest rate risk to the extent of our variable rate debt and prevent us from meeting obligations on our indebtedness.
The significant terms of our financing agreements can be found in Note 10, “Financing Arrangements,” to our audited Consolidated Financial Statements included elsewhere in this prospectus. As of September 30, 2014, our total indebtedness was $6,023 million (excluding capital lease obligations). Avaya Inc.’s senior secured multi-currency asset-based revolving credit facility allows for senior secured borrowings of up to $335 million and the right to request up to $100 million of additional commitments. As of September 30, 2014, Avaya Inc. had $40 million of outstanding borrowings and $79 million of undrawn letters of credit outstanding under this facility. In addition, the senior secured multi-currency revolver available under our senior secured credit facility allows for senior secured borrowings of up to $200 million, and as of September 30, 2014, there were $90 million of issued and outstanding borrowings under the senior secured multi-currency revolver.
26
Table of Contents
Our degree of leverage could have consequences, including:
| • | making it more difficult for us to make payments on our indebtedness; |
| • | increasing our vulnerability to general economic and industry conditions; |
| • | requiring a substantial portion of cash flow from operations to be dedicated to the payment of principal and interest on our indebtedness, thereby reducing our ability to use our cash flow to fund our operations, capital expenditures and future business opportunities; |
| • | exposing us to the risk of increased interest rates as borrowings under Avaya Inc.’s senior secured multi-currency asset-based revolving credit facility and Avaya Inc.’s senior secured credit facility are at variable rates of interest; |
| • | limiting our ability to make strategic acquisitions; |
| • | limiting our ability to obtain additional financing for working capital, capital expenditures, debt service requirements, acquisitions and general corporate or other purposes; and |
| • | limiting our ability to adjust to changing market conditions and placing us at a competitive disadvantage compared to our competitors who are less highly leveraged. |
Our debt agreements contain restrictions that limit in certain respects our flexibility in operating our business.
Avaya Inc.’s credit facilities, the indentures governing its senior secured notes due April 1, 2019 (the “2019 senior secured notes”) and the indenture governing its senior secured notes due 2021 (the “2021 senior secured notes” and, together with the 2019 senior secured notes, the “notes,”) contain various covenants that limit our ability to engage in specific types of transactions. These covenants limit Avaya Inc.’s and its restricted subsidiaries’ ability to:
| • | incur or guarantee additional debt and issue or sell certain preferred stock; |
| • | pay dividends on, redeem or repurchase our capital stock; |
| • | make certain acquisitions or investments; |
| • | incur or assume certain liens; |
| • | enter into transactions with affiliates; and |
| • | sell assets to, or merge or consolidate with, another company. |
A breach of any of these covenants could result in a default under one or both of the credit facilities and/or the indentures governing the notes. In the event of any default under either of the credit facilities, the applicable lenders could elect to terminate borrowing commitments and declare all borrowings and loans outstanding, together with accrued and unpaid interest and any fees and other obligations, to be due and payable, which would be an event of default under the indentures governing the notes.
We have refinanced our and our subsidiaries’ debt in the past but there is no assurance we will be able to refinance all or any portion of our or our subsidiaries’ debt in the future. If we were unable to repay or otherwise refinance these borrowings and loans when due, the applicable secured lenders could proceed against the collateral granted to them to secure that indebtedness, which could force us into bankruptcy or liquidation. In the event the lenders accelerate the repayment of our or our subsidiaries’ borrowings, we and our subsidiaries may not have sufficient assets to repay that indebtedness.
27
Table of Contents
We may not be able to generate sufficient cash to service all of our indebtedness and our other ongoing liquidity needs, and we may be forced to take other actions to satisfy our obligations under our indebtedness, which may not be successful.
Our ability to make scheduled payments on or to refinance our debt obligations and to fund our planned capital expenditures, acquisitions and other ongoing liquidity needs depends on our financial condition and operating performance, which is subject to prevailing economic and competitive conditions and to certain financial, business and other factors beyond our control. There can be no assurance that we will maintain a level of cash flow from operating activities or that future borrowings will be available to us under either of our credit facilities or otherwise in an amount sufficient to permit us to pay the principal, premium, if any, and interest on our indebtedness. If our cash flow and capital resources are insufficient to fund our debt service obligations, we may be forced to reduce or delay investments and capital expenditures, or to seek additional capital or restructure or refinance our indebtedness. These alternative measures may not be successful and may not permit us to meet our scheduled debt service obligations. In the absence of such operating results and resources, we could face substantial liquidity problems and might be required to dispose of material assets or operations to meet our debt service and other obligations. Avaya Inc.’s credit facilities and the indentures governing the notes restrict the ability of Avaya Inc. and its restricted subsidiaries to dispose of assets and use the proceeds from the disposition. Accordingly, we may not be able to consummate those dispositions or to obtain any proceeds on terms acceptable to us or at all, and any such proceeds may not be adequate to meet any debt service obligations then due.
Despite our level of indebtedness, we and our subsidiaries may be able to incur additional indebtedness. This could further exacerbate the risks associated with our degree of leverage.
We and our subsidiaries may be able to incur additional indebtedness in the future. Although the credit facilities and the indentures governing the notes contain restrictions on the incurrence of additional indebtedness, these restrictions are subject to a number of significant qualifications and exceptions, and any indebtedness incurred in compliance with these restrictions could be substantial. To the extent new debt is added to our and our subsidiaries’ currently anticipated debt levels, the related risks that we and our subsidiaries face could intensify.
A ratings downgrade of Avaya Inc. or other negative action by a ratings organization could adversely affect the trading price of the shares of our common stock.
Credit rating agencies continually revise their ratings for companies they follow. The condition of the financial and credit markets and prevailing interest rates have fluctuated in the past and are likely to fluctuate in the future. In addition, developments in our business and operations could lead to a ratings downgrade for Avaya Inc. Any such fluctuation in the rating of Avaya Inc. may impact Avaya Inc.’s ability to access debt markets in the future or increase its cost of future debt which could have a material adverse effect on the operations and financial condition of Avaya Inc., which in return may adversely affect the trading price of shares of our common stock.
Risks Related to this Offering and Ownership of Our Common Stock
An active trading market for our common stock may not develop.
Prior to this offering, there has been no public market for our common stock. Although we have applied to list our common stock on the New York Stock Exchange, an active trading market for our shares may never develop or be sustained following this offering. If the market does not develop or is not sustained, it may be difficult for you to sell your shares of common stock at a price that is attractive to you or at all. In addition, an inactive market may impair our ability to raise capital by selling shares and may impair our ability to acquire other companies by using our shares as consideration, which, in turn, could materially adversely affect our business.
28
Table of Contents
The price of our common stock may be volatile and fluctuate substantially, which could result in substantial losses for investors purchasing shares in this offering.
The initial public offering price for the shares of our common stock sold in this offering will be determined by negotiation between the representatives of the underwriters and us. This price may not reflect the market price of our common stock following this offering. In addition, the market price of our common stock is likely to be highly volatile and may fluctuate substantially due to the following factors (in addition to the other risk factors described in this section):
| • | actual or anticipated fluctuations in our results of operations; |
| • | variance in our financial performance from the expectations of equity research analysts; |
| • | conditions and trends in the markets we serve; |
| • | announcements of significant new services or products by us or our competitors; |
| • | additions or changes to key employees; |
| • | changes in market valuation or earnings of our competitors; |
| • | the trading volume of our common stock; |
| • | future sale of our equity securities; |
| • | changes in the estimation of the future size and growth rate of our markets; |
| • | legislation or regulatory policies, practices or actions; and |
| • | general economic conditions. |
In addition, the stock markets in general have experienced extreme price and volume fluctuations that have often been unrelated or disproportionate to the operating performance of the particular companies affected. These broad market and industry factors may materially harm the market price of our common stock irrespective of our operating performance. As a result of these factors, you might be unable to resell your shares at or above the initial public offering price after this offering.
The Sponsors will have the ability to control the outcome of matters submitted for stockholder approval and may have interests that differ from those of our other stockholders.
After the completion of this offering, the Sponsors will own approximately % of our common stock, or % on a fully diluted basis. The Sponsors have significant influence over corporate transactions. So long as investment funds associated with or designated by the Sponsors continue to own a significant amount of the outstanding shares of our common stock, even if such amount is less than 50%, the Sponsors will continue to be able to strongly influence or effectively control our decisions, regardless of whether or not other stockholders believe that the transaction is in their own best interests. Such concentration of voting power could also have the effect of delaying, deterring or preventing a change of control or other business combination that might otherwise be beneficial to our stockholders.
In addition, the Sponsors and their affiliates are in the business of making investments in companies and may, from time to time in the future, acquire interests in businesses that directly or indirectly compete with certain portions of our business. To the extent the Sponsors invest in such other businesses, the Sponsors may have differing interests than our other stockholders. The Sponsors may also pursue acquisition opportunities that may be complementary to our business and, as a result, those acquisition opportunities may not be available to us.
29
Table of Contents
We are a “controlled company” within the meaning of the rules of the New York Stock Exchange and, as a result, will qualify for, and intend to rely on, exemptions from certain corporate governance requirements.
After completion of this offering, the Sponsors will continue to control a majority of the voting power of our outstanding common stock. As a result, we are a “controlled company” within the meaning of the corporate governance rules of the New York Stock Exchange. Under these rules, a company of which more than 50% of the voting power is held by an individual, group or another company is a “controlled company” and may elect not to comply with certain corporate governance requirements, including:
| • | the requirement that a majority of the board of directors consist of independent directors; |
| • | the requirement that we have a nominating/corporate governance committee that is composed entirely of independent directors; |
| • | the requirement that we have a compensation committee that is composed entirely of independent directors; and |
| • | the requirement for an annual performance evaluation of the nominating/corporate governance and compensation committees. |
Following this offering, we intend to utilize some or all of those exemptions. As a result, we may not have a majority of independent directors, our nominating and corporate governance committee and compensation committee may not consist entirely of independent directors and, while we may choose to do so, such committees will not be required to conduct annual performance evaluations.
Accordingly, you will not be similarly situated to stockholders of companies that are subject to all of the corporate governance requirements of the New York Stock Exchange.
New investors in our common stock will experience immediate and substantial book value dilution after this offering.
The initial public offering price of our common stock will be substantially higher than the pro forma net tangible book value, or deficit, per share of the outstanding shares immediately after the offering. Based on an assumed initial public offering price of $ per share, the midpoint of the price range set forth on the cover of this prospectus, and our as-adjusted deficit at September 30, 2014, if you purchase our shares in this offering, you will suffer immediate dilution in net tangible book value per share of approximately $ per share. See “Dilution” included elsewhere in this prospectus.
Upon expiration of lock-up arrangements between the underwriters and our officers, directors and certain holders of our common stock, a substantial number of shares of our common stock could be sold into the public market shortly after this offering, which could depress our stock price.
Our officers, directors and certain holders of our common stock, options and warrants, holding substantially all of our outstanding shares of common stock prior to completion of this offering, have entered into lock-up agreements with our underwriters which prohibit, subject to certain limited exceptions, the disposal or pledge of, or the hedging against, any of their common stock or securities convertible into or exchangeable for shares of common stock for a period through the date 180 days after the date of this prospectus, subject to extension in certain circumstances. Our management stockholders’ agreement also restricts the parties thereto from transferring their shares of common stock or any securities convertible into or exchangeable or exercisable for shares of common stock (other than shares acquired in the public market subsequent to this offering and other than certain transfers to their affiliates) until 180 days after the effective date of the registration statement. The market price of our common stock could decline as a result of sales by our existing stockholders in the market after this offering and after the expiration of these lock-up periods, or the perception that these sales could occur. If a trading market develops for our common stock, and after these lock-up periods expire, many of our stockholders will have an opportunity to sell their stock for the first time. These factors could also make it difficult for us to raise additional capital by selling stock. Please see the section titled “Shares Eligible for Future
30
Table of Contents
Sale” for additional information regarding these factors. In addition, in the future, we may issue securities to raise additional capital or to acquire interests in other companies or technologies. As a result, your interest in our company may be further diluted and the market price of our common stock could decline.
We are a holding company and rely on dividends, distributions and other payments, advances and transfers of funds from our subsidiaries to meet our obligations.
We have no direct operations and derive all of our cash flow from our subsidiaries. Because we conduct our operations through our subsidiaries, we depend on those entities for dividends and other payments or distributions to meet our obligations. The deterioration of the earnings from, or other available assets of, our subsidiaries for any reason could limit or impair their ability to pay dividends or other distributions to us.
We currently do not intend to pay dividends on our common stock and, consequently, your only opportunity to achieve a return on your investment is if the price of our common stock appreciates.
Following the completion of this offering, we do not anticipate that we will pay any cash dividends on shares of our common stock for the foreseeable future. Any determination to pay dividends in the future will be at the discretion of our board of directors and will depend on results of operations, financial condition, contractual restrictions, restrictions imposed by applicable law and other factors our board of directors deems relevant. Accordingly, if you purchase shares in this offering, realization of a gain on your investment will depend on the appreciation of the price of our common stock, which may never occur. Investors seeking cash dividends in the foreseeable future should not purchase our common stock. Please see the section titled “Dividend Policy” for additional information.
Anti-takeover provisions in our certificate of incorporation and bylaws could prevent or delay a change in control of our company.
Our certificate of incorporation and our bylaws contain certain provisions that may discourage, delay or prevent a change in our management or control over us that stockholders may consider favorable, including the following, some of which may only become effective when the Sponsors collectively beneficially own less than 40% of our outstanding shares of common stock:
| • | the division of our board of directors into three classes and the election of each class for three-year terms; |
| • | the sole ability of the board of directors to fill a vacancy created by the expansion of the board of directors; |
| • | advance notice requirements for stockholder proposals and director nominations; |
| • | limitations on the ability of stockholders to call special meetings and to take action by written consent; |
| • | the approval of holders of at least two-thirds of the shares entitled to vote generally on the making, alteration, amendment or repeal of our certificate of incorporation or bylaws, will be required to adopt, amend or repeal our bylaws, or amend or repeal certain provisions of our certificate of incorporation; |
| • | the required approval of holders of at least two-thirds of the shares entitled to vote at an election of the directors to remove directors and, following the classification of the board of directors, removal only for cause; and |
| • | the ability of our board of directors to designate the terms of and issue new series of preferred stock, without stockholder approval, which could be used to institute a rights plan, or a poison pill, that would work to dilute the stock ownership or a potential hostile acquirer, likely preventing acquisitions that have not been approved by our board of directors. |
The existence of the foregoing provisions and other anti-takeover measures could limit the price that investors might be willing to pay in the future for shares of our common stock. They could also deter potential acquirers of our company, thereby reducing the likelihood that you could receive a premium for your common stock in an acquisition. For more information, please see the section titled “Description of Capital Stock.”
31
Table of Contents
If securities or industry analysts do not publish research or reports or publish unfavorable research or reports about our business, our stock price and trading volume could decline.
The trading market for our common stock will depend in part on the research and reports that securities or industry analysts publish about us, our business, our market or our competitors. We may not obtain research coverage by securities and industry analysts. If no securities or industry analysts commence coverage of our company, the trading price for our stock could be negatively impacted. In the event we obtain securities or industry analyst coverage, if one or more of the analysts who covers us publishes unfavorable research or reports or downgrades our stock, our stock price would likely decline. If one or more of these analysts ceases to cover us or fails to regularly publish reports on us, interest in our stock could decrease, which could cause our stock price or trading volume to decline.
32
Table of Contents
SPECIAL NOTE REGARDING FORWARD-LOOKING STATEMENTS
This prospectus contains “forward-looking statements.” In some cases, these statements may be identified by the use of forward-looking terminology such as “anticipate,” “believe,” “continue,” “could,” “estimate,” “expect,” “intend,” “may,” “might,” “our vision,” “plan,” “potential,” “predict,” “should,” “will” or “would” or other similar words. These statements discuss future expectations, contain projections of results of operations or of financial condition, or state trends and known uncertainties or other forward-looking information. You are cautioned that forward-looking statements are inherently uncertain. Each forward-looking statement contained in this prospectus is subject to risks and uncertainties that could cause actual results to differ materially from those expressed or implied by such statement. We refer you to the section entitled “Risk Factors” in this prospectus for identification of important factors with respect to these risks and uncertainties. We caution readers not to place considerable reliance on such statements. Our business is subject to substantial risks and uncertainties, including those identified in this prospectus. The information contained in this prospectus is provided by us as of the date of this prospectus, and we do not undertake any obligation to update any forward-looking statements contained in this document as a result of new information, future events or otherwise. Forward-looking statements include, without limitation, statements regarding:
| • | our expectations regarding our revenue, cost of revenue, selling, general and administrative expenses, research and development expenses, amortization of intangible assets and interest expense; |
| • | our expectations regarding the demand for our next-generation business collaboration products and the market trends contributing to such demand; |
| • | our strategy for worldwide growth, including our ability to develop and sell collaboration and communications products and services, including unified communications, networking products and contact center products; |
| • | the strength of our current intellectual property portfolio and our intention to obtain patents and other intellectual property rights used in connection with our business; |
| • | our anticipated competition as the business collaboration market evolves; |
| • | the product sales to be generated by our backlog; |
| • | our future cash requirements, including our primary cash requirements for the period October 1, 2014 through September 30, 2015; |
| • | our intention to use the net proceeds of the initial public offering to repay certain of our existing indebtedness and to redeem some or all of our Series A Preferred Stock; |
| • | our future sources of liquidity, including any future refinancing of our existing debt or issuance of additional securities; |
| • | the uncertainties regarding our liquidity, including our ability to generate revenue, reduce costs, make future acquisitions and defend against litigation; |
| • | the impact of new accounting pronouncements; and |
| • | our expectations regarding the impact of legal proceedings, including antitrust, intellectual property or employment litigation. |
Many factors could cause our actual results, performance or achievements to differ materially from any future results, performance or achievements expressed or implied by these forward-looking statements. Some of the key factors that could cause actual results to differ from our expectations include:
| • | our ability to develop and sell advanced business collaboration and communications products and services, including unified communications, networking products and contact center products; |
| • | our reliance on our indirect sales channel; |
33
Table of Contents
| • | the market for our products and services; |
| • | our ability to remain competitive in the markets we serve; |
| • | economic conditions and the willingness of enterprises to make technology investments; |
| • | our ability to retain and attract key employees; |
| • | our degree of leverage and its effect on our ability to raise additional capital and to react to changes in the economy or our industry; |
| • | our ability to integrate acquired businesses; |
| • | our ability to successfully transition toward or integrate the products of acquired businesses into our portfolio; |
| • | our ability to manage our supply chain and logistics functions; |
| • | the ability to protect our intellectual property and avoid claims of infringement; |
| • | an adverse result in any significant litigation, including antitrust, intellectual property or employment litigation; |
| • | our ability to maintain adequate security over our information systems, products and services; |
| • | environmental, health and safety laws, regulations, costs and other liabilities and climate change risks; |
| • | our ability to realize the benefits we expect from our cost reduction initiatives; |
| • | changes to Avaya Inc.’s tax rates; |
| • | fluctuations in foreign currency exchange rates; |
| • | our ability to detect and fix design defects and “bugs”; |
| • | risks relating to the transaction of business internationally, and |
| • | pension and post-retirement healthcare and life insurance liabilities. |
34
Table of Contents
We estimate that the net proceeds of the sale of the common stock that we are offering will be approximately $ million after deducting estimated underwriting discounts and commissions and estimated offering expenses payable by us. This assumes an initial public offering price of $ per share, which is the midpoint of the range listed on the cover page of this prospectus.
We currently expect to use the net proceeds to us from this offering for the following purposes and in the following amounts:
| • | approximately $ million will be used to pay certain amounts in connection with the termination of our management services agreement with affiliates of our Sponsors as described under “Certain Relationships and Related Party Transactions,” of which $ million and $ million will be paid to Silver Lake and TPG, respectively, pursuant to the terms of the agreement. |
We intend to use the remainder of the net proceeds, if any, for working capital and other general corporate purposes, including repayment of a portion of our long-term indebtedness, redemption of some or all of our outstanding Series A Preferred Stock and supporting our strategic growth opportunities in the future.
While we currently anticipate that we will use the net proceeds of this offering as described above, we may reallocate the net proceeds from time to time depending upon market and other conditions in effect at the time. To the extent the net proceeds of this offering are greater or less than the estimated amount, because either the offering does not price at the midpoint of the estimated price range or the size of the offering changes, the difference will increase or decrease the amount of net proceeds available for the purposes set forth above. Pending their application, we intend to invest the net proceeds in short-term, interest-bearing, investment-grade securities.
35
Table of Contents
Our payment of dividends on our common stock in the future will be determined by our board of directors in its sole discretion and will depend on business conditions, our financial condition, earnings, liquidity and capital requirements, the covenants in agreements governing our indebtedness and other factors. We have no current plans to pay dividends on our common stock.
As disclosed above under “Use of Proceeds,” we may use a portion of the net proceeds from this offering to redeem some or all of our outstanding Series A Preferred Stock. Subject to the rights of holders of our Series B Convertible Preferred Stock as described below, the certificate of designations for the Series A Preferred Stock grants holders of our Series A Preferred Stock the right to receive, as, when and if declared by our board of directors and in preference to the holders of any and all other series or classes of capital stock, payable either in cash or, at our option, by issuance of additional shares of Series A Preferred Stock, cumulative annual dividends at a rate of 5% per annum on $1,000 per share (which value is to be proportionately adjusted to reflect any stock dividend, stock split, combination of shares, reclassification, reorganization, recapitalization or other similar event affecting the Series A Preferred Stock), compounded quarterly from and after the date of issuance of such shares of Series A Preferred Stock. As of September 30, 2014, the carrying value of our Series A Preferred Stock was $159 million which includes $34 million of accumulated and unpaid dividends as well as $57 million of discount accretion. The $57 million of discount accretion was recorded to the carrying amount of the Series A Preferred Stock at the date of issuance so that the carrying amount was equal to the redemption amount at that date of $125 million.
The certificate of designations for the Series B Convertible Preferred Stock grants holders of our Series B Convertible Preferred Stock the right to receive, as, when and if declared by our board of directors and in preference to the holders of any and all other series or classes of capital stock, payable either in cash or, at our option, by issuance of additional shares of Series B Convertible Preferred Stock, cumulative annual dividends at a rate of 8% per annum on $4,000 per share (which value is to be proportionately adjusted to reflect any stock dividend, stock split, combination of shares, reclassification, reorganization, recapitalization or other similar event affecting the Series B Convertible Preferred Stock), compounded annually from and after the date of issuance of such shares of Series B Convertible Preferred Stock. Additionally, holders of Series B Convertible Preferred Stock participate in any dividends payable on shares of the Company’s common stock on an as converted basis. As of September 30, 2014, the carrying value of our Series B Convertible Preferred Stock was $300 million which includes $38 million of accumulated and unpaid dividends, $66 million of accretion to the redemption price, as well as $33 million of discount accretion at the date of issuance.
So long as any share of our Series A Preferred Stock and Series B Convertible Preferred Stock remain outstanding, no dividend or distribution may be declared or paid on our common stock unless all accrued and unpaid dividends have been paid on our Series A Preferred Stock and Series B Convertible Preferred Stock and dividends paid on our common stock may not be paid at a rate greater than the rate paid on Series A Preferred Stock or Series B Convertible Preferred Stock.
In addition, because Avaya Holdings Corp. is a holding company, its ability to pay cash dividends on its common stock may be limited by restrictions on its ability to obtain sufficient funds through dividends or other means from subsidiaries, including restrictions under the terms of the agreements governing Avaya Inc.’s indebtedness. Refer to the section of this prospectus entitled “Description of Certain Outstanding Indebtedness” for a more detailed discussion of the agreements governing our indebtedness and the section of this prospectus entitled “Description of Capital Stock” for a more detailed description of the terms of our Series A Preferred Stock and our Series B Convertible Preferred Stock.
36
Table of Contents
The following table sets forth our capitalization as of September 30, 2014:
| • | on an actual basis; and |
| • | on a pro forma basis after giving effect to (i) the sale by us of shares of common stock at an assumed initial public offering price of $ per share and after deducting estimated underwriting discounts and commissions and estimated offering expenses payable by us and (ii) the application of such net proceeds as described under “Use of Proceeds.” For purpose of this table, the assumed initial public offering price is $ per share, which is the midpoint of the range listed on the cover page of this prospectus. |
You should read the following table in conjunction with our Consolidated Financial Statements and related notes, “Selected Historical Consolidated Financial Data” and “Management’s Discussion and Analysis of Financial Condition and Results of Operations,” all included elsewhere in this prospectus.
| As of September 30, 2014 | ||||||
| Actual | Pro Forma(1) | |||||
| (in millions, except share amounts) | ||||||
| Cash and cash equivalents |
$ | 322 | ||||
|
|
|
| ||||
|
Debt:(2) |
||||||
| Senior secured multi-currency asset-based revolving credit facility |
$ | 40 | ||||
| Senior secured multi-currency revolver |
90 | |||||
| Senior secured term B-3 loans |
2,102 | |||||
| Senior secured term B-4 loans |
1 | |||||
| Senior secured term B-6 loans |
1,128 | |||||
| 7% senior secured notes |
1,009 | |||||
| 9% senior secured notes |
290 | |||||
| 10.50% senior secured notes |
1,384 | |||||
| Unaccreted discount |
(21 | ) | ||||
|
|
|
| ||||
| Total debt |
6,023 | |||||
|
|
|
| ||||
| Equity awards on redeemable shares |
21 | |||||
| Preferred stock, par value $.001 per share; authorized 250,000 shares |
||||||
| Series B, 48,921 and 48,921 shares issued and outstanding on an actual and pro forma basis, respectively(3) |
300 | |||||
| Series A, 125,000 and 125,000 shares issued and outstanding on an actual and pro forma basis, respectively |
159 | |||||
| Deficiency: |
||||||
| Common stock, par value $.001 per share; authorized 750,000,000 shares, outstanding 489,459,943 and shares on an actual and pro forma basis, respectively |
||||||
| Additional paid-in capital |
2,453 | |||||
| Accumulated deficit |
(4,874 | ) | ||||
| Accumulated other comprehensive loss |
(1,200 | ) | ||||
|
|
|
| ||||
| Total deficiency |
(3,621 | ) | ||||
|
|
|
| ||||
| Total capitalization |
$ | 2,882 | ||||
|
|
|
| ||||
| (1) | Assumes the net proceeds from this offering are used to repay $ million of our long-term indebtedness, and to redeem some or all of our outstanding shares of our Series A Preferred Stock for up to $159 million, |
37
Table of Contents
| which includes accumulated and accrued unpaid dividends of $34 million, as well as the discount accretion recorded at the date of issuance of $57 million; the remainder of the net proceeds, of $ million to pay for working capital and other general corporate purposes, including supporting our strategic growth opportunities in the future. The pro forma amounts do not give effect to any accounting charges that may be recorded as a result of such payment. A $1.00 increase (decrease) in the assumed initial public offering price of $ per share, the mid-point of the estimated price range set forth on the cover page of this prospectus and the application of the net proceeds therefrom, would (i) increase (decrease) the net proceeds to us by $ million, assuming the number of shares offered by us, as set forth on the cover page of this prospectus, remains the same and after deducting underwriting discounts and commissions and estimated offering expenses payable by us. |
| (2) | For additional information regarding our outstanding indebtedness, refer to “Management’s Discussion and Analysis of Financial Condition and Results of Operations—Liquidity and Capital Resources—Financing Activities,” “Description of Certain Outstanding Indebtedness” and Note 10, “Financing Arrangements,” to our audited Consolidated Financial Statements included elsewhere in this prospectus. |
| (3) | Includes accumulated and unpaid dividends of $38 million, accretion to the redemption price of $66 million, as well as the discount accretion recorded at the date of issuance of $33 million. Refer to Note 16, “Capital Stock,” to our audited Consolidated Financial Statements included elsewhere in this prospectus. |
38
Table of Contents
If you invest in shares of our common stock in this offering, your interest will be diluted to the extent of the difference between the public offering price per share of our common stock and the as-adjusted net tangible book value, or deficit, per share of our common stock after this offering. The deficit is calculated as the liabilities in excess of our net tangible book value. The deficit per share is determined by dividing the numerator of total liabilities plus the book value of our Series A Preferred Stock less total tangible assets (total assets less intangible assets) by the denominator of the number of outstanding shares of common stock. Our deficit value at September 30, 2014 was $8,571 million or $17.51 per share of common stock.
Our as-adjusted deficit at September 30, 2014, after giving effect to the sale by us of shares of common stock at an assumed initial public offering price of $ per share, which is the midpoint of the range listed on the cover of this prospectus, and application of the net proceeds therefrom, and after deducting estimated underwriting discounts and commissions and estimated offering expenses payable by us, would have been approximately $ million, or $ per share. This represents an immediate increase in as-adjusted deficit of $ per share to existing stockholders and an immediate dilution of $ per share to new investors, or approximately % of the assumed initial public offering price of $ per share. The following table illustrates this per share dilution:
| Assumed initial public offering price per share |
$ | |||||||
| Deficit per share as of September 30, 2014, before giving effect to this offering |
$ | (8,571 | ) | |||||
| Decrease in deficit per share attributable to investors purchasing shares in this offering |
||||||||
| As adjusted deficit per share, after giving effect to this offering |
A $1.00 increase (decrease) in the assumed initial public offering price of $ per share would decrease (increase) our as-adjusted deficit by $ million, the as-adjusted deficit per share after this offering by $ per share and the dilution in as-adjusted deficit per share to investors in this offering by $ per share, assuming that the number of shares offered by us, as set forth on the cover page of this prospectus, remains the same and after deducting the estimated underwriting discount and estimated offering expenses payable by us.
The following table summarizes, as of September 30, 2014, the number of shares of common stock purchased from us since inception, the total consideration paid to us and the average price per share paid by existing shareholders and by new investors purchasing shares of common stock in this offering at an assumed initial public offering price of $ per share, before deducting underwriting discount and estimated offering expenses payable by us.
| Shares Purchased | Total Consideration | Average Price Per Share |
||||||||||||||
| Number | Percent | Amount | Percent | |||||||||||||
| Existing shareholders |
$ | $ | ||||||||||||||
| New investors |
||||||||||||||||
|
|
|
|
|
|
|
|||||||||||
| Total |
||||||||||||||||
|
|
|
|
|
|
|
|||||||||||
A $1.00 increase (decrease) in the assumed initial public offering price of $ per share would increase (decrease) total consideration paid by new investors, total consideration paid by all stockholders and the average price per share paid by all stockholders by $ million, $ million and $ per share, assuming the number of shares offered by us, as set forth on the cover page of this prospectus, remains the same and before deducting underwriting discounts and commissions and estimated offering expenses payable by us.
The above discussion and table are based on 489,459,943 shares of common stock outstanding as of September 30, 2014. This excludes the following numbers of shares of our common stock issuable in connection
39
Table of Contents
with the exercise of warrants outstanding as of September 30, 2014, the conversion of our Series B Convertible Preferred Stock and equity awards under our Amended and Restated 2007 Equity Incentive Plan:
| • | 100,000,000 shares of common stock issuable upon the exercise of warrants held by affiliates of our Sponsors, which warrants are subject to the lock-up agreements described under “Underwriters” and exercisable at any time prior to December 18, 2019 at an exercise price of $3.25 per share (see “Description of Capital Stock—Warrants”); |
| • | 24,460,642 shares of common stock issuable upon the exercise of warrants held by affiliates of our Sponsors, which warrants are subject to the lock-up agreements described under “Underwriters” and exercisable at any time prior to May 29, 2022 at an exercise price of $4.00 per share (see “Description of Capital Stock—Warrants”); |
| • | shares of common stock issuable upon conversion of the Series B Convertible Preferred shares held by affiliates of our Sponsors, and convertible at any time as such Series B Convertible Preferred Stock is outstanding at a conversion price equal to the lesser of (1) $4.00 per share (subject to certain anti-dilution provisions) and (2) the offering price per share in this offering, which such shares if converted are subject to the lock-up agreements described under “Underwriters” (see “Description of Capital Stock—Preferred Stock—Series B Convertible Preferred Stock”); |
| • | 26,055,786 shares of common stock issuable upon the exercise of options with exercise prices ranging from $2.25 to $5.00 per share and a weighted average exercise price of $2.95 per share; |
| • | 16,172,848 shares of common stock issuable upon the vesting and distribution of RSUs; and |
| • | 4,530,864 additional shares of common stock as of September 30, 2014 reserved for future grants under the 2007 Plan. |
This also excludes additional shares of common stock reserved for future equity incentive plans to be effective upon the completion of this offering.
To the extent the options or warrants are exercised and awards are granted under these plans, there may be further economic dilution to our stockholders.
40
Table of Contents
SELECTED HISTORICAL CONSOLIDATED FINANCIAL DATA
Avaya Holdings Corp., was formed by affiliates of two private equity firms, Silver Lake Partners (“Silver Lake”) and TPG Capital (“TPG”) (collectively, the “Sponsors”). Avaya Holdings Corp., through a subsidiary holding corporation, acquired Avaya Inc. in a transaction that was completed on October 26, 2007 (the “Merger”) with Avaya Inc. continuing as the surviving entity and a wholly owned subsidiary of Avaya Holdings Corp. Avaya Holdings Corp. is a holding company and has no material assets or stand-alone operations other than the ownership in Avaya Inc. and its subsidiaries. See discussion in Note 1, “Description of Business,” to our audited Consolidated Financial Statements included elsewhere in this prospectus for further details.
The selected historical consolidated financial data set forth below as of September 30, 2014 and 2013 and for the years ended September 30, 2014, 2013 and 2012 have been derived from our audited Consolidated Financial Statements and related notes included elsewhere in this prospectus. The selected historical consolidated financial data set forth below as of September 30, 2012 and as of and for the years ended September 30, 2011 and 2010 has been derived from Consolidated Financial Statements that are not included in this prospectus.
The selected historical consolidated financial data set forth below should be read in conjunction with our audited Consolidated Financial Statements and the related notes and the “Management’s Discussion and Analysis of Financial Condition and Results of Operations” included elsewhere in this prospectus. Our financial information may not be indicative of future performance.
41
Table of Contents
| Fiscal years
ended September 30, |
||||||||||||||||||||
| 2014 | 2013 | 2012 | 2011 | 2010 | ||||||||||||||||
| (in millions, except per share amounts) |
||||||||||||||||||||
| STATEMENTS OF OPERATIONS DATA: |
||||||||||||||||||||
| REVENUE |
||||||||||||||||||||
| Products |
$ | 2,196 | $ | 2,337 | $ | 2,672 | $ | 2,976 | $ | 2,602 | ||||||||||
| Services |
2,175 | 2,241 | 2,347 | 2,398 | 2,300 | |||||||||||||||
|
|
|
|
|
|
|
|
|
|
|
|||||||||||
| 4,371 | 4,578 | 5,019 | 5,374 | 4,902 | ||||||||||||||||
|
|
|
|
|
|
|
|
|
|
|
|||||||||||
| COSTS |
||||||||||||||||||||
| Products: |
||||||||||||||||||||
| Costs (exclusive of amortization of acquired technology intangible assets) |
854 | 963 | 1,145 | 1,314 | 1,243 | |||||||||||||||
| Amortization of acquired technology intangible assets |
56 | 63 | 192 | 257 | 291 | |||||||||||||||
| Services |
962 | 1,022 | 1,134 | 1,214 | 1,237 | |||||||||||||||
|
|
|
|
|
|
|
|
|
|
|
|||||||||||
| 1,872 | 2,048 | 2,471 | 2,785 | 2,771 | ||||||||||||||||
|
|
|
|
|
|
|
|
|
|
|
|||||||||||
| GROSS PROFIT |
2,499 | 2,530 | 2,548 | 2,589 | 2,131 | |||||||||||||||
|
|
|
|
|
|
|
|
|
|
|
|||||||||||
| OPERATING EXPENSES |
||||||||||||||||||||
| Selling, general and administrative |
1,531 | 1,512 | 1,617 | 1,833 | 1,709 | |||||||||||||||
| Research and development |
379 | 445 | 464 | 461 | 407 | |||||||||||||||
| Amortization of intangible assets |
227 | 228 | 227 | 227 | 219 | |||||||||||||||
| Restructuring and impairment charges, net |
165 | 200 | 147 | 189 | 187 | |||||||||||||||
| Acquisition-related costs |
— | 1 | 4 | 5 | 20 | |||||||||||||||
|
|
|
|
|
|
|
|
|
|
|
|||||||||||
| 2,302 | 2,386 | 2,459 | 2,715 | 2,542 | ||||||||||||||||
|
|
|
|
|
|
|
|
|
|
|
|||||||||||
| OPERATING INCOME (LOSS) |
197 | 144 | 89 | (126 | ) | (411 | ) | |||||||||||||
| Interest expense |
(459 | ) | (467 | ) | (432 | ) | (460 | ) | (487 | ) | ||||||||||
| Loss on extinguishment of debt |
(5 | ) | (6 | ) | — | (246 | ) | — | ||||||||||||
| Other income (expense), net |
3 | (25 | ) | (29 | ) | 5 | 15 | |||||||||||||
|
|
|
|
|
|
|
|
|
|
|
|||||||||||
| LOSS FROM CONTINUING OPERATIONS BEFORE INCOME TAXES |
(264 | ) | (354 | ) | (372 | ) | (827 | ) | (883 | ) | ||||||||||
| (Provision for) benefit from income taxes |
(51 | ) | 35 | 4 | (54 | ) | (4 | ) | ||||||||||||
|
|
|
|
|
|
|
|
|
|
|
|||||||||||
| LOSS FROM CONTINUING OPERATIONS |
(315 | ) | (319 | ) | (368 | ) | (881 | ) | (887 | ) | ||||||||||
| Income (loss) from discontinued operations, net of income taxes |
62 | (57 | ) | 14 | 18 | 16 | ||||||||||||||
|
|
|
|
|
|
|
|
|
|
|
|||||||||||
| NET LOSS |
(253 | ) | (376 | ) | (354 | ) | (863 | ) | (871 | ) | ||||||||||
| Less: net income attributable to noncontrolling interests |
— | — | — | — | 3 | |||||||||||||||
|
|
|
|
|
|
|
|
|
|
|
|||||||||||
| NET LOSS ATTRIBUTABLE TO AVAYA HOLDINGS CORP. |
(253 | ) | (376 | ) | (354 | ) | (863 | ) | (874 | ) | ||||||||||
| Less: Accretion of issuance costs and accrued dividends on Series A and Series B preferred stock |
(45 | ) | (43 | ) | (71 | ) | (7 | ) | (62 | ) | ||||||||||
|
|
|
|
|
|
|
|
|
|
|
|||||||||||
| NET LOSS ATTRIBUTABLE TO AVAYA HOLDINGS CORP. COMMON STOCKHOLDERS |
$ | (298 | ) | $ | (419 | ) | $ | (425 | ) | $ | (870 | ) | $ | (936 | ) | |||||
|
|
|
|
|
|
|
|
|
|
|
|||||||||||
| Basic and diluted earnings per share attributable to common stockholders: |
||||||||||||||||||||
| Loss from continuing operations per share – basic and diluted |
$ | (0.73 | ) | $ | (0.74 | ) | $ | (0.90 | ) | $ | (1.82 | ) | $ | (1.95 | ) | |||||
| Income (loss) from discontinued operations per share – basic and diluted |
0.13 | (0.12 | ) | 0.03 | 0.04 | 0.03 | ||||||||||||||
|
|
|
|
|
|
|
|
|
|
|
|||||||||||
| Net loss per share – basic and diluted |
$ | (0.60 | ) | $ | (0.86 | ) | $ | (0.87 | ) | $ | (1.78 | ) | $ | (1.92 | ) | |||||
|
|
|
|
|
|
|
|
|
|
|
|||||||||||
| Weighted average shares outstanding – basic and diluted |
495.4 | 489.8 | 489.6 | 489.0 | 488.6 | |||||||||||||||
|
|
|
|
|
|
|
|
|
|
|
|||||||||||
42
Table of Contents
| Fiscal years
ended September 30, |
||||||||||||||||||||
| 2014 | 2013 | 2012 | 2011 | 2010 | ||||||||||||||||
| (in millions) |
||||||||||||||||||||
| BALANCE SHEET DATA (at end of period): |
||||||||||||||||||||
| Cash and cash equivalents |
$ | 322 | $ | 289 | $ | 338 | $ | 415 | $ | 594 | ||||||||||
| Intangible assets, net |
1,224 | 1,497 | 1,787 | 2,142 | 2,617 | |||||||||||||||
| Goodwill |
4,047 | 4,048 | 4,055 | 3,946 | 3,942 | |||||||||||||||
| Total assets |
7,234 | 7,649 | 8,184 | 8,561 | 9,276 | |||||||||||||||
| Total debt (excluding capital lease obligations) |
6,023 | 6,086 | 6,121 | 6,157 | 5,928 | |||||||||||||||
| Equity awards on redeemable shares |
21 | 5 | — | — | — | |||||||||||||||
| Preferred stock, Series B |
300 | 263 | 227 | — | — | |||||||||||||||
| Preferred stock, Series A |
159 | 151 | 144 | 137 | 130 | |||||||||||||||
| Total Avaya Holdings Corp. stockholders’ deficiency |
(3,621 | ) | (3,138 | ) | (2,843 | ) | (2,500 | ) | (1,543 | ) | ||||||||||
| STATEMENT OF CASH FLOWS DATA: |
||||||||||||||||||||
| Net cash provided by (used in) continuing operations: |
||||||||||||||||||||
| Operating activities |
$ | 35 | $ | 131 | $ | 16 | $ | (335 | ) | $ | 12 | |||||||||
| Investing activities |
(33 | ) | (113 | ) | (283 | ) | (101 | ) | (864 | ) | ||||||||||
| Financing activities |
(60 | ) | (79 | ) | 155 | 228 | 853 | |||||||||||||
| OTHER FINANCIAL DATA: |
||||||||||||||||||||
| EBITDA (unaudited) |
$ | 627 | $ | 566 | $ | 622 | $ | 282 | $ | 291 | ||||||||||
| Adjusted EBITDA (unaudited)(1) |
898 | 922 | 946 | 940 | 766 | |||||||||||||||
| Capital expenditures |
134 | 110 | 92 | 83 | 79 | |||||||||||||||
| Capitalized software development costs |
1 | 14 | 35 | 42 | 43 | |||||||||||||||
| (1) | Adjusted EBITDA is calculated in accordance with, and is disclosed herein to demonstrate compliance with, Avaya Inc.’s debt agreements. See “Management’s Discussion and Analysis of Financial Condition and Results of Operations—Non-GAAP Financial Measures and Supplemental Disclosure—EBITDA and Adjusted EBITDA” for a definition and explanation of Adjusted EBITDA and reconciliation of loss from continuing operations to Adjusted EBITDA. |
The following are some of the items affecting the comparability of the selected historical consolidated financial data for the periods presented:
Divestitures—In order to remain focused on our business objectives, we have divested ourselves of certain specialized businesses which were not considered core to our ongoing operations as a global provider of business collaboration and communication products and services or essential to the needs of our primary-customer base.
| • | On March 31, 2014, we completed the sale of our government IT Professional Services, or ITPS, business for a final sales price of $101 million, inclusive of $3 million of working capital adjustments and net of $2 million in costs to sell. As a result of the divestiture of the ITPS business, the results of operations, cash flows, and assets and liabilities of this business have been classified as discontinued operations in all periods presented. Income from discontinued operations for fiscal 2014 includes the gain on the sale of the ITPS business of $52 million. Loss from discontinued operations for fiscal 2013 includes an $89 million impairment charge to the goodwill of the ITPS business. |
| • | In July 2014, we sold the Technology Business Unit, or TBU, which we acquired as part of our acquisition of RADVISION Ltd., or Radvision, and recognized a $14 million gain on the sale, which is included in other income (expense), net. TBU is a software development business that licenses technologies to developers for their use and integration into their own products and includes protocol stacks, client framework solutions and network testing and monitoring tools. |
43
Table of Contents
Refinancing, Interest Expense, and Loss on Extinguishment of Debt—During fiscal 2014, 2013 and 2011, Avaya Inc. completed a series of transactions which allowed Avaya Inc. to refinance certain of its debt arrangements. See Note 10, “Financing Arrangements” to our audited Consolidated Financial Statements included elsewhere in this prospectus for further details regarding our financing arrangements. These transactions included:
| • | During fiscal 2011, Avaya Inc. amended the terms of the multi-currency revolvers available under its senior secured credit facility and its senior secured multi-currency asset-based revolving credit facility to extend the final maturity of each from October 26, 2013 to October 26, 2016 and completed a private placement of $1,009 million of senior secured notes. The proceeds from the notes were used to repay in full the senior secured incremental term B-2 loans outstanding under the senior secured credit facility (representing $988 million in aggregate principal amount and $12 million in accrued and unpaid interest) and to pay related fees and expenses. |
| • | During fiscal 2013 Avaya Inc. completed a series of transaction which allowed Avaya Inc. to refinance (1) all of Avaya Inc. senior secured term B-1 loans (“term B-1 loans”) outstanding under Avaya Inc. senior secured credit facility originally due October 26, 2014, and (2) $642 million of Avaya Inc. 9.75% senior unsecured cash-pay notes and $742 million of Avaya Inc. senior unsecured paid-in-kind (“PIK”) toggle notes each originally due November 1, 2015. These transactions extended the maturity date of the $2.8 billion of refinanced debt by an additional three to six years and increased the associated interest rate. |
| • | During fiscal 2014 Avaya Inc. entered into refinancing transactions which lowered the interest rate of certain debt. On February 5, 2014, Avaya Inc. completed an amendment to the senior secured credit facility pursuant to which we refinanced $1,138 million aggregate principal amount of senior secured term B-5 loans (“term B-5 loans”) with the cash proceeds from the issuance of senior secured term B-6 loans (“term B-6 loans”). On May 15, 2014, we redeemed 100% of the remaining aggregate principal amount of our 9.75% senior unsecured cash-pay notes due 2015 and 10.125%/10.875% senior unsecured PIK toggle notes due 2015 at a redemption price of 100% of the principal amount thereof, plus accrued and unpaid interest, or $92 million and $58 million, respectively. The redemption price was funded through cash on-hand of $10 million and borrowings of $140 million under our revolving credit facilities. |
| • | In connection with the refinancing transactions, we recognized a loss on extinguishment of debt of $5 million, $6 million, and $246 million in fiscal 2014, 2013 and 2011, respectively. |
| • | These refinancing transactions impacted the interest paid on the related debt. As of September 30, 2014, 2013 and 2012, the weighted average interest rate of the Company’s outstanding debt was 6.9%, 7.4%, and 6.1%, respectively. |
Restructuring Charges and Cost Saving Initiatives—We have maintained our focus on profitability levels and investing in our future results. In connection with our acquisition of the enterprise business solutions business (“NES”) of Nortel Networks Corporation, our acquisition of RADVISION Ltd. (“Radvision”) and in response to global economic conditions, since the Merger in fiscal 2008 and continuing through fiscal 2014, the Company initiated cost savings programs designed to streamline its operations, generate cost savings, and eliminate overlapping processes and expenses. These cost savings programs have included: (1) reducing headcount, (2) relocating certain job functions to lower cost geographies, including service delivery, customer care, research and development, human resources and finance, (3) eliminating real estate costs associated with unused or under-utilized facilities and (4) implementing gross margin improvement and other cost reduction initiatives. In connection with these cost savings programs we recognized restructuring charges of $165 million, $200 million, $142 million, $189 million and $171 million for fiscal 2014, 2013, 2012, 2011 and 2010, respectively. These costs include employee separation charges such as, but not limited to, severance and employment benefit payments, social pension fund payments, and healthcare and unemployment insurance costs to be paid to or on behalf of the affected employees. The related restructuring costs also include the contractual
44
Table of Contents
future lease payments and payments made under lease termination agreements associated with vacated facilities. As of September 30, 2014, the remaining liability associated with these actions is $205 million. The Company continues to evaluate opportunities to streamline its operations and identify cost savings globally and may take additional restructuring actions in the future, the costs of which could be material. See Note 9, “Business Restructuring Reserves and Programs” to our audited Consolidated Financial Statements included elsewhere in this prospectus for further details regarding our business restructuring programs.
Capital Lease—As of September 30, 2014, our capital lease obligation was $59 million. On August 20, 2014, we signed an agreement with HP Enterprise Services, LLC, or HP, pursuant to which the Company will outsource to HP certain delivery services in order to scale our operational capacity to serve cloud demand of customers. In connection with that agreement, HP acquired specified assets owned by the Company for $40 million which are being leased-back by Avaya under a capital lease.
Acquisition of NES and Radvision—As a result of the acquisition of NES and Radvision, our operating results include the operations of the NES business and Radvision as of December 19, 2009 and June 5, 2012, respectively. Additionally, some of the items affecting the comparability of the selected financial information for the periods presented regarding these acquisitions include:
| • | Acquisition Costs—In connection with the acquisition of NES, we have incurred acquisition-related costs during fiscal 2010 of $20 million. |
| • | Integration Costs—We incurred integration costs with respect to the NES acquisition of $132 million and $208 million, for fiscal 2011 and 2010, respectively. Integration costs primarily represent third-party consulting fees and other administrative costs associated with consolidating and coordinating the operations of Avaya and NES. These costs were incurred in connection with, among other things, the on-boarding of NES personnel, developing compatible IT systems and internal processes and developing and implementing a strategic operating plan to help enable a smooth transition with minimal disruption to NES customers. Such costs also include fees paid to Nortel Networks Corporation for logistics and other support functions being performed on a temporary basis according to a transition services agreement. In fiscal 2014, 2013 and 2012 we incurred $9 million, $18 million and $19 million, respectively, of integration costs which were primarily associated with consolidating and coordinating the operations of Avaya and Radvision and costs associated with NES, primarily related to developing compatible IT systems and internal processes. |
| • | Impairment—In fiscal 2010, we recognized impairment charges of $16 million associated with certain technologies with overlapping functionality to technologies acquired with NES. |
Amortization of Acquired Intangible Assets—We recorded amortization of acquired intangible assets of $283 million, $291 million, $419 million, $484 million and $510 million for fiscal 2014, 2013, 2012, 2011 and 2010, respectively. Amortization of acquired intangible assets represents the amortization of acquired technologies, customer relationships and other intangibles recognized at the time of the Merger and our acquisitions. In acquisition accounting, these intangible assets are recorded at their estimated fair values and then amortized over their estimated economic lives ranging from less than one year to thirteen years. The fluctuation in year-over-year amortization is attributable to the incremental amortization associated with the acquired intangible assets of NES in fiscal 2010 and Radvision in fiscal 2012, offset by reductions in amortization associated with impaired and fully amortized intangibles that are no longer being amortized.
Changes in Estimated Lives and Salvage Value of Property—In addition to the restructuring charges associated with vacated facilities under operating leases discussed above, the Company also sold four Company-owned and underutilized facilities in order to reduce its real estate costs. During fiscal 2014, in anticipation of selling a Company-owned facility, additional depreciation of $6 million, $24 million and $5 million was recognized and included in cost of revenue, selling, general and administrative expense, and research and development, respectively. During fiscal 2013, in anticipation of selling a Company-owned facility, additional
45
Table of Contents
depreciation of $21 million was recognized as selling, general and administrative expenses. The additional depreciation was the result of changes to the estimated salvage value and useful life of the facility made to be consistent with the estimated proceeds and timing of the contemplated sale of the facility. The other two formerly owned facilities, prior to being sold, were written down to their net realizable value in fiscal 2012 resulting in $5 million of impairment losses which is included in restructuring and impairment charges, net.
Series B Convertible Preferred Stock—In May 2012, the Company issued 48,921 shares of Series B Convertible Preferred Stock (with detachable warrants) for gross proceeds of $196 million, in order to fund, in part, the acquisition of Radvision. Because the terms of the Series B Convertible Preferred Stock contain an embedded derivative as defined by GAAP, the fair value of that derivative must be recognized as a liability at each balance sheet date, and any change in the fair value of the embedded derivative must be recognized in the Company’s operating results. Included in other income (expense), net is $(22) million and $(11) million representing the change in the fair value of the embedded derivative for fiscal 2014 and 2013, respectively. See discussion in Note 16, “Capital Stock” to our audited Consolidated Financial Statements included elsewhere in this prospectus for further details on our preferred stock.
Income Taxes—(Provision for) benefit from income taxes of continuing operations was $(51) million, $35 million, $4 million, $(54) million, and $(4) million for fiscal 2014, 2013, 2012, 2011 and 2010, respectively. The effective tax rate differed from the U.S. federal statutory rate for the periods presented as follows:
| • | Changes in Valuation Allowance of Deferred Tax Assets—In fiscal 2009, the Company was in a three-year cumulative U.S. book tax loss position and determined that it is more likely than not that our U.S. net deferred tax assets would not be realized. Accordingly, we provided a valuation allowance against our U.S. net deferred tax assets. In fiscal 2010, 2011, 2012, 2013 and 2014, we provided additional valuation allowances associated with the U.S. and our income tax provision primarily relates to earnings of certain profitable non-U.S. tax jurisdictions. |
| • | Change in Reinvestment of Undistributed Foreign Earnings Assertion—As of September 30, 2012, the Company changed its indefinite reinvestment of undistributed foreign earnings assertion with respect to its non-U.S. subsidiaries. As a result the Company recorded income tax benefit (expense) of $1 million, $(2) million and $(17) million in fiscal 2014, 2013 and 2012, respectively, relating to non-U.S. taxes. |
| • | Effect of Changes in Other Comprehensive Income—During fiscal 2013 and 2012, we recognized tax charges to other comprehensive income of $126 million and $62 million, respectively. As a result of the tax charges recognized in other comprehensive income, we recognized a corresponding income tax benefit in the Consolidated Statements of Operations. |
| • | Effect of Tax Charge to Discontinued Operations—During fiscal 2012, we recorded a tax charge of $12 million to discontinued operations. As a result of the tax charge recognized in discontinued operations, we recognized a corresponding income tax benefit in continuing operations. |
46
Table of Contents
UNAUDITED PRO FORMA FINANCIAL STATEMENTS
The following presents the unaudited pro forma balance sheet as of September 30, 2014, and the unaudited pro forma statement of operations for the year ended September 30, 2014.
The following unaudited pro forma financial statements have been developed by applying pro forma adjustments to the historical Consolidated Balance Sheet and Consolidated Statement of Operations of Avaya Holdings Corp. appearing elsewhere in this prospectus. The unaudited pro forma balance sheet as of September 30, 2014 gives effect to the sale of the common stock as contemplated in this offering and the use of the proceeds thereof as if they had occurred on September 30, 2014. The unaudited pro forma statement of operations for the fiscal year ended September 30, 2014 gives effect to the refinancing of certain debt that took place during the year ended September 30, 2014 and the sale of the common stock as contemplated in this offering and the use of the proceeds thereof as if they had occurred on October 1, 2013. All pro forma adjustments and underlying assumptions are described more fully in the notes to the unaudited pro forma financial statements.
The pro forma information presented is for illustrative purposes only and is not necessarily indicative of the financial position or results of operations that would have been realized if the use of the proceeds thereof were completed on the dates indicated, nor is it indicative of future operating results. The pro forma adjustments are based upon available information and certain assumptions that management believes to be reasonable.
The unaudited pro forma statement of operations does not include the effects of:
| • | compensation expense relative to the market-based “multiple-of-money” options or cash awards under the Long-Term Incentive Cash Bonus Plan granted by the Company and recognized upon the completion of this offering; or |
| • | accounting charges that may be recorded as a result of the termination of the management services agreement with affiliates of the Sponsors pursuant to the terms of the agreement. |
You should read this information in conjunction with the:
| • | accompanying notes to the unaudited pro forma financial statements; and |
| • | audited historical Consolidated Financial Statements of Avaya Holdings Corp. as of and for the year ended September 30, 2014, included elsewhere in this prospectus. |
47
Table of Contents
Avaya Holdings Corp.
Unaudited Pro Forma Balance Sheet
September 30, 2014
| Historical | IPO Pro Forma Adjustment (Note 2) |
Pro Forma | ||||||||||
| (in millions) | ||||||||||||
| ASSETS |
||||||||||||
| Current assets: |
||||||||||||
| Cash and cash equivalents |
$ | 322 | $ | — | (a), (b), (c) | |||||||
| Accounts receivable, net |
745 | — | ||||||||||
| Inventory |
197 | — | ||||||||||
| Deferred income taxes, net |
24 | — | ||||||||||
| Other current assets |
219 | — | ||||||||||
|
|
|
|
|
| ||||||||
| TOTAL CURRENT ASSETS |
1,507 | — | ||||||||||
|
|
|
|
|
| ||||||||
| Property, plant and equipment, net |
281 | — | ||||||||||
| Deferred income taxes, net |
52 | — | ||||||||||
| Intangible assets, net |
1,224 | — | ||||||||||
| Goodwill |
4,047 | — | ||||||||||
| Other assets |
123 | — | ||||||||||
|
|
|
|
|
| ||||||||
| TOTAL ASSETS |
$ | 7,234 | $ | — | ||||||||
|
|
|
|
|
| ||||||||
| LIABILITIES |
||||||||||||
| Current liabilities: |
||||||||||||
| Debt maturing within one year |
$ | 32 | $ | — | ||||||||
| Accounts payable |
416 | — | ||||||||||
| Payroll and benefit obligations |
228 | — | ||||||||||
| Deferred revenue |
668 | — | ||||||||||
| Business restructuring reserves, current portion |
86 | — | ||||||||||
| Other current liabilities |
303 | — | ||||||||||
|
|
|
|
|
| ||||||||
| TOTAL CURRENT LIABILITIES |
1,733 | — | ||||||||||
|
|
|
|
|
| ||||||||
| Long-term debt |
5,991 | — | ||||||||||
| Pension obligations |
1,535 | — | ||||||||||
| Other postretirement obligations |
273 | |||||||||||
| Deferred income taxes, net |
249 | — | ||||||||||
| Business restructuring reserves, non-current portion |
119 | — | ||||||||||
| Other liabilities |
475 | — | (d) | |||||||||
|
|
|
|
|
| ||||||||
| TOTAL NON-CURRENT LIABILITIES |
8,642 | — | ||||||||||
|
|
|
|
|
| ||||||||
| Equity awards on redeemable shares |
21 | — | ||||||||||
| Preferred stock, Series B |
300 | |||||||||||
| Preferred stock, Series A |
159 | — | ||||||||||
| TOTAL STOCKHOLDERS’ DEFICIENCY |
(3,621 | ) | — | (a), (b), (c), (d) | ||||||||
|
|
|
|
|
| ||||||||
| TOTAL LIABILITIES AND STOCKHOLDERS’ DEFICIENCY |
$ | 7,234 | $ | — | ||||||||
|
|
|
|
|
| ||||||||
See accompanying notes to unaudited pro forma financial statements.
48
Table of Contents
Avaya Holdings Corp.
Unaudited Pro Forma Statement of Operations
Year Ended September 30, 2014
| Historical | Debt Refinancing Pro Forma Adjustments (Note 3) |
IPO Pro Forma Adjustments (Note 2) |
Pro Forma | |||||||||||||
| (in millions, except per share amounts) | ||||||||||||||||
| REVENUE |
||||||||||||||||
| Products |
$ | 2,196 | $ | — | $ | — | ||||||||||
| Services |
2,175 | — | — | |||||||||||||
|
|
|
|
|
|
|
| ||||||||||
| 4,371 | — | — | ||||||||||||||
|
|
|
|
|
|
|
| ||||||||||
| COSTS |
||||||||||||||||
| Products: |
||||||||||||||||
| Costs (exclusive of amortization of acquired technology intangible assets) |
854 | — | — | |||||||||||||
| Amortization of acquired technology intangible assets |
56 | — | — | |||||||||||||
| Services |
962 | — | — | |||||||||||||
|
|
|
|
|
|
|
| ||||||||||
| 1,872 | — | — | ||||||||||||||
|
|
|
|
|
|
|
| ||||||||||
| GROSS PROFIT |
2,499 | — | — | |||||||||||||
|
|
|
|
|
|
|
| ||||||||||
| OPERATING EXPENSES |
||||||||||||||||
| Selling, general and administrative |
1,531 | — | — | (e) | ||||||||||||
| Research and development |
379 | — | — | |||||||||||||
| Amortization of acquired intangible assets |
227 | — | — | |||||||||||||
| Restructuring and impairment charges, net |
165 | — | — | |||||||||||||
|
|
|
|
|
|
|
| ||||||||||
| TOTAL OPERATING EXPENSES |
2,302 | — | — | |||||||||||||
|
|
|
|
|
|
|
| ||||||||||
| OPERATING INCOME |
197 | — | — | |||||||||||||
| Interest expense |
(459 | ) | 14 | — | ||||||||||||
| Loss on extinguishment of debt |
(5 | ) | ||||||||||||||
| Other income, net |
3 | — | — | |||||||||||||
|
|
|
|
|
|
|
| ||||||||||
| LOSS FROM CONTINUING OPERATIONS BEFORE INCOME TAXES |
(264 | ) | 14 | — | ||||||||||||
| Provision for income taxes of continuing operations |
(51 | ) | — | — | ||||||||||||
|
|
|
|
|
|
|
| ||||||||||
| LOSS FROM CONTINUING OPERATIONS |
(315 | ) | 14 | — | ||||||||||||
| Income from discontinued operations, net of income taxes |
62 | — | — | |||||||||||||
|
|
|
|
|
|
|
|
| |||||||||
| NET LOSS |
(253 | ) | 14 | — | ||||||||||||
| Less: Accretion and accrued dividends on Series A preferred stock and Series B preferred stock |
(45 | ) | — | — | ||||||||||||
|
|
|
|
|
|
|
| ||||||||||
| NET LOSS ATTRIBUTABLE TO COMMON STOCKHOLDERS |
$ | (298 | ) | $ | 14 | $ | — | |||||||||
|
|
|
|
|
|
|
| ||||||||||
| SHARE DATA: |
||||||||||||||||
| Loss from continuing operations per share to common stockholders |
$ | (0.73 | ) | |||||||||||||
| Income from discontinued operations per share to common stockholders |
$ | 0.13 | ||||||||||||||
|
|
|
|||||||||||||||
| Net loss per share attributable to common stockholders |
$ | (0.60 | ) | |||||||||||||
|
|
|
| ||||||||||||||
| Weighted average basic and diluted shares outstanding |
495.4 | |||||||||||||||
|
|
|
| ||||||||||||||
See accompanying notes to unaudited pro forma financial statements.
49
Table of Contents
NOTES TO UNAUDITED PRO FORMA FINANCIAL STATEMENTS
1. BASIS OF PRESENTATION
The unaudited pro forma financial statements include the following for all applicable periods:
| • | The historical Consolidated Financial Statements of Avaya Holdings Corp. |
| • | Debt refinancing pro forma adjustments related to interest expense which give effect to the refinancing of certain debt that took place during the year ended September 30, 2014 as if such refinancing had occurred on October 1, 2013. |
| • | Initial public offering pro forma adjustments which give effect to the sale of the number of shares set forth on the cover of this prospectus at an assumed initial public offering price of $ , which is the midpoint of the range listed on the cover of this prospectus and the use of the proceeds as set forth under “Use of Proceeds” as if the initial public offering had occurred on October 1, 2013 for purposes of the unaudited pro forma statement of operations and on September 30, 2014 for purposes of the unaudited pro forma balance sheet. |
As more fully discussed under “Use of Proceeds,” the Company estimates that it will receive net proceeds of approximately $ million from the sale of the number of shares set forth on the cover of this prospectus at an assumed initial public offering price of $ , which is the midpoint of the range listed on the cover of this prospectus, after deducting the underwriting discounts and commissions and estimated offering expenses payable by the Company. The Company intends to use the net proceeds received in connection with this offering to redeem all outstanding shares of Series A Preferred Stock for $ million, including accretion and accrued unpaid dividends of $ million, repay $ million of our long-term indebtedness, and $ million for working capital and other corporate purposes. Under the terms of the Management Services Agreement, the agreement will terminate upon an initial public offering, and, upon such termination the one-time success fee referenced in the preceding sentence is due.
2. INITIAL PUBLIC OFFERING PRO FORMA ADJUSTMENTS
The unaudited pro forma financial statements reflect the pro forma adjustments of the sale of the number of shares set forth on the cover of this prospectus at an assumed initial public offering price of $ , which is the midpoint of the range listed on the cover of this prospectus and the use of the net proceeds as set forth under “Use of Proceeds.” The tax effects of these pro forma adjustments are not material to the unaudited pro forma statement of operations as a result of the valuation allowance established against the Company’s U.S. deferred tax assets.
ADJUSTMENTS TO UNAUDITED PRO FORMA BALANCE SHEET
The pro forma adjustments included in the unaudited pro forma balance sheet as of September 30, 2014 related to the sale of the number of shares set forth on the cover of this prospectus at an assumed initial public offering price of $ , which is the midpoint of the range listed on the cover of this prospectus and the use of the net proceeds as set forth under “Use of Proceeds” are as follows:
| Pro Forma Adjustments | ||||||||||
| Sale of Shares (a) |
Payment of Management Services Termination Fee (b) |
Working Capital and Other Corporate Purposes (c) |
Compensation expense (d) |
Net Adjustments | ||||||
| Increases / (Decreases) in |
(in millions) | |||||||||
| Cash and cash equivalents |
||||||||||
| Other current assets |
||||||||||
| Other assets |
||||||||||
| Long-term debt |
||||||||||
| Other liabilities |
||||||||||
| Preferred Stock: Series A |
||||||||||
| Stockholders’ deficiency |
||||||||||
50
Table of Contents
(a) Sale of Shares—As more fully discussed under “Use of Proceeds,” the Company estimates that it will receive net proceeds of approximately $ million from the sale of the common stock offered in this offering, after deducting the underwriting discounts and commissions and estimated offering expenses payable by the Company. These net proceeds assume that the underwriters do not exercise their option to purchase additional shares.
(b) Payment of Management Services Termination Fee—The Company intends to use the net proceeds received in connection with this offering in part to pay $ million in connection with the termination of the management services agreement with affiliates of our Sponsors pursuant to its terms.
(c) Working Capital and other Corporate Purposes—The Company intends to use the net proceeds received in connection with this offering in part to pay $ million for working capital and other corporate purposes.
(d) Compensation expense—The pro forma adjustment of $ million has been provided to give effect to $ million of stock-based compensation expense associated with market-based “multiple-of-money” options granted by the Company and $ million of compensation expense relative to cash awards granted by the Company under the Long-Term Incentive Cash Bonus Plan, which will be recognized upon completion of this offering.
ADJUSTMENTS TO UNAUDITED PRO FORMA STATEMENTS OF OPERATIONS
The pro forma adjustments included in the unaudited pro forma statement of operations for the year ended September 30, 2014 related to the sale of the common stock offered in this offering and the use of the net proceeds thereof are as follows:
(e) Selling, general and administrative expense—The pro forma adjustment of $ million has been provided to eliminate the annual monitoring fee payable under the management services agreement with affiliates of our Sponsors reflected in the historical Consolidated Financial Statements of Avaya Holdings Corp. for the year ended September 30, 2014. Under the terms of the management services agreement, the agreement will terminate upon consummation of this offering and the Company is required to pay a success fee of $ to affiliates of our Sponsors.
(f) Compensation expense—The pro forma adjustment of $ million reflects $ million of stock-based compensation expense associated with market-based “multiple-of-money” options granted by the Company and $ million of compensation expense relative to cash awards granted by the Company under the Long-Term Incentive Cash Bonus Plan for the year ended September 30, 2014 as if the sale of the common stock as contemplated in this offering had occurred on October 1, 2013.
3. DEBT REFINANCING PRO FORMA ADJUSTMENTS
Debt refinancing pro forma adjustments related to interest expense for the year ended September 30, 2014 give effect to the refinancing of certain debt that took place during fiscal 2014 as if the refinancings had occurred on October 1, 2013. The tax effects of these pro forma adjustments are not material to the unaudited pro forma statement of operations as a result of the valuation allowance established against the Company’s U.S. deferred tax assets. Such pro forma adjustments include:
| • | the elimination of interest expense, including amortization of debt issuance costs and accretion of debt discounts, recognized on the senior secured term B-5 loans outstanding under the senior secured credit facility that were refinanced, and the senior unsecured cash-pay notes and the senior unsecured paid-in-kind toggle notes that were redeemed, and |
| • | adjustments to interest expense, including amortization of debt issuance costs and accretion of debt discounts, associated with the new senior secured term B-6 loans and the amounts borrowed under the Company’s revolving credit facilities. |
51
Table of Contents
The interest expense on the variable rate senior secured term B-6 loans was determined by applying an applicable margin to the 3-month LIBOR rate on the date of the respective transaction (subject to a floor of 1.00%). A 0.125% change in the LIBOR rate would have no impact on the pro forma interest expense, as the LIBOR rate was not in excess of the floor. The interest expense on the variable rate senior secured multi-currency revolver and senior secured multi-currency asset-based revolving credit facility was determined by applying an applicable margin to the 1-month LIBOR rate on the date of the respective transaction. A 0.125% change in the LIBOR rate would have less than a $1 million impact on the pro forma interest expense.
52
Table of Contents
MANAGEMENT’S DISCUSSION AND ANALYSIS OF
FINANCIAL CONDITION AND RESULTS OF OPERATIONS
The following is a discussion and analysis of our financial condition and results of operations for the fiscal years ended September 30, 2014, 2013 and 2012. You should read this discussion and analysis together with our Consolidated Financial Statements and related notes and the other financial information included elsewhere in this prospectus. This discussion contains forward-looking statements that involve significant risks and uncertainties. As a result of many factors, such as those set forth under “Risk Factors” and elsewhere in this prospectus, our actual results may differ materially from those anticipated in these forward-looking statements.
When we use the terms “we,” “us,” “our,” “Avaya” or the “Company,” we mean Avaya Holdings Corp., a Delaware corporation, and its consolidated subsidiaries, including Avaya Inc., our principal U.S. operating subsidiary, taken as a whole, unless the context otherwise indicates.
Overview
We are a leading provider of contact center, unified communications and networking products and services designed to help enterprise and midmarket businesses increase workforce productivity, customer engagement, and the lifetime value of customers, with the ultimate objective of higher revenue and profitability.
Our products and services portfolio spans software, hardware, networking technology and professional services. See Item 1, “Business - Our Products and Services,” included elsewhere in this prospectus for details. Our products and services fall under three operating segments: 1) Global Communications Solutions; 2) Avaya Networking; and 3) Avaya Global Services.
| • | Global Communications Solutions, or GCS, includes real-time collaboration, contact center and unified communications software and hardware, as well as technology that creates mobile engagement environments designed to deliver better customer service, increased productivity, and higher profitability. GCS also includes a development platform for third-parties to innovate with custom engagement environments and applications, and hardware and software products that enable customers to take advantage of our other communications products in a cloud environment. |
| • | Avaya Networking includes an advanced fabric-based networking technology that offers a virtualized network that is simple to deploy, agile to operate and resilient. Our technology is flexible and extensible to legacy network systems, which gives customers the option to upgrade to new contact center and collaboration and unified communications technology while using their existing infrastructure, if desired. |
| • | Avaya Global Services include professional and support services that help our customers achieve enhanced business results through the use of our products and technology. It also includes our cloud services, which enable customers to take advantage of our technology in a cloud environment. |
For fiscal 2014 and 2013, we generated revenue of $4,371 million and $4,578 million, respectively. For fiscal 2014 and 2013, product revenue represented 50% and 51% of our total revenue and services revenue represented 50% and 49%, respectively. For fiscal 2014 and 2013, revenue generated in the United States was 52% and 53%, respectively. For fiscal 2014 and 2013 we had a net loss of $253 million and $376 million, respectively, and Adjusted EBITDA of $898 million and $922 million, respectively. See “EBITDA and Adjusted EBITDA” for a definition and explanation of Adjusted EBITDA and a reconciliation of loss from continuing operations to Adjusted EBITDA.
History
We have a long history of innovation dating back to our research and development roots in Bell Laboratories when we were a part of AT&T. Avaya was formerly the Business Communications business unit of Lucent Technologies, Inc., or Lucent, a 1996 spin-off from AT&T. Since our own spin-off from Lucent in 2000,
53
Table of Contents
we have been a leading provider of unified communications and contact center products and services and more recently business collaboration products and services to our customers. Avaya Inc., our wholly owned subsidiary, operated as a public company with common stock traded on the New York Stock Exchange from October 1, 2000 until acquired by affiliates of our Sponsors on October 26, 2007.
Business Trends
There are a number of trends and uncertainties affecting our business. For example, the global economic downturn during 2008 through 2010 as well as recent economic uncertainties negatively affected most of the markets we serve. We believe these uncertainties have impacted our customers’ willingness to spend on information technology and the manner in which they procure such technologies and services.
While the focus of our go-to-market efforts has been successful in driving growth in the sales of our flagship products and services, we have experienced declines in excess of these gains in the revenues attributable to our core and legacy product lines. As we have shifted our focus toward our flagship products this has detracted from the sales of our legacy products. Further, as our core products are integral components to our flagship and legacy products, core product sales declined as the decrease in sales of our legacy products were only partially offset by the increase in the sales of our flagship products. In addition, we believe better utilization of SIP technology, which enables our customers to run their communication networks more efficiently requiring fewer gateways and servers, has contributed to lower demand for our core product lines.
We believe the decrease in our product revenues may also be due in part to a growing market trend around Cloud consumption preferences with more customers exploring operational expense, or OpEx models rather than a capital expenditure, or CapEx models for procuring technology. Increasingly, to manage costs and efficiencies, customers are exploring a shift to OpEx models, also referred to as “spend-as-you-go” models, where they pay a fee for business collaboration and communications services but the underlying solutions, infrastructure and personnel are owned and managed by the equipment vendor or a managed services or Cloud provider, as opposed to CapEx models that require them to invest in and own the solutions, infrastructure and personnel. We believe the market trend toward OpEx models will continue as we see an increasing number of opportunities and requests for proposal based on the OpEx model. As the trend towards the OpEx model continues, we have focused our go-to-market strategy on our Avaya Private Cloud Services, or APCS, as well as our flagship product offerings such as Aura, contact center and IP Office. Throughout fiscal 2014, our total contracted value for cloud managed services grew and as of September 30, 2014 we estimate the total contracted value exceeds $750 million. The values for these contracts are usually larger than contracts under a CapEx model, but the associated revenues are recognized over a period of time, typically three to seven years.
In part to address these market trends, on August 20, 2014 we entered into a multi-year agreement with HP Enterprise Services, LLC, or HP, pursuant to which the Company will outsource to HP certain delivery services in order to scale our operational capacity to serve cloud demand of customers. Together, the companies will also sell a combined portfolio of Unified Communications-as-a-service, Contact Center-as-a-service, and infrastructure modernization services. As part of that agreement, HP has agreed to acquire specific assets owned by the Company and make available one or more additional financings to Avaya and its subsidiaries of up to $24 million per year for the sole purpose of financing the use of equipment for the performance of services under the agreement.
As we actively position ourselves to address these market trends, we also continue to invest in research and development. During fiscal 2014, we delivered a total of 114 new product releases, which is up more than 10% from the number in fiscal 2013. In December 2009, we acquired the enterprise business solutions business, or NES, of Nortel Networks Corporation in order to further expand our technology portfolio, enhance our customer base, broaden our indirect sales channel and provide us greater ability to compete globally. In June 2012, we acquired RADVISION Ltd., or Radvision, a global provider of videoconferencing and telepresence technologies over internet protocol, or IP, and wireless networks. The integrated Avaya and Radvision technology portfolios
54
Table of Contents
provides customers a highly integrated and interoperable suite of cost-effective, easy to use, high-definition video collaboration products, with the ability to interoperate with multiple mobile devices including Apple iPad and Google Android. On October 1, 2013, we acquired IT Navigator Ltd., or IT Navigator, a global provider of Cloud, social media and management products and services. The integration of the Avaya and IT Navigator portfolios has added key management reporting and social media capabilities and enhanced Avaya’s Cloud as well as its unified communication and contact center products. We believe the investments in NES, Radvision, IT Navigator and other acquisitions, as well as our ongoing investments in research and development, are helping us to capitalize on the increasing focus of enterprises on deploying collaboration products to increase productivity, reduce costs and complexity and gain competitive advantages, which is being further accelerated by a trend toward a more mobile workforce and the associated proliferation of devices.
We have also successfully expanded our indirect channel to support our go-to-market strategy within our enterprise and midmarket customer bases. Since fiscal 2009 and the acquisition of NES, our indirect channel has grown from 53% to 75% of our product revenues. We believe this expansion of our indirect channel favorably impacts our financial results by reducing selling expenses and allowing us to reach more end users and grow our business, although sales through the indirect channel generally generate lower profits than direct sales due to higher discounts. In furtherance of our effort to maintain an effective business partner program, we continue to refine and expand our global coverage while better aligning our go-to-market strategy for our products and services with our enterprise and midmarket customer bases. We have been deploying new customer segmentation and enhanced geographic emphasis while leveraging our existing and new channel partners. This has generated momentum in our midmarket efforts. Throughout fiscal 2014, we have brought additional industry-seasoned sales and technical personnel into customer and partner facing roles.
Certain trends and uncertainties also impact our global services organization, which provides us a large recurring revenue stream. Due to advances in technology, our customers continue to expect to pay less for traditional services. In addition, despite the benefits of a robust indirect channel, our channel partners have direct contact with our customers that may foster independent relationships between them and a loss of certain services agreements for us. We have been able to offset these impacts by focusing on other types of services not traditionally provided by our channel partners, such as professional services and Cloud and managed services.
For fiscal 2014, 2013 and 2012, revenue outside of the U.S. represented 48%, 47% and 48% of total revenue, respectively. Foreign currency exchange rates and fluctuations have had an impact on our revenue, costs and cash flows from our international operations. Our primary currency exposures are to the euro, British pound, Indian rupee, Canadian dollar and Brazilian real. These exposures may change over time as business practices evolve and as the geographic mix of our business changes and we are not able to predict the impact that foreign currency fluctuations will have on future periods.
Refinancing of Debt
During fiscal 2013, Avaya Inc. completed a series of transactions which allowed Avaya Inc. to refinance (1) all of its senior secured term B-1 loans (“term B-1 loans”) outstanding under its senior secured credit facility originally due October 26, 2014, and (2) $642 million of its 9.75% senior unsecured cash-pay notes and $742 million of its senior unsecured paid-in-kind (“PIK”) toggle notes each originally due November 1, 2015. These transactions extended the maturity date of the $2.8 billion of refinanced debt by an additional three to six years and increased the associated interest rate.
During fiscal 2014, Avaya Inc. entered into refinancing transactions which lowered the interest rate of certain debt. On February 5, 2014, Avaya Inc. completed an amendment to the senior secured credit facility pursuant to which Avaya Inc. refinanced $1,138 million aggregate principal amount of senior secured term B-5 loans (“term B-5 loans”) with the cash proceeds from the issuance of senior secured term B-6 loans (“term B-6 loans”). On May 15, 2014, Avaya Inc. redeemed 100% of the aggregate principal amount of its 9.75% senior unsecured cash-pay notes due 2015 and 10.125%/10.875% senior unsecured PIK toggle notes due 2015 at a
55
Table of Contents
redemption price of 100% of the principal amount thereof, plus accrued and unpaid interest, or $92 million and $58 million, respectively. The redemption price of $150 million was funded through cash on-hand of $10 million and borrowings of $140 million under Avaya Inc.’s revolving credit facilities, which are payable in full on October 26, 2016.
During the quarter ended September 30, 2014, Avaya Inc. repaid $10 million of the borrowings under Avaya Inc.’s revolving credit facilities. Subsequent to September 30, 2014, Avaya Inc. repaid an additional $30 million of these borrowings.
See Note 10, “Financing Arrangements” to our audited Consolidated Financial Statements and “Management’s Discussion and Analysis—Liquidity and Capital Resources: Credit Facilities” for further details.
Long-term debt consists of the following:
| In millions |
September 30, 2014 |
September 30, 2013 |
||||||
| 9.75% senior unsecured cash pay notes due November 1, 2015 |
$ | — | $ | 58 | ||||
| 10.125%/10.875% senior unsecured PIK toggle notes due November 1, 2015 |
— | 92 | ||||||
| Variable rate senior secured multi-currency asset-based revolving credit facility due October 26, 2016 |
40 | — | ||||||
| Variable rate senior secured multi-currency revolver due October 26, 2016 |
90 | — | ||||||
| Variable rate senior secured term B-3 loans due October 26, 2017 |
2,102 | 2,127 | ||||||
| Variable rate senior secured term B-4 loans due October 26, 2017 |
1 | 1 | ||||||
| Variable rate senior secured term B-5 loans due March 31, 2018 |
— | 1,141 | ||||||
| Variable rate senior secured term B-6 loans due March 31, 2018 |
1,128 | — | ||||||
| 7% senior secured notes due April 1, 2019 |
1,009 | 1,009 | ||||||
| 9% senior secured notes due April 1, 2019 |
290 | 290 | ||||||
| 10.50% senior secured notes due March 1, 2021 |
1,384 | 1,384 | ||||||
| Unaccreted discount |
(21 | ) | (16 | ) | ||||
|
|
|
|
|
|||||
| 6,023 | 6,086 | |||||||
| Debt maturing within one year |
(32 | ) | (35 | ) | ||||
|
|
|
|
|
|||||
| Long-term debt |
$ | 5,991 | $ | 6,051 | ||||
|
|
|
|
|
|||||
During fiscal 2013, Avaya Inc. incurred $49 million in debt refinancing fees and expenses, of which $18 million was expensed as incurred and included in other expense, net and $31 million was deferred and is being amortized over the term of the related debt.
During fiscal 2014, Avaya Inc. incurred $15 million in debt refinancing fees and expenses, of which $2 million was expensed as incurred and included in other expense, net, $3 million was included in the determination of the loss on extinguishment of debt, and $10 million was deferred and is being amortized over the term of the related debt.
The weighted average contractual interest rate of Avaya Inc.’s outstanding debt as of September 30, 2014 and September 30, 2013 was 6.9% and 7.4%, respectively.
56
Table of Contents
Annual maturities of long-term debt (excluding unaccreted discount of $21 million), for the next five years ending September 30th and thereafter, consist of:
| In millions |
September 30, 2014 |
|||
| 2015 |
$ | 38 | ||
| 2016 |
39 | |||
| 2017 |
168 | |||
| 2018 |
3,116 | |||
| 2019 |
1,299 | |||
| 2020 and thereafter |
1,384 | |||
|
|
|
|||
| Total |
$ | 6,044 | ||
|
|
|
|||
Continued Focus on Cost Structure
We maintain our focus on profitability levels and investing in our future results. The Company has initiated cost savings programs designed to streamline its operations and eliminate overlapping processes and expenses associated with various acquisitions and in response to the global economic downturn. These cost savings programs have included: (1) reducing headcount, (2) relocating certain job functions to lower cost geographies, including service delivery, customer care, research and development, human resources and finance, (3) eliminating real estate costs associated with unused or under-utilized facilities and (4) implementing gross margin improvement and other cost reduction initiatives.
We have executed on several gross margin improvement and other cost reduction initiatives. These initiatives included obtaining better pricing from our contract manufacturers and transportation vendors which has improved our product gross margins. In addition, we have streamlined our operations by redesigning the Avaya support website and continue to transition our customers from an agent-based support model to a self-service/web-based support model. These improvements have allowed us to reduce the workforce and relocate positions to lower-cost geographies and improve our services gross margins.
We expect our gross profit and gross margin to continue to improve in the foreseeable future as we continue to implement additional initiatives such as increasing our focus on sales of higher margin software, working with our contract manufacturers and transportation vendors to secure more favorable pricing, optimizing the design of products and services delivery to drive efficiencies, and achieving greater economies of scale.
In addition to the improvements in gross margin, we have successfully reduced our operating expenses through these cost savings programs, primarily through reducing our labor and real estate costs.
Reductions in labor costs have been achieved through the elimination of redundancies by redefining and consolidating job functions, reductions in management and in back-office headcount of our sales organization, reduced headcount in our services business, the use of remote monitoring of customer systems as discussed above, and a shift in the mix of the Company’s distribution channels toward the indirect channel which reduced our personnel needs. We were also able to attain additional savings as the Company placed greater emphasis on shifting job functions to its shared service centers in India and Argentina, as well as the automation of customer service.
During fiscal 2012, 2013 and 2014, the Company initiated cost savings programs to reduce headcount that included reaching agreements with the works council representing employees of certain of the Company’s German subsidiaries for the elimination of positions, offering enhanced separation plans to certain management employees in the U.S., and other actions primarily focused in the U.S. and EMEA. As a result of these programs and the divestiture of two non-core businesses discussed below in fiscal 2014, the Company’s workforce at September 2012, 2013, and 2014 was approximately 17,000, 14,500, and 13,100, respectively.
57
Table of Contents
Reductions in real estate costs were achieved by: (1) eliminating redundant facilities, particularly research and development facilities, in similar geographic areas as part of transitioning and integrating the operations of NES, (2) reductions in headcount, which decreased our real estate needs, and (3) reducing operating costs through more efficient facilities management. These initiatives enabled us to vacate and consolidate facilities without affecting the quality or distribution of our products and services, and reduce our real estate costs. Further, in part due to headcount reductions and office consolidations, we identified and sold four underutilized facilities during fiscal 2013 and 2014, generating additional cash of $79 million in aggregate. The operations associated with these facilities were either relocated to existing or smaller leased facilities or in certain cases we were able to lease-back a portion of the facility for our ongoing operations. The sale of these facilities not only generated additional cash but, as a result of reducing our real estate needs, provided for reductions in our real estate costs and overhead.
The Company’s restructuring charges include employee separation charges such as, but not limited to, severance and employment benefit payments, social pension fund payments, and healthcare and unemployment insurance costs to be paid to or on behalf of the affected employees. The aggregate restructuring charges also include the future lease payments and payments made under lease termination agreements associated with vacated facilities. As of September 30, 2014, the remaining liability associated with these actions is $205 million. This liability includes $124 million of employee separation payments of which $59 million will be paid in fiscal 2015 and the balance through fiscal 2018, and $81 million of cash payments associated with lease obligations of vacated facilities of which $27 million will be paid in fiscal 2015 and the balance through fiscal 2022.
As a portion of our 2014 actions took place during the second half of fiscal 2014, the benefits are not fully reflected in our operating results as of September 30, 2014. We expect our operating margin to continue to improve in the foreseeable future as we begin to realize the full positive effects of our 2014 cost savings programs in our reported results. As we begin fiscal 2015, the Company continues to evaluate opportunities to streamline its operations and identify additional cost savings globally. Although a specific plan does not exist at this time, the Company may take additional restructuring actions in the future, the costs of which could be material. All costs associated with such actions would be recognized in accordance with authoritative accounting guidance and the Company’s accounting policies as outlined in Note 2, “Summary of Significant Accounting Policies—Restructuring Programs” and Note 9, “Business Restructuring Reserves and Programs,” to our audited Consolidated Financial Statements included elsewhere in this prospectus.
Acquisition of RADVISION Ltd.
On June 5, 2012, Avaya acquired Radvision, a global provider of videoconferencing and telepresence technologies over IP and wireless networks, for $230 million in cash.
The integrated Avaya and Radvision technology portfolios provides customers a highly integrated and interoperable suite of cost-effective, easy to use, high-definition video collaboration products, with the ability to interoperate with multiple mobile devices including Apple iPad and Google Android. Radvision brings to Avaya a portfolio which includes a full range of videoconferencing products, technologies and expertise serving large enterprises, small businesses, and service providers. It includes standards-based applications, open infrastructure and endpoints for ad-hoc and scheduled videoconferencing with room-based systems, desktop, and mobile consumer devices. Radvision has enabled Avaya to provide a Cloud offering through hosted products by service providers. The integrated Avaya and Radvision portfolios extend intra-company business to business and business to consumer video communications, and also support internal “Bring Your Own Device” initiatives. See discussion in Note 4, “Business Combinations—RADVISION Ltd.” to our audited Consolidated Financial Statements included elsewhere in this prospectus for further details.
Divestitures
In order to remain focused on our business objectives, we have divested ourselves of two businesses which we obtained as part of larger acquisitions.
58
Table of Contents
In March 2014, we sold the IT Professional Services, or ITPS, business that we acquired as part of our acquisition of NES. The ITPS business provides specialized information technology services exclusively to government customers in the U.S. In July 2014, we sold the Technology Business Unit, or TBU, which we acquired as part of our acquisition of Radvision. TBU is a software development business that licenses technologies to developers for their use and integration into their own products and includes protocol stacks, client framework solutions and network testing and monitoring tools. We do not view the ITPS or TBU businesses as core to our ongoing operations as a global provider of business collaboration and communication products and services or essential to the needs of our primary-customer base. As these businesses were not part of our long-term growth strategy we took the opportunity to monetize these assets and generated $127 million of cash while reducing the complexities of our operations.
Financial Operations Overview
The following describes certain components of our statement of operations and considerations impacting those results.
Revenue. We derive our revenue primarily from the sale and service of business collaboration and communications systems and applications. Our product revenue includes the sale of unified communications, contact center, midmarket enterprise communications, video and data networking products. Product revenue accounted for 50%, 51% and 53% of our total revenue for fiscal 2014, 2013 and 2012, respectively. Our services revenue includes product maintenance and support, professional services, including design and integration, and Cloud and managed services.
We employ a flexible go-to-market strategy with direct and indirect presence worldwide and as of September 30, 2014, we had approximately 10,800 channel partners. For fiscal 2014, 2013 and 2012 our product revenue from indirect sales represented approximately 75%, 76% and 75% of our total product revenue, respectively. Our revenue outside the United States represented 48%, 47% and 48% of our total revenue for each of fiscal 2014, 2013 and 2012, respectively.
Because we sell our products to end-users in a wide range of industries and geographies, demand for our products is generally driven more by the level of general economic activity than by conditions in one particular industry or geographic region.
Cost of Revenue. Cost of product revenue consists primarily of hardware costs, royalties and license fees for third-party software included in our systems, personnel and related overhead costs of operation including but not limited to current engineering, freight, warranty costs, amortization of acquired technology intangible assets and provisions for excess inventory. We outsource substantially all of our manufacturing operations to several contract manufacturers. Our contract manufacturers produce the vast majority of our products in facilities located in southern China, with other products produced in facilities located in Israel, Mexico, Malaysia, Taiwan, Germany, Ireland and the U.S. The majority of these costs vary with the unit volumes of product sold. We expect over time to increase the software content of our products, decrease our product costs and improve product gross profits. Cost of services revenue consists of salaries and related overhead costs of personnel engaged in support and services. As we continue to realize the benefit of cost saving initiatives, which include productivity improvements from automation of customer service, reducing the workforce and relocating positions to lower cost geographies, we expect our cost of services revenue will decrease as a percentage of services revenue.
Selling, General and Administrative Expenses. Sales and marketing expenses primarily include personnel costs, sales commissions, travel, marketing promotional and lead generation programs, trade shows, professional services fees and related overhead expenses. We plan to continue to invest in development of our distribution channels by increasing the size of our field sales force and continue to develop the capabilities of our channel partners to enable us to expand into new geographies and further increase our sales to the midmarket across the world.
59
Table of Contents
General and administrative expenses consist primarily of salary and benefit costs for executive and administrative staff, the use and maintenance of administrative offices, including depreciation expense, logistics, information systems and legal, financial, human resources, and other corporate functions. Administrative expenses generally do not increase or decrease directly with changes in sales volume.
Research and Development Expenses. Research and development expenses primarily include personnel costs, outside engineering costs, professional services, prototype costs, test equipment, software usage fees and related overhead expenses. Research and development expenses are recognized when incurred. The level of research and development expense is related to the number of products in development, the stage of development process, the complexity of the underlying technology, the potential scale of the product upon successful commercialization and the level of our exploratory research. We conduct such activities in areas we believe will accelerate our longer term net revenue growth.
We are devoting substantial resources to the development of additional functionality for existing products and the development of new products and related software applications. We intend to continue to invest in our research and development efforts because we believe they are essential to maintaining and improving our competitive position.
Amortization of Acquired Intangible Assets. As a result of the Merger, the acquisitions of NES and Radvision, and other acquisitions, significant amounts were recognized in purchase accounting for the estimated fair values of customer relationships associated with the businesses acquired. The fair value of these intangible assets was estimated by independent valuations at the time of acquisition and is amortized into our operating expenses over their estimated useful lives.
Restructuring and Impairment Charges, net. In response to the global economic climate, the acquisitions of NES and Radvision and the Company’s commitment to control costs, the Company implemented initiatives designed to streamline the operations of the Company and generate cost savings. The Company exited and consolidated facilities and terminated or relocated certain job functions. The expenses associated with these actions are reflected in our operating results. As the Company continues to evaluate and identify additional operational synergies, additional cost saving opportunities may be identified and future restructuring charges may be incurred.
Interest Expense. Interest expense consists primarily of interest on indebtedness under our credit facilities and our notes. Interest expense also includes the amortization of deferred financing costs, the amortization of debt discount, and the expense associated with interest rate derivative instruments we use to minimize our exposure to variable rate interest payments associated with our debt. We regularly evaluate market conditions, our liquidity profile, and various financing alternatives for opportunities to enhance our capital structure. If market conditions are favorable, we may refinance existing debt or issue additional debt securities.
Loss on Extinguishment of Debt. During fiscal 2014, 2013 and 2011, Avaya Inc. completed a series of transactions which allowed us to refinance certain of our debt arrangements. Under accounting principles generally accepted in the United States of America, or GAAP, Avaya Inc. was required to account for certain of these transactions as an extinguishment of debt. A loss representing the difference between the reacquisition price of the original debt (including consent fees paid by Avaya to the holders of the original debt that consented to the transaction) and the carrying value of the old debt (including unamortized debt discount and debt issue costs) was recognized. See Note 10, “Financing Arrangements,” to our audited Consolidated Financial Statements included elsewhere in this prospectus for further details.
Other (Expense) Income, net. Other (expense) income, net consists primarily of gains and losses on foreign currency transactions and forward contracts, changes in the fair value of certain features included in the Company’s Series B Convertible Preferred Stock (“preferred series B”) which are considered an embedded
60
Table of Contents
derivative, third party fees incurred in connection with certain debt modifications, changes to the reserves of certain tax indemnifications, interest income, and other gains and losses that are not considered part of the Company’s ongoing major or central operations.
Income Taxes. Income taxes are accounted for under the asset and liability method. Under this method, deferred tax assets and liabilities are recognized for the estimated future tax consequences attributable to differences between the financial statement carrying amounts of existing assets and liabilities and their respective tax bases, and operating loss and tax credit carryforwards. Deferred tax assets and liabilities are measured using enacted tax rates in effect for the year in which those temporary differences are expected to be recovered or settled. Our effective income tax rate differs from the U.S. federal tax rate primarily due to (1) the effect of tax rate differentials on foreign income/loss, (2) changes in the valuation allowance established against the Company’s deferred tax assets, and (3) changes in estimates of uncertain tax positions. As of September 30, 2012, the Company changed its indefinite reinvestment of undistributed foreign earnings assertion with respect to its non-U.S. subsidiaries. As a result the Company recorded income tax (expense) benefit of $(17) million, $(2) million, and $1 million in fiscal 2012, 2013, and 2014 respectively, relating to non-U.S. taxes.
Discontinued Operations. On March 31, 2014, the Company completed the sale of its ITPS business. As a result of the divestiture of the ITPS business, the results of operations, cash flows, and assets and liabilities of this business have been classified as discontinued operations in all periods presented. See Note 5, “Divestitures—IT Professional Services Business,” to our audited Consolidated Financial Statements included elsewhere in this prospectus for further details.
Selected Segment Information
Avaya conducts its business operations in three segments. Two of those segments, Global Communications Solutions, or GCS, and Avaya Networking, or Networking, make up Avaya’s Enterprise Collaboration Solutions, or ECS, product portfolio. The third segment contains Avaya’s services portfolio and is called Avaya Global Services, or AGS.
In GCS, we deliver business collaboration and communications products primarily for IT infrastructure, unified communications, and contact centers. Our infrastructure and UC application products are designed to promote collaboration, innovation, productivity and real-time decision-making by providing business users a highly intuitive and personalized user experience that enables them to collaborate seamlessly across various modes of communication, including voice, video, email, instant messaging, text messaging, web conferencing, voicemail and social networking. Our contact center applications are highly reliable, scalable communications-centric applications suites designed to optimize customer service.
Our Networking segment provides a broad range of internet protocol networking infrastructure products including ethernet switches, routers and Virtual Private Network or VPN appliances, wireless networking routers, access control products, unified management products and end-to-end virtualization strategies and architectures.
61
Table of Contents
Through our AGS segment we help our customers evaluate, plan, design, implement, support, manage and optimize their enterprise communications networks to help them achieve enhanced business results. Our award-winning service portfolio includes product support, integration and professional and Cloud and managed services that enable customers to optimize and manage their converged communications networks worldwide.
| Dollars in millions |
Fiscal year ended September 30, 2014 | Fiscal year ended September 30, 2013 | ||||||||||||||||||||||||||||||
| Revenues | Gross Profit | Revenues | Gross Profit | |||||||||||||||||||||||||||||
| Dollar Amount |
Percent of Total Revenue |
Dollar Amount |
Percent of Revenue |
Dollar Amount |
Percent of Total Revenue |
Dollar Amount |
Percent of Revenue |
|||||||||||||||||||||||||
| Global Communications Solutions |
$ | 1,953 | 45 | % | $ | 1,241 | 64 | % | $ | 2,096 | 46 | % | $ | 1,276 | 61 | % | ||||||||||||||||
| Avaya Networking |
243 | 5 | % | 107 | 44 | % | 242 | 5 | % | 101 | 42 | % | ||||||||||||||||||||
|
|
|
|
|
|
|
|
|
|
|
|
|
|
|
|
|
|||||||||||||||||
| Enterprise Collaboration Systems |
2,196 | 50 | % | 1,348 | 61 | % | 2,338 | 51 | % | 1,377 | 59 | % | ||||||||||||||||||||
| Avaya Global Services |
2,175 | 50 | % | 1,220 | 56 | % | 2,241 | 49 | % | 1,223 | 55 | % | ||||||||||||||||||||
| Unallocated Amounts |
— | — | % | (69 | ) | (1) | (1 | ) | — | % | (70 | ) | (1) | |||||||||||||||||||
|
|
|
|
|
|
|
|
|
|
|
|
|
|
|
|
|
|||||||||||||||||
| $ | 4,371 | 100 | % | $ | 2,499 | 57 | % | $ | 4,578 | 100 | % | $ | 2,530 | 55 | % | |||||||||||||||||
|
|
|
|
|
|
|
|
|
|
|
|
|
|
|
|
|
|||||||||||||||||
| (1) | Not meaningful |
62
Table of Contents
Financial Results Summary
The following table sets forth our results of operations for fiscal 2014, 2013 and 2012, as reported in our audited Consolidated Financial Statements located elsewhere in this prospectus.
| Fiscal years
ended September 30, |
||||||||||||
| 2014 | 2013 | 2012 | ||||||||||
| (in millions, except per share amounts) |
||||||||||||
| STATEMENTS OF OPERATIONS DATA: |
||||||||||||
| REVENUE |
||||||||||||
| Products |
$ | 2,196 | $ | 2,337 | $ | 2,672 | ||||||
| Services |
2,175 | 2,241 | 2,347 | |||||||||
|
|
|
|
|
|
|
|||||||
| 4,371 | 4,578 | 5,019 | ||||||||||
|
|
|
|
|
|
|
|||||||
| COSTS |
||||||||||||
| Products: |
||||||||||||
| Costs (exclusive of amortization of acquired technology intangible assets) |
854 | 963 | 1,145 | |||||||||
| Amortization of acquired technology intangible assets |
56 | 63 | 192 | |||||||||
| Services |
962 | 1,022 | 1,134 | |||||||||
|
|
|
|
|
|
|
|||||||
| 1,872 | 2,048 | 2,471 | ||||||||||
|
|
|
|
|
|
|
|||||||
| GROSS PROFIT |
2,499 | 2,530 | 2,548 | |||||||||
|
|
|
|
|
|
|
|||||||
| OPERATING EXPENSES |
||||||||||||
| Selling, general and administrative |
1,531 | 1,512 | 1,617 | |||||||||
| Research and development |
379 | |
445 |
|
|
464 |
| |||||
| Amortization of acquired intangible assets |
227 | 228 | 227 | |||||||||
| Restructuring and impairment charges, net |
165 | 200 | 147 | |||||||||
| Acquisition-related costs . . |
— | 1 | 4 | |||||||||
|
|
|
|
|
|
|
|||||||
| 2,302 | 2,386 | 2,459 | ||||||||||
|
|
|
|
|
|
|
|||||||
| OPERATING INCOME (LOSS) |
197 | 144 | 89 | |||||||||
| Interest expense |
(459 | ) | (467 | ) | (432 | ) | ||||||
| Loss on extinguishment of debt |
(5 | ) | (6 | ) | — | |||||||
| Other income (expense), net |
3 | (25 | ) | (29 | ) | |||||||
|
|
|
|
|
|
|
|||||||
| LOSS FROM CONTINUING OPERATIONS BEFORE INCOME TAXES |
(264 | ) | (354 | ) | (372 | ) | ||||||
| (Provision for) benefit from income taxes |
(51 | ) | 35 | 4 | ||||||||
|
|
|
|
|
|
|
|||||||
| LOSS FROM CONTINUING OPERATIONS |
(315 | ) | (319 | ) | (368 | ) | ||||||
| Income (loss) from discontinued operations, net of income taxes |
62 | (57 | ) | 14 | ||||||||
|
|
|
|
|
|
|
|||||||
| NET LOSS |
(253 | ) | (376 | ) | (354 | ) | ||||||
| Less: Accretion of issuance costs and accrued dividends on Series A and Series B preferred stock |
(45 | ) | (43 | ) | (71 | ) | ||||||
|
|
|
|
|
|
|
|||||||
| NET LOSS ATTRIBUTABLE TO COMMON STOCKHOLDERS |
$ | (298 | ) | $ | (419 | ) | $ | (425 | ) | |||
|
|
|
|
|
|
|
|||||||
| Basic and diluted earnings per share attributable to common stockholders: |
||||||||||||
| Loss from continuing operations per share - basic and diluted |
$ | (0.73 | ) | $ | (0.74 | ) | $ | (0.90 | ) | |||
| Income (loss) from discontinued operations per share - basic and diluted |
0.13 | (0.12 | ) | 0.03 | ||||||||
|
|
|
|
|
|
|
|||||||
| Net loss per share - basic and diluted |
$ | (0.60 | ) | $ | (0.86 | ) | $ | (0.87 | ) | |||
|
|
|
|
|
|
|
|||||||
| Weighted average shares outstanding - basic and diluted |
495.4 | 489.8 | 489.6 | |||||||||
|
|
|
|
|
|
|
|||||||
63
Table of Contents
Summary of the Fiscal Year Ended September 30, 2014 versus 2013
Our revenue for fiscal 2014 decreased 5% as compared to fiscal 2013. While our go-to-market efforts have been successful in driving the revenue growth of our flagship products, we experienced declines in excess of these gains in the revenues attributable to our core and legacy product lines. The shift toward our flagship products has detracted from the sales of our legacy products. Further, as our core products are integral components to our flagship and legacy products, core product sales declined as the decrease in sales of our legacy products were only partially offset by the increase in sales of our flagship products. In addition, we believe better utilization of SIP technology, which enables our customers to run their communication networks more efficiently requiring fewer gateways and servers, has contributed to lower demand for our core product lines. The declines in our legacy and core products in turn contributed to lower maintenance and professional services revenue. We believe the decrease in our core and legacy product revenues may also be due in part to a growing market trend around Cloud consumption preferences with more customers exploring an operational expense, or OpEx models, rather than a capital expenditure, or CapEx models, for procuring technology. Increasingly, to manage costs and efficiencies, we believe customers are exploring a shift to OpEx models, also referred to as “spend-as-you-go” models, where they pay a fee for business collaboration and communications services but the underlying solutions, infrastructure and personnel are owned and managed by the equipment vendor or a managed services or Cloud provider, as opposed to CapEx models that require them to invest in and own the solutions, infrastructure and personnel. We believe the market trend toward OpEx models will continue as we see an increasing number of opportunities and requests for proposal based on OpEx models. As the trend towards the OpEx model continues, we have focused our go-to-market strategy on our Avaya Private Cloud Services, or APCS, as well as our flagship product offerings such as Avaya Aura, contact center and IP Office. Throughout fiscal 2014, our total contracted value for cloud managed services grew and as of September 30, 2014 we estimate the total contracted value exceeds $750 million. The values for these contracts are usually larger than contracts under a CapEx model, but the associated revenues are recognized over a period of time, typically three to seven years.
The Company has maintained its focus on profitability levels and investing in future results and continued to implement cost savings programs designed to streamline its operations, generate cost savings, and eliminate overlapping processes and expenses associated with various acquisitions and in response to the global economic downturn. These cost savings programs have included: (1) reducing headcount, (2) relocating certain job functions to lower cost geographies, including service delivery, customer care, research and development, human resources and finance, (3) eliminating real estate costs associated with unused or under-utilized facilities and (4) implementing gross margin improvement and other cost reduction initiatives. During fiscal 2014, the Company incurred restructuring charges of $165 million. The Company continues to evaluate opportunities to streamline its operations and identify cost savings globally and may take additional restructuring actions in the future and the costs of those actions could be material.
Operating income for fiscal 2014 and 2013 was $197 million and $144 million, respectively, an increase of $53 million. The increase in operating income is primarily attributable to lower restructuring charges and the continued benefit from our cost savings initiatives. In addition to these improvements in operating income, our fiscal 2014 operating results compared to our fiscal 2013 results reflect, among other things:
| • | a 1% decrease in gross profit primarily as a result of decreased revenues as discussed above, while gross margin increased to 57.2% in fiscal 2014 as compared to 55.3% in fiscal 2013; |
| • | additional selling expenses associated with our marketing rights at the Sochi Olympics and to support our go-to-market strategy within enterprise and midmarket customers; and |
| • | additional depreciation charges as the Company continues to consolidate and vacate under-utilized facilities. |
Operating income includes non-cash depreciation and amortization of $434 million and $455 million and share-based compensation of $25 million and $11 million for fiscal 2014 and 2013, respectively.
64
Table of Contents
On March 31, 2014, the Company completed the sale of its ITPS business for a final sales price of $101 million, inclusive of $3 million of working capital adjustments and net of $2 million in costs to sell. Income from discontinued operations of $62 million for fiscal 2014 includes the gain on the sale of the ITPS business of $52 million and compares to a loss from discontinued operations of $57 million for fiscal 2013 which includes an $89 million impairment charge to the goodwill of the ITPS business.
Net loss for fiscal 2014 and 2013 was $253 million and $376 million, respectively. The decrease in our net loss is primarily attributable to the increase in operating income as described above, the gain from the sale of the ITPS business in fiscal 2014 as opposed to the loss from discontinued operations recognized in fiscal 2013 primarily attributable to the impairment charge to the goodwill of the ITPS business, partially offset by the increase in the provision for income taxes.
Summary of the Fiscal Year Ended September 30, 2013 versus 2012
Our revenue for fiscal 2013 decreased 9% as compared to fiscal 2012, primarily as a result of lower customer spending on unified communication, contact center and networking products in a cautious economic environment, which in turn contributed to lower maintenance and professional services revenue. During fiscal 2013, we experienced lower sales of our unified communications products, particularly gateways and legacy NES phones and platforms. We believe these declines are primarily attributable to customers choosing not to upgrade their systems in a cautious economic environment, better utilization of SIP technology, and the growing market trend around Cloud consumption preferences with more customers exploring OpEx models as opposed to CapEx models for procuring technology as discussed above.
The Company continues to identify opportunities to streamline its operations and generate cost savings which includes consolidating and exiting facilities and eliminating employee positions. During fiscal 2013, the Company incurred restructuring charges of $200 million, which includes actions to eliminate employee positions primarily in EMEA and the U.S. and the future rental payments related to operating lease obligations associated with the unused space of our Frankfurt, Germany facility and certain other facilities.
Operating income for fiscal 2013 was $144 million as compared to operating income of $89 million for fiscal 2012, an increase of $55 million. In addition to the changes in our revenues discussed above, our fiscal 2013 operating results compared to our fiscal 2012 results reflect, among other things:
| • | a 1% decrease in gross profit primarily as a result of decreased revenues, while gross margin increased to 55.3% in fiscal 2013 as compared to 50.8% in fiscal 2012; |
| • | additional depreciation charges as the Company continues to consolidate and vacate under-utilized facilities; and |
| • | a $10 million charge recognized in the third quarter of fiscal 2013 in connection with the resolution of an intellectual property legal dispute that was not material to Avaya’s financial position. |
These decreases were partially offset by the continued benefit from cost savings initiatives.
Operating income includes non-cash depreciation and amortization of $455 million and $565 million and share-based compensation of $11 million and $8 million for fiscal 2013 and 2012, respectively.
On March 31, 2014, the Company completed the sale of its ITPS business. Loss from discontinued operations was $57 million for fiscal 2013 and included an $89 million impairment charge to the goodwill of the ITPS business which compares to income from discontinued operations of $14 million for fiscal 2012.
Net loss for fiscal 2013 and 2012 was $376 million and $354 million, respectively. The increase in our net loss is primarily attributable to the decrease in operating income as described above, the loss from discontinued operations in fiscal 2013 which included an $89 million impairment charge to the goodwill of the ITPS business,
65
Table of Contents
higher interest expense and costs incurred in connection with the modifications to certain credit facilities, partially offset by the impact of income taxes and higher foreign currency transaction gains for fiscal 2013 as compared to fiscal 2012.
Deferred Tax Assets
Our deferred tax assets are primarily a result of deductible temporary differences related to net operating loss (“NOL”) carryforwards, benefit obligations, tax credit carryforwards, and other accruals which are available to reduce taxable income in future periods. As of September 30, 2014, the Company had tax-effected NOL carryforwards of $1,143 million, comprised of $595 million for U.S. federal, state and local taxes and $548 million for foreign taxes including $215 million and, $287 million, in Germany and, Luxembourg, respectively. U.S. federal and state NOL carryforwards expire through the year 2023, with the majority expiring in excess of 8 years. The majority of foreign NOL carryforwards have no expiration. Additionally, the Company has various other tax credit carryforwards totaling $78 million, of which $54 million expire within 5 to 15 years and the remaining have no expiration.
The Internal Revenue Code contains certain provisions which may limit the use of U.S. federal net operating losses and U.S. federal tax credits upon a change in ownership (determined under very broad and complex direct and indirect ownership rules) in the Company within a three-year testing period. As a result of the Merger in October 2007, a significant change in the ownership of the Company occurred that limits, on an annual basis, the Company’s ability to utilize its pre-Merger U.S. federal NOLs and U.S. federal tax credits. The Company’s NOLs and tax credits will continue to be available to offset taxable income and tax liabilities (until such NOLs and tax credits are either used or expire) subject to the annual limitation. If the annual limitation amount is not fully utilized in a particular tax year, then the unused portion from that particular tax year will be added to the annual limitation in subsequent years. We do not believe that the share issuance as contemplated in this prospectus itself, or when aggregated with other prior shareholder ownership changes during the applicable testing period, cause an ownership change that would further limit, on an annual basis, our ability to utilize our current U.S. federal net operating losses and U.S. federal tax credits. Under German tax law any change in ownership in excess of 25% would limit the amount of NOL carryforward available for use in future periods. Depending on market conditions, share issuance related to a proposed initial public offering may result in an ownership change under German law that would limit our ability to utilize our current German NOL carryforward.
A valuation allowance is recorded to reduce the carrying amounts of deferred tax assets if it is more likely than not that some or all of its deferred tax assets will not be realized. At September 30, 2014, the Company’s valuation allowance is $1,639 million, of which $1,068 million, $296 million, $224 million and $51 million relates to U.S., Germany, Luxembourg, and other foreign entities, respectively. Primarily as a result of significant book taxable losses incurred subsequent to the Merger, the Company’s deferred tax assets exceed its deferred tax liabilities, exclusive of the U.S. deferred tax liabilities associated with indefinite-lived intangible assets. The Company is in a three-year cumulative book taxable loss position in the U.S. and other significant tax jurisdictions and experts to continue to incur significant interest expense related to its debt and amortization and depreciation expense associated with the Merger and acquisition of NES. The Company considered the scheduled reversal of deferred tax assets and liabilities, projected future taxable income, and certain tax planning strategies in assessing the realization of its deferred tax assets. Based on this assessment, the Company determined that it is more likely than not that the deferred tax assets in certain significant jurisdictions, including the U.S., Canada, Ireland, Germany, Luxembourg, Spain and France, will not be realized to the extent they exceed the scheduled reversal of deferred tax liabilities. The recognition of valuation allowances will adversely affect the Company’s effective income tax rate.
66
Table of Contents
Results of Operations
Fiscal Year Ended September 30, 2014 Compared with Fiscal Year Ended September 30, 2013
Revenue
Our revenue for fiscal 2014 and 2013 was $4,371 million and $4,578 million, respectively, a decrease of $207 million or 5%. The following table sets forth a comparison of revenue by portfolio:
| Fiscal years ended September 30, | ||||||||||||||||||||||||
| 2014 | 2013 | Percentage
of Total Revenue |
Yr. to
Yr. Percent Change |
Yr. to Yr.
Percent Change, net of Foreign Currency Impact |
||||||||||||||||||||
| Dollars in millions |
2014 | 2013 | ||||||||||||||||||||||
| GCS |
$ | 1,953 | $ | 2,096 | 45 | % | 46 | % | (7 | )% | (7 | )% | ||||||||||||
| Purchase accounting adjustments |
— | (1 | ) | — | % | — | % | (1) | (1) | |||||||||||||||
| Networking |
243 | 242 | 5 | % | 5 | % | — | % | 1 | % | ||||||||||||||
|
|
|
|
|
|
|
|
|
|
|
|
|
|||||||||||||
| Total product revenue |
2,196 | 2,337 | 50 | % | 51 | % | (6 | )% | (6 | )% | ||||||||||||||
| AGS |
2,175 | 2,241 | 50 | % | 49 | % | (3 | )% | (3 | )% | ||||||||||||||
|
|
|
|
|
|
|
|
|
|
|
|
|
|||||||||||||
| Total revenue |
$ | 4,371 | $ | 4,578 | 100 | % | 100 | % | (5 | )% | (4 | )% | ||||||||||||
|
|
|
|
|
|
|
|
|
|
|
|
|
|||||||||||||
| (1) | Not meaningful |
GCS revenue for fiscal 2014 and 2013 was $1,953 million and $2,096 million, respectively, a decrease of $143 million or 7%. The decrease in GCS revenue was primarily attributable to lower demand for our legacy and core products and services, partially offset by increases in demand for our flagship products as discussed above.
Networking revenue for fiscal 2014 and 2013 was $243 million and $242 million, respectively, an increase of $1 million or less than 1%. The increase in Networking revenue is primarily attributable to the Company’s successful completion of its networking deployment at the Sochi Olympics partially offset by the unfavorable impact of foreign currency and lower demand for established networking products.
AGS revenue for fiscal 2014 and 2013 was $2,175 million and $2,241 million, respectively, a decrease of $66 million or 3%. The decrease in AGS revenue was primarily due to lower maintenance and professional services revenues as a result of lower demand for our legacy and core products. These decreases in AGS revenue were partially offset by higher revenue from Cloud and managed services performed under contracts entered into in prior periods.
The following table sets forth a comparison of revenue by location:
| Fiscal years ended September 30, | ||||||||||||||||||||||||
| 2014 | 2013 | Percentage
of Total Revenue |
Yr. to
Yr. Percentage Change |
Yr. to Yr. Percentage Change, net of Foreign Currency Impact |
||||||||||||||||||||
| Dollars in millions |
2014 | 2013 | ||||||||||||||||||||||
| U.S. |
$ | 2,267 | $ | 2,430 | 52 | % | 53 | % | (7 | )% | (7 | )% | ||||||||||||
| International: |
||||||||||||||||||||||||
| EMEA |
1,234 | 1,239 | 28 | % | 27 | % | — | % | (2 | )% | ||||||||||||||
| APAC—Asia Pacific |
445 | 457 | 10 | % | 10 | % | (3 | )% | (1 | )% | ||||||||||||||
| Americas International—Canada and Latin America |
425 | 452 | 10 | % | 10 | % | (6 | )% | (1 | )% | ||||||||||||||
|
|
|
|
|
|
|
|
|
|
|
|
|
|||||||||||||
| Total international |
2,104 | 2,148 | 48 | % | 47 | % | (2 | )% | (2 | )% | ||||||||||||||
|
|
|
|
|
|
|
|
|
|
|
|
|
|||||||||||||
| Total revenue |
$ | 4,371 | $ | 4,578 | 100 | % | 100 | % | (5 | )% | (4 | )% | ||||||||||||
|
|
|
|
|
|
|
|
|
|
|
|
|
|||||||||||||
67
Table of Contents
Revenue in the U.S. for fiscal 2014 and 2013 was $2,267 million and $2,430 million, respectively, a decrease of $163 million or 7%. The decrease in U.S. revenue was primarily attributable to lower sales associated with our core and legacy products which contributed to lower revenues from maintenance and professional services. These decreases in U.S. revenue were partially offset by higher revenue from Cloud and managed services performed under contracts entered into in prior periods. Revenue in EMEA for fiscal 2014 and 2013 was $1,234 million and $1,239 million, respectively, a decrease of $5 million or less than one percent. The decrease in EMEA revenue was primarily attributable to lower sales associated with core and legacy products which contributed to lower revenues from maintenance and professional services. These decreases in EMEA revenue were partially offset by the favorable impact of foreign currency, higher revenue from Cloud and managed services performed under contracts entered into in prior periods, and the Company’s successful completion of its networking deployment at the Sochi Olympics. Revenue in APAC for fiscal 2014 and 2013 was $445 million and $457 million, respectively, a decrease of $12 million or 3%. The decrease in APAC revenue was primarily attributable to lower sales associated with our core and legacy products and the unfavorable impact of foreign currency. These decreases in APAC revenue were partially offset by higher revenue from Cloud and managed services performed under contracts entered into in prior periods. Revenue in Americas International was $425 million and $452 million for fiscal 2014 and 2013, respectively, a decrease of $27 million or 6%. The decrease in Americas International revenue was primarily attributable to the unfavorable impact of foreign currency and lower sales associated with our core and legacy products. The decreases in Americas International revenue were partially offset by higher sales of our contact center products and higher revenue from Cloud and managed services performed under contracts entered into in prior periods.
We sell our products both directly and through an indirect sales channel. The following table sets forth a comparison of revenue from sales of products by channel:
| Fiscal years ended September 30, | ||||||||||||||||||||||||
| 2014 | 2013 | Percentage
of ECS Product Revenue |
Yr. to
Yr. Percentage Change |
Yr. to
Yr. Percentage Change, net of Foreign Currency Impact |
||||||||||||||||||||
| Dollars in millions |
2014 | 2013 | ||||||||||||||||||||||
| Direct |
$ | 551 | $ | 551 | 25 | % | 24 | % | — | % | (1 | )% | ||||||||||||
| Indirect |
1,645 | 1,786 | 75 | % | 76 | % | (8 | )% | (8 | )% | ||||||||||||||
|
|
|
|
|
|
|
|
|
|
|
|
|
|||||||||||||
| Total ECS product revenue |
$ | 2,196 | $ | 2,337 | 100 | % | 100 | % | (6 | )% | (6 | )% | ||||||||||||
|
|
|
|
|
|
|
|
|
|
|
|
|
|||||||||||||
Gross Profit
The following table sets forth a comparison of gross profit by segment:
| Fiscal years ended September 30, | ||||||||||||||||||||||||
| Gross Profit | Gross Margin | Change | ||||||||||||||||||||||
| Dollars in millions |
2014 | 2013 | 2014 | 2013 | Amount | Percentage | ||||||||||||||||||
| GCS |
$ | 1,241 | $ | 1,276 | 63.5 | % | 60.9 | % | $ | (35 | ) | (3 | )% | |||||||||||
| Networking |
107 | 101 | 44.0 | % | 41.7 | % | 6 | 6 | % | |||||||||||||||
|
|
|
|
|
|
|
|
|
|
|
|
|
|||||||||||||
| ECS |
1,348 | 1,377 | 61.4 | % | 58.9 | % | (29 | ) | (2 | )% | ||||||||||||||
| AGS |
1,220 | 1,223 | 56.1 | % | 54.6 | % | (3 | ) | — | % | ||||||||||||||
| Unallocated amounts |
(69 | ) | (70 | ) | (1) | (1) | 1 | (1) | ||||||||||||||||
|
|
|
|
|
|
|
|
|
|
|
|
|
|||||||||||||
| Total |
$ | 2,499 | $ | 2,530 | 57.2 | % | 55.3 | % | $ | (31 | ) | (1 | )% | |||||||||||
|
|
|
|
|
|
|
|
|
|
|
|
|
|||||||||||||
| (1) | Not meaningful |
Gross profit for fiscal 2014 and 2013 was $2,499 million and $2,530 million, respectively, a decrease of $31 million or 1%. The decrease is primarily attributable to a decrease in sales volume, as well as $6 million of
68
Table of Contents
additional depreciation related to the change in the estimates of salvage value and useful life of the Company’s Westminster, Colorado facility, and the effect of a $5 million benefit associated with the release of a contingent liability during fiscal 2013 related to a labor matter in EMEA that we released as a result of a favorable court ruling. These decreases in gross profit were partially offset by the success of our gross margin improvement initiatives, the improvement in our customer discount discipline, and the impact of lower amortization of acquired technology intangible assets. Our gross margin improvement initiatives included exiting facilities, reducing the workforce, relocating positions to lower-cost geographies, productivity improvements, and obtaining better pricing from our contract manufacturers and transportation vendors. As a result of our gross margin improvement initiatives and the improvement in our customer discount discipline, gross margin increased to 57.2% for fiscal 2014 from 55.3% for fiscal 2013.
GCS gross profit for fiscal 2014 and 2013 was $1,241 million and $1,276 million, respectively, a decrease of $35 million or 3%. The decrease in GCS gross profit is primarily due to the decrease in sales volume. This decrease in gross profit was partially offset by the success of our gross margin improvement initiatives discussed above and the improvement in our customer discount discipline. As a result of our gross margin improvement initiatives and the improvement in our customer discount discipline, GCS gross margin increased to 63.5% for fiscal 2014 compared to 60.9% for fiscal 2013.
Networking gross profit for fiscal 2014 and 2013 was $107 million and $101 million, respectively, an increase of $6 million or 6%. Networking gross margin increased to 44.0% for fiscal 2014 from 41.7% for fiscal 2013. The increase in Networking gross profit and margin were due to higher revenues associated with several new product launches beginning in July 2013, the Company’s successful completion of its networking deployment at the Sochi Olympics and our gross margin improvement initiatives.
AGS gross profit for fiscal 2014 and 2013 was $1,220 million and $1,223 million, respectively, a decrease of $3 million or less than one percent. The decrease in AGS gross profit is primarily due to lower services revenue and the effect of a $5 million benefit associated with the release of contingent liability during fiscal 2013 related to a labor matter in EMEA that we released as a result of a favorable court ruling. These decreases in AGS gross profit were partially offset by the continued benefit from our gross margin improvement initiatives discussed above. We have redesigned the Avaya support website and continue to transition our customers from an agent-based support model to a largely self-service/web-based support model. These improvements have allowed us to reduce the workforce and relocate positions to lower-cost geographies. As a result of the above factors, AGS gross margin increased to 56.1% for fiscal 2014 compared to 54.6% for fiscal 2013.
Unallocated amounts for fiscal 2014 and 2013 include the effect of the amortization of acquired technology intangibles and costs that are not core to the measurement of segment management’s performance, but rather are controlled at the corporate level. The decrease in unallocated amounts is attributable to lower amortization associated with technology intangible assets acquired prior to fiscal 2013 partially offset by $6 million of additional depreciation related to the change in the estimates of salvage value and useful life of the Company’s Westminster, Colorado facility.
Operating Expenses
| Fiscal years ended September 30, | ||||||||||||||||||||||||
| 2014 | 2013 | Percentage of Revenue | Change | |||||||||||||||||||||
| Dollars in millions |
2014 | 2013 | Amount | Percentage | ||||||||||||||||||||
| Selling, general and administrative |
$ | 1,531 | $ | 1,512 | 35.0 | % | 33.0 | % | $ | 19 | 1 | % | ||||||||||||
| Research and development |
379 | 445 | 8.7 | % | 9.7 | % | (66 | ) | (15 | )% | ||||||||||||||
| Amortization of acquired intangible assets |
227 | 228 | 5.2 | % | 5.0 | % | (1 | ) | — | % | ||||||||||||||
| Restructuring and impairment charges, net |
165 | 200 | 3.8 | % | 4.4 | % | (35 | ) | (18 | )% | ||||||||||||||
| Acquisition-related costs |
— | 1 | — | % | — | % | (1 | ) | (100 | )% | ||||||||||||||
|
|
|
|
|
|
|
|
|
|
|
|
|
|||||||||||||
| Total operating expenses |
$ | 2,302 | $ | 2,386 | 52.7 | % | 52.1 | % | $ | (84 | ) | (4 | )% | |||||||||||
|
|
|
|
|
|
|
|
|
|
|
|
|
|||||||||||||
69
Table of Contents
SG&A expenses for fiscal 2014 and 2013 were $1,531 million and $1,512 million, respectively, an increase of $19 million. The increase was primarily due to the expense of the marketing rights we obtained to the Sochi Olympics and additional selling expenses to support our go-to-market strategy within the enterprise and midmarket customer bases. These increases in SG&A expenses were partially offset by our cost savings initiatives. Our cost savings initiatives include exiting and consolidating facilities, reducing the workforce and relocating positions to lower-cost geographies.
R&D expenses for fiscal 2014 and 2013 were $379 million and $445 million, respectively, a decrease of $66 million. The decrease was primarily due to lower expenses associated with our cost savings initiatives discussed above. This decrease in R&D expense was partially offset by $5 million of additional depreciation related to the change in the estimates of salvage value and useful life of the Company’s Westminster, Colorado facility.
Amortization of acquired intangible assets for fiscal 2014 and 2013 was $227 million and $228 million, respectively.
Restructuring and impairment charges, net, for fiscal 2014 and 2013 were $165 million and $200 million, respectively, a decrease of $35 million. The Company continued to identify opportunities to streamline its operations and generate cost savings which included consolidating and exiting facilities and eliminating employee positions. Restructuring charges recorded during fiscal 2014 include employee separation costs of $152 million primarily associated with employee severance actions in EMEA and the U.S. and lease obligations of $13 million primarily related to facilities in the U.S. The EMEA charges include approved plans in the third and fourth quarters of fiscal 2014 for the elimination of 121 and 165 positions and resulted in a charge of $26 million and $39 million, respectively, for which the related payments are expected to be completed in fiscal 2016. The separation charges include, but are not limited to, social pension fund payments and health care and unemployment insurance costs to be paid to or on behalf of the affected employees. A voluntary program offered to certain management employees in the U.S. resulted in the elimination of 172 positions and resulted in a charge of $10 million. Restructuring charges recorded during fiscal 2013 include employee separation costs of $139 million and lease obligations of $61 million. These costs primarily include the payments associated with employee severance actions in EMEA and the U.S. and lease obligations associated with the vacated portion of a facility in Frankfurt, Germany, and facilities in the United Kingdom and the U.S. The severance actions in EMEA provided for the elimination of 234 positions and resulted in a charge of $48 million. The separation charges include, but are not limited to, social pension fund payments and health care and unemployment insurance costs to be paid to or on behalf of the affected employees. Enhanced severance plans were offered to certain management employees in the U.S. in the first and third quarters of fiscal 2013 and resulted in the elimination of 196 and 447 positions and restructuring charges of $9 million and $20 million, respectively. The Company continues to evaluate opportunities to streamline its operations and identify cost savings globally and may take additional restructuring actions in the future and the costs of those actions could be material.
Acquisition-related costs for fiscal 2013 were $1 million and include third-party legal and other costs related to business acquisitions in fiscal 2013.
Operating Income
Fiscal 2014 operating income was $197 million compared to operating income of $144 million for fiscal 2013.
Operating income for fiscal 2014 and 2013 includes non-cash expenses for depreciation and amortization of $434 million and $455 million, and share-based compensation of $25 million and $11 million, respectively.
Interest Expense
Interest expense for fiscal 2014 and 2013 was $459 million and $467 million, respectively, which includes non-cash interest expense of $19 million and $21 million, respectively. Non-cash interest expense for each period
70
Table of Contents
includes amortization of debt issuance costs and accretion of debt discount. Cash interest expense for fiscal 2014 and 2013 was $440 million and $446 million, respectively, a decrease of $6 million. Cash interest expense for fiscal 2014 compared to fiscal 2013 decreased as a result of the expiration of certain unfavorable interest rate swap contracts partially offset by an increase in interest expense as a result of certain debt refinancing transactions that occurred during fiscal 2013.
During fiscal 2013, Avaya Inc. completed a series of transactions which allowed Avaya Inc. to refinance term loans under its senior secured credit facilities that originally matured October 26, 2014 and substantially all of its senior unsecured notes that were scheduled to mature on November 1, 2015. As a result of these debt refinancing transactions, the interest rate associated with the portion of Avaya Inc.’s debt that was refinanced increased. See Note 10, “Financing Arrangements” to our audited Consolidated Financial Statements included elsewhere in this prospectus.
Loss on Extinguishment of Debt
During fiscal 2014, we recognized a $5 million loss on extinguishment of debt in connection with (1) the refinancing of $1,138 million aggregate principal amount of term B-5 loans with the cash proceeds from the issuance of term B-6 loans and (2) the redemption of 100% of the aggregate principal amount of the 10.125%/10.875% senior unsecured PIK toggles notes and the 9.75% senior unsecured cash-pay notes. During fiscal 2013, we recognized a $6 million loss on extinguishment of debt in connection with (1) the issuance of Avaya Inc.’s 9% Senior Secured Notes and the payment of $284 million of Avaya Inc’s term B-5 loans and (2) the refinancing of $584 million of outstanding term B-1 loans. In each period, the loss represents the difference between the reacquisition price and the carrying value (including unamortized discount and debt issues costs) of the debt. See Note 10, “Financing Arrangements” to our audited Consolidated Financial Statements included elsewhere in this prospectus.
Other Income (Expense), Net
Other income, net for fiscal 2014 was $3 million compared with other expense, net of $25 million in fiscal 2013.
Other income, net, for fiscal 2014 includes net foreign currency transaction gains of $18 million and the gain on the sale of the TBU business of $14 million, offset by changes in the fair value of the preferred series B embedded derivative of $22 million, $4 million of net charges associated with certain tax indemnifications, $2 million of third party fees incurred in connection with debt modifications, and a $2 million charge associated with the remeasurement of the monetary assets and liabilities of our Venezuelan subsidiary. Based on developments related to the foreign exchange process in Venezuela, the Company has changed the exchange rate used to remeasure its Venezuelan subsidiary’s monetary assets and liabilities from the official exchange rate as established by the Venezuelan government to the “Complimentary System of Foreign Currency Acquirement” or SICAD rate.
Other expense, net for fiscal 2013 includes $18 million of third party fees incurred in connection with debt modifications and changes in the fair value of the preferred series B embedded derivative of $11 million, partially offset by net foreign currency transaction gains of $5 million. Also included in other expense, net is a $1 million translation loss recognized in connection with the devaluation of the bolivar by the Venezuela government in February 2013.
(Provision for) Benefit from Income Taxes of Continuing Operations
For fiscal 2014 the provision for income taxes of continuing operations was $51 million as compared to the benefit from income taxes of continuing operations of $35 million for fiscal 2013.
71
Table of Contents
The effective income tax rate for fiscal 2014 differs from the statutory U.S. Federal income tax rate primarily due to (1) the effect of tax rate differentials on foreign income/loss, (2) changes in the valuation allowance established against the Company’s deferred tax assets, (3) net reductions in the Company’s liability for unrecognized tax benefits resulting from the settlement of certain international tax exams offset by increases due to tax positions taken during the current period, and (4) recognition of a $6 million income tax benefit related to the correction of prior year deferred tax assets and liabilities for certain non-U.S. legal entities.
The effective rate for fiscal 2013 differs from the statutory U.S. federal income tax rate primarily due to (1) the effect of tax rate differentials on foreign income/loss, (2) changes in the valuation allowance established against the Company’s deferred tax assets, (3) the recognition of a $96 million benefit as a result of net gains in other comprehensive income, and (4) $17 million of income tax benefit recognized upon the expiration of certain interest rate swaps. The tax effect of such interest rate swaps was recognized in other comprehensive income prior to the establishment of a valuation allowance against the Company’s U.S. net deferred tax assets and was eliminated following the expiration of the final interest rate swap upon which the tax effect was established.
Income (Loss) from Discontinued Operations, Net of Income Taxes
Income from discontinued operations for fiscal 2014 was $62 million and compares to a loss from discontinued operations for fiscal 2013 of $57 million. On March 31, 2014, the Company completed the sale of its ITPS business for a final sales price of $101 million, inclusive of $3 million of working capital adjustments and net of $2 million in costs to sell. Income from discontinued operations for fiscal 2014 includes the gain on the sale of the ITPS business of $52 million. Loss from discontinued operations for the fiscal 2013 included the impact of an $89 million impairment charge to goodwill. See Note 5, “Divestitures—IT Professional Services Business,” to our audited Consolidated Financial Statements for further details.
Fiscal Year Ended September 30, 2013 Compared with Fiscal Year Ended September 30, 2012
Revenue
Our revenue for fiscal 2013 and 2012 was $4,578 million and $5,019 million, respectively, a decrease of $441 million or 9%. Revenue from the Radvision business for fiscal 2013 was $80 million and for the period June 5, 2012 through September 30, 2012 was $31 million.
The following table sets forth a comparison of revenue by portfolio:
| Fiscal years ended September 30, | ||||||||||||||||||||||||
| 2013 | 2012 | Percentage
of Total Revenue |
Yr. to
Yr. Percent Change |
Yr. to Yr.
Percent Change, net of Foreign Currency Impact |
||||||||||||||||||||
| Dollars in millions |
2013 | 2012 | ||||||||||||||||||||||
| GCS |
$ | 2,096 | $ | 2,390 | 46 | % | 47 | % | (12 | )% | (12 | )% | ||||||||||||
| Purchase accounting adjustments |
(1 | ) | (2 | ) | — | % | — | % | (1) | (1) | ||||||||||||||
| Networking |
242 | 284 | 5 | % | 6 | % | (15 | )% | (15 | )% | ||||||||||||||
|
|
|
|
|
|
|
|
|
|
|
|
|
|||||||||||||
| Total product revenue |
2,337 | 2,672 | 51 | % | 53 | % | (13 | )% | (13 | )% | ||||||||||||||
| AGS |
2,241 | 2,347 | 49 | % | 47 | % | (5 | )% | (4 | )% | ||||||||||||||
|
|
|
|
|
|
|
|
|
|
|
|
|
|||||||||||||
| Total revenue |
$ | 4,578 | $ | 5,019 | 100 | % | 100 | % | (9 | )% | (9 | )% | ||||||||||||
|
|
|
|
|
|
|
|
|
|
|
|
|
|||||||||||||
| (1) | Not meaningful |
GCS revenue for fiscal 2013 and 2012 was $2,096 million and $2,390 million, respectively, a decrease of $294 million or 12%. The decrease in GCS revenue was primarily the result of lower customer spend on unified communications and contact center products in a cautious economic environment as discussed above. These decreases were partially offset by the incremental revenue from the Radvision business for fiscal 2013 as compared to the period June 5, 2012 through September 30, 2012.
72
Table of Contents
Networking revenue for fiscal 2013 and 2012 was $242 million and $284 million, respectively, a decrease of $42 million or 15%. The decrease in Networking revenue is primarily a result of lower customer spend in a cautious economic environment.
AGS revenue for fiscal 2013 and 2012 was $2,241 million and $2,347 million, respectively, a decrease of $106 million or 5%. The decrease in AGS revenue was primarily due to lower maintenance and professional services revenues as a result of lower product sales particularly in the U.S. These decreases were partially offset by an increase in revenues from Cloud and managed services performed under contracts entered into in prior periods.
The following table sets forth a comparison of revenue by location:
| Fiscal years ended September 30, | ||||||||||||||||||||||||
| 2013 | 2012 | Percentage
of Total Revenue |
Yr. to
Yr. Percentage Change |
Yr. to Yr. Percentage Change, net of Foreign Currency Impact |
||||||||||||||||||||
| Dollars in millions |
2013 | 2012 | ||||||||||||||||||||||
| U.S. |
$ | 2,430 | $ | 2,634 | 53 | % | 52 | % | (8 | )% | (8 | )% | ||||||||||||
| International: |
||||||||||||||||||||||||
| EMEA |
1,239 | 1,349 | 27 | % | 27 | % | (8 | )% | (8 | )% | ||||||||||||||
| APAC—Asia Pacific |
457 | 497 | 10 | % | 10 | % | (8 | )% | (7 | )% | ||||||||||||||
| Americas International—Canada and Latin America |
452 | 539 | 10 | % | 11 | % | (16 | )% | (14 | )% | ||||||||||||||
|
|
|
|
|
|
|
|
|
|
|
|
|
|||||||||||||
| Total international |
2,148 | 2,385 | 47 | % | 48 | % | (10 | )% | (9 | )% | ||||||||||||||
|
|
|
|
|
|
|
|
|
|
|
|
|
|||||||||||||
| Total revenue |
$ | 4,578 | $ | 5,019 | 100 | % | 100 | % | (9 | )% | (9 | )% | ||||||||||||
|
|
|
|
|
|
|
|
|
|
|
|
|
|||||||||||||
Revenue in the U.S. for fiscal 2013 and 2012 was $2,430 million and $2,634 million, respectively, a decrease of $204 million or 8%. The decrease in U.S. revenue was primarily attributable to lower sales associated with our unified communications and contact center products, which contributed to lower revenues from maintenance and professional services. Revenue in EMEA for fiscal 2013 and 2012 was $1,239 million and $1,349 million, respectively, a decrease of $110 million or 8%. The decrease in EMEA revenue was primarily attributable to lower sales associated with our unified communications products and to lesser extent lower sales associated with our contact center and networking products, partially offset by the incremental revenues from the Radvision business. Revenue in APAC for fiscal 2013 and 2012 was $457 million and $497 million, respectively, a decrease of $40 million or 8%. The decrease in APAC revenue is primarily attributable to lower revenues associated with our unified communications and network products and professional services, partially offset by an increase in maintenance services. Revenue in Americas International was $452 million and $539 million for fiscal 2013 and 2012, respectively, a decrease of $87 million or 16%. The decrease in Americas International revenue was particularly attributable to Canada and Brazil and was associated primarily with our unified communications and contact center products, as well as an unfavorable impact of foreign currency.
We sell our products both directly and through an indirect sales channel. The following table sets forth a comparison of revenue from sales of products by channel:
| Fiscal years ended September 30, | ||||||||||||||||||||||||
| 2013 | 2012 | Percentage
of ECS Product Revenue |
Yr. to
Yr. Percentage Change |
Yr. to Yr. Percentage Change, net of Foreign Currency Impact |
||||||||||||||||||||
| Dollars in millions |
2013 | 2012 | ||||||||||||||||||||||
| Direct |
$ | 551 | $ | 662 | 24 | % | 25 | % | (17 | )% | (17 | )% | ||||||||||||
| Indirect |
1,786 | 2,010 | 76 | % | 75 | % | (11 | )% | (11 | )% | ||||||||||||||
|
|
|
|
|
|
|
|
|
|
|
|
|
|||||||||||||
| Total ECS product revenue |
$ | 2,337 | $ | 2,672 | 100 | % | 100 | % | (13 | )% | (13 | )% | ||||||||||||
|
|
|
|
|
|
|
|
|
|
|
|
|
|||||||||||||
73
Table of Contents
Gross Profit
The following table sets forth a comparison of gross profit by segment:
| Fiscal years ended September 30, | ||||||||||||||||||||||||
| Gross Profit | Gross Margin | Change | ||||||||||||||||||||||
| Dollars in millions |
2013 | 2012 | 2013 | 2012 | Amount | Percentage | ||||||||||||||||||
| GCS |
$ | 1,276 | $ | 1,387 | 60.9 | % | 58.0 | % | $ | (111 | ) | (8 | )% | |||||||||||
| Networking |
101 | 115 | 41.7 | % | 40.5 | % | (14 | ) | (12 | )% | ||||||||||||||
|
|
|
|
|
|
|
|
|
|
|
|
|
|||||||||||||
| ECS |
1,377 | 1,502 | 58.9 | % | 56.2 | % | (125 | ) | (8 | )% | ||||||||||||||
| AGS |
1,223 | 1,189 | 54.6 | % | 50.7 | % | 34 | 3 | % | |||||||||||||||
| Unallocated amounts |
(70 | ) | (143 | ) | (1) | (1) | 73 | (1) | ||||||||||||||||
|
|
|
|
|
|
|
|
|
|
|
|
|
|||||||||||||
| Total |
$ | 2,530 | $ | 2,548 | 55.3 | % | 50.8 | % | $ | (18 | ) | (1 | )% | |||||||||||
|
|
|
|
|
|
|
|
|
|
|
|
|
|||||||||||||
| (1) | Not meaningful |
Gross profit for fiscal 2013 and 2012 was $2,530 million and $2,548 million, respectively, a decrease of $18 million or 1%. The decrease is primarily attributable to a decrease in sales volume and lower pricing as a result of increasing competition in the marketplace partially offset by the success of our gross margin improvement initiatives, the impact of lower amortization of acquired technology intangible assets, and a $5 million benefit associated with our release of a contingent liability reserve related to a labor matter in EMEA following the receipt of a favorable court ruling. Our gross margin improvement initiatives included exiting facilities, reducing the workforce, relocating positions to lower-cost geographies, productivity improvements, and obtaining better pricing from our contract manufacturers and transportation vendors. As a result of the above initiatives, gross margin increased to 55.3% for fiscal 2013 from 50.8% for fiscal 2012.
GCS gross profit for fiscal 2013 and 2012 was $1,276 million and $1,387 million, respectively, a decrease of $111 million or 8%. The decrease in GCS gross profit is primarily due to the decrease in sales volume and lower pricing as a result of increasing competition in the marketplace partially offset by the success of our gross margin improvement initiatives discussed above. As a result of the above factors, GCS gross margin increased to 60.9% for fiscal 2013 compared to 58.0% for fiscal 2012.
Networking gross profit for fiscal 2013 and 2012 was $101 million and $115 million, respectively, a decrease of $14 million or 12%. Networking gross margin increased to 41.7% for fiscal 2013 from 40.5% for fiscal 2012. The decrease in Networking gross profit is primarily due to lower revenues, while the increase in gross margin was as a result of the success of our gross margin improvement initiatives partially offset by lower revenues which did not allow us to leverage our fixed costs.
AGS gross profit for fiscal 2013 and 2012 was $1,223 million and $1,189 million, respectively, an increase of $34 million or 3%. The increase is primarily due to the continued benefit from our gross margin improvement initiatives discussed above and a $5 million benefit associated with the release of a contingent liability related to a labor matter in EMEA as a result of a favorable court ruling. We have redesigned the Avaya support website and continue to transition our customers from an agent-based support model to a largely self-service/web-based support model. These improvements have allowed us to reduce our workforce and relocate positions to lower-cost geographies. The increase in AGS gross profit was partially offset by a decrease in services revenue. As a result of the above initiatives, AGS gross margin increased to 54.6% for fiscal 2013 compared to 50.7% for fiscal 2012.
Unallocated amounts for fiscal 2013 and 2012 include the effect of the amortization of acquired technology intangibles and costs that are not core to the measurement of segment management’s performance, but rather are controlled at the corporate level. The decrease in unallocated costs is primarily due to the impact of lower amortization associated with acquired technology intangible assets acquired prior to fiscal 2012.
74
Table of Contents
Operating Expenses
| Fiscal years ended September 30, | ||||||||||||||||||||||||
| 2013 | 2012 | Percentage of Revenue | Change | |||||||||||||||||||||
| Dollars in millions |
2013 | 2012 | Amount | Percentage | ||||||||||||||||||||
| Selling, general and administrative |
$ | 1,512 | $ | 1,617 | 33.0 | % | 32.2 | % | $ | (105 | ) | (6 | )% | |||||||||||
| Research and development |
445 | 464 | 9.7 | % | 9.2 | % | (19 | ) | (4 | )% | ||||||||||||||
| Amortization of acquired intangible assets |
228 | 227 | 5.0 | % | 4.5 | % | 1 | — | % | |||||||||||||||
| Restructuring and impairment charges, net |
200 | 147 | 4.4 | % | 2.9 | % | 53 | 36 | % | |||||||||||||||
| Acquisition-related costs |
1 | 4 | — | % | 0.1 | % | (3 | ) | (75 | )% | ||||||||||||||
|
|
|
|
|
|
|
|
|
|
|
|
|
|||||||||||||
| Total operating expenses |
$ | 2,386 | $ | 2,459 | 52.1 | % | 48.9 | % | $ | (73 | ) | (3 | )% | |||||||||||
|
|
|
|
|
|
|
|
|
|
|
|
|
|||||||||||||
SG&A expenses for fiscal 2013 and 2012 were $1,512 million and $1,617 million, respectively, a decrease of $105 million. The decrease was primarily due to lower expenses as a result of our cost savings initiatives, lower selling expenses and a $3 million benefit associated with our release of a contingent liability reserve related to a labor matter in EMEA following the receipt of a favorable court ruling. Our cost savings initiatives included exiting and consolidating facilities, reducing workforce and relocating positions to lower-cost geographies. These decreases were partially offset by the incremental expenses associated with the Radvision business for the full twelve months ended September 30, 2013 versus the period June 5, 2012 through September 30, 2012, $21 million of additional depreciation expense related to the change in the estimates of the salvage value and useful life of the Company’s New Jersey facility and a $10 million charge recognized in the third quarter of fiscal 2013 in connection with the resolution of an intellectual property dispute that was not material to Avaya’s financial position.
R&D expenses for fiscal 2013 and 2012 were $445 million and $464 million, respectively, a decrease of $19 million. The decrease in R&D expense was primarily due to lower expenses associated with our cost savings initiatives discussed above partially offset by the incremental expenses associated with the Radvision business. Although the Company has identified opportunities to streamline its R&D functions, it continues to focus on product development and innovation. Capitalized software development costs for fiscal 2013 and 2012 were $14 million and $35 million, respectively, a decrease of $21 million.
Amortization of acquired intangible assets for fiscal 2013 and 2012 was $228 million and $227 million, respectively.
Restructuring and impairment charges, net, for fiscal 2013 and 2012 were $200 million and $147 million, respectively, an increase of $53 million. The Company continued to identify opportunities to streamline its operations and generate cost savings which included consolidating and exiting facilities and eliminating employee positions. Restructuring charges recorded during fiscal 2013 include employee separation costs of $139 million and lease obligations of $61 million. These costs primarily include the payments associated with employee severance actions in EMEA and the U.S. and lease obligations associated with the vacated portion of a facility in Frankfurt, Germany, and facilities in the United Kingdom and the U.S. The severance actions in EMEA provided for the elimination of 234 positions and resulted in a charge of $48 million. The separation charges include, but are not limited to, social pension fund payments and health care and unemployment insurance costs to be paid to or on behalf of the affected employees. Enhanced severance plans were offered to certain management employees in the U.S. in the first and third quarters of fiscal 2013 and resulted in the elimination of 196 and 447 positions and restructuring charges of $9 million and $20 million, respectively. Restructuring charges recorded during fiscal 2012 include employee separation costs of $123 million and lease obligations of $19 million. Employee separation costs for the period include $70 million associated with a plan presented to the works council on February 13, 2012 representing employees of certain of the Company’s German subsidiaries to eliminate 327 positions. In addition to the restructuring charges related to Germany, the Company had employee separation costs in the U.S., Canada, and EMEA, excluding Germany. Costs related to
75
Table of Contents
lease obligations include facilities partially or totally vacated during the period primarily located in the United Kingdom and the U.S. The Company continues to evaluate opportunities to streamline its operations and identify cost savings globally and may take additional restructuring actions in the future, the costs of which could be material.
During fiscal 2012, the Company initiated a plan to dispose of a Company owned facility in Germany and relocate to a new facility. Accordingly, the Company wrote the value of this asset down to its net realizable value and had reclassified this asset to held for sale. Included in restructuring and impairment charges, net is an impairment of $5 million for fiscal 2012. During the first quarter of fiscal 2013, the Company sold this facility.
Acquisition-related costs for fiscal 2013 were $1 million and include third-party legal and other costs related to business acquisitions in fiscal 2013. Acquisition-related costs for fiscal 2012 were $4 million and include third-party legal and other costs related to business acquisitions in fiscal 2012.
Operating Income
Fiscal 2013 operating income was $144 million compared to operating income of $89 million for fiscal 2012.
Operating income for fiscal 2013 and 2012 includes non-cash expenses for depreciation and amortization of $455 million and $565 million and share-based compensation of $11 million and $8 million, respectively.
Interest Expense
Interest expense for fiscal 2013 and 2012 was $467 million and $432 million, respectively, which includes non-cash interest expense of $21 million and $22 million, respectively. Non-cash interest expense for each period includes amortization of debt issuance costs and accretion of debt discount. Cash interest expense for fiscal 2013 compared to fiscal 2012 increased as a result of certain debt refinancing transactions partially offset by a decrease in interest expense as a result of the expiration of certain unfavorable interest rate swap contracts.
During fiscal 2013, Avaya Inc. completed a series of transactions which allowed Avaya Inc. to refinance term loans under its senior secured credit facilities that originally matured October 26, 2014 and substantially all of its senior unsecured notes that were scheduled to mature on November 1, 2015. As a result of these transactions and the resulting extension of the maturity of a large portion of our indebtedness, Avaya Inc. extended the maturity date of $2.8 billion of its debt by an additional three to six years, although the interest rates associated with the refinanced portion of Avaya Inc.’s debt increased. See Note 10, “Financing Arrangements” to our audited Consolidated Financial Statements included elsewhere in this prospectus.
Loss on Extinguishment of Debt
In connection with (1) the issuance of Avaya Inc. 9% senior secured notes and the payment of $284 million of Avaya Inc. term B-5 loans and (2) the refinancing of $584 million of outstanding term B-1 loans, we recognized a loss on extinguishment of debt for fiscal 2013 of $6 million. The loss represents the difference between the reacquisition price and the carrying value (including unamortized discount and debt issue costs) of the debt. See Note 10, “Financing Arrangements” to our audited Consolidated Financial Statements included elsewhere in this prospectus.
Other Expense, Net
Other expense, net, for fiscal 2013 was $25 million as compared to other expense, net of $29 million for fiscal 2012. During fiscal 2013, other expense, net, includes $18 million of third party fees incurred in connection with debt modifications and changes in the fair value of the preferred series B embedded derivative of
76
Table of Contents
$11 million, partially offset by net foreign currency transaction gains of $5 million. Also included in other expense, net is a $1 million translation loss recognized in connection with the devaluation of the bolivar by the Venezuela government in February 2013. During fiscal 2012, other expense, net, was primarily related to net foreign currency transaction losses of $21 million.
Benefit from Income Taxes of Continuing Operations
For fiscal 2013 the benefit from income taxes of continuing operations was $35 million as compared to $4 million for fiscal 2012.
The effective rate for fiscal 2013 differs from the statutory U.S. federal income tax rate primarily due to (1) the effect of tax rate differentials on foreign income/loss, (2) changes in the valuation allowance established against the Company’s deferred tax assets, (3) the recognition of a $96 million benefit as a result of net gains in other comprehensive income, and (4) $17 million of income tax benefit recognized upon the expiration of certain interest rate swaps. The tax effect of such interest rate swaps was recognized in other comprehensive income prior to the establishment of a valuation allowance against the Company’s U.S. net deferred tax assets and was eliminated following the expiration of the final interest rate swap upon which the tax effect was established.
The effective income tax rate for fiscal 2012 differs from the U.S. federal tax rate primarily due to (1) effect of tax rate differentials on foreign income/loss, (2) the valuation allowance established against the Company’s deferred tax assets, (3) recognition of a $62 million benefit as a result of net gains in other comprehensive income, (4) the recognition of a $12 million benefit as a result of income from discontinued operations, (5) $17 million of income tax expense related to undistributed foreign earnings, and (6) $9 million of income tax benefit related to the correction of prior year deferred tax assets and liabilities for certain non-U.S. legal entities.
In fiscal 2012, the Company recorded a tax charge of $62 million to other comprehensive income primarily relating to post-employment benefits and a tax charge of $12 million to discontinued operations. The charge to other comprehensive income and discontinued operations resulted in the recording of an income tax benefit within continuing operations in the Consolidated Statement of Operations.
As of September 30, 2012, the Company changed its indefinite reinvestment of undistributed foreign earnings assertion with respect to its non-U.S. subsidiaries. As a result the Company recorded income tax expense of $17 million in fiscal 2012 relating to non-U.S. taxes.
During the fourth quarter of fiscal 2012, the Company recorded a correction to prior year deferred tax assets and liabilities for certain non U.S. legal entities. This adjustment decreased the provision for income taxes by $9 million. Without this adjustment the Company’s fiscal 2012 provision for income taxes and effective income tax rate would have been $17 million and (5%), respectively. The Company evaluated the correction in relation to fiscal 2012, as well as the periods on which the adjustment originated, and concluded that the adjustment is not material to fiscal 2012 and any prior period.
(Loss) Income from Discontinued Operations, Net of Income Taxes
Loss from discontinued operations for fiscal 2013 of $57 million compares to income from discontinued operations for fiscal 2012 of $14 million. On March 31, 2014, the Company completed the sale of its ITPS business. Loss from discontinued operations for fiscal 2013 included the impact of an $89 million impairment charge to goodwill. See Note 5, “Divestitures—IT Professional Services Business,” to our audited Consolidated Financial Statements for further details.
EBITDA and Adjusted EBITDA
EBITDA is defined as net income (loss) before income taxes, interest expense, interest income and depreciation and amortization and excludes the results of discontinued operations. EBITDA provides us with a measure of operating performance that excludes items that are outside the control of management, which can
77
Table of Contents
differ significantly from company to company depending on capital structure, the tax jurisdictions in which companies operate and capital investments. Under Avaya Inc.’s debt agreements, its ability to draw on the revolving credit facilities or engage in activities such as incurring additional indebtedness, making investments and paying dividends is tied in part to ratios based on Adjusted EBITDA. Adjusted EBITDA is a non-GAAP measure of EBITDA further adjusted to exclude certain charges and other adjustments permitted in calculating covenant compliance under Avaya Inc.’s debt agreements. We believe that including supplementary information concerning Adjusted EBITDA is appropriate to provide additional information to investors to demonstrate compliance with Avaya Inc.’s debt agreements and because it serves as a basis for determining management compensation. In addition, we believe Adjusted EBITDA provides more comparability between our historical results and results that reflect purchase accounting and our new capital structure. Accordingly, Adjusted EBITDA measures our financial performance based on operational factors that management can impact in the short-term, namely the Company’s pricing strategies, volume, costs and expenses of the organization.
EBITDA and Adjusted EBITDA have limitations as analytical tools. Adjusted EBITDA does not represent net income (loss) or cash flow from operations as those terms are defined by GAAP and does not necessarily indicate whether cash flows will be sufficient to fund cash needs. While Adjusted EBITDA and similar measures are frequently used as measures of operations and the ability to meet debt service requirements, these terms are not necessarily comparable to other similarly titled captions of other companies due to the potential inconsistencies in the method of calculation. Adjusted EBITDA does not reflect the impact of earnings or charges resulting from matters that we consider not to be indicative of our ongoing operations. In particular, the definition of Adjusted EBITDA in Avaya Inc.’s debt agreements also allow us to add back certain non-cash charges that are deducted in calculating net income (loss). Avaya Inc.’s debt agreements also allows us to add back restructuring charges, certain fees payable to our private equity investors or their affiliates and other specific cash costs and expenses as defined in the agreements and that portion of our pension costs, other post-employment benefit costs, and non-retirement post-employment benefits costs representing the amortization of prior service costs and actuarial gain or loss associated with these employment benefits. However, these are expenses that may recur, may vary and are difficult to predict. Further, Avaya Inc.’s debt agreements require that Adjusted EBITDA be calculated for the most recent four fiscal quarters. As a result, the measure can be disproportionately affected by a particularly strong or weak quarter. Further, it may not be comparable to the measure for any subsequent four-quarter period or any complete fiscal year.
78
Table of Contents
The unaudited reconciliation of loss from continuing operations, which is a GAAP measure, to EBITDA and Adjusted EBITDA is presented below:
| Fiscal years ended September 30, |
||||||||||||
| 2014 | 2013 | 2012 | ||||||||||
| (in millions) | ||||||||||||
| Loss from continuing operations |
$ | (315 | ) | $ | (319 | ) | $ | (368 | ) | |||
| Interest expense |
459 | 467 | 432 | |||||||||
| Interest income |
(2 | ) | (2 | ) | (3 | ) | ||||||
| Provision for (benefit from) income taxes |
51 | (35 | ) | (4 | ) | |||||||
| Depreciation and amortization |
434 | 455 | 565 | |||||||||
|
|
|
|
|
|
|
|||||||
| EBITDA |
627 | 566 | 622 | |||||||||
| Impact of purchase accounting adjustments |
— | 1 | 3 | |||||||||
| Restructuring charges, net |
165 | 200 | 142 | |||||||||
| Sponsors’ fees(a) |
7 | 7 | 7 | |||||||||
| Acquisition-related costs(b) |
— | 1 | 4 | |||||||||
| Integration-related costs(c) |
7 | 15 | 19 | |||||||||
| Divestiture-related costs |
2 | — | — | |||||||||
| Loss on extinguishment of debt(d) |
5 | 6 | — | |||||||||
| Third-party fees expensed in connection with debt(e) |
2 | 18 | — | |||||||||
| Non-cash share-based compensation |
25 | 11 | 8 | |||||||||
| Write-down of held for sale assets to net realizable value |
— | — | 5 | |||||||||
| (Gain) loss on investments and sale of long-lived assets, net |
— | (1 | ) | 3 | ||||||||
| Gain on sale of TBU business |
(14 | ) | — | — | ||||||||
| Change in certain tax indemnifications |
4 | — | — | |||||||||
| Impairment of long-lived assets |
— | 1 | 6 | |||||||||
| Reversal of contingent liability related to acquisition |
— | — | (1 | ) | ||||||||
| Change in fair value of Preferred Series B embedded derivative(f) |
22 | 11 | 6 | |||||||||
| Venezuela hyperinflationary and devaluation charges |
2 | 1 | — | |||||||||
| Securities registration fees(g) |
— | 1 | 3 | |||||||||
| Resolution of certain legal matters(h) |
8 | 10 | — | |||||||||
| (Gain) loss on foreign currency transactions |
(18 | ) | (5 | ) | 21 | |||||||
| Pension/OPEB/nonretirement postemployment benefits(i) |
51 | 79 | 98 | |||||||||
| Other |
3 | — | — | |||||||||
|
|
|
|
|
|
|
|||||||
| Adjusted EBITDA |
$ | 898 | $ | 922 | $ | 946 | ||||||
|
|
|
|
|
|
|
|||||||
| (a) | Sponsors’ monitoring fees represent monitoring fees payable to affiliates of the Sponsors and their designees pursuant to a management services agreement entered into at the time of the Merger. See “Certain Relationships and Related Party Transactions.” |
| (b) | Acquisition-related costs include legal and other costs related to NES, Radvision and other acquisitions. |
| (c) | Integration-related costs primarily represent third-party consulting fees and other administrative costs associated with consolidating and coordinating the operations of Avaya with Radvision and NES. The costs associated with Radvision primarily relate to consolidating and coordinating the operations of Avaya and Radvision and the costs associated with NES primarily relate to developing compatible IT systems and internal processes. |
| (d) | Loss on extinguishment of debt represents losses recognized in connection with certain debt refinancing transaction entered into during fiscal 2014 and 2013. The loss is based on the difference between the reacquisition price and the carrying value of the debt. See Note 10, “Financing Arrangements,” to our audited Consolidated Financial Statements located elsewhere in this prospectus. |
| (e) | The third-party fees expensed in connection with debt modification represent fees paid to third parties in connection with certain debt refinancing transactions entered into during fiscal 2014 and 2013. See Note 10, “Financing Arrangements,” to our audited Consolidated Financial Statements located elsewhere in this prospectus. |
79
Table of Contents
| (f) | Represents the loss on changes in the fair value of certain embedded derivative features of the Company’s Series B preferred stock. Under GAAP, these embedded features must be recognized at fair value at each balance sheet date with the changes in the fair value recognized in operations. See Note 16, “Capital Stock.” to our audited Consolidated Financial Statements located elsewhere in this prospectus. |
| (g) | Represents third party fees incurred in connection with the Company’s registration statement. |
| (h) | Charges recognized in connection with the resolution of certain commercial and intellectual property legal disputes that, individually and in the aggregate, were not material to the Company or Avaya Inc.’s financial position. |
| (i) | Represents that portion of our pension costs, other post-employment benefit costs and non-retirement post-employment benefit costs representing the amortization of prior service costs and net actuarial gains/losses associated with these employment benefits. In fiscal 2013, the amount includes a net curtailment gain of $9 million associated with the U.S. pension and postretirement plans. In fiscal 2012 the amounts include a curtailment charge of $5 million associated with workforce reductions in Germany and the U.S. |
80
Table of Contents
Supplemental Quarterly Financial Information
Our quarterly revenues and other financial measures have varied in the past and can be expected to vary in the future due to numerous factors, including modest seasonality related to the structure of our incentive compensation plan, which has been based on annual targets rather than quarterly targets, and customer budget cycles generally resulting in higher revenue in the fourth fiscal quarter relative to other quarters. The following table sets forth our unaudited (a) revenue, (b) gross profit and (c) reconciliations of loss from continuing operations to EBITDA and Adjusted EBITDA for each of the eight quarters in the period ended September 30, 2014. Operating results for these periods are not necessarily indicative of the operating results for a full year or of the results expected in future periods. You should read this data together with our Consolidated Financial Statements and the related notes included elsewhere in this prospectus.
| Three months ended | ||||||||||||||||||||||||||||||||
| September 30, 2014 |
June 30, 2014 |
March 31, 2014 |
December 31, 2013 |
September 30, 2013 |
June 30, 2013 |
March 31, 2013 |
December 31, 2012 |
|||||||||||||||||||||||||
| (in millions) | ||||||||||||||||||||||||||||||||
| STATEMENTS OF OPERATIONS DATA: |
|
|||||||||||||||||||||||||||||||
| REVENUE |
||||||||||||||||||||||||||||||||
| Products |
$ | 579 | $ | 511 | $ | 532 | $ | 574 | $ | 617 | $ | 560 | $ | 529 | $ | 631 | ||||||||||||||||
| Services |
547 | 543 | 528 | 557 | 552 | 556 | 557 | 576 | ||||||||||||||||||||||||
|
|
|
|
|
|
|
|
|
|
|
|
|
|
|
|
|
|||||||||||||||||
| COSTS |
1,126 | 1,054 | 1,060 | 1,131 | 1,169 | 1,116 | 1,086 | 1,207 | ||||||||||||||||||||||||
|
|
|
|
|
|
|
|
|
|
|
|
|
|
|
|
|
|||||||||||||||||
| Products: |
||||||||||||||||||||||||||||||||
| Costs (exclusive of amortization of technology intangible assets) |
221 | 199 | 206 | 228 | 232 | 234 | 236 | 261 | ||||||||||||||||||||||||
| Amortization of technology intangible assets |
14 | 14 | 14 | 14 | 14 | 13 | 14 | 22 | ||||||||||||||||||||||||
| Services |
236 | 234 | 243 | 249 | 249 | 251 | 257 | 265 | ||||||||||||||||||||||||
|
|
|
|
|
|
|
|
|
|
|
|
|
|
|
|
|
|||||||||||||||||
| 471 | 447 | 463 | 491 | 495 | 498 | 507 | 548 | |||||||||||||||||||||||||
|
|
|
|
|
|
|
|
|
|
|
|
|
|
|
|
|
|||||||||||||||||
| GROSS PROFIT |
$ | 655 | $ | 607 | $ | 597 | $ | 640 | $ | 674 | $ | 618 | $ | 579 | $ | 659 | ||||||||||||||||
|
|
|
|
|
|
|
|
|
|
|
|
|
|
|
|
|
|||||||||||||||||
| Reconciliation of Adjusted EBITDA |
||||||||||||||||||||||||||||||||
| (Loss) income from continuing operations |
$ | (49 | ) | $ | (87 | ) | $ | (120 | ) | $ | (59 | ) | $ | 14 | $ | (140 | ) | $ | (108 | ) | $ | (85 | ) | |||||||||
| Interest expense |
112 | 112 | 116 | 119 | 121 | 122 | 116 | 108 | ||||||||||||||||||||||||
| Interest income |
(1 | ) | — | (1 | ) | — | — | (l | ) | — | (1 | ) | ||||||||||||||||||||
| Provision for (benefit from) income taxes |
32 | (8 | ) | 1 | 26 | (29 | ) | (3 | ) | 7 | (10 | ) | ||||||||||||||||||||
| Depreciation and amortization |
98 | 99 | 118 | 119 | 123 | 110 | 107 | 115 | ||||||||||||||||||||||||
|
|
|
|
|
|
|
|
|
|
|
|
|
|
|
|
|
|||||||||||||||||
| EBITDA |
192 | 116 | 114 | 205 | 229 | 88 | 122 | 127 | ||||||||||||||||||||||||
| Impact of purchase accounting adjustments |
— | — | — | — | — | 1 | — | — | ||||||||||||||||||||||||
| Restructuring charges, net |
71 | 45 | 42 | 7 | 35 | 63 | 18 | 84 | ||||||||||||||||||||||||
| Sponsors’ fees(a) |
1 | 2 | 2 | 2 | 2 | 1 | 2 | 2 | ||||||||||||||||||||||||
| Acquisition-related costs(b) |
— | — | — | — | — | 1 | — | — | ||||||||||||||||||||||||
| Integration-related costs(c) |
2 | 1 | 2 | 2 | 3 | 3 | 5 | 4 | ||||||||||||||||||||||||
| Divestiturc-related costs |
— | 2 | — | — | — | — | — | — | ||||||||||||||||||||||||
| Loss on extinguishment of debt(d) |
— | 1 | 4 | — | — | — | 3 | 3 | ||||||||||||||||||||||||
| Third-party fees expensed in connection with debt modification(e) |
— | — | 2 | — | — | — | 14 | 4 | ||||||||||||||||||||||||
| Non-cash share-based compensation |
5 | 6 | 8 | 6 | 4 | 4 | 1 | 2 | ||||||||||||||||||||||||
| Gain on investments and sale of long-lived assets, net |
— | — | — | — | — | (1 | ) | — | — | |||||||||||||||||||||||
| Gain on sale of TBU business |
(14 | ) | — | — | — | — | — | — | — | |||||||||||||||||||||||
| Change in certain tax indemnifications |
(1 | ) | 8 | (3 | ) | — | — | — | — | — | ||||||||||||||||||||||
| Impairment of long-lived assets |
— | — | — | — | — | 1 | — | — | ||||||||||||||||||||||||
| Change in fair value of Preferred Series B embedded derivative(f) |
— | 23 | (3 | ) | 2 | (2 | ) | 21 | (4 | ) | (4 | ) | ||||||||||||||||||||
| Venezuela hyperinflationary and devaluation charges |
— | — | 2 | — | — | — | 1 | — | ||||||||||||||||||||||||
| Securities registration fees(g) |
— | — | — | — | — | 1 | — | — | ||||||||||||||||||||||||
| Resolution of certain legal matters(h) |
— | 8 | — | — | — | 10 | — | — | ||||||||||||||||||||||||
| (Gain) loss on foreign currency transactions |
(17 | ) | (1 | ) | 2 | (2 | ) | 5 | 5 | (17 | ) | 2 | ||||||||||||||||||||
| Pension/OPEB/nonretirement postemployment benefits and long-term disability costs(i) |
13 | 12 | 13 | 13 | 15 | 19 | 22 | 23 | ||||||||||||||||||||||||
| Other |
1 | — | — | 2 | — | — | — | — | ||||||||||||||||||||||||
|
|
|
|
|
|
|
|
|
|
|
|
|
|
|
|
|
|||||||||||||||||
| Adjusted EBITDA |
$ | 253 | $ | 223 | $ | 185 | $ | 237 | $ | 291 | $ | 217 | $ | 167 | $ | 247 | ||||||||||||||||
|
|
|
|
|
|
|
|
|
|
|
|
|
|
|
|
|
|||||||||||||||||
81
Table of Contents
| (a) | Sponsors’ monitoring fees represent monitoring fees payable to affiliates of the Sponsors pursuant to a management services agreement entered into at the time of the Merger. See Note 20, “Related Party Transactions,” in our audited Consolidated Financial Statements located elsewhere in this prospectus. |
| (b) | Acquisition-related costs include legal and other costs related to NES, Radvision and other acquisitions. |
| (c) | Integration-related costs primarily represent third-party consulting fees and other administrative costs associated with consolidating and coordinating the operations of Avaya with Radvision and NES. The costs associated with Radvision primarily relate to consolidating and coordinating the operations of Avaya and Radvision and the costs associated with NES primarily relate to developing compatible IT systems and internal processes. |
| (d) | Loss on extinguishment of debt represents losses recognized in connection with certain debt refinancing transactions entered into during fiscal 2014 and 2013. The loss is based on the difference between the reacquisition price and the carrying value of the debt. See Note 10, “Financing Arrangements,” to our audited Consolidated Financial Statements located elsewhere in this prospectus. |
| (e) | The third-party fees expensed in connection with debt modification represent fees paid to third parties in connection with certain debt refinancing transactions entered into during fiscal 2014 and 2013. See Note 10, “Financing Arrangements,” to our audited Consolidated Financial Statements located elsewhere in this prospectus. |
| (f) | Represents the loss (gain) on changes in the fair value of certain embedded derivative features of the Company’s Series B preferred stock. Under GAAP, these embedded features must be recognized at fair value at each balance sheet date with the changes in the fair value recognized in operations. See Note 16, “Capital Stock.” to our audited Consolidated Financial Statements located elsewhere in this prospectus. |
| (g) | Represents third party fees incurred in connection with the Company’s registration statement. |
| (h) | Charges recognized in connection with the resolution of certain commercial and intellectual property disputes that, individually and in the aggregate, were not material to the Company or Avaya Inc.’s financial position. |
| (i) | Represents that portion of our pension costs, other post-employment benefit costs and non-retirement post-employment benefit costs representing the amortization of prior service costs and net actuarial gains/losses associated with these employment benefits. In fiscal 2013, the amount includes a net curtailment gain of $9 million associated with the U.S. pension and postretirement plans. |
82
Table of Contents
Liquidity and Capital Resources
We expect our existing cash balance, cash generated by operations and borrowings available under our credit facilities to be our primary sources of short-term liquidity. Based on our current level of operations, we believe these sources will be adequate to meet our liquidity needs for at least the next twelve months. Our ability to meet our cash requirements will depend on our ability to generate cash in the future, which is subject to general economic, financial, competitive, legislative, regulatory and other factors that are beyond our control. As part of our analysis, we have assessed the implications of recent financial events on our current business and determined that these market conditions have not resulted in an inability to meet our obligations as they come due in the ordinary course of business and have not had a significant impact on our liquidity as of September 30, 2014. However, we cannot assure you that our business will generate sufficient cash flows from operations or that future borrowings will be available to us under our credit facilities in an amount sufficient to enable us to repay our indebtedness or to fund our other liquidity needs.
Sources and Uses of Cash
The following table provides the condensed statements of cash flows for the periods indicated:
| Fiscal years ended September 30, |
||||||||||||
| In millions |
2014 | 2013 | 2012 | |||||||||
| Net cash (used for) provided by: |
||||||||||||
| Operating activities |
||||||||||||
| Net loss |
$ | (253 | ) | $ | (376 | ) | $ | (354 | ) | |||
| Income (loss) from discontinued operations, net of income taxes |
62 | (57 | ) | 14 | ||||||||
|
|
|
|
|
|
|
|||||||
| Loss from continuing operations |
(315 | ) | (319 | ) | (368 | ) | ||||||
| Adjustments to net loss for non-cash items |
489 | 392 | 605 | |||||||||
| Changes in operating assets and liabilities |
(139 | ) | 58 | (221 | ) | |||||||
|
|
|
|
|
|
|
|||||||
| Continuing operating activities |
35 | 131 | 16 | |||||||||
| Discontinued operating activities |
4 | 20 | 28 | |||||||||
|
|
|
|
|
|
|
|||||||
| 39 | 151 | 44 | ||||||||||
|
|
|
|
|
|
|
|||||||
| Investing activities |
||||||||||||
| Continuing investing activities |
(33 | ) | (113 | ) | (283 | ) | ||||||
| Discontinued investing activities |
101 | — | — | |||||||||
|
|
|
|
|
|
|
|||||||
| 68 | (113 | ) | (283 | ) | ||||||||
|
|
|
|
|
|
|
|||||||
| Financing activities |
(60 | ) | (79 | ) | 155 | |||||||
|
|
|
|
|
|
|
|||||||
| Effect of exchange rate changes on cash and cash equivalents |
(14 | ) | (8 | ) | 7 | |||||||
|
|
|
|
|
|
|
|||||||
| Net increase (decrease) in cash and cash equivalents |
33 | (49 | ) | (77 | ) | |||||||
| Cash and cash equivalents at beginning of period |
289 | 338 | 415 | |||||||||
|
|
|
|
|
|
|
|||||||
| Cash and cash equivalents at end of period |
$ | 322 | $ | 289 | $ | 338 | ||||||
|
|
|
|
|
|
|
|||||||
Operating Activities
Cash provided by operations was $39 million $151 million and $44 million for fiscal 2014, 2013 and 2012, respectively.
Adjustments to reconcile net loss to net cash provided by operations for fiscal 2014, 2013 and 2012 were $489 million, $392 million and $605 million and consisted of depreciation and amortization of $434 million, $455 million and $565 million, deferred income taxes of $22 million, $(101) million and $(49) million,
83
Table of Contents
unrealized (gain) loss on foreign currency exchange of $(15) million, $(23) million and $29 million, non-cash interest expense of $19 million, $21 million and $22 million, third-party fees expensed in connection with debt modifications of $2 million, $18 million and $0, changes in the fair value of Preferred Series B embedded derivative of $22 million, $11 million, and $6 million and share based compensation of $25 million, $11 million and $8 million, respectively.
Cash (used for) provided by changes in operating assets and liabilities for fiscal 2014, 2013 and 2012 were $(139) million, $58 million and $(221) million, respectively.
In fiscal 2014 changes in our operating assets and liabilities resulted in a net decrease in cash and cash equivalents and was driven by payments associated with our employee incentive programs and benefit obligations and increases in receivables. The decreases were partially offset by reductions in our inventory levels and an increase in accounts payable.
In fiscal 2013 changes in our operating assets and liabilities resulted in a net increase in cash and cash equivalents and was predominantly driven by improvements in the collection of receivables, increases in deferred revenues attributable to a number of annual prepaid maintenance contracts, the effects of non-cash business restructuring reserves net of cash payments against reserves established in prior years and a decrease in inventory levels. These increases in net cash and cash equivalents were partially offset by payments associated with our employee incentive programs and a decrease in accounts payable.
In fiscal 2012 changes in our operating assets and liabilities resulted in a net decrease in cash and cash equivalents and was predominantly driven by payments associated with our business restructuring reserves established in prior years, decreases in accounts payable and deferred revenue balances and payment of previously established employee payroll and benefit obligations, the most significant of which were payments under our pension and employee incentive plans. These decreases were partially offset by a decrease in inventory levels.
Investing Activities
Net cash provided by (used for) investing activities for fiscal 2014, 2013 and 2012 was $68 million, $(113) million and $(283) million and consisted primarily of cash used for the acquisition of businesses of $16 million, $12 million and $234 million and capital expenditures of $134 million, $110 million and $92 million and payments to develop capitalized software of $1 million, $14 million and $35 million, respectively.
During fiscal 2014, cash provided by investing activities included proceeds from the sale of the ITPS business of $101 million and the TBU business of $26 million. Also, during the fiscal 2014 the Company invested $10 million for less than a 6% equity interest in an unaffiliated privately-held company.
Cash used for the acquisition of businesses in fiscal 2012 includes $208 million of payments (net of cash acquired of $22 million) related to our acquisition of Radvision. Cash used for investing activities for fiscal 2013 was partially offset by $23 million of cash proceeds from the sales of long-lived assets. Cash used for investing activities for fiscal 2012 was partially offset by $74 million of cash proceeds from the sale of investments primarily related to marketable securities which were acquired in connection with the acquisition of Radvision and subsequently sold.
Financing Activities
Net cash (used for) provided by financing activities for fiscal 2014, 2013 and 2012 was $(60) million, $(79) million and $155 million, respectively, and primarily included proceeds from our financing agreements (net of repayments), proceeds from the issuance of preferred stock and payments for debt issuance and modification costs.
Cash used for financing activities for fiscal 2014 includes proceeds of $1,136 million from the issuance of term B-6 loans and $140 million from borrowing under the Company’s revolving credit facilities. The proceeds
84
Table of Contents
from the issuance of the term B-6 loans were used to repay $1,138 million of term B-5 loans and the proceeds from borrowings under the Company’s revolving credit facilities, together with cash on-hand of $10 million, were used to redeem $92 million of 10.125%/10.875% senior unsecured PIK toggle notes and $58 million of 9.75% senior unsecured cash-pay notes. The redemption of the $92 million of 10.125%/10.875% senior unsecured PIK toggle notes includes $9 million of paid-in-kind interest expensed in prior periods. During the quarter ended September 30, 2014, the Company repaid $10 million of the borrowings under the Company’s revolving credit facilities.
Cash provided by financing activities for fiscal 2013 includes proceeds of $589 million from the issuance of senior secured term B-5 loans and proceeds of $290 million from the issuance of 9% senior secured notes. The proceeds from the issuance of the senior secured term B-5 loans were used to repay $584 million principal amount of our senior secured term B-1 loans and the proceeds from the issuance of the 9% senior secured notes were used to repay $284 million principal amount of our term B-5 loans. Additionally, during fiscal 2013, the Company completed a non-cash exchange in which $642 million of the 9.75% senior unsecured cash-pay notes and $742 million of the 10.125%/10.875% senior unsecured PIK toggle notes were exchanged for $1,384 million of 10.50% senior secured notes. Cash used for financing activities for fiscal 2013 also includes cash paid for debt issuance and modification costs of $49 million.
In fiscal 2012 net cash provided by financing activities included proceeds of $196 million from the issuance of 48,921 shares of Series B Convertible Preferred Stock with detachable warrants to purchase 24.5 million shares of common stock and $60 million borrowed by the Company under its senior secured asset-based credit facility both of which were used to finance, in part, the acquisition of Radvision. Following the completion of the acquisition, all amounts borrowed under the senior secured asset-based credit facility were repaid in full.
Net cash provided by financing activities was partially offset by the scheduled repayments of our long-term debt of $38 million, $38 million and $37 million in fiscal 2014, 2013 and 2012, respectively.
Contractual Obligations and Sources of Liquidity
Contractual Obligations
The following table summarizes our contractual obligations as of September 30, 2014:
| Payments due by period | ||||||||||||||||||||
| In millions |
Total | Less than 1 year |
1-3 years |
3-5 years |
More than 5 years |
|||||||||||||||
| Capital lease obligations(1) |
$ | 59 | $ | 15 | $ | 30 | $ | 14 | $ | — | ||||||||||
| Operating lease obligations(2) |
419 | 93 | 142 | 101 | 83 | |||||||||||||||
| Purchase obligations with contract manufacturers and suppliers(3) |
44 | 44 | — | — | — | |||||||||||||||
| Other purchase obligations(4) |
557 | 150 | 232 | 175 | — | |||||||||||||||
| Variable rate senior secured multi-currency asset-based revolving credit facility(5) |
40 | — | 40 | — | — | |||||||||||||||
| Variable rate senior secured multi-currency revolver(5) |
90 | — | 90 | — | — | |||||||||||||||
| Variable rate senior secured term B-3 loans due October 26, 2017(6) |
2,102 | 25 | 50 | 2,027 | — | |||||||||||||||
| Variable rate senior secured term B-4 loans due October 26, 2017(6) |
1 | — | — | 1 | — | |||||||||||||||
| Variable rate senior secured term B-6 loans due March 31, 2018(6) |
1,128 | 13 | 27 | 1,088 | — | |||||||||||||||
| 7% senior secured notes due April 1, 2019(5) |
1,009 | — | — | 1,009 | — | |||||||||||||||
| 9% senior secured notes due April 1, 2019(5) |
290 | — | — | 290 | — | |||||||||||||||
| 10.50% senior secured notes due March 1, 2011(5) |
1,384 | — | — | — | 1,384 | |||||||||||||||
| Interest payments due on long-term debt(7) |
2,084 | 419 | 899 | 548 | 218 | |||||||||||||||
| Pension benefit obligations(8) |
165 | 165 | — | — | — | |||||||||||||||
|
|
|
|
|
|
|
|
|
|
|
|||||||||||
| Total |
$ | 9,372 | $ | 924 | $ | 1,510 | $ | 5,253 | $ | 1,685 | ||||||||||
|
|
|
|
|
|
|
|
|
|
|
|||||||||||
| (1) | The payments due for capital lease obligations do not include $8 million in future payments for interest. |
85
Table of Contents
| (2) | Contractual obligations for operating leases include $81 million of future minimum lease payments that have been accrued for in accordance with GAAP pertaining to restructuring and exit activities. |
| (3) | We purchase components from a variety of suppliers and use several contract manufacturers to provide manufacturing services for our products. During the normal course of business, in order to manage manufacturing lead times and to help assure adequate component supply, we enter into agreements with contract manufacturers and suppliers that allow them to produce and procure inventory based upon forecasted requirements provided by us. If we do not meet these specified purchase commitments, we could be required to purchase the inventory. See Note 21, “Commitments and Contingencies,” to our audited Consolidated Financial Statements included elsewhere in this prospectus for further details on our purchase commitments. |
| (4) | Other purchase obligations represent an estimate of contractual obligations in the ordinary course of business, other than commitments with contract manufacturers and suppliers, for which we have not received the goods or services as of September 30, 2014. Although contractual obligations are considered enforceable and legally binding, the terms generally allow us the option to cancel, reschedule and adjust our requirements based on our business needs prior to the delivery of goods or performance of services. Other purchase obligations also includes estimated payments under the multi-year contract entered into with HP pursuant to which Avaya will outsource to HP Enterprise Services, LLC (“HP”) certain delivery services associated with the Avaya Private Cloud Business including current specified customer contracts. |
| (5) | The contractual obligations for our notes represent principal payments only. |
| (6) | The contractual obligations for the senior secured credit facility represent the minimum principal payments owed per year. The contractual cash obligations do not reflect any contingent mandatory annual principal repayments that may be required to be made upon us achieving certain excess cash flow targets, as defined in our senior secured credit facility. |
| (7) | The contractual obligations for interest payments represent the related interest payments on long-term debt. The interest payments for the senior secured term B-3 loans, senior secured term B-4 loans, and senior secured term B-6 loans were calculated by applying an applicable margin to a projected LIBOR rate. The interest payments for the notes were calculated using the stated interest rate. |
| (8) | The Company sponsors non-contributory defined pension and postretirement plans covering certain employees and retirees. The Company’s general funding policy with respect to qualified pension plans is to contribute amounts at least sufficient to satisfy the minimum amount required by applicable law and regulations, or to directly pay benefits where appropriate. Most postretirement medical benefits are not pre-funded. Consequently, the Company makes payments as these retiree medical benefits are disbursed. At this time, the Company is unable to make a reasonably reliable estimate beyond fiscal 2015 of the timing of payments in connection with these liabilities. |
As of September 30, 2014, the Company’s unrecognized tax benefits, or UTBs, associated with uncertain tax positions were $257 million and interest and penalties related to these amounts were an additional $22 million. In addition to these amounts is $3 million related to audits by state and local and foreign taxing authorities for the periods prior to the Company’s separation from Lucent Technologies Inc. (now Alcatel-Lucent) pursuant to the Tax Sharing Agreement between the Company and Lucent. At this time, the Company is unable to make a reasonably reliable estimate of the timing of payments in connection with these tax liabilities and its Tax Sharing Agreement with Lucent; therefore, such amounts are not included in the above contractual obligation table.
Our primary future cash requirements will be to fund benefit obligations, debt service, capital expenditures, and restructuring payments. In addition, we may use cash in the future to make strategic acquisitions.
Specifically, we expect our primary cash requirements for fiscal 2015 to be as follows:
| • | Debt service—We expect to make payments of approximately $460 million during fiscal 2015 in principal and interest associated with long-term debt and interest associated with our two revolving credit facilities, although we may elect to make additional principal payments under certain circumstances. The expected payments are exclusive of repayments we have made or may make under |
86
Table of Contents
| our revolving credit facilities. In the ordinary course of business, we may from time to time borrow and repay amounts under our revolving credit facilities to meet business needs. |
| • | Restructuring payments—We expect to make payments of approximately $95 million to $110 million during fiscal 2015 for employee separation costs and lease termination obligations associated with restructuring actions we have taken through September 30, 2014 and additional actions we may take in fiscal 2015 as the Company continues to evaluate opportunities to streamline its operations and identify additional cost savings globally. |
| • | Capital expenditures—We expect to spend approximately $120 million to $135 million for capital expenditures during fiscal 2015. |
| • | Benefit obligations—We expect to make payments under our pension and postretirement obligations of $168 million during fiscal 2015. These payments include: $92 million to satisfy the minimum statutory funding requirements of our U.S. qualified pension plans, $7 million of payments under our U.S. benefit plans that are not pre-funded, $29 million under our non-U.S. benefit plans that are predominately not pre-funded and $40 million under our U.S. retiree medical benefit plan that is not pre-funded. See discussion in Note 14, “Benefit Obligations,” to our audited Consolidated Financial Statements included elsewhere in this prospectus for further details of our benefit obligations. |
We and our subsidiaries, affiliates and significant shareholders may from time to time seek to retire or purchase our outstanding debt (including publicly issued debt) through cash purchases and/or exchanges, in open market purchases, privately negotiated transactions, by tender offer or otherwise. Such repurchases or exchanges, if any, will depend on prevailing market conditions, liquidity requirements, contractual restrictions and other factors. The amounts involved may be material.
Future Sources of Liquidity
We expect our existing cash balance, cash generated by operations and borrowings available under our credit facilities to be our primary sources of short-term liquidity. We expect that revenues from higher margin products and services and continued focus on accounts receivable, inventory management and cost containment will enable us to generate positive net cash from operating activities. Further, we continue to focus on cost reductions and have initiated restructuring plans during fiscal 2014 designed to reduce overhead and provide cash savings.
The Company currently has two revolving credit facilities providing for borrowings of up to an aggregate of $535 million subject to certain contractual limitations. Our senior secured multi-currency asset-based revolving credit facility provides senior secured revolving financing of up to $335 million, subject to availability under a borrowing base which, at any time, equals the sum of 85% of eligible accounts receivable plus 85% of the net orderly liquidation value of eligible inventory, subject to certain reserves and other adjustments. In addition, although the senior secured multi-currency asset-based revolving credit facility does not require us to comply with any financial ratio maintenance covenants, if we have Excess Availability under the facility of less than $33.5 million at any time, we will not be permitted to borrow any additional amounts thereunder unless our pro forma Consolidated Fixed Charge Coverage Ratio (each such term as defined in the credit agreement governing the facility) is at least 1.0 to 1.0. At September 30, 2014, the Company had $40 million of outstanding borrowings, $79 million of issued and outstanding letters of credit and remaining availability of $207 million under the multi-currency asset-based revolving credit facility. We also have a senior secured multi-currency revolver, which allows for borrowings of up to $200 million. At September 30, 2014, the Company had $90 million of issued and outstanding borrowings and $110 million available under the senior secured multi-currency revolver. Both revolving credit facilities include other customary conditions that, if not complied with, could restrict our availability to borrow.
On August 20, 2014, we signed an agreement with HP pursuant to which the Company will outsource to HP certain delivery services associated with the Avaya Private Cloud Services business. In connection with that agreement, HP acquired specified assets owned by the Company. HP also agreed to make available one or more
87
Table of Contents
additional financings to Avaya and its subsidiaries of up to $24 million per year for the sole purpose of financing the use of equipment for the performance of services under the agreement, provided that no material adverse change with respect to the Company has occurred and is continuing as of the date any such financing is requested.
During the fourth quarter of fiscal 2012, the Company changed its indefinite reinvestment of undistributed foreign earnings assertion with respect to its non-U.S. subsidiaries. This change in assertion reflects the Company’s intention and ability to maintain flexibility with respect to sourcing of funds from non-U.S. locations. As of September 30, 2014, our cash and cash equivalent balances held outside the U.S. were $178 million. As of September 30, 2014, balances of cash and cash equivalents held outside the U.S. that are in excess of in-country needs and which could not be distributed to the U.S. without restriction were not material.
The Company is planning to make an initial public offering of its common stock as contemplated in this prospectus. We intend to use the proceeds of this offering to repay certain of our existing indebtedness.
If we do not generate sufficient cash from operations, face unanticipated cash needs such as the need to fund significant strategic acquisitions or do not otherwise have sufficient cash and cash equivalents, we may need to incur additional debt or issue additional equity. In order to meet our cash needs we may, from time to time, borrow under our credit facilities or issue long-term or short-term debt or equity, if the market and our credit facilities and the indentures governing our notes permit us to do so. Furthermore, if we acquire a business in the future that has existing debt, our debt service requirements may increase. We regularly evaluate market conditions, our liquidity profile, and various financing alternatives for opportunities to enhance our capital structure. If market conditions are favorable, we may refinance our existing debt or issue additional securities.
Based on past performance and current expectations, we believe that our existing cash and cash equivalents of $322 million as of September 30, 2014 and future cash provided by operating activities will be sufficient to meet our future cash requirements described above for at least the next twelve months. Our ability to meet these requirements will depend on our ability to generate cash in the future, which is subject to general economic, financial, competitive, legislative, regulatory and other factors that are beyond our control. As of September 30, 2014, our cash and cash equivalent balances held outside the U.S. were $178 million. As of September 30, 2014, balances of cash and cash equivalents held outside the U.S. that are in excess of in-country needs and cannot be distributed to the U.S. without restriction were not material.
Uncertainties Regarding Our Liquidity
We believe the following uncertainties exist regarding our liquidity:
| • | Revenues—Our ability to generate net cash from operating activities has been a primary source of our liquidity. If our revenues and gross profits were to decline significantly during an economic downturn and challenging market conditions, particularly in the U.S. and Europe, our ability to generate net cash from operating activities in a sufficient amount to meet our cash needs could be adversely affected. Furthermore, our net cash provided by operating activities may be insufficient if we face unanticipated cash needs such as the funding of a future acquisition or other capital investment |
| • | Cost Saving Initiatives—Our ability to reduce costs through cost saving initiatives will have a direct effect on our cash flows and available cash balances, as certain restructuring charges are recorded in the current year but are paid in future periods. Further, although we may identify additional cost saving initiatives in the future, we may be unsuccessful in these actions or the amount required for severance payments may be so prohibitive as to preclude the implementation of such cost savings initiatives, which could negatively impact our future cash flows. |
| • | Future Acquisitions—We may from time to time in the future make acquisitions. Such acquisitions may require significant amounts of cash or may result in increased debt service requirements to the extent we assume or incur debt in connection with such acquisitions. |
88
Table of Contents
| • | Litigation—In the ordinary course of business, the Company is involved in litigation, claims, government inquiries, investigations, charges and proceedings. See Note 21, “Commitments and Contingencies,” to our audited Consolidated Financial Statements located elsewhere in this prospectus. Our ability to successfully defend the Company against pending and future litigation may impact cash flows. |
On October 23, 2014, in connection with a litigation matter, the Company filed a supersedeas bond with the Court in the amount of $63 million to stay execution of a judgment against it while the matter is on appeal. The Company secured posting of the bond through the issuance of a letter of credit under its existing credit facilities. In connection with this proceeding, an application was also filed seeking approximately $60 million for attorneys’ fees, expenses and costs from the Company which the Company intends to contest. Once required, and in order to stay the enforcement of any award for attorney’s fees, expenses and costs, on appeal or otherwise, the Company will post a bond in the amount of the award for attorney’s fees, expenses and costs, plus interest. The Company expects to secure posting of the bond through existing resources and may use any or a combination of the issuance of one or more letters of credit under its existing credit facilities and cash on hand. See Note 21, “Commitments and Contingencies,” to our audited Consolidated Financial Statements included elsewhere in this prospectus for additional details regarding this litigation matter.
Debt Service Obligations
As a result of the Merger and the acquisition of NES, our level of indebtedness increased. As of September 30, 2014, principal payments due under our indebtedness were $6,044 million, excluding capital lease obligations of $59 million, net of imputed interest. Our interest expense for fiscal 2014, 2013, and 2012 was $459 million, $467 million and $432 million, and included $19 million, $21 million and $22 million of non-cash interest expense, respectively.
Our leverage requires that a substantial portion of our cash flows from operations be dedicated to the payment of principal and interest on our indebtedness.
We continually monitor our exposure to the risk of increased interest rates as portions of our borrowings under our credit facilities are at variable rates of interest. We use interest rate swap agreements to manage the amount of our floating rate debt to the extent we deem appropriate. At September 30, 2014 there were no outstanding swap agreements.
Deferred Tax Assets
Our deferred tax assets are primarily a result of deductible temporary differences related to net operating loss (“NOL”) carryforwards, benefit obligations, tax credit carryforwards, and other accruals which are available to reduce taxable income in future periods. As of September 30, 2014, the Company had tax-effected NOL carryforwards of $1,143 million, comprised of $595 million for U.S. federal, state and local taxes and $548 million for foreign taxes including $215 million and $287 million in Germany and Luxembourg, respectively. U.S. federal and state NOL carryforwards expire through the year 2023, with the majority expiring in excess of 8 years. The majority of foreign NOL carryforwards have no expiration. Additionally, the Company has various other tax credit carryforwards totaling $78 million. Of this total, $54 million expire within 5 to 15 years and the remaining have no expiration.
The Internal Revenue Code contains certain provisions which may limit the use of U.S. federal net operating losses and U.S. federal tax credits upon a change in ownership (determined under very broad and complex direct and indirect ownership rules) in the Company within a three-year testing period. As a result of the Merger in October 2007, a significant change in the ownership of the Company occurred that limits, on an annual basis, the Company’s ability to utilize its pre-Merger U.S. federal NOLs and U.S. federal tax credits. The Company’s NOLs and tax credits will continue to be available to offset taxable income and tax liabilities (until such NOLs and tax credits are either used or expire) subject to the annual limitation. If the annual limitation amount is not fully utilized in a particular tax year, then the unused portion from that particular tax year will be added to the
89
Table of Contents
annual limitation in subsequent years. We do not believe that the share issuance as contemplated in this prospectus itself, or when aggregated with other prior shareholder ownership changes during the applicable testing period, cause an ownership change that would further limit, on an annual basis, our ability to utilize our current U.S. federal net operating losses and U.S. federal tax credits. Under German tax law any change in ownership in excess of 25% would limit the amount of NOL carryforward available for use in future periods. Depending on market conditions, share issuance related to a proposed initial public offering may result in an ownership change under German law that would limit our ability to utilize our current German NOL carryforward.
A valuation allowance is recorded to reduce the carrying amounts of deferred tax assets if it is more likely than not that some or all of its deferred tax assets will not be realized. At September 30, 2014, the Company’s valuation allowance is $1,639 million, of which $1,068 million, $296 million, $224 million and $51 million relates to U.S., Germany, Luxembourg, and other foreign entities, respectively. Primarily as a result of significant book taxable losses incurred subsequent to the Merger, the Company’s deferred tax assets exceed its deferred tax liabilities, exclusive of the U.S. deferred tax liabilities associated with indefinite-lived intangible assets. The Company is in a three-year cumulative book taxable loss position in the U.S. and other significant tax jurisdictions and expects to continue to incur significant interest expense related to its debt and amortization and depreciation expense associated with the Merger and acquisition of NES. The Company considered the scheduled reversal of deferred tax assets and liabilities, projected future taxable income, and certain tax planning strategies in assessing the realization of its deferred tax assets. Based on this assessment, the Company determined that it is more likely than not that the deferred tax assets in certain significant jurisdictions, including the U.S., Canada, Ireland, Germany, Luxembourg, Spain and France, will not be realized to the extent they exceed the scheduled reversal of deferred tax liabilities. The recognition of valuation allowances will adversely affect the Company’s effective income tax rate.
Credit Facilities
Avaya Inc. entered into borrowing arrangements and further amended the arrangements with several financial institutions in connection with the Merger on October 26, 2007 and the acquisition of the enterprise solutions business of Nortel Networks Corporation in December 2009.
In connection with the acquisition of Radvision, Avaya Inc. borrowed $60 million under its senior secured asset-based credit facility. Following the completion of the acquisition, all amounts borrowed were repaid in full.
During the three months ended December 31, 2012, Avaya Inc. completed three transactions which allowed Avaya Inc. to refinance $848 million of term loans under its senior secured credit facilities that originally matured October 26, 2014. These transactions were (1) an amendment and restatement of the senior secured credit facility and the senior secured multi-currency asset-based revolving credit facility on October 29, 2012 along with the extension of the maturity date of $135 million aggregate principal amount of senior secured term B-1 loans, or “term B-1 loans”, (2) an amendment and restatement of the senior secured credit facility on December 21, 2012 along with the extension of the maturity date of $713 million aggregate principal amount of term B-1 loans and $134 million aggregate principal amount of senior secured term B-4 loans, and (3) the issuance on December 21, 2012 of $290 million of 9% senior secured notes due April 2019.
During the three months ended March 31, 2013, Avaya Inc. refinanced the remaining $584 million of term B-1 loans outstanding under its senior secured credit facility with the cash proceeds of $589 million aggregate principal amount of term B-5 loans under the senior secured credit facility.
Additionally, during the three months ended March 31, 2013, Avaya Inc. refinanced $1,384 million of senior unsecured notes, through (1) amendments to the senior secured credit facility and the senior secured multi-currency asset-based revolving credit facility permitting the refinancing of the 9.75% senior unsecured cash-pay notes due 2015 and 10.125%/10.875% senior unsecured PIK toggle notes due 2015 (collectively, the “Cash Pay and PIK Toggle
90
Table of Contents
Notes”) with indebtedness secured by a lien on certain collateral on a junior-priority basis and (2) the exchange of $1,384 million of Cash Pay and PIK Toggle for $1,384 million of 10.50% senior secured notes due 2021.
On February 5, 2014, Avaya Inc., Citibank, N.A., as Administrative Agent, and the lenders party thereto entered into Amendment No. 8 to Credit Agreement, pursuant to which the senior secured credit facility was amended.
Pursuant to Amendment No. 8 to Credit Agreement, Avaya Inc. refinanced in full all term B-5 loans outstanding under the senior secured credit facility with the cash proceeds from Avaya Inc.’s borrowing of approximately $1,138 million aggregate principal amount of term B-6 loans under the senior secured credit facility. In addition, Avaya Inc. paid $15 million in cash for certain fees and expenses incurred in connection with the refinancing. The new term B-6 loans mature on March 31, 2018, which was the same date on which the term B-5 loans were scheduled to mature.
The new tranche of term B-6 loans bears interest at a rate per annum equal to either a base rate (subject to a floor of 2.00%) or a LIBOR rate (subject to a floor of 1.00%), in each case plus an applicable margin. Subject to the floor described in the immediately preceding sentence, the base rate is determined by reference to the higher of (1) the prime rate of Citibank, N.A. and (2) the federal funds effective rate plus one half of 1%. The applicable margin for borrowings of term B-6 loans is 4.50% per annum with respect to base rate borrowings and 5.50% per annum with respect to LIBOR borrowings, in each case, subject to increase pursuant to the senior secured credit facility in connection with the making of certain refinancing, extended or replacement term loans under the senior secured credit facility with an Effective Yield (as defined in the senior secured credit facility) greater than the applicable Effective Yield payable in respect of the term B-6 loans at such time plus 50 basis points.
On May 15, 2014, Avaya Inc. redeemed 100% of the aggregate principal amount of its 10.125%/10.875% senior unsecured PIK toggle notes due 2015 and 9.75% senior unsecured cash-pay notes due 2015 at a redemption price of 100% of the principal amount thereof, plus accrued and unpaid interest, or $92 million and $58 million, respectively. The redemption price of $150 million was funded through cash on-hand of $10 million, borrowings of $100 million under the multi-currency revolver available under the senior secured credit facility, and $40 million under the senior secured asset-based credit facility.
During the quarter ended September 30, 2014, the Company repaid $10 million of the borrowings under the Company’s revolving credit facilities. Subsequent to September 30, 2014, the Company repaid an additional $30 million under the multi-currency revolver.
Borrowings under the senior secured multi-currency revolver bear interest at a rate per annum equal to a LIBOR rate plus an applicable margin.
Borrowings under the senior secured asset-based asset based credit facility bear interest at a rate per annum equal to, at Avaya Inc.’s option, either (a) a LIBOR rate plus a margin of 1.75% or (b) a base rate plus a margin of 0.75%. The interest rate election made on the May 15, 2014 borrowing was the LIBOR rate.
As of September 30, 2014, term loans outstanding include term B-3 loans, term B-4 loans and term B-6 loans with remaining face values (after all principal payments through September 30, 2014) of $90 million, $2,102 million and $1,128 million respectively. The Company regularly evaluates market conditions, its liquidity profile, and various financing alternatives for opportunities to enhance its capital structure. If opportunities are favorable, Avaya Inc. may refinance existing debt or issue additional debt securities.
Avaya Inc. regularly evaluates market conditions, its liquidity profile, and various financing alternatives for opportunities to enhance its capital structure. If opportunities are favorable, Avaya Inc. may refinance existing debt or issue additional debt securities.
We are not in default under the senior secured credit facility, the indentures governing Avaya Inc.’s notes or Avaya Inc.’s senior secured multi-currency asset-based revolving credit facility. See Note 10, “Financing Arrangements” to our audited Consolidated Financial Statements for further details.
91
Table of Contents
Guarantees of Indebtedness and Other Off-Balance Sheet Arrangements
We are party to several types of agreements, including surety bonds, purchase commitments, product financing arrangements and performance guarantees, which are fully discussed in Note 21, “Commitments and Contingencies,” to our audited Consolidated Financial Statements, respectively.
Legal Proceedings and Environmental, Health and Safety Matters
We are subject to certain legal proceedings, which are fully discussed in Note 21, “Commitments and Contingencies” to our audited Consolidated Financial Statements, respectively.
Use of Estimates and Critical Accounting Policies
Our Consolidated Financial Statements are based on the selection and application of accounting principles generally accepted in the United States of America, which require us to make estimates and assumptions about future events that affect the amounts reported in our financial statements and the accompanying notes. Future events and their effects cannot be determined with absolute certainty. Therefore, the determination of estimates requires the exercise of judgment. Actual results could differ from those estimates, and any such differences may be material to the financial statements. We believe that the following policies may involve a higher degree of judgment and complexity in their application and represent the critical accounting policies used in the preparation of our financial statements. If different assumptions or conditions were to prevail, the results could be materially different from our reported results.
Acquisition Accounting
The Company accounts for business combinations using the acquisition method, which requires an allocation of the purchase price of an acquired entity to the assets acquired and liabilities assumed based on their estimated fair values at the date of acquisition. Goodwill represents the excess of the purchase price over the net tangible and intangible assets acquired.
Revenue Recognition
The Company derives revenue primarily from the sale of products, software, and services for communications systems and applications. The Company’s products are sold directly through its worldwide sales force and indirectly through its global network of distributors, service providers, dealers, value-added resellers, systems integrators and business partners. Services includes (i) supplemental maintenance service, including services provided under contracts to monitor and optimize customers’ communications network performance; (ii) professional services for implementation and integration of converged voice and data networks, network security and unified communications; and (iii) Cloud and managed services. Maintenance contracts have terms that range from one to five years. Contracts for professional services typically have terms that range from four to six weeks for standard products and from six months to one year for customized products. Contracts for Cloud and managed services have terms that range from one to seven years.
In accordance with GAAP, revenue is recognized when persuasive evidence of an arrangement exists, delivery has occurred, the fee is fixed or determinable, and collectability is reasonably assured. For arrangements that require acceptance of the product, system, or solution as specified by the customer, revenue is deferred until the acceptance criteria have been met.
The Company’s indirect sales to channel partners are generally recognized at the time of shipment if all contractual obligations have been satisfied. The Company accrues a provision for estimated sales returns and other allowances, including promotional marketing programs and other incentives as a reduction of revenue at time of sale. When estimating returns, the Company considers customary inventory levels held by third-party distributors.
92
Table of Contents
The Company enters into multiple deliverable arrangements, which may include various combinations of products, software and services. Most product and service deliverables qualify as separate units of accounting and can be sold on a standalone basis. A deliverable constitutes a separate unit of accounting when it has standalone value and, where return rights exist, delivery or performance of the undelivered items is considered probable and substantially within the Company’s control. When the Company sells products with implementation services, they are generally combined as one or more units of accounting, depending on the nature of the services and the customer’s acceptance requirements.
Most of the Company’s products have both software and non-software components that function together to deliver the products’ essential functionality. For these multiple deliverable arrangements, the Company allocates revenue to the deliverables based on their relative selling prices. To the extent that a deliverable is subject to specific guidance on whether and/or how to allocate the consideration in a multiple deliverable arrangement, that deliverable is accounted for in accordance with such specific guidance. The Company limits the amount of revenue recognition for delivered items to the amount that is not contingent on the future delivery of products or services or meeting other future performance obligations.
The Company allocates revenue based on a selling price hierarchy of vendor-specific objective evidence, third-party evidence, and then estimated selling price. Vendor-specific objective evidence is based on the price charged when the deliverable is sold separately. Third-party evidence is based on largely interchangeable competitor products or services in standalone sales to similarly situated customers. As the Company is unable to reliably determine what competitors products’ selling prices are on a standalone basis, the Company is not typically able to determine third-party evidence. Estimated selling price is based on the Company’s best estimates of what the selling prices of deliverables would be if they were sold regularly on a standalone basis. Estimated selling price is established considering multiple factors including, but not limited to, pricing practices in different geographies and through different sales channels, major product and services groups, and customer classifications.
Once the Company allocates revenue to each deliverable, the Company recognizes revenue in accordance with its policies when all revenue recognition criteria are met. Product revenue is generally recognized upon delivery and maintenance revenue is generally recognized ratably over the period during which the services are performed, whereas revenue from managed services is generally recognized based on usage, subject to contractual minimums. However, revenue for professional services arrangements is generally recognized upon completion of performance and revenue for arrangements that require acceptance of the product, system, or solution, is recognized when the acceptance criteria have been met.
Standalone or subsequent sales of software or software-related items are recognized in accordance with the software revenue recognition guidance. For multiple deliverable arrangements that only include software items, the Company generally uses the residual method to allocate the arrangement consideration. Under the residual method, the amount of consideration allocated to the delivered items equals the total arrangement consideration, less the fair value of the undelivered items. Where vendor-specific objective evidence of fair value for the undelivered items cannot be determined, the Company defers revenue until all items are delivered and services have been performed, or until such evidence of fair value can be determined for the undelivered items.
Income Taxes
Income taxes are accounted for under the asset and liability method. Under this method, deferred tax assets and liabilities are recognized for the estimated future tax consequences attributable to differences between the financial statement carrying amounts of existing assets and liabilities and their respective tax bases, and operating loss and tax credit carryforwards. Deferred tax assets and liabilities are measured using enacted tax rates in effect for the year in which those temporary differences are expected to be recovered or settled. The effect on deferred tax assets and liabilities of a change in tax rates is recognized in the Consolidated Statements of Operations in the period that includes the enactment date. A valuation allowance is recorded to reduce the carrying amounts of deferred tax assets if it is more likely than not that such assets will not be realized. Additionally, the accounting for income taxes requires the Company to evaluate and make an assertion as to whether undistributed foreign
93
Table of Contents
earnings will be indefinitely reinvested or repatriated. “(Financial Accounting Standards Board), or FASB, Accounting Standards Codification, or (ASC), subtopic 740-10, “Income Taxes—Overall” (“ASC 740-10”) prescribes a comprehensive model for the financial statement recognition, measurement, classification, and disclosure of uncertain tax positions. ASC 740-10 contains a two-step approach to recognizing and measuring uncertain tax positions. The first step is to evaluate the tax position for recognition by determining if the weight of available evidence indicates that it is more likely than not that the position will be sustained on audit, based on the technical merits of the position. The second step is to measure the tax benefit as the largest amount that is more than 50% likely of being realized upon settlement.
Significant judgment is required in evaluating uncertain tax positions and determining our provision for income taxes. Although the Company believes its reserves are reasonable, no assurance can be given that the final tax outcome of these matters will not be different from that which is reflected in our historical income tax provision and accruals. The Company adjusts these reserves in light of changing facts and circumstances.
Intangible and Long-lived Assets
Intangible assets include technology, customer relationships, trademarks and trade-names and other intangibles. Intangible assets with finite lives are amortized using the straight-line method over the estimated economic lives of the assets, which range from two to fifteen years. Long-lived assets, including intangible assets with finite lives, are reviewed for impairment whenever events or changes in circumstances indicate that the carrying amount of such assets may not be recoverable in accordance with FASB ASC Topic 360, “Property, Plant, and Equipment.” Determination of recoverability is based on an estimate of undiscounted future cash flows resulting from the use of the asset and its eventual disposition. Measurement of an impairment loss for long-lived assets that management expects to hold and use is based on the estimated fair value of the asset. Long-lived assets to be disposed of are reported at the lower of carrying amount or estimated fair value less costs to sell. Intangible assets determined to have indefinite useful lives are not amortized but are tested for impairment annually each July 1st, and more frequently if events occur or circumstances change that indicate an asset may be impaired. The estimated useful lives of intangible and long-lived assets are based on many factors including assumptions regarding the effects of obsolescence, demand, competition and other economic factors, expectations regarding the future use of the asset, and our historical experience with similar assets. The assumptions used to determine the estimated useful lives could change due to numerous factors including product demand, market conditions, technological developments, economic conditions and competition.
Goodwill
Goodwill is not amortized but is subject to periodic testing for impairment in accordance with FASB ASC Topic 350, “Intangibles–Goodwill and Other” (“ASC 350”) at the reporting unit level which is one level below the Company’s operating segments. The assessment of goodwill impairment is conducted by estimating and comparing the fair value of the Company’s reporting units’ net assets, as defined in ASC 350, to their carrying value as of that date. The fair value is estimated using an income approach whereby the fair value of the reporting unit is based on the future cash flows that each reporting unit’s assets can be expected to generate. Future cash flows are based on forward-looking information regarding market share and costs for each reporting unit and are discounted using an appropriate discount rate. Future discounted cash flows can be affected by changes in industry or market conditions or the rate and extent to which anticipated synergies or cost savings are realized with newly acquired entities. The test for impairment is conducted annually each July 1st, and more frequently if events occur or circumstances change that would more likely than not reduce the fair value of a reporting unit below its carrying amount.
At July 1, 2014 the Company performed its annual goodwill impairment test and determined that the respective book values of the Company’s reporting units did not exceed their estimated fair values and that it was not necessary to record impairment charges. In order to evaluate the sensitivity of the fair value calculations on the goodwill impairment test the Company applied a hypothetical 10% decrease to the fair value of each reporting unit. This hypothetical 10% decrease in the fair value of each reporting unit at July 1, 2014 would not result in an impairment of goodwill for any reporting unit.
94
Table of Contents
Restructuring Programs
The Company accounts for exit or disposal of activities in accordance with FASB ASC Topic 420, “Exit or Disposal Cost Obligations” (“ASC 420”). In accordance with ASC 420, a business restructuring is defined as an exit or disposal activity that includes but is not limited to a program that is planned and controlled by management and materially changes either the scope of a business or the manner in which that business is conducted. Business restructuring charges includes (i) one-time termination benefits related to employee separations, (ii) contract termination costs and (iii) other costs associated with exit or disposal activities including, but not limited to, costs for consolidating or closing facilities and relocating employees.
A liability is recognized and measured at its fair value for one-time termination benefits once the plan of termination is communicated to affected employees and it meets all of the following criteria: (i) management commits to a plan of termination, (ii) the plan identifies the number of employees to be terminated and their job classifications or functions, locations and the expected completion date, (iii) the plan establishes the terms of the benefit arrangement and (iv) it is unlikely that significant changes to the plan will be made or the plan will be withdrawn. Contract termination costs include costs to terminate a contract or costs that will continue to be incurred under the contract without benefit to the Company. A liability is recognized and measured at its fair value when the Company either terminates the contract or ceases using the rights conveyed by the contract. A liability is recognized and measured at its fair value for other associated costs in the period in which the liability is incurred.
In connection with the Merger, the Company adopted a plan to exit certain activities of the newly acquired company. A liability was recognized as of the consummation date of the acquisition for the costs under the exit plan in accordance with the authoritative guidance at that time if these costs were not associated with or were not incurred to generate revenues of the combined entity after the consummation date and either (i) had no future economic benefit to the combined company, were incremental to other costs incurred by either the acquired company or the acquiring company in the conduct of activities prior to the consummation date, and were expected to be incurred as a direct result of the plan to exit an activity of the acquired company or (ii) the cost represented an amount to be incurred by the combined company under a contractual obligation of the acquired company that existed prior to the consummation date and will either continue after the plan is completed with no economic benefit to the combined company or be a penalty incurred by the combined company to cancel that contractual obligation.
Pension and Postretirement Benefit Obligations
The Company sponsors non-contributory defined benefit pension plans covering a portion of its U.S. employees and retirees, and postretirement benefit plans covering a portion of its U.S. retirees that include healthcare benefits and life insurance coverage. Certain non-U.S. operations have various retirement benefit programs covering substantially all of their employees. Some of these programs are considered to be defined benefit pension plans for accounting purposes.
The Company’s pension and postretirement benefit costs are developed from actuarial valuations. Inherent in these valuations are key assumptions, including the discount rate and expected long-term rate of return on plan assets. Material changes in pension and postretirement benefit costs may occur in the future due to changes in these assumptions, changes in the number of plan participants, changes in the level of benefits provided, changes in asset levels and changes in legislation.
The discount rate is subject to change each year, consistent with changes in rates of return on high-quality fixed-income investments currently available and expected to be available during the expected benefit payment period. The Company selects the assumed discount rate for its U.S. pension and postretirement plans by applying the rates from the AonHewitt AA Only and AonHewitt AA Only Above Median yield curves to the expected benefit payment streams and develops a rate at which it is believed the benefit obligations could be effectively settled. The Company follows a similar process for its non-U.S. pension plans by applying the AonHewitt Euro
95
Table of Contents
AA corporate bond yield curve. Based on the published rates as of September 30, 2014, the Company used a weighted average discount rate of 4.21% for the U.S. pension plans, 2.63% for the non-U.S. pension plans, and 4.17% for the postretirement plans. For the U.S. pension plans, non-U.S. pension plans, and the postretirement plans, every one-percentage-point increase or decrease in the discount rate reduces or increases our benefit obligation by approximately $390 million, $87 million and $55 million, respectively.
The market-related value of the Company’s plan assets as of the measurement date is developed using a 5-year smoothing technique. First, a preliminary market-related value is calculated by adjusting the market-related value at the beginning of the year for payments to and from plan assets and the expected return on assets during the year.
The expected return on assets represents the expected long-term rate of return on plan assets adjusted up to plus or minus 2% based on the actual 10-year average rate of return on plan assets. A final market-related value is determined as the preliminary market-related value, plus 20% of the difference between the actual return and expected return for each of the past five years.
These pension and other postretirement benefits are accounted for in accordance with FASB ASC Topic 715, “Compensation—Retirement Benefits” (“ASC 715”). ASC 715 requires that plan assets and obligations be measured as of the reporting date and the over-funded, under-funded or unfunded status of plans be recognized as of the reporting date as an asset or liability in the Consolidated Balance Sheets. In addition, ASC 715 requires costs and related obligations and assets arising from pensions and other postretirement benefit plans to be accounted for based on actuarially-determined estimates.
The plans use different factors, including years of service, eligible compensation and age, to determine the benefit amount for eligible participants. The Company funds its U.S. pension plans in compliance with applicable laws. See Note 14, “Benefit Obligations,” to our audited Consolidated Financial Statements included elsewhere in this prospectus for a discussion of the Company’s pension and postretirement plans.
Commitments and Contingencies
In the ordinary course of business we are subject to legal proceedings related to environmental, product, employment, intellectual property, licensing and other matters. In addition, we are subject to indemnification and liability sharing claims by Lucent Technologies Inc. (now Alcatel-Lucent) under the terms of the Contribution and Distribution Agreement. In order to determine the amount of reserves required, we assess the likelihood of any adverse judgments or outcomes to these matters as well as potential ranges of probable losses. A determination of the amount of reserves required for these contingencies is made after analysis of each individual issue. The estimates of required reserves may change in the future due to new developments in each matter or changes in approach such as a change in settlement strategy. Assessing the adequacy of any reserve for matters for which we may have to indemnify Alcatel-Lucent is especially difficult, as we do not control the defense of those matters and have limited information. In addition, estimates are made for our repurchase obligations related to products sold to various distributors who obtain financing from certain third party lending institutions, as described in Note 21, “Commitments and Contingencies” to our audited Consolidated Financial Statements.
Share-based Compensation
The Avaya Holdings Corp. Amended and Restated 2007 Equity Incentive Plan (“2007 Plan”) governs the issuance of equity awards, including restricted stock units (“RSUs”) and stock options to eligible plan participants. Key employees, directors, and consultants of the Company may be eligible to receive awards under the 2007 Plan. We account for share-based compensation in accordance with FASB Topic ASC 718, “Compensation—Stock Compensation” (“ASC 718”), which requires the measurement and recognition of compensation expense for all share-based payment awards to be based on their estimated fair values at the date of grant. Substantially all of our outstanding equity awards are subject to time-based vesting and vest over their performance periods, generally three to four years.
96
Table of Contents
As there has been no public market for our common stock to date, the estimated fair value of our common stock has been determined by our board of directors or a committee of the board, as plan administrator. The determination is based in part upon the recommendation of our CEO and an independent third-party appraisal that is obtained at least annually and is reassessed by the plan administrator at least semi-annually. The independent third party valuations are performed in accordance with the guidance outlined in the American Institute of Certified Public Accountants Practice Aid, Valuation of Privately-Held-Company Equity Securities Issued as Compensation, also known as the Practice Aid. We generally use the income and market approaches prescribed in the Practice Aid, in particular the income approach’s discounted cash flow method, which was based on our projections and estimated discount rate and the guideline public company, guideline transactions and precedent transaction methodologies, based on inputs from comparable public companies’ equity valuations, comparable acquisition transactions and transactions in our own equity securities, to estimate the enterprise value of our company. During fiscal 2011, 2012, 2013 and 2014, we performed these contemporaneous valuations as of May 31, 2011, October 31, 2011, April 30, 2012, October 31, 2012, March 31, 2013, June 30, 2013, September 30, 2013, December 31, 2013, March 31, 2014, June 30, 2014 and September 30, 2014. The assumptions underlying these valuations represent management’s best estimates, which involve inherent uncertainties and the application of management judgment. As a result, if factors or expected outcomes change and we use significantly different assumptions or estimates, our equity based compensation could be materially different.
Following the consummation of this offering, the fair value of our equity awards will be determined based on the quoted market price of our common stock.
New Accounting Guidance Recently Adopted
Reporting of Amounts Reclassified Out of Accumulated Other Comprehensive Income
In the first quarter of fiscal 2014, the Company adopted new guidance on the reporting of amounts reclassified out of accumulated other comprehensive income. The guidance requires presentation, either in a single note or parenthetically on the face of the financial statements, of the effect of significant amounts reclassified from each component of accumulated other comprehensive income based on its source and the income statement line items affected by the reclassification. The relevant presentation and disclosures have been applied retrospectively for all periods presented, as presented in Note 19, “Accumulated Other Comprehensive Loss” to our audited Consolidated Financial Statements included elsewhere in this prospectus.
Reporting Discontinued Operations and Disclosures of Disposals of Components of an Entity
In April 2014, the Financial Accounting Standards Board (“FASB”) issued Accounting Standards Update (“ASU”) No. 2014-8 “Reporting Discontinued Operations and Disclosures of Disposals of Components of an Entity.” The standard changes the criteria for determining which disposals can be presented as discontinued operations and modifies related disclosure requirements. Under the new guidance, a discontinued operation is defined as a disposal of a component or group of components that is disposed of or is classified as held for sale and represents a strategic shift that has a major effect on an entity’s operations and financial results. This accounting guidance applies prospectively to new disposals and new classifications of disposal groups as held for sale. The Company adopted this guidance in the third quarter of fiscal 2014, which did not have a material impact on the financial statements and disclosures and is not expected to have a material impact on future periods.
Recent Accounting Guidance Not Yet Effective
In July 2013, the FASB issued Accounting Standards Update No. 2013-11 “Presentation of an Unrecognized Tax Benefit When a Net Operating Loss Carryforward, a Similar Tax Loss, or a Tax Credit Carryforward Exists.” The standard requires the netting of unrecognized tax benefits (“UTBs”) against a deferred tax asset for a loss or other carryforward that would apply in settlement of the uncertain tax positions. UTBs are required to be netted against all available same-jurisdiction loss or other tax carryforwards that would be utilized, rather than only against carryforwards that are created by the UTBs. This accounting guidance is effective for the Company beginning in the first quarter of fiscal 2015. The Company is currently evaluating the impact the adoption of this accounting guidance may have on its consolidated financial statements.
97
Table of Contents
In May 2014, the FASB issued ASU No. 2014-09 “Revenue from Contracts with Customers.” The standard supersedes most of the current revenue recognition guidance under U.S. GAAP and is intended to improve and converge with international standards the financial reporting requirements for revenue from contracts with customers. The core principle of the new guidance is that an entity should recognize revenue to depict the transfer of promised goods or services to customers in an amount that reflects the consideration to which the entity expects to be entitled in exchange for those goods or services. New disclosures about the nature, amount, timing and uncertainty of revenue and cash flows arising from contracts with customers are also required. This accounting guidance is effective for the Company beginning in the first quarter of fiscal 2018; early adoption is not permitted. The ASU may be applied retrospectively (a) to each reporting period presented or (b) with the cumulative effect in retained earnings at the beginning of the adoption period. The Company is currently evaluating the method of adoption and the impact that the adoption of this accounting guidance may have on its Consolidation Financial Statements.
In August 2014, the FASB issued ASU No. 2014-15 “Disclosure of Uncertainties about an Entity’s Ability to Continue as a Going Concern.” The standard requires management to evaluate, at each annual and interim reporting period, the company’s ability to continue as a going concern within one year of the date the financial statements are issued and provide related disclosures. This accounting guidance is effective for the Company on a prospective basis beginning in the first quarter of fiscal 2017 and is not expected to have a material effect on the Company’s Consolidated Financial Statements.
Quantitative and Qualitative Disclosures About Market Risk
Foreign Currency Transactions
Recorded Transactions—We utilize foreign currency forward contracts primarily to manage short-term exchange rate exposures on certain receivables, payables and loans residing on foreign subsidiaries’ books, which are denominated in currencies other than the subsidiary’s functional currency. For fiscal 2014, 2013, and 2012 the changes in the fair value of the foreign currency forward contracts were substantially offset by changes resulting from the revaluation of the hedged items.
The fair value of foreign currency forward contracts is sensitive to changes in currency exchange rates. A 10% upward shift in the value of the foreign currencies that we trade against from the prevailing market rates would have had a negative impact of $16 million, $8 million, and $6 million for fiscal 2014, 2013 and 2012, respectively. A 10% downward shift in the value of the foreign currencies that we trade against from the prevailing market rates would have had a positive impact of $14 million, $13 million and $11 million for fiscal 2014, 2013 and 2012, respectively.
Forecasted Transactions—From time to time, we use foreign currency forward contracts to offset certain forecasted foreign currency transactions primarily related to the purchase or sale of product expected to occur during the ensuing twelve months. The change in the fair value of foreign currency forward contracts is recognized as other income or expense in the period in which the exchange rates change. For fiscal 2014, 2013 and 2012, these gains and losses were not material to our results of operations.
Interest Rate Risk
From time to time, the Company has entered into interest rate swap agreements to manage the amount of its floating rate debt in order to reduce its exposure to variable rate interest payments associated with certain borrowings. As of September 30, 2014 each of these agreements has reached maturity and there are no outstanding interest rate swap agreements.
See Note 11, “Derivatives and Other Financial Instruments,” to our audited Consolidated Financial Statements included elsewhere in this prospectus for further details related to these interest rate swap agreements.
98
Table of Contents
Our Company
Avaya is a leading provider of contact center, unified communications and networking products and services designed to help enterprise and midmarket businesses increase workforce productivity, customer engagement, and customer lifetime value, with the ultimate objective of higher revenue and profitability for our customers. Through September 30, 2014, we had over 300,000 customers, including over 95% of the Fortune 500, with installations in over one million customer locations worldwide.
Our products and services portfolio spans software, hardware, professional and support services, and cloud services. These fall under three reporting segments:
| • | Global Communications Solutions, or GCS, encompass all of our real-time collaboration, contact center and unified communications software and hardware. Unified communications integrates real-time communication services including telephony, e-mail, instant messaging and video. Examples in GCS include audio conferencing systems; mobile video software, software that runs contact center operations such as call routing; software that enables mobile access to the company network for employees; and hardware such as phones, gateways, and servers. This reporting segment also includes a development platform, which allows our customers and third parties to adapt our technology by creating custom applications, workflows, and environments for their unique needs and allows them to integrate Avaya’s capabilities into their existing infrastructure. GCS also includes cloud-supporting software and hardware products, which make it possible to use our contact center and unified communications products via the cloud. |
| • | Avaya Networking includes our advanced fabric networking technology which offers a virtualized network designed to be simple to deploy, agile and resilient. This reporting segment also includes products such as Ethernet switches and routers; wireless networking; and access control products that enforce role- and policy- based access to the network. Our fabric networking technology is flexible and extensible to legacy network systems, which gives customers the option to upgrade to new contact center and unified communications technology while maintaining their existing infrastructure, if desired. |
| • | Avaya Global Services, or AGS, includes professional and support services designed to help our customers maximize the benefits of using our products and technology. Our services include support for implementation, deployment, monitoring, troubleshooting, optimization, and more. This reporting segment also includes our cloud and managed services, which enable customers to take advantage of our technology in a private, hybrid, or public cloud environment. The majority of our revenue in this reporting segment is recurring in nature, based on multi-year services contracts. |
As enterprise and midmarket businesses increasingly seek to improve customer experience through the quality and efficiency of contact center and unified communications, they are confronted with several industry trends presenting emerging and varied challenges. We believe the most forceful among these trends are:
| • | the increasing mobility of the workforce; |
| • | shifting priorities of C-level business decision makers, including an increased preference for software-defined networking (SDN, or network virtualization), cloud delivery of applications, and management of multiple and varied devices, all of which must be handled with the security the business demands; |
| • | increasing demand for IT purchases under operating expense models over capital expense models; and |
| • | the rise of omni-channel customer service involving multiple modes of communications. |
We aim to be the leader in our industry in addressing the resulting customer needs and priorities in light of these trends and emerging challenges. We have invested in open, mobile enterprise communication and
99
Table of Contents
collaboration platforms and are well poised to serve a broad range of needs, from servicing old phone systems to deploying leading edge call center technology via the cloud. While we remain committed to our legacy capabilities and the customers who rely on them, in the past several years we have also responded to the emerging landscape by evolving our market and product approach in three important ways.
| • | We have invested in R&D and new technologies to develop and provide more comprehensive contact center, unified communications, and networking products and services, continuing our focus on the enterprise while expanding the value we can provide to midmarket customers. |
| • | We have evolved our product design philosophy, anticipating demand for products that are cloud- and mobile enabled. We also design our products to be flexible, extensible, secure and reliable. This allows our customers to transition from old communications and collaboration technology to newer technology in a way that is manageable and cost-effective. |
| • | We have increased our focus on packaging our products and services into “solutions” including: |
| • | Customer Engagement Solutions: which are primarily comprised of our contact center products and services (such as software for intelligent call routing and reporting) and supported by our networking technology and development environment. These solutions are designed to help our customers improve customer experience and maximize customer lifetime value, while expanding communications channels to include chat, mobile applications, video, and more. |
| • | Team Engagement Solutions: which are primarily comprised of our real-time collaboration and unified communications products and services (such as audio conferencing systems, mobile video software, phones, and software that governs employee network access) and supported by our networking technology and development environment. These solutions are designed to help our customers improve workforce productivity and mobility, while allowing employees to securely use increasing number and variety of devices and communications channels to collaborate. |
| • | Networking solutions: which are primarily comprised of our advanced fabric networking technology, based on open industry standards, as well as Ethernet switches, routers, and software that governs role- and policy-based network access. Our networking solutions are designed to enable customer and team engagement across devices and communications modes, on-premise or via the cloud. These solutions are designed to reduce outages, boost agility and resiliency, and increase speed to deployment of contact center and unified communications technology. |
We design and build these solutions for engagement of the customers and employees of our customers. We define “engagement” as the set of tangible outcomes that a business experiences through improved team and customer communications and collaboration. These tangible benefits include higher employee productivity; higher customer satisfaction; higher customer lifetime value, and, ultimately, higher profitability.
With our products and services, packaged as solutions, we can address the needs of a diverse range of customers, including large multinational enterprises, small and medium-sized businesses, and government organizations. Our customers operate in a broad range of industries, including financial services, manufacturing, retail, transportation, energy, media and communications, healthcare, education and government. We employ a flexible go-to-market strategy with direct or indirect presence in over 160 countries. As of September 30, 2014, we had approximately 10,800 channel partners and for fiscal 2014, our product revenue from indirect sales through our channel partners represented approximately 75% of our total product revenue.
For fiscal 2014 and 2013, we generated revenue of $4,371 million and $4,578 million, respectively. For fiscal 2014, our total revenue was evenly split between product revenue and services revenue. For fiscal 2013, product revenue represented 51% of our total revenue and services revenue represented 49%. Revenue generated in the United States for fiscal 2014 and 2013 represented 52% and 53% of our total revenue, respectively. For fiscal 2014 and 2013 we had operating income from continuing operations of $197 million and $144 million,
100
Table of Contents
respectively. For fiscal 2014 and 2013, we had Adjusted EBITDA of $898 million and $922 million, respectively. See “Management’s Discussion and Analysis of Financial Condition and Results of Operations: EBITDA and Adjusted EBITDA” for a definition and explanation of Adjusted EBITDA and a reconciliation of loss from continuing operations to Adjusted EBITDA.
The Benefits of Our Solutions
Avaya’s solutions are combinations of our products and services designed to help our customers address their customer and team engagement needs, before, during and after any transition they may make to a mobile- and cloud-enabled communications environment. We believe our unified communications, contact center, and networking technology can increase productivity and profitability for businesses of all sizes.
Customer Engagement Solutions
Our Customer Engagement Solutions are designed to facilitate long-lasting and successful relationships between companies and their customers. The objective is to increase customer lifetime value, revenue, and profitability for our customers - even as they evolve to integrate more communications channels and mobile devices into their customer service strategies. These solutions are predominately made up of our contact center products and services, and supported by our networking technology and development environment. Some of the benefits of Avaya Customer Engagement Solutions include:
| • | Improved customer experience: As businesses increasingly compete on customer experience, we offer products and services designed to incorporate multiple channels of communication, improve customer satisfaction and retention; increase referrals and customer acquisition; and increase cross-sell and upsell opportunities. For example, our intelligent routing and multi-modal integration software can help an enterprise or midmarket business deliver a seamless ongoing conversation with a customer, even if that conversation includes interactions by phone, chat, email, and social media. Our products and services are designed to drive consistency and increased satisfaction across touch points and enable better measurement of customer experience data for dispersion to other business units. |
| • | Contact center efficiency: We believe the contact center is at the heart of a successful customer engagement solution because it is a primary channel of communication between the customer and businesses, even as modes of contact expand to include social media, chat, and mobile apps. Our products and services are designed to help our customers achieve contact center efficiency through automation, by reducing operational costs and staffing impacts, eliminating resource constraints caused by repetitive requests and manual processes, and ensuring service level agreements as well as compliance requirements. For example, we might deploy our contact center platform with intelligent call routing and contact flow analytics software to help a customer better manage volume fluctuations and better match contact center resources to customer needs in real-time. |
| • | Revenue growth: Our solutions are designed to help our customers increase revenue through stronger and longer lasting customer relationships. We believe our solutions address this challenge by reducing complexity within the contact center and facilitating better sell-through, sell-in and sell-up performance. For example, we might deploy our Avaya Customer Experience Portal with software for proactive consumer outreach, to help a customer increase the efficiency and effectiveness of increasing repeat purchases and order sizes, while allowing the customer’s end-consumer to use his or her preferred communications channel for the interaction. |
Team Engagement Solutions
Avaya Team Engagement Solutions are designed to offer businesses the simplicity of a single solution to address workforce communication and collaboration needs, including via mobile devices. These solutions are made up predominately of our real-time collaboration and unified communications products and services, and
101
Table of Contents
supported by our networking technology and development environment. Some of the benefits of Avaya Team Engagement Solutions include:
| • | Communications modernization: Avaya helps modernize communications ecosystems by centralizing, consolidating and virtualizing underlying technology infrastructures and making applications available via the cloud. This model is designed to account for mobile device usage, reduce total cost of ownership for the entire collaboration environment and allow firms to transition from a capital expenditure to operating expenditure model. For example, an Avaya private cloud solution can be implemented to integrate virtualized voice, email, video, messaging, chat and conferencing capabilities. This enables cloud access to communications tools for desk-based and remote workers and improves security, delivering total cost of ownership, or TCO, efficiencies and rapid payback. |
| • | Worker productivity: Our conferencing, messaging, and other unified communications products and services are designed to help our customers integrate products that equally support desk-workers, teleworkers, and frequent business travelers, thereby increasing the mobility and productivity of their workforce. Our customers are increasingly demanding that individual workers be able to communicate across device types, channels and geographic locations knowing that their devices, data and connections are reliable and secure. For example, our customers using the Avaya Session Border Control can securely extend the corporate unified communications capabilities to a remote user on a mobile device and to desk phones in their remote and home offices. |
| • | Team productivity: Our unified communications products and services are designed to help our customers improve team productivity by diminishing the complexity of team collaboration channels, enabling off-the-shelf and customizable application integration, providing omni-channel conferencing across audio, web, and video for room, desktop, and mobile platforms. It also provides the opportunity to simplify and expand by moving conferencing services into the cloud. For example, the Avaya Scopia platform can enable employees or remote workers to collaborate using high-definition, secure video conferencing accessed through on-premise conference rooms, desktop systems, and mobile devices. |
Networking Solutions
Our advanced fabric networking technology, based on open industry standards, is designed to deliver a virtualized network that is simple to deploy, agile to operate, and resilient. Many conventional networking technologies have complex architectures, layering protocols over protocols, making the network architecture fragile and significantly impeding the roll-out of real-time applications. Avaya’s Fabric Connect, our fabric networking technology, is designed to deliver the agility businesses need to focus on integrating customer and team engagement solutions into their existing IT infrastructures. Unified access and network virtualization capabilities form the foundation of Avaya Networking Solutions. Benefits include:
| • | Unified access: Our unified access solution is designed to securely extend both fixed and mobile “bring-your-own-device (BYOD)” policies and enable proactive provisioning, quality monitoring, and active application awareness and control. |
| • | Network virtualization: Our network virtualization solutions are designed to optimize the physical network, decrease network complexity, eliminate complex protocols, and integrate security features for the safe segmentation of data. All of this is intended to accelerate application and user deployment. |
Trends Shaping Our Industry
We believe there are a number of key trends shaping our industry and that there is a substantial market opportunity for the market participants that capitalize on these trends.
A new mobile workforce
The increase in mobile technology has created a world more focused on real-time, flexible and always-on communication. We see companies increasingly looking for ways to make corporate applications more accessible
102
Table of Contents
via mobile devices as the usage of those devices by workers continues to rise worldwide. A Forrester Research, Inc. survey indicates that 73% of firms with 1,000 or more employees claim supporting more types of mobile devices and platforms will be a critical or high priority during the next 12 months.1
Evolving priorities of C-level business leaders
CEOs and CMOs, we believe, are increasingly seeking to differentiate through customer experience, or in some cases, just trying to keep up with swift-changing customer demands. Meanwhile, we have seen, these two roles become increasingly involved in our customers’ decision making process for the kinds of software, hardware and services we provide. We believe the increasing importance of technology as both an internal and external facing presence of the enterprise, as well as the high stakes of data breaches are reasons CEOs are increasingly engaged in the decision making process. CMOs are gaining additional IT budget authority as they are tasked to manage customer experience and marketing activities using modern communications technology and rich data. We believe that as a result of this shift in decision-making roles, customer engagement solutions need to provide businesses with better ways to engage with end users securely across multiple platforms and channels, creating better customer experiences and thus higher revenues for our customers.
CTOs and CIOs, we believe, have three critically increasing priorities.
| • | Manage the reliable and secure integration of an increasing number and variety of devices and endpoints: Today, business users not only use desk-based devices, but also laptops, smartphones, and tablets. Gartner reports from June and September 2014 forecasted that these devices are growing at a CAGR of 6.4% for laptops, 10.6% for smartphones, and 14.4% for tablets through 20182-4. To communicate seamlessly and securely across devices, applications and endpoints must be managed as part of an integrated communications infrastructure. |
| • | Leverage existing technology infrastructure while positioning for the future: The speed at which new enterprise technology enters the market is challenging companies to rapidly adopt and install new technology. We believe this pressure creates strong demand for systems that do not require enterprise-wide overhauls of existing technology. Instead, it favors incremental, flexible, extensible technologies that are easy to adopt and compatible with existing infrastructures. As a result, many customers are in the midst of transition from on-premise to cloud-based delivery models. |
| • | Shift to software-defined networking (SDN) and cloud-based applications: Companies today seek technology that helps them lower TCO, increase deployment speed and application agility, centralize network control, and embed network functions such as fine-grained security. They also seek to shift away from a complex, proprietary capital-intensive model to one that is more open and efficient. |
Omni-channel engagement hubs replacing call centers
Like workforces, the customers of our customers are also increasingly using mobile devices and expecting service interactions with companies across multiple communications channels and devices. Customer interactions are evolving from voice-centric, point-in-time, contact center transactions to ongoing customer conversations over multiple interactions and across multiple media and modes of communication. Customers expect businesses to know about the history of their interactions, even when they occur across a mix of self-service and agent assisted communications methods, including voice, video, email, chat and social media.
Our Large and Growing Addressable Market Opportunity
We believe that the above trends create significant market opportunity for customer and team engagement solutions. In addition, we believe the limitations of traditional collaboration products and services and capital-intensive buying models present an opportunity for differentiated vendors to gain market share.
| 1 | Forrester Research: The Forrester WaveTM: Global BYOD Management Services, Q2 2014, June 2014 |
| 2 | Gartner Forecast: PCs, Ultramobiles and Mobile Phones, Worldwide, 2011-2018, 3Q14 Update, Ranjit Atwal, et al, September 2014. |
| 3 | Gartner Forecast: Mobile Phones, Worldwide, 2011-2018, 2Q14 Update, Annette Zimmermann, et al, June 2014. |
| 4 | Gartner Forecast: PCs, Ultramobiles and Mobile Phones, Worldwide, 2011-2018, 3Q14 Update, Ranjit Atwal, et al, September 2014. |
103
Table of Contents
We believe that the total available market for customer and team engagement solutions includes spending on unified communications, contact center applications and networking infrastructure equipment, as well as spending on one-time and recurring professional, managed/cloud, and support services to implement, maintain and manage these tools. We believe that in 2015, the portion of these markets that Avaya serves will have grown to approximately $60 billion of vendor spending with approximately $36 billion of that amount coming from enterprises having 5,000 or more employees. In aggregate, we see unified communications accounting for $16 billion, contact center accounting for $4 billion, data networking infrastructure accounting for $18 billion and support, managed/cloud and professional recurring services accounting for the remaining $22 billion. These markets are impacted positively by the need for enterprises to increase productivity and upgrade their unified communications strategy to a more integrated approach, accounting for mobility, varied devices, and multiple communications channels. In response to this need, industry analysts expect that from 2014 through 2017 aggregate spending on unified communications, contact center, data networking and support, managed/cloud and professional services will grow.
Furthermore, the midmarket, which we define as companies with fewer than 5,000 employees, is a growing opportunity for Avaya’s products and services. We believe our communications market opportunity for the portion of the midmarket segment which Avaya serves is approximately $24 billion. Not only do we believe this segment is growing, but we believe it is underserved and willing to invest in IT enhancements. Avaya has a set of offerings that are specifically designed to address the needs of midmarket businesses, built around our Avaya IP Office, software and hardware designed to simplify processes and streamline information exchange within companies. It lets midmarket companies deliver a collaboration experience that integrates voice, video, and mobile device communications, at price points affordable to midmarket businesses.
Our Competitive Strengths
We believe the following competitive strengths position us well to capitalize on the opportunities created by the market trends affecting our industry.
Leading position across our key end markets
We are a leader in business collaboration and communications, with leading market share in worldwide telephony systems5, contact center infrastructure6, voice maintenance services7 and enterprise messaging,8 and a position in the Leader’s quadrant in each of Gartner’s Magic Quadrants for Corporate Telephony, Unified Communications and Contact Center Infrastructure.9 Additionally, we believe we are a leading provider of cloud and managed services, which in fiscal 2014 grew revenues 19 percent over fiscal 2013 and has continued to be one of the fastest growing areas of our business. We also believe that our market leadership and our incumbent position within our customer base better enables us to cross-sell to existing customers and win new customers.
| 5 | Dell’Oro Group, Enterprise Telephony Report, 4Q13, March, 2014. |
| 6 | Gartner Inc. Market Share, Contact Center: Worldwide, 2013, Drew Kraus, March, 2014. Gartner ranks Avaya the leader in Contact Center Agent End-User Revenue by Manufacturer, Worldwide in 2013. |
| 7 | IntelliCom Analytics, Services Market Dashboard, Q4 2013 Global Lifecycle Services Market Workbook, June, 2014. |
| 8 | T3i Group, InfoTrack for Converged Applications, Messaging Systems Shipments, Revenue & Market Share Details, Full Year 2013, June 2014 |
| 9 | Gartner Magic Quadrants-Gartner Magic Quadrant for Corporate Telephony, Sorell Slaymaker, et al, October, 2014. |
- Gartner Magic Quadrant for Unified Communications, Bern Elliot et al, August 2014.
- Gartner Magic Quadrant for Contact Center Infrastructure, Drew Kraus, et al, May 2014.
Gartner, Inc. (Gartner) does not endorse any vendor, product or service depicted in our research publications, and does not advise technology users to select only those vendors with the highest ratings. Gartner research publications consist of the opinions of Gartner’s research organization and should not be construed as statements of fact. Gartner disclaims all warranties, expressed or implied, with respect to this research, including any warranties of merchantability or fitness for a particular purpose.
The Gartner Report(s) described herein, (the Gartner Report(s)) represent(s) data, research opinion or viewpoints published, as part of a syndicated subscription service, by Gartner, Inc. (Gartner), and are not representations of fact. Each Gartner Report speaks as of its original publication date (and not as of the date of this prospectus) and the opinions expressed in the Gartner Report(s) are subject to change without notice.
104
Table of Contents
Open standards technology that supports multi-vendor environments
Our open standards-based technology is designed to accommodate customers with multi-vendor environments seeking to leverage existing investments. Providing enterprises with strong integration capabilities allows them to take advantage of new collaboration and contact center technology as it is introduced. It does not limit customers to a single vendor or add to the backlog of integration work. We also continue to invest in our developer ecosystem, Avaya DevConnect, which has grown to include over 24,000 members as of September 30, 2014. We believe Avaya DevConnect, together with our Agile Communication Environment, or ACE, toolkits, application programming interfaces, or APIs, and integration environments allow businesses to derive unique value from our architecture.
Leading service capabilities tied to a large recurring revenue stream
Avaya Global Services, or AGS, is a leading provider of recurring support services relating to business collaboration and communications products. Our worldwide services-delivery infrastructure and capabilities help customers address critical business collaboration and communications needs from initial planning and design through implementation, maintenance and day-to-day operation, monitoring and troubleshooting. We believe AGS is uniquely positioned as a result of close collaboration between our R&D and service planning teams in advance of new products being released. Customers can use “Ava”, our virtual agent, to get immediate answers online. They can also connect with one of our experts via web chat, web talk, or web video. Avaya Global Services can also directly access our research and development teams when necessary to quickly resolve customer issues. These capabilities allow Avaya to provide quality service for Avaya products.
In addition, AGS delivers cloud and managed services with a focus on customer performance and growth. These services can range from managing software releases to operating customer communication systems to helping customers migrate to next-generation business collaboration and communications environments. We believe that our deep understanding of application management supporting unified communications, contact center, video and networking uniquely position us to best manage and operate cloud-based communications systems for our customers.
Our service delivery is most often provided to customers through recurring contracts. In fiscal 2014, we generated 50% of our revenues from services with over 80% of service revenues from recurring contracts. Recurring contracts for support services typically have terms that range from one to five years, and contracts for cloud and managed services typically have terms that range from one to seven years. In fiscal 2014, the U.S. accounted for approximately 64% of our support revenue, with contract renewal rates of more than 83%. We believe our services relationships have provided us with a large recurring revenue base and significant visibility into our customers’ future collaboration needs.
Lower total cost of ownership (TCO)
Many vendors try to address customer demands by layering on more architectures and protocols. In the process, they frequently sacrifice simplicity, flexibility and total cost of ownership. In contrast, our products and services are specifically designed to address these needs - typically with less hardware - without sacrificing performance. We believe our product performance, deployment methods, and networking technology contribute to a lower total cost of ownership for customer and team engagement solutions.
Large, diverse and global customer installed base
Our products and services address the needs of a diverse range of customers from large multinational enterprises to small and medium-sized businesses in various industries, including financial services, manufacturing, retail, transportation, energy, media and communications, health care, education and government. Through September 30, 2014, we had over 300,000 customers, including over 95% of the Fortune 500 with installations in over one million customer locations worldwide. We believe our large and diverse customer base provides us with recurring revenue and the opportunity to further expand within our customer base.
105
Table of Contents
Our Growth Strategy
We believe we are well-positioned worldwide and have a multi-faceted strategy to be a leading provider in delivering engagement and networking solutions.
Expand our cloud offerings and capabilities
In our experience, technology and business leaders are increasingly turning to cloud-based technologies and business models that allow enterprises to cut costs, increase productivity, simplify IT environments, and shift when possible to usage-based operating expense models.
Avaya’s technologies that make up our Customer Engagement, Team Engagement, and Networking solutions are designed to be available both on-premise and as a cloud-based service to meet these demands.
Increase mobility offerings to customers
As global workforces change and demand mobile engagement solutions, we intend to meet these demands. For example, the Avaya Aura Platform is designed to support mobility, providing dynamic access to applications and services based on need, not location.
Invest in open standards and product differentiation and innovation
As potential customers look to migrate to our products and services, our open architecture can integrate with competitor systems and provide a path for gradual transition while still achieving cost savings and improved functionality. Our Fabric Networking technology is fundamental to this approach. Fabric networking represents a strong growth area for Avaya, as fabric networking deployments gain momentum.
During fiscal 2014, we delivered a total of 114 new product releases, which is more than 10% above the level from fiscal 2013. We also expect to continue to make investments in product innovation and research and development across the portfolio to create enhancements and breakthroughs. We believe this will encourage customers to upgrade their products more frequently. We also plan to continue to embrace the cloud computing and mobility opportunities, and to seek new ways to leverage the Virtual Desktop Integration, or VDI, trend to securely deliver business collaboration to users.
Increase our midmarket offerings, capabilities, and market share
We believe our communications market opportunity for the portion of the midmarket segment which Avaya serves is approximately $24 billion. We define the midmarket as firms with fewer than 5,000 employees. Not only do we believe this segment is growing, but we believe midmarket businesses are underserved and willing to invest in IT enhancements. With the most recent version of our IP Office product, version 9.0, we developed our first complete offering specifically tailored to the needs of midmarket businesses. We believe this offering increases the value we can provide to midmarket businesses and creates an opportunity for market share gain. During fiscal 2014, we made over 300 new strategic hires to key front line sales, specialist, and support roles to increase reach and accelerate our growth, particularly in the midmarket. We intend to continue to invest in our midmarket offerings and go-to-market resources to increase market share and meet the growing demands of this segment.
Increase sales to existing customers and pursue new customers
We believe that we have a significant opportunity to increase our sales to our existing customers by offering new solutions from our diverse product portfolio, including cloud, mobility, and networking solutions. This ability is supported by our market leadership, global scale and extensive customer interaction, including at the C-suite, and creates a strong platform from which to drive and shape the evolution of enterprise communications toward greater business collaboration. Our track record with our customers gives us the credibility that we believe provides us with a competitive advantage in helping them cope with this evolution.
106
Table of Contents
Invest in sales and distribution capabilities
Our flexible go-to-market strategy, which consists of both a direct sales force and approximately 10,800 channel partners (as of September 30, 2014), allows us to reach customers across industries and around the globe while allowing them to interact with Avaya in a way that fits their organization. We intend to continue investing in our channel partners and sales force to optimize their market focus, enter new geographies and provide our channel partners with training, marketing programs, and technical support through our Avaya Connect program. We also leverage our sales and distribution channels to accelerate customer adoption and generate an increasing percentage of our revenue from our new high-value software products, data networking, video collaboration, midmarket offerings, and user experience-centric applications.
Expand margins and profitability
We have maintained our focus on profitability levels and implemented a number of cost savings initiatives. These initiatives, along with decreases in the amortization of acquired technology intangible assets, have contributed to improvements in our gross margin. Our gross margin has improved from 43.5% in fiscal 2010 to 57.2% in fiscal 2014. This improvement in gross margin along with other cost savings is also reflected in Adjusted EBITDA, a key metric management uses to evaluate the Company’s performance. Adjusted EBITDA as a percentage of revenues improved from 15.6% in fiscal 2010 to 20.5% in fiscal 2014. See “Management’s Discussion and Analysis of Financial Condition and Results of Operations: EBITDA and Adjusted EBITDA” for a definition and explanation of Adjusted EBITDA and a reconciliation of loss from continuing operations to Adjusted EBITDA.
We expect to pursue additional cost reduction opportunities which are likely to be more targeted and may include increased automation of our processes, headcount attrition, actions to address unproductive assets, real estate consolidation, sales back office and front line skill transformations, and balancing our professional services structure. Having delivered substantial cost structure reductions over the past several years, we believe the opportunities for additional savings and execution of our growth strategy can result in further margin and profitability expansion.
Our Products and Services
Overview
Avaya possesses diverse product and services portfolios and combines individual products and services to solve customer challenges related to customer engagement, team (workforce and partner) engagement, and networking.
The products and services that make up these solutions are organized in three reporting segments:
| • | Global Communications Solutions (GCS) encompass all of our real-time collaboration, contact center and unified communications software and hardware. Examples include audio conferencing systems; mobile video software, software that runs contact center operations such as call routing; software that enables mobile access to the company network for employees; and hardware like phones, gateways, and servers. This segment also includes a development platform, which allows our customers and third parties to adapt our technology by creating custom applications, workflows, and environments for their unique needs and allows them to integrate Avaya’s capabilities into their existing infrastructure. GCS also includes cloud-supporting software and hardware products, which make it possible to use our contact center and unified communications products via the cloud. |
| • | Avaya Networking includes our advanced fabric networking technology that offers a virtualized network designed to be simple to deploy, agile and resilient. The reporting segment also includes products such as Ethernet switches and routers; wireless networking; and access control products that enforce role- and policy- based access to the network. Our fabric networking technology is flexible and |
107
Table of Contents
| extensible to legacy network systems, which gives customers the option to upgrade to new contact center and unified communications technology while maintaining their existing infrastructure, if desired. |
| • | Avaya Global Services includes professional and support services designed to help our customers use our products and technology efficiently and effectively. Our services include support for implementation, deployment, monitoring, troubleshooting, optimization, and more. This reporting segment also includes our cloud and managed services, which enable customers to take advantage of our technology in a private, hybrid, or public cloud environment. While some are one-time services, the majority are recurring services. |
The majority of our product portfolio is made up of software products that reside on either a client or server. Our client software resides on both our own and third-party devices, including desk phones, tablets, laptops and smartphones. It provides users with access to unified communications capabilities such as voice and video calling, audio conferencing, instant messaging, and contact directories. Our server-side software controls communication and collaboration for the enterprise. It delivers rich value-added applications such as messaging, telephony, voice, video and web conferencing, mobility and customer service. Our hardware includes a broad range of desk phones, servers and gateways and LAN/WAN switching wireless access points. A portion of our portfolio has been subjected to rigorous interoperability and security testing and is approved for acquisition by the US Government. Avaya’s portfolio of services include product support, integration, cloud and managed services as well as professional services that enable customers to optimize and manage their communications networks worldwide and achieve enhanced business results.
108
Table of Contents
Global Communications Solutions
Enterprises of all sizes depend on Avaya for unified communications, collaboration, contact center, and networking applications and technology that help improve efficiency, engagement, and competitiveness. Our people-centric products integrate voice, video and data, enabling users to communicate and collaborate in real-time, in the mode best suited to each interaction. This eliminates inefficiencies in communications to help make organizations more productive and responsive.
The following chart provides a representative list of products, descriptions, and classifications that are included in the Global Communications Solutions reporting segment.
| Category | Product Name | Description | Included in which Avaya Solutions | |||
| Video and |
Avaya Scopia | A standards-based portfolio of hardware and software products that includes conference room systems, desktop and mobile video conferencing, and infrastructure and management. Available extensions include HD (high-definition) video-conference rooms, and mobile applications for video conferencing, control, and management on mobile devices. | Team Engagement | |||
| Avaya Aura Conferencing | A combination of hardware and software that provides simple access to multi-media collaboration. In the same application users can use voice, video, chat, and web conferencing. Based on the Avaya Aura architecture, Avaya Aura Conferencing is distributed and scalable to thousands of users. Its modular conception allows the system to be dimensioned appropriately in terms of video or web content servers or voice communications manager. | Team Engagement | ||||
| The complementary Avaya Video Conferencing infrastructure includes Avaya Scopia Elite Multipoint Conferencing Units, or MCUs, reliable and highly scalable multi-party video conferencing platforms for enterprise and service provider environments. They offer advanced and easy-to-use multi-party infrastructure for video conferencing and are at the core of a high definition deployment. In addition, gateways for Microsoft Lync and Session Initiation Protocol (“SIP”) provide connectivity and interoperability with unified communications products to standards-based video conferencing systems and infrastructure. |
||||||
| BurstPoint Networks video conference recording and streaming | In July 2014 Avaya completed the acquisition of the intellectual property assets of BurstPoint Networks. These assets include high-definition video conference recording and streaming platforms that can be deployed behind corporate firewalls for scaled, secure, high-volume streaming. | Team Engagement | ||||
109
Table of Contents
|
Communications |
Avaya one-X Communicator and one-X Mobile | Ideal for users who communicate frequently, manage multiple calls, set up ad-hoc conferencing, and need to be highly reachable, Avaya one-X Communicator software provides users with access to unified communications capabilities including voice and video calling, audio conferencing, instant messaging and presence, corporate directories, and communication logs. Avaya one-X Mobile software enables users to access enterprise communications from a wide selection of mobile devices, including high-end smart phones and tablets. A choice of one-X Mobile clients is available for popular platforms including Apple iPhone, Google Android, and BlackBerry. | Team Engagement | |||
| Avaya Client Applications | Software that provides access to Avaya voice and video services from business applications such as Microsoft Lync, Microsoft Office Communications Server, Microsoft Outlook, Microsoft Office, IBM Sametime, and customer relationship management, or CRM, applications such as Salesforce.com and Microsoft Dynamics. | Team Engagement | ||||
| Avaya Aura Messaging | Unified messaging software that gives users access to email, voicemail, and fax from a single interface. It uses an all-Linux platform with local survivability and geo-redundant capabilities to serve large distributed or centralized configurations, with the option to store messages in an Avaya and/or Microsoft Exchange message store. | Team Engagement | ||||
| Avaya Aura Messaging Service | A cloud-based service that enables business phone lines to be a textable number. This software allows the user to communicate via text messaging using an enterprise phone number, enabling the user to keep his or her mobile phone number private and reserving it for their personal use. Messages are secure and stored in the cloud and simultaneously available on smartphones, tablets, notebooks, and desktop devices, enabling one-number communications via voice, pictures and text messaging. | Team Engagement |
110
Table of Contents
| Platforms, |
Avaya Aura Core |
A next-generation architecture powering our customers’ communications and collaboration services. Based on IMS, an industry standard defined by 3GPP, this core (a blend of hardware and software) provides a flat communications control and management function using SIP methods. Unlike point-to-point SIP, or even standard client server SIP approaches used by most of our competitors, the Avaya Aura Core uses the SIP-ISC, or IMS Service Control, signaling standard to allow multiple independent applications to serve communication sessions. Avaya Aura can scale to hundreds of thousands of users, serving the small enterprise all the way through the largest enterprise customers in the world. | Customer Engagement
Team Engagement
| |||
| The Avaya Engagement Development Platform | The Avaya Engagement Development Platform is a software platform that simplifies embedding robust communications and collaboration capabilities into business applications, such as CRM or Enterprise Resources Planning, or ERP. This platform allows customers, third parties, and Avaya to create customized engagement applications and environments to meet unique needs. Customers and third parties can integrate business applications with unified communications technology and contact center capabilities including voice, short message service or SMS, and email. | Customer Engagement
Team Engagement | ||||
| Avaya IP Office | Avaya IP Office is a unified communications set of hardware and software products designed specifically for midmarket-sized customers. Avaya IP Office can be deployed on-premise or in the cloud. It was designed to simplify processes and streamline information exchange within companies. Communications capabilities can be added as needed. The latest version of Avaya IP Office (9.0) gives midmarket customers features and functions that large enterprises use, but at a scale that is efficient and affordable for them. Avaya IP Office delivers a seamless collaboration experience across voice, video, and mobility for up to 2,000 users. | Customer Engagement
Team Engagement | ||||
| Avaya Session Border Controller (“SBC”) for Enterprise | SBC provides enhanced security for collaboration within and outside of the enterprise, helping to protect SIP trunks from multiple threats and allowing SIP remote users to simply and securely connect communication and collaboration applications to the enterprise without the need of VPN connection. This is made up of hardware, software, or both. | Customer Engagement
Team Engagement | ||||
| Avaya Phones | Avaya’s range of desk phones and portable technologies include IP and digital desk phones, digital enhanced cordless telecommunications (DECT) handsets, wireless phones, docking stations for BYOD, and conference room phones. Avaya phones offer capabilities such as touch screen and applications such as integration to corporate calendar, directory and presence, enhanced audio quality for a “you-are-there” experience, customization and soft keys, and multiple lines appearances, to name a few. | Customer Engagement
Team Engagement |
111
Table of Contents
|
Assisted |
Avaya Aura Contact Center | Avaya Aura Contact Center lets customers connect with a company in ways beyond phone calls, including via text, IM, email, and chat. The omni-channel contact center solution gives agents the context (real-time and historical) to deliver a differentiated customer experience. It is designed to provide a unified, efficient, and highly personalized experience that builds brand and customer loyalty. | Customer Engagement | |||
| Avaya Aura Call Center Elite |
With intelligent routing and resource selection features, Avaya Aura Call Center Elite allows a business to determine if its customers should be served by the least busy agent, the first available agent, or the agent with skills that best match the customer’s needs. Calls can be routed across a pool of agents regardless of physical location. | Customer Engagement | ||||
| Interaction Center | Interaction Center extends Avaya Aura Call Center Elite to enable service channels beyond the telephone, including email, web chat, SMS/text, and social media. | Customer Engagement | ||||
| IP Office Contact Center - Mid Market |
New in 2014 and built to integrate with the IP Office Platform, this is a contact center software solution designed specifically for midmarket business needs. It enables seamless conversations for hundreds of agents across multiple modes of communication, including voice, email, chat, text, and fax. | Customer Engagement | ||||
| Avaya Contact Center Select | New in 2014, this advanced software provides enterprise-level contact center capabilities to midmarket clients on the Avaya IP Office platform. It provides, among other things, omni-channel support (voice, email, chat, SMS, and fax) scalability for 30 - 250 agents and skills-based routing. | Customer Engagement | ||||
| Automated |
Avaya Aura Experience Portal | The Avaya Aura Experience Portal enables organizations to connect with customers in new ways and take advantage of all the popular mobile channels, including SMS text and mobile phones. The product enables customers to connect with agents using their favorite channels and devices and gives them powerful, unique service experiences with multi-party conferencing, intelligent routing, and pre-identified customer preferences. | Customer Engagement | |||
| Intelligent Customer Routing | This enables customers to turn customer wait times into positive and productive customer engagements. It lets firms share offers during wait times, deliver customer information to agents that help assure fast and accurate answers, and relay alerts and notifications to callers in queues. | Customer Engagement | ||||
| Proactive Contact | This enables firms to optimize outbound customer care, like payment reminders, announce product enhancements, explain service changes, and deliver surveys, with best-in-class predictive dialing. | Customer Engagement | ||||
| Proactive Outreach Manager | Proactive Outreach Manager lets customers of a business choose when and where they want to connect and whether it’s via mobile, online, in store, or over the phone. | Customer Engagement |
112
Table of Contents
|
Performance |
Avaya Aura Performance Center | Avaya Aura Performance Center is a unified, end-to-end reporting and analytics platform that distills business intelligence from large volumes of data, to discover not only what has happened in a communications stream, but also why it happened. | Customer Engagement | |||
| Avaya Aura Workforce Optimization | Avaya Aura Workforce Optimization is designed to give firms a deeper, more meaningful look at customer interactions by uniting all workforce optimization requirements under one, integrated platform. Firms can use this to capture, share, and act on information from across the enterprise-especially contact centers and back-office systems-and use the data to make informed decisions faster. | Customer Engagement | ||||
| Avaya Call Management System | Avaya Call Management System is designed for businesses with complex contact-center operations and high call volume. Call Management System is a database, administration, and reporting application to help businesses identify operational issues and take immediate action to solve them. | Customer Engagement | ||||
| Speech Analytics | Speech Analytics enables firms to capture and analyze all data from recorded audio content in order to monitor quality and manage and mitigate risk. With advanced phonetic speech tools customers can quickly identify key words and phrases in audio recordings, search and tag keywords and phrases that have been identified and compile the information needed to make informed decisions and take action. | Customer Engagement | ||||
| Cloud |
CCAAS, UCAAS, VAAS and Collaboration Pod | The contact center as-a-service, unified communications as-a-service, and video-as-a-service products are software reference architectures that use multi-tenant control technology and virtualized communications platforms to extend Avaya’s industry leading Contact Center, Unified Communications, and Video products to the cloud, making them available as a service. The Collaboration Pod is a hardware delivery mechanism for the solutions, available for partners who want a fully-installed solution. | Customer Engagement
Team Engagement | |||
| Avaya Aura Control Manager |
Aura Control Manager is a cloud-based product for centralizing administration and management for Avaya contact centers. This product is designed to allow a customer to easily update call center functions and business processes across the entire organization. Administrators can apply rules and definitions using as little as a single keystroke, allowing quick and error-free changes to agents, skills, call flows, IVR prompts, and more. | Customer Engagement | ||||
| AvayaLive Connect and AvayaLive Video |
AvayaLive Connect is a low-cost, no-contract suite of collaboration services for small business communications. AvayaLive Video is a conference room in the cloud, based on Avaya Scopia® Video. | Customer Engagement
Team Engagement | ||||
| Collaboratory | Avaya Aura Collaboratory is an Avaya-cloud-based execution and test environment intended for development of non-production, proof-of-concept Collaboration Environment services. | Customer Engagement
Team Engagement |
113
Table of Contents
Avaya Networking
In support of our engagement communications strategy, our networking product portfolio is designed to address and deliver on three key requirements: 1) eliminate network complexity through fabric virtualization; 2) reduce time to service (i.e. application deployment); and 3) ensure the security of the environment. Customers across industry verticals can use our networking technology to benefit from virtualization, integrated provisioning, system management, quality of experience, and improved bandwidth use.
Our networking portfolio is a foundational element for the unified communications and contact center products we deliver in an end-to-end Avaya Aura architecture. We believe that customers today benefit from end-to-end product design, testing, and support that is possible when our networking technology is combined with our Global Communications Services software and hardware under this end-to-end architecture. However, our networking technology allows companies to embrace the value of new technology while using their existing infrastructure, if desired, as they evolve toward a next-generation fabric-enabled infrastructure.
Avaya’s fabric networking technology is called Fabric Connect. It helps customers simplify their network environment and eliminate the need for multi-touch configuration. We believe it provides today’s functional instantiation of software-defined networking. Fabric Connect reduces the multiple protocols necessary in legacy networks to a single, unified technology and is fully compatible with existing Ethernet networks.
In addition to Fabric Connect, our networking portfolio includes:
| • | Ethernet Switches and Routers: a range of Ethernet Switches, Routers, and supporting software for data center, core, edge and branch applications; |
| • | Wireless Networking: cost-effective and scalable products that enable enterprises to support wireless connectivity and services; |
| • | Access Control: products that enforce role- and policy-based access control to the network; and |
| • | Unified Management and Orchestration: products that provide support for data and voice networks by simplifying the requirements associated across functional areas. |
We sell our portfolio of data networking products globally into enterprises and midmarket businesses of all types, with particular strength in healthcare, education, hospitality, financial services and local and state government, where we believe requirements are better met by Fabric Connect.
Avaya Global Services
Avaya Global Services consult, enable, support, manage, optimize and even outsource enterprise communications products (applications and networks) to help customers achieve enhanced business results both directly and through partners. Avaya’s portfolio of services is designed to enable customers to mitigate risk, reduce total cost of ownership, and optimize communication products. Avaya Global Services is supported by patented design and management tools, and by network operations and technical support centers around the world.
Avaya’s Global Services portfolio is divided into Avaya Professional Services and Avaya Client Services.
Avaya Professional Services (APS)
APS helps organizations leverage technologies effectively to meet their business objectives. Our strategic and technical consulting, as well as deployment and customization services, help customers accelerate business performance and deliver an improved customer experience. Whether deploying new products or optimizing existing capabilities, APS leverages its specialists globally across three core areas:
| • | Enablement Services: Provide access to expertise and resources for planning, defining and deploying Avaya products to maximize technology potential, simplify your business processes, increase security, |
114
Table of Contents
| and minimize risk. Avaya integrates and tests equipment, trains employees, and deploys a plan to help ensure success. |
| • | Optimization Services: Help drive increased value and greater business results by leveraging customers’ existing technology. Avaya consultants and product architects analyze a communications environment in the context of customer business priorities and strategies, working to increase customers’ ROI by implementing proven best practices, enabling operational improvements, and stress testing products and services. |
| • | Innovation Services: Help identify improved methods for using communications and collaboration to increase business productivity, employee efficiency and customer service levels. Our consultative approach, deep industry experience, and custom application services, from business planning through to execution and product integration, is designed to create alignment with customer’s specific business objectives. |
Avaya Client Services (ACS)
ACS is a market-leading organization offering support, management and optimization of enterprise communications networks to help customers mitigate risk, reduce TCO and optimize product performance. ACS is supported by patented design and management tools, and by network operations and technical support centers around the world. The contracts for these services range from one to multiple- years, with three year terms being the most common. Custom or complex services contracts are typically five years in length. The portfolio of ACS services includes:
| • | Global Support Services (GSS): Provides a comprehensive suite of support options both directly and through partners to proactively resolve issues and improve uptime. Support offers and capabilities include: |
| • | 24x7 remote support |
| • | proactive remote monitoring |
| • | sophisticated diagnostic tools |
| • | parts replacement |
| • | onsite response |
Recent innovations include our Avaya Support Web site that quickly connects customers to advanced Avaya technicians via live chat, voice or video. The web site also provides access to “Ava,” an interactive virtual chat agent based on Avaya Automated Chat that quickly searches our knowledge base and a wide range of “how-to” videos to answer customer support questions. Ava learns with each customer interaction and can make the decision to transition the chat to an Avaya technician-often without the customer realizing the change is taking place.
All new support solutions are published to the web by our engineers, generally within 30 minutes of finding a resolution, adding value for customers by providing known solutions for potential issues rapidly. Most of our customers also benefit from Avaya EXPERT Systems, which provides real-time monitoring of diagnostic and system status. This to proactively identifies potential issues to improve reliability, uptime, and faster issue resolution.
| • | Avaya Private Cloud and Managed Services (APCS): Provides the IT Infrastructure Library (ITIL), aligned, multivendor managed and outsourcing services for customers’ communications environments. Managed and private cloud services can be procured in standard packages or in fully custom arrangements that include on-premise or private Cloud options, Service Level Agreements (SLAs) billing, and reporting. |
Avaya can manage existing infrastructure of any age and from any communications vendor, and many customers leverage this model as a way to manage complex existing environments while they upgrade
115
Table of Contents
their entire communication network to the latest technology. This provides customers with the option of a recurring operational expense, rather than a one-time capital expenditure, for upgrading to the latest technology. In these types of deals, the underlying solutions and infrastructure are owned by the equipment vendor, or managed services/Cloud provider, and are often included in the managed services pricing/revenue.
In addition, managed services can take the form of one of three Cloud models offered by Avaya:
| • | Avaya Partner Cloud Service, a model that supports public and private products offered by service providers and system integrators; |
| • | Avaya Branded Cloud Service, an Avaya-hosted multi-customer public cloud option; and |
| • | Private Cloud, a private cloud model for individual customers. |
We sometimes refer to the foregoing products and services as “flagship,” “legacy,” and “core” as follows:
| • | Flagship includes products and services which reflect the expertise and innovation in some of the newest enhancements to our product portfolio. We believe these products and services offer the highest potential to contribute to revenue growth. The Flagship category includes Video, Avaya Aura®, IP Office, Contact Center, Wireless LAN, SBC, Ethernet/fabric switching, Avaya professional services, and Avaya Private cloud and managed services. |
| • | Core includes products and services which are foundational components of our technology solutions. The Core category includes certain phone models, gateways, servers, core contact center, and other managed and maintenance support services. |
| • | Legacy includes certain products we acquired in our acquisitions of Tenovis and the enterprise solutions business, or NES, of Nortel Networks Corporation, but does not include NES networking products. |
Our Technology
Technology enhances the way people communicate and collaborate, enabling team and customer engagement. We leverage critical technology and open standards across our portfolio to our customers’ advantage. One of these standards is Session Initiation Protocol (or “SIP”), and Avaya is a leading innovator in leveraging its use for business collaboration. By allowing application flexibility and cost reduction, SIP has become the protocol of choice for real-time communications and will continue to expand in the industry. We distinguish ourselves from competition by exploiting advanced SIP capabilities as opposed to only exploiting basic features. Avaya shifts communications from having to coordinate multiple, independent media and communications systems toward session management based environments, where multiple media and resources can flexibly be brought into a seamless experience. This fundamental difference supports more fluid, effective and persistent collaboration across media such as voice, video and text and modes of communications such as calls or conferences.
To adapt to our customers’ needs in light of the trends described in “Trends Shaping Our Industry” section above, we have shifted our design philosophy over the last few years, anticipating increased demand for our unified communications and contact center products to be available via cloud delivery. While our products have traditionally been deployed on a customer’s premise, many can now also be deployed in public, private and hybrid cloud models. Further, through comprehensive monitoring technologies, these products and services can also be deployed as managed services.
Multimedia Session Management
At the core of our architecture, SIP based Avaya Aura Session Manager centralizes communications control and application integration. Applications are decoupled from the network and can be deployed to individual users based on their need, rather than by where they work or the capabilities of the system to which they are connected.
116
Table of Contents
This allows for extreme scalability, with the Avaya Aura Session Manager currently capable of handling up to 350,000 users per system.
Unique End User Experiences
Avaya one-X Communicator and Avaya one-X Mobile software clients leverage the Avaya Aura technology and allow users to perform all unified communications and conferencing functions, via voice, video and text. In addition, users can access Microsoft Exchange services, such as e-mail, contacts and calendar and exchange instant message and presence information with Microsoft Lync users (i.e., Microsoft Communicator clients).
The Avaya Engagement Development platform is software that abstracts the core Avaya Aura system and allows developers with common web and JAVA programming skills to develop innovative applications that embed communications. For example a customer escalation registered in an insurance claims application could start an Avaya Engagement Development platform workflow that would automatically find and join the customer, the claims adjuster and claims manager via email or SMS and bring them into a video conferencing session. This ability to invoke and combine communications functions allows our customers to generate more business value from their Avaya products.
Management and Orchestration
Simple and consistent management and operations are essential to customers. We believe our management products facilitate efficient operations and better overall performance. They cover a wide range of functions, from initial provisioning to monitoring and orchestration of components to enable networking of communications services.
Advanced Routing and Switching Protocols
Avaya offers routing switches and wireless products that embed advanced protocols such as “shortest path bridging (SPB)” at the forefront of the networking industry. SPB simplifies networking by provisioning services at the edge rather than on every node; as a consequence, administration is simpler and recovery from incidents can be up to 100 times faster than in conventional data networks. As an example, we believe this type of infrastructure is able to support applications such as multicasting large numbers of video streams or network isolation, delivering lower cost and better performance. Our continued investment in this domain contributes to our differentiation in the networking space.
Additional Technologies
In addition to Session Management, we use technologies including:
| • | Messaging and Presence via SIP/SIMPLE and XMPP: The Avaya Aura Presence Services collects, aggregates and disseminates rich presence and enables instant messaging including using SIP/SIMPLE and XMPP, providing interoperability with systems from other vendors, such as Microsoft and IBM; |
| • | Virtualization and Cross Operating System (OS) Support: Our software applications run on a broad range of operating systems including, but not limited to, Microsoft Windows, Apple MAC OS and Google Android. We also support virtualization to not only reduce the physical server footprint using hypervisor technology to run multiple applications concurrently on a single physical platform, but also facilitate certain tasks such as system expansion or recovery. |
| • | High Quality/Low Bandwidth Video: Avaya’s Video products and services are able to deliver high quality video while minimizing bandwidth consumption and responding to adverse network conditions such as congestion or packet loss. We use H.264 High Profile for bandwidth efficiency and cascading media to optimize bandwidth between sites and H.264 Scalable Video Coding, or SVC. |
| • | Virtualization is used in our core Avaya Aura portfolio to decrease the supporting hardware cost and also to enable operations resilience and facilitate scalability. |
117
Table of Contents
| • | WebRTC is a newly evolving technology that Avaya is leveraging to develop a new stage of Unified Communications. WebRTC allows for communication clients to be supported directly from HTML 5 browsers. Voice and video are embedded in web applications, allowing access to these media to be much more ubiquitous. |
| • | Big Data: By leveraging the power of large unstructured data stores, important information streams from multi-vendor systems and customer support infrastructure can be aggregated. This allows Avaya to create a next generation of contact centers, where customer service or sales representative assignment is made based on real-time business insights. |
Alliances and Partnerships
Avaya has formed commercial and partnering arrangements through global alliances to improve the availability of our products and services and the value derived by customers from our products and services. Global alliances are strategically oriented commercial relationships with key partners. We have three primary types of Global alliances: Global Service Provider Alliances, Global Systems Integrator Alliances, and Ecosystem Alliances.
| • | Global Service Provider (SP) alliances are partnering arrangements by Avaya with leading telecommunications service providers for enterprise communications and collaboration. We pursue sell-to and sell-through opportunities for Avaya products and services. These alliances are integral in selling and implementing our cloud-based Communications-as-a-service (CaaS) services. We also see them as a principal route to market for our Unified Collaboration-as-a-service (UCaaS) and Contact Center-as-a-service (CCaaS) solutions. |
| • | Global Systems Integrator (SI) alliances are identical in nature to our Global Service Provider alliances, except that these are forged with system integrator partners. |
| • | Ecosystem alliances are partnering arrangements by Avaya with IT and telecommunications industry leaders to bring to our joint customers solutions that leverage our combined range of products and services. |
As of September 30, 2014, there were approximately 10,800 channel partners that serve our customers worldwide through Avaya Connect, our business partner program. Through the use of certifications, the program positions partners to sell, implement and maintain our communications systems, applications and services. Avaya Connect offers clearly defined partner categories with financial, technical, sales and marketing benefits that grow in parallel with levels of certification. We support partners in the program by providing a portfolio of industry-leading products in addition to sales, marketing and technical support. Although the terms of individual channel partner agreements may deviate from our standard program terms, our standard program agreements for resellers generally provide for a term of one year with automatic renewal for successive one year terms. They may generally be terminated by either party for convenience upon 30 days prior notice, and our standard program agreements for distributors may generally be terminated by either party for convenience upon 90 days prior notice. Certain of our contractual agreements with our largest distributors and resellers, however, permit termination of the relationship by either party for convenience upon prior notice of 180 days. Our partner agreements generally provide for responsibilities, conduct, order and delivery, pricing and payment, and include customary indemnification, warranty and other similar provisions. No single channel partner represented more than 10% of our revenue for fiscal 2014, 2013 or 2012.
Development Partnerships
The Avaya DevConnect program is designed to promote the development, compliance-testing and co-marketing of innovative third-party products that are compatible with Avaya’s standards-based products. Member organizations have expertise in a broad range of technologies, including IP telephony, contact center and unified communications applications.
As of September 30, 2014, more than 24,000 companies have registered with the program, including more than 420 companies operating as Technology Partners that are eligible to submit their products or services for
118
Table of Contents
compatibility testing by the Avaya Solution Interoperability and Test Lab. Avaya Test Lab engineers work in concert with each submitting member company to develop comprehensive test plans for each application to validate the product integrations.
Customers, Sales, and Distribution
Customers
We have a diverse customer base, ranging in size from small businesses employing a few employees to large government agencies and multinational companies with over 100,000 employees. Through of September 30, 2014, we had over 300,000 customers, including over 95% of the Fortune 500 with installations in over one million customer locations worldwide. Our customers operate in a broad range of industries, including financial services, manufacturing, retail, transportation, energy, media and communications, health care, education and government. They represent leading companies from the Forbes Global 2000 including at least 8 of the world’s top 10 from industries such as airlines, auto & tuck manufacturers, hotels & motels, major banks, and investment services firms. We employ a flexible go-to-market strategy with direct or indirect presence in over 160 countries. As of September 30, 2014, we had approximately 10,800 channel partners and for fiscal 2014, our product revenue from indirect sales represented approximately 75% of our total product revenue.
Sales and Distribution
Our global go-to-market strategy is designed to focus and strengthen our reach and impact on large multinational enterprises, midmarket and more regional enterprises and small businesses. Our go-to-market strategy is to serve our customers the way they prefer to work with us, either directly with Avaya or through our indirect sales channel, which includes our global network of alliance partners, distributors, dealers, value-added resellers, telecommunications service providers and system integrators. Our sales organizations are equipped with a broad product and software portfolio, complemented with services offerings including product support, integration and professional and managed services.
The Avaya sales organization is globally deployed with direct or indirect (e.g., channel partner) presence in over 160 countries. We continue to focus on efficient deployment of Avaya sales resources, both directly and indirectly, for maximum market penetration and global growth. Our investment in our sales organization includes training curricula to support the evolution of our sales strategy. The program includes sales process, skills and solutions curricula for all roles within our sales organization.
Research and Development
We make substantial investments in research and development to develop new systems, services and software in support of business collaboration, including, but not limited to, converged communications systems, communications applications, multimedia contact center innovations, collaboration tools, messaging applications, video, speech enabled applications, business infrastructure and architectures, converged mobility systems, cloud offerings, web services, communications-enabled business processes and applications, data networks and services for our customers.
We invested $379 million, $445 million and $464 million in fiscal 2014, 2013 and 2012, respectively, on research and development. Customer-sponsored research and development activities that we have conducted have not been material.
Manufacturing and Suppliers
We have outsourced substantially all of our manufacturing operations to several contract manufacturers. Our contract manufacturers produce the vast majority of our products in facilities located in southern China, with other products manufactured in facilities located in Israel, Mexico, Malaysia, Taiwan, United Kingdom, Ireland
119
Table of Contents
and the U.S. All manufacturing of our products is performed in accordance with detailed specifications and product designs, furnished or approved by Avaya and, is subject to rigorous quality control standards. We periodically review our product manufacturing operations and consider changes we believe may be necessary or appropriate. We also purchase certain hardware components and license certain software components from third-party original equipment manufacturers or OEMs and resell them separately or as part of our products under the Avaya brand.
In some cases, certain components are available only from a single source or from a limited source of suppliers. Delays or shortages associated with these components could cause significant disruption to our operations. We have also outsourced substantially all of our warehousing and distribution logistics operations to several providers of such services on a global basis, and any delays or material changes in such services could cause significant disruption to our operations. For more information on risks related to products, components and logistics, see “Risk Factors-Risks Associated with our Company.”
As our business and operations related relationships have expanded globally, certain operational and logistical challenges as well as changes in economic or political conditions and natural disasters, in a specific country or region, could negatively affect our revenue, costs, expenses and financial condition or those of our channel partners and distributors.
Competition
As a provider of team and customer engagement solutions - made up of unified communications and real-time collaboration products, call center applications, networking technologies and services-we believe we are differentiated from any single competitor.
For the sale of unified communications products and services specifically, in the enterprise segment we compete with companies such as Cisco Systems, Inc. (Cisco), Microsoft Corporation, NEC Corporation, Unify GmbH & Co. Kg (Unify), Alcatel-Lucent, and Huawei Technologies Co., Ltd (Huawei). In the midmarket we compete with companies such as ShoreTel, Inc., and Mitel Networks Corp. (Mitel). In cloud products and services we compete with companies such as Cisco, Broadsoft Inc., Microsoft Corpration, 8x8, Inc., RingCentral Inc., and ShoreTel, Inc. Our video products and services compete with companies such as Cisco, Polycom Inc., and LifeSize (now a division of Logitech International S.A.).
Our contact center products and services compete with companies such as Genesys Telecommunications Laboratories, Inc. (Genesys), Cisco, Huawei, and Mitel in the enterprise segment. In the midmarket, as well as cloud products and services, we compete with companies such as Cisco, Genesys and Interactive Intelligence, Inc.
Our networking products and services compete with companies such as Cisco, Hewlett-Packard Company (HP), Huawei, Dell, Inc., and Juniper Networks, Inc., in each case primarily with respect to Level 2/Level 3 Ethernet switching.
We face competition in certain geographies with companies that have a particular strength and focus in these regions, such as Huawei in China, Intelbras S.A. in Latin America, and Matsushita Electric Corporation of America (Panasonic), in Asia.
While we believe our global, in-house end-to-end services organization provides us with a competitive advantage, it faces competition from companies like those above offering services, either directly or indirectly through their channel partners, with respect to their own product offerings, as well as many value-added resellers, consulting and systems integration firms and network service providers.
120
Table of Contents
Technological developments and consolidation within the industry, as well as changes in the products and services that we offer, result in frequent changes to our group of competitors. The principal competitive factors applicable to our products and services include:
| • | perceived and real value of the products and services as paths to solving meaningful team and customer engagement challenges; |
| • | perceived and real ability to integrate various products into a customer’s existing environment, including the ability of a provider’s products to interoperate with other providers’ business collaboration products; |
| • | the ability to offer on-premise or cloud products and services, with all services available via mobile; |
| • | product features, performance and reliability; |
| • | customer service and technical support; |
| • | relationships with distributors, value-added resellers and systems integrators; |
| • | an installed base of similar or related products; |
| • | relationships with buyers and decision makers; |
| • | price; |
| • | the relative financial condition of competitors; |
| • | brand recognition; |
| • | the ability to be among the first to introduce new products and services. |
For more information on risks related to our competition, see “Risk Factors-Risks Associated with Our Company.”
Patents, Trademarks and Other Intellectual Property
We own a significant number of patents important to our business and we expect to continue to file new applications to protect our research and development investments in new products and services across all areas of the business. As of September 30, 2014, we had approximately 5,400 patents and pending patent applications, including foreign counterpart patents and foreign applications. Our patents and pending patent applications cover a wide range of products and services involving a variety of technologies, including, but not limited to, unified communications (including video, social media, telephony and messaging), contact centers, wireless communications and networking. The durations of our patents are determined by the laws of the country of issuance. For the U.S., patents may be 17 years from the date of issuance of the patent or 20 years from the date of its filing, depending upon when the patent application was filed. In addition, we hold numerous trademarks, both in the U.S. and in other countries. We also have licenses to intellectual property for the manufacture, use and sale of our products.
We will obtain patents and other intellectual property rights used in connection with our business when practicable and appropriate. Historically, we have done so organically or through commercial relationships as well as in connection with acquisitions.
Our intellectual property policy is to protect our products, technology and processes by asserting our intellectual property rights where appropriate and prudent. From time to time, assertions of infringement of certain patents or other intellectual property rights of others have been made against us. In addition, certain pending claims are in various stages of litigation. Based on industry practice, we believe that any licenses or other rights that might be necessary for us to continue with our current business could be obtained on commercially reasonable terms. However, we cannot be sure that any of those licenses or other rights will always be available on acceptable terms or that litigation will not occur. The failure to obtain necessary licenses or other rights, or litigation arising out of such claims, could adversely affect our business.
121
Table of Contents
We are dependent on our intellectual property. If we are not able to protect our proprietary rights or if those rights are invalidated or circumvented, our business may be adversely affected. We may be subject to litigation and infringement claims, which could cause us to incur significant expenses or prevent us from selling our products or services. For more information concerning the risks related to patents, trademarks, and other intellectual property, please see “Risk Factors-Risks Associated with our Company.”
Backlog
Our backlog for product sales generated (the aggregate of the sales price of orders received from customers, but not yet recognized as revenue) was $118 million, $145 million and $149 million on September 30, 2014, 2013 and 2012, respectively. These orders are expected to be recognized as revenue within the next 90 days; however, all orders are subject to possible rescheduling by customers. Our backlog for product sales is inclusive of software orders but does not include any expected revenues from our APCS and other services businesses. Although we believe that the orders included in the backlog are firm, some orders may be canceled by the customer without penalty, and we may elect to permit cancellation of orders without penalty where management believes it is in our best interests to do so. We do not believe that our backlog, as of any particular date, is necessarily indicative of actual net sales for any future period.
Employees
As of September 30, 2014, we employed 13,122 employees, of which 13,007 were full-time employees (12,300 were non-represented employees and 707 were represented employees covered by collective bargaining agreements) and 115 were part-time non-represented employees. Of the 707 full-time employees covered by collective bargaining agreements as of September 30, 2014, 635 were in the United States, 58 were located in the CALA region and 14 were located in Canada.
Effective November 25, 2013 and January 31, 2014, the Company entered into a two-year contract extension with the Communications Workers of America and the International Brotherhood of Electrical Workers, respectively. With the extensions, the contract with each now terminates on June 13, 2016.
Environmental, Health and Safety Matters
We are subject to a wide range of governmental requirements relating to safety, health and environmental protection, including:
| • | certain provisions of environmental laws governing the cleanup of soil and groundwater contamination; |
| • | various local, federal and international laws and regulations regarding the material content and electrical design of our products that require us to be financially responsible for the collection, treatment, recycling and disposal of those products; and |
| • | various employee safety and health regulations that are imposed in various countries within which we operate. |
For example, we are currently involved in several remediations at currently or formerly owned or leased sites, which we do not believe will have a material impact on our business or results of operations. Please see “Risk Factors-Risks Associated with Our Company-We may be adversely affected by environmental, health and safety, laws, regulations, costs and other liabilities” for a discussion of the potential impact such governmental requirements and climate change risks may have on our business.
Corporate Responsibility at Avaya
Avaya’s Corporate Responsibility Program incorporates four key elements: Environment, Community, Marketplace and Workplace. For the Environment element, Avaya looks to implement environmental
122
Table of Contents
stewardship practices at our global locations. The element of Community represents Avaya working to positively impact society as a whole and supporting the communities where we are located. The Marketplace element includes engaging in fair and ethical business dealings with our customers, our partners and our supply chain. The Workplace element focuses on developing a desirable place to work for our employees across the globe.
Properties
As of September 30, 2014, we had 192 leased facilities (which included 15 storage locations containing between 100 to 400 square feet) and 2 owned facilities, located in 56 countries. These included 13 primary research and development facilities located in Canada, China, Germany, India, Ireland, Israel, Italy and the U.S. Our real property portfolio consists of aggregate floor space of 4.8 million square feet, substantially all of which is leased. Of the 4.8 million square feet of leased space, 1.1 million square feet is related to property for which the future minimum lease payments have been accrued for in accordance with accounting principles generally accepted in the United States of America pertaining to restructuring and exit activities. Our lease terms range from monthly leases to 12 years. We believe that all of our facilities are in good condition and are well maintained. Our facilities are used for current operations of all operating segments. For additional information regarding obligations under operating leases, see Note 21, “Commitments and Contingencies,” to our audited Consolidated Financial Statements included elsewhere in this prospectus.
Legal Proceedings
In the ordinary course of business, the Company is involved in litigation, claims, government inquiries, investigations and proceedings, including, but not limited to, those identified below, relating to intellectual property, commercial, employment, environmental and regulatory matters.
The Company believes that it has meritorious defenses in connection with its current lawsuits and material claims and disputes, and intends to vigorously contest each of them.
Based on the Company’s experience, management believes that the damages amounts claimed in a case are not a meaningful indicator of the potential liability. Claims, suits, investigations and proceedings are inherently uncertain and it is not possible to predict the ultimate outcome of cases.
Other than as described below, in the opinion of the Company’s management based upon information currently available to the Company, while the outcome of these lawsuits, claims and disputes is uncertain, the likely results of these lawsuits, claims and disputes are not expected, either individually or in the aggregate, to have a material adverse effect on the Company’s financial position, results of operations or cash flows, although the effect could be material to the Company’s results of operations or cash flows for any interim reporting period.
Antitrust Litigation
In 2006, the Company instituted an action in the U.S. District Court, District of New Jersey, against defendants Telecom Labs, Inc., TeamTLI.com Corp. and Continuant Technologies, Inc. (“TLI/Continuant”) and subsequently amended its complaint to include certain individual officers of these companies as defendants. Defendants purportedly provide maintenance services to customers who have purchased or leased the Company’s communications equipment. The Company asserted in its amended complaint that, among other things, defendants, or each of them, engaged in tortious conduct by improperly accessing and utilizing the Company’s proprietary software, including passwords, logins and maintenance service permissions, to perform certain maintenance services on the Company’s customers’ equipment. TLI/Continuant filed counterclaims against the Company alleging that the Company has violated the Sherman Act’s prohibitions against anticompetitive conduct through the manner in which the Company sells its products and services. TLI/Continuant sought to recover the profits they claim they would have earned from maintaining Avaya’s products, and asked for injunctive relief prohibiting the conduct they claim is anticompetitive.
123
Table of Contents
The trial commenced on September 9, 2013. On January 8, 2014, the Court issued an opinion dismissing the Company’s affirmative claims. With respect to TLI/Continuant’s counterclaims, on March 27, 2014, a jury found against the Company on two of eight claims and awarded damages of $20 million. Under the federal antitrust laws, the jury’s award is subject to automatic trebling, or $60 million.
Following the jury verdict, TLI/Continuant sought an injunction regarding the Company’s ongoing business operations. On June 30, 2014, a federal judge rejected the demands of TLI/Continuant’s proposed injunction and stated that “only a narrow injunction is appropriate.” Instead, the judge issued an order relating to customers who purchased an Avaya PBX system between January 1, 1990 and April 30, 2008 only. Those customers and their agents will have free access to the on demand maintenance commands that were installed on their systems at the time of the purchase transaction. The Company has six months from the date of the injunction to enable such access. The court specified that this right “does not extend to access on a system purchased after April 30, 2008.” Consequently, the injunction affects only systems sold more than six years ago. The judge denied all other requests TLI/Continuant made in its injunction filing.
The Company and TLI/Continuant filed post-trial motions seeking to overturn the jury’s verdict, which motions were denied. In September 2014, the Court entered judgment in the amount of $63 million, which included the jury’s award of $20 million, subject to automatic trebling, or $60 million, plus prejudgment interest in the amount of $3 million. On October 10, 2014, the Company filed a Notice of Appeal, and on October 23, 2014, TLI/Continuant filed a Notice of Conditional Cross-Appeal. On October 23, 2014, the Company filed its supersedeas bond with the Court in the amount of $63 million, which includes an amount for post-judgment interest and stays execution of the judgment while the matter is on appeal. The Company secured posting of the bond through the issuance of a letter of credit under its existing credit facilities. On November 10, 2014, TLI/Continuant made an application for attorneys’ fees, expenses and costs, seeking approximately $60 million, which the Company intends to contest. Once required, and in order to stay the enforcement of any award for attorney’s fees, expenses and costs, on appeal or otherwise, the Company will post a bond in the amount of the award for attorney’s fees, expenses and costs, plus interest. The Company expects to secure posting of the bond through existing resources and may use any or a combination of the issuance of one or more letters of credit under its existing credit facilities and cash on hand.
The Company continues to believe that TLI/Continuant’s claims are without merit and unsupported by the facts and law, and the Company intends to defend this matter, including by filing its appeal to the United States Court of Appeals for the Third Circuit. No loss reserve has been provided for this matter.
In the event TLI/Continuant ultimately succeed in subsequent appeals, any potential loss could be material. At this time an outcome cannot be predicted and, as a result, the Company cannot be assured that this case will not have a material adverse effect on the manner in which it does business, its financial position, results of operations, or cash flows.
Intellectual Property
In the ordinary course of business, the Company is involved in litigation alleging it has infringed upon third parties’ intellectual property rights, including patents; some litigation may involve claims for infringement against customers by third parties relating to the use of Avaya’s products, as to which the Company may provide indemnifications of varying scope to certain customers. These matters are on-going and the outcomes are subject to inherent uncertainties. As a result, the Company cannot be assured that any such matter will not have a material adverse effect on its financial position, results of operations or cash flows.
Other
In October 2009, a group of former employees of Avaya’s former Shreveport, Louisiana manufacturing facility brought suit in Louisiana state court, naming as defendants Alcatel-Lucent USA, Inc., Lucent Technologies Services Company, Inc., and AT&T Technologies, Inc. The former employees allege hearing loss
124
Table of Contents
due to hazardous noise exposure from the facility dating back over forty years, and stipulate that the total amount of each individual’s damages does not exceed $50,000. In February 2010 plaintiffs amended their complaint to add the Company as a named defendant. There are 101 plaintiffs in the case. Defendants’ motion to dismiss plaintiffs’ complaint was denied on April 30, 2012. At this time an outcome cannot be predicted however, because the amounts of the claims individually and in the aggregate are not material, the Company believes the outcome of this matter will not have a material adverse effect on the manner in which it does business, its financial position, results of operations, or cash flows.
General
The Company records accruals for legal contingencies to the extent that it has concluded it is probable that a liability has been incurred and the amount of the loss can be reasonably estimated. No estimate of the possible loss or range of loss in excess of amounts accrued, if any, can be made at this time regarding the matters specifically described above because the inherently unpredictable nature of legal proceedings may be exacerbated by various factors, including: (i) the damages sought in the proceedings are unsubstantiated or indeterminate; (ii) discovery is not complete; (iii) the proceeding is in its early stages; (iv) the matters present legal uncertainties; (v) there are significant facts in dispute; (vi) there are a large number of parties (including where it is uncertain how much liability, if any, will be shared among multiple defendants); or (vii) there is a wide range of potential outcomes.
125
Table of Contents
MARKET, RANKING AND OTHER INDUSTRY DATA
This prospectus includes industry and trade association data, forecasts and information that we have prepared based, in part, upon data, forecasts and information obtained from independent trade associations, industry publications and surveys and other information available to us. Some data is also based on our good faith estimates, which are derived from management’s knowledge of the industry and independent sources. Industry publications and surveys and forecasts generally state that the information contained therein has been obtained from sources believed to be reliable. We have not independently verified any of the data from third-party sources nor have we ascertained the underlying economic assumptions relied upon therein. Statements as to our market position are based on market data currently available to us. Our estimates involve risks and uncertainties and are subject to change based on various factors, including those discussed under the heading “Risk Factors” in this prospectus.
126
Table of Contents
Executive Officers and Directors
The following table sets forth the name, age and position of each of our executive officers and directors as of November 1, 2014:
| Name |
Age | Position | ||||
| Pierre-Paul Allard |
55 | Senior Vice President, Worldwide Sales and President Global Field Operations | ||||
| Gary E. Barnett |
61 | Senior Vice President and General Manager, Avaya Collaboration | ||||
| James M. Chirico, Jr. |
56 | Executive Vice President, Business Operations | ||||
| Andy Cunningham |
58 | Chief Marketing Officer* | ||||
| Fariborz Ebrahimi |
53 | Senior Vice President and Chief Information Officer | ||||
| Amy Fliegelman Olli |
50 | Senior Vice President and General Counsel | ||||
| Roger C. Gaston |
58 | Senior Vice President, Human Resources | ||||
| Jaroslaw S. Glembocki |
58 | Senior Vice President, Quality Program Office | ||||
| Kevin J. Kennedy |
59 | Director, President and Chief Executive Officer | ||||
| Laurent Philonenko |
55 | Senior Vice President, Corporate Strategy, Development and Technology | ||||
| Marc J. Randall |
53 | Senior Vice President and General Manager, Avaya Networking | ||||
| Michael M. Runda |
58 | Senior Vice President and President, Avaya Client Services | ||||
| David Vellequette |
58 | Senior Vice President and Chief Financial Officer | ||||
| Directors |
||||||
| Charles H. Giancarlo |
56 | Chairman of the Board of Directors | ||||
| Mary Henry |
55 | Director | ||||
| John W. Marren |
51 | Director | ||||
| Afshin Mohebbi |
51 | Director | ||||
| Greg K. Mondre |
40 | Director | ||||
| Kiran Patel |
66 | Director | ||||
| Ronald Rittenmeyer |
67 | Director | ||||
| Gary B. Smith |
53 | Director | ||||
| * | Consultant |
Pierre-Paul Allard, Senior Vice President, Worldwide Sales and President, Global Field Operations
Mr. Allard has been our Senior Vice President, Worldwide Sales and President, Global Field Operations since July 2013. He served as Senior Vice President, Corporate Strategy and Development since May 7, 2012. Previously, he spent 19 years at Cisco Systems, Inc., or Cisco, a provider of communications and networking products and services. Most recently, from August 2003 until February 2012, he served as Vice President, Sales and Operations, Global Enterprise at Cisco. Prior to joining Cisco, he spent 12 years at International Business Machines Corporation, or IBM, a global provider of information technology products and services. Since September 2008, Mr. Allard has served on the Board of Directors of EXFO Inc., a provider of next-generation test and service assurance solutions for wireless and wireline network operators and equipment manufacturers in the global telecommunications industry.
127
Table of Contents
Gary E. Barnett, Senior Vice President and General Manager, Avaya Collaboration
Mr. Barnett has been our Senior Vice President and General Manager, Avaya Collaboration since December 20, 2011. Prior to that time, from August 2011 until December 2011, he served as our Vice President and General Manager of UC Applications, and from April 2011 until August 2011, he served as our Vice President of CC Applications. Previously, from October 2005 until April 2011, he served as Executive Vice President and Chief Technology Officer of Aspect Software, Inc., a provider of unified communications and contact center software and services.
James M. Chirico, Jr., Executive Vice President, Business Operations
Mr. Chirico has been our Executive Vice President, Business Operations since June 14, 2010. Previously, from February 3, 2009 until June 14, 2010, he served as our Chief Restructure Officer and President, Operations. From January 2, 2008 until February 3, 2009, he served as our Senior Vice President and President, Operations. Prior to that time, from February 1998 to November 2007, Mr. Chirico held various senior management positions at Seagate Technology, a designer, manufacturer and marketer of hard disc drives, including Executive Vice President, Global Disc Storage Operations, from February 2006 until November 2007, and Senior Vice President and General Manager, Asia Operations, from September 2000 to February 2006.
Andy Cunningham, Chief Marketing Officer
Ms. Cunningham has been serving as our Chief Marketing Officer since May 2014. Ms. Cunningham is the president of SeriesC, a brand strategy firm dedicated to bringing innovation to market, a company that she founded in 2012. She is an Aspen Institute Henry Crown Fellow and holds memberships in Chief Executive Organization, Technology, Entertainment, Design, Women Corporate Directors and World President’s Organization.
Fariborz Ebrahimi, Senior Vice President and Chief Information Officer
Mr. Ebrahimi has been our Senior Vice President and Chief Information Officer since February 18, 2013. Previously, he was employed by Verizon Communications Inc., a leading provider of communications, information and entertainment products and services to consumers, businesses and governmental agencies. From January 2006 until December 2012 he served as Senior Vice President and CIO for Corporate Network and Technology which included Verizon’s Wireline network as well as Verizon Shared Services Operations (VSO) which included the finance operations, real estate and supply chain services supporting all Verizon companies.
Amy Fliegelman Olli, Senior Vice President and General Counsel
Mrs. Fliegelman Olli has been our Senior Vice President and General Counsel since June 2014. Previously, she was the General Counsel of CA Technologies, Inc. from September 2006 to June 2014 where she held a similar position of responsibility covering all legal, governance, compliance, internal audit, security, risk management and controls. Mrs. Fliegelman Olli also spent 18 years with IBM Corporation, ultimately serving as Vice President and General Counsel for the Americas and Europe.
Roger C. Gaston, Senior Vice President, Human Resources
Mr. Gaston has been our Senior Vice President, Human Resources since May 2006. In his role, Mr. Gaston is responsible for employee compensation and benefits, employee communications, workforce relations, organizational development and transformation, recruitment, talent management and labor relations.
128
Table of Contents
Jaroslaw S. Glembocki, Senior Vice President, Quality Program Office
Mr. Glembocki has served as our Senior Vice President, Quality Program Office since November 7, 2011. Previously he served as Chief Operating Officer of Solexant Corp., a developer of third-generation ultrathin-film PV technology, from March 2011 until October 2011. From June 2009 until March 2011, Mr. Glembocki was engaged in various consulting projects. Prior to that, Mr. Glembocki served as Senior Vice President of Recording Heads and Media Operations at Seagate Technology HDD Holdings, a designer, manufacturer and marketer of hard disc drives, from October 2000 until May 2009.
Laurent Philonenko, Senior Vice President, Corporate Strategy, Development and Technology
Mr. Philonenko has been our Senior Vice President, Corporate Strategy, Development and Technology since November 2014. He served as Vice President, Corporate Development and Strategy since November 2013. Prior to joining Avaya, Laurent served as Chief Technology Officer for Cisco’s Collaboration Technology Group from November 2012 to October 2013 and he was a Vice President and General Manager of three business units at Cisco from June 2004 to November 2012. He also served as the COO of Genesys Telecommunications Laboratories from July 2002 to December 2003 and CEO from December 2003 to May 2004. Mr. Philonenko is graduate of Ecole Polytechnique in Paris and earned his master’s degree in Management Science from Paris University.
Kevin J. Kennedy, Director, President and Chief Executive Officer
Mr. Kennedy has been our President and Chief Executive Officer and a member of our Board of Directors since December 22, 2008. Previously, from September 2003 until December 2008, he served as Chief Executive Officer of JDS Uniphase Corporation, or JDSU, a provider of optical communications products, and from March 2004 until December 2008, he also served as President of JDSU. He was a member of JDSU’s Board of Directors from November 2001 until August 2012 and served as Vice Chairman of their Board of Directors from December 2008 until August 2012. Mr. Kennedy is also on the Board of Directors of KLA-Tencor Corporation, a supplier of process control and yield management solutions for the semiconductor industry. Mr. Kennedy served on the Boards of Directors of Rambus Inc., a developer of a high-speed chip-to-chip interface technology, from April 2003 until July 2008 and Polycom Inc., a provider of telepresence, voice and video conferencing solutions, from May 2008 until January 2009. Mr. Kennedy was selected to serve as a director in light of his role as Chief Executive Officer, the management perspective he brings to board deliberations, his extensive management experience and his experience on multiple public company boards. Mr. Kennedy is also currently a Presidential Advisory Member of the National Security Telecommunications Advisory Committee.
Marc J. Randall, Senior Vice President and General Manager, Avaya Networking
Mr. Randall has been our Senior Vice President and General Manager, Avaya Networking since December 20, 2011. From January 31, 2011 until December 16, 2011, he served as Vice President and General Manager of Cisco Systems, Inc., a provider of communications and networking products and services. Previously, from 2008 to 2010, he served as Senior Vice President of Products and Offerings of Brocade, Inc., a provider of network solutions. Prior to that time, from 2003 until 2008, he served as President, CEO and a Director of Force10 Networks, a provider of data center networking.
Michael M. Runda, Senior Vice President and President, Avaya Client Services
Mr. Runda has been our Senior Vice President and President, Avaya Client Services since May 2012. From October 2011 until May 2012, he served as our Vice President, Global Support Services. Prior to that time, from 2010 until 2011, he served as Chief Executive Officer of KCS Academy, where he was responsible for the startup of the KCS Academy, a subsidiary of the Consortium for Service Innovation. The Academy developed and delivered executive legal and technical support and consulting practices. From 2006 until 2010, he served as the Vice President of Global Support for Intuit Corporation. From 2004 until 2010, he served in various positions on the Board of Directors for the Consortium for Service Innovation.
129
Table of Contents
David Vellequette, Senior Vice President, Chief Financial Officer
Mr. Vellequette has been our Senior Vice President, Chief Financial Officer since October 1, 2012. Previously, he served as Executive Vice President and Chief Financial Officer, a position he held from June 2005 until August 2012, of JDS Uniphase Corporation, or JDSU, a provider of optical communications products. He joined JDSU as Vice President and Operations Controller in July 2004. Since January 2007.
Charles H. Giancarlo, Chairman of the Board of Directors
Mr. Giancarlo has been a member of our Board of Directors since June 30, 2008 and has been our Chairman of the Board of Directors since December 22, 2008. He served as our President and Chief Executive Officer from June 30, 2008 until December 22, 2008. Mr. Giancarlo has been a Senior Advisor of Silver Lake since January 2014 and previously was Managing Director of Silver Lake since 2007. Mr. Giancarlo is also on the Boards of Directors of Accenture plc, a management consulting business, Arista Networks, Inc., a data center switching company, ServiceNow, an enterprise IT cloud company, Imperva, Inc., a data security company, and various private companies. He served on the Board of Directors of Netflix, Inc., an online movie rental subscription service, from April 2007 until May 2012. Mr. Giancarlo’s related industry experience, experience in financial matters, service as an executive officer and director of other companies, prior service as our Chief Executive Officer, experience in working with companies controlled by private equity sponsors, and affiliation with Silver Lake, which has the right to select three of our directors, led to the conclusion that he should serve as a director of our Company.
Mary Henry, Director
Ms. Henry has been a member of our Board of Directors since July 1, 2014. Ms. Henry was a partner and managing director of Goldman Sachs, employed there from August 1986 to November 2004, primarily in the firm’s Investment Research Division. Ms. Henry is also on the boards of directors of various private companies. Ms. Henry’s experience with public companies, finance matters and her independence from the Company led to the conclusion that she should serve as a director of the Company.
John W. Marren, Director
Mr. Marren has been a member of our Board of Directors since August 24, 2012 and he previously served as a member of our Board of Directors from October 26, 2007 to April 15, 2011. Mr. Marren joined TPG Capital in 2000 as Partner and leads TPG’s technology team. Mr. Marren served as Chairman of the Board of MEMC Electronic Materials, Inc., a provider in the semiconductor and solar industries from 2001 to 2012. Mr. Marren’s related industry experience in working with companies controlled by private equity sponsors, and affiliation with TPG, which has the right to select three of our directors, led to the conclusion that he should serve as a director our Company.
Afshin Mohebbi, Director
Mr. Mohebbi has been a member of our Board of Directors since April 2011. Mr. Mohebbi has been a Senior Advisor to TPG since 2004. Previously, Mr. Mohebbi held various executive positions at Qwest Communications International Inc., British Telecom Plc., SBC Communications Inc. and Pacific Telesis Group. Mr. Mohebbi currently serves on boards of directors of DISH Network Corporation as well as a number of private companies. Mr. Mohebbi’s related industry experience, service as an executive officer and director of other companies, experience in working with companies controlled by private equity sponsors, and affiliation with TPG, which has the right to select three of our directors, led to the conclusion that he should serve as a director our Company.
130
Table of Contents
Greg K. Mondre, Director
Mr. Mondre has been a member of our Board of Directors since October 26, 2007. Mr. Mondre has been a Managing Partner of Silver Lake since 2012 and a Managing Director of Silver Lake since 2005. Prior to joining Silver Lake in 1999, he was a principal at TPG and an investment banker at Goldman, Sachs & Co., a global investment banking and securities firm. Mr. Mondre is on the board of directors of Sabre Corporation, a technology solutions provider to the global travel industry. Mr. Mondre is also on the boards of directors of various private companies. Mr. Mondre’s experience in financial matters, service as a director of other companies, experience in working with companies controlled by private equity sponsors and affiliation with Silver Lake, which has the right to select three of our directors, led to the conclusion that he should serve as a director of our Company.
Kiran Patel, Director
Kiran Patel has been a member of our Board of Directors since October 1, 2013. Mr. Patel served as Executive Vice President and General Manager, Small Business Group of Intuit, a provider of financial software solutions for consumers and small businesses, from December 2008 to September 2013. He was Senior Vice President and General Manager, Consumer Tax Group from June 2007 to December 2008 and Chief Financial Officer from September 2005 to January 2008. Mr. Patel also serves on the Board of Directors of KLA-Tencor Corporation and is a trustee of The Charles Schwab Family of Funds. Mr. Patel’s experience as a Chief Financial Officer and independence from the Company led to the conclusion that he should serve as a director of the Company.
Ronald Rittenmeyer, Director
Ronald Rittenmeyer has been a member of our Board of Directors since October 1, 2013. Mr. Rittenmeyer is the former Chairman, President and Chief Executive Officer of Expert Global Solutions, Inc. (formerly known as NCO Group, Inc.), a global provider of business process outsourcing services, serving from 2011 to June 2014. Mr. Rittenmeyer is also the former Chairman, Chief Executive Officer and President of Electronic Data Systems Corporation, serving from 2005 to 2008. Mr. Rittenmeyer is currently a director of American International Group, Inc., Tenet Healthcare Corporation and IMS Health, Inc. Mr. Rittenmeyer’s service as an executive officer and director of other companies and affiliation with TPG, which has the right to select three of our directors, led to the conclusion that he should serve as a director of our Company.
Gary B. Smith, Director
Mr. Smith has been a Director of the Company since December 6, 2011. Mr. Smith currently serves as President, Chief Executive Officer and Director of Ciena Corporation, or Ciena, a network infrastructure company. Mr. Smith began serving as Chief Executive Officer of Ciena in May 2001, in addition to his existing responsibilities as president and director, positions he has held since October 2000. Mr. Smith also serves on the Board of Directors of CommVault Systems, Inc., a provider of data and information management software applications and related services, a position he has held since May 2004. Mr. Smith’s nearly 30 years of experience in the global telecommunications industry, and independence from the Company, led to the conclusion that he should serve as a director of the Company.
Board Composition and Director Independence
Our business and affairs are managed under the direction of the board of directors. Our board of directors is currently composed of nine directors: Mr. Kennedy, two representatives from Silver Lake, three representatives from TPG and three non-affiliated directors. Each of Messrs. Smith and Patel and Ms. Henry is a non-affiliated director, and each has been determined by the Board to meet the independence rules of the New York Stock Exchange and Rule 10A-3 under the Exchange Act.
131
Table of Contents
Under our certificate of incorporation that will be in effect upon the completion of this offering, until such time as the Sponsors collectively cease to beneficially own at least 40% or more of our outstanding common stock (such time referred to in this section as the “triggering event”), the number of directors shall be no fewer than three and no more than fifteen. At each annual meeting of stockholders, the directors will be elected to serve until the earlier of their death, resignation or removal, or until their successors have been elected and qualified. Vacancies and newly-created directorships on the board may be filled by the remaining directors, and until the triggering event, vacancies on the board may also be filled by holders of a majority of the outstanding shares of common stock.
Currently, each director is elected for a one-year term. Our certificate of incorporation that will become effective upon the closing of this offering provides that at the first annual meeting after the triggering event, the board shall be divided into three classes with staggered three-year terms.
Prior to the triggering event, directors may be removed with or without cause by holders of a majority of the outstanding shares of common stock. Following the triggering event, our directors may be removed only for cause by the affirmative vote of the holders of at least two-thirds of the voting power of our outstanding shares of capital stock entitled to vote generally in the election of directors, voting together as a single class.
A stockholders’ agreement between us and our current shareholders contains an agreement among the parties pursuant to which each of the Sponsors, in its sole discretion, designates three of the current directors. In connection with the consummation of this offering, certain of the provisions in the stockholders’ agreement are likely to be amended or terminated. In addition, Mr. Kennedy’s employment agreement provides that, for so long as he is the Company’s Chief Executive Officer, our Sponsors shall ensure that their affiliates vote to elect him as a member of our board of directors.
Following the completion of this offering, we expect to be a “controlled company” under the rules of the New York Stock Exchange because more than 50% of our outstanding voting power will be held by the Sponsors. See “Principal Stockholders.” We intend to rely upon the “controlled company” exception relating to the board of directors and committee independence requirements under the rules of the New York Stock Exchange. Pursuant to this exception, we will be exempt from the rules that would otherwise require that our board of directors consist of a majority of independent directors and that our compensation committee and nominating and governance committee be composed entirely of independent directors. The “controlled company” exception does not modify the independence requirements for the audit committee, and we intend to comply with the requirements of the Exchange Act and the rules of the New York Stock Exchange, which require that our audit committee have at least one independent director upon consummation of this offering, consist of a majority of independent directors within 90 days following the effective date of the registration statement of which this prospectus forms a part and exclusively of independent directors within one year following the effective date of the registration statement of which this prospectus forms a part.
Board Committees
We currently have an audit committee, a compensation committee and a nominating and governance committee with the composition and responsibilities described below. The members of each committee are appointed by the board of directors and serve until their successor is elected and qualified, unless they are earlier removed or resign. In addition, from time to time, special committees may be established under the direction of the board of directors when necessary to address specific issues.
Audit Committee
Following the offering, the Audit Committee will be composed of Messrs. Patel, Mondre and Rittenmeyer and Ms. Henry. Mr. Patel will serve as the Chairperson of the Audit Committee.
132
Table of Contents
Each of Messrs. Patel and Rittenmeyer and Ms. Henry is a non-affiliated Director, and each has been determined by the Board to meet the independence rules of the New York Stock Exchange and Rule 10A-3 of the Exchange Act. None of our Audit Committee members simultaneously serves on the audit committees of more than three public companies, including ours. The board of directors has affirmatively determined that Messrs. Mondre and Patel qualify as audit committee financial experts under the applicable requirements of the rules and regulations of the SEC.
Our Audit Committee is responsible for, among other things:
| • | selecting the independent auditors; |
| • | pre-approving all audit engagement fees and terms, as well as audit and permitted non-audit services to be provided by the independent auditors; |
| • | at least annually, obtaining and reviewing a report of the independent auditors describing the audit firm’s internal quality-control procedures and any material issues raised by its most recent review of internal quality controls; |
| • | annually evaluating the qualifications, performance and independence of the independent auditors; |
| • | discussing the scope of the audit and any problems or difficulties; |
| • | reviewing and discussing the annual audited and quarterly unaudited financial statements and “Management’s Discussion and Analysis of Financial Conditions in Results of Operations” with management and the independent auditor; |
| • | discussing types of information to be disclosed in earnings press releases and provided to analysts and rating agencies; |
| • | discussing policies governing the process by which risk assessment and risk management are to be undertaken; |
| • | reviewing and evaluating the adequacy of the Company’s ethics and compliance program, including our Code of Conduct, Operating with Integrity; |
| • | reviewing disclosures made by the chief executive officer and chief financial officer regarding any significant deficiencies or material weaknesses in our internal control over financial reporting; |
| • | reviewing internal audit activities and qualifications of the internal audit function; |
| • | establishing procedures for receipt, retention and treatment of complaints received by us regarding accounting, auditing or internal controls and the submission of anonymous employee concerns regarding accounting and auditing; |
| • | discussing with our general counsel any material government investigations, litigation or legal matters that could reasonably be expected to have a material impact on business or financial statements; |
| • | approving all related party transactions; |
| • | reviewing and approving the Company’s decisions to enter into certain swaps and security-based swaps; |
| • | annually reviewing and reassessing the Audit Committee charter; and |
| • | preparing the report required by the SEC to be included in our annual report on Form 10-K or our proxy or information statement. |
The Audit Committee has authority under its charter to obtain advice and assistance from outside legal counsel, accounting, or other outside advisors as deemed appropriate to perform its duties and responsibilities. A copy of the charter will be available on our website at www.avaya.com upon completion of this offering. Information contained in, and that can be accessed through, our website is not incorporated into and does not form a part of this prospectus.
133
Table of Contents
Compensation Committee
The Compensation Committee consists of Messrs. Giancarlo, Marren and Smith. Mr. Marren serves as Chairman of the Compensation Committee. We anticipate that, prior to the completion of this offering, the Compensation Committee, or a subcommittee, will be composed of “outside directors” as defined in Section 162(m) of the Code.
The Compensation Committee is responsible for:
| • | reviewing and approving individual performance of each of the Company’s senior officers reporting directly to the CEO and setting their compensation based on that evaluation; |
| • | reviewing the individual goals and objectives of, and evaluating the performance of, the chief executive officer, and setting the chief executive officer’s compensation based on that evaluation; |
| • | making recommendations to the board of directors regarding the adoption of new incentive compensation and equity-based plans, and administering our existing incentive compensation and equity-based plans; |
| • | making recommendations to the board of directors regarding compensation of the board members and its committee members; |
| • | annually reviewing the Compensation Committee charter and recommending any proposed changes to the Board; |
| • | reviewing and discussing with management the compensation discussion and analysis to be included in our filings with the SEC and preparing an annual compensation committee report for inclusion in our annual report on Form 10-K or proxy statement; and |
| • | overseeing any other such matters as the board of directors shall deem appropriate from time to time. |
The Compensation Committee has authority under its charter to access such internal and external resources, including retaining legal, financial, or other advisors, as the Compensation Committee deems necessary or appropriate to fulfill its responsibilities. A copy of the charter will be available on our website at www.avaya.com upon completion of this offering. Information contained in, and that can be accessed through, our website is not incorporated into and does not form a part of this prospectus.
Nominating and Governance Committee
The Nominating and Governance Committee of our board of directors consists of Messrs. Mohebbi, Giancarlo, Kennedy and Smith. Mr. Mohebbi serves as Chairman of the Nominating and Governance Committee.
The Nominating and Governance Committee is responsible for and oversees:
| • | evaluating the performance, size and composition of the full board of directors annually to determine the qualifications and areas of expertise needed to further enhance the composition of the board of directors and working with management in attracting candidates with those qualifications; |
| • | establishing criteria for the selection of new directors; |
| • | identifying individuals qualified to become directors and reviewing the qualifications of prospective nominees; |
| • | recommending the slate of nominees for inclusion in the Company’s proxy statement and presentation to the Company’s shareholders at each annual meeting, if any; |
| • | establishing a policy for considering shareholder nominees for election to our board of directors and reviewing any candidates for board membership nominated by shareholders; |
134
Table of Contents
| • | recommending qualified individuals to serve as committee members on the various board committees and recommending to the full board of directors, as appropriate, changes in number, function or composition of committees; |
| • | reviewing the performance of any board member eligible to stand for re-election at our annual meeting, if any, as well as other criteria prescribed by Company policies; |
| • | establish criteria and processes for, and overseeing, the performance and self-evaluation process of our board of directors; |
| • | reviewing and assessing any director who retires, changes from the principal occupation or principal background association held when such director was originally invited to join the board of directors, joins any new board of directors of a public company or private company or joins a governmental commission, and in each case, determining whether it believes that such director’s change in circumstances represents a conflict of interest or otherwise inhibits such director’s ability to serve the best interest of the Company and its stockholders; |
| • | evaluating the need and, if necessary, create a plan for the orientation and continuing education of directors; |
| • | monitoring, with the assistance of our General Counsel, current developments in the regulation and practice of corporate governance; and |
| • | reviewing our corporate governance guidelines once adopted and providing recommendations to the board of directors regarding possible changes. |
The Nominating and Governance Committee has sole authority under its charter to retain and terminate, at the Company’s expense, any search firm or advisor to be used to identify director candidates and has sole authority to approve the search firm’s or advisor’s fees and other retention terms. A copy of the charter will be available on our website at www.avaya.com upon completion of this offering.
Board Leadership Structure
Our board of directors understands that there is no single, generally accepted approach to providing board leadership and that given the dynamic and competitive environment in which we operate, the right board leadership structure may vary as circumstances warrant. To this end, our board of directors has no policy mandating the combination or separation of the roles of Chairman and Chief Executive Officer. We currently have a separate Chairman and Chief Executive Officer. This leadership structure has been determined to be appropriate for us at this time in light of our current relationship with our Sponsors, though our board of directors believes the matter should be discussed and considered from time to time as circumstances change.
Board Oversight of Risk Management
While the full board of directors has the ultimate oversight responsibility for the risk management process, its committees oversee risk in certain specified areas. In particular, our Compensation Committee is responsible for overseeing the management of risks relating to our executive compensation plans and arrangements and the incentives created by the compensation awards it administers. Our Audit Committee oversees management of enterprise risks as well as financial risks and effective upon the consummation of this offering will also be responsible for overseeing potential conflicts of interests. Pursuant to the board of directors’ instruction, management regularly reports on applicable risks to the relevant committee or the full board of directors, as appropriate, with additional review or reporting on risks conducted as needed or as requested by the board of directors and its committees.
135
Table of Contents
Code of Ethics and Business Conduct
Our Code of Conduct, Operating with Integrity, is designed to help directors and employees worldwide to resolve ethical issues in an increasingly complex global business environment. The Code of Conduct applies to all directors and employees, including, without limitation, the Chief Executive Officer, the Chief Financial Officer, the Corporate Controller and any other employee with any responsibility for the preparation and filing of documents with the SEC. The Code of Conduct covers a variety of topics, including those required to be addressed by the SEC. Topics covered include, but are not limited to, conflicts of interest, confidentiality of information and compliance with applicable laws and regulations. Directors and employees of the Company receive periodic updates regarding policies governed by and changes to the Code of Conduct. The Code of Conduct is available at our Investor Relations website located at http://investors.avaya.com. We will post amendments to or waivers of the provisions of the Code of Conduct made with respect to any of our directors and executive officers on that website within four business days. The information contained on, or accessible through, our website is not part of this prospectus, and is therefore not incorporated by reference. During fiscal 2014, no amendments to or waivers of the provisions of the Code of Conduct were made with respect to any of our directors or executive officers.
Compensation Committee Interlocks and Insider Participation
During fiscal 2014, Mr. Giancarlo served as a member of the Compensation Committee. Mr. Giancarlo served as our President and Chief Executive Officer from June 20, 2008 until December 22, 2008. In addition, each of the Compensation Committee members is a party to a relationship with the Company as more fully set forth under the heading “Certain Relationships and Related Party Transactions” below.
Compensation Committee
Pursuant to its charter, the compensation committee of Avaya Holdings Corp., which we refer to in this prospectus as the “Compensation Committee,” must consist of at least three members. A Compensation Committee member serves until his successor is elected and qualified. The Compensation Committee charter provides that the Compensation Committee acts on behalf of the Company and Avaya Inc. All of our executive officers are employees of Avaya Inc. During fiscal 2014, the Compensation Committee held four meetings. For fiscal 2014 the Compensation Committee members were Messrs. Giancarlo (Chairman), Marren and Smith. Mr. Giancarlo previously served as Chairman of the Compensation Committee from September 2012 to April 2013.
Compensation Committee Report
The Compensation Committee has reviewed and discussed the Compensation Discussion and Analysis required by Item 402(b) of Regulation S-K included in this prospectus with management and, based on such review and discussions, the Compensation Committee recommended to the Board of Directors that the Compensation Discussion and Analysis be included in this prospectus.
COMPENSATION COMMITTEE
John W. Marren, Chairman
Charles Giancarlo
Gary B. Smith
136
Table of Contents
Introduction
The fiscal year 2014 Compensation Discussion and Analysis (“CD&A”) outlines the design and overall philosophy of our executive compensation program components, the objectives and principles upon which they are based, and our fiscal 2014 pay decisions for our Named Executive Officers (“NEOs”), which include our CEO, CFO and the next three most highly compensated officers.
Our Fiscal 2014 NEOs
| • | Kevin J. Kennedy, President and Chief Executive Officer (“CEO”) |
| • | David Vellequette, Senior Vice President and Chief Financial Officer |
| • | James M. Chirico, Jr., Executive Vice President, Business Operations |
| • | Pierre-Paul Allard, Senior Vice President, Worldwide Sales and President, Global Field Operations |
| • | Roger Gaston, Senior Vice President, Human Resources |
Overview
The objectives of our compensation program are to:
| • | Attract and retain executives with the skills and experience necessary to execute a fundamental business transformation by providing a competitive pay package that reflects the market in which we compete for talent; |
| • | Align executive officer compensation with performance by providing executives with opportunities to earn performance-based compensation based on both company performance as well as individual performance; |
| • | Align executive officer compensation with the stated objective of transforming Avaya into a premier software and services company. |
We achieve these objectives through a combination of fixed pay and variable incentive compensation opportunities, which for fiscal 2014 includes the following specific elements:
| Element of Compensation |
Overview of Program Element | |||
| Base Salary |
• |
Provide executive officers with base salaries which are market competitive and reflect the skills and experience required for their roles. | ||
| Short-Term Incentive Compensation |
• |
Provide executive officers with a semi-annual incentive opportunity intended to reward for both Company and individual performance. The Compensation Committee assesses overall performance and makes final determinations of awards. | ||
| Long-Term Incentive Compensation (“LTI”) |
• |
Provide executive officers with market competitive annual long-term incentive grants comprised of a combination of cash-based performance awards, restricted stock units (“RSUs”) and stock options. | ||
Our determinations of target compensation level and mix of compensation elements are linked to short and long-term performance as evaluated by our Compensation Committee based on market practices and the Compensation Committee’s assessment of each executive officer’s skills, contributions and performance, each assessed without a specific weighting.
137
Table of Contents
For fiscal 2014 the pay mix at target levels was as follows:
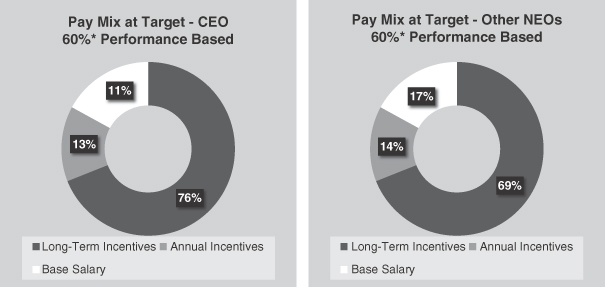
| * | For purposes of the above, performance-based compensation includes the target value of EC DAIP (defined below) and stock option and RSU awards. |
Actual pay will vary from these targets based on the Compensation Committee’s assessment of Company and individual performance as well as the change in the value of the equity of our Company over time.
In addition to these standard elements of pay for fiscal 2014, Avaya had a number of one-time and legacy long-term incentive plans in effect which provided payouts during the fiscal year. These included:
| • | Executive Committee Performance Recognition Program (“EC LTIP”) which is a performance based long-term cash incentive plan designed to reward annual financial performance over a five-year period from fiscal 2011 to fiscal 2015. |
| • | Short-Term Cash Awards were created in fiscal 2013 to recognize the significant progress made in our business transformation despite the fact that targets were not achieved under the Avaya Inc. Short Term Incentive Plan (“STIP”). |
| • | Long-Term Cash Award which is a retention cash award that vests over a three- or five-year time horizon from fiscal 2013 to fiscal 2015 or fiscal 2017, depending on executive officer tenure and is intended to provide liquidity for stock or options until an IPO or certain other events occur. |
| • | Segment Transformation Growth Incentive (“STGI”) was created in fiscal 2013 and was payable in fiscal 2014 to address historical gaps identified between our executives’ total direct compensation and market total direct compensation of a peer group. |
No new awards were provided to NEOs under these one-time or legacy programs in fiscal 2014. These incentives are further described in the narrative below and footnotes following the Summary Compensation Table where relevant.
138
Table of Contents
Compensation Governance
Our process for determining executive officer compensation (including NEOs) is as follows:
Compensation Committee
In accordance with its charter, the Compensation Committee, which is comprised of representatives of our majority shareholders as well as one independent board member, approves all elements of compensation for our executive officers. The role of the Compensation Committee is to discharge the Board’s responsibilities relating to executive compensation matters. In this regard the Compensation Committee is responsible for the development and administration of our executive officer compensation and benefits programs. In furtherance of this purpose, the Compensation Committee has the authority and responsibility to:
| • | Develop, in partnership with management, an overarching compensation philosophy upon which our executive officer pay programs are built; |
| • | Review and approve corporate goals and objectives relevant to the compensation of the CEO, to evaluate the performance of the CEO in light of these goals and objectives, and determine and approve the compensation of the CEO based on this evaluation; |
| • | Review the appropriateness of our peer group ensuring its continued alignment with our pay philosophy; |
| • | Set executive officer compensation and make recommendations to the Board with respect to incentive compensation and equity based plans, administer and make awards under such plans and review the cumulative effect of its actions; |
| • | Review and approve compensation of all executive officers; |
| • | At its discretion, retain a compensation consultant to advise the Compensation Committee on executive pay matters; and |
| • | Review and assist with the development of executive officer succession plans. |
Compensation Consultant
The Company is advised on executive compensation matters by Semler Brossy Consulting Group (“Semler Brossy”). Semler Brossy is retained by management but provides advice and guidance to the Compensation Committee on a variety of topics including program design, our peer group, benchmarking and competitive assessments. During fiscal 2014, the Compensation Committee did not retain a separate compensation consultant.
Management
Our CEO, supported by our Human Resources team and with input from Semler Brossy, makes recommendations to the Compensation Committee for setting target compensation levels and determining realized pay results for all executives other than himself. Pay decisions for the CEO are reviewed separately by the Compensation Committee and independent of the CEO’s input. Semler Brossy provides comparative market data and recommendations on CEO pay to the Compensation Committee directly.
Peer Group
To ensure that our compensation program remains competitive and aligned with our overall philosophy and objectives, the Compensation Committee compares our compensation and benefit practices and levels of pay to a peer group consisting of technology oriented businesses that compete with us for talent and:
| • | are primarily focused information technology service businesses; |
139
Table of Contents
| • | have similar revenue base and size to reflect complexity; and |
| • | are companies for which comparative executive compensation data are readily available. |
Using these characteristics as our guide, the following 18 companies were used as the peer group for fiscal 2014 pay related decisions (the “Peer Group”):
| Fiscal 2014 Peer Group |
||
| Adobe Systems Inc. | EMC Corp. | |
| Autodesk, Inc. | Juniper Networks Inc. | |
| BMC Software | Motorola Solutions | |
| Broadcom Corp. | Symantec Corp. | |
| Brocade Communications Systems Inc. | Teradata Corp. | |
| CA, Inc. | Unisys Corp. | |
| Citrix Systems Inc. | NetApp, Inc. | |
| Cognizant Technology Solutions Corp. | VMWare | |
| Computer Sciences Corp. | Qualcomm Inc. |
In August of 2014, we conducted our annual assessment of our Peer Group with guidance from Semler Brossy. Semler Brossy recommended that we remove two companies from our Peer Group as described below. The revised Peer Group will be used to assess executive officer compensation for fiscal 2015.
| Peer Company |
Reason | |
| Qualcomm Inc. | Revenue size is out of scale with our business | |
| BMC Software | Privatization of company and resulting unavailability of publicly disclosed compensation data |
In addition to the Peer Group, we also review pay data from the Radford Global Compensation Survey, with a focus on Technology Companies with revenues of approximately $5 billion. This data is used to supplement the pay data from the Peer Group and provides market data for executives whose positions are not listed in Peer Group public filings.
Fiscal 2014 Compensation Elements and Pay Decisions
We believe Avaya continues to evolve from a traditional telecommunications hardware company into a software and services company to meet the demands of today’s customers. We believe that improvements in our products and services have enhanced our leadership in the market and provided future growth opportunities. Fiscal 2014 marked our first year of a multi-year sales transformation initiative, and we continue to see indications of our progress across various business measures such as increases in Net Promoter Score (NPS) and growth in sales of key products and services. Our total direct compensation program for our NEOs and other executive officers was built to incentivize senior leadership to help achieve these and other go-to-market objectives by emphasizing pay-for-performance. We use base salaries and short-term cash-based incentives designed to reward for achievement of individual and Company performance and cash and equity-based long-term incentives intended to reward for achievement of longer-term performance.
Our Compensation Committee and Board regularly evaluate individual contributions and achievements in order to make organizational and compensation decisions. This includes in-depth discussions of CEO and executive officer performance and an annual 360 degree review process that is facilitated by a third party advisor, including self-assessments. Individual performance for the executive officers was measured by the CEO using an assessment scale evaluating four performance metrics including overall impact, teamwork and attitude, results and performance, and leadership (“Performance Metrics”).
The Compensation Committee participates in this process to develop an informed point of view which establishes the basis of their decisions for determining awards under all of the fiscal 2014 incentive programs.
140
Table of Contents
Our approach taken in fiscal 2014 with respect to long-term incentives differs from the approach taken in prior years. During our November 2013 Compensation Committee meeting, Semler Brossy presented their annual competitive assessment of CEO and executive officer compensation relative to our Peer Group and the market. The assessment indicated that while pay opportunities were competitive with the addition of one-time programs, we needed to transition to a standardized approach to total direct compensation (total target cash compensation plus long-term incentives) through an annual grant strategy under our long-term incentive program. For fiscal 2014, the primary elements of our executive compensation plan included:
Base Salary
Base salaries are evaluated at the beginning of each fiscal year following an assessment using market and Peer Group data performed by Semler Brossy. Assessment-based recommendations are made by the CEO and the Company’s Executive Compensation team and presented to the Compensation Committee for further evaluation based on individual performance.
No changes were made to base salaries for our executive officers during fiscal 2014. Please see the Summary Compensation Table for additional details.
Executive Committee Discretionary Annual Incentive Plan (“EC DAIP”)
On October 15, 2013 the Compensation Committee approved a new short-term incentive plan for executive officers, the EC DAIP, thereby making them ineligible for participation in the STIP. The EC DAIP was designed to balance the need for a competitive incentive opportunity which is tied to performance, with the necessity of providing our Compensation Committee with the ability to exercise judgment at the end of each performance period to consider other factors in determining awards including:
| • | Overall company performance; and |
| • | Executive officer individual and function performance over time. |
The plan provides two payout opportunities each fiscal year based on financial performance during the previous 6 month period (October 1 to March 31 and April 1 to September 30). During our annual competitive assessment, targets are established as a percent of base salary using market and Peer Group data. Plan funding and individual awards are determined in each period by the Compensation Committee in its discretion based on its evaluation of the Performance Metrics and the CEO’s recommendations for the executive officers other than the CEO. There is no guarantee for any individual award and individual awards may not exceed more than 200% of an individual’s target.
No changes were made to targets for our executive officers during fiscal 2014. Please see the Summary Compensation Table footnote 4(a) and Grants of Plan Based Awards Table for additional details, including target and actual payouts for fiscal 2014.
Long-Term Incentives
At the beginning of fiscal 2014, we established a framework for providing annual grants of long-term incentive opportunities to our executive officers. These awards are intended to be competitive with practices among public companies with which we primarily compete for talent by providing annual equity-based and cash-based awards that vest over a multi-year timeframe. These awards also include both time-vesting and performance-based features.
141
Table of Contents
The specific mix of long-term incentive vehicles provided in fiscal 2014 is shown in the table below.
| Vehicle |
Cash |
Restricted Stock Units |
Stock Options | |||
| % of Annual Grant Value |
50% | 30% | 20% | |||
| Performance Upside |
50% of total grant value | 50% total grant value | Not Applicable |
The mix includes long-term cash in addition to equity-based awards both to recognize the limited liquidity of our stock as a private company and to limit the dilution of the interests of our current shareholders given the concentrated ownership of the Company.
Cash Component
Annual cash awards with multi-year vesting are designed to encourage retention and performance of our executive officers. Fifty-percent of the long-term incentive award is allocated in cash. These awards vest ratably on an annual basis over a 3 year period. These awards also contain an additional performance-based upside provision providing up to an additional 50% of one-third of the grant value at the end of each performance year if a pre-established financial target is achieved. The financial metric for fiscal 2014 grants was Adjusted EBITDA on a pre-STIP basis (i.e. before taking into account any payment under the Company’s short-term incentive plans for employees generally), or “Pre-STIP Adjusted EBITDA.” Adjusted EBITDA is defined in “Management’s Discussion and Analysis of Financial Condition and Results of Operations—EBITDA and Adjusted EBITDA,” found elsewhere in this Prospectus. The target for fiscal 2014 of $1.1 billion was not met and no additional grants were earned.
Restricted Stock Units (RSUs)
RSUs are the most prevalent form of equity-based compensation used by companies in our industry and among our Peer Group. Thirty percent of the value of the annual long-term incentive grant is delivered in RSUs with the actual number of units being determined based on our common stock price at the time the grant is approved, as determined by our Compensation Committee. Generally, these awards vest based on continued service one-third on the first anniversary of the grant date and one-twelfth on each quarterly anniversary thereafter. As with the cash portion of the award, there is also an additional performance-based upside provision providing up to an additional 50% of one-third of the grant value at the end of each performance year, if a pre-established Pre-STIP Adjusted EBITDA target is achieved. The target for fiscal 2014 of $1.1 billion was not met and no additional grants were earned.
Stock Options
Although the use of stock options is fairly uncommon among our Peer Group, we believe as a private company, delivering 20% of the annual long-term incentive grant through stock options is appropriate, particularly in balancing the mix of risk and reward for our executive officers. The actual number of stock options is determined using an estimated Cox Ross Rubenstein value of our stock at the time the grant is approved. Generally, these awards vest one-third on the first anniversary of the grant date and one-twelfth on each quarterly anniversary thereafter.
142
Table of Contents
In the beginning of 2014, the Compensation Committee made the following long-term incentive awards to our NEOs based on market competitiveness and the Performance Metrics for executive officers and the third-party advisor led performance assessment for the CEO:
| Potential Upside ($) | ||||||||||||||||||||||||
| Name |
Fiscal 2014 Target LTI Award ($)* |
Cash Award ($) |
Base Award Restricted Stock Units (# shares) |
Stock Options (# shares) |
Cash | RSUs | ||||||||||||||||||
| Kevin J. Kennedy |
$ | 7,764,000 | $ | 3,750,000 | 1,000,000 | 1,200,000 | $ | 1,875,000 | $ | 1,125,000 | ||||||||||||||
| David Vellequette |
$ | 2,329,200 | $ | 1,125,000 | 300,000 | 360,000 | $ | 562,500 | $ | 337,500 | ||||||||||||||
| James M. Chirico |
$ | 2,329,200 | $ | 1,125,000 | 300,000 | 360,000 | $ | 562,500 | $ | 337,500 | ||||||||||||||
| Pierre-Paul Allard |
$ | 1,552,800 | $ | 750,000 | 200,000 | 240,000 | $ | 375,000 | $ | 225,000 | ||||||||||||||
| Roger Gaston |
$ | 1,035,199 | $ | 500,000 | 133,333 | 160,000 | $ | 250,000 | $ | 150,000 | ||||||||||||||
| * | Values reported are based on the fair value on the date of grant as determined under ASC 718. |
One-Time and Legacy Long-Term Incentive Plans
In July of 2012, we engaged Pearl Meyer to conduct a competitive assessment of our CEO and executive officer compensation relative to the market and Peer Group. Overall the assessment indicated that when compared to the Peer Group, while total target cash compensation was competitive, actual total cash compensation (base salary plus annual non-equity incentives paid) was below the median of the Peer Group and in some cases well below the twenty-fifth percentile. The assessment further indicated that total direct compensation was below the Peer Group twenty-fifth percentile.
The one-time compensation programs described below were specifically designed to address these competitive gaps.
Short-Term Cash Awards
The Short-Term Cash Award Program was created in fiscal 2013 to recognize significant efforts during fiscal 2012 despite the fact that corporate targets were not achieved under our performance-based incentive plans. The awards were designed to retain executive officers and a core group of approximately 3,000 of our highest performing employees. Amounts per individual were determined as a percentage of base salary and were relative to the amount of variable pay opportunity for each corporate level, including the NEOs. Awards to executive officers were paid in three installments, provided the executive was active on the date of payment.
Please see Summary Compensation Table footnote 4(b) for additional details.
Long-Term Cash Award Program
In fiscal 2013, the Compensation Committee approved a long-term cash award program for executive officers. These awards were designed to provide a degree of value assurance relative to our equity plans for executive officers due to the uncertainty regarding the timing of any liquidity event for shares of our common stock. The awards are payable in three installments over either a three or five year period depending on executive officer tenure. The first installments were paid in fiscal 2013 and the second installments were paid to certain NEOs in fiscal 2014 and will be paid to others in fiscal 2015. All of the NEOs are entitled to receive third installments of awards between fiscal 2016 and fiscal 2018. The third installment payment for each award recipient will be adjusted downward (i) to reflect shares of the Company’s common stock previously owned and sold by that individual and (ii) if the Company’s common stock is then publicly traded, to reflect the value of certain shares of the Company’s common stock that individual owns or could receive upon exercise of stock options, or vested RSUs.
143
Table of Contents
No awards were granted under this program in fiscal 2014 but previous awards which vested in fiscal 2013 and 2014 are reported in the Summary Compensation Table. Please see Summary Compensation Table footnote 4(d) for additional details.
Segment Transformation Growth Incentive (STGI)
STGI was created in fiscal 2013 for certain key employees, including the NEOs. The program addressed gaps identified between our executive officers’ total direct compensation and market and peer group total direct compensation during a critical stage of our business transformation strategy. Awards were established as a percentage of base pay and were delivered through a mix of cash and RSUs; the actual ratio was chosen by each executive officer from various alternatives presented. Awards were fully vested and paid over fiscal 2014, as further described in the Summary Compensation Table and Options Exercised and Stock Vested Table and accompanying footnotes below. No further awards are planned under this program.
Please see Summary Compensation Table footnote 4(c) for additional details.
Quarterly Incentive Plan
Pierre-Paul Allard, our Senior Vice President, Worldwide Sales and President, Global Field Operations, is eligible for a special Quarterly Incentive Plan for fiscals 2014 and 2015, designed to accelerate the performance of our sales team and enhance our market position. This incentive is directly linked to our go-to-market strategy and includes a balanced focus on three performance areas: Growth, Transformation of the Sales Organization, and Customer Satisfaction. Mr. Allard’s maximum opportunity under this Quarterly Incentive was $100,000 in each quarter and he was awarded a total of $231,669 for the year based on assessment of his performance.
Please see Summary Compensation Table footnote 4 for additional details.
EC Performance Recognition Plan (EC LTIP)
The EC LTIP was created in fiscal 2011 and revised for fiscal 2014 to provide executive officers with an additional annual deferred incentive opportunity. For fiscal 2014, the program was amended to consider a single financial target of Pre-STIP Adjusted EBITDA and further, to provide the Compensation Committee with full discretion to determine awards, as long as no individual award exceeds 160% of the individual’s target.
The Pre-STIP Adjusted EBITDA target for fiscal 2014 was $1.1 billion. Our actual Pre-STIP Adjusted EBITDA result was $909.7 million or approximately 83% achievement relative to target. Individual awards were decided based upon this achievement level and were further adjusted based on the Performance Metrics.
Please see Summary Compensation Table footnote 4(f) for additional details, including target and actual payouts for fiscal 2014.
Fiscal 2015 Compensation Elements and Pay Decisions
At the November 2014 meeting of our Compensation Committee, Semler Brossy presented their findings from the fiscal 2015 competitive assessment of CEO and executive officer pay relative to the market and our Peer Group. The assessment indicated that overall, our total target direct compensation, with the addition of the annual long-term incentive grants, placed our executives between the median and the seventy-fifth percentile of Peer Group. There were no adjustments to base, EC DAIP or EC Performance Recognition Plan (EC LTIP) targets for fiscal 2015. There were also no additional awards provided under any of the one-time and legacy long-term incentive plans described above. There were adjustments to the annual long-term incentive grant values for Mr. Chirico and Mr. Vellequette to address a concern about their retention through the second year of our business transformation, considering their fiscal 2014 performance and expected criticality to the business during fiscal 2015.
144
Table of Contents
Long-Term Incentives
On August 13, 2014, the Committee approved the Avaya Holdings Corp Second Amended and Restated 2007 Equity Incentive Plan (“2007 Plan”), which was approved by the stockholders of the Company effective November 20, 2014. The 2007 Plan was amended to make an additional 6,009,248 shares available for issuance, increasing the total amount of shares of the Companys common stock available for issuance under the 2007 Plan to 55,857,405, in addition to 2,984,125 shares of common stock underlying certain continuation awards and other awards that were permitted to be issued at the time of the Merger.
For fiscal 2015, changes were made to the vesting terms for our grants such that Stock Options, RSUs and cash awards will vest one-quarter on the first anniversary of the grant date and one-sixteenth on each quarterly anniversary of the grant date thereafter. Additionally, the performance-based upside provision was removed from the RSU portion of the fiscal 2015 grants, but remains on the cash portion, providing up to an additional 50% of one-fourth of the total grant value at the end of each performance year if a pre-established financial target is achieved.
The foregoing description of the 2007 Plan, the form of Restricted Stock Unit Award Agreement, and the form of Non-Statutory Stock Option Award Agreement are each qualified in its entirety by reference to the full text thereof.
At the November 2014 meeting, the Compensation Committee made the following long-term incentive awards to our NEOs for fiscal 2015 based on market competitiveness and the Compensation Committee’s assessment of each executive’s criticality in supporting our transformation:
| Name |
Fiscal 2015 Target LTI Award ($)* |
Cash Award ($) |
Restricted Stock Units (# shares) |
Stock Options (# shares) |
Potential 3- Year Upside Cash ($) |
|||||||||||||||
| Kevin J. Kennedy |
$ | 7,500,000 | $ | 3,750,000 | 900,000 | 937,500 | $ | 1,875,000 | ||||||||||||
| David Vellequette |
$ | 2,750,000 | $ | 1,375,000 | 330,000 | 343,750 | $ | 687,500 | ||||||||||||
| James M. Chirico |
$ | 2,750,000 | $ | 1,375,000 | 330,000 | 343,750 | $ | 687,500 | ||||||||||||
| Pierre-Paul Allard |
$ | 1,500,000 | $ | 750,000 | 180,000 | 187,500 | $ | 375,000 | ||||||||||||
| Roger Gaston |
$ | 1,000,000 | $ | 500,000 | 120,000 | 125,000 | $ | 250,000 | ||||||||||||
Awards vest one-fourth on the first anniversary of the date of grant and one-sixteenth on each quarterly anniversary of the date of grant thereafter. The numbers of RSUs and Stock Options is based upon the fair market value of a share of our common stock which was $2.50 on the date of grant and a Cox Ross Rubenstein value of $1.60 as of August 13, 2014, respectively.
Other Compensation
Perquisites
We provide certain perquisites to our executive officers to ensure our compensation and benefits package remains competitive. The Compensation Committee reviews these perquisites annually to evaluate their value and market prevalence based on data provided by Semler Brossy.
Savings Plans
We offer a qualified savings plan for all U.S. salaried employees, the Avaya Inc. Savings Plan for Salaried Employees (“ASPSE”). Effective January 1, 2013, our matching allocation is made on a quarterly basis, once a Company financial performance threshold is met. The matching formula is 50% for the first 5% of pre-tax eligible compensation contributed by a participant, up to $3,000 annually. None of our NEOs received a company matching allocation during fiscal 2014.
145
Table of Contents
We also offer an unfunded, non-qualified deferred compensation plan, the Avaya Inc. Savings Restoration Plan (“ASRP”) to restore savings opportunities lost under the ASPSE due to IRS code limitations. There is no company match provided for this plan.
Severance Plan
We offer a severance plan to our executive officers, the Avaya Inc. Separation Plan for Senior Officers. The plan provides specific payments and benefit enhancements if an executive officer’s employment is terminated involuntarily under the Avaya Force Management Program Guidelines. For additional details, please refer to the Potential Payments on Occurrence of Change of Control and Other Events section.
Summary Compensation Table
The Summary Compensation Table contains values calculated and disclosed according to SEC reporting requirements. Salary, Bonus and Non-Equity Incentive Compensation values are reflective of compensation earned during the fiscal year. Stock Award and Option Award values are reflective of the total fair value, regardless of vesting conditions for earning the awards, for grants received during the fiscal year.
| Name |
Year | Salary ($) (1) |
Bonus ($)(2) |
Stock Awards ($)(3) |
Option Awards ($)(3) |
Non-Equity Incentive Plan Comp. ($)(4) |
All Other Comp. ($)(5) |
Total ($) |
||||||||||||||||||||||||
| Kevin J. Kennedy President and Chief Executive Officer |
2014 | $ | 1,250,000 | $ | 2,000,000 | $ | 2,250,000 | $ | 4,704,000 | $ | 5,460,938 | $ | 41,996 | $ | 15,706,934 | |||||||||||||||||
| 2013 | $ | 1,250,000 | $ | 1,592,382 | $ | 2,575,001 | — | $ | 3,532,000 | $ | 17,571 | $ | 8,966,954 | |||||||||||||||||||
| 2012 | $ | 1,250,000 | — | — | — | — | $ | 78,648 | $ | 1,328,648 | ||||||||||||||||||||||
| David Vellequette Senior Vice President and Chief Financial Officer |
2014 | $ | 625,000 | $ | 200,000 | $ | 675,000 | $ | 529,200 | $ | 1,358,750 | $ | 24,881 | $ | 3,412,831 | |||||||||||||||||
| 2013 | $ | 587,500 | $ | 200,000 | $ | 1,006,251 | $ | 585,000 | $ | 1,071,250 | $ | 7,718 | $ | 3,457,719 | ||||||||||||||||||
| James M. Chirico, Jr. Executive Vice President, Business Operations |
2014 | $ | 675,000 | — | $ | 675,000 | $ | 529,200 | $ | 2,905,750 | $ | 23,189 | $ | 4,808,139 | ||||||||||||||||||
| 2013 | $ | 653,269 | — | $ | 708,127 | — | $ | 2,085,250 | $ | 7,819 | $ | 3,454,465 | ||||||||||||||||||||
| 2012 | $ | 636,250 | $ | 100,000 | — | — | — | $ | 28,970 | $ | 765,220 | |||||||||||||||||||||
| Pierre-Paul Allard Senior Vice President, Worldwide Sales and President, Global Field Operations |
2014 | $ | 525,000 | — | $ | 450,000 | $ | 352,800 | $ | 1,344,169 | $ | 46,453 | $ | 2,718,422 | ||||||||||||||||||
| Roger Gaston |
2014 | $ | 425,000 | — | $ | 299,999 | $ | 235,200 | $ | 1,575,000 | $ | 23,884 | $ | 2,559,083 | ||||||||||||||||||
| Senior Vice President, Human Resources |
||||||||||||||||||||||||||||||||
| (1) | Amounts shown for fiscal 2013 for Mr. Chirico reflect the impact of participation in the Company’s mandatory one-week furlough program. |
| (2) | Amounts shown for fiscal 2014 reflect: (i) for Mr. Kennedy, a cash bonus in recognition of his performance and efforts to transform our business, including amounts that he otherwise would have received under the EC LTIP, and (ii) for Mr. Vellequette, the second installment of a sign-on payment made in connection with |
146
Table of Contents
| his offer of employment. Amounts shown for fiscal 2013 reflect: (i) for Mr. Kennedy, a cash recognition award, (ii) for Mr. Vellequette, the first installment of a sign-on payment made in connection with his offer of employment. The amount shown for Mr. Chirico for fiscal 2012 reflects the second installment of a cash bonus program adopted to retain employees assisting with the NES acquisition. |
| (3) | Amounts indicated for “Stock Awards” and “Option Awards” represent the fair value of the awards at the date of grant as calculated in accordance with Financial Accounting Standards Board Accounting Standards Codification Topic 718, “Compensation-Stock Compensation,” or ASC 718, without regard to forfeiture assumptions. For fiscal 2014 the fair value of stock options for Mr. Kennedy and Mr. Vellequette vary from the amounts reported in Forms 8-K on November 15, 2013 and December 11, 2013 as those amounts were estimated using the June 30, 2013 fair value of the securities and not the fair value on the date of grant as subsequently determined under ASC 718. |
| Included in fiscal 2013 is the incremental fair value of replacement RSUs awarded under a stock option exchange program whereby individuals holding previously granted performance-based stock options could exchange them on a three-for-one basis for RSUs. Not included in fiscal 2013 are any amounts attributable to previously granted performance-based stock options as it is not possible to determine if the performance condition (e.g., sale or initial public offering of the Company) will be satisfied until such event actually occurs. For options granted to Mr. Vellequette in 2013, assuming the highest level of achievement, the aggregate grant date fair value for fiscal 2013 would have been $410,375. |
| For more information regarding the valuation of stock-based awards (including assumptions made in such valuation), refer to Note 15, “Share-based Compensation,” to our audited Consolidated Financial Statements included elsewhere in this report. |
| (4) | Reflects amounts earned under each of the following programs: |
| Name |
Year | EC DAIP Awards (a) |
Short Term Cash Award (b) |
Segment Transformation Growth Incentive (c) |
Long Term Cash Award (d) |
Quarterly Sales Transformation Incentive (e) |
EC Long Term Incentive Plan (f) |
Total ($) | ||||||||||||||||||||||
| Kevin J. Kennedy |
2014 | $ | 804,688 | $ | 1,250,000 | $ | 750,000 | $ | 1,656,250 | — | $ | 1,000,000 | $ | 5,460,938 | ||||||||||||||||
| 2013 | $ | 725,000 | $ | 1,563,000 | $ | 250,000 | $ | 994,000 | — | — | $ | 3,532,000 | ||||||||||||||||||
| 2012 | — | — | — | — | — | — | — | |||||||||||||||||||||||
| David Vellequette |
2014 | $ | 265,000 | — | $ | 618,750 | — | — | $ | 475,000 | $ | 1,358,750 | ||||||||||||||||||
| 2013 | $ | 217,000 | — | $ | 206,250 | $ | 173,000 | — | $ | 475,000 | $ | 1,071,250 | ||||||||||||||||||
| James M. Chirico, Jr. |
2014 | $ | 290,000 | $ | 575,000 | $ | 618,750 | $ | 872,000 | — | $ | 550,000 | $ | 2,905,750 | ||||||||||||||||
| 2013 | $ | 231,000 | $ | 650,000 | $ | 206,250 | $ | 523,000 | — | $ | 475,000 | $ | 2,085,250 | |||||||||||||||||
| 2012 | — | — | — | — | — | — | — | |||||||||||||||||||||||
| Pierre-Paul Allard |
2014 | $ | 190,000 | — | $ | 562,500 | — | $ | 231,669 | $ | 360,000 | $ | 1,344,169 | |||||||||||||||||
| Roger Gaston |
2014 | $ | 135,000 | $ | 300,000 | $ | 337,500 | $ | 492,500 | — | $ | 310,000 | $ | 1,575,000 | ||||||||||||||||
| (a) | Represents EC DAIP award payments for both performance periods of fiscal 2014. |
| Name |
Target | Maximum | Midyear Payout |
Year-End Payout |
Total | % of Target | ||||||||||||||||||
| Kevin J. Kennedy |
$ | 1,562,500 | $ | 3,125,000 | $ | 390,625 | $ | 414,063 | $ | 804,688 | 52 | % | ||||||||||||
| David Vellequette |
$ | 562,500 | $ | 1,125,000 | $ | 140,000 | $ | 125,000 | $ | 265,000 | 47 | % | ||||||||||||
| James M. Chirico |
$ | 573,750 | $ | 1,147,500 | $ | 140,000 | $ | 150,000 | $ | 290,000 | 51 | % | ||||||||||||
| Pierre-Paul Allard |
$ | 420,000 | $ | 840,000 | $ | 100,000 | $ | 90,000 | $ | 190,000 | 45 | % | ||||||||||||
| Roger Gaston |
$ | 318,750 | $ | 637,500 | $ | 60,000 | $ | 75,000 | $ | 135,000 | 42 | % | ||||||||||||
147
Table of Contents
| (b) | Represents short-term cash awards paid in fiscal 2013 and 2014. Awards were payable in three installments in December 2012, March 2013 and December 2013. |
| Name |
Award Amount | |||
| Kevin J. Kennedy |
$ | 2,813,000 | ||
| David Vellequette1 |
$ | 0 | ||
| James M. Chirico |
$ | 1,225,000 | ||
| Pierre-Paul Allard |
$ | 100,000 | ||
| Roger Gaston |
$ | 625,000 | ||
| 1 | Mr. Vellequette joined the company on October 1, 2012, three months after the July 2012 Pearl Meyer competitive assessment was completed and was therefore not a participant in this program. |
| (c) | Represents the cash portion of the STGI Program earned for the fiscal year as described in “One-time and Legacy Long-Term Incentive Plans - Segment Transformation Growth Incentive.” The cash portion of each executive officer’s award vested monthly over a 12 month period from July 1, 2013 to June 30, 2014, provided the award recipient was employed by the Company as of the last day of the applicable month. |
| Name |
Total Award Amount |
Cash Award Amount |
RSU Award Amount |
Number of RSUs |
Election% Cash |
Election% RSUs |
||||||||||||||||||
| Kevin J. Kennedy |
$ | 2,000,000 | $ | 1,000,000 | $ | 1,000,000 | 444,444 | 50 | % | 50 | % | |||||||||||||
| David Vellequette |
$ | 1,100,000 | $ | 825,000 | $ | 275,000 | 122,222 | 75 | % | 25 | % | |||||||||||||
| James M. Chirico |
$ | 1,100,000 | $ | 825,000 | $ | 275,000 | 122,222 | 75 | % | 25 | % | |||||||||||||
| Pierre-Paul Allard |
$ | 1,000,000 | $ | 750,000 | $ | 250,000 | 111,111 | 75 | % | 25 | % | |||||||||||||
| Roger Gaston |
$ | 600,000 | $ | 450,000 | $ | 150,000 | 66,667 | 75 | % | 25 | % | |||||||||||||
| (d) | Represents Long-Term Cash Bonus award payments in fiscal 2014 as discussed under “One-Time and Legacy Long-Term Incentive Plans - Long Term Cash Award.” |
| Name |
Cash Payment (First Installment) |
Cash
Payment (Second Installment) |
Cash Payment
Target Range (Third Installment) |
|||||||||
| Kevin J. Kennedy |
$ | 994,000 | $ | 1,656,250 | $ | 3,975,000 - $7,287,500 | ||||||
| David Vellequette |
$ | 173,000 | $ | 517,500 | $ | 1,660,000 - $2,835,500 | ||||||
| James M. Chirico, Jr. |
$ | 523,000 | $ | 872,000 | $ | 2,093,000 - $3,836,000 | ||||||
| Pierre-Paul Allard |
$ | 120,000 | $ | 360,000 | $ | 1,245,000 - $2,108,000 | ||||||
| Roger Gaston |
$ | 296,000 | $ | 492,500 | $ | 1,182,000 - $2,167,000 | ||||||
| (e) | Represents earnings under a special incentive award. See “Fiscal 2014 Compensation Elements and Pay Decisions - Quarterly Incentive Plan.” |
| (f) | Represents cash incentives earned as discussed under “One-Time and Legacy Long-Term Incentive Plans- EC Performance Recognition Program.” |
| Name |
Target | Year-End Payout | % of Target | |||||||||
| Kevin J. Kennedy |
$ | 1,250,000 | $ | 1,000,000 | 80 | % | ||||||
| David Vellequette |
$ | 575,000 | $ | 475,000 | 83 | % | ||||||
| James M. Chirico |
$ | 675,000 | $ | 550,000 | 81 | % | ||||||
| Pierre-Paul Allard |
$ | 400,000 | $ | 360,000 | 90 | % | ||||||
| Roger Gaston |
$ | 425,000 | $ | 310,000 | 73 | % | ||||||
| (5) | During fiscal 2014, NEOs received certain perquisites provided by or paid for by the Company pursuant to Company policies. For all NEOs, amounts include life insurance premiums paid for by the Company and a financial planning allowance. For Mr. Chirico, includes a Company health spending account match that is |
148
Table of Contents
| provided through the Company’s standard medical benefit plans. For Messrs. Kennedy and Allard, includes amounts associated with expenses paid by the company in relation to family member attendance at company events and certain administrative fees associated with business expenses. |
Grants of Plan-Based Awards in Fiscal 2014
The following table sets forth information concerning non-equity and equity incentive awards granted in fiscal 2014 to each of the NEOs. The equity incentive awards were made under the 2007 Plan described below.
| Estimated Future Payouts Under Non-Equity Incentive Plan Awards |
Estimated Future Payouts Under Equity Incentive Plan Awards |
All Other Stock Awards: Number of shares of stock or units (#) |
All other option awards: Number of securities underlying options (#) |
Exercise or Base Price of Option Awards ($)(7) |
Grant Date Fair Value of Stock and Option Awards ($)(8) |
|||||||||||||||||||||||||||||||||
| Name |
Grant Date |
Threshold ($) |
Target ($) |
Maximum ($) |
Threshold ($) |
Target ($) |
Maximum ($) |
|||||||||||||||||||||||||||||||
| Kevin J. Kennedy |
(1) | $ | 1,562,500 | $ | 3,125,000 | |||||||||||||||||||||||||||||||||
| (2) | $ | 1,250,000 | ||||||||||||||||||||||||||||||||||||
| 12/11/2013 | (3) | $ | 3,750,000 | $ | 5,625,000 | |||||||||||||||||||||||||||||||||
| 12/11/2013 | (4)(5) | $ | 1,125,000 | 1,000,000 | $ | 3,375,000 | ||||||||||||||||||||||||||||||||
| 12/11/2013 | 2,000,000 | $ | 2.25 | $ | 2,940,000 | |||||||||||||||||||||||||||||||||
| 12/11/2013 | (6) | 1,200,000 | $ | 2.25 | $ | 1,764,000 | ||||||||||||||||||||||||||||||||
| David Vellequette |
(1) | $ | 562,500 | $ | 1,125,000 | |||||||||||||||||||||||||||||||||
| (2) | $ | 575,000 | ||||||||||||||||||||||||||||||||||||
| 11/15/2013 | (3) | $ | 1,125,000 | $ | 1,687,500 | |||||||||||||||||||||||||||||||||
| 11/15/2013 | (4)(5) | $ | 337,500 | 300,000 | $ | 1,012,500 | ||||||||||||||||||||||||||||||||
| 11/15/2013 | (6) | 360,000 | $ | 2.25 | $ | 529,200 | ||||||||||||||||||||||||||||||||
| James M. Chirico, Jr. |
(1) | $ | 573,750 | $ | 1,147,500 | |||||||||||||||||||||||||||||||||
| (2) | $ | 675,000 | ||||||||||||||||||||||||||||||||||||
| 11/15/2013 | (3) | $ | 1,125,000 | $ | 1,687,500 | |||||||||||||||||||||||||||||||||
| 11/15/2013 | (4)(5) | $ | 337,500 | 300,000 | $ | 1,012,500 | ||||||||||||||||||||||||||||||||
| 11/15/2013 | (6) | 360,000 | $ | 2.25 | $ | 529,200 | ||||||||||||||||||||||||||||||||
| Pierre-Paul Allard |
(1) | $ | 420,000 | $ | 840,000 | |||||||||||||||||||||||||||||||||
| (2) | $ | 400,000 | ||||||||||||||||||||||||||||||||||||
| $ | 900,000 | |||||||||||||||||||||||||||||||||||||
| 11/15/2013 | (3) | $ | 750,000 | $ | 1,125,000 | |||||||||||||||||||||||||||||||||
| 11/15/2013 | (4)(5) | $ | 225,000 | 200,000 | $ | 675,000 | ||||||||||||||||||||||||||||||||
| 11/15/2013 | (6) | 240,000 | $ | 2.25 | $ | 352,800 | ||||||||||||||||||||||||||||||||
| Roger Gaston |
(1) | $ | 318,750 | $ | 637,500 | |||||||||||||||||||||||||||||||||
| (2) | $ | 425,000 | ||||||||||||||||||||||||||||||||||||
| 11/15/2013 | (3) | $ | 500,000 | $ | 750,000 | |||||||||||||||||||||||||||||||||
| 11/15/2013 | (4)(5) | $ | 150,000 | 133,333 | $ | 449,999 | ||||||||||||||||||||||||||||||||
| 11/15/2013 | (6) | 160,000 | $ | 2.25 | $ | 235,200 | ||||||||||||||||||||||||||||||||
| (1) | Represents fiscal 2014 target and maximum under the EC DAIP, which is discussed above under “Fiscal 2014 Compensation Elements and Pay Decisions - EC DAIP”. |
| (2) | Represents fiscal 2014 target under the EC LTIP, which is discussed above under “One-Time and Legacy Long-Term Incentive Plans - EC Performance Recognition Program (“EC LTIP”).” |
| (3) | Represents the target and maximum, including the 3-year performance-based value that could be earned of the cash portion of the fiscal 2014 LTI grant. The target value of the award vests ratably on an annual basis over a 3-year period. If earned, the performance value vests immediately upon grant. See “Fiscal 2014 Compensation Elements and Pay Decisions - Long-Term Incentives” for additional details. |
149
Table of Contents
| (4) | Value reported as “Target” represents the total amount that could be earned over the 3-year performance-based period with respect to the performance value of the RSU portion of the fiscal 2014 LTI grant. If earned, the value is converted to units which will be fully vested upon grant. See “Fiscal 2014 Compensation Elements and Pay Decisions - Long-Term Incentives” for additional details. |
| (5) | Number of units reported as “All Other Stock Awards” represents the RSU portion of the fiscal 2014 LTI grant, which vests one-third on the first anniversary of the grant date and one-twelfth on each quarterly anniversary until fully vested on the third anniversary of the grant date. See “Fiscal 2014 Compensation Elements and Pay Decisions - Long-Term Incentives” for additional details. |
| (6) | Represents the stock option portion of the fiscal 2014 LTI grant, which vests one-third on the first anniversary of the grant date and one-twelfth on each quarterly anniversary until fully vested on the third anniversary of the grant date. See “Fiscal 2014 Compensation Elements and Pay Decisions - Long-Term Incentives” for additional details. |
| (7) | Under the terms of the 2007 Plan (defined below), the exercise price for an award cannot be less than the fair market value of a share of our common stock on the date of grant. The exercise prices indicated represent the fair market value of our common stock on the applicable grant dates, as determined by the Compensation Committee, the administrator under the 2007 Plan. |
| (8) | Amounts shown represent the grant date fair value of each award as calculated in accordance with ASC 718, without regard to forfeiture assumptions, and assumes a price of $2.25 per share of the Company’s common stock. |
Description of Equity Plan
Executive officers, including the NEOs, and other employees, directors and consultants are eligible to participate in the 2007 Plan. As of September 30, 2014, 49,848,157 shares of the Company’s common stock were authorized for issuance under the 2007 Plan. The 2007 Plan was amended by the Compensation Committee on August 13, 2014, and approved by the stockholders of the Company effective November 20, 2014 to make an additional 6,009,248 shares available for issuance, increasing the total amount of shares of the Company’s common stock available for issuance under the 2007 Plan to 55,857,405, in addition to 2,984,125 shares of common stock underlying certain continuation awards and other awards that were permitted to be issued at the time of the Merger. The Company’s common stock is not publicly traded. See “Management’s Discussion and Analysis-Use of Estimates and Critical Accounting Policies-Share-based Compensation” for information on the methodology to value the Company’s common stock.
RSUs
Each RSU awarded under the 2007 Plan, when vested, entitles the holder to receive one share of the Company’s common stock, subject to certain restrictions on their transfer and sale as provided for in the 2007 Plan and the related award agreements.
Prior to fiscal 2015 RSUs granted to executive officers generally vest one-third on the first anniversary of the grant date and one-twelfth on each quarterly anniversary thereafter. Starting in fiscal 2015 RSUs granted to executive officers will vest one-fourth on the first anniversary of the grant date and one-sixteenth on each quarterly anniversary thereafter.
Stock Options
Each stock option, when vested and exercised, entitles the holder to receive one share of the Company’s common stock, subject to certain restrictions on transfer and sale as provided for in the 2007 Plan and the related award agreements. Prior to fiscal 2015s stock options granted to executive officers generally vest one-third on the first anniversary of the grant date and one-twelfth on each quarterly anniversary thereafter. Starting in fiscal 2015 stock options granted to executive officers will vest one-fourth on the first anniversary of the grant date and one-sixteenth on each quarterly anniversary thereafter. All stock options awarded under the 2007 Plan expire ten
150
Table of Contents
years from the date of grant or upon cessation of employment, in which event there are limited exercise provisions associated with vested stock options.
To the extent an individual acquires shares of the Company’s common stock upon exercise of a stock option or vesting of an RSU, those shares are subject to the restrictions on transfer and other provisions contained in a management stockholders’ agreement and, in the case of certain executive officers, including certain of the NEOs, a registration rights agreement. See “Certain Relationships and Related Transactions and Director Independence.”
Outstanding Equity Awards at Fiscal Year End
The following table sets forth the outstanding equity awards at the end of fiscal 2014 for each of the NEOs:
| OPTION AWARDS | STOCK AWARDS | |||||||||||||||||||||||||||||||||
| Name |
Number of Securities Underlying Unexercised Options # Exercisable(1) |
Number of Securities Underlying Unexercised Options # Unexercisable(2)(3) |
Equity Incentive Plan Awards: Number of Securities Underlying Unexercised Unearned Options |
Option Exercise Price |
Option Expiration Date |
Number of Shares or Units of Stock That Have Not Vested ($)(4)(6) |
Market Value of Shares or Units of Stock That Have Not Vested ($)(5) |
Equity Incentive Plan Awards: Number of unearned shares, units, or othe rights that have not vested (#) |
Equity Incentive Plan Awards: Market or Payout Value of Unearned Shares, Units or Other Rights That Have Not Vested ($)(6) |
|||||||||||||||||||||||||
| Kevin J. Kennedy |
3,250,000 | — | — | $ | 3.00 | 11/17/2019 | ||||||||||||||||||||||||||||
| 650,000 | — | — | $ | 3.00 | 11/19/2019 | |||||||||||||||||||||||||||||
| — | 2,000,000 | — | $ | 2.25 | 12/11/2023 | |||||||||||||||||||||||||||||
| — | 1,200,000 | — | $ | 2.25 | 12/11/2023 | |||||||||||||||||||||||||||||
| 1,000,000 | $ | 2,500,000 | $ | 1,125,000 | ||||||||||||||||||||||||||||||
| David Vellequette |
81,250 | 243,750 | $ | 4.00 | 10/1/2022 | |||||||||||||||||||||||||||||
| — | 360,000 | $ | 2.25 | 11/15/2023 | ||||||||||||||||||||||||||||||
| 412,500 | $ | 1,031,250 | $ | 337,500 | ||||||||||||||||||||||||||||||
| James M. Chirico, Jr. |
650,000 | — | $ | 3.00 | 11/17/2019 | |||||||||||||||||||||||||||||
| 162,500 | — | $ | 3.00 | 11/17/2019 | ||||||||||||||||||||||||||||||
| 260,000 | — | $ | 3.00 | 11/19/2019 | ||||||||||||||||||||||||||||||
| — | 360,000 | $ | 2.25 | 11/15/2023 | ||||||||||||||||||||||||||||||
| 300,000 | $ | 750,000 | $ | 337,500 | ||||||||||||||||||||||||||||||
| Pierre-Paul Allard |
113,750 | 113,750 | $ | 4.00 | 5/17/2022 | |||||||||||||||||||||||||||||
| 43,125 | 129,375 | $ | 2.25 | 6/28/2023 | ||||||||||||||||||||||||||||||
| — | 240,000 | $ | 2.25 | 11/15/2023 | ||||||||||||||||||||||||||||||
| 275,000 | $ | 687,500 | $ | 225,000 | ||||||||||||||||||||||||||||||
| Roger Gaston |
416,000 | — | $ | 3.00 | 11/17/2019 | |||||||||||||||||||||||||||||
| 292,500 | — | $ | 3.00 | 11/19/2019 | ||||||||||||||||||||||||||||||
| — | 160,000 | $ | 2.25 | 11/15/2023 | ||||||||||||||||||||||||||||||
| 133,333 | $ | 333,333 | $ | 150,000 | ||||||||||||||||||||||||||||||
| (1) | Represents the exercisable portion of stock options granted and outstanding. |
| (2) | Represents the unvested and un-exercisable portion of stock options granted and outstanding. |
| (3) | The vesting dates for the stock option awards indicated are as follows: |
151
Table of Contents
| Name |
Number of Securities Underlying Options |
Grant Date | Vesting Description | |||||||
| Kevin J. Kennedy |
2,000,000 | 12/11/2013 | 1/3 on 1st anniversary; 1/12 each quarterly anniversary thereafter | |||||||
| 1,200,000 | 12/11/2013 | 1/3 on 1st anniversary; 1/12 each quarterly anniversary thereafter | ||||||||
| David Vellequette |
325,000 | 10/1/2012 | 25% annually | |||||||
| 360,000 | 11/15/2013 | 1/3 on 1st anniversary; 1/12 each quarterly anniversary thereafter | ||||||||
| James M. Chirico, Jr. |
360,000 | 11/15/2013 | 1/3 on 1st anniversary; 1/12 each quarterly anniversary thereafter | |||||||
| Pierre-Paul Allard |
227,500 | 5/17/2012 | 25% annually | |||||||
| 172,500 | 6/28/2013 | 25% annually | ||||||||
| 240,000 | 11/15/2013 | 1/3 on 1st anniversary; 1/12 each quarterly anniversary thereafter | ||||||||
| Roger Gaston |
160,000 | 11/15/2013 | 1/3 on 1st anniversary; 1/12 each quarterly anniversary thereafter | |||||||
| (4) | The awards are scheduled to vest as follows: |
| Name | RSU Award |
Grant Date | RSUs Vested |
RSUs Cancelled |
RSUs Unvested |
Vesting Description | ||||||||||||||||
| Kevin J. Kennedy |
1,000,000 | 12/11/2013 | — | — | 1,000,000 | 1/3 on 1st anniversary; 1/12 each quarterly anniversary thereafter | ||||||||||||||||
| David Vellequette |
150,000 | 10/1/2012 | 37,500 | — | 112,500 | 25% annually | ||||||||||||||||
| 300,000 | 11/15/2013 | — | — | 300,000 | 1/3 on 1st anniversary; 1/12 each quarterly anniversary thereafter | |||||||||||||||||
| James M. Chirico, Jr. |
300,000 | 11/15/2013 | — | — | 300,000 | 1/3 on 1st anniversary; 1/12 each quarterly anniversary thereafter | ||||||||||||||||
| Pierre-Paul Allard |
100,000 | 6/28/2013 | 25,000 | — | 75,000 | 25% annually | ||||||||||||||||
| 200,000 | 11/15/2013 | — | — | 200,000 | 1/3 on 1st anniversary; 1/12 each quarterly anniversary thereafter | |||||||||||||||||
| Roger Gaston |
133,333 | 11/15/2013 | — | — | 133,333 | 1/3 on 1st anniversary; 1/12 each quarterly anniversary thereafter | ||||||||||||||||
| (5) | Determined using the fair market value of the Company’s common stock as of the last day of the fiscal year, which was $2.50 per share. |
| (6) | Represents the total 3-year performance-based potential upside value of the RSU portion of the fiscal 2014 LTI grant. If earned, the value is converted to units which will be fully vested upon grant. See “Fiscal 2014 Compensation Elements & Pay Decisions - Long-Term Incentives” for additional details. |
152
Table of Contents
Options Exercised and Stock Vested
During fiscal 2014, there were no exercises of stock options by any of the NEOs. The following table sets forth the vesting of RSU awards in fiscal 2014:
| Option Awards | Stock Awards | |||||||||||||||||
| Name |
Number of Shares Acquired on Exercise (#) |
Value Realized on Exercise ($) |
Number of Shares Acquired on Vesting (#) |
Value Realized on Vesting ($)(1) |
||||||||||||||
| Kevin J. Kennedy |
— | — | 1,033,334 | 2,417,594 | ||||||||||||||
| David Vellequette |
— | — | 187,499 | 447,335 | ||||||||||||||
| James M. Chirico, Jr. |
— | — | 284,166 | 664,836 | ||||||||||||||
| Pierre-Paul Allard |
— | — | 149,167 | 371,274 | ||||||||||||||
| Roger Gaston |
— | — | 177,166 | 412,511 | ||||||||||||||
| (1) | The receipt of shares subject to each of these RSU awards has been deferred. Had the shares been delivered to the recipients on vesting, the value realized by each individual per share would range from $2.25 to $2.75, which was the fair market value of one share of our common stock on each of their respective vesting dates. |
Nonqualified Deferred Compensation
The table below sets forth information concerning all nonqualified deferred compensation earned by each of the NEOs during fiscal 2014.
All information represents data from the ASRP, a nonqualified defined contribution plan designed to restore lost tax-deferred savings opportunities for executive officers unavailable under the ASPSE, the Company’s qualified savings plan, due to Code limitations. Executive officers may contribute from 1-25% of eligible compensation (including base pay, short-term disability payments, short-term incentive compensation and marketing/sales compensation paid after the executive officer reaches the maximum contribution and/or compensation limit established by the Code). Effective March 1, 2009, the Company suspended matching contributions to this plan. Earnings are based on the individual fund allocations selected by each participant from among the variety of different investment fund choices available; investment elections can be changed daily, subject to certain funds’ trading restrictions. All participants are fully vested.
| Name |
Executive Contributions in the Last Fiscal Year |
Registrant Contributions in the Last Fiscal Year |
Aggregate Earnings in the Last Fiscal Year |
Aggregate Withdrawals/ Distributions in the Last Fiscal Year |
Aggregate Balance at the Last Fiscal Year End |
|||||||||||||||
| Kevin J. Kennedy |
$ | 79,225 | — | $ | 12,251 | — | $ | 377,196 | ||||||||||||
| David Vellequette |
— | — | — | — | — | |||||||||||||||
| James M. Chirico, Jr. |
$ | 51,800 | — | $ | 37,365 | — | $ | 386,159 | ||||||||||||
| Pierre-Paul Allard |
— | — | — | — | — | |||||||||||||||
| Roger Gaston |
$ | 34,800 | — | $ | 19,252 | — | $ | 276,903 | ||||||||||||
Potential Payments on Occurrence of Change of Control and Other Events
General
The sections below indicate amounts that could have been received by each of the NEOs following, or in connection with, involuntary separation, resignation and retirement. The sections assume that the triggering event happened as of September 30, 2014. It should be noted that each of the sections below represents the various amounts that could have been received by the NEOs under alternative scenarios, and they are not cumulative in nature.
153
Table of Contents
Involuntary Separation
Cash and Benefits
During fiscal 2014, the NEOs were participants under the Avaya Inc. Involuntary Separation Plan for Senior Officers, or the Senior Officer Plan. The Plan is designed to provide a specific payment and certain benefit enhancements to eligible Senior Officers of Avaya and its affiliated companies and subsidiaries in the event that their employment is involuntarily terminated under certain conditions.
The Senior Officer Plan covers the CEO and each other officer of the Company who is elected by the Company’s board of directors at a level above vice president and who is designated “At Risk” under the Avaya Force Management Program Guidelines.
The Senior Officer Plan provides that a Senior Officer is “At Risk” if there is a Company initiated termination other than for “cause,” defined as: (i) a material breach of duties and responsibilities as an executive officer of the Company (other than as a result of incapacity due to physical or mental illness) which is demonstrably willful and deliberate, which is committed in bad faith or without reasonable belief that such breach is in the best interests of the Company and which is not remedied in a reasonable period of time after receipt of written notice from the Company specifying such breach; (ii) conviction (including a plea of guilty or nolo contendere) of a felony involving moral turpitude; (iii) the commission of theft, fraud, breach of trust or any act of dishonesty involving the Company or its subsidiaries; or (iv) any significant violation of the Company’s Code of Conduct or any statutory or common law duty of loyalty to the Company or its subsidiaries.
In the event that a Senior Officer (other than Mr. Kennedy) is terminated by the Company other than for “cause,” that Senior Officer is entitled to receive under the Senior Officer Plan, upon executing a termination agreement and release, a payment equal to 100% of final annual base salary, along with certain other benefits to continue for a period of time post-termination of employment, including certain medical benefits as prescribed by applicable law, and outplacement services. With respect to Mr. Kennedy, the terms of his employment agreement provide that his involuntary termination would be governed by the same plan, but he would be entitled to a payment equal to 200% of his base salary plus 200% of his target bonus under the Company’s short term incentive plan for the year of termination, in addition to the other benefits offered generally to Senior Officers under the Senior Officer Plan.
Under the terms of the EC LTIP, if a participant’s employment was terminated involuntarily without cause as of September 30, 2014, such participant’s account would have been credited for any amount earned during fiscal 2014 and subsequently paid on December 31, 2015.
The table below represents amounts that could have been received by each of the NEOs as of September 30, 2014, assuming an involuntary separation occurred on that date.
| Name |
Cash Payment Based on Salary(1) |
Cash Payment Based on Target Bonus(2) |
Outplacement Services (3) |
Total (4) | ||||||||||||
| Kevin J. Kennedy |
$ | 2,500,000 | $ | 3,125,000 | $ | 7,000 | $ | 5,632,000 | ||||||||
| David Vellequette |
$ | 625,000 | $ | 562,500 | $ | 7,000 | $ | 1,194,500 | ||||||||
| James M. Chirico, Jr. |
$ | 675,000 | $ | 573,750 | $ | 7,000 | $ | 1,255,750 | ||||||||
| Pierre-Paul Allard |
$ | 525,000 | $ | 420,000 | $ | 7,000 | $ | 952,000 | ||||||||
| Roger Gaston |
$ | 425,000 | $ | 318,750 | $ | 7,000 | $ | 750,750 | ||||||||
| (1) | Amounts represent two times annual base salary for Mr. Kennedy, and one times annual base salary for each of Messrs. Vellequette, Chirico, Allard, and Gaston, each as of September 30, 2014. |
| (2) | Amount for Mr. Kennedy is equal to two times his target EC DAIP award as per his employment agreement. Amounts indicated for NEOs other than Mr. Kennedy assume that the last date of employment was |
154
Table of Contents
| September 30, 2014 and that the Company paid EC DAIP at target. Amounts reflect total target EC DAIP opportunity for the fiscal year, regardless of whether or not actually earned - e.g., regardless of actual results for fiscal 2014 as set forth above under “-Fiscal 2014 Compensation Elements and Pay Decisions - EC Discretionary Annual Incentive Plan (“EC DAIP”).” See “Summary Compensation Table” for actual EC DAIP payments earned in 2014. |
| (3) | Represents an estimated cost to the Company for outplacement services based upon historical experience. |
| (4) | Excludes amounts earned in the EC LTIP Plan for fiscal 2014. See “Summary Compensation Table” and chart in footnote (4). |
Stock Options
Termination without Cause (Outside of the Change in Control Context)
If an employee is terminated without “cause,” generally there would be an acceleration of vesting of time-based stock options as follows: one quarter of the shares that otherwise would have vested at the end of the vesting year had the termination not occurred will vest for each partial or full quarter in which the optionee was employed during that vesting year. “Vesting year” means a twelve-month period beginning on the date of grant or an anniversary of the date of grant, as applicable, and ending on the first anniversary of such beginning date.
Generally, the employee would have 90 days post-termination of employment to exercise any vested stock options, and any unvested stock options would be forfeited as of the date of termination. However, Mr. Kennedy’s employment agreement would allow him 12 months to exercise his vested stock options in such an event. The number of stock options for which vesting would be accelerated due to an involuntary termination as of September 30, 2014 and the value of the accelerated options are represented in the table below. In as much as the exercise price of each option is equal to or greater than the fair market value, those stock options are not exercisable, and no value has been attributed to them below.
| Name |
Number of Time-based Stock Options Accelerated Vesting |
Exercise Price |
Value of Accelerated Vesting Options |
|||||||||
| Kevin J. Kennedy |
1,066,667 | $ | 2.25 | $ | 266,667 | |||||||
| David Vellequette |
81,250 | $ | 4.00 | — | ||||||||
| 120,000 | $ | 2.25 | $ | 30,000 | ||||||||
| James M. Chirico, Jr. |
120,000 | $ | 2.25 | $ | 30,000 | |||||||
| Pierre-Paul Allard |
28,438 | $ | 4.00 | — | ||||||||
| 101,563 | $ | 2.25 | $ | 25,391 | ||||||||
| Roger Gaston |
53,333 | $ | 2.25 | $ | 13,333 | |||||||
Termination without Cause (Change in Control Context)
Stock option award agreements also contain certain provisions that are triggered upon a change in control. Under the 2007 Plan, “change in control” is defined to mean the acquisition by a person or group of at least forty percent (40%) of the issued and outstanding shares of common stock or securities representing at least forty percent (40%) of the voting power of the Company.
With respect to time-based stock options, if an employee is terminated without cause within one-year following a change in control, then, unless the stock option has been terminated, exercised or exchanged for other current or deferred cash or property in connection with the change in control, the time-based stock option is treated as having vested in full immediately prior to such termination of employment.
Generally, a terminated employee would have 90 days post-termination of employment to exercise any of such vested time-based stock options. Mr. Kennedy’s employment agreement would allow him 12 months to
155
Table of Contents
exercise all of his stock options in such an event. The number of stock options for which vesting would be accelerated due to an involuntary termination due to a change in control as of September 30, 2014 and the value of the accelerated options are represented in the table below. Pursuant to the terms of the 2007 Plan, if the exercise price of a grant is equal to or greater than the fair market value, those stock options are not exercisable. The fair market value of a share of the Company’s common stock on September 30, 2014 was $2.50. When the fair market value of $2.50 is less than the respective exercise prices for those awards, no value has been attributed to them.
| Name |
Number of Time-based Stock Options Accelerated Vesting |
Exercise Price |
Value of Accelerated Vesting Options |
|||||||||
| Kevin J. Kennedy |
3,200,000 | $ | 2.25 | $ | 800,000 | |||||||
| David Vellequette |
243,750 | $ | 4.00 | — | ||||||||
| 360,000 | $ | 2.25 | $ | 90,000 | ||||||||
| James M. Chirico, Jr. |
360,000 | $ | 2.25 | $ | 90,000 | |||||||
| Pierre-Paul Allard |
113,750 | $ | 4.00 | — | ||||||||
| 369,375 | $ | 2.25 | $ | 92,344 | ||||||||
| Roger Gaston |
160,000 | $ | 2.25 | $ | 40,000 | |||||||
Restricted Stock Units
RSU awards issued under the 2007 Plan, including the RSU portions of the STGI awards, generally provide for accelerated vesting upon death or disability or upon a termination following a change in control (each as defined in the 2007 Plan). As the fair market value of a share of the Company’s common stock on September 30, 2014 was $2.50, the number and value of RSUs that would be accelerated is represented in the table below.
| Name |
Number of Restricted Stock Units Accelerated Vesting |
Fair Market Value at September 30, 2014 |
Value of Accelerated Vesting Units |
|||||||||
| Kevin J. Kennedy |
1,000,000 | $ | 2.50 | $ | 2,500,000 | |||||||
| David Vellequette |
412,500 | $ | 2.50 | $ | 1,031,250 | |||||||
| James M. Chirico, Jr. |
300,000 | $ | 2.50 | $ | 750,000 | |||||||
| Pierre-Paul Allard |
275,000 | $ | 2.50 | $ | 687,500 | |||||||
| Roger Gaston |
133,333 | $ | 2.50 | $ | 333,333 | |||||||
In addition to the amounts shown above, to the extent that receipt of shares underlying previously vested RSUs has been deferred, those shares would be distributed upon the earlier of a change in control, death or disability (each as defined in the 2007 Plan), termination of employment or five (5) years from the grant date. As the fair market value of a share of the Company’s common stock on September 30, 2014 was $2.50, the number of shares and value of previously vested and deferred shares is represented in the table below.
| Name |
Number of Restricted Stock Units Deferred Distribution |
Fair Market Value at September 30, 2014 |
Value of Deferred Distribution Units |
|||||||||
| Kevin J. Kennedy |
1,144,445 | $ | 2.50 | $ | 2,861,113 | |||||||
| David Vellequette |
218,056 | $ | 2.50 | $ | 545,140 | |||||||
| James M. Chirico, Jr. |
388,636 | $ | 2.50 | $ | 971,590 | |||||||
| Pierre-Paul Allard |
173,633 | $ | 2.50 | $ | 434,083 | |||||||
| Roger Gaston |
193,834 | $ | 2.50 | $ | 484,585 | |||||||
156
Table of Contents
Resignation/Retirement
Cash and Benefits
Mr. Kennedy’s employment agreement provides that, in the event he resigns for “good reason,” he would be entitled to receive the same amount as set forth under “Involuntary Separation - Cash and Benefits” above. Under the agreement, “good reason” means: a material reduction by the Company in his base salary; a material breach of the agreement by the Company which shall include a material reduction or material negative change by the Company in the type or level of compensation and benefits (other than base salary) to which he is entitled under the agreement, other than any such reduction or change that is part of and consistent with a general reduction or change applicable to all senior officers of the Company; a material failure by the Company to pay or provide to him any compensation or benefits to which he is entitled; a change in Mr. Kennedy’s status, positions, titles, offices or responsibilities that constitutes a material and adverse change from his status, positions, titles, offices or responsibilities as in effect immediately before such change; the assignment to him of any duties or responsibilities that are materially and adversely inconsistent with his status, positions, titles, offices or responsibilities as in effect immediately before such assignment; any removal of Mr. Kennedy from or failure to reappoint or reelect him to any of such positions, titles or offices; the Company changing the location of its principal executive offices to a location more than 50 miles from its current principal office; any material breach by the Company of the agreement or any other agreement between the Company and Mr. Kennedy incorporated by reference in the agreement; or the provision of notice by the Company of its intention not to renew the agreement.
In all other contexts, upon resignation or retirement, there would be no continuation of benefits (other than certain medical benefits as prescribed by applicable law) and no additional payments made under any of the Company’s defined contribution (qualified and nonqualified) plans to any of the NEOs, other than as set forth under the “Nonqualified Deferred Compensation Plans” table.
With respect to the EC LTIP, if a participant’s employment was terminated due to retirement as of September 30, 2014, such participant’s account would have been credited for any amount earned during fiscal 2014 and subsequently paid on December 31, 2015. If a Change of Control had occurred prior to September 30, 2014 and a participant’s employment was voluntarily terminated with “good reason” within one year of the Change of Control event, such participant’s account would have been credited for any amount earned during fiscal 2014.
Equity Awards
Generally, each of the NEOs has up to 30 days subsequent to a resignation to exercise vested stock options, and any unvested stock options as of the date of termination of employment are forfeited. If the resignation is for “good reason” (as defined in the 2007 Plan), then each of the NEOs would have 90 days from the date of such termination to exercise any vested stock options. However, Mr. Kennedy’s employment agreement provides that, with respect to his stock option awards, he would have 12 months following his termination of employment to exercise those stock options.
In addition, with respect to time-based stock options, if the resignation is for “good reason” and it occurs within one-year following a change in control (as defined under the 2007 Plan), then, unless the time-based stock option has been terminated, exercised or exchanged for other current or deferred cash or property in connection with the change in control, the time-based stock option is treated as having vested in full immediately prior to such termination of employment. For a summary of the time-based stock options held by each of the Named Executive Officers, please see “Outstanding Equity Awards at Fiscal Year-End.” The number and value of the shares accelerated on resignation for “good reason” is identical to the section above labeled “Termination without Cause (Change in Control Context).”
157
Table of Contents
Confidentiality; Non-Compete; Non-Solicitation; Recoupment of Profits
All of the Company’s senior officers, including the NEOs, have signed confidentiality agreements as a requirement for receiving certain stock-based compensation. The agreements stipulate that these officers will not misappropriate or disclose the Company’s proprietary information.
The agreements generally provide that, during the term of their employment and for a period of twelve months from the date of termination of employment, the officers will not directly or indirectly: (i) subject to certain exceptions, work for or provide services to, in any capacity, whether as an employee, independent contractor or otherwise, whether with or without compensation, a material competitor of the Company; (ii) hire or solicit for hire any employee of the Company or seek to persuade or induce any employee of the Company to discontinue employment with the Company; (iii) hire or engage any independent contractor providing services to the Company, or solicit, encourage or induce any independent contractor providing services to the Company to terminate or diminish in any substantial respect its relationship with the Company; (iv) subject to certain limitations, (a) solicit, encourage or induce any customer of the Company to terminate or diminish in any substantial respect its relationship with the Company or (b) seek to persuade or induce any such customer or prospective customer of the Company to conduct with anyone else any substantial business or activity which such customer or prospective customer conducts or could conduct with the Company.
If the officers breach the provisions of these agreements, then the Company shall, in addition to any other remedies available to it, have the right to institute legal proceedings to enjoin the offending conduct. In addition, the Company generally has the immediate right to call and repurchase any shares of stock that have been issued under any stock options that have been awarded to the optionee by the Company at a purchase price that is the lesser of cost or fair market value.
Mr. Kennedy’s Employment Agreement
Mr. Kennedy is party to an employment agreement with the Company under which he agrees to serve as the Company’s President and CEO. The agreement, which became effective December 22, 2008, has an initial three-year term that is automatically renewed for subsequent one-year periods unless notice of non-renewal is delivered by the Company. Under the agreement, Mr. Kennedy’s base salary is $1,250,000.
Under the agreement, Mr. Kennedy received, effective as of the date his employment with the Company commenced, a grant of 5,000,000 stock options having an exercise price equal to the fair market value of a share of the Company’s common stock at the time of grant, which was $3.80. These awards were exchanged for replacement options with an exercise price of $3.00 per share, vesting ratably in four annual installments, under a stock option exchange program available to all holders of stock options, conducted in fiscal 2010.
Effective December 22, 2008, Mr. Kennedy also received 400,000 RSUs, which are now fully vested and for which the underlying shares have been distributed to him. Prior to an initial public offering, (i) if Mr. Kennedy’s employment is terminated other than for cause, (ii) if he voluntarily resigns for any reason or (iii) upon his death or disability, Mr. Kennedy has the right to require the Company to purchase from him any or all of the shares of common stock subject to those vested RSUs at fair market value, unless fair market value is less than $10 per share, in which case the purchase price shall be $10 per share, or the RSU Price. Further, in the event that certain “drag-along” or “tag-along” provisions under the management stockholders’ agreement are exercised and Mr. Kennedy sells shares of common stock underlying those vested RSUs in certain transactions and receives less than $10 per share, then the Company is obligated to pay to Mr. Kennedy the difference between $10 per share and the amount realized by Mr. Kennedy in such transaction.
In addition, the agreement provides that, for so long as Mr. Kennedy is the Company’s CEO, the Sponsors shall ensure that their affiliates vote to elect him as a member of our board of directors.
158
Table of Contents
Director Compensation
In August 2011, the Company implemented a non-affiliated director compensation program in which independent directors of the Company receive an initial grant of RSUs with a market value of $200,000 upon joining the board of directors and an annual retainer of $100,000 in cash (which was to be reduced to $80,000 at such time as the Company had at least three independent directors on its board) plus RSUs with a market value of $150,000. Each independent director who serves on the Audit Committee, Compensation Committee and Nominating and Governance Committee of the Company receives an additional $10,000 as part of his annual retainer in lieu of meeting attendance fees. The Audit Committee Chairperson receives an additional $20,000 as part of his annual retainer and each of the Compensation Committee Chairperson and the Nominating and Governance Committee Chairperson receives an additional $15,000 as part of his annual retainer. Eligible directors could elect to receive their cash retainers in the form of RSUs, provided that at least 50% of their aggregate annual cash compensation was required to be in the form of RSUs. Each RSU granted under the program vests immediately upon issuance and is distributed to a director upon his resignation or removal from the Company’s board. The market value of all RSUs granted under the program is established based on the fair market value of a share of the Company’s common stock on the date prior to the date on which that director is elected or appointed to serve.
Effective October 1, 2013, the Company’s board revised the program to (i) set the annual cash retainer at $100,000 and eliminate the step-down to $80,000 in the event three or more independent directors serve on the Company’s board and (ii) remove the requirement that independent directors must elect to receive at least 50% of their aggregate annual cash compensation in the form of RSUs. All other terms of the program remain unchanged.
In December 2013 we executed letter agreements with each of Messrs. Mohebbi and Rittenmeyer agreeing to pay them Director fees in cash. We agreed to pay Mr. Mohebbi $450,000 for 2013 and $500,000 for 2014 and beyond and Mr. Rittenmeyer $75,000 for 2013 and $300,000 for 2014 and beyond.
Below is a summary of the compensation received by our Directors for their services as directors of the Company during fiscal 2014. Except as indicated below, none of our other directors received compensation from us for service on the board of directors during fiscal 2014.
| Name |
Fees Earned of Paid in Cash ($) |
Stock Awards ($)(1) |
Total ($) |
|||||||||
| Mary Henry2 |
$ | — | $ | 375,000 | $ | 375,000 | ||||||
| Afshin Mohebbi |
$ | 500,000 | $ | — | $ | 500,000 | ||||||
| Kiran Patel3 |
$ | — | $ | 480,000 | $ | 480,000 | ||||||
| Ronald Rittenmeyer |
$ | 300,000 | $ | — | $ | 300,000 | ||||||
| Gary Smith4 |
$ | 120,000 | $ | 150,000 | $ | 270,000 | ||||||
| (1) | Amounts indicated for “Stock Awards” represent the fair value of the awards at the date of grant as calculated in accordance with Financial Accounting Standards Board Accounting Standards Codification Topic 718, “Compensation-Stock Compensation,” or ASC 718, without regard to forfeiture assumptions. For more information regarding the valuation of stock-based awards (including assumptions made in such valuation), refer to Note 15, “Share-based Compensation,” to our audited Consolidated Financial Statements included elsewhere in this report. |
| (2) | Includes Ms. Henry’s inaugural grant of RSUs, annual grant of RSUs and pro-rated annual retainer which she elected to receive in the form of RSUs. |
| (3) | Includes Mr. Patel’s inaugural grant of RSUs, annual grant of RSUs and annual retainers which he elected to receive in the form of RSUs. |
| (4) | Includes Mr. Smith’s annual grant of RSUs and annual retainers which he elected to receive in the form of cash. |
159
Table of Contents
Compensation Committee Interlocks and Insider Participation
During fiscal 2014, Mr. Giancarlo served as a member of the Compensation Committee. Mr. Giancarlo served as our President and Chief Executive Officer from June 20, 2008 until December 22, 2008. In addition, each of the Compensation Committee members is a party to a relationship with the Company as more fully set forth under the heading “Certain Relationships and Related Party Transactions” below.
160
Table of Contents
CERTAIN RELATIONSHIPS AND RELATED PARTY TRANSACTIONS
Arrangements with Our Sponsors
In connection with their investment in us, we entered into certain stockholder agreements and registration rights agreements with the Sponsors and various co-investors. Certain of those agreements were amended in connection with the financing of the NES acquisition and again in connection with the financing of the Radvision acquisition (see Note 10, “Financing Arrangements,” to our audited Consolidated Financial Statements for the fiscal year ended September 30, 2014 for more information). The co-investors include individuals and entities invited by our Sponsors to participate in our financings, such as affiliated investment funds, individuals employed by affiliates of our Sponsors, limited partners of our Sponsors and members of our management. In addition, we entered into a management services agreement with affiliates of the Sponsors and, from time to time, we may enter into various other contracts with companies affiliated with our Sponsors.
Stockholders’ Agreement
In connection with the Merger, we entered into a stockholders’ agreement with the Sponsors and certain of their affiliates. This stockholders’ agreement was amended and restated in connection with the financing of the NES acquisition and again in connection with the financing of the Radvision acquisition. The stockholders’ agreement contains certain restrictions on the Sponsors’ and their affiliates’ ability to transfer our equity securities, contains provisions regarding participation rights, contains standard tag-along and drag-along provisions, provides for the election of our directors, mandates Board of Directors approval of certain matters to include the consent of each Sponsor and generally sets forth the respective rights and obligations of the stockholders who are parties to that agreement. None of our officers or directors are parties to this agreement, although certain of our non-employee directors may have an indirect interest in the agreement to the extent of their affiliations with the Sponsors.
Registration Rights Agreement
In addition, in connection with the Merger, we entered into a registration rights agreement with the Sponsors and certain of their affiliates which was amended and restated in connection with the financing of the NES acquisition and again in connection with the financing of the Radvision acquisition. Pursuant to the registration rights agreement, as amended, we will provide the Sponsors and certain of their affiliates party thereto with certain demand registration rights following the expiration of the 180-day lockup period in respect of the shares of our common stock held by them. In addition, in the event that we register additional shares of common stock for sale to the public following the consummation of this offering, we will be required to give notice of such registration to the Sponsors and their affiliates party to the agreement of our intention to effect such a registration, and, subject to certain limitations, the Sponsors and such holders will have piggyback registration rights providing them with the right to require us to include shares of common stock held by them in such registration. We will be required to bear the registration expenses, other than underwriting discounts and commissions and transfer taxes, if any, associated with any registration of shares by the Sponsors or other holders described above. We have agreed to indemnify each holder of our common stock covered by the registration rights agreement for violations of federal or state securities laws by us in connection with any registration statement, prospectus or any preliminary prospectus. Each holder of such securities has in turn agreed to indemnify us for federal or state securities law violations that occur in reliance upon written information the holder provides to the Company in connection with any registration statement in which a holder of such securities is participating. None of our officers or directors is a party to this agreement, although our non-employee directors may have an indirect interest in the agreement to the extent of their affiliations with the Sponsors.
Management Services Agreement and Consulting Services
Both Avaya Holdings Corp. and Avaya Inc. are party to a management services agreement with Silver Lake Management Company, L.L.C., an affiliate of Silver Lake, and TPG Capital Management, L.P., an affiliate of
161
Table of Contents
TPG, who are collectively referred to as the Managers, pursuant to which the Managers provide management and financial advisory services to us. Pursuant to the management services agreement, the Managers receive a monitoring fee of $7.0 million per annum, or the monitoring fees, and reimbursement on demand for out-of-pocket expenses incurred in connection with the provision of such services. In the event of a financing, acquisition, disposition or change of control transaction involving us during the term of the management services agreement, the Managers have the right to require us to pay to the Managers a fee equal to customary fees charged by internationally-recognized investment banks for serving as a financial advisor in similar transactions. The management services agreement may be terminated at any time by the Managers, but otherwise has an initial term ending on December 31, 2017 that automatically extends each December 31 for an additional year unless earlier terminated by us or the Managers. The term has automatically extended seven times since the execution of the agreement such that the current term is December 31, 2024. The management services agreement will terminate pursuant to its terms upon consummation of this offering, and, upon termination, the Managers will receive a one-time fee in an amount equal to $ , which is the net present values of the monitoring fees that would have been payable during the remaining term of the management services agreement. The termination fee will be calculated using the current term ending December 31, 2024. The management services agreement contains customary exculpation and indemnification provisions in favor of the Managers and their affiliates.
In December 2013, the Company and TPG Capital Management, L.P. executed a letter agreement reducing the portion of the monitoring fees owed to TPG Capital Management, L.P. by $1,325,000 for fiscal 2014 and thereafter on an annual basis by $800,000. The executed letter agreement also provided that the Company agreed to pay Messrs. Mohebbi and Rittenmeyer for their service as Directors $450,000 and $75,000, respectively, for fiscal 2013 and $500,000 and $300,000, respectively, for fiscal 2014 and each fiscal year thereafter.
In the course of business, Avaya will enter into arrangements with affiliates of the Sponsors pursuant to which consultants are engaged to provide services to the Company. For each of fiscal 2014, 2013 and 2012, expenses associated with these consulting agreements with affiliates of TPG were less $1 million.
Transactions with Other Sponsor Portfolio Companies
The Sponsors are private equity firms that have investments in companies that do business with Avaya. For fiscal 2014, 2013 and 2012, we recorded $27 million, $6 million and $7 million, respectively, associated with sales of the Company’s products and services to companies in which one or both of the Sponsors have investments. For fiscal 2014, 2013 and 2012, we purchased goods and services of $8 million, less than $1 million, and $2 million, respectively from companies in which one or both of the Sponsors have investments.
Financing
Term Loans Held by Sponsors
Since April 2008, affiliates of TPG have held a portion of Avaya Inc.’s outstanding term B-1 loans. In fiscal 2013, certain of the term B-1 loans held by those affiliates were reclassified as term B-5 loans, $22 million of which were repaid in connection with the issuance of the 9% Senior Secured Notes. Based on the amount of the term loans that were held during fiscal 2013 and 2012, and consistent with the terms of the loan, those affiliates received payments of principal and interest (inclusive of amounts paid by the Company in connection with the issuance of the 9% Senior Secured Notes) aggregating approximately $23 million and $4 million, respectively.
Since September 2008, an affiliate of Silver Lake held a portion of Avaya Inc.’s outstanding term B-1 loans. In fiscal 2011, certain of the term B-1 loans held by this affiliate were reclassified as term B-3 loans and in fiscal 2013, the remaining term B-1 loans were reclassified as term B-5 loans. Based on the amount of the term loans that were held by an affiliate of Silver Lake during fiscal 2013 and 2012, and consistent with the terms of the loan, that affiliate received payments of principal and interest aggregating approximately $5 million and $10 million, respectively. As of September 30, 2014 and 2013, affiliates of Silver Lake held no outstanding principal amounts of term loans under the senior secured credit facility.
162
Table of Contents
On October 29, 2012, December 21, 2012 and February 13, 2013, Avaya Inc. amended the terms of its credit facilities in connection with certain refinancing transactions. Lenders who provided consents in connection with the amendments and/or agreed to have loans that they held in one tranche of term loans reclassified as another received certain fees. Affiliates of Silver Lake received less than $1 million in each of these transactions. Affiliates of TPG received less than $1 million in each of the 2012 transactions.
See Note 10. “Financing Arrangements,” to our audited Consolidated Financial Statements included elsewhere in this prospectus for further details on our financing arrangements.
Preferred Stock Ownership by Sponsors
In connection with the financing of the acquisition of NES, we issued shares of our non-voting Series A Preferred Stock to affiliates of TPG and Silver Lake. In connection with the financing of the Radvision acquisition, we issued shares of our convertible non-voting Series B Preferred Stock to affiliates of TPG and Silver Lake. For information regarding the equity holdings of affiliates of TPG and Silver Lake, please see “Principal Stockholders.”
Arrangements Involving our Directors and Executive Officers
Sponsor Board Appointments and Director Independence
Charles Giancarlo and Greg Mondre are Directors of each of Avaya Holdings Corp. and Avaya Inc. and they hold the positions of Special Advisor and Managing Partner and Managing Director, respectively, of Silver Lake. John W. Marren, Afshin Mohebbi and Ronald Rittenmeyer are Directors of each of Avaya Holdings Corp. and Avaya Inc. and they hold the positions of Partner, Senior Advisor and Senior Advisor, respectively, of TPG.
Each of Messrs. Patel and Smith and Ms. Henry have been determined by the Board of Directors to meet the independence rules of the New York Stock Exchange and Rule 10A-3 of the Exchange Act.
Senior Manager Registration and Preemptive Rights Agreement and Management Stockholders’ Agreement
In connection with the Merger, we entered into a senior manager registration and preemptive rights agreement with certain current and former members of our senior management who own shares of our common stock and options and RSUs convertible into shares of our common stock, including Messrs, Chirico, Giancarlo and Kennedy. Pursuant to the senior manager registration and preemptive rights agreement we will provide the senior managers party thereto that hold registrable securities thereunder with certain registration rights upon either (a) the exercise of the Sponsors or their affiliates of demand registration rights under the Sponsors’ registration rights agreement discussed above or (b) any request by the Sponsors to file a shelf registration statement for the resale of such shares. In addition, in the event that we register additional shares of common stock for sale to the public following the consummation of this offering, pursuant to the senior manager registration and preemptive rights agreement, senior managers party thereto that hold registrable securities thereunder are entitled to notice of such registration and, subject to certain limitations, such senior managers will have piggyback registration rights providing them with the right to require us to include shares of common stock held by them in such registration. We will be required to bear the registration expenses, other than underwriting discounts and commissions and transfer taxes, if any, associated with any registration of stock by the senior managers as described above. We have agreed to indemnify each holder of registrable securities covered by this agreement for violations of federal or state securities laws by us in connection with any registration statement, prospectus or any preliminary prospectus. Each holder of such registrable securities has in turn agreed to indemnify us for federal or state securities law violations that occur in reliance upon written information the holder provides to the Company in connection with any registration statement in which a holder of such registrable securities is participating.
In addition, pursuant to the senior manager registration and preemptive rights agreement, the Company agreed to provide each senior manager party thereto with certain preemptive rights to participate in any future
163
Table of Contents
issuance of shares of our common stock to the Sponsors or their affiliates. The preemptive rights granted under the senior manager registration and preemptive rights agreement will terminate upon completion of this offering.
In connection with the Merger, we also entered into a management stockholders’ agreement with management stockholders, including all of our named executive officers and Mr. Giancarlo. The stockholders’ agreement contains certain restrictions on such stockholders’ transfer of our equity securities, contains rights of first refusal upon disposition of shares, contains standard tag-along and drag-along provisions, and generally sets forth the respective rights and obligations of the stockholders who are parties to that agreement.
Transactions with Expert Global Solutions Inc.
Ronald A. Rittenmeyer serves on the Board of Directors of Avaya Holdings Corp. and Avaya Inc. and served as Chairman, President and Chief Executive Officer of Expert Global Solutions, Inc. (formerly known as NCO Group, Inc.), or Expert Global Solutions, a global provider of business process outsourcing services until June 2014. During fiscal 2014 and 2013, the Company recorded $8.6 million and $9.3 million, respectively associated with sales of the Company’s products and services to Expert Global Solutions.
Transactions with Intuit, Inc. and The Charles Schwab Family of Funds
Kiran Patel serves on the Board of Directors of Avaya Holdings Corp. and Avaya Inc. and also serves as a trustee of The Charles Schwab Family of Funds, or Charles Schwab, a mutual fund company, and, until September 2013, served as Executive Vice President and General Manager, Small Business Group of Intuit, Inc., or Intuit, a provider of financial software solutions for consumers and small businesses. During fiscal 2013, the Company recorded less than $0.2 million and $2.5 million, respectively associated with sales of the Company’s products and services to Charles Schwab and Intuit, respectively.
Transactions with Ciena Corporation
Gary B. Smith serves on the Board of Directors of Avaya Holdings Corp. and Avaya Inc. and also currently serves as president, Chief Executive Officer and Director of Ciena Corporation, a network infrastructure company. During fiscal 2014, the Company recorded less than $0.4 million associated with sales of the Company’s products and services to Ciena. The Company also purchased goods and services of less than $0.2 million from Ciena during fiscal 2014.
Related Party Transaction Policy
In February 2009, our Board of Directors adopted written procedures for the review, approval and/or ratification of “related party transactions,” which are those transactions required to be disclosed pursuant to Item 404 of Regulation S-K as promulgated by the SEC.
The procedures give our Audit Committee the power to approve or disapprove existing and potential related party transactions involving our directors and certain of our executive officers. Upon becoming aware of an existing or potential related party transaction, the Audit Committee is required to conduct a full inquiry into the facts and circumstances concerning that transaction and to determine the appropriate actions, if any, for us to take. If the Audit Committee does not approve a transaction that is brought before it, then the matter is automatically forwarded to our full board of directors for consideration. A director who is the subject of a potential related party transaction is not permitted to participate in the decision-making process of the Audit Committee or full board of directors, as applicable, relating to what actions, if any, shall be taken by us in light of that transaction.
All related party transactions identified above that occurred during fiscal 2014 or that are currently proposed which required approval and/or ratification through the procedures described above were subject to such review procedures (other than those listed under the heading “Arrangements with our Sponsors-Transactions with Other Sponsor Portfolio Companies” which were transacted in the ordinary course of the Company’s business).
164
Table of Contents
The following table sets forth certain information with respect to the beneficial ownership of our common stock at November 1, 2014 for:
| • | each person whom we know beneficially owns more than five percent of our common stock; |
| • | each of our directors; |
| • | each of our named executive officers; and |
| • | all of our directors and executive officers as a group. |
The number of shares beneficially owned by each stockholder is determined under rules issued by the SEC.
The percentage of common stock beneficially owned by each person before the offering is based on 489,459,943 shares of common stock outstanding as of November 1, 2014, and shares of common stock expected to be outstanding following this offering after giving effect to the shares of common stock offered hereby. See “Description of Capital Stock.” Shares of common stock that may be acquired within 60 days following November 1, 2014 pursuant to the exercise of options or warrants are deemed to be outstanding for the purpose of computing the percentage ownership of such holder but are not deemed to be outstanding for computing the percentage ownership of any other person shown in the table. Beneficial ownership representing less than one percent is denoted with an “*.”
Upon the completion of this offering, investment funds affiliated with the Sponsors will own, in the aggregate, approximately % of our common stock, assuming the underwriters do not exercise their option to purchase additional shares of our common stock. As a result, we intend to be a “controlled company” within the meaning of the corporate governance rules of the New York Stock Exchange.
| Name |
Common Stock of Avaya Holdings Corp. Beneficially Owned |
Percentage of Outstanding Shares Beneficially Owned |
||||||
| Silver Lake Funds and affiliates(1) |
419,814,172 | 73.0 | % | |||||
| TPG Funds and affiliates(2) |
419,814,172 | 73.0 | % | |||||
| Pierre-Paul Allard(3)(4)(5) |
480,487 | * | ||||||
| James M. Chirico, Jr.(3)(4)(5) |
1,716,423 | * | ||||||
| Roger Gaston(3)(4)(5) |
1,149,776 | * | ||||||
| Kevin J. Kennedy(3)(4)(5)(6) |
7,173,392 | 1.4 | % | |||||
| David Vellequette(3)(4)(5) |
638,057 | * | ||||||
| Mary Henry(4) |
137,274 | * | ||||||
| John W. Marren(2)(7) |
— | * | ||||||
| Charles H. Giancarlo(1)(3)(4)(8) |
383,334 | * | ||||||
| Afshin Mohebbi(2)(9) |
— | * | ||||||
| Greg K. Mondre(1)(10) |
— | * | ||||||
| Kiran Patel(4) |
211,717 | * | ||||||
| Ronald Rittenmeyer(1)(11) |
— | * | ||||||
| Gary B. Smith(4) |
229,849 | * | ||||||
| Directors and executive officers as a group, |
14,782,896 | 2.9 | % | |||||
| (1) | The shares of our common stock that are attributed to Silver Lake Funds (as defined below) and affiliates consist of an aggregate of 332,450,000 shares of our common stock, 32,649 shares of our common stock issuable upon conversion of shares of our convertible Series B Preferred Stock and 87,331,523 warrants to purchase shares of our common stock. Of the warrants owned by Silver Lake Funds and affiliates, 71,007,030 warrants have an exercise price of $3.25 per share and are exercisable at any time prior to |
165
Table of Contents
| December 18, 2019, and 16,324,493 warrants have an exercise price of $4.00 per share and are exercisable at any time prior to May 29, 2022. Excluding warrants and shares issuable upon conversion of Series B Preferred Stock, the shares of our common stock that are attributed to Silver Lake Funds and affiliates represent 68% of all shares of our common stock outstanding as of November 1, 2014. The 32,649 shares of our convertible non-voting Series B Preferred Stock owned by Silver Lake Funds and affiliates represents 66.7% of all shares of our Series B Preferred Stock outstanding as of November 1, 2014. In addition, funds affiliated with Silver Lake own an aggregate of 38,864 shares of our non-voting Series A Preferred Stock (representing 31.1% of the issued and outstanding shares of Series A Preferred Stock) that are not convertible into our common stock and are excluded from the table above. The warrants expiring on December 18, 2019 and the Series A Preferred Stock were issued in connection with the financing of the NES acquisition, while the warrants expiring on May 29, 2022 and the Series B Preferred Stock were issued in connection with the financing of the Radvision acquisition (see Note 10, “Financing Arrangements,” to our audited Consolidated Financial Statements included elsewhere in this prospectus for more information). |
The shares of common stock, Series B Preferred Stock and warrants (rounded to the nearest whole share) that are attributed to the Silver Lake Funds and their affiliates in this table represent direct holdings by the following entities:
| Common Stock | Series B Preferred | Warrants | ||||||||||
| Silver Lake Partners II, L.P., or SLP II |
39,815,641 | 4,319 | 9,855,464 | |||||||||
| Silver Lake Partners III, L.P., or SLP III |
109,624,955 | 11,892 | 27,135,186 | |||||||||
| Silver Lake Technology Investors II, L.P., or SLTI II |
184,359 | 20 | 45,634 | |||||||||
| Silver Lake Technology Investors III, L.P., or SLTI III |
375,045 | 40 | 92,834 | |||||||||
| Sierra Co-Invest, LLC, or Sierra Co-Invest |
182,450,000 | — | — | |||||||||
| Sierra Co-Invest II, LLC, or Sierra Co-Invest II |
— | — | 42,014,060 | |||||||||
| Sierra Co-Invest III, LLC, or Sierra Co-Invest III |
— | 16,376 | 8,188,344 | |||||||||
| Total fractional shares held by Silver Lake Funds and Affiliates |
— | 2 | 1 | |||||||||
|
|
|
|
|
|
|
|||||||
| Total |
332,450,000 | 32,649 | 87,331,523 | |||||||||
For ease of reference, we refer to SLP II, SLP III, SLTI II and SLTI III collectively as the Silver Lake Funds. The general partner of each of SLP II and SLTI II is Silver Lake Technology Associates II, L.L.C., whose managing member is Silver Lake Group, L.L.C. The general partner of each of SLP III and SLTI III is Silver Lake Technology Associates III, L.P., whose general partner is SLTA III (GP), L.L.C., whose managing member is Silver Lake Group, L.L.C.
The managing member of Sierra Co-Invest, Sierra Co-Invest II and Sierra Co-Invest III is Sierra Manager Co-Invest, LLC, or Sierra Manager. Pursuant to Sierra Manager’s limited liability company operating agreement, each of TPG GenPar V, L.P. and Silver Lake Technology Associates III, L.P. has the right to designate one of the two members of Sierra Manager’s management committee. Greg Mondre currently serves as Silver Lake’s designee.
The mailing address for Greg Mondre and for each of the Silver Lake Funds and their direct and indirect general partners is c/o Silver Lake, 2775 Sand Hill Road, Suite 100, Menlo Park, CA 94025. Charles Giancarlo, who is a Senior Advisor for Silver Lake, can also be contacted care of Silver Lake’s mailing address.
| (2) | The shares of our common stock that are attributed to the TPG Funds (as defined below) and affiliates in this table consist of an aggregate of 332,450,000 shares of our common stock, 32,649 shares of our common stock issuable upon conversion of shares of our convertible Series B Preferred Stock and 87,331,523 warrants to purchase shares of our common stock. Of the warrants owned by TPG Funds and affiliates, |
166
Table of Contents
| 71,007,030 warrants have an exercise price of $3.25 per share and are exercisable at any time prior to December 18, 2019, and 16,324,493 warrants have an exercise price of $4.00 per share and are exercisable at any time prior to May 29, 2022. Excluding warrants and shares issuable upon conversion of Series B Preferred Stock, the shares of our common stock that are attributed to the TPG Funds and affiliates represent 68% of all shares of our common stock outstanding as of November 1, 2014. The 32,649 shares of our convertible non-voting Series B Preferred Stock owned by TPG Funds and affiliates represents 66.7% of all shares of our Series B Preferred Stock outstanding as of November 1, 2014. In addition, funds affiliated with TPG own an aggregate of 38,864 shares of our non-voting Series A Preferred Stock (representing 31.1% of the issued and outstanding shares of Series A Preferred Stock) that are not convertible into common stock and are excluded from the table above. The warrants expiring on December 18, 2019 and the Series A Preferred Stock were issued in connection with the financing of the NES acquisition, while the warrants expiring on May 29, 2022 and the Series B Preferred Stock were issued in connection with the financing of the Radvision acquisition (see Note 10, “Financing Arrangements,” to our audited Consolidated Financial Statements included elsewhere in this prospectus for more information). |
The shares of our common stock and warrants (rounded to the nearest whole share) that are attributed to TPG Partners V, L.P., a Delaware limited partnership, or Partners, TPG FOF V-A, L.P., a Delaware limited partnership, or FOF A, and TPG FOF V-B, L.P., a Delaware limited partnership, or FOF B, which, together with Partners and FOF A, are collectively referred to as the TPG Funds, and their affiliates in this table represent direct holdings by the following entities:
| Common Stock | Series B Preferred | Warrants | ||||||||||
| Partners |
149,294,510 | 16,195 | 36,954,491 | |||||||||
| FOF A |
390,556 | 42 | 96,673 | |||||||||
| FOF B |
314,933 | 34 | 77,954 | |||||||||
| Sierra Co-Invest |
182,450,000 | — | — | |||||||||
| Sierra Co-Invest II |
— | — | 42,014,060 | |||||||||
| Sierra Co-Invest III |
— | 16,376 | 8,188,344 | |||||||||
| Total fractional shares held by TPG Funds and Affiliates |
1 | 2 | 1 | |||||||||
|
|
|
|
|
|
|
|||||||
| Total |
332,450,000 | 32,649 | 87,331,523 | |||||||||
The general partner of each of the TPG Funds is TPG GenPar V, L.P., a Delaware limited partnership, or GenPar, whose general partner is TPG GenPar V Advisors, LLC, a Delaware limited liability company, or GenPar Advisors, whose sole member is TPG Holdings I, L.P., a Delaware limited partnership, or Holdings I, whose general partner is TPG Holdings I-A, LLC, a Delaware limited liability company, or Holdings I GP, whose sole member is TPG Group Holdings (SBS), L.P., a Delaware limited partnership, or Group Holdings, whose general partner is TPG Group Holdings (SBS) Advisors, Inc., a Delaware corporation, or Group Advisors, which, together with the TPG Funds, GenPar, GenPar Advisors, Holdings I, Holdings I GP and Group Holdings we collectively refer to as the TPG Entities). The managing member of Sierra Co-Invest, Sierra Co-Invest II and Sierra Co-Invest III is Sierra Manager. Pursuant to the Sierra Manager’s limited liability company operating agreement, each of GenPar and Silver Lake Technology Associates III, L.P. has the right to designate one of the two members of the management committee of Sierra Manager. John Marren currently serves as GenPar’s designee.
Because of these relationships, Group Advisors may be deemed to beneficially own the shares and warrants directly held by the TPG Funds, Sierra Co-Invest, Sierra Co-Invest II and Sierra Co-Invest III. David Bonderman and James G. Coulter are officers and sole shareholders of Group Advisors. Because of the relationship of Messrs. Bonderman and Coulter to Group Advisors, each of Messrs. Bonderman and Coulter may be deemed to beneficially own the shares and warrants directly held by the TPG Funds, Sierra Co-Invest, Sierra Co-Invest II and Sierra Co-Invest III. Messrs. Bonderman and Coulter disclaim beneficial ownership of the shares and warrants directly held by the TPG Funds, Sierra Co-Invest, Sierra Co-Invest II and Sierra Co-Invest III except to the extent of their pecuniary interest therein.
167
Table of Contents
The mailing address for each of Group Advisors and Messrs. Bonderman , Coulter and John Marren is c/o TPG Global, LLC, 301 Commerce Street, Suite 3300, Fort Worth, TX 76102. The mailing address for each of Sierra Co-Invest, Sierra Co-Invest II, and Sierra Co-Invest III is 301 Commerce Street, Suite 3300, Fort Worth, TX 76102. The mailing address for Sierra Manager is 9 West 57th Street, 32nd Floor, New York, NY 10019.
| (3) | Includes beneficial ownership of the following numbers of shares of common stock that may be acquired within 60 days of November 1, 2014 pursuant to stock options: |
| • | Pierre-Paul Allard | 236,875 | • | David Vellequette | 282,500 | |||||||||
| • | James J. Chirico, Jr. | 1,192,500 | • | Charles H. Giancarlo | 325,000 | |||||||||
| • | Roger Gaston | 761,833 | • | Directors and executive officers as a group |
8,882,166 | |||||||||
| • | Kevin J. Kennedy | 4,966,667 |
Note that the number of shares that can be acquired pursuant to stock options held by Directors and officers as a group excludes shares held by; Mrs. Pamela Craven, who ceased serving as Senior Vice President and Chief Administrative Officer on May 31, 2014, and, Mr. Brett Shockley, who ceased serving as Senior Vice President and Chief Technology Officer on September 11, 2014. Including their stock options, Directors and executive officers as a group would beneficially own 10,192,603 shares of common stock that may be acquired within 60 days of November 1, 2014 pursuant to stock options.
| (4) | Includes ownership of the following numbers of shares of common stock underlying RSUs that have vested or that may vest within 60 days of November 1, 2014 for which receipt has been deferred such that, absent an event triggering issuance of the shares in accordance with the terms of the award agreement under which the RSUs were issued, the shares would not be received within 60 days of November 1, 2014. |
| • | Pierre-Paul Allard | 176,945 | • | Charles H. Giancarlo | 58,334 | |||||||||
| • | James J. Chirico, Jr. | 389,722 | • | Mary Henry | 137,274 | |||||||||
| • | Roger Gaston | 193,833 | • | Kiran Patel |
211,717 | |||||||||
| • | Kevin J. Kennedy | 1,144,444 | • | Gary B. Smith | 229,849 | |||||||||
| • | David Vellequette | 255,556 | • | Directors and executive officers as a group |
4,072,357 |
Note that the number of units held by Directors and executive officers as a group excludes units held by Mrs. Pamela Craven, who ceased serving as Senior Vice President, Chief Administrative Officer and General Counsel on May 31, 2014, and Mr. Brett Shockley, who ceased serving as Senior Vice President and Chief Technology Officer on September 11, 2014. Including their RSUs, Directors and executive officers as a group would beneficially own 4,467,525 shares of common stock underlying RSUs that have vested or that may vest within 60 days of November 1, 2014 for which receipt has been deferred such that, absent an event triggering issuance of the shares in accordance with the terms of the award agreement under which the RSUs were issued, the shares would not be received within 60 days of November 1, 2014.
| (5) | Includes ownership of the following numbers of shares of common stock underlying RSUs that may vest within 60 days of November 1, 2014 for which receipt has not been deferred such that, the shares will be received within 60 days of November 1, 2014. |
| • | Pierre-Paul Allard | 66,667 | • | Kevin J. Kennedy | 333,334 | |||||||||
| • | James J. Chirico, Jr. | 100,001 | • | David Vellequette | 100,001 | |||||||||
| • | Roger Gaston | 44,445 | • | Directors and executive officers as a group |
915,562 |
Note that the number of units held by Directors and executive officers as a group excludes units held by Mr. Brett Shockley, who ceased serving as Senior Vice President and Chief Technology Officer on September 11, 2014. Including Mr. Shockley’s RSUs, Directors and executive officers as a group would beneficially own 948,896 shares of common stock underlying RSUs that have vested or that may vest within
168
Table of Contents
60 days of November 1, 2014 for which receipt has not been deferred such that, the shares will be received within 60 days of November 1, 2014.
| (6) | Includes 320,000 shares held by Mr. Kennedy and his spouse as trustees under a grantor retained annuity and a family trust. |
| (7) | John Marren is a TPG partner. Mr. Marren has no voting or investment power over and disclaims beneficial ownership of any shares of our common stock and warrants exercisable for and preferred shares convertible into shares of our common stock held directly or indirectly by the TPG Entities, Sierra Co-Invest, Sierra Co-Invest II or Sierra Co-Invest III. |
| (8) | Charles Giancarlo is a Special Advisor of Silver Lake Group, L.L.C. Mr. Giancarlo has no voting or investment power over the shares and warrants held directly by the Silver Lake Funds and disclaims beneficial ownership of any shares of our common stock and warrants exercisable for shares of our common stock held by the Silver Lake Funds, Sierra Co-Invest, Sierra Co-Invest II or Sierra Co-Invest III. |
| (9) | Afshin Mohebbi is a TPG Senior Advisor. Mr. Mohebbi has no voting or investment power over and disclaims beneficial ownership of any shares of our common stock and warrants exercisable for and preferred shares convertible into shares of our common stock held directly or indirectly by the TPG Entities, Sierra Co-Invest, Sierra Co-Invest II or Sierra Co-Invest III. |
| (10) | Greg Mondre is (a) Managing Partner and Managing Director of Silver Lake Group, L.L.C., (b) a member of Sierra Manager’s management committee and (c) a vice president of Sierra Manager. Mr. Mondre has no voting or investment power over the shares and warrants held directly by the Silver Lake Funds and disclaims beneficial ownership of any shares of our common stock and warrants exercisable for shares of our common stock held by the Silver Lake Funds, Sierra Co-Invest, Sierra Co-Invest II or Sierra Co-Invest III. |
| (11) | Ronald Rittenmeyer is a TPG Senior Advisor. Mr. Rittenmeyer has no voting or investment power over and disclaims beneficial ownership of any shares of our common stock and warrants exercisable for and preferred shares convertible into shares of our common stock held directly or indirectly by the TPG Entities, Sierra Co-Invest, Sierra Co-Invest II or Sierra Co-Invest III. |
| (12) | Note that the number of shares beneficially owned by Directors and executive officers as a group excludes shares beneficially owned by the following individuals: Mrs. Pamela Craven, who ceased serving as Senior Vice President and Chief Administrative Officer on May 31, 2014, and Mr. Brett Shockley, who ceased serving as Senior Vice President and Chief Technology Officer on September 11, 2014. Including shares beneficially owned by Mrs. Craven and Mr. Shockley, the number of shares beneficially owned by Directors and executive officers as a group would equal 16,830,335 or 3.3% of outstanding shares of common stock. |
169
Table of Contents
DESCRIPTION OF CERTAIN OUTSTANDING INDEBTEDNESS
Senior secured multi-currency asset-based revolving credit facility
Overview
In connection with the Merger, Avaya Inc. entered into a credit agreement and related security and other agreements, dated as of October 26, 2007, or the “Merger Date”, for a senior secured multi-currency asset-based revolving credit facility. The senior secured multi-currency asset-based revolving credit facility was amended and restated as of October 29, 2012, and amended as of February 5, 2014, as discussed under “-Amendments of senior secured multi-currency asset-based revolving credit facility” below.
On May 15, 2014, Avaya Inc. borrowed $40 million under its senior secured multi-currency asset-based revolving credit facility, the proceeds of which were used to fund, in part, the redemption of the 10.125%/10.875% senior unsecured PIK toggle notes due 2015 and 9.75% senior unsecured cash-pay notes. Borrowings under the senior secured multi-currency asset-based revolving credit facility bear interest at a rate per annum equal to, at Avaya Inc.’s option, either; (a) a LIBOR rate plus a margin of 1.75% or (b) a base rate plus a margin of 0.75%. The interest rate election made on the May 15, 2014 borrowing was the LIBOR rate. Any principal amount outstanding under this facility is payable in full on October 26, 2016.
The senior secured multi-currency asset-based revolving credit facility provides senior secured revolving financing of up to $335 million, subject to availability under a borrowing base, of which $150 million may be in the form of letters of credit. The borrowing base at any time equals the sum of 85% of eligible accounts receivable plus 85% of the net orderly liquidation value of eligible inventory, subject to certain reserves and other adjustments. The senior secured multi-currency asset-based revolving credit facility includes borrowing capacity available for letters of credit and for short-term borrowings, referred to as swingline loans, and is available in euros in addition to dollars. At September 30, 2014, the borrowings under this facility were $40 million, in addition to $79 million of issued and outstanding letters of credit, with aggregate remaining revolver availability of $207 million.
Avaya Inc. has the right to request up to $100 million of additional commitments under this facility, although the lenders under this facility are not under any obligation to provide any such additional commitments, and any increase in commitments is subject to certain conditions precedent. If Avaya Inc. were to request any such additional commitments and the existing lenders or new lenders were to agree to provide such commitments, the facility size could be increased by up to $100 million, but Avaya Inc.’s ability to borrow under this facility would still be limited by the amount of the borrowing base.
Amendments of senior secured multi-currency asset-based revolving credit facility
On October 29, 2012, Avaya Inc., the several subsidiary borrowers party thereto, Citicorp USA, Inc. and the lenders party thereto entered into Amendment No. 2 to Credit Agreement, pursuant to which the senior secured multi-currency asset-based revolving credit facility was amended and restated in its entirety.
The modified terms of the senior secured multi-currency asset-based revolving credit facility include permission to issue or incur, as applicable, secured indebtedness in the form of (1) one or more series of incremental replacement junior secured notes in lieu of the $100 million of additional commitments discussed in the final paragraph of “-Senior secured multi-currency asset-based revolving credit facility-Overview” above, plus the amount by which unused commitments have been previously reduced under the senior secured multi-currency asset-based revolving credit facility, less the amount of all revolving commitment increases effected at or prior to the time of issuance of such incremental replacement junior secured notes, and (2) one or more series of junior secured notes or junior secured loans, in the case of each such issuance or incurrence, in connection with a modification, refinancing, refunding, renewal, replacement, exchange or extension of senior unsecured indebtedness and subject to certain other conditions and limitations set forth in the senior secured multi-currency asset-based revolving credit facility.
170
Table of Contents
On February 13, 2013, Avaya Inc., the several subsidiary borrowers party thereto, Citicorp USA, Inc. and the lenders party thereto entered into Amendment No. 3 to Credit Agreement pursuant to which the senior secured multi-currency asset-based revolving credit facility was amended.
The modified terms of the senior secured multi-currency asset-based revolving credit facility permitted Avaya Inc. to refinance all of Avaya Inc.’s outstanding senior unsecured notes with junior secured notes or junior secured loans, subject to certain other conditions and limitations set forth in the senior secured multi-currency asset-based revolving credit facility. Further, the terms of the amendment permit certain other obligations of Avaya Inc. and certain of its subsidiaries to be secured by the ABL Priority Collateral on a junior-priority basis.
Interest rate and fees
Borrowings under the senior secured multi-currency asset-based revolving credit facility bear interest at a rate per annum equal to, at Avaya Inc.’s option, either (a) a base rate determined by reference to the higher of (1) the prime rate of Citicorp USA, Inc. and (2) the federal funds effective rate plus 1/2 of 1% or (b) a LIBOR rate determined by reference to the costs of funds for U.S. dollar deposits for the interest period relevant to such borrowing adjusted for certain additional costs, in each case plus an applicable margin. The applicable margin for borrowings under the senior secured multi-currency asset-based revolving credit facility is based on excess availability under that facility and ranges from (1) 0.50% to 0.75% per annum with respect to base rate borrowings and (2) 1.50% to 1.75% per annum with respect to LIBOR borrowings. Swingline loans bear interest at a rate per annum equal to the base rate plus the applicable margin.
In addition to paying interest on outstanding principal under the senior secured multi-currency asset-based revolving credit facility, Avaya Inc. is required to pay a commitment fee of 0.25% per annum in respect of the unutilized commitments thereunder. Avaya Inc. must also pay customary letter of credit fees equal to the applicable margin on LIBOR loans and agency fees.
Mandatory repayments
If at any time the aggregate amount of outstanding loans, unreimbursed letter of credit drawings and undrawn letters of credit under the senior secured multi-currency asset-based revolving credit facility exceeds the lesser of (i) the commitment amount and (ii) the borrowing base, Avaya Inc. will be required to repay outstanding loans and cash collateralize letters of credit in an aggregate amount equal to such excess, with no reduction of the commitment amount. If the amount available under the senior secured multi-currency asset-based revolving credit facility is less than $33.5 million for five consecutive business days or a payment or bankruptcy event of default has occurred, Avaya Inc. will be required to deposit cash from specified concentration accounts daily in a collection account maintained with the administrative agent under the senior secured multi-currency asset-based revolving credit facility, which will be used to repay outstanding loans and cash collateralize letters of credit.
Voluntary repayments
Avaya Inc. may voluntarily reduce the unutilized portion of the commitment amount and repay outstanding loans at any time without premium or penalty other than customary “breakage” costs with respect to LIBOR loans.
Amortization and final maturity
There is no scheduled amortization under the senior secured multi-currency asset-based revolving credit facility. Pursuant to an amendment to this facility effective August 8, 2011, all outstanding loans under the senior secured multi-currency asset-based revolving credit facility are due and payable in full on October 26, 2016.
171
Table of Contents
Co-borrowers, guarantees and security
All obligations under the senior secured multi-currency asset-based revolving credit facility are unconditionally guaranteed by Avaya Holdings Corp. In addition, all of our existing 100% owned domestic subsidiaries (with certain agreed-upon exceptions), or the subsidiary borrowers, act as co-borrowers under the facility, and certain of our future domestic 100% owned subsidiaries will act as co-borrowers under the facility. All obligations under the senior secured multi-currency asset-based revolving credit facility, and the guarantees of those obligations, are secured, subject to certain exceptions, on a pari passu basis (subject to intercreditor arrangements) with the senior secured credit facility, the 7% Senior Secured Notes, the 9% Senior Secured Notes and any future senior obligations, by substantially all of our assets and the assets of Avaya Inc. and the subsidiary borrowers, including:
| • | a first-priority security interest in personal property consisting of accounts receivable, inventory, cash, deposit accounts, securities accounts, chattel paper and certain related assets and proceeds of the foregoing, which are collectively referred to as “ABL Priority Collateral”; |
| • | a second-priority pledge of all of Avaya Inc.’s capital stock and all of the capital stock held by Avaya Inc. and the subsidiary borrowers (which pledge, in the case of the capital stock of any foreign subsidiary or of any U.S. subsidiary that holds capital stock of a foreign subsidiary and is a disregarded entity for U.S. federal income tax purposes, is limited to 65% of the voting stock of such subsidiary); and |
| • | a second-priority security interest in, and mortgages on, substantially all other tangible and intangible assets of us, Avaya Inc. and each subsidiary borrower, including substantially all of our material owned real property and equipment, fixtures, intellectual property, investment property, instruments, commercial tort claims, documents and general intangibles, which are collectively, and together with the pledge of capital stock described in the previous bullet-point, referred to as “Non-ABL Priority Collateral”. |
Certain covenants and events of default
The senior secured multi-currency asset-based revolving credit facility contains a number of covenants that, among other things and subject to certain exceptions, restrict Avaya Inc.’s ability and the ability of Avaya Inc.’s subsidiaries to:
| • | incur or guarantee additional debt and issue or sell certain preferred stock; |
| • | pay dividends on, redeem or repurchase our capital stock; |
| • | make certain acquisitions or investments; |
| • | incur or assume certain liens; |
| • | enter into transactions with affiliates; |
| • | merge or consolidate with another company; |
| • | transfer or otherwise dispose of assets; |
| • | redeem subordinated debt; |
| • | incur obligations that restrict the ability of its subsidiaries to make dividends or other payments to us; and |
| • | create or designate unrestricted subsidiaries. |
The covenants limiting the incurrence of unsecured or subordinated debt, dividends and other restricted payments, investments, loans, advances and acquisitions, and prepayments or redemptions of Avaya Inc.’s subordinated indebtedness, each permit the restricted actions in an unlimited amount, subject to the satisfaction
172
Table of Contents
of certain payment conditions, principally that Avaya Inc. must have pro forma excess availability greater than $33.5 million under the senior secured multi-currency asset-based revolving credit facility and that it must be in pro forma compliance with the fixed charge coverage ratio described in the next paragraph.
Although the senior secured multi-currency asset-based revolving credit facility does not require Avaya Inc. to comply with any financial ratio maintenance covenants, if Avaya Inc. has excess availability under the facility of less than $33.5 million at any time, it will not be permitted to borrow any additional amounts thereunder unless its pro forma Fixed Charge Coverage Ratio (as defined in the senior secured multi-currency asset-based revolving credit facility) is at least 1.0 to 1.0.
The senior secured multi-currency asset-based revolving credit facility also contains certain customary affirmative covenants and events of default, including an event of default that would result from the failure to make payment beyond any applicable grace period in respect of any indebtedness having an aggregate principal amount of not less than $75 million, the failure to observe or perform any other agreement or condition relating to any such indebtedness (other than the senior secured credit facility) which results in the acceleration of, or permits the holders of such indebtedness to accelerate, the maturity of such indebtedness or the failure to observe or perform any other agreement or condition relating to the senior secured credit facility which results in the lenders thereunder accelerating the maturity of such facility.
Senior secured credit facility
Overview
In connection with the Merger, Avaya Inc. also entered into a credit agreement and related security and other agreements, dated as of the Merger Date. The senior secured credit facility was amended and restated as of February 11, 2011, amended and restated as of October 29, 2012, amended and restated as of December 21, 2012, amended as of February 13, 2013, amended as of March 12, 2013, and amended as of February 5, 2014 as discussed under “-Amendments of senior secured credit facility” below.
The senior secured credit facility consists of (a) a senior secured multi-currency revolver allowing for borrowings as of September 30, 2014 of $90 million borrowed and outstanding and remaining availability of $110 million, (b) term B-3 loans with an outstanding principal amount as of September 30, 2014 of $2,102 million, (c) term B-4 loans with an outstanding principal amount as of September 30, 2014 of $1 million, and (d) term B-6 loans with an outstanding principal amount as of September 30, 2014 of $1,128 million.
Amendments of senior secured credit facility
On February 11, 2011, the senior secured credit facility was amended and restated. The modified terms included amendments to:
| • | permit the Company to effect a refinancing (see below) in which the maturity of 60% of the senior secured term loans representing outstanding principal amounts of $2.2 billion was extended from October 26, 2014 to October 26, 2017 by converting such loans into a new tranche of senior secured term loans (the senior secured term loans that remain due October 26, 2014 are referred to as the senior secured term B-1 loans and the senior secured term loans that are due October 26, 2017 are referred to as the senior secured term B-3 loans); |
| • | permit, at the election of Avaya Inc., prepayments to the senior secured incremental term B-2 loans prior to the senior secured term B-1 loans and senior secured term B-3 loans and thereafter to the class of term loans with the next earliest maturity; |
| • | permit the issuance of indebtedness (including the 7% Senior Secured Notes) to refinance a portion of the term loans under the senior secured credit facility and to secure such indebtedness (including the 7% Senior Secured Notes) on a pari passu basis with the obligations under the senior secured credit facility; |
173
Table of Contents
| • | permit future refinancing of the term loans under the senior secured credit facility; and |
| • | permit future extensions of the term loans and revolving credit commitments (including, in the case of the revolving credit commitments, by obtaining new revolving credit commitments) under the senior secured credit facility. |
On October 29, 2012, Avaya Inc., Citibank, N.A. and the lenders party thereto entered into Amendment No. 4 to Credit Agreement pursuant to which the senior secured credit facility was amended and restated in its entirety. The modified terms included:
| • | an amendment to extend the maturity of a portion of the term B-1 loans representing outstanding principal amounts of $135 million from October 26, 2014 to October 26, 2017; |
| • | permission to issue incremental replacement junior secured notes, junior secured notes and junior secured loans as described above under the heading “—Amendments of senior secured multi-currency asset-based revolving credit facility” (except, pursuant to the senior secured credit facility, such incremental replacement junior secured notes, junior secured notes and junior secured loans must be secured by a lien on the collateral ranking junior to the lien securing the obligations under the senior secured credit facility); and |
| • | permission to issue indebtedness to refinance a portion of the term loans outstanding under the senior secured credit facility and to secure such indebtedness by a lien on the collateral ranking junior to the lien securing the obligations under the senior secured credit facility, subject to certain other conditions and limitations set forth in the senior secured credit facility. |
On December 21, 2012, Avaya Inc., Citibank, N.A. and the lenders party thereto entered into Amendment No. 5 to Credit Agreement, pursuant to which the senior secured credit facility was amended and restated in its entirety. The modified terms included:
| • | an amendment to extend the maturity of $713 million aggregate principal amount of the outstanding term B-1 loans from October 26, 2014 to March 31, 2018 and $134 million aggregate principal amount of the outstanding term B-4 loans from October 26, 2017 to March 31, 2018, in each case, by converting such loans into a new tranche of term B-5 loans; and |
| • | permission to apply net proceeds from the issuance of the 9% Senior Secured Notes to refinance term B-5 loans. |
Additionally, as discussed more fully below, on December 21, 2012, Avaya Inc. completed a private placement of $290 million of the 9% Senior Secured Notes, the net proceeds of which were used to repay $284 million of term B-5 loans outstanding under the senior secured credit facility. Funds affiliated with TPG were holders of $22 million of term B-5 loans repaid with the proceeds of the 9% Senior Secured Notes.
On February 13, 2013, Avaya Inc. and Citibank, N.A. and the lenders party thereto entered into Amendment No. 6 to Credit Agreement pursuant to which the senior secured credit facility was amended. The modified terms of the senior secured credit facility permitted Avaya Inc. to refinance all of Avaya Inc.’s outstanding senior unsecured notes with indebtedness secured by a lien on the collateral ranking junior to the lien on the collateral securing the obligations under the senior secured credit facility, subject to certain other conditions and limitations set forth in the senior secured credit facility.
On March 12, 2013, Avaya Inc., Citibank, N.A. and the lenders party thereto entered into Amendment No. 7 to Credit Agreement pursuant to which the senior secured credit facility was further amended. The modified terms of the senior secured credit facility resulted in the refinancing in full all the outstanding term B-1 loans with the cash proceeds from the issuance of $589 million aggregate principal amount of term B-5 loans under the senior secured credit facility.
174
Table of Contents
On February 5, 2014, Avaya Inc., Citibank, N.A., and the lenders party thereto entered into Amendment No. 8 to Credit Agreement pursuant to which the Cash Flow Credit Agreement was amended. Pursuant to the amendment, Avaya Inc. refinanced in full all the outstanding term B-5 loans with the cash proceeds from the issuance of $1,138 million aggregate principal balance of term B-6 loans under the Cash Flow Credit Agreement.
On May 15, 2014, Avaya Inc. borrowed $100 million under its senior secured multi-currency revolver, the proceeds of which were used to fund, in part, the redemption of the 10.125%/10.875% senior unsecured PIK toggle notes due 2015 and 9.75% senior unsecured cash-pay notes. The borrowings bear interest at a rate per annum equal to a LIBOR rate plus an applicable margin. The senior secured multi-currency revolver allows for borrowings of up to $200 million, has a final maturity of October 26, 2016, includes capacity available for letters of credit and for short-term borrowings, and is available in euros in addition to dollars.
During the quarter ended September 30, 2014, Avaya Inc. repaid $10 million of the borrowings under Avaya Inc.’s revolving credit facilities. Subsequent to September 30, 2014, Avaya Inc. repaid an additional $30 million of these borrowings.
Interest rate and fees
Borrowings under the senior secured credit facility bear interest at a rate per annum equal to, at Avaya Inc.’s option, either a base rate (subject to a floor of 2.25% in the case of the term B-4 loans and 2.00% in the case of the term B-6 loans) or a LIBOR rate (subject to a floor of 1.25% in the case of the term B-4 loans and 1.00% in the case of the term B-6 loans), in each case plus an applicable margin. Subject to the floor described in the immediately preceding sentence, the base rate is determined by reference to the higher of (1) the prime rate of Citibank, N.A. and (2) the federal funds effective rate plus 1/2 of 1%. Subject to the floor described in the first sentence of this paragraph, the LIBOR rate is determined by reference to the costs of funds for U.S. dollar deposits for the interest period relevant to such borrowing adjusted for certain additional costs.
The applicable margin for borrowings of revolving loans under the senior secured credit facility are subject to adjustment each fiscal quarter based on its senior secured leverage ratio and range from (A) 1.00% to 1.75% per annum with respect to revolving loans that are base rate borrowings and (B) 2.00% to 2.75% per annum with respect to revolving loans that are LIBOR borrowings.
The applicable margins for borrowings of term B-3 loans, term B-4 loans, and term B-6 loans under the senior secured credit facility are equal at all times to 3.50%, 5.25%, and 4.50%, respectively per annum with respect to base rate borrowings and 4.50%, 6.25%, and 5.50%, respectively per annum with respect to LIBOR borrowings. The applicable margins on the term B-4 loans and term B-6 loans are subject to increase pursuant to the senior secured credit facility in connection with the making of certain refinancing, extended or replacement term loans under the senior secured credit facility with an effective yield greater than the applicable effective yield payable in respect of the applicable loans at such time plus 50 basis points.
In addition to paying interest on outstanding principal under the senior secured credit facility, Avaya Inc. is required to pay a commitment fee of 0.50% per annum in respect of the unutilized commitments under the senior secured multi-currency revolver. This commitment fee is subject to adjustment to 0.375% each fiscal quarter based on Avaya Inc.’s senior secured leverage ratio. Avaya Inc. is also required to pay customary letter of credit fees equal to the applicable margin on LIBOR loans and agency fees under this facility.
Mandatory repayments
Avaya Inc. is required to prepay outstanding term loans under its senior secured credit facility with (x) 100% of the net cash proceeds of any debt issued by it or its subsidiaries (with exceptions for certain debt permitted to be incurred under the facility), (y) 50% (which percentage is reduced to 25% and to 0% if Avaya Inc.’s senior secured leverage ratio is less than or equal to 3.00:1.00 and 2.50:1.00, respectively) of Avaya Inc.’s
175
Table of Contents
annual excess cash flow (as defined in the facility) and (z) if Avaya Inc.’s senior secured leverage ratio exceeds 2.50:1.00, 100% of the net cash proceeds of all non-ordinary course asset sales, casualty events or other dispositions of property by it or its subsidiaries, subject to reinvestment rights and certain other exceptions.
Voluntary repayments
Avaya Inc. may voluntarily prepay outstanding loans under its senior secured credit facility and reduce the unutilized portion of the commitment amount in respect of the senior secured multi-currency revolver at any time without premium or penalty other than customary “breakage” costs with respect to LIBOR loans.
Amortization and final maturity
Avaya Inc. is required to make scheduled quarterly payments under its senior secured term loan facility equal to 0.25% of the original principal amount of the senior secured term loans, with the balance of the term B-3 loans and the term B-4 loans paid on October 26, 2017, and the balance of the term B-5 loans paid on March 31, 2018.
Pursuant to an amendment to this facility effective August 8, 2011, the principal amount outstanding of the loans under the senior secured multi-currency revolver is due and payable in full on October 26, 2016.
Guarantees and security
All obligations under the senior secured credit facility are unconditionally guaranteed by Avaya Holdings Corp. and all of our existing 100% owned domestic subsidiaries (with certain agreed-upon exceptions) and will be required to be guaranteed by certain of our future domestic 100% owned subsidiaries. All obligations under the senior secured credit facility, and the guarantees of those obligations, are secured, subject to certain exceptions, on a pari passu basis (subject to intercreditor arrangements) with the senior secured multi-currency asset-based revolving credit facility, the 7% Senior Secured Notes, the 9% Senior Secured Notes and any future senior obligations, by substantially all of our assets and the assets of Avaya Inc. and the subsidiary guarantors, including:
| • | a second-priority security interest in personal property consisting of accounts receivable, inventory, cash, deposit accounts, securities accounts, chattel paper and certain related assets and proceeds of the foregoing; |
| • | a first-priority pledge of all of Avaya Inc.’s capital stock and all of the capital stock held by Avaya Inc. and the subsidiary guarantors (which pledge, in the case of the capital stock of any foreign subsidiary or of any U.S. subsidiary that holds capital stock of a foreign subsidiary and is a disregarded entity for U.S. federal income tax purposes, is limited to 65% of the voting stock of such subsidiary); and |
| • | a first-priority security interest in, and mortgages on, substantially all other tangible and intangible assets of us, Avaya Inc. and each subsidiary guarantor, including substantially all of our material owned real property and equipment, fixtures, intellectual property, investment property, instruments, commercial tort claims, demands and general intangibles. |
Certain covenants and events of default
The credit agreement governing the senior secured credit facility contains a number of covenants that, among other things and subject to certain exceptions, restrict Avaya Inc.’s ability and the ability of its subsidiaries to:
| • | incur or guarantee additional debt and issue or sell certain preferred stock; |
| • | pay dividends on, redeem or repurchase its capital stock; |
176
Table of Contents
| • | make certain acquisitions or investments; |
| • | incur or assume certain liens; |
| • | enter into transactions with affiliates; |
| • | merge or consolidate with another company; |
| • | transfer or otherwise dispose of assets; |
| • | redeem subordinated debt; |
| • | incur obligations that restrict the ability of its subsidiaries to make dividends or other payments to Avaya Inc.; and |
| • | create or designate unrestricted subsidiaries. |
The facility also contains certain customary affirmative covenants and events of default, including an event of default that would result from the failure to make payment beyond any applicable grace period in respect of any indebtedness having an aggregate principal amount of not less than $75 million, the failure to observe or perform any other agreement or condition relating to any such indebtedness (other than the senior secured multi-currency asset-based revolving credit facility) which results in the acceleration of, or permits the holders of such indebtedness to accelerate, the maturity of such indebtedness or the failure to observe or perform any other agreement or condition relating to the senior secured multi-currency asset-based revolving credit facility which results in the lenders thereunder accelerating the maturity of such facility.
Senior unsecured cash-pay notes and senior unsecured PIK toggle notes due 2015
Overview
As of September 30, 2013, Avaya Inc. had outstanding an aggregate principal amount of $58 million senior unsecured cash-pay notes due 2015 and $92 million senior unsecured PIK toggle notes due 2015, which were issued on October 24, 2008 in exchange for all of the outstanding loans under a bridge loan facility entered into in connection with the Merger.
On March 7, 2013, Avaya Inc. completed the exchange offer in which $1,384 million of senior unsecured notes (including $642 million of senior unsecured cash-pay notes and $742 million of senior unsecured PIK toggle notes) were exchanged for the 10.50% Senior Secured Notes. Prior to March 7, 2013, Avaya Inc. had $700 million and $750 million of senior unsecured cash-pay notes and senior unsecured PIK toggle notes, respectively.
On May 15, 2014, Avaya Inc. redeemed 100% of the aggregate principal amount of its 9.75% senior unsecured cash-pay notes due 2015 and 10.125%/10.875% senior unsecured PIK toggle notes due 2015 at a redemption price of 100% of the principal amount thereof, plus accrued and unpaid interest, or $92 million and $58 million, respectively. The redemption price of $150 million was funded through cash on-hand of $10 million and borrowings of $140 million under Avaya Inc.’s revolving credit facilities.
7% Senior Secured Notes due 2019
Overview
As of September 30, 2014, Avaya Inc. had outstanding an aggregate principal amount of $1,009 million senior secured notes due 2019 (the “7% Senior Secured Notes”), which were issued on February 11, 2011.
Interest rate
The 7% Senior Secured Notes were issued in the aggregate principal amount of $1,009 million and bear interest in cash at the rate of 7.00% per annum. Interest is payable semi-annually on April 1 and October 1 commencing on October 1, 2011.
177
Table of Contents
Optional redemption
Commencing April 1, 2015, Avaya Inc. may redeem the 7% Senior Secured Notes, in whole or in part, at a price equal to 103.5% of the principal amount redeemed, which decreases to 101.75% on April 1, 2016 and to 100% on or after April 1, 2017, plus accrued and unpaid interest.
Prior to April 1, 2015, Avaya Inc. may redeem the 7% Senior Secured Notes, in whole or in part, at a price equal to 100% of the principal amount thereof, plus a “make-whole” premium, plus accrued and unpaid interest.
In addition, at any time until April 1, 2014, Avaya Inc. may redeem up to 35% of the aggregate principal amount of the 7% Senior Secured Notes at a redemption price equal to 107% of the face amount thereof plus accrued and unpaid interest, if any, to the redemption date, with the net cash proceeds raised in or more equity offerings by Avaya Inc. or Avaya Holdings Corp.; provided that the aggregate principal amount of 7% Senior Secured Notes that remain outstanding immediately after such redemption is equal to or greater than 50% of the aggregate principal amount of 7% Senior Secured Notes issued under the indenture governing the 7% Senior Secured Notes.
Change of control offer
If a change of control occurs, Avaya Inc. must give holders of its 7% Senior Secured Notes an opportunity to sell their notes to Avaya Inc. at a purchase price equal to 101% of the principal amount thereof, plus accrued and unpaid interest.
Mandatory offer to purchase following certain asset sales
If Avaya Inc. or its subsidiaries engage in certain asset sales, unless they invest the cash proceeds from such sales in their business or use the proceeds to prepay secured indebtedness (including under the credit facilities) within a specified period of time, Avaya Inc. must offer to repurchase the 7% Senior Secured Notes at 100% of the principal amount thereof, plus accrued and unpaid interest, if any, with such proceeds (if applicable, on a pro rata basis with certain pari passu indebtedness).
Final maturity
The 7% Senior Secured Notes mature on April 1, 2019, and do not have required principal payments prior to maturity.
Guarantees and security
Avaya Inc.‘s domestic 100% owned subsidiaries that are borrowers or guarantors of the senior secured multi-currency asset-based revolving credit facility, the senior secured credit facility, the senior unsecured notes and the senior unsecured PIK toggle notes guarantee the 7% Senior Secured Notes.
All obligations under the indenture governing the 7% Senior Secured Notes, and the guarantees of those obligations, are secured, subject to certain exceptions, on a pari passu basis (subject to intercreditor arrangements) with the senior secured multi-currency asset-based revolving credit facility, the senior secured credit facility, the 9% Senior Secured Notes and any future senior obligations, by a first-priority lien on substantially all of the assets of Avaya Inc. and the subsidiary guarantors other than real estate and other than the ABL Priority Collateral and by a second-priority lien on the ABL Priority Collateral.
178
Table of Contents
Certain covenants and events of default
The indenture governing the 7% Senior Secured Notes contains a number of covenants that, among other things and subject to certain exceptions, restrict Avaya Inc.’s ability and the ability of its subsidiaries to:
| • | incur additional debt and issue preferred stock; |
| • | pay dividends on, redeem or repurchase capital stock; |
| • | issue capital stock of restricted subsidiaries; |
| • | make certain investments; |
| • | enter into certain types of transactions with affiliates; |
| • | create liens; and |
| • | sell certain assets or merge with or into other companies. |
The indenture governing the 7% Senior Secured Notes also contains certain customary affirmative covenants and events of default, including an event of default that would result from either the failure to pay at stated final maturity, or acceleration of the maturity of, a principal amount of any other indebtedness of Avaya Inc. or any of its restricted subsidiaries if the aggregate principal amount of such indebtedness, together with the principal amount of any other such indebtedness in default for failure to pay principal at final maturity or the maturity of which has been accelerated, aggregates $85 million or more at any time.
9% Senior Secured Notes due 2019
Overview
As of September 30, 2014, Avaya Inc. had outstanding an aggregate principal amount of $290 million senior secured notes due 2019 (the “9% Senior Secured Notes”), which were issued on December 21, 2012.
Interest rate
The 9% Senior Secured Notes were issued in the aggregate principal amount of $290 million and bear interest in cash at the rate of 9.00% per annum. Interest is payable semi-annually on April 1 and October 1 commencing on April 1, 2013.
Optional redemption
Commencing April 1, 2015, Avaya Inc. may redeem the 9% Senior Secured Notes, in whole or in part, at a price equal to 104.5% of the principal amount redeemed, which decreases to 102.25% on April 1, 2016 and to 100% on or after April 1, 2017, plus accrued and unpaid interest.
Prior to April 1, 2015, Avaya Inc. may redeem the 9% Senior Secured Notes, in whole or in part, at a price equal to 100% of the principal amount thereof, plus a “make-whole” premium, plus accrued and unpaid interest.
In addition, at any time until April 1, 2015, Avaya Inc. may redeem up to 35% of the aggregate principal amount of the 9% Senior Secured Notes at a redemption price equal to 109% of the face amount thereof plus accrued and unpaid interest, if any, to the redemption date, with the net cash proceeds raised in or more equity offerings by Avaya Inc. or Avaya Holdings Corp.; provided that the aggregate principal amount of 9% Senior Secured Notes that remain outstanding immediately after such redemption is equal to or greater than 50% of the aggregate principal amount of 9% Senior Secured Notes issued under the indenture governing the 9% Senior Secured Notes.
179
Table of Contents
Change of control offer
If a change of control occurs, Avaya Inc. must give holders of its 9% Senior Secured Notes an opportunity to sell their notes to Avaya Inc. at a purchase price equal to 101% of the principal amount thereof, plus accrued and unpaid interest.
Mandatory offer to purchase following certain asset sales
If Avaya Inc. or its subsidiaries engage in certain asset sales, unless they invest the cash proceeds from such sales in their business or use the proceeds to prepay secured indebtedness (including under the credit facilities) within a specified period of time, Avaya Inc. must offer to repurchase the 9% Senior Secured Notes at 100% of the principal amount thereof, plus accrued and unpaid interest, if any, with such proceeds (if applicable, on a pro rata basis with certain pari passu indebtedness).
Final maturity
The 9% Senior Secured Notes mature on April 1, 2019, and do not have required principal payments prior to maturity.
Guarantees and security
Avaya Inc.’s domestic 100% owned subsidiaries that are borrowers or guarantors of the senior secured multi-currency asset-based revolving credit facility, the senior secured credit facility, the senior unsecured notes, the senior unsecured PIK toggle notes and the 7% Senior Secured Notes guarantee the 9% Senior Secured Notes.
All obligations under the indenture governing the 9% Senior Secured Notes, and the guarantees of those obligations, are secured, subject to certain exceptions, on a pari passu basis (subject to intercreditor arrangements) with the senior secured multi-currency asset-based revolving credit facility, the senior secured credit facility, the 7% Senior Secured Notes and any future senior obligations, by a first-priority lien on substantially all of the assets of Avaya Inc. and the subsidiary guarantors other than real estate and other than the ABL Priority Collateral and by a second-priority lien on the ABL Priority Collateral.
Certain covenants and events of default
The indenture governing the 9% Senior Secured Notes contains a number of covenants that, among other things and subject to certain exceptions, restrict Avaya Inc.’s ability and the ability of its subsidiaries to:
| • | incur additional debt and issue preferred stock; |
| • | pay dividends on, redeem or repurchase capital stock; |
| • | issue capital stock of restricted subsidiaries; |
| • | make certain investments; |
| • | enter into certain types of transactions with affiliates; |
| • | create liens; and |
| • | sell certain assets or merge with or into other companies. |
The indenture governing the 9% Senior Secured Notes also contains certain customary affirmative covenants and events of default, including an event of default that would result from either the failure to pay at stated final maturity, or acceleration of the maturity of, a principal amount of any other indebtedness of Avaya Inc. or any of its restricted subsidiaries if the aggregate principal amount of such indebtedness, together with the principal amount of any other such indebtedness in default for failure to pay principal at final maturity or the maturity of which has been accelerated, aggregates $85 million or more at any time.
180
Table of Contents
10.50% Senior Secured Notes due 2019
Overview
On March 7, 2013, Avaya Inc. completed an Exchange Offer in which $1,384 million of senior unsecured notes were exchanged for $1,384 million of 10.50% senior secured notes due 2021 (the “10.50% Senior Secured Notes”). As of September 30, 2014, Avaya Inc. had outstanding an aggregate principal amount of $1,384 million senior secured notes due 2021, which were issued on March 7, 2013.
Interest rate
The 10.50% Senior Secured Notes were issued in the aggregate principal amount of $1,384 million and bear interest in cash at the rate of 10.50% per annum. Interest is payable semi-annually on March 1 and September 1 commencing on September 1, 2013.
Optional redemption
Commencing March 1, 2017, Avaya Inc. may redeem the 10.50% Senior Secured Notes, in whole or in part, at a price equal to 107.875% of the principal amount redeemed, which decreases to 105.250% on March 1, 2018, to 102.625% on March 1, 2019 and to 100% on or after March 1, 2020, plus accrued and unpaid interest.
Prior to March 1, 2017, Avaya Inc. may redeem the 10.50% Senior Secured Notes, in whole or in part, at a price equal to 100% of the principal amount thereof, plus a “make-whole” premium, plus accrued and unpaid interest.
In addition, at any time until March 1, 2016, Avaya Inc. may redeem up to 35% of the aggregate principal amount of the 10.50% Senior Secured Notes at a redemption price equal to 110.50% of the face amount thereof plus accrued and unpaid interest, if any, to the redemption date, with the net cash proceeds raised in or more equity offerings by Avaya Inc. or Avaya Holdings Corp.; provided that the aggregate principal amount of 10.50% Senior Secured Notes that remain outstanding immediately after such redemption is equal to or greater than 50% of the aggregate principal amount of 10.50% Senior Secured Notes issued under the indenture governing the 10.50% Senior Secured Notes.
Change of control offer
If a change of control occurs, Avaya Inc. must give holders of its 10.50% Senior Secured Notes an opportunity to sell their notes to Avaya Inc. at a purchase price equal to 101% of the principal amount thereof, plus accrued and unpaid interest.
Mandatory offer to purchase following certain asset sales
If Avaya Inc. or its subsidiaries engage in certain asset sales, unless they invest the cash proceeds from such sales in their business or use the proceeds to prepay secured indebtedness (including under the credit facilities) within a specified period of time, Avaya Inc. must offer to repurchase the 10.50% Senior Secured Notes at 100% of the principal amount thereof, plus accrued and unpaid interest, if any, with such proceeds (if applicable, on a pro rata basis with certain pari passu indebtedness).
Final maturity
The 10.50% Senior Secured Notes mature on March 1, 2021, and do not have required principal payments prior to maturity.
181
Table of Contents
Guarantees and security
Avaya Inc.’s domestic 100% owned subsidiaries that are borrowers or guarantors of the senior secured multi-currency asset-based revolving credit facility, the senior secured credit facility, the senior unsecured notes, the 7% Senior Secured Notes and the 9% Senior Secured Notes guarantee the 10.50% Senior Secured Notes.
All obligations under the indenture governing the 10.50% Senior Secured Notes, and the guarantees of those obligations, are secured, subject to certain exceptions, on a junior priority basis to the senior secured multi-currency asset-based revolving credit facility, the senior secured credit facility, the 7% Senior Secured Notes, the 9% Senior Secured Notes and any future senior obligations by a lien on substantially all of the assets of Avaya Inc. and the subsidiary guarantors other than real estate, subject to certain limited exceptions.
Certain covenants and events of default
The indenture governing the 10.50% Senior Secured Notes contains a number of covenants that, among other things and subject to certain exceptions, restrict Avaya Inc.’s ability and the ability of its subsidiaries to:
| • | incur additional debt and issue preferred stock; |
| • | pay dividends on, redeem or repurchase capital stock; |
| • | issue capital stock of restricted subsidiaries; |
| • | make certain investments; |
| • | enter into certain types of transactions with affiliates; |
| • | create liens; and |
| • | sell certain assets or merge with or into other companies. |
The indenture governing the 10.50% Senior Secured Notes also contains certain customary affirmative covenants and events of default, including an event of default that would result from either the failure to pay at stated final maturity, or acceleration of the maturity of, a principal amount of any other indebtedness of Avaya Inc. or any of its restricted subsidiaries if the aggregate principal amount of such indebtedness, together with the principal amount of any other such indebtedness in default for failure to pay principal at final maturity or the maturity of which has been accelerated, aggregates $85 million or more at any time.
182
Table of Contents
The following is a description of the material terms of our certificate of incorporation and bylaws as each is anticipated to be in effect upon the consummation of this offering.
General
Upon the consummation of this offering, the total amount of our authorized capital stock will consist of shares of common stock, par value $0.001 per share and shares of preferred stock, par value $0.001 per share. As of November 1, 2014, we had 489,459,943 shares of common stock outstanding, held by 160 holders, 125,000 shares of Series A Preferred Stock outstanding, held by 33 holders and 48,921 shares of Series B Convertible Preferred Stock outstanding, held by 8 holders.
Immediately following the consummation of this offering, and giving effect to the application of the net proceeds from this offering as described in “Use of Proceeds” above, we expect to have issued and outstanding shares of common stock ( shares of common stock if the underwriters’ over-allotment option is exercised in full) and up to 125,000 shares of Series A Preferred Stock outstanding, in the event we do not redeem any shares of the Series A Preferred Stock. Immediately outstanding following the closing of this offer, we also expect to have:
| • | outstanding vested and unvested options to acquire shares of common stock and options available for grant under our 2007 Plan to acquire shares of common stock; |
| • | shares of common stock issuable upon conversion of the Series B Convertible Preferred Stock held by affiliates of our Sponsors, and convertible at any time as such Series B Convertible Preferred Stock is outstanding at a conversion price equal to the lesser of (1) $4.00 per share (subject to certain anti-dilution provisions) or (2) the offering price per share in this offering, which shares if converted are subject to the lock-up agreements described under “Underwriters.” |
| • | outstanding RSUs issued under the 2007 Plan, each representing the right to receive one share of common stock, subject to certain restrictions on their transfer and sale as provided for in the 2007 Plan and the related award agreements; and |
| • | outstanding warrants to acquire a total of 124,460,642 shares of common stock (see “—Warrants”). |
Common Stock
Holders of our common stock are entitled to one vote for each share held on all matters submitted to a vote of stockholders and do not have cumulative voting rights. An election of directors by our stockholders shall be determined by a plurality of the votes cast by the stockholders entitled to vote on the election. Holders of common stock are entitled to receive proportionately any dividends as may be declared by our board of directors, subject to any preferential dividend rights of any series of preferred stock that is outstanding at the time of the dividend.
In the event of our liquidation or dissolution, the holders of common stock are entitled to receive proportionately our net assets available for distribution to stockholders after payment of all debts and other liabilities and subject to the prior rights of any outstanding preferred stock.
All shares of common stock will, when issued, be duly authorized, fully paid and nonassessable. The rights, preferences and privileges of holders of common stock are subject to the rights of the holders of shares of any series of preferred stock that we may designate and issue in the future.
Warrants
In connection with the financing of the acquisition of NES, on December 18, 2009, we issued warrants to purchase 100,000,000 shares of our common stock. The warrants have a cashless exercise feature. The warrants contain customary adjustment provisions for stock splits, capital reorganizations and certain other distributions. The warrants have an exercise price of $3.25 per share and are exercisable at any time prior to December 18, 2019.
183
Table of Contents
In connection with the issuance on May 29, 2012 of Series B Convertible Preferred Stock described below, we issued warrants to purchase 24,460,642 shares of our common stock. The warrants have a cashless exercise feature. The warrants contain customary adjustment provisions for stock splits, capital reorganizations and certain other distributions. The warrants have an exercise price of $4.00 per share and are exercisable at any time prior to May 29, 2022.
Options and Restricted Stock Units
As of September 30, 2014, we had outstanding options to acquire 26,055,786 shares of common stock which are held by our employees, directors and advisors, with exercise prices ranging from $2.25 to $5.00 per share and a weighted average exercise price of $2.95 per share. As of September 30, 2014, we also had 16,172,848 shares of common stock issuable upon the vesting and distributions of RSUs. Each RSU represents the right to receive one share of common stock, subject to certain restrictions on their transfer and sale as provided for in the 2007 Plan and the related award agreements.
Preferred Stock
Our board of directors is authorized to issue shares of preferred stock in one or more series, with such designations, preferences and relative participating, optional or other special rights, qualifications, limitations or restrictions as determined by our board of directors, without any further vote or action by our stockholders. We believe that the board of directors’ authority to set the terms of, and our ability to issue, preferred stock will provide flexibility in connection with possible financing transactions in the future. The issuance of preferred stock, however, could adversely affect the voting power of holders of common stock and the likelihood that such holders will receive dividend payments and payments upon a liquidation, dissolution or winding up of us.
Series A Preferred Stock
Our board of directors has designated 125,000 shares of preferred stock as Series A Preferred Stock. As of September 30, 2014 we had 125,000 shares of Series A Preferred Stock issued and outstanding. The certificate of designations for the Series A Preferred Stock grants holders of our Series A Preferred Stock the right to receive, when and if declared by our board of directors and in preference to the holders of any and all other series or classes of capital stock, payable either in cash or, at our option, by issuance of additional shares of Series A Preferred Stock, cumulative annual dividends at a rate of 5% per annum on $1,000 per share (which value is to be proportionately adjusted to reflect any stock dividend, stock split, combination of shares, reclassification, reorganization, recapitalization or other similar event affecting the Series A Preferred Stock), compounded quarterly from and after the date of issuance of such shares of Series A Preferred Stock. Except as required by Delaware law or as otherwise provided by our certificate of incorporation, the holders of Series A Preferred Stock have no right to vote their shares at any stockholders’ meeting or provide consent to any action taken by stockholders in writing in lieu of a meeting.
In the event of certain events including our liquidation, dissolution or winding up, either voluntarily or involuntarily, a sale of all or substantially all of our assets, or our merger or consolidation, the holders of the Series A Preferred Stock are entitled to receive, in cash, prior and in preference to any other distribution of any of our assets to the holders of all series and classes of our stock, an amount per share equal to the sum of $1,000 (as adjusted to reflect any stock dividend, stock split, combination of shares, reclassification, reorganization, recapitalization or other similar event affecting the Series A Preferred Stock) plus the amount of accrued unpaid dividends for any prior dividend periods on such share, if any (such sum being referred to as the Series A Preferential Amount). We may at any time redeem, in cash, to the extent of lawfully available funds therefor, any or all Series A Preferred Shares at a price per share equal to the Series A Preferential Amount allocable to each share of Series A Preferred Stock.
As disclosed under “Use of Proceeds” above, we may use a portion of the net proceeds from this offering to redeem some or all of the outstanding shares of Series A Preferred Stock.
184
Table of Contents
Series B Convertible Preferred Stock
Our board of directors has designated 52,500 shares of preferred stock as Series B Convertible Preferred Stock. As of September 30, 2014, we had 48,921 shares of Series B Convertible Preferred Stock issued and outstanding. The certificate of designations for the Series B Convertible Preferred Stock grants holders of our Series B Convertible Preferred Stock the right to receive, as when and if declared by our board of directors and in preference to the holders of any and all other series or classes of capital stock, payable either in cash or, at our option, by issuance of additional shares of Series B Convertible Preferred Stock, cumulative annual dividends at a rate of 8% per annum on $4,000 per share (which value is to be proportionately adjusted to reflect any stock dividend, stock split, combination of shares, reclassification, reorganization, recapitalization or other similar event affecting the Series B Convertible Preferred Stock), compounded annually from and after the date of issuance of such shares of Series B Convertible Preferred Stock. Except as required by Delaware law or as otherwise provided by our certificate of incorporation, the holders of Series B Convertible Preferred Stock have no right to vote their shares at any stockholders’ meeting or provide consent to any action taken by stockholders in writing in lieu of a meeting.
In the event of certain events including our liquidation, dissolution or winding up, either voluntarily or involuntarily, a sale of all or substantially all of our assets, or our merger or consolidation, the holders of the Series B Convertible Preferred Stock are entitled to receive, in cash, prior and in preference to any other distribution of any of our assets to the holders of all series and classes of our stock, an amount per share equal to the sum of $4,000 (as adjusted to reflect any stock dividend, stock split, combination of shares, reclassification, reorganization, recapitalization or other similar event affecting the Series B Convertible Preferred Stock) multiplied by the redemption premium, calculated as follows based on the date fixed for redemption: (1) from the date of issuance through the date of the 1st anniversary thereof, 110%; (2) from the date that follows the 1st anniversary through the date of the 2nd anniversary, 120%; (3) from the date that follows the 2nd anniversary through the date of the 3rd anniversary, 130%; (4) from the date that follows the 3rd anniversary through the date of the 4th anniversary, 140% and (4) any date that follows the 4th anniversary of the date of issuance, 150%, plus the amount of accrued unpaid dividends for any prior dividend periods on such share, if any (such sum being referred to as the Series B Preferential Amount). A majority of the holders of Series B Convertible Stock may elect at any time prior to this offering to redeem, in cash, to the extent of lawfully available funds therefor, all Series B Convertible Preferred Shares at a price per share equal to the Series B Preferential Amount allocable to each share of Series B Convertible Preferred Stock. We may at any time redeem, in cash, to the extent of lawfully available funds therefor, all Series B Convertible Preferred Shares at a price per share equal to the Series B Convertible Preferential Amount allocable to each share of Series B Convertible Preferred Stock.
Each holder of the Series B Convertible Preferred Stock may at any time prior to this offering elect to convert the shares of Series B Preferred Stock into shares of common stock, the number of which will be determined by dividing $4,000 (as adjusted to reflect any stock dividend, stock split, combination of shares, reclassification, reorganization, recapitalization or other similar event affecting the Series B Convertible Preferred Stock) plus all accrued and unpaid dividends by the lesser of (a) $4.00 (as adjusted to reflect any stock dividend, stock split, combination of shares, reclassification, reorganization, recapitalization or other similar event affecting the Series B Convertible Preferred Stock); or (b) in the event that such conversion is in connection with this offering, the offering price per share in such offering (such amount being referred to as the Conversion Price).
Notwithstanding the optional conversion and redemption rights described above, concurrently with the consummation of this offering, the Series B Convertible Preferred Stock will be converted into common stock at the Conversion Price or redeemed for cash at the Series B Preferential Amount. The determination of which will occur will be made by the majority of the holders of Series B Convertible Stock; however, if our Total Leverage Ratio (as defined in our senior secured credit facility) after giving effect to this offering would be greater than 5.0x, the Series B Convertible Preferred Stock will automatically convert into shares of our common stock.
185
Table of Contents
Anti-takeover Effects of the Delaware General Corporation Law and Our Certificate of Incorporation and Bylaws
Our certificate of incorporation and our bylaws contain provisions that may delay, defer or discourage another party from acquiring control of us, some of which may only become effective when the Sponsors collectively cease to beneficially own at least 40% or more of our outstanding common stock (such time referred to in this section as the “triggering event”). We expect that these provisions, which are summarized below, will discourage coercive takeover practices or inadequate takeover bids. These provisions are also designed to encourage persons seeking to acquire control of us to negotiate first with the board of directors, which we believe may result in an improvement of the terms of any such acquisition in favor of our stockholders. However, they may also discourage acquisitions that some stockholders may favor. This offering will not constitute a triggering event.
Board of Directors
Immediately following this offering, the board of directors will consist of nine members. Our certificate of incorporation provides that the board of directors will not have more than fifteen members. See “Certain Relationships and Related Party Transactions—Arrangements with Our Sponsors.”
Potential Staggered Board
Our current board is, and upon completion of this offering will be, comprised of a single class of directors. Our certificate of incorporation provides that at the first annual meeting after the triggering event, the Board shall be divided into three classes with staggered three-year terms. The classification of our Board could make it more difficult for a third party to acquire, or discourage a third party from seeking to acquire, control of our company.
Action by Written Consent
The Delaware General Corporation Law, or the DGCL, provides that, unless otherwise stated in a corporation’s certificate of incorporation, the stockholders may act by written consent without a meeting. Our certificate of incorporation and bylaws provide that, following the triggering event, any action required or permitted to be taken by our stockholders at an annual meeting or special meeting of the stockholders may only be taken if it is properly brought before such meeting, and not by written consent without a meeting. Prior to the triggering event, stockholders may act by written consent without a meeting.
Special Meeting of Stockholders and Advance Notice Requirements for Stockholder Proposals
Our certificate of incorporation and bylaws provide that, except as otherwise required by law, special meetings of the stockholders can only be called by (a) our chairman or, if one is appointed, vice chairman of the Board, (b) our president, (c) a majority of the board of directors through a special resolution or (d) prior to the triggering event, a Sponsor-nominated director.
In addition, following the first annual meeting of stockholders that occurs at least 90 days after the triggering event described above, our bylaws will require advance notice procedures for stockholder proposals to be brought before an annual meeting of the stockholders, including the nomination of directors. Stockholders at an annual meeting may only consider the proposals specified in the notice of meeting or brought before the meeting by or at the direction of the board of directors, or by a stockholder of record on the record date for the meeting, who is entitled to vote at the meeting and who has delivered a timely written notice in proper form to our secretary, of the stockholders’ intention to bring such business before the meeting.
These provisions could have the effect of delaying until the next stockholder meeting any stockholder actions that are favored by the holders of a majority of our outstanding voting securities.
186
Table of Contents
Requirements for Removal and Interim Election of Directors
Our certificate of incorporation and bylaws provide that, prior to the triggering event, directors may be removed, with or without cause, by the holders of a majority of the shares entitled to vote on the election of directors, voting together as a single class.
Following the triggering event, our certificate of incorporation and bylaws provide that the directors may only be removed for cause and only by the affirmative vote of the holders of at least two-thirds of the voting power of our outstanding capital stock entitled to vote generally in the election of directors, voting together as a single class.
Vacancies and newly created directorships may be filled only by a vote of a majority of the directors then in office, even though less than a quorum, and not by the stockholders, except that, prior to a triggering event, such vacancies may be filled by a vote of holders of a majority of the outstanding common stock. In addition, the certificate of incorporation provides that any vacancy created by the removal of a director by the stockholders shall only be filled by, in addition to any other vote otherwise required by law, the affirmative vote of a majority of the outstanding common stock. Our bylaws allow the presiding officer at a meeting of the stockholders to adopt rules and regulations for the conduct of meetings, which may have the effect of precluding the conduct of certain business at a meeting if the rules and regulations are not followed.
These provisions may have the effect of deferring, delaying or discouraging hostile takeovers, or changes in control or management of our company.
Amendment to Certificate of Incorporation and Bylaws
The DGCL provides generally that the affirmative vote of a majority of the shares entitled to vote on any matter is required to amend a corporation’s certificate of incorporation or bylaws, unless a corporation’s certificate of incorporation or bylaws, as the case may be, requires a greater percentage. Prior to the triggering event, our bylaws may be amended by a majority vote of our board of directors or the affirmative vote of the holders of a majority of the outstanding common stock. Following the triggering event, our bylaws may be amended or repealed by a majority vote of our board of directors or, in addition to any other vote otherwise required by law, the affirmative vote of the holders of at least two-thirds of the voting power of our outstanding shares of common stock. Additionally, prior to the triggering event, our certificate of incorporation may be amended by the affirmative vote of the holders of a majority of the outstanding common stock. Following the triggering event, the affirmative vote of at least two-thirds of the voting power of the outstanding shares of capital stock entitled to vote on the adoption, alteration, amendment or repeal of our certificate of incorporation, voting as a single class, is required to amend or repeal or to adopt any provision inconsistent with the “Board of Directors,” “No Action by Written Consent,” “Special Meetings of Stockholders,” “Amendments to the Amended and Restated Certificate of Incorporation and Bylaws” and “Business Combinations” provisions described in our certificate of incorporation. These provisions may have the effect of deferring, delaying or discouraging the removal of any anti-takeover defenses provided for in our certificate of incorporation and our bylaws.
Exclusive Jurisdiction of Certain Actions
Our certificate of incorporation requires, to the fullest extent permitted by law, that derivative actions brought in the name of the company, actions against directors, officers and employees for breach of fiduciary duty and other similar actions may be brought only in the Court of Chancery in the State of Delaware. Although we believe this provision benefits the Company by providing increased consistency in the application of Delaware law in the types of lawsuits to which it applies, the provision may have the effect of discouraging lawsuits against our directors and officers.
187
Table of Contents
Authorized but Unissued Shares
The authorized but unissued shares of common stock and preferred stock are available for future issuance without stockholder approval, subject to any limitations imposed by the listing standards of the New York Stock Exchange. These additional shares may be used for a variety of corporate finance transactions, acquisitions and employee benefit plans. The existence of authorized but unissued common stock and preferred stock could make more difficult or discourage an attempt to obtain control of us by means of a proxy contest, tender offer, merger or otherwise.
Business Combinations
We have elected to not be subject to Section 203 of the DGCL, which regulates business combinations with “interested stockholders,” until such time as neither Sponsor is an “interested stockholder” under the DGCL.
Corporate Opportunities
Our certificate of incorporation will provide that none of our Sponsors or non-employee directors, or any of their respective affiliates, partners, principals, directors, officers, members, managers or employees, shall have any fiduciary duty to refrain from engaging directly or indirectly in the same or similar business activities or lines of business as we do or offer us business opportunities of which they become aware. The affirmative vote of eighty percent (80%) of the voting power of the outstanding shares of capital stock entitled to vote on the adoption, alteration, amendment or repeal of amendments to our certificate of incorporation, voting together as a single class, shall be required to alter, amend or repeal, or to adopt any provision inconsistent with that provision.
Transfer Agent and Registrar
The transfer agent and registrar for our common stock is .
Listing
We have applied to list our shares of common stock on the New York Stock Exchange under the symbol “AVYA.”
188
Table of Contents
SHARES ELIGIBLE FOR FUTURE SALE
Before this offering, there has not been a public market for our common stock. As described below, only a limited number of shares currently outstanding will be available for sale immediately after this offering due to contractual and legal restrictions on resale. Nevertheless, future sales of substantial amounts of our common stock, including shares issued upon exercise of outstanding options and warrants, in the public market after the restrictions lapse, or the possibility of such sales, could cause the prevailing market price of our common stock to fall or impair our ability to raise equity capital in the future.
Upon the consummation of this offering, we will have outstanding an aggregate of approximately shares of common stock. In addition, as of the closing of this offering, (a) options to purchase an aggregate of approximately shares of our common stock will be outstanding, (b) restricted stock units, each representing the right to receive one share of common stock will be outstanding and (c) warrants to acquire 124,460,642 shares of our common stock will be outstanding. Of the outstanding shares, the shares sold in this offering will be freely tradable in the public market without restriction or further registration under the Securities Act, unless these shares are held by our affiliates, as that term is defined in Rule 144 under the Securities Act. Shares purchased by our affiliates may not be resold except pursuant to an effective registration statement or an exemption from registration.
The remaining shares of our common stock will be “restricted securities,” as that term is defined in Rule 144 under the Securities Act. These restricted securities may be sold in the public market only pursuant to an effective registration statement or an exemption from registration under Rule 144 and Rule 701 under the Securities Act. These rules are summarized below. Subject to our stockholders’ agreement and the lock-up agreements described below and the provisions of Rule 144 and Rule 701, these restricted securities will be available for sale in the public market as follows:
| Number of Shares |
Date of Availability for Sale | |
| Various times after the date of this prospectus pursuant to Rule 144 | ||
| Various times beginning 180 days after the date of this prospectus |
Lock-Up Arrangements
We and our officers, directors, employees and certain stockholders, including the Sponsors, who together hold an aggregate of shares of our common stock after the consummation of this offering, have agreed, subject to limited exceptions, not to directly or indirectly sell or dispose of any shares of common stock or any securities convertible into or exchangeable or exercisable for shares of common stock for a period of 180 days after the date of this prospectus, unless extended pursuant to its terms, without the prior written consent of Morgan Stanley & Co. LLC, Goldman, Sachs & Co. and J.P. Morgan Securities LLC. For additional information, see “Underwriters.”
Rule 144
In general, under Rule 144, immediately upon the completion of this offering, a person who is not our affiliate and has not been our affiliate at any time during the preceding three months will be entitled to sell any shares of our common stock that such person has held for at least six months, including the holding period of any prior owner other than one of our affiliates, without regard to volume limitations. Sales of our common stock by any such person would be subject to the availability of current public information about us if the shares to be sold were held by such person for less than one year.
Our affiliates who have beneficially owned shares of our common stock for at least six months, including the holding period of any prior owner other than another of our affiliates, would be entitled to sell within any
189
Table of Contents
three-month period those shares and any other shares they have acquired that are not restricted securities, provided that the aggregate number of shares sold does not exceed the greater of:
| • | 1% of the number of shares of our common stock then outstanding, which will equal approximately shares immediately after this offering, and |
| • | the average weekly trading volume in our common stock during the four calendar weeks preceding the date of filing of a Notice of Proposed Sale of Securities Pursuant to Rule 144 with respect to the sale. |
Sales under Rule 144 by our affiliates are also subject to manner of sale provisions and notice requirements and to the availability of current public information about us.
Rule 701
In general, under Rule 701, any of an issuer’s employees, directors, officers, consultants or advisors who purchases shares from the issuer in connection with a compensatory stock or option plan or other written agreement before the effective date of a registration statement under the Securities Act is entitled to sell such shares 90 days after such effective date in reliance on Rule 144. An affiliate of the issuer can resell shares in reliance on Rule 144 without having to comply with the holding period requirement, and non-affiliates of the issuer can resell shares in reliance on Rule 144 without having to comply with the current public information and holding period requirements.
The SEC has indicated that Rule 701 will apply to typical stock options granted by an issuer before it becomes subject to the reporting requirements of the Exchange Act, along with the shares acquired upon exercise of such options, including exercises after an issuer becomes subject to the reporting requirements of the Exchange Act.
Stock Plans
We intend to file a registration statement on Form S-8 under the Securities Act covering shares of our common stock issuable upon exercise of outstanding options under the 2007 Plan and for future equity incentive plans to be effective upon consummation of this offering. Resale of these shares will be subject to any applicable contractual lock-up periods.
Registration Rights
Subject to the lock-up agreements described above, certain holders of our common stock may demand that we register their shares under the Securities Act or, if we file another registration statement under the Securities Act other than a Form S-8 covering securities issuable under our equity plans or on Form S-4, may elect to include their shares of common stock in such registration. Shares sold pursuant to any such registration statement will be freely tradable without restriction under the Securities Act, unless held by our affiliates.
190
Table of Contents
MATERIAL U.S. FEDERAL INCOME TAX CONSIDERATIONS FOR
NON-U.S. HOLDERS
The following is a summary of the material U.S. federal income tax considerations relating to the purchase, ownership and disposition of our common stock by Non-U.S. Holders (defined below). This summary does not purport to be a complete analysis of all the potential tax considerations relevant to Non-U.S. Holders of our common stock. This summary is based upon the Internal Revenue Code of 1986, as amended (the “Code”), the U.S. Treasury regulations promulgated or proposed thereunder and administrative and judicial interpretations thereof, all as of the date hereof and all of which are subject to change at any time, possibly with retroactive effect.
This summary deals only with shares of our common stock that are purchased in this offering and held as “capital assets” within the meaning of Section 1221 of the Code. This summary does not purport to deal with all aspects of U.S. federal income taxation that might be relevant to particular Non-U.S. Holders in light of their particular investment circumstances or status, nor does it address specific tax considerations that may be relevant to particular persons (including, for example, financial institutions, broker-dealers, insurance companies, partnerships or other pass-through entities, U.S. expatriates, tax-exempt entities, pension plans, “controlled foreign corporations,” “passive foreign investment companies,” corporations that accumulate earnings to avoid U.S. federal income tax, persons in special situations, such as those who have elected to mark securities to market or those who hold common stock as part of a straddle, hedge, conversion transaction, synthetic security or other integrated investment, or holders subject to the alternative minimum tax). In addition, this summary does not address any U.S. federal income tax consequences other than U.S. federal income tax consequences (such as estate and gift tax considerations) or considerations under the tax laws of the United States, any state, local or non-U.S. jurisdiction.
For purposes of this summary, a “Non-U.S. Holder” means a beneficial owner of common stock that is, for U.S. federal income tax purposes, an individual, corporation, estate or trust and is not:
| • | an individual who is a citizen or resident of the United States; |
| • | a corporation organized under the laws of the United States, any state thereof or the District of Columbia; |
| • | an estate, the income of which is included in gross income for U.S. federal income tax purposes regardless of its source; or |
| • | a trust, if (i) a U.S. court is able to exercise primary supervision over the trust’s administration and one or more U.S. persons have the authority to control all of the trust’s substantial decisions or (ii) the trust has a valid election in effect under applicable U.S. Treasury regulations to be treated as a U.S. person. |
If an entity that is treated as a partnership for U.S. federal income tax purposes holds our common stock, the tax treatment of its partners will generally depend upon the status of the partner and the activities of the partnership. Entities that are treated as partnerships for U.S. federal income tax purposes and persons considering an investment in our common stock through an entity treated as a partnership for U.S. federal income tax purposes are urged to consult their own tax advisors. There can be no assurance that the Internal Revenue Service (“IRS”) will not challenge one or more of the tax consequences described herein, and we have not obtained, nor do we intend to obtain, a ruling from the IRS with respect to the U.S. federal income or estate tax consequences to a Non-U.S. Holder of the purchase, ownership or disposition of our common stock.
THIS SUMMARY IS FOR GENERAL INFORMATION ONLY AND NOT SPECIFIC TO ANY PARTICULAR INVESTOR. NON-U.S. HOLDERS ARE URGED TO CONSULT THEIR OWN TAX ADVISORS CONCERNING THE U.S. FEDERAL, STATE, LOCAL AND NON-U.S. INCOME AND OTHER TAX CONSEQUENCES TO THEM OF THE PURCHASE, OWNERSHIP AND DISPOSITION OF OUR COMMON STOCK, AS WELL AS THE APPLICATION OF U.S. FEDERAL STATE, LOCAL AND NON-U.S. INCOME AND OTHER TAX LAWS.
191
Table of Contents
Distributions on Our Common Stock
As discussed under “Dividend Policy” above, we do not currently expect to pay dividends on our common stock. If we do make a distribution of cash or other property with respect to our common stock, any such distributions generally will constitute dividends for U.S. federal income tax purposes to the extent of our current or accumulated earnings and profits, as determined under U.S. federal income tax principles. If a distribution exceeds our current and accumulated earnings and profits, the excess will first constitute a tax-free return of capital and will reduce the holder’s basis in our common stock (normally determined on a share by share basis), but not below zero. Any remaining excess will be treated as capital gain, subject to the tax treatment described below in “—Gain on Sale, Exchange or Other Taxable Disposition of Our Common Stock.” Any such distribution would also be subject to the discussion below in “—Additional FATCA Withholding.”
Dividends paid to a Non-U.S. Holder generally will be subject to a 30% U.S. federal withholding tax unless such Non-U.S. Holder provides us or our agent, as the case may be, with the appropriate IRS Form W-8, such as:
| • | IRS Form W-8BEN (or successor form) certifying, under penalties of perjury, a reduction in or exemption from withholding under an applicable income tax treaty, or |
| • | IRS Form W-8ECI (or successor form) certifying that a dividend paid on common stock is not subject to such withholding tax because it is effectively connected with a trade or business in the United States of the Non-U.S. Holder (in which case such dividend generally will be subject to regular graduated U.S. federal income tax rates as described below). |
The certification requirement described above also may require a Non-U.S. Holder that provides an IRS form or that claims treaty benefits to provide its U.S. taxpayer identification number. Special certification and other requirements apply in the case of certain Non-U.S. Holders that are intermediaries or pass-through entities for U.S. federal income tax purposes. Each Non-U.S. Holder is urged to consult its own tax advisor about the specific methods for satisfying these requirements. A claim for exemption will not be valid if the person receiving the applicable form has actual knowledge or reason to know that the statements on the form are false.
If dividends are effectively connected with a trade or business in the United States of a Non-U.S. Holder, the Non-U.S. Holder, although exempt from the withholding tax described above (provided that the certifications described above are satisfied), generally will be subject to U.S. federal income tax on such dividends on a net income basis in the same manner as if it were a resident of the United States (unless an applicable tax treaty provides otherwise). In addition, if a Non-U.S. Holder is treated as a corporation for U.S. federal income tax purposes, the Non-U.S. Holder may be subject to an additional “branch profits tax” equal to 30% (unless reduced by an applicable income treaty) of its earnings and profits, subject to adjustments, in respect of such effectively connected dividend income.
If a Non-U.S. Holder is eligible for a reduced rate of U.S. federal withholding tax pursuant to an income tax treaty, the holder may obtain a refund or credit of any excess amount withheld by timely filing an appropriate claim for refund with the IRS.
Gain on Sale, Exchange or Other Taxable Disposition of Our Common Stock
Subject to the discussion below in “—Additional FATCA Withholding,” in general, a Non-U.S. Holder will not be subject to U.S. federal income tax or withholding tax on any gain realized upon such holder’s sale, exchange or other taxable disposition of shares of our common stock unless (i) such Non-U.S. Holder is an individual who is present in the United States for 183 days or more in the taxable year of disposition, and certain other conditions are met, (ii) we are or have been a “United States real property holding corporation,” as defined in the Code (a “USRPHC”), at any time within the shorter of the five-year period preceding the disposition and the Non-U.S. Holder’s holding period in the shares of our common stock, and certain other requirements are met, or (iii) such gain is effectively connected with the conduct by such Non-U.S. Holder of a trade or business in the United States (and, if required by an applicable income tax treaty, is attributable to a permanent establishment maintained by such Non-U.S. Holder in the United States).
192
Table of Contents
If the first exception applies, the Non-U.S. Holder generally will be subject to U.S. federal income tax at a rate of 30% (or at a reduced rate under an applicable income tax treaty) on the amount by which such Non-U.S. Holder’s capital gains allocable to U.S. sources (including gain, if any, realized on a disposition of our common stock) exceed capital losses allocable to U.S. sources during the taxable year of the disposition. If the third exception applies, the Non-U.S. Holder generally will be subject to U.S. federal income tax with respect to such gain on a net income basis in the same manner as if it were a resident of the United States, and a Non-U.S. Holder that is a corporation for U.S. federal income tax purposes may also be subject to a branch profits tax with respect any earnings and profits, subject to adjustments, attributable to such gain at a rate of 30% (or at a reduced rate under an applicable income tax treaty).
Generally, a corporation is a USRPHC only if the fair market value of its U.S. real property interests (as defined in the Internal Revenue Code) equals or exceeds 50% of the sum of the fair market value of its worldwide real property interests plus its other assets used or held for use in a trade or business. Although there can be no assurance in this regard, we believe that we are not, and do not currently anticipate becoming, a USRPHC. However, because the determination of whether we are a USRPHC depends on the fair market value of our U.S. real property relative to the fair market value of other business assets, there can be no assurance that we will not become a USRPHC in the future. Even if we were to become a USRPHC, a Non-U.S. Holder would not be subject to U.S. federal income tax on a sale, exchange or other taxable disposition of our common stock by reason of our status as a USRPHC so long as our common stock is regularly traded on an established securities market at any time during the calendar year in which the disposition occurs and such Non-U.S. Holder does not own and is not deemed to own (directly, indirectly or constructively) more than 5% of our common stock at any time during the shorter of the five-year period ending on the date of disposition and the holder’s holding period. However, no assurance can be provided that our common stock will be regularly traded on an established securities market for purposes of the rules described above. Prospective investors are encouraged to consult their own tax advisors regarding the possible consequences to them if we are, or were to become, a USRPHC.
Additional FATCA Withholding
Under Sections 1471 through 1474 of the Internal Revenue Code and related Treasury guidance (“FATCA”), a withholding tax of 30% will be imposed in certain circumstances on payments of (a) dividends on our common stock on or after January 1, 2014, and (b) gross proceeds from the sale or other disposition of our common stock on or after January 1, 2017 to certain foreign financial institutions or foreign entities that are not foreign financial institutions. In the case of payments made to a ‘‘foreign financial institution’’ as defined under FATCA (including, among other entities, an investment fund), as a beneficial owner or as an intermediary, the tax generally will be imposed, subject to certain exceptions, unless such institution (i) enters into (or is otherwise subject to) and complies with an agreement with the U.S. government (a “FATCA Agreement”) or (ii) complies with applicable foreign law enacted in connection with an intergovernmental agreement between the United States and a foreign jurisdiction (an “IGA”), in either case to, among other things, collect and provide to the U.S. or other relevant taxing authorities certain information regarding U.S. account holders of such institution. In the case of payments made to a foreign entity that is not a foreign financial institution (as a beneficial owner or an intermediary), the tax generally will be imposed, subject to certain exceptions, unless such foreign entity provides the withholding agent with a certification that it does not have any “substantial U.S. owner” (generally, any specified U.S. person that directly or indirectly owns more than a specified percentage of such entity) or that identifies its substantial U.S. owners. If our common stock is held through a foreign financial institution that enters into (or is otherwise subject to) a FATCA Agreement, such foreign financial institution (or, in certain cases, a person paying amounts to such foreign financial institution) generally will be required, subject to certain exceptions, to withhold such tax on payments of dividends and proceeds described above made to (x) a person (including an individual) that fails to comply with certain information requests or (y) a foreign financial institution that has not entered into (and is not otherwise subject to) a FATCA Agreement and is not required to comply with FATCA pursuant to applicable foreign law enacted in connection with an IGA. Each Non-U.S. Holder should consult its own tax advisor regarding the application of FATCA to the ownership and disposition of our common stock, including through an intermediary.
193
Table of Contents
Backup Withholding and Information Reporting
We must report annually to the IRS and to each Non-U.S. Holder the gross amount of the distributions on our common stock paid to the holder and the tax withheld, if any, with respect to the distributions.
Non-U.S. Holders must generally have to comply with specific certification procedures to establish that the holder is not a United States person (as defined in the Internal Revenue Code) in order to avoid backup withholding at a rate of 28% with respect to dividends on our common stock, or otherwise establish an exemption.
Information reporting and backup withholding will generally apply to the proceeds of a disposition of our common stock by a Non-U.S. Holder effected by or through the U.S. office of any broker, U.S. or foreign, unless the holder certifies its status as a Non-U.S. Holder and satisfies certain other requirements, or otherwise establishes an exemption. Dispositions effected through a non-U.S. office of a U.S. broker or a non-U.S. broker with substantial U.S. ownership or operations generally will be treated in a manner similar to dispositions effected through a U.S. office of a broker. Prospective investors should consult their own tax advisors regarding the application of the information reporting and backup withholding rules to them.
Copies of information returns may be made available to the tax authorities of the country in which the Non-U.S. Holder resides or is incorporated under the provisions of a specific treaty or agreement.
Backup withholding is not an additional tax. Any amounts withheld under the backup withholding rules from a payment to a Non-U.S. Holder can be refunded or credited against the Non-U.S. Holder’s U.S. federal income tax liability, if any, provided that an appropriate claim is timely filed with the IRS.
Additional Tax on Net Investment Income
For taxable years beginning after December 31, 2012, a 3.8% tax is imposed on the net investment income (which includes dividends and gains recognized upon of a disposition of stock) of certain individuals, trusts, and estates with adjusted gross income in excess of certain thresholds. The tax is expressly not imposed on nonresident aliens, and proposed guidance suggests estates and trusts that are Non-U.S. Holders and have no U.S. beneficiaries are exempted from the tax. Therefore, Non-U.S. Holders of our common shares should consult their own tax advisors regarding application of this tax in their particular situations.
194
Table of Contents
Under the terms and subject to the conditions contained in an underwriting agreement dated the date of this prospectus, Morgan Stanley & Co. LLC, Goldman, Sachs & Co. and J.P. Morgan Securities LLC are acting as the representatives and joint book-running managers. Citigroup Global Markets Inc., Deutsche Bank Securities Inc., Merrill Lynch, Pierce, Fenner & Smith Incorporated, Barclays Capital Inc., UBS Securities LLC and Credit Suisse Securities (USA) LLC are also acting as joint book-running managers for the offering. The underwriters have severally agreed to purchase, and we have agreed to sell to them, severally the number of shares indicated below:
| Name |
Number of Shares | |||
| Morgan Stanley & Co. LLC |
||||
| Goldman, Sachs & Co. |
||||
| J.P. Morgan Securities LLC |
||||
| Citigroup Global Markets Inc. |
||||
| Deutsche Bank Securities Inc. |
||||
| Merrill Lynch, Pierce, Fenner & Smith Incorporated |
||||
| Barclays Capital Inc. |
||||
| UBS Securities LLC |
||||
| Credit Suisse Securities (USA) LLC |
||||
|
|
|
|||
| Total |
$ | |||
The underwriters and the representatives are collectively referred to as the “underwriters” and the “representatives,” respectively. The underwriters are offering the shares of common stock subject to their acceptance of the shares from us and subject to prior sale. The underwriting agreement provides that the obligations of the several underwriters to pay for and accept delivery of the shares of common stock offered by this prospectus are subject to the approval of certain legal matters by their counsel and to certain other conditions. The underwriters are obligated to take and pay for all of the shares of common stock offered by this prospectus if any such shares are taken. However, the underwriters are not required to take or pay for the shares covered by the underwriters’ over-allotment option described below. The offering of the shares by the underwriters is subject to receipt and acceptance and subject to the underwriters’ right to reject any order in whole or in part.
The underwriters initially propose to offer part of the shares of common stock directly to the public at the public offering price listed on the cover page of this prospectus and part to certain dealers at a price that represents a concession not in excess of $ a share under the public offering price. After the initial offering of the shares of common stock, the offering price and other selling terms may from time to time be varied by the representatives, including in connection with sales of unsold allotments of common stock or subsequent sales of common stock purchased by the representatives in stabilizing and related transactions.
We granted to the underwriters an option, exercisable for 30 days from the date of this prospectus, to purchase up to additional shares of our common stock at the public offering price listed on the cover page of this prospectus, less underwriting discounts and commissions. To the extent the option is exercised, each underwriter will become obligated, subject to certain conditions, to purchase about the same percentage of the additional shares of common stock as the number listed next to the underwriter’s name in the preceding table bears to the total number of shares of common stock listed next to the names of all underwriters in the preceding table.
195
Table of Contents
The following table shows the per share and total public offering price, underwriting discounts and commissions and proceeds before expenses to us. These amounts are shown assuming both no exercise and full exercise of the underwriters’ option to purchase up to additional shares of our common stock.
|
|
Total | |||||||||||
| Per Share | No Exercise |
Full Exercise |
||||||||||
| Public offering price |
$ | $ | $ | |||||||||
| Underwriting discounts and commissions |
$ | $ | $ | |||||||||
| Proceeds, before expenses, to us |
$ | $ | $ | |||||||||
The estimated offering expenses payable by us, are approximately $ million, which includes legal, accounting and printing costs and various other fees associated with the registration of the common stock to be sold pursuant to this prospectus.
The underwriters have informed us that they do not intend sales to discretionary accounts to exceed 5% of the total number of shares of common stock offered by them.
We have applied to list our common stock on the New York Stock Exchange under the symbol “AVYA.”
We and all of our directors and officers have agreed that, without the prior written consent of Morgan Stanley & Co. LLC, Goldman, Sachs & Co. and J.P. Morgan Securities LLC on behalf of the underwriters, we and they will not, during the period ending 180 days after the date of this prospectus:
| • | offer, pledge, sell, contract to sell, sell any option or contract to purchase, purchase any option or contract to sell, grant any option, right or warrant to purchase, lend or otherwise transfer or dispose of, directly or indirectly, any shares of common stock or any securities convertible into or exercisable or exchangeable for shares of common stock; or |
| • | enter into any swap or other arrangement that transfers to another, in whole or in part, any of the economic consequences of ownership of the common stock. |
| • | in our case, file any registration statement with the SEC relating to the offering of any shares of common stock or any securities convertible into or exercisable or exchangeable for common stock; |
whether any such transaction described in the first two bullet points above is to be settled by delivery of common stock or such other securities, in cash or otherwise. In addition, we and each such person agrees that, without the prior written consent of Morgan Stanley & Co. LLC, Goldman, Sachs & Co. and J.P. Morgan Securities LLC, on behalf of the underwriters, it will not, during the period ending 180 days after the date of this prospectus, make any demand for, or exercise any right with respect to, the registration of any shares of common stock or any security convertible into or exercisable or exchangeable for common stock.
The restrictions described in the immediately preceding paragraph do not apply to:
| • | the sale of shares to the underwriters; |
| • | transactions by persons other than us relating to shares of our common stock or other securities acquired in open market transactions after the completion of the offering of the shares, provided that no filing under Section 16(a) of the Exchange Act shall be required or shall be voluntarily made in connection with subsequent sales of our common stock or other securities acquired in such open market transactions; |
| • | transfers by any person other than us of shares of our common stock or any security convertible into our common stock as a bona fide gift, provided that each donee shall enter into a written agreement accepting the restrictions set forth herein and no filing under Section 16(a) of the Exchange Act, |
196
Table of Contents
| reporting a reduction in beneficial ownership of shares of our common stock, shall be required or shall be voluntarily made during the restricted period; |
| • | distributions by any persons other than us of shares of common stock or any security convertible into our common stock to partners, members, stockholders, affiliates or any entity which is directly or indirectly controlled by, or is under common control with, such person, provided that each distributee shall enter into a written agreement accepting the restrictions set forth herein and no filing under Section 16(a) of the Exchange Act, reporting a reduction in beneficial ownership of shares of our common stock, shall be required or shall be voluntarily made during the restricted period; or |
| • | the establishment of a trading plan pursuant to Rule 10b5-1 under the Exchange Act for the transfer of shares of our common stock, provided that such plan does not provide for the transfer of our common stock during the restricted period and no public announcement or filing under the Exchange Act regarding the establishment of such plan shall be required of or voluntarily made by or on behalf of such person or us. |
The 180-day restricted period described in the preceding paragraphs will be extended if:
| • | during the last 17 days of the 180-day restricted period, we issue an earnings release or material news or a material event relating to us occurs; or |
| • | prior to the expiration of the 180-day restricted period, we announce that we will release earnings results during the 16-day period beginning on the last day of the 180-day period; |
in which case the restrictions described in the preceding paragraphs will continue to apply until the expiration of the 18-day period beginning on the issuance of the earnings release or the occurrence of the material news or material event.
In order to facilitate this offering of the common stock, the underwriters may engage in transactions that stabilize, maintain or otherwise affect the price of the common stock. Specifically, the underwriters may sell more shares than they are obligated to purchase under the underwriting agreement, creating a short position. A short sale is covered if the short position is no greater than the number of shares available for purchase by the underwriters under the over-allotment option. The underwriters can close out a covered short sale by exercising the over-allotment option or purchasing shares in the open market. In determining the source of shares to close out a covered short sale, the underwriters will consider, among other things, the open market price of shares compared to the price available under the over-allotment option. The underwriters may also sell shares in excess of the over-allotment option, creating a naked short position. The underwriters must close out any naked short position by purchasing shares in the open market. A naked short position is more likely to be created if the underwriters are concerned that there may be downward pressure on the price of the common stock in the open market after pricing that could adversely affect investors who purchase in this offering. In addition, to stabilize the price of common stock, the underwriters may bid for, and purchase, shares of common stock in the open market. Finally, the underwriting syndicate may reclaim selling concessions allowed to an underwriter or a dealer for distributing the common stock in this offering, if the syndicate repurchases previously distributed common stock to cover syndicate short positions or to stabilize the price of the common stock. These activities may raise or maintain the market price of the common stock above independent market levels or prevent or retard a decline in the market price of the common stock. The underwriters are not required to engage in these activities and may end any of these activities at any time.
The underwriters may also impose a penalty bid. This occurs when a particular underwriter repays to the underwriters a portion of the underwriting discount received by it because the representatives have repurchased shares sold by or for the account of such underwriter in stabilizing or short covering transactions.
The underwriters and their respective affiliates are full-service financial institutions engaged in various activities, which may include securities trading, commercial and investment banking, financial advisory, investment management, investment research, principal investment, hedging, financing and brokerage activities.
197
Table of Contents
From time to time, certain of the underwriters and/or their respective affiliates may provide investment banking services to us. In addition, affiliates of certain of the underwriters are our customers and the contracts governing such relationships were entered into at arm’s length and on customary terms. In the ordinary course of their various business activities, the underwriters and their respective affiliates may make or hold a broad array of investments and actively trade debt and equity securities (or related derivative securities) and financial instruments (including bank loans) for their own account and for the accounts of their customers, and such investment and securities activities may involve securities and/or instruments of Avaya, including the existing senior unsecured notes. The underwriters and their respective affiliates may also make investment recommendations and/or publish or express independent research views in respect of such securities or instruments and may at any time hold, or recommend to clients that they acquire, long and/or short positions in such securities and instruments. The underwriters and their affiliates have in the past engaged, currently engage and may in the future engage, in transactions with and perform services for, including commercial banking, financial advisory and investment banking services, us and our affiliates in the ordinary course of business for which they have received or will receive customary fees and expenses. We also have, and expect to continue to have, economic hedges, cash management relationships and/or other swaps and hedges in place with certain of the underwriters or their affiliates on customary economic terms. An affiliate of J.P. Morgan Securities LLC owns shares representing less than 5% of our outstanding stock. Affiliates of certain of the underwriters are lenders and/or agents under our existing credit facilities.
We and the several underwriters have agreed to indemnify each other against certain liabilities, including liabilities under the Securities Act.
A prospectus in electronic format may be made available on websites maintained by one or more underwriters, or selling group members, if any, participating in this offering. The representatives may agree to allocate a number of shares of common stock to underwriters for sale to their online brokerage account holders. Internet distributions will be allocated by the representatives to underwriters that may make Internet distributions on the same basis as other allocations.
Selling Restrictions
European Economic Area
In relation to each Member State of the European Economic Area which has implemented the Prospectus Directive (each referred to as a Relevant Member State), each underwriter has represented and agreed that with effect from and including the date on which the Prospectus Directive is implemented in that Relevant Member State, or the Relevant Implementation Date, it has not made and will not make an offer of shares which are the subject of the offering contemplated by this prospectus to the public in that Relevant Member State other than:
(a) to any legal entity which is a qualified investor as defined in the Prospectus Directive.
(b) to fewer than 100 or, if the Relevant Member State has implemented the relevant provision of the 2010 PD Amending Directive, 150, natural or legal persons (other than qualified investors as defined in the Prospectus Directive), as permitted under the Prospectus Directive subject to obtaining the prior consent of the relevant Dealer or Dealers nominated by the Issuer for any such offer; or
(c) in any other circumstances falling within Article 3(2) of the Prospectus Directive,
provided that no such offer of shares shall require the Issuer or any underwriter to publish a prospectus pursuant to Article 3 of the Prospectus Directive.
For the purposes of this provision, the expression an “offer of shares to the public” in relation to any shares in any Relevant Member State means the communication in any form and by any means of sufficient information on the terms of the offer and the shares to be offered so as to enable an investor to decide to purchase or
198
Table of Contents
subscribe the shares, as the same may be varied in that Member State by any measure implementing the Prospectus Directive in that Member State, the expression “Prospectus Directive” means Directive 2003/71/EC (and amendments thereto, including the 2010 PD Amending Directive, to the extent implemented in the Relevant Member State), and includes any relevant implementing measure in the Relevant Member State and the expression “2010 PD Amending Directive” means Directive 2010/73/EU.
United Kingdom
Each underwriter has represented and agreed that:
(a) (i) it is a person whose ordinary activities involve it in acquiring, holding, managing or disposing of investments (as principal or agent) for the purposes of its business and (ii) it has not offered or sold and will not offer or sell the shares other than to persons whose ordinary activities involve them in acquiring, holding, managing or disposing of investments (as principal or as agent) for the purposes of their businesses or who it is reasonable to expect will acquire, hold, manage or dispose of investments (as principal or agent) for the purposes of their businesses where the issue of the shares would otherwise constitute a contravention of Section 19 of the FSMA by the Issuer;
(b) it has only communicated or caused to be communicated and will only communicate or cause to be communicated an invitation or inducement to engage in investment activity (within the meaning of Section 21 of the FSMA) received by it in connection with the issue or sale of the shares in circumstances in which Section 21(1) of the FSMA does not apply to the Issuer or the Guarantors; and
(c) it has complied and will comply with all applicable provisions of the FSMA with respect to anything done by it in relation to the shares in, from or otherwise involving the United Kingdom.
France
Neither this prospectus nor any other offering material relating to the shares described in this prospectus has been submitted to the clearance procedures of the Autorité des Marchés Financiers or of the competent authority of another member state of the European Economic Area and notified to the Autorité des Marchés Financiers. The shares have not been offered or sold and will not be offered or sold, directly or indirectly, to the public in France. Neither this prospectus nor any other offering material relating to the shares has been or will be:
| • | released, issued, distributed or caused to be released, issued or distributed to the public in France; or |
| • | used in connection with any offer for subscription or sale of the shares to the public in France. |
Such offers, sales and distributions will be made in France only:
| • | to qualified investors (investisseurs qualifiés) and/or to a restricted circle of investors (cercle restreint d’investisseurs), in each case investing for their own account, all as defined in, and in accordance with articles L.411-2, D.411-1, D.411-2, D.734-1, D.744-1, D.754-1 and D.764-1 of the French Code monétaire et financier; |
| • | to investment services providers authorized to engage in portfolio management on behalf of third parties; or |
| • | in a transaction that, in accordance with article L.411-2-II-1°-or-2°-or 3° of the French Code monétaire et financier and article 211-2 of the General Regulations (Règlement Général) of the Autorité des Marchés Financiers, does not constitute a public offer (appel public à l’épargne). |
The shares may be resold directly or indirectly, only in compliance with articles L.411-1, L.411-2, L.412-1 and L.621-8 through L.621-8-3 of the French Code monétaire et financier.
199
Table of Contents
Hong Kong
The shares may not be offered or sold by means of any document other than (i) in circumstances which do not constitute an offer to the public within the meaning of the Companies Ordinance (Cap.32, Laws of Hong Kong), or (ii) to “professional investors” within the meaning of the Securities and Futures Ordinance (Cap.571, Laws of Hong Kong) and any rules made thereunder, or (iii) in other circumstances which do not result in the document being a “prospectus” within the meaning of the Companies Ordinance (Cap.32, Laws of Hong Kong), and no advertisement, invitation or document relating to the shares may be issued or may be in the possession of any person for the purpose of issue (in each case whether in Hong Kong or elsewhere), which is directed at, or the contents of which are likely to be accessed or read by, the public in Hong Kong (except if permitted to do so under the laws of Hong Kong) other than with respect to shares which are or are intended to be disposed of only to persons outside Hong Kong or only to “professional investors” within the meaning of the Securities and Futures Ordinance (Cap. 571, Laws of Hong Kong) and any rules made thereunder.
Singapore
This prospectus has not been registered as a prospectus with the Monetary Authority of Singapore. Accordingly, this prospectus and any other document or material in connection with the offer or sale, or invitation for subscription or purchase, of the shares may not be circulated or distributed, nor may the shares be offered or sold, or be made the subject of an invitation for subscription or purchase, whether directly or indirectly, to persons in Singapore other than (i) to an institutional investor under Section 274 of the Securities and Futures Act, Chapter 289 of Singapore (the “SFA”), (ii) to a relevant person, or any person pursuant to Section 275(1A), and in accordance with the conditions, specified in Section 275 of the SFA or (iii) otherwise pursuant to, and in accordance with the conditions of, any other applicable provision of the SFA.
Where the shares are subscribed or purchased under Section 275 by a relevant person which is: (a) a corporation (which is not an accredited investor) the sole business of which is to hold investments and the entire share capital of which is owned by one or more individuals, each of whom is an accredited investor; or (b) a trust (where the trustee is not an accredited investor) whose sole purpose is to hold investments and each beneficiary is an accredited investor, shares, debentures and units of shares and debentures of that corporation or the beneficiaries’ rights and interest in that trust shall not be transferable for 6 months after that corporation or that trust has acquired the shares under Section 275 except: (1) to an institutional investor under Section 274 of the SFA or to a relevant person, or any person pursuant to Section 275(1A), and in accordance with the conditions, specified in Section 275 of the SFA; (2) where no consideration is given for the transfer; or (3) by operation of law.
Japan
The shares offered in this prospectus have not been registered under the Financial Instruments and Exchange Law of Japan. The shares have not been offered or sold and will not be offered or sold, directly or indirectly, in Japan or to or for the account of any resident of Japan, (which term as used herein means any person resident in Japan, including any corporation or other entity organized under the laws of Japan) or to others for re-offering or resale, directly or indirectly, in Japan or to a resident of Japan, except (i) pursuant to an exemption from the registration requirements of the Securities and Exchange Law and (ii) in compliance with any other applicable requirements of the Financial Instruments and Exchange Law and any other applicable laws, regulations and ministerial guidelines of Japan.
Switzerland
This document as well as any other material relating to the shares which are the subject of the offering contemplated by this Prospectus, or the Shares, do not constitute an issue prospectus pursuant to Article 652a of the Swiss Code of Obligations. The Shares will not be listed on the SWX Swiss Exchange and, therefore, the
200
Table of Contents
documents relating to the Shares, including, but not limited to, this document, do not claim to comply with the disclosure standards of the listing rules of SWX Swiss Exchange and corresponding prospectus schemes annexed to the listing rules of the SWX Swiss Exchange.
The Shares are being offered in Switzerland by way of a private placement, i.e. to a small number of selected investors only, without any public offer and only to investors who do not purchase the Shares with the intention to distribute them to the public. The investors will be individually approached by the Company from time to time.
This document as well as any other material relating to the Shares is personal and confidential and do not constitute an offer to any other person. This document may only be used by those investors to whom it has been handed out in connection with the offering described herein and may neither directly nor indirectly be distributed or made available to other persons without express consent of the Company. It may not be used in connection with any other offer and shall in particular not be copied and/or distributed to the public in (or from) Switzerland.
Dubai International Financial Centre
This document relates to an exempt offer in accordance with the Offered Securities Rules of the Dubai Financial Services Authority. This document is intended for distribution only to persons of a type specified in those rules. It must not be delivered to, or relied on by, any other person. The Dubai Financial Services Authority has no responsibility for reviewing or verifying any documents in connection with exempt offers. The Dubai Financial Services Authority has not approved this document nor taken steps to verify the information set out in it, and has no responsibility for it. The shares which are the subject of the offering contemplated by this Prospectus, or the Shares, may be illiquid and/or subject to restrictions on their resale.
Prospective purchasers of the Shares offered should conduct their own due diligence on the Shares. If you do not understand the contents of this document you should consult an authorised financial adviser.
201
Table of Contents
Ropes & Gray LLP, Boston, Massachusetts, will pass for us on the validity of the shares of common stock offered by this prospectus. The underwriters are being represented by Cahill Gordon & Reindel LLP, New York, New York. Ropes & Gray LLP and some partners of Ropes & Gray LLP are limited partners of RGIP, LP, which is an investor in certain investment funds associated with Silver Lake and TPG and often a co-investor with such funds. RGIP, LP directly or indirectly owns shares of our common stock representing less than 1% of the outstanding shares of each of our common stock, Series A Preferred Stock, Series B Convertible Preferred Stock and Warrants.
The consolidated financial statements of Avaya Holdings Corp. as of September 30, 2014 and 2013, and for each of the three years in the period ended September 30, 2014 included in this Prospectus have been so included in reliance on the report of PricewaterhouseCoopers LLP, an independent registered public accounting firm, given on the authority of said firm as experts in auditing and accounting.
WHERE YOU CAN FIND ADDITIONAL INFORMATION
We have filed with the SEC a registration statement on Form S-1 under the Securities Act that registers the shares of our common stock to be sold in this offering. This prospectus does not contain all of the information set forth in the registration statement and the exhibits and schedules filed as part of the registration statement. For further information with respect to us and our common stock, we refer you to the registration statement and the exhibits and schedules filed as a part of the registration statement. Statements contained in this prospectus concerning the contents of any contract or any other document are not necessarily complete. If a contract or document has been filed as an exhibit to the registration statement, we refer you to the copy of the contract or document that has been filed. Each statement in this prospectus relating to a contract or document filed as an exhibit is qualified in all respects by the filed exhibit.
The reports and other information we file with the SEC can be read and copied at the SEC’s Public Reference Room at 100 F Street, N.E., Washington D.C. 20549. You may obtain information regarding the operation of the public reference room by calling 1-800-SEC-0330. The SEC also maintains a website (http://www.sec.gov) that contains reports, proxy and information statements and other information that we file electronically with the SEC. Our website address is www.avaya.com. Our subsidiary, Avaya Inc., currently is a voluntary filer and makes available free of charge, through our website, its annual report on Form 10-K, quarterly reports on Form 10-Q, current reports on Form 8-K and all amendments to those reports, as soon as reasonably practicable after such material is electronically filed with or furnished to the SEC. Please note that our website address is provided as an inactive textual reference only. The information contained on, or accessible through, our website is not part of this prospectus, and is therefore not incorporated by reference.
202
Table of Contents
AVAYA HOLDINGS CORP.
Index to Consolidated Financial Statements
| Page | ||||
| F-2 | ||||
| For the fiscal years ended September 30, 2014, 2013 and 2012 |
||||
| F-3 | ||||
| F-4 | ||||
| F-5 | ||||
| Consolidated Statements of Changes in Stockholders’ Deficiency |
F-6 | |||
| F-7 | ||||
| F-8 | ||||
F-1
Table of Contents
Report of Independent Registered Public Accounting Firm
To the Board of Directors and Stockholders of Avaya Holdings Corp.:
In our opinion, the accompanying consolidated balance sheets and the related consolidated statements of operations, of comprehensive loss, of changes in stockholders’ deficiency and of cash flows present fairly, in all material respects, the financial position of Avaya Holdings Corp. and its subsidiaries (the “Company”) at September 30, 2014 and 2013, and the results of their operations and their cash flows for each of the three years in the period ended September 30, 2014 in conformity with accounting principles generally accepted in the United States of America. These financial statements are the responsibility of the Company’s management. Our responsibility is to express an opinion on these financial statements based on our audits. We conducted our audits of these statements in accordance with the standards of the Public Company Accounting Oversight Board (United States). Those standards require that we plan and perform the audit to obtain reasonable assurance about whether the financial statements are free of material misstatement. An audit includes examining, on a test basis, evidence supporting the amounts and disclosures in the financial statements, assessing the accounting principles used and significant estimates made by management, and evaluating the overall financial statement presentation. We believe that our audits provide a reasonable basis for our opinion.
As discussed in Note 2 to the Consolidated Financial Statements, the Company changed the timing of their annual impairment testing date for goodwill and indefinite-lived intangibles during the period ended September 30, 2014.
/s/ PricewaterhouseCoopers LLP
Florham Park, New Jersey
December 5, 2014
F-2
Table of Contents
Avaya Holdings Corp.
Consolidated Statements of Operations
(In millions, except per share amounts)
| Fiscal years ended September 30, |
||||||||||||
| 2014 | 2013 | 2012 | ||||||||||
| REVENUE |
||||||||||||
| Products |
$ | 2,196 | $ | 2,337 | $ | 2,672 | ||||||
| Services |
2,175 | 2,241 | 2,347 | |||||||||
|
|
|
|
|
|
|
|||||||
| 4,371 | 4,578 | 5,019 | ||||||||||
|
|
|
|
|
|
|
|||||||
| COSTS |
||||||||||||
| Products: |
||||||||||||
| Costs (exclusive of amortization of acquired technology intangible assets) |
854 | 963 | 1,145 | |||||||||
| Amortization of acquired technology intangible assets |
56 | |
63 |
|
|
192 |
| |||||
| Services |
962 | 1,022 | 1,134 | |||||||||
|
|
|
|
|
|
|
|||||||
| 1,872 | 2,048 | 2,471 | ||||||||||
|
|
|
|
|
|
|
|||||||
| GROSS PROFIT |
2,499 | 2,530 | 2,548 | |||||||||
|
|
|
|
|
|
|
|||||||
| OPERATING EXPENSES |
||||||||||||
| Selling, general and administrative |
1,531 | 1,512 | 1,617 | |||||||||
| Research and development |
379 | 445 | 464 | |||||||||
| Amortization of acquired intangible assets |
227 | 228 | 227 | |||||||||
| Restructuring and impairment charges, net |
165 | |
200 |
|
|
147 |
| |||||
| Acquisition-related costs . |
— | 1 | 4 | |||||||||
|
|
|
|
|
|
|
|||||||
| 2,302 | 2,386 | 2,459 | ||||||||||
|
|
|
|
|
|
|
|||||||
| OPERATING INCOME |
197 | 144 | 89 | |||||||||
| Interest expense |
(459 | ) | (467 | ) | (432 | ) | ||||||
| Loss on extinguishment of debt |
(5 | ) | (6 | ) | — | |||||||
| Other income (expense), net |
3 | (25 | ) | (29 | ) | |||||||
|
|
|
|
|
|
|
|||||||
| LOSS FROM CONTINUING OPERATIONS BEFORE INCOME TAXES |
(264 | ) | (354 | ) | (372 | ) | ||||||
| (Provision for) benefit from income taxes of continuing operations |
(51 | ) | 35 | 4 | ||||||||
|
|
|
|
|
|
|
|||||||
| LOSS FROM CONTINUING OPERATIONS |
(315 | ) | (319 | ) | (368 | ) | ||||||
| INCOME (LOSS) FROM DISCONTINUED OPERATIONS, NET OF INCOME TAXES |
62 | (57 | ) | 14 | ||||||||
|
|
|
|
|
|
|
|||||||
| NET LOSS . . |
(253 | ) | |
(376 |
) |
|
(354 |
) | ||||
| Less: Accretion and accrued dividends on Series A and Series B preferred stock |
(45 | ) | (43 | ) | (71 | ) | ||||||
|
|
|
|
|
|
|
|||||||
| NET LOSS ATTRIBUTABLE TO COMMON STOCKHOLDERS |
$ | (298 | ) | $ | (419 | ) | $ | (425 | ) | |||
|
|
|
|
|
|
|
|||||||
| Basic and diluted earnings per share attributable to common stockholders: |
||||||||||||
| Loss from continuing operations per share – basic and diluted |
$ | (0.73 | ) | $ | (0.74 | ) | $ | (0.90 | ) | |||
| Income (loss) from discontinued operations per share – basic and diluted |
0.13 | (0.12 | ) | 0.03 | ||||||||
|
|
|
|
|
|
|
|||||||
| Net loss per share – basic and diluted |
$ | (0.60 | ) | $ | (0.86 | ) | $ | (0.87 | ) | |||
|
|
|
|
|
|
|
|||||||
| Weighted average shares outstanding – basic and diluted |
495.4 | 489.8 | 489.6 | |||||||||
|
|
|
|
|
|
|
|||||||
The accompanying Notes to Consolidated Financial Statements are an integral part of these statements.
F-3
Table of Contents
Avaya Holdings Corp.
Consolidated Statements of Comprehensive Loss
(In millions)
| Years ended September 30, | ||||||||||||
| 2014 | 2013 | 2012 | ||||||||||
| Net loss |
$ | (253 | ) | $ | (376 | ) | $ | (354 | ) | |||
| Other comprehensive (loss) income: |
||||||||||||
| Pension, postretirement and postemployment benefit-related items, net of tax effect of $0, $121 and $54 for the years ended September 30, 2014, 2013 and 2012, respectively |
(201 | ) | 160 | 2 | ||||||||
| Cumulative translation adjustment, net of tax benefit of $0, $4, and $0, for the years ended September 30, 2014, 2013 and 2012, respectively |
7 | (43 | ) | 37 | ||||||||
| Change in interest rate swaps, net of tax effect of $(7) and $7 for the years ended September 30, 2013 and 2012, respectively |
— | 20 | 11 | |||||||||
| Income tax benefit reclassified into earnings upon the expiration of certain interest rate swaps |
— | (17 | ) | — | ||||||||
| Unrealized loss on investments reclassified into earnings, net of tax of $1 for the year ended September 30, 2012 |
— | — | 1 | |||||||||
| Unrealized loss on investments, net of tax effect of $0 for the year ended September 30, 2012 |
— | — | 1 | |||||||||
|
|
|
|
|
|
|
|||||||
| Other comprehensive (loss) income |
(194 | ) | 120 | 52 | ||||||||
|
|
|
|
|
|
|
|||||||
| Comprehensive loss |
$ | (447 | ) | $ | (256 | ) | $ | (302 | ) | |||
|
|
|
|
|
|
|
|||||||
The accompanying Notes to Consolidated Financial Statements are an integral part of these statements.
F-4
Table of Contents
Avaya Holdings Corp.
(In millions, except share amounts)
| September 30, | ||||||||
| 2014 | 2013 | |||||||
| ASSETS |
||||||||
| Current assets: |
||||||||
| Cash and cash equivalents |
$ | 322 | $ | 289 | ||||
| Accounts receivable, net |
745 | 702 | ||||||
| Inventory |
197 | 245 | ||||||
| Deferred income taxes, net |
24 | 54 | ||||||
| Other current assets |
219 | 235 | ||||||
| Assets of discontinued operations |
— | 59 | ||||||
|
|
|
|
|
|||||
| TOTAL CURRENT ASSETS |
1,507 | 1,584 | ||||||
|
|
|
|
|
|||||
| Property, plant and equipment, net |
281 | 334 | ||||||
| Deferred income taxes, net |
52 | 32 | ||||||
| Intangible assets, net |
1,224 | 1,497 | ||||||
| Goodwill |
4,047 | 4,048 | ||||||
| Other assets |
123 | 154 | ||||||
|
|
|
|
|
|||||
| TOTAL ASSETS |
$ | 7,234 | $ | 7,649 | ||||
|
|
|
|
|
|||||
| LIABILITIES |
||||||||
| Current liabilities: |
||||||||
| Debt maturing within one year |
$ | 32 | $ | 35 | ||||
| Accounts payable |
416 | 401 | ||||||
| Payroll and benefit obligations |
228 | 251 | ||||||
| Deferred revenue |
668 | 671 | ||||||
| Business restructuring reserve, current portion |
86 | 92 | ||||||
| Other current liabilities |
303 | 283 | ||||||
| Liabilities of discontinued operations |
— | 19 | ||||||
|
|
|
|
|
|||||
| TOTAL CURRENT LIABILITIES |
1,733 | 1,752 | ||||||
|
|
|
|
|
|||||
| Long-term debt |
5,991 | 6,051 | ||||||
| Pension obligations |
1,535 | 1,510 | ||||||
| Other postretirement obligations |
273 | 290 | ||||||
| Deferred income taxes, net |
249 | 237 | ||||||
| Business restructuring reserve, non-current portion |
119 | 78 | ||||||
| Other liabilities . |
475 | 450 | ||||||
|
|
|
|
|
|||||
| TOTAL NON-CURRENT LIABILITIES |
8,642 | 8,616 | ||||||
|
|
|
|
|
|||||
| Commitments and contingencies |
||||||||
| Equity awards on redeemable shares |
21 | 5 | ||||||
| Preferred stock, par value $.001 per share, authorized 250,000 shares at September 30, 2014 and 2013 |
||||||||
| Convertible Series B, 48,921 shares issued and outstanding at September 30, 2014 and 2013 |
300 | 263 | ||||||
| Series A, 125,000 shares issued and outstanding at September 30, 2014 and 2013 |
159 | 151 | ||||||
| STOCKHOLDERS’ DEFICIENCY |
||||||||
| Common stock, par value $.001 per share; 750,000,000 and 750,000,000 shares authorized; 489,459,943 and 488,929,315 shares issued and outstanding at September 30, 2014 and 2013, respectively |
— | — | ||||||
| Additional paid-in capital |
2,453 | 2,489 | ||||||
| Accumulated deficit |
(4,874 | ) | (4,621 | ) | ||||
| Accumulated other comprehensive loss |
(1,200 | ) | (1,006 | ) | ||||
|
|
|
|
|
|||||
| TOTAL STOCKHOLDERS’ DEFICIENCY |
(3,621 | ) | (3,138 | ) | ||||
|
|
|
|
|
|||||
| TOTAL LIABILITIES AND STOCKHOLDERS’ DEFICIENCY |
$ | 7,234 | $ | 7,649 | ||||
|
|
|
|
|
|||||
The accompanying Notes to Consolidated Financial Statements are an integral part of these statements.
F-5
Table of Contents
Avaya Holdings Corp.
Consolidated Statements of Changes in Stockholders’ Deficiency
(In millions)
| Number of Shares |
Common Stock |
Additional Paid-In Capital |
Accumulated Deficit |
Accumulated Other Comprehensive Loss |
Total Stockholders’ Deficiency |
|||||||||||||||||||
| Balance as of October 1, 2011 |
487.4 | $ | — | $ | 2,569 | $ | (3,891 | ) | $ | (1,178 | ) | $ | (2,500 | ) | ||||||||||
| Issuance of common stock, net of shares redeemed |
0.2 | |||||||||||||||||||||||
| Share-based compensation |
7 | 7 | ||||||||||||||||||||||
| Accrued dividends on Series A preferred stock |
(7 | ) | (7 | ) | ||||||||||||||||||||
| Issuance of warrants on Series B preferred stock |
23 | 23 | ||||||||||||||||||||||
| Accrued dividends on Series B preferred stock |
(5 | ) | (5 | ) | ||||||||||||||||||||
| Accretion on Series B preferred stock |
(59 | ) | (59 | ) | ||||||||||||||||||||
| Net loss |
(354 | ) | (354 | ) | ||||||||||||||||||||
| Other comprehensive income |
52 | 52 | ||||||||||||||||||||||
|
|
|
|
|
|
|
|
|
|
|
|
|
|||||||||||||
| Balance as of September 30, 2012 |
487.6 | — | 2,528 | (4,245 | ) | (1,126 | ) | (2,843 | ) | |||||||||||||||
| Issuance of common stock, net of shares redeemed |
1.3 | (2 | ) | (2 | ) | |||||||||||||||||||
| Share-based compensation |
11 | 11 | ||||||||||||||||||||||
| Accrued dividends on Series A preferred stock |
(7 | ) | (7 | ) | ||||||||||||||||||||
| Accrued dividends on Series B preferred stock |
(16 | ) | (16 | ) | ||||||||||||||||||||
| Accretion on Series B preferred stock |
(20 | ) | (20 | ) | ||||||||||||||||||||
| Reclassifications to equity awards on redeemable shares |
(5 | ) | (5 | ) | ||||||||||||||||||||
| Net loss |
(376 | ) | (376 | ) | ||||||||||||||||||||
| Other comprehensive income |
120 | 120 | ||||||||||||||||||||||
|
|
|
|
|
|
|
|
|
|
|
|
|
|||||||||||||
| Balance as of September 30, 2013 |
488.9 | — | 2,489 | (4,621 | ) | (1,006 | ) | (3,138 | ) | |||||||||||||||
| Issuance of common stock, net of shares redeemed and cancelled, under employee stock option plan |
0.6 | — | — | |||||||||||||||||||||
| Share-based compensation |
25 | 25 | ||||||||||||||||||||||
| Accrued dividends on Series A preferred stock |
(8 | ) | (8 | ) | ||||||||||||||||||||
| Accrued dividends on Series B preferred stock |
(17 | ) | (17 | ) | ||||||||||||||||||||
| Accretion on Series B preferred stock |
(20 | ) | (20 | ) | ||||||||||||||||||||
| Reclassifications to equity awards on redeemable shares |
(16 | ) | (16 | ) | ||||||||||||||||||||
| Net loss |
(253 | ) | (253 | ) | ||||||||||||||||||||
| Other comprehensive income |
(194 | ) | (194 | ) | ||||||||||||||||||||
|
|
|
|
|
|
|
|
|
|
|
|
|
|||||||||||||
| Balance as of September 30, 2014 |
489.5 | $ | — | $ | 2,453 | $ | (4,874 | ) | $ | (1,200 | ) | $ | (3,621 | ) | ||||||||||
|
|
|
|
|
|
|
|
|
|
|
|
|
|||||||||||||
The accompanying Notes to Consolidated Financial Statements are an integral part of these statements.
F-6
Table of Contents
Avaya Holdings Corp.
Consolidated Statements of Cash Flows
(In millions)
| Fiscal years ended September 30, |
||||||||||||
| 2014 | 2013 | 2012 | ||||||||||
| OPERATING ACTIVITIES: |
||||||||||||
| Net loss |
$ | (253 | ) | $ | (376 | ) | $ | (354 | ) | |||
| Income (loss) from discontinued operations, net of income taxes |
62 | (57 | ) | 14 | ||||||||
|
|
|
|
|
|
|
|||||||
| Loss from continuing operations |
(315 | ) | (319 | ) | (368 | ) | ||||||
| Adjustments to reconcile loss from continuing operations to net cash provided by (used for) operating activities: |
||||||||||||
| Depreciation and amortization |
434 | 455 | 565 | |||||||||
| Share-based compensation |
25 | 11 | 8 | |||||||||
| Amortization of debt issuance costs |
14 | 17 | 21 | |||||||||
| Accretion of debt discount |
5 | 4 | 1 | |||||||||
| Non-cash charge for debt issuance costs upon redemption of term loans |
3 | 5 | — | |||||||||
| Third-party fees expensed in connection with the debt modification |
2 | 18 | — | |||||||||
| Payment of paid-in-kind interest |
(9 | ) | — | — | ||||||||
| Change in fair value of Preferred Series B embedded derivative |
22 | 11 | 6 | |||||||||
| Premium on issuance of senior secured term B-5 loans |
— | 3 | — | |||||||||
| Provision for uncollectible receivables |
— | 1 | 5 | |||||||||
| Deferred income taxes, net |
22 | (101 | ) | (49 | ) | |||||||
| (Gain) loss on sale of investments and long-lived assets, net |
— | (1 | ) | 3 | ||||||||
| Write-down of assets held for sale to net realizable value |
— | — | 5 | |||||||||
| Gain on sale of TBU business |
(14 | ) | — | — | ||||||||
| Impairment of long-lived assets |
— | 1 | 6 | |||||||||
| Pension curtailments |
— | (9 | ) | 5 | ||||||||
| Unrealized (gain) loss on foreign currency exchange |
(15 | ) | (23 | ) | 29 | |||||||
| Changes in operating assets and liabilities: |
||||||||||||
| Accounts receivable |
(51 | ) | 72 | (9 | ) | |||||||
| Inventory |
46 | 9 | 27 | |||||||||
| Accounts payable |
19 | (29 | ) | (23 | ) | |||||||
| Payroll and benefit obligations |
(177 | ) | (60 | ) | (108 | ) | ||||||
| Business restructuring reserve |
42 | 38 | (43 | ) | ||||||||
| Deferred revenue |
24 | 80 | (45 | ) | ||||||||
| Other assets and liabilities . |
(42 | ) | (52 | ) | (20 | ) | ||||||
|
|
|
|
|
|
|
|||||||
| NET CASH PROVIDED BY CONTINUING OPERATING ACTIVITIES |
35 | 131 | 16 | |||||||||
| NET CASH PROVIDED BY DISCONTINUED OPERATING ACTIVITIES |
4 | 20 | 28 | |||||||||
|
|
|
|
|
|
|
|||||||
| NET CASH PROVIDED BY OPERATING ACTIVITIES |
39 | 151 | 44 | |||||||||
|
|
|
|
|
|
|
|||||||
| INVESTING ACTIVITIES: |
||||||||||||
| Capital expenditures |
(134 | ) | (110 | ) | (92 | ) | ||||||
| Capitalized software development costs |
(1 | ) | (14 | ) | (35 | ) | ||||||
| Acquisition of businesses, net of cash acquired |
(16 | ) | (12 | ) | (234 | ) | ||||||
| Proceeds from sale of long-lived assets |
101 | 23 | 3 | |||||||||
| Proceeds from sale of TBU business |
26 | — | — | |||||||||
| Proceeds from sale of investments |
1 | 1 | 74 | |||||||||
| Purchase of investment |
(10 | ) | — | — | ||||||||
| Restricted cash |
— | — | 1 | |||||||||
| Other investing activities net |
— | (1 | ) | — | ||||||||
|
|
|
|
|
|
|
|||||||
| NET CASH USED FOR CONTINUING INVESTING ACTIVITIES |
(33 | ) | (113 | ) | (283 | ) | ||||||
|
|
|
|
|
|
|
|||||||
| NET CASH PROVIDED BY DISCONTINUED INVESTING ACTIVITIES |
101 | — | — | |||||||||
|
|
|
|
|
|
|
|||||||
| NET CASH PROVIDED BY (USED FOR) INVESTING ACTIVITIES |
68 | (113 | ) | (283 | ) | |||||||
|
|
|
|
|
|
|
|||||||
| FINANCING ACTIVITIES: |
||||||||||||
| Proceeds from issuance of preferred stock and warrants |
— | — | 196 | |||||||||
| Proceeds from term B-6 loans |
1,136 | — | — | |||||||||
| Proceeds from 9% secured notes . |
— | 290 | — | |||||||||
| Repayment of term B-5 loans |
(1,138 | ) | (284 | ) | — | |||||||
| Proceeds from term B-5 loans |
— | 589 | — | |||||||||
| Repayment of term B-1 loans |
— | (584 | ) | — | ||||||||
| Proceeds from multi-currency asset-based revolving credit facility |
40 | — | — | |||||||||
| Proceeds from multi-currency revolver |
100 | — | — | |||||||||
| Repayment of senior unsecured cash pay notes |
(58 | ) | — | — | ||||||||
| Repayment of senior unsecured PIK toggle notes |
(83 | ) | — | — | ||||||||
| Repayment of multi-currency revolver |
(10 | ) | — | — | ||||||||
| Debt issuance costs and third-party debt modification costs |
(10 | ) | (49 | ) | — | |||||||
| Repayment of long-term debt |
(38 | ) | (38 | ) | (37 | ) | ||||||
| Borrowings under revolving credit facility |
— | — | 60 | |||||||||
| Repayments of borrowings under revolving credit facility |
— | — | (60 | ) | ||||||||
| Other financing activities, net |
1 | (3 | ) | (4 | ) | |||||||
|
|
|
|
|
|
|
|||||||
| NET CASH (USED FOR) PROVIDED BY FINANCING ACTIVITIES |
(60 | ) | (79 | ) | 155 | |||||||
|
|
|
|
|
|
|
|||||||
| Effect of exchange rate changes on cash and cash equivalents |
(14 | ) | (8 | ) | 7 | |||||||
|
|
|
|
|
|
|
|||||||
| NET INCREASE (DECREASE) IN CASH AND CASH EQUIVALENTS |
33 | (49 | ) | (77 | ) | |||||||
| Cash and cash equivalents at beginning of year |
289 | 338 | 415 | |||||||||
|
|
|
|
|
|
|
|||||||
| Cash and cash equivalents at end of year |
$ | 322 | $ | 289 | $ | 338 | ||||||
|
|
|
|
|
|
|
|||||||
The accompanying Notes to Consolidated Financial Statements are an integral part of these statements.
F-7
Table of Contents
Avaya Holdings Corp.
Notes to Consolidated Financial Statements
1. Description of Business
Background
Avaya Holdings Corp. (formerly Sierra Holdings Corp.) together with its consolidated subsidiaries (collectively, the “Company” or “Avaya”) is a leading provider of contact center, unified communications and networking products and services. The Company’s products and services portfolio spans software, hardware, networking technology and professional services. Avaya conducts its business operations in three segments. Two of those segments, Global Communications Solutions and Avaya Networking, make up Avaya’s Enterprise Collaboration Solutions product portfolio. The third segment contains Avaya’s services portfolio and is called Avaya Global Services.
Avaya sells directly through its worldwide sales force and through its global network of channel partners. As of September 30, 2014, Avaya had approximately 10,800 channel partners, including distributors, service providers, dealers, value-added resellers, system integrators and business partners that provide sales and service support.
Merger
Avaya Holdings Corp. is a holding company formed by affiliates of two private equity firms, Silver Lake Partners (“Silver Lake”) and TPG (“TPG”) (collectively, the “Sponsors”) on June 1, 2007, solely for the purpose of entering into an Agreement and Plan of Merger (the “Merger Agreement”) with Avaya Inc. Prior to the Merger Agreement, Avaya Inc. was a registered company with the U.S. Securities and Exchange Commission (“SEC”) and had common stock traded on the New York Stock Exchange. On June 4, 2007, the Company and its wholly owned subsidiary, Sierra Merger Corp., a Delaware corporation, (“Merger Sub”), entered into a Merger Agreement with Avaya Inc. pursuant to which Merger Sub would be merged with and into Avaya Inc., with Avaya Inc. continuing as the surviving corporation and a wholly owned subsidiary of Avaya Holdings Corp. (the “Merger”).
Acquisition of Enterprise Solutions Business of Nortel Networks Corporation
On December 18, 2009, Avaya acquired certain assets and assumed certain liabilities of the enterprise solutions business (“NES”) of Nortel Networks Corporation (“Nortel”) out of bankruptcy court proceedings, for an adjusted purchase price of $933 million. The terms of the acquisition did not include any significant contingent consideration arrangements.
Acquisition of RADVISION Ltd.
On June 5, 2012, Avaya acquired RADVISION Ltd. (“Radvision”) for $230 million in cash. Radvision is a global provider of videoconferencing and telepresence technologies over internet protocol and wireless networks. These audited consolidated financial statements include the operating results of Radvision since June 5, 2012.
Divestiture of Government IT Professional Services
On March 31, 2014, the Company completed the sale of its IT Professional Services (“ITPS”) business for a final sales price of $101 million, inclusive of $3 million of working capital adjustments and net of $2 million in costs to sell. See Note 5, “Divestitures—IT Professional Services Business,” for further details.
F-8
Table of Contents
Basis of Presentation
Avaya Holdings Corp. has no material assets or standalone operations other than its ownership in Avaya Inc. and its subsidiaries. The consolidated financial statements as of September 30, 2014 and 2013 and for the years ended September 30, 2014, 2013 and 2012 reflect the operating results of Avaya Holdings Corp. and its consolidated subsidiaries. As a result of the divestiture of the ITPS business, the results of operations, cash flows, and assets and liabilities of this business have been classified as discontinued operations in all periods presented.
2. Summary of Significant Accounting Policies
Use of Estimates
The consolidated financial statements and related disclosures are prepared in conformity with accounting principles generally accepted in the United States of America (“GAAP”). Management is required to make estimates and assumptions that affect the reported amounts of assets and liabilities, the disclosure of contingent assets and liabilities at the date of the financial statements, and revenue and expenses during the periods reported. These estimates include assessing the collectibility of accounts receivable, sales returns and allowances, the use and recoverability of inventory, the realization of deferred tax assets, business restructuring reserves, pension and postretirement benefit costs, the fair value of equity compensation, the fair value of assets and liabilities acquired in business combinations, the recoverability of long-lived assets, and useful lives and impairment of tangible and intangible assets including goodwill, the amount of exposure from potential loss contingencies, and fair value measurements, among others. The markets for the Company’s products are characterized by intense competition, rapid technological development and frequent new product introductions, all of which could affect the future recoverability of the Company’s assets. Estimates and assumptions are reviewed periodically and the effects of revisions are reflected in the consolidated financial statements in the period they are determined to be necessary. Actual results could differ from these estimates.
Principles of Consolidation
The consolidated financial statements include the accounts of Avaya and its subsidiaries. In the event that the Company is a primary beneficiary of a variable interest entity, the assets, liabilities, and results of operations of the variable interest entity will be included in the Company’s consolidated financial statements. All intercompany transactions and balances have been eliminated in consolidation. Certain prior year amounts have been reclassified to conform to the current presentation.
Acquisition Accounting
The Company accounts for business combinations using the acquisition method, which requires an allocation of the purchase price of an acquired entity to the assets acquired and liabilities assumed based on their estimated fair values at the date of acquisition. Goodwill represents the excess of the purchase price over the net tangible and intangible assets acquired.
Revenue Recognition
The Company derives revenue primarily from the sale of products, software, and services for communications systems and applications. The Company’s products are sold directly through its worldwide sales force and indirectly through its global network of distributors, service providers, dealers, value-added resellers, systems integrators and business partners. Services includes (i) supplemental maintenance service, including services provided under contracts to monitor and optimize customers’ communications network performance; (ii) professional services for implementation and integration of converged voice and data networks, network security and unified communications; and (iii) Cloud or managed services. Maintenance contracts have terms that range from one to five years. Contracts for professional services typically have terms that range from four to six weeks for standard products and from six months to one year for customized products. Contracts for Cloud and managed services have terms that range from one to seven years.
F-9
Table of Contents
In accordance with GAAP, revenue is recognized when persuasive evidence of an arrangement exists, delivery has occurred, the fee is fixed or determinable, and collectability is reasonably assured. For arrangements that require acceptance of the product, system, or solution as specified by the customer, revenue is deferred until the acceptance criteria have been met.
The Company’s indirect sales to channel partners are generally recognized at the time of shipment if all contractual obligations have been satisfied. The Company accrues a provision for estimated sales returns and other allowances, including promotional marketing programs and other incentives as a reduction of revenue at time of sale. When estimating returns, the Company considers customary inventory levels held by third-party distributors.
The Company enters into multiple deliverable arrangements, which may include various combinations of products, software and services. Most product and service deliverables qualify as separate units of accounting and can be sold on a standalone basis. A deliverable constitutes a separate unit of accounting when it has standalone value and, where return rights exist, delivery or performance of the undelivered items is considered probable and substantially within the Company’s control. When the Company sells products with implementation services, they are generally combined as one or more units of accounting, depending on the nature of the services and the customer’s acceptance requirements.
Most of the Company’s products have both software and non-software components that function together to deliver the products’ essential functionality. For these multiple deliverable arrangements, the Company allocates revenue to the deliverables based on their relative selling prices. To the extent that a deliverable is subject to specific guidance on whether and/or how to allocate the consideration in a multiple element arrangement, that deliverable is accounted for in accordance with such specific guidance. The Company limits the amount of revenue recognition for delivered items to the amount that is not contingent on the future delivery of products or services or meeting other future performance obligations.
The Company allocates revenue based on a selling price hierarchy of vendor-specific objective evidence, third-party evidence, and then estimated selling price. Vendor-specific objective evidence is based on the price charged when the deliverable is sold separately. Third-party evidence is based on largely interchangeable competitor products or services in standalone sales to similarly situated customers. As the Company is unable to reliably determine what competitors products’ selling prices are on a standalone basis, the Company is not typically able to determine third-party evidence. Estimated selling price is based on the Company’s best estimates of what the selling prices of deliverables would be if they were sold regularly on a standalone basis. Estimated selling price is established considering multiple factors including, but not limited to, pricing practices in different geographies and through different sales channels, major product and services groups, and customer classifications.
Once the Company allocates revenue to each deliverable, the Company recognizes revenue in accordance with its policies when all revenue recognition criteria are met. Product revenue is generally recognized upon delivery and maintenance services revenue is generally recognized ratably over the period during which the services are performed, whereas revenue from managed services is generally recognized based on usage, subject to contractual minimums. However, revenue for professional services arrangements is generally recognized upon completion of performance and revenue for arrangements that require acceptance of the product, system or solution, is recognized when the acceptance criteria have been met.
Standalone or subsequent sales of software or software-related items are recognized in accordance with the software revenue recognition guidance. For multiple deliverable arrangements that only include software items, the Company generally uses the residual method to allocate the arrangement consideration. Under the residual method, the amount of consideration allocated to the delivered items equals the total arrangement consideration, less the fair value of the undelivered items. Where vendor-specific objective evidence of fair value for the undelivered items cannot be determined, the Company generally defers revenue until all items are delivered and services have been performed, or until such evidence of fair value can be determined for the undelivered items.
F-10
Table of Contents
Cash and Cash Equivalents
Cash and cash equivalents consist of highly liquid investments with original maturities of three months or less when purchased, and are stated at cost, which approximates market value.
Concentrations of Risk
The Company’s cash and cash equivalents are invested in various investment grade institutional money market accounts and bank term deposits. Deposits held at banks may exceed the amount of insurance provided on such deposits. Generally, these deposits may be redeemed upon demand and are maintained with financial institutions with reputable credit and therefore bear minimal credit risk. The Company seeks to mitigate such risks by spreading its risk across multiple counterparties and monitoring the risk profiles of these counterparties.
The Company relies on a limited number of contract manufacturers and suppliers to provide manufacturing services for its products. The inability of a contract manufacturer or supplier to fulfill supply requirements of the Company could materially impact future operating results.
Accounts Receivable and Allowance for Doubtful Accounts
Accounts receivable are recorded net of reserves for sales returns and allowances and provisions for doubtful accounts. The Company performs ongoing credit evaluations of its customers and generally does not require collateral from its customers. The allowances are based on analyses of historical trends, aging of accounts receivable balances and the creditworthiness of customers as determined by credit checks, analyses, and payment history. At September 30, 2014, one distributor accounted for more than 10% of accounts receivable. At September 30, 2013, two distributors each accounted for more than 10% of accounts receivable.
Inventory
Inventory includes goods awaiting sale (finished goods), equipment that is being installed at customer locations for various installations that are not yet complete and goods to be used in connection with providing maintenance services. Inventory is stated at the lower of cost or market, determined on a first-in, first-out method. Reserves to reduce the inventory cost to market value are based on current inventory levels, assumptions about future demand and product life cycles for the various inventory types.
As discussed in detail in Note 21, “Commitments and Contingencies-Purchase Commitments and Termination Fees,” the Company has outsourced the manufacturing of substantially all of its products and may be obligated to purchase certain excess inventory levels from its outsourced manufacturers if actual sales of product vary from forecast, in which case additional inventory provisions may need to be recorded in the future.
Research and Development Costs
Research and development costs are charged to expense as incurred. The costs incurred for the development of communications software that will be sold, leased or otherwise marketed, however, are capitalized when technological feasibility has been established in accordance with Financial Accounting Standards Board (“FASB”) Accounting Standards Codification (“ASC”) Topic 985, “Software” (“ASC 985”). These capitalized costs are subject to an ongoing assessment of recoverability based on anticipated future revenues and costs and changes in hardware and software technologies. Costs that are capitalized include direct labor and related overhead.
Amortization of capitalized software development costs begins when the product is available for general release to customers. Amortization is recognized on a product-by-product basis generally on the straight-line method over a period of up to two years. Unamortized software development costs determined to be in excess of net realizable value of the product are expensed immediately. Included in other assets at September 30, 2014 and 2013 is unamortized software development costs of $8 million and $30 million, respectively.
F-11
Table of Contents
Property, Plant and Equipment
Property, plant and equipment are stated at cost less accumulated depreciation. Depreciation is determined using a straight-line method over the estimated useful lives of the assets. Estimated lives range from three to ten years for machinery and equipment, up to five years for rental equipment and up to 40 years for buildings. Improvements that extend the useful life of assets are capitalized and maintenance and repairs are charged to expense as incurred. Upon retirement or disposal of assets, the cost and related accumulated depreciation are removed from the Consolidated Balance Sheets and any gain or loss is reflected in the Consolidated Statements of Operations.
Internal Use Software
Certain costs of computer software developed or obtained for internal use are capitalized and amortized on a straight-line basis generally over three to seven years. General and administrative costs, overhead, maintenance and training, as well as the cost of software that does not add functionality to the existing system, are expensed as incurred. The Company had unamortized internal use software costs included in Other Assets in the Consolidated Balance Sheets of $51 million and $18 million as of September 30, 2014 and 2013, respectively.
Goodwill
Goodwill is not amortized but is subject to periodic testing for impairment in accordance with FASB ASC Topic 350, “Intangibles-Goodwill and Other” (“ASC 350”) at the reporting unit level which is one level below the Company’s operating segments. The assessment of goodwill impairment is conducted by estimating and comparing the fair value of the Company’s reporting units, as defined in ASC 350, to their carrying value as of that date. The fair value is estimated using an income approach whereby the fair value of the reporting unit is based on the future cash flows that each reporting unit’s assets can be expected to generate. Future cash flows are based on forward-looking information regarding market share and costs for each reporting unit and are discounted using an appropriate discount rate. Future discounted cash flows can be affected by changes in industry or market conditions or the rate and extent to which anticipated synergies or cost savings are realized with newly acquired entities.
Avaya has historically performed its annual impairment test of goodwill on September 30th, its fiscal year end date. During the fiscal year ended September 30, 2014, the Company adopted a change in accounting principle whereby the annual impairment assessment of goodwill will be performed as of July 1st each year. The change in the testing date allows more time for analysis and is in line with the timing of the Company’s annual strategic planning process. This change in accounting principle does not delay, accelerate or avoid an impairment charge. Accordingly, the Company believes that the change described above is preferable. The Company will continue to test for impairment more frequently if events occur or circumstances change that would more likely than not reduce the fair value of a reporting unit below its carrying amount.
Intangible and Long-lived Assets
Intangible assets include technology, customer relationships, trademarks and trade-names and other intangibles. Intangible assets with finite lives are amortized using the straight-line method over the estimated economic lives of the assets, which range from two to fifteen years. Long-lived assets, including intangible assets with finite lives, are reviewed for impairment whenever events or changes in circumstances indicate that the carrying amount of such assets may not be recoverable in accordance with FASB ASC Topic 360, “Property, Plant, and Equipment.” Determination of recoverability is based on an estimate of undiscounted future cash flows resulting from the use of the asset and its eventual disposition. Measurement of an impairment loss for long-lived assets that management expects to hold and use is based on the estimated fair value of the asset. Long-lived assets to be disposed of are reported at the lower of carrying amount or estimated fair value less costs to sell. Intangible assets determined to have indefinite useful lives are not amortized but are tested for impairment annually and more frequently if events occur or circumstances change that indicate an asset may be impaired.
F-12
Table of Contents
Avaya has historically performed its annual impairment test of indefinite-lived intangible assets on September 30th, its fiscal year end date. In the fiscal year ended September 30, 2014, the Company adopted a change in accounting principle whereby the annual impairment assessment of indefinite-lived intangible assets will be performed as of July 1st each year. The change in the testing date allows more time for analysis and is in line with the timing of the Company’s annual strategic planning process. This change in accounting principle does not delay, accelerate or avoid an impairment charge. Accordingly, the Company believes that the change described above is preferable. The Company will continue to test for impairment more frequently if events occur or circumstances change that indicate an asset may be impaired.
Financial Instruments
The Company uses foreign currency forward contracts to manage and reduce risk to the Company by generating cash flows that offset the cash flows of certain transactions in foreign currencies in relation to their amounts and timing. The Company’s derivative financial instruments are used as risk management tools and not for speculative or trading purposes. These derivative instruments represent assets and liabilities and are classified as other current assets or other current liabilities on the Consolidated Balance Sheets. Gains and losses on the changes in the fair values of the Company’s foreign currency forward contracts are included in other income (expense), net. As permitted under FASB ASC Topic 815 “Derivatives and Hedging” (“ASC 815”), the Company has elected not to designate its forward contracts as hedges thereby precluding the use of hedge accounting for these instruments.
In order to reduce its exposure to variable rate interest payments associated with its senior secured credit facility, the Company may use interest rate swap agreements. Those interest rate swaps that are designated and qualify as cash flow hedges under ASC 815 are included at estimated fair value as an asset or liability in the Consolidated Balance Sheets. These are bifurcated into current and non-current components depending upon the timing of the cash flows. Fair value related to the cash flows occurring within one year are classified as current and beyond one year as non-current. Unrealized gains/losses related to the change in market value on these interest rate swaps are recorded in other comprehensive loss and reclassified to earnings in the same period or periods during which the hedged transaction affects earnings. The market value of the interest rate swaps recorded in other comprehensive loss may be recognized in the Consolidated Statement of Operations earlier if the interest rate swaps are determined to be ineffective, for example, if certain terms of the senior secured credit facility change, if the loan is extinguished, if the counterparty’s ability to honor its obligation under the agreement changes, or if the interest rate swap agreements are terminated prior to maturity.
As discussed more fully in Note 16 “Capital Stock”, the Company has issued Series B Convertible Preferred Stock (“preferred series B”) containing certain features which are considered an embedded derivative under GAAP. This embedded derivative was separated from the host contract (i.e. the preferred stock) and recognized as a current liability on the Consolidated Balance Sheet at fair value. Gains and losses on the changes in the fair value of the embedded derivative are included in other income (expense), net.
The Company also utilizes non-derivative financial instruments including letters of credit and commitments to extend credit.
Restructuring Programs
The Company accounts for exit or disposal of activities in accordance with FASB ASC Topic 420, “Exit or Disposal Cost Obligations” (“ASC 420”). In accordance with ASC 420, a business restructuring is defined as an exit or disposal activity that includes but is not limited to a program that is planned and controlled by management and materially changes either the scope of a business or the manner in which that business is conducted. Business restructuring charges include (i) one-time termination benefits related to employee separations, (ii) contract termination costs and (iii) other costs associated with exit or disposal activities including, but not limited to, costs for consolidating or closing facilities and relocating employees.
F-13
Table of Contents
A liability is recognized and measured at its fair value for one-time termination benefits once the plan of termination is communicated to affected employees and it meets all of the following criteria: (i) management commits to a plan of termination, (ii) the plan identifies the number of employees to be terminated and their job classifications or functions, locations and the expected completion date, (iii) the plan establishes the terms of the benefit arrangement and (iv) it is unlikely that significant changes to the plan will be made or the plan will be withdrawn. Contract termination costs include costs to terminate a contract or costs that will continue to be incurred under the contract without benefit to the Company. A liability is recognized and measured at its fair value when the Company either terminates the contract or ceases using the rights conveyed by the contract. A liability is recognized and measured at its fair value for other associated costs in the period in which the liability is incurred.
Pension and Postretirement Benefit Obligations
The Company sponsors non-contributory defined benefit pension plans covering a portion of its U.S. employees and retirees, and postretirement benefit plans covering a portion of its U.S. retirees that include healthcare benefits and life insurance coverage. Certain non-U.S. operations have various retirement benefit programs covering substantially all of their employees. Some of these programs are considered to be defined benefit pension plans for accounting purposes.
The Company’s pension and postretirement benefit costs are developed from actuarial valuations. Inherent in these valuations are key assumptions, including the discount rate and expected long-term rate of return on plan assets. Material changes in pension and postretirement benefit costs may occur in the future due to changes in these assumptions, changes in the number of plan participants, changes in the level of benefits provided, changes in asset levels and changes in legislation.
The market-related value of the Company’s plan assets as of the measurement date is developed using a five-year smoothing technique. First, a preliminary market-related value is calculated by adjusting the market-related value at the beginning of the year for payments to and from plan assets and the expected return on assets during the year. The expected return on assets represents the expected long-term rate of return on plan assets adjusted up to plus or minus 2% based on the actual ten-year average rate of return on plan assets. A final market-related value is determined as the preliminary market-related value, plus 20% of the difference between the actual return and expected return for each of the past five years.
These pension and other postretirement benefits are accounted for in accordance with FASB ASC Topic 715, “Compensation—Retirement Benefits” (“ASC 715”). ASC 715 requires that plan assets and obligations be measured as of the reporting date and the over-funded, under-funded or unfunded status of plans be recognized as of the reporting date as an asset or liability in the Consolidated Balance Sheets. In addition, ASC 715 requires costs and related obligations and assets arising from pensions and other postretirement benefit plans to be accounted for based on actuarially-determined estimates.
The plans use different factors, including years of service, eligible compensation and age, to determine the benefit amount for eligible participants. The Company funds its U.S. qualified pension plans in compliance with applicable laws. See Note 14, “Benefit Obligations,” for further details on the Company’s pension and postretirement plans.
Advertising Costs
The Company expenses advertising costs as incurred. Advertising costs were $68 million, $54 million and $70 million in fiscal 2014, 2013 and 2012, respectively.
Share-based Compensation
The Company accounts for share-based compensation in accordance with FASB Topic ASC 718, “Compensation—Stock Compensation” (“ASC 718”), which requires the measurement and recognition of compensation expense for all share-based payment awards made to employees and directors including stock options, restricted stock units and stock purchases based on estimated fair values.
F-14
Table of Contents
Equity Awards on Redeemable Shares
The Company issued equity awards, including restricted stock units and stock options, to employees of the Company that had a provision allowing, upon the employees’ death or disability during employment, their estates to sell any shares obtained as a result of the equity award to the Company at an amount equal to the then current fair value per share as long as the sale is done pursuant to the terms and conditions of the Management Stockholder’s Agreement. As a result of this provision, the Company classifies the vested portion of the intrinsic value of these stock options and restricted stock units in the mezzanine section between debt and stockholders’ deficiency in the Consolidated Balance Sheets.
Income Taxes
Income taxes are accounted for under the asset and liability method. Under this method, deferred tax assets and liabilities are recognized for the estimated future tax consequences attributable to differences between the financial statement carrying amounts of existing assets and liabilities and their respective tax bases, and operating loss and tax credit carryforwards. Deferred tax assets and liabilities are measured using enacted tax rates in effect for the year in which those temporary differences are expected to be recovered or settled. The effect on deferred tax assets and liabilities of a change in tax rates is recognized in the Consolidated Statements of Operations in the period that includes the enactment date. A valuation allowance is recorded to reduce the carrying amounts of deferred tax assets if it is more likely than not that such assets will not be realized. Additionally, the accounting for income taxes requires the Company to evaluate and make an assertion as to whether undistributed foreign earnings will be indefinitely reinvested or repatriated.
FASB ASC Subtopic 740-10, “Income Taxes—Overall” (“ASC 740-10”) prescribes a comprehensive model for the financial statement recognition, measurement, classification, and disclosure of uncertain tax positions. ASC 740-10 contains a two-step approach to recognizing and measuring uncertain tax positions. The first step is to evaluate the tax position for recognition by determining if the weight of available evidence indicates that it is more likely than not that the position will be sustained on audit, based on the technical merits of the position. The second step is to measure the tax benefit as the largest amount that is more than 50% likely of being realized upon settlement.
Significant judgment is required in evaluating uncertain tax positions and determining the provision for income taxes. Although the Company believes its reserves are reasonable, no assurance can be given that the final tax outcome of these matters will not be different from that which is reflected in the historical income tax provision and accruals. The Company adjusts these reserves in light of changing facts and circumstances.
Net Loss Per Share
Basic net loss per share from continuing and discontinued operations is computed by dividing the net loss attributable to common stockholders by the weighted average number of common shares outstanding during the period. Net loss attributable to common stockholders is adjusted (increased) for preferred stock dividends earned during the period. Diluted loss per share from continuing and discontinued operations is computed by dividing the net loss attributable to common stockholders by the weighted average number of common shares outstanding plus potentially dilutive common shares.
Deferred Financing Costs
Deferred financing costs, which are included in other assets, are amortized using the effective interest method as interest expense over the contractual lives of the related credit facilities.
Foreign Currency Translation
Assets and liabilities of non-U.S. subsidiaries that operate in a local currency environment, where the local currency is the functional currency, are translated from foreign currencies into U.S. dollars at period-end
F-15
Table of Contents
exchange rates while income and expenses are translated at the spot rate. Translation gains or losses related to net assets located outside the U.S. are shown as a component of accumulated other comprehensive loss in the Consolidated Statements of Changes in Stockholders’ Deficiency. Gains and losses resulting from foreign currency transactions, which are denominated in currencies other than Avaya’s functional currency, are included in other income (loss), net in the Consolidated Statements of Operations.
Other Comprehensive Income (Loss)
Other comprehensive income (loss) is recorded directly to a separate section of stockholders’ deficiency in accumulated other comprehensive loss and primarily includes unrealized gains and losses excluded from the Consolidated Statements of Operations. These unrealized gains and losses consist of changes in foreign currency translation, interest rate swaps, and changes in unamortized pension, postretirement and postemployment actuarial gains and losses.
3. Recent Accounting Pronouncements
New Accounting Guidance Recently Adopted
Reporting of Amounts Reclassified Out of Accumulated Other Comprehensive Income
In the first quarter of fiscal 2014, the Company adopted new guidance on the reporting of amounts reclassified out of accumulated other comprehensive income. The guidance requires presentation, either in a single note or parenthetically on the face of the financial statements, of the effect of significant amounts reclassified from each component of accumulated other comprehensive income based on its source and the income statement line items affected by the reclassification. The relevant presentation and disclosures have been applied retrospectively for all periods presented, as presented in Note 19, “Accumulated Other Comprehensive Loss”.
Reporting Discontinued Operations and Disclosures of Disposals of Components of an Entity
In April 2014, the FASB issued Accounting Standards Update (“ASU”) No. 2014-8 “Reporting Discontinued Operations and Disclosures of Disposals of Components of an Entity.” The standard changes the criteria for determining which disposals can be presented as discontinued operations and modifies related disclosure requirements. Under the new guidance, a discontinued operation is defined as a disposal of a component or group of components that is disposed of or is classified as held for sale and represents a strategic shift that has a major effect on an entity’s operations and financial results. This accounting guidance applies prospectively to new disposals and new classifications of disposal groups as held for sale. The Company adopted this guidance in the third quarter of fiscal 2014, which did not have a material impact on the Consolidated Financial Statements and disclosures and is not expected to have a material impact on future periods.
Recent Accounting Guidance Not Yet Effective
In July 2013, the FASB issued ASU No. 2013-11 “Presentation of an Unrecognized Tax Benefit When a Net Operating Loss Carryforward, a Similar Tax Loss, or a Tax Credit Carryforward Exists.” The standard requires the netting of unrecognized tax benefits (“UTBs”) against a deferred tax asset for a loss or other carryforward that would apply in settlement of the uncertain tax positions. UTBs are required to be netted against all available same-jurisdiction loss or other tax carryforwards that would be utilized, rather than only against carryforwards that are created by the UTBs. This accounting guidance is effective for the Company beginning in the first quarter of fiscal 2015. The Company is currently evaluating the impact that the adoption of this accounting guidance may have on its Consolidated Financial Statements.
In May 2014, the FASB issued ASU No. 2014-09 “Revenue from Contracts with Customers.” The standard supersedes most of the current revenue recognition guidance under U.S. GAAP and is intended to improve and
F-16
Table of Contents
converge with international standards the financial reporting requirements for revenue from contracts with customers. The core principle of the new guidance is that an entity should recognize revenue to depict the transfer of promised goods or services to customers in an amount that reflects the consideration to which the entity expects to be entitled in exchange for those goods or services. New disclosures about the nature, amount, timing and uncertainty of revenue and cash flows arising from contracts with customers are also required. This accounting guidance is effective for the Company beginning in the first quarter of fiscal 2018; early adoption is not permitted. The ASU may be applied retrospectively (a) to each reporting period presented or (b) with the cumulative effect in retained earnings at the beginning of the adoption period. The Company is currently evaluating the method of adoption and the impact that the adoption of this accounting guidance may have on its Consolidated Financial Statements.
In August 2014, the FASB issued ASU No. 2014-15 “Disclosure of Uncertainties about an Entity’s Ability to Continue as a Going Concern.” The standard requires management to evaluate, at each annual and interim reporting period, the company’s ability to continue as a going concern within one year of the date the financial statements are issued and provide related disclosures. This accounting guidance is effective for the Company on a prospective basis beginning in the first quarter of fiscal 2017 and is not expected to have a material effect on its Consolidated Financial Statements.
4. Business Combinations
IT Navigator Ltd.
On October 1, 2013, Avaya acquired IT Navigator, Ltd. (“IT Navigator”), a global provider of Cloud, social media and management products and services. The integration of the Avaya and IT Navigator portfolios has added key management reporting and social media capabilities and enhanced Avaya’s Cloud as well as its unified communication and contact center products. These audited Consolidated Financial Statements include the operating results of IT Navigator since October 1, 2013.
RADVISION Ltd.
On June 5, 2012, Avaya acquired Radvision for $230 million in cash. The purchase price was funded with (i) $196 million from the issuance of Series B preferred stock and warrants to purchase common stock and (ii) approximately $34 million of Avaya’s cash. The acquisition of Radvision has been accounted for under the acquisition method, which requires an allocation of the purchase price of the acquired entity to the assets acquired and liabilities assumed based on their estimated fair values from a market-participant perspective at the date of acquisition.
Other Acquisitions
During fiscal 2014, 2013 and 2012, the Company completed several other acquisitions primarily to enhance the Company’s technology portfolio which had an aggregate purchase price of $2 million, $2 million and $36 million for fiscal 2014, 2013 and 2012, respectively.
Acquired intangible assets among other acquisitions were $2 million, $1 million and $20 million during fiscal 2014, 2013 and 2012, respectively. The acquired intangible assets are being amortized over a weighted average useful life of five years, on a straight-line basis. No in-process research and development was acquired in the acquisitions.
The excess of the purchase price over the assessment of the net tangible and intangible assets acquired in connection with these other acquisitions resulted in no goodwill in fiscal 2014 and less than $1 million and $15 million of goodwill in fiscal 2013 and 2012, respectively. The premiums paid by the Company in the transactions are largely attributable to the acquisition of assembled workforces and the synergies and economies of scale provided to a market participant, particularly as it pertains to marketing efforts and customer base. None of the goodwill is deductible for tax purposes.
F-17
Table of Contents
These Consolidated Financial Statements include the operating results of the acquired entities since their respective acquisition dates. The revenues and expenses specific to these businesses and their pro forma results are not material to these Consolidated Financial Statements.
5. Divestitures
IT Professional Services Business
On March 31, 2014, the Company completed the sale of the ITPS business of its wholly-owned subsidiary, Avaya Government Solutions Inc. for a final sales price of $101 million, inclusive of $3 million of working capital adjustments and net of $2 million in costs to sell. The ITPS business, which was part of the Avaya Global Services segment, provides specialized information technology services exclusively to government customers in the U.S. The Company retained its Federal product sales and services teams and continues to sell unified communications, collaboration, contact center and networking products and services to Federal, state and municipal governments under the name Avaya Government Solutions.
Discontinued Operations
Summarized financial information relating to the Company’s discontinued operations are as follows:
| Fiscal years ended September 30, | ||||||||||||
| In millions |
2014 | 2013 | 2012 | |||||||||
| SERVICES REVENUE |
$ | 53 | $ | 130 | $ | 152 | ||||||
|
|
|
|
|
|
|
|||||||
| OPERATING INCOME (LOSS) FROM DISCONTINUED OPERATIONS |
$ | 7 | $ | (67 | ) | $ | 26 | |||||
| Gain on sale of ITPS business |
52 | — | — | |||||||||
|
|
|
|
|
|
|
|||||||
| INCOME (LOSS) FROM DISCONTINUED OPERATIONS BEFORE INCOME TAXES |
59 | (67 | ) | 26 | ||||||||
| Benefit from (provision for) income taxes from discontinued operations |
3 | 10 | (12 | ) | ||||||||
|
|
|
|
|
|
|
|||||||
| INCOME (LOSS) FROM DISCONTINUED OPERATIONS, NET OF INCOME TAXES |
$ | 62 | $ | (57 | ) | $ | 14 | |||||
|
|
|
|
|
|
|
|||||||
Operating loss from discontinued operations for the fiscal year ended September 30, 2013 includes a goodwill impairment charge of $89 million. During the three months ended March 31, 2013, the ITPS reporting unit experienced a decline in revenues as a result of reduced government spending in anticipation of sequestration and budget cuts. Additionally, there was uncertainty regarding how the U.S. government sequestration cuts would be implemented and the impact they would have on contractors supporting the government. As a result of these events, the Company determined that an interim impairment test of the reporting unit’s goodwill should be performed.
The results of step one of the goodwill impairment test indicated that the estimated fair value of the ITPS reporting unit was less than the respective carrying value of its net assets (including goodwill) and as such, the Company performed step two of the impairment test.
As a result of the application of step two of the goodwill impairment test, the Company estimated the implied fair value of the goodwill to be $44 million as compared with a carrying value of $133 million and recorded an impairment to goodwill of $89 million associated with the ITPS reporting unit.
Prior to the goodwill testing discussed above, the Company tested the intangible assets and other long-lived assets of the ITPS reporting unit for impairment during the three months ended March 31, 2013 and no impairment was identified.
As of September 30, 2013, the book value of the assets and liabilities of the ITPS reporting unit, which were classified as held for sale, were $59 million and $19 million, respectively, and consisted primarily of accounts receivable, intangible assets, goodwill and accounts payable.
F-18
Table of Contents
Technology Business Unit
On July 31, 2014, Avaya completed the sale of assets and liabilities associated with the Technology Business Unit (“TBU”) for $26 million, subject to working capital and other customary adjustments. As a result of the sale, a $14 million gain was recognized and included in other income (expense), net in the Consolidated Statements of Operations during the year ended September 30, 2014. TBU, which was acquired as part of the Radvision acquisition, is a software development business that licenses technologies to developers for their use and integration into their own products and includes protocol stacks, client framework solutions, and network testing and monitoring tools.
6. Goodwill
Goodwill is not amortized but is subject to periodic testing for impairment at the reporting unit level which is one level below the Company’s operating segments. Avaya has historically performed its annual impairment test of goodwill on September 30th, its fiscal year end date. As discussed in Note 2, “Summary of Significant Accounting Policies-Goodwill,” during the fiscal year ended September 30, 2014, the Company adopted a change in accounting principle whereby the annual impairment assessment of goodwill will be performed as of July 1st each year. The Company continues to test for impairment more frequently if events occur or circumstances change that would more likely than not reduce the fair value of a reporting unit below its carrying amount.
The impairment test for goodwill is a two-step process. Step one consists of a comparison of the fair value of a reporting unit with its carrying amount, including the goodwill allocated to that reporting unit. The Company estimated the fair value of each reporting unit using an income approach which values the unit based on the future cash flows expected from that reporting unit. Future cash flows are based on forward-looking information regarding market share and costs for each reporting unit and are discounted using an appropriate discount rate. Future discounted cash flows can be affected by changes in industry or market conditions or the rate and extent to which anticipated synergies or cost savings are realized with newly acquired entities. In step one of the test, a market approach was used as a reasonableness test but was not given significant weighting in the final determination of fair value.
The discounted cash flows model used in the Company’s income approach relies on assumptions regarding revenue growth rates, gross profit, projected working capital needs, selling, general and administrative expenses, research and development expenses, business restructuring costs, capital expenditures, income tax rates, discount rates and terminal growth rates. To estimate fair value, the Company discounts the expected cash flows of each reporting unit. The discount rate Avaya uses represents the estimated weighted average cost of capital, which reflects the overall level of inherent risk involved in its reporting unit operations and the rate of return an outside investor would expect to earn. To estimate cash flows beyond the final year of its model, Avaya uses a terminal value approach. Under this approach, Avaya applies a perpetuity growth assumption and discounts by a perpetuity discount factor to determine the terminal value. Avaya incorporates the present value of the resulting terminal value into its estimate of fair value.
The Company forecasted cash flows for each of its reporting units and took into consideration current economic conditions and trends, estimated future operating results, Avaya’s view of growth rates and anticipated future economic conditions. Revenue growth rates inherent in this forecast are based on input from internal and external market intelligence research sources that compare factors such as growth in global economies, regional trends in the telecommunications industry and product evolution from a technological segment basis. Macro economic factors such as changes in economies, product evolutions, industry consolidations and other changes beyond Avaya’s control could have a positive or negative impact on achieving its targets.
F-19
Table of Contents
July 1, 2014
At July 1, 2014, the Company performed its annual goodwill impairment test and determined that the respective book values of the Company’s reporting units did not exceed their estimated fair values and therefore no impairment existed. However, if market conditions deteriorate, it may be necessary to record impairment charges in the future.
September 30, 2013
At September 30, 2013, the Company performed its annual goodwill impairment test and determined that the respective book values of the Company’s reporting units did not exceed their estimated fair values and therefore no impairment existed.
Excluding the interim impairment test for the ITPS reporting unit, as disclosed in Note 5, “Divestitures—IT Professional Services Business,” the Company determined that no events or circumstances changed during the fiscal year ended September 30, 2013 that would more likely than not reduce the fair value of its reporting units below their respective carrying amounts.
September 30, 2012
At September 30, 2012, the Company performed its annual goodwill impairment test and determined that the respective book values of the Company’s reporting units did not exceed their estimated fair values and therefore no impairment existed.
The changes in the carrying amount of goodwill by operating segment are as follows:
| In millions |
Global Communications Solutions |
Networking | Avaya Global Services |
Total | ||||||||||||
| Balance as of October 1, 2012 |
$ | 1,511 | $ | — | $ | 2,544 | $ | 4,055 | ||||||||
| Adjustments |
(3 | ) | — | (4 | ) | (7 | ) | |||||||||
|
|
|
|
|
|
|
|
|
|||||||||
| Balance as of September 30, 2013 |
$ | 1,508 | $ | — | $ | 2,540 | $ | 4,048 | ||||||||
| Acquisitions |
13 | — | — | 13 | ||||||||||||
| Sale of TBU business |
(7 | ) | — | (2 | ) | (9 | ) | |||||||||
| Adjustments |
(5 | ) | — | — | (5 | ) | ||||||||||
|
|
|
|
|
|
|
|
|
|||||||||
| Balance as of September 30, 2014 |
$ | 1,509 | $ | — | $ | 2,538 | $ | 4,047 | ||||||||
|
|
|
|
|
|
|
|
|
|||||||||
| Balance as of September 30, 2014: |
||||||||||||||||
| Goodwill |
$ | 2,643 | $ | — | $ | 2,538 | $ | 5,181 | ||||||||
| Accumulated Impairment |
(1,134 | ) | — | — | (1,134 | ) | ||||||||||
|
|
|
|
|
|
|
|
|
|||||||||
| $ | 1,509 | $ | — | $ | 2,538 | $ | 4,047 | |||||||||
|
|
|
|
|
|
|
|
|
|||||||||
“Adjustments” substantially pertain to the reversal of business restructuring reserves, tax valuation allowances, and the impact of foreign currency fluctuations.
7. Acquired Intangible Assets
Acquired intangible assets include acquired technology, customer relationships, trademarks and trade-names and other intangibles. Acquired intangible assets with finite lives are amortized using the straight-line method over the estimated economic lives of the assets, which range from two to fifteen years.
F-20
Table of Contents
The Company’s acquired intangible assets consist of:
| In millions |
Acquired technology and patents |
Customer relationships and other intangibles |
Trademarks and trade names |
Total | ||||||||||||
| Balance as of September 30, 2014 |
||||||||||||||||
| Gross Carrying Amount |
$ | 1,419 | $ | 2,302 | $ | 546 | $ | 4,267 | ||||||||
| Accumulated Amortization |
(1,330 | ) | (1,523 | ) | — | (2,853 | ) | |||||||||
| Accumulated Impairment |
— | — | (190 | ) | (190 | ) | ||||||||||
|
|
|
|
|
|
|
|
|
|||||||||
| $ | 89 | $ | 779 | $ | 356 | $ | 1,224 | |||||||||
|
|
|
|
|
|
|
|
|
|||||||||
| Balance as of September 30, 2013 |
||||||||||||||||
| Gross Carrying Amount |
$ | 1,415 | $ | 2,288 | $ | 546 | $ | 4,249 | ||||||||
| Accumulated Amortization |
(1,277 | ) | (1,285 | ) | — | (2,562 | ) | |||||||||
| Accumulated Impairment |
— | — | (190 | ) | (190 | ) | ||||||||||
|
|
|
|
|
|
|
|
|
|||||||||
| $ | 138 | $ | 1,003 | $ | 356 | $ | 1,497 | |||||||||
|
|
|
|
|
|
|
|
|
|||||||||
Long-lived assets, including intangible assets with finite lives, are reviewed for impairment whenever events or changes in circumstances indicate that the carrying amount of such assets may not be recoverable. Intangible assets determined to have indefinite useful lives are not amortized but are tested for impairment annually, or more frequently if events or changes in circumstances indicate the asset may be impaired.
The Company’s trademarks and trade names are expected to generate cash flows indefinitely. Consequently, these assets were classified as indefinite-lived intangibles and accordingly are not amortized but reviewed for impairment annually, or sooner under certain circumstances. Prior to the goodwill testing discussed above, the Company tested its intangible assets with indefinite lives. The test for impairment requires the Company to compare the fair value of its indefinite-lived intangible assets to the carrying value of those assets. In situations where the carrying value exceeds the fair value of the intangible asset, an impairment loss equal to the difference is recognized. The Company estimates the fair value of its indefinite-lived intangible assets using an income approach; specifically, based on discounted cash flows.
Avaya has historically performed its annual impairment test of indefinite-lived intangible assets on September 30th, its fiscal year end date. As discussed in Note 2, “Summary of Significant Accounting Policies-Intangible and Long-lived Assets,” during the fiscal year ended September 30, 2014, the Company adopted a change in accounting principle whereby the annual impairment assessment of indefinite-lived intangible assets will be performed as of July 1st each year. The Company continues to test for impairment more frequently if events occur or circumstances change that would more likely than not reduce the fair value of its indefinite-lived intangibles below its carrying amount.
July 1, 2014
At July 1, 2014, the Company performed its annual test of recoverability of indefinite-lived intangible assets. The Company determined that the respective book values of the Company’s indefinite-lived intangible assets did not exceed their estimated fair values and therefore no impairment existed.
September 30, 2013
At September 30, 2013, the Company performed its annual test of recoverability of indefinite-lived intangible assets. The Company determined that the respective book values of the Company’s indefinite-lived intangible assets did not exceed their estimated fair values and therefore no impairment existed.
Excluding the interim impairment test for the intangible assets and other long-lived assets of the ITPS reporting unit, as disclosed in Note 5, “Divestiture—IT Professional Services Business,” the Company determined that no events or circumstances changed during the fiscal year ended September 30, 2013 that would indicate that the intangible assets and long-lived assets of its other reporting units may not be recoverable.
F-21
Table of Contents
September 30, 2012
At September 30, 2012, the Company performed its annual test of recoverability of indefinite-lived intangible assets. The Company determined that the respective book values of the Company’s indefinite-lived intangible assets did not exceed their estimated fair values and therefore no impairment existed.
Future amortization expense of acquired intangible assets for the years ending September 30 is as follows:
| In millions |
||||
| 2015 |
$ | 261 | ||
| 2016 |
252 | |||
| 2017 |
220 | |||
| 2018 |
38 | |||
| 2019 and thereafter |
97 | |||
|
|
|
|||
| Total |
$ | 868 | ||
|
|
|
|||
8. Supplementary Financial Information
Consolidated Statements of Operations Information
| Fiscal years ended September 30, |
||||||||||||
| In millions |
2014 | 2013 | 2012 | |||||||||
| DEPRECIATION AND AMORTIZATION |
||||||||||||
| Amortization of software development costs included in costs |
$ | 22 | $ | 34 | $ | 36 | ||||||
| Amortization of acquired intangible assets |
283 | 291 | 419 | |||||||||
| Depreciation and amortization of property, plant and equipment and internal use software included in costs and operating expenses |
129 | 130 | 110 | |||||||||
|
|
|
|
|
|
|
|||||||
| Total depreciation and amortization |
$ | 434 | $ | 455 | $ | 565 | ||||||
|
|
|
|
|
|
|
|||||||
| OTHER INCOME (EXPENSE), NET |
||||||||||||
| Interest income |
$ | 2 | $ | 2 | $ | 3 | ||||||
| Gain (loss) on foreign currency transactions and forward contracts |
18 | 5 | (21 | ) | ||||||||
| Third party fees incurred in connection with debt modification |
(2 | ) | (18 | ) | — | |||||||
| Gain on sale of TBU business |
14 | — | — | |||||||||
| Change in fair value of Preferred B embedded derivative |
(22 | ) | (11 | ) | (6 | ) | ||||||
| Securities registration fees |
— | — | (3 | ) | ||||||||
| Venezuela hyperinflationary and devaluation charges |
(2 | ) | (1 | ) | — | |||||||
| Change in certain tax indemnifications |
(4 | ) | — | — | ||||||||
| Other, net |
(1 | ) | (2 | ) | (2 | ) | ||||||
|
|
|
|
|
|
|
|||||||
| Total other income (expense), net |
$ | 3 | $ | (25 | ) | $ | (29 | ) | ||||
|
|
|
|
|
|
|
|||||||
F-22
Table of Contents
Consolidated Balance Sheet Information
| Fiscal years ended September 30, |
||||||||||||
| In millions |
2014 | 2013 | 2012 | |||||||||
| VALUATION AND QUALIFYING ACCOUNTS |
||||||||||||
| Allowance for Accounts Receivable: |
||||||||||||
| Balance at beginning of year |
$ | 28 | $ | 24 | $ | 28 | ||||||
| Charged to expense |
2 | 6 | (2 | ) | ||||||||
| Additions (deductions) |
1 | (2 | ) | (2 | ) | |||||||
|
|
|
|
|
|
|
|||||||
| Balance at end of year |
$ | 31 | $ | 28 | $ | 24 | ||||||
|
|
|
|
|
|
|
|||||||
| Deferred Tax Asset Valuation Allowance: |
||||||||||||
| Balance at beginning of year |
$ | 1,508 | $ | 1,455 | $ | 1,372 | ||||||
| Charged to expense |
126 | (45 | ) | 26 | ||||||||
| Additions |
5 | 98 | 57 | |||||||||
|
|
|
|
|
|
|
|||||||
| Balance at end of year |
$ | 1,639 | $ | 1,508 | $ | 1,455 | ||||||
|
|
|
|
|
|
|
|||||||
| September 30, | ||||||||
| In millions |
2014 | 2013 | ||||||
| PROPERTY, PLANT AND EQUIPMENT, NET |
||||||||
| Land and improvements |
$ | 1 | $ | 6 | ||||
| Buildings and improvements |
165 | 252 | ||||||
| Machinery and equipment |
302 | 285 | ||||||
| Rental equipment |
203 | 217 | ||||||
| Assets under construction |
22 | 16 | ||||||
| Internal use software |
174 | 138 | ||||||
|
|
|
|
|
|||||
| Total property, plant and equipment |
867 | 914 | ||||||
| Less: Accumulated depreciation and amortization |
(586 | ) | (580 | ) | ||||
|
|
|
|
|
|||||
| Property, plant and equipment, net |
$ | 281 | $ | 334 | ||||
|
|
|
|
|
|||||
Included in buildings and improvements, net, is $26 million under a capital lease related to an office facility acquired in the acquisition of NES. Included in machinery and equipment is $18 million related to equipment acquired under capital leases.
F-23
Table of Contents
Supplemental Cash Flow Information
| Fiscal years ended September 30, |
||||||||||||
| In millions |
2014 | 2013 | 2012 | |||||||||
| OTHER PAYMENTS |
||||||||||||
| Interest payments |
$ | 452 | $ | 473 | $ | 416 | ||||||
| Income tax payments |
$ | 50 | $ | 39 | $ | 39 | ||||||
| NON-CASH FINANCING TRANSACTION |
||||||||||||
| Exchange of debt (1) |
$ | — | $ | 1,384 | $ | — | ||||||
| Acquisition of equipment under capital lease |
$ | 42 | $ | — | $ | 4 | ||||||
| (1) | Represents exchange of $642 million of senior unsecured cash-pay notes and $742 million of senior unsecured paid-in-kind toggle notes each originally due November 1, 2015 for $1,384 million of 10.50% senior secured notes due 2021. See Note 10, “Financing Arrangements.” |
9. Business Restructuring Reserves and Programs
Fiscal 2014 Restructuring Program
During fiscal 2014, the Company continued to identify opportunities to streamline operations and generate costs savings which included exiting facilities and eliminating employee positions. Restructuring charges recorded during fiscal year 2014 associated with these initiatives, net of adjustments to previous periods, were $165 million. These charges included employee separation costs of $155 million, primarily associated with employee severance actions of $123 million in Europe, Middle East and Africa (“EMEA”) and $24 million in the U.S. The EMEA charges include approved plans in the third and fourth quarters of fiscal 2014 for the elimination of 121 and 165 positions and resulted in a charge of $26 million and $39 million, respectively, for which the related payments are expected to be completed in fiscal 2016. The separation charges include, but are not limited to, social pension fund payments and health care and unemployment insurance costs to be paid to or on behalf of the affected employees. The charges in the U.S. included an enhanced separation plan that was offered to certain employees that will result in the elimination of 172 positions and a restructuring charge of $10 million, for which the related payments are expected to be completed in fiscal 2015.
Restructuring charges also included $9 million of lease obligations primarily in the U.S. The future lease obligations, net of estimated sublease income, related to operating lease obligations for unused space in connection with vacating or consolidating facilities during fiscal 2014 are expected to continue through fiscal 2022.
The Company continues to evaluate opportunities to streamline its operations and identify cost savings globally and may take additional restructuring actions in the future and the costs of those actions could be material.
The following table summarizes the components of the fiscal 2014 restructuring program during the fiscal year ended September 30, 2014:
| In millions |
Employee Separation Costs |
Lease Obligations |
Total | |||||||||
| 2014 restructuring charges |
$ | 155 | $ | 9 | $ | 164 | ||||||
| Cash payments |
(34 | ) | (2 | ) | (36 | ) | ||||||
| Impact of foreign currency fluctuations |
(6 | ) | — | (6 | ) | |||||||
|
|
|
|
|
|
|
|||||||
| Balance as of September 30, 2014 |
$ | 115 | $ | 7 | $ | 122 | ||||||
|
|
|
|
|
|
|
|||||||
F-24
Table of Contents
Fiscal 2013 Restructuring Program
During fiscal 2013, the Company continued to identify opportunities to streamline operations and generate cost savings which included exiting facilities and eliminating employee positions. Restructuring charges recorded during fiscal 2013 associated with these initiatives, net of adjustments to previous periods, were $200 million and include separation costs primarily associated with employee severance actions in EMEA and the U.S. In EMEA an approved plan provided for the elimination of 234 positions and resulted in a charge of $48 million, for which the related payments are expected to be completed in fiscal 2015. The separation charges include, but are not limited to, social pension fund payments and health care and unemployment insurance costs to be paid to or on behalf of the impacted employees. Enhanced separation plans were offered to certain management employees in the U.S. in the first and third quarters of fiscal 2013 and resulted in the elimination of 196 and 447 positions and restructuring charges of $9 million and $20 million, respectively for which the related payments were completed in fiscal 2014.
Restructuring charges also include $52 million of future lease obligations, which included $32 million of lease obligations associated with the Frankfurt, Germany facility vacated during fiscal 2013. The Company also recorded restructuring charges related to facilities vacated in the United Kingdom and the U.S. The future rental payments, net of estimated sublease income, related to operating lease obligations for unused space in connection with vacating or consolidating of facilities during fiscal 2013 are expected to continue through fiscal 2021.
The following table summarizes the components of the fiscal 2013 restructuring program:
| In millions |
Employee Separation Costs |
Lease Obligations |
Total | |||||||||
| 2013 restructuring charges |
$ | 142 | $ | 52 | $ | 194 | ||||||
| Cash payments |
(78 | ) | (7 | ) | (85 | ) | ||||||
| Impact of foreign currency fluctuations |
— | 1 | 1 | |||||||||
|
|
|
|
|
|
|
|||||||
| Balance as of September 30, 2013 |
64 | 46 | 110 | |||||||||
| Cash payments |
(55 | ) | (11 | ) | (66 | ) | ||||||
| Adjustments (1) |
(3 | ) | 3 | — | ||||||||
| Impact of foreign currency fluctuations |
— | (3 | ) | (3 | ) | |||||||
|
|
|
|
|
|
|
|||||||
| Balance as of September 30, 2014 |
$ | 6 | $ | 35 | $ | 41 | ||||||
|
|
|
|
|
|
|
|||||||
| (1) | Included in adjustments are changes in estimates, whereby all increases and decreases in costs related to the fiscal 2013 restructuring program are recorded to the restructuring charges line item in operating expenses in the period of the adjustment. |
Fiscal 2012 Restructuring Program
During fiscal 2012, the Company identified opportunities to streamline operations and generate cost savings which included exiting facilities and eliminating employee positions. Restructuring charges recorded during fiscal 2012 associated with these initiatives, net of adjustments to previous periods, were $147 million and include employee separation costs primarily associated with employee severance actions in Germany, as well as the US, EMEA excluding Germany and Canada. Employee separation charges included $70 million related to an agreement reached with the works council representing employees of certain of Avaya’s German subsidiaries for the elimination of 327 positions. The headcount reductions identified in this action were completed in fiscal 2013 with the related payments completed in fiscal 2014. The payments include, but are not limited to, social pension fund payments and health care and unemployment insurance costs to be paid to or on behalf of the affected employees. The payments related to the headcount reductions for the other actions taken globally were substantially completed in fiscal 2014. Future rental payments, net of estimated sublease income, related to operating lease obligations for unused space in connection with vacating or consolidating of facilities during fiscal 2012 were $17 million and are expected to continue through fiscal 2021.
F-25
Table of Contents
The Company had initiated a plan to dispose of a Company owned facility in Munich, Germany and relocate to a new facility. Accordingly, the Company had written the value of this asset down to its net realizable value of $3 million and reclassified the asset as held for sale. Included in restructuring and impairment charges, net in the Statement of Operations is an impairment charge of $5 million for fiscal 2012. During the first quarter of fiscal 2013, the Company sold this facility for its net realizable value.
The following table summarizes the components of the fiscal 2012 restructuring program:
| In millions |
Employee Separation Costs |
Lease Obligations |
Total | |||||||||
| 2012 restructuring charges |
$ | 123 | $ | 17 | $ | 140 | ||||||
| Cash payments |
(62 | ) | (4 | ) | (66 | ) | ||||||
| Impact of foreign currency fluctuations |
(3 | ) | (1 | ) | (4 | ) | ||||||
|
|
|
|
|
|
|
|||||||
| Balance as of September 30, 2012 |
58 | 12 | 70 | |||||||||
| Cash payments |
(51 | ) | (4 | ) | (55 | ) | ||||||
| Adjustments (1) |
(3 | ) | 3 | — | ||||||||
| Impact of foreign currency fluctuations |
2 | 1 | 3 | |||||||||
|
|
|
|
|
|
|
|||||||
| Balance as of September 30, 2013 |
6 | 12 | 18 | |||||||||
| Cash payments |
(5 | ) | (3 | ) | (8 | ) | ||||||
| Adjustments (1) |
— | 1 | 1 | |||||||||
| Impact of foreign currency fluctuations |
— | 1 | 1 | |||||||||
|
|
|
|
|
|
|
|||||||
| Balance of September 30, 2014 |
$ | 1 | $ | 11 | $ | 12 | ||||||
|
|
|
|
|
|
|
|||||||
| (1) | Included in adjustments are changes in estimates, whereby all increases and decreases in costs related to the fiscal 2012 restructuring program are recorded to the restructuring charges line item in operating expenses in the period of the adjustment. |
Fiscal 2008 through 2011 Restructuring Programs
During fiscal years 2008 through 2011, the Company identified opportunities to streamline operations and generate cost savings which included exiting facilities and eliminating employee positions. The payments related to the headcount reductions identified in those programs are expected to be completed in fiscal 2018. Future rental payments, net of estimated sublease income, related to operating lease obligations for unused space in connection with the closing or consolidation of facilities are expected to continue through fiscal 2021.
The following table aggregates the remaining components of the fiscal 2008 through 2011 restructuring programs:
| In millions |
Employee Separation Costs |
Lease Obligations |
Total | |||||||||
| Balance as of October 1, 2011 |
$ | 115 | $ | 71 | $ | 186 | ||||||
| Cash payments |
(99 | ) | (20 | ) | (119 | ) | ||||||
| Adjustments (1) |
(1 | ) | — | (1 | ) | |||||||
| Impact of foreign currency fluctuations |
(2 | ) | 1 | (1 | ) | |||||||
|
|
|
|
|
|
|
|||||||
| Balance as of September 30, 2012 |
13 | 52 | 65 | |||||||||
| Cash payments |
(8 | ) | (14 | ) | (22 | ) | ||||||
| Adjustments (1) |
(2 | ) | 2 | — | ||||||||
| Impact of foreign currency fluctuations |
— | (1 | ) | (1 | ) | |||||||
|
|
|
|
|
|
|
|||||||
| Balance as of September 30, 2013 |
3 | 39 | 42 | |||||||||
| Cash payments |
(2 | ) | (10 | ) | (12 | ) | ||||||
| Impact of foreign currency fluctuations |
1 | (1 | ) | — | ||||||||
|
|
|
|
|
|
|
|||||||
| Balance as of September 30, 2014 |
$ | 2 | $ | 28 | $ | 30 | ||||||
|
|
|
|
|
|
|
|||||||
F-26
Table of Contents
| (1) | Included in adjustments are changes in estimates, whereby all increases and decreases in costs related to the fiscal 2009, 2010 and 2011 restructuring program are recorded to the restructuring charges line item in operating expenses in the period of the adjustment. Included in adjustments are changes in estimates whereby all increases in costs related to the fiscal 2008 restructuring reserve are recorded in the restructuring charges line item in operating expenses in the period of the adjustments and decreases in costs are recorded as adjustments to goodwill. |
As a result of restructuring programs noted above and cost saving initiatives to consolidate facilities, the Company sold facilities in both fiscal 2014 and 2013, respectively. The Company is leasing portions of these facilities under separate agreements from the sales. The Company changed its estimates of the salvage values and the useful lives of the buildings to reflect the sales prices and the closing dates of the sales, respectively. The changes to the estimated salvage values and the useful lives resulted in additional depreciation expense of $35 million and $21 million for the fiscal years ended September 30, 2014 and 2013, respectively.
10. Financing Arrangements
In connection with the Merger, on October 26, 2007, Avaya Inc. entered into financing arrangements consisting of a senior secured credit facility, a senior unsecured credit facility, which later became senior unsecured notes and a senior secured multi-currency asset-based revolving credit facility, certain of which arrangements were amended on December 18, 2009 in connection with the acquisition of NES and amended on February 11, 2011 in connection with a debt refinancing. During fiscal 2013, Avaya Inc. completed a series of transactions which allowed Avaya Inc. to refinance term loans under its senior secured credit facility that originally matured October 26, 2014 and to refinance $1,384 million of senior unsecured notes that originally matured on November 1, 2015.
During fiscal 2014, Avaya Inc. entered into a transaction to refinance term loans under its senior secured credit facility with a new tranche of term loans that bear interest at a lower rate per annum than the debt they replaced while maintaining the same maturity and redeemed its senior unsecured notes due 2015 through cash on-hand and borrowings under its revolving credit facilities.
Fiscal 2013 Refinancing Transactions
During the three months ended December 31, 2012, Avaya Inc. completed three transactions to refinance $848 million of term loans under its senior secured credit facility, which were (1) an amendment and restatement of the senior secured credit facility and the senior secured multi-currency asset-based revolving credit facility on October 29, 2012 along with the extension of the maturity date of $135 million aggregate principal amount of senior secured term B-1 loans (the “term B-1 loans”) by converting such loans into a new tranche of senior secured term B-4 loans (the “term B-4 loans”), (2) an amendment and restatement of the senior secured credit facility on December 21, 2012 along with the extension of the maturity date of $713 million aggregate principal amount of term B-1 loans and $134 million aggregate principal amount of term B-4 loans, in each case, by converting such loans into a new tranche of senior secured term B-5 loans (the “term B-5 loans”) and (3) the issuance on December 21, 2012 of $290 million of 9% senior secured notes due April 2019, the net proceeds of which were used to repay $284 million of term B-5 loans.
During the three months ended March 31, 2013, Avaya Inc. refinanced the remaining $584 million of term B-1 loans outstanding under its senior secured credit facility with cash proceeds from the issuance of $589 million aggregate principal amount of term B-5 loans under the senior secured credit facility.
Additionally, during the three months ended March 31, 2013, Avaya Inc. refinanced $1,384 million of senior unsecured notes, through (1) amendments to the senior secured credit facility and the senior secured multi-currency asset-based revolving credit facility permitting the refinancing of the 9.75% senior unsecured notes due 2015 and 10.125%/10.875% senior unsecured paid-in-kind (“PIK”) toggle notes due 2015 (collectively, the “Old Notes”) with indebtedness secured by a lien on certain collateral on a junior-priority basis and (2) the exchange of $1,384 million of Old Notes for $1,384 million of 10.50% senior secured notes due 2021.
F-27
Table of Contents
Fiscal 2014 Refinancing Transactions
On February 5, 2014, Avaya Inc. completed an amendment to the senior secured credit facility pursuant to which Avaya Inc. refinanced $1,138 million aggregate principal amount of term B-5 loans with the cash proceeds from the issuance of senior secured term B-6 loans (“term B-6 loans”).
On May 15, 2014, Avaya Inc. redeemed 100% of the aggregate principal amount of its 10.125%/10.875% senior unsecured PIK toggle notes due 2015 and 9.75% senior unsecured cash-pay notes due 2015 at a redemption price of 100% of the principal amount thereof, plus accrued and unpaid interest, or $92 million and $58 million, respectively. The redemption price of $150 million was funded through cash on-hand of $10 million and borrowings of $140 million under Avaya Inc.’s revolving credit facilities. During the quarter ended September 30, 2014, Avaya Inc. repaid $10 million of the borrowings under the senior secured multi-currency revolver.
Long-term debt consists of the following:
| September 30, | ||||||||
| In millions |
2014 | 2013 | ||||||
| 9.75% senior unsecured cash pay notes due November 1, 2015 |
— | 58 | ||||||
| 10.125%/10.875% senior unsecured PIK toggle notes due November 1, 2015 |
— | 92 | ||||||
| Variable rate senior secured multi-currency asset-based revolving credit facility due October 26, 2016 |
40 | — | ||||||
| Variable rate senior secured multi-currency revolver due October 26, 2016 |
90 | — | ||||||
| Variable rate senior secured term B-3 loans due October 26, 2017 |
2,102 | 2,127 | ||||||
| Variable rate senior secured term B-4 loans due October 26, 2017 |
1 | 1 | ||||||
| Variable rate senior secured term B-5 loans due March 31, 2018 |
— | 1,141 | ||||||
| Variable rate senior secured term B-6 loans due March 31, 2018 |
1,128 | — | ||||||
| 7% senior secured notes due April 1, 2019 |
1,009 | 1,009 | ||||||
| 9% senior secured notes due April 1, 2019 |
290 | 290 | ||||||
| 10.50% senior secured notes due March 1, 2021 |
1,384 | 1,384 | ||||||
| Unaccreted discount |
(21 | ) | (16 | ) | ||||
|
|
|
|
|
|||||
| 6,023 | 6,086 | |||||||
| Debt maturing within one year |
(32 | ) | (35 | ) | ||||
|
|
|
|
|
|||||
| Long-term debt |
$ | 5,991 | $ | 6,051 | ||||
|
|
|
|
|
|||||
Senior Secured Credit Facility
Prior to the fiscal 2013 refinancing transactions, the senior secured credit facility consisted of (a) a senior secured multi-currency revolver allowing for borrowings of up to $200 million, (b) term B-1 loans with an outstanding principal amount as of September 30, 2012 of $1,434 million, and (c) senior secured term B-3 loans (the “term B-3 loans”) with an outstanding principal amount as of September 30, 2012 of $2,152 million.
On October 29, 2012, Avaya Inc., Citibank, N.A. and the lenders party thereto entered into Amendment No. 4 to Credit Agreement pursuant to which the senior secured credit facility was amended and restated in its entirety (as so amended and restated, the “Cash Flow Credit Agreement”). The modified terms of the Cash Flow Credit Agreement included (1) an amendment which allowed Avaya Inc. to extend the maturity of a portion of the term B-1 loans representing outstanding principal amounts of $135 million from October 26, 2014 to October 26, 2017 by converting such loans into a new tranche of term B-4 loans, (2) permission to issue Incremental Replacement Secured Notes and Junior Secured Debt as described below under the heading “Senior Secured Asset-Based Credit Facility” (except, pursuant to the Cash Flow Credit Agreement, such Incremental
F-28
Table of Contents
Replacement Secured Notes and Junior Secured Debt must be secured by a lien on the Collateral (as defined in the Cash Flow Credit Agreement) ranking junior to the lien securing the obligations under the Cash Flow Credit Agreement) and (3) permission to issue indebtedness to refinance a portion of the term loans outstanding under the Cash Flow Credit Agreement and to secure such indebtedness by a lien on the Collateral (as defined in the Cash Flow Credit Agreement) ranking junior to the lien securing the obligations under the Cash Flow Credit Agreement, subject to certain other conditions and limitations set forth in the Cash Flow Credit Agreement.
On December 21, 2012, Avaya Inc., Citibank, N.A. and the lenders party thereto entered into Amendment No. 5 to Credit Agreement, pursuant to which the Cash Flow Credit Agreement was amended and restated in its entirety. The modified terms of the Cash Flow Credit Agreement included (1) an amendment which allowed Avaya Inc. to extend the maturity of $713 million aggregate principal amount of the outstanding term B-1 loans from October 26, 2014 to March 31, 2018 and $134 million aggregate principal amount of the outstanding term B-4 loans from October 26, 2017 to March 31, 2018, in each case, by converting such loans into a new tranche of term B-5 loans; and (2) permission to apply net proceeds from Credit Agreement Refinancing Indebtedness (as defined in the Cash Flow Credit Agreement) incurred or issued on December 21, 2012 to refinance, at Avaya Inc.’s election, any class or classes of senior secured term loans, including the new term B-5 loans.
Additionally, as discussed more fully below, on December 21, 2012, Avaya Inc. completed a private placement of $290 million of senior secured notes, the net proceeds of which were used to repay $284 million of term B-5 loans outstanding under the Cash Flow Credit Agreement. Funds affiliated with TPG were holders of $22 million of term B-5 loans repaid with the proceeds of the senior secured notes.
On February 13, 2013, Avaya Inc. and Citibank, N.A. and the lenders party thereto entered into Amendment No. 6 to Credit Agreement pursuant to which the Cash Flow Credit Agreement was amended. The modified terms of the Cash Flow Credit Agreement permitted Avaya Inc. to refinance all of its outstanding Old Notes with indebtedness secured by a lien on the Collateral (as defined in the Cash Flow Credit Agreement) ranking junior to the lien on the Collateral securing the obligations under the Cash Flow Credit Agreement, subject to certain other conditions and limitations set forth in the Cash Flow Credit Agreement.
On March 12, 2013, Avaya Inc., Citibank, N.A. and the lenders party thereto entered into Amendment No. 7 to Credit Agreement pursuant to which the Cash Flow Credit Agreement was amended. Pursuant to the amendment, Avaya Inc. refinanced in full all the outstanding term B-1 loans with the cash proceeds from the issuance of $589 million aggregate principal amount of term B-5 loans under the Cash Flow Credit Agreement.
The October 29, 2012, December 21, 2012 and February 13, 2013 amendments and restatements of the Cash Flow Credit Agreement represent debt modifications for accounting purposes. Accordingly, third party expenses of $6 million incurred in connection with the transactions were expensed as incurred and included in other income, net during fiscal 2013. Avaya’s financing sources that held term B-1 loans, term B-3 loans, term B-5 loans and/or revolving credit commitments under the Cash Flow Credit Agreement and consented to each amendment and restatement of the Cash Flow Credit Agreement received in aggregate a consent fee of $15 million. Fees paid to or on behalf of the holders of term loans in connection with the modification were recorded as a discount to the face value of the respective debt and are being accreted over the term of the debt as interest expense. Fees paid to or on behalf of the holders of the revolving credit commitments in connection with the modification were recorded as deferred debt issuance costs and are being amortized over the term of the debt as interest expense.
The March 12, 2013 amendment and restatement of the Cash Flow Credit Agreement was accounted for as a modification of debt to the extent the existing term B-1 loans were refinanced with term B-5 loans issued to the same creditor and an extinguishment of debt to the extent refinanced with term B-5 loans issued to a different creditor. Accordingly, for the portion accounted for as a debt extinguishment the difference between the reacquisition price and the carrying value of the term B-1 loans (including any unamortized discount and debt
F-29
Table of Contents
issue costs) of $3 million was recognized as a loss upon debt extinguishment during fiscal 2013. Third party expenses of $5 million associated with the issuance of the new term B-5 loans were capitalized and are being amortized over the term of the term B-5 loans. Third party expenses of $3 million associated with the modification of debt were expensed as incurred and included in other income, net during fiscal 2013.
On February 5, 2014, Avaya Inc., Citibank, N.A., and the lenders party thereto entered into Amendment No. 8 to Credit Agreement pursuant to which the Cash Flow Credit Agreement was amended. Pursuant to the amendment, Avaya Inc. refinanced in full all of the outstanding term B-5 loans with the cash proceeds from the issuance of $1,138 million aggregate principal balance of term B-6 loans under the Cash Flow Credit Agreement.
The February 5, 2014 amendment of the Cash Flow Credit Agreement was accounted for as a modification of debt to the extent the existing term B-5 loans were refinanced with term B-6 loans issued to the same creditor and an extinguishment of debt to the extent refinanced with term B-6 loans issued to a different creditor. Accordingly, for the portion accounted for as a debt extinguishment the difference between the reacquisition price (including a call premium required to be paid to the holders of the term B-5 loans) and the carrying value of the term B-5 loans (including any unamortized premium and debt issue costs) of $4 million was recognized as a loss upon debt extinguishment during fiscal 2014. Third party expenses of $2 million associated with the modification of debt were expensed as incurred and included in other income, net during fiscal 2014.
On May 15, 2014, Avaya Inc. borrowed $100 million under the senior secured multi-currency revolver, the proceeds of which were used to fund, in part, the redemption of the 10.125%/10.875% senior unsecured PIK toggle notes due 2015 and 9.75% senior unsecured cash-pay notes. During the quarter ended September 30, 2014, Avaya Inc. repaid $10 million of the borrowings under the senior secured multi-currency revolver. The borrowings bear interest at a rate per annum equal to a LIBOR rate plus an applicable margin, and are subject to the terms and conditions of the Cash Flow Credit Agreement. The senior secured multi-currency revolver allows for borrowings of up to $200 million, has a final maturity of October 26, 2016, includes capacity available for letters of credit and for short-term borrowings, and is available in euros in addition to dollars.
Subsequent to the fiscal 2014 refinancing transactions, the Cash Flow Credit Agreement consists of (a) a senior secured multi-currency revolver with borrowings as of September 30, 2014 of $90 million issued and outstanding and remaining availability of $110 million, (b) term B-3 loans with an outstanding principal amount as of September 30, 2014 of $2,102 million, (c) term B-4 loans with an outstanding principal amount as of September 30, 2014 of $1 million, and (d) term B-6 loans with an outstanding principal amount as of September 30, 2014 of $1,128 million. Borrowings are guaranteed by the Company and substantially all of Avaya Inc.’s U.S. subsidiaries. The Cash Flow Credit Agreement is secured by substantially all assets of Avaya Holdings Corp., Avaya Inc. and subsidiary guarantors.
The term B-3 loans, term B-4 loans and term B-6 loans each bear interest at a rate per annum equal to either a base rate (subject to a floor of 2.25% in the case of the term B-4 loans and 2.00% in the case of the term B-6 loans) or a LIBOR rate (subject to a floor of 1.25% in the case of the term B-4 loans and 1.00% in the case of the term B-6 loans), in each case plus an applicable margin. Subject to the floor described in the immediately preceding sentence the base rate is determined by reference to the higher of (1) the prime rate of Citibank, N.A. and (2) the federal funds effective rate plus 1/2 of 1%. The applicable margin for borrowings of term B-3 loans, term B-4 loans and term B-6 loans is 3.50%, 5.25% and 4.50% per annum, respectively, with respect to base rate borrowings and 4.50%, 6.25% and 5.50%, per annum, respectively, with respect to LIBOR borrowings. The applicable margin on the term B-4 loans and term B-6 loans is subject to increase pursuant to the Cash Flow Credit Agreement in connection with the making of certain refinancing, extended or replacement term loans under the Cash Flow Credit Agreement with an Effective Yield (as defined in the Cash Flow Credit Agreement) greater than the applicable Effective Yield payable in respect of the applicable loans at such time plus 50 basis points.
F-30
Table of Contents
During fiscal 2014 and 2013, Avaya Inc. paid $38 million and $38 million, respectively in aggregate quarterly principal payments on the senior secured term loans outstanding under the senior secured credit facility. In addition, Avaya Inc. is required to prepay outstanding term loans based on its annual excess cash flow, as defined in the senior secured credit facility. No such excess cash payment was required during fiscal 2014 and 2013 based on fiscal 2013 and 2012 cash flows, respectively.
In addition to paying interest on outstanding principal under the senior secured credit facility, Avaya Inc. is required to pay a commitment fee of 0.50% per annum in respect of unutilized commitments under the revolver portion of this facility.
Senior Unsecured Notes
Avaya Inc. issued senior unsecured cash-pay notes and senior unsecured PIK toggle notes, each due November 1, 2015. The interest rate for the cash-pay notes is fixed at 9.75% and the interest rates for the cash interest and PIK interest portions of the PIK-toggle notes are fixed at 10.125% and 10.875%, respectively. At the time of their issuance, the Company had $700 million and $750 million of cash-pay and PIK-toggle notes, respectively. Immediately prior to March 7, 2013, Avaya Inc. had $700 million and $834 million of cash-pay and PIK-toggle notes, respectively.
As discussed more fully below, on March 7, 2013, Avaya Inc. completed an exchange offer (the “Exchange Offer”) in which $1,384 million of Old Notes (including $642 million of senior unsecured cash-pay notes and $742 million of senior unsecured PIK toggle notes) were exchanged for 10.50% senior secured notes due 2021. The Exchange Offer represents a debt modification for accounting purposes. Accordingly, third party expenses of $9 million incurred in connection with the transaction were expensed as incurred and included in other income, net during fiscal 2014. Avaya Inc.’s financing sources that held the Old Notes that elected to exchange received a consent fee in aggregate of $4 million. Fees paid to or on behalf of the holders of the Old Notes in connection with the modification were recorded as a discount to the face value of the 10.50% senior secured notes due 2021 and are being accreted over the term of the debt as interest expense.
On May 15, 2014, Avaya Inc. redeemed 100% of the remaining aggregate principal amount of its 10.125%/10.875% senior unsecured PIK toggle notes due 2015 and 9.75% senior unsecured cash-pay notes due 2015 at a redemption price of 100% of the principal amount thereof, plus accrued and unpaid interest, or $92 million and $58 million, respectively. The redemption represents a debt extinguishment for accounting purposes. Accordingly, the difference between the reacquisition price and the carrying value of the 10.125%/10.875% senior unsecured PIK toggle notes due 2015 and 9.75% senior unsecured cash-pay notes (including any unamortized discount and debt issue costs) of $1 million was recognized as a loss upon debt extinguishment during fiscal 2014.
Senior Secured Asset-Based Credit Facility
Avaya Inc.’s senior secured multi-currency asset-based revolving credit facility allows for borrowings of up to $335 million, subject to availability under a borrowing base, of which $150 million may be in the form of letters of credit. The borrowing base at any time equals the sum of 85% of eligible accounts receivable plus 85% of the net orderly liquidation value of eligible inventory, subject to certain reserves and other adjustments. Avaya Inc. and substantially all of its U.S. subsidiaries are borrowers under this facility, and borrowings are guaranteed by Avaya Holdings Corp., Avaya Inc. and substantially all of Avaya Inc.’s U.S. subsidiaries. The facility is secured by substantially all assets of Avaya Holdings Corp., Avaya Inc. and the subsidiary guarantors. The senior secured multi-currency asset-based revolving credit facility also provides Avaya Inc. with the right to request up to $100 million of additional commitments under this facility.
On October 29, 2012 Avaya Inc., the several subsidiary borrowers (the “Subsidiary Borrowers”) party thereto, Citicorp USA, Inc. and the lenders party thereto entered into Amendment No. 2 to Credit Agreement, pursuant to which the senior secured multi-currency asset-based revolving credit facility was amended and restated in its entirety (as so amended and restated, the “ABL Credit Agreement”).
F-31
Table of Contents
The modified terms of the ABL Credit Agreement include permission to issue or incur, as applicable, secured indebtedness in the form of (1) one or more series of secured notes in lieu of any Revolving Commitment Increases (as defined in the ABL Credit Agreement) in an aggregate principal amount not to exceed $100 million, plus the amount by which unused Commitments (as defined in the ABL Credit Agreement) have been previously reduced pursuant to the ABL Credit Agreement, less the amount of all Revolving Commitment Increases effected at or prior to the time of issuance of such notes (“Incremental Replacement Secured Notes”), and (2) one or more series of secured notes or secured loans in an aggregate principal amount not to exceed $750 million (“Junior Secured Debt”). Any such Incremental Replacement Secured Notes or Junior Secured Debt (a) must be (x) issued or incurred, as applicable, in connection with a modification, refinancing, refunding, renewal, replacement, exchange or extension of senior unsecured indebtedness and (y) secured by a lien on the Collateral (as defined in the ABL Credit Agreement) ranking junior to the lien securing the obligations under the ABL Credit Agreement and (b) will be subject to certain other conditions and limitations set forth in the ABL Credit Agreement.
On February 13, 2013, Avaya Inc., the Subsidiary Borrowers, Citicorp USA, Inc. and the lenders party thereto entered into Amendment No. 3 to Credit Agreement pursuant to which the ABL Credit Agreement was amended. The modified terms of the ABL Credit Agreement permitted Avaya Inc. to refinance all of the its outstanding Old Notes with indebtedness secured by a lien on the Collateral (as defined in the ABL Credit Agreement) ranking junior to the lien on the Collateral securing the obligations under the ABL Credit Agreement, subject to certain other conditions and limitations set forth in the ABL Credit Agreement. Further, the terms of the amendment permit certain other obligations of Avaya Inc. and certain of its subsidiaries to be secured by the ABL Priority Collateral (as defined in the ABL Credit Agreement) on a junior-priority basis.
On May 15, 2014, Avaya Inc. borrowed $40 million under the senior secured multi-currency asset-based revolving credit facility, the proceeds of which were used to fund, in part, the redemption of the 10.125%/10.875% senior unsecured PIK toggle notes due 2015 and 9.75% senior unsecured cash-pay notes. Borrowings under the ABL Credit Agreement bear interest at a rate per annum equal to, at the Company’s option, either (a) a LIBOR rate plus a margin of 1.75% or (b) a base rate plus a margin of 0.75%. The interest rate election made on the May 15, 2014 borrowing was the LIBOR rate. Any principal amount outstanding under this facility is payable in full on October 26, 2016.
At September 30, 2014, there was $40 million of aggregate borrowings under this facility in addition to $79 million of issued and outstanding letters of credit, with aggregate remaining revolver availability of $207 million. At September 30, 2013 there were no borrowings under this facility in addition to $82 million of issued and outstanding letters of credit, with remaining availability of $228 million.
7% Senior Secured Notes
On February 11, 2011, Avaya Inc. completed a private placement of $1,009 million of senior secured notes (the “7% Senior Secured Notes”). The 7% Senior Secured Notes bear interest at a rate of 7% per annum, mature on April 1, 2019 and were sold at par through a private placement to qualified institutional buyers pursuant to Rule 144A (and outside the United States in reliance on Regulation S) under the Securities Act of 1933, as amended (the “Securities Act”) and have not been, and will not be, registered under the Securities Act or applicable state or foreign securities laws.
Avaya Inc. may redeem the 7% Senior Secured Notes commencing April 1, 2015 at 103.5% of the principal amount redeemed, which decreases to 101.75% on April 1, 2016 and to 100% on or after April 1, 2017. Avaya Inc. may redeem all or part of the notes at any time prior to April 1, 2015 at 100% of the principal amount redeemed plus a “make-whole” premium. In addition, Avaya Inc. may redeem up to 35% of the original aggregate principal balance of the 7% Senior Secured Notes at any time prior to April 1, 2014 with the net proceeds of certain equity offerings at 107% of the aggregate principal amount of 7% Senior Secured Notes redeemed. Upon the occurrence of specific kinds of changes of control, Avaya Inc. will be required to make an
F-32
Table of Contents
offer to purchase the 7% Senior Secured Notes at 101% of their principal amount. If Avaya Inc. or any of its restricted subsidiaries engages in certain asset sales, under certain circumstances Avaya Inc. will be required to use the net proceeds to make an offer to purchase the 7% Senior Secured Notes at 100% of their principal amount.
Substantially all of Avaya Inc.’s U.S. 100%-owned subsidiaries are guarantors of the 7% Senior Secured Notes. The 7% Senior Secured Notes are secured by substantially all of the assets of Avaya Inc. and the subsidiary guarantors (other than with respect to real estate). The notes and the guarantees are secured equally and ratably with the Cash Flow Credit Agreement and any future first lien obligations by (i) a first-priority lien on substantially all of Avaya Inc.’s and the guarantors’ assets, other than (x) any real estate and (y) collateral that secures the ABL Credit Agreement on a first-priority basis (the “ABL Priority Collateral”), and (ii) a second-priority lien on the ABL Priority Collateral, in each case, subject to certain customary exceptions.
9% Senior Secured Notes
On December 21, 2012, Avaya Inc. completed a private placement of $290 million of senior secured notes (the “9% Senior Secured Notes”). The 9% Senior Secured Notes bear interest at a rate of 9% per annum, mature on April 1, 2019, and were sold at par through a private placement to qualified institutional buyers pursuant to Rule 144A (and outside the United States in reliance on Regulation S) under the Securities Act. The 9% Senior Secured Notes have not been, and will not be, registered under the Securities Act or applicable state or foreign securities laws and may not be offered or sold absent registration under the Securities Act or applicable state or foreign securities laws or applicable exemptions from registration requirements.
The 9% Senior Secured Notes are redeemable commencing April 1, 2015 at 104.5% of the principal amount redeemed, which decreases to 102.25% on April 1, 2016 and to 100% on or after April 1, 2017. Avaya Inc. may redeem all or part of the notes at any time prior to April 1, 2015 at 100% of the principal amount redeemed plus a “make-whole” premium, as defined in the indenture governing the 9% Senior Secured Notes. In addition, Avaya Inc. may redeem up to 35% of the original aggregate principal balance of the 9% Senior Secured Notes at any time prior to April 1, 2015 with the net proceeds of certain equity offerings at 109% of the aggregate principal amount redeemed. Upon the occurrence of specific kinds of changes of control, Avaya Inc. will be required to make an offer to purchase the 9% Senior Secured Notes at 101% of their principal amount. If Avaya Inc. or any of its restricted subsidiaries engages in certain asset sales, under certain circumstances Avaya Inc. will be required to use the net proceeds to make an offer to purchase the 9% Senior Secured Notes at 100% of their principal amount.
The 9% Senior Secured Notes are secured by substantially all of the assets of Avaya Inc. and substantially all of Avaya Inc.’s U.S. 100%-owned subsidiaries (other than with respect to real estate). The notes and the guarantees are secured equally and ratably with the Cash Flow Credit Agreement, the 7% Senior Secured Notes due 2019 and any future first lien obligations by (i) a first-priority lien on substantially all of the Avaya Inc. and the guarantors’ assets, other than (x) any real estate and (y) collateral that secures the ABL Credit Agreement on a first-priority basis (the “ABL Priority Collateral”), and (ii) a second-priority lien on the ABL Priority Collateral, in each case, subject to certain customary exceptions.
The proceeds from the 9% Senior Secured Notes were used to repay $284 million aggregate principal amount of term B-5 loans and to pay related fees and expenses. In connection with the issuance of the 9% Senior Secured Notes, Avaya Inc. capitalized financing costs of $7 million during fiscal 2013 and is amortizing these costs over the term of the 9% Senior Secured Notes.
The repayment of the term B-5 loans was accounted for as an extinguishment of debt. Accordingly the difference between the reacquisition price and the carrying value of the term B-5 loans (including unamortized debt issue costs) of $3 million was recognized as a loss upon debt extinguishment during fiscal 2013.
F-33
Table of Contents
10.50% Senior Secured Notes
On March 7, 2013, Avaya Inc. completed an Exchange Offer in which $1,384 million of Old Notes were exchanged for $1,384 million of senior secured notes due 2021 (the “10.50% Senior Secured Notes”). The 10.50% Senior Secured Notes were issued at par, bear interest at a rate of 10.50% per annum and mature on March 1, 2021. The 10.50% Senior Secured Notes have not been, and will not be, registered under the Securities Act or applicable state or foreign securities laws and may not be offered or sold absent registration under the Securities Act or applicable state or foreign securities laws or applicable exemptions from registration requirements.
The 10.50% Senior Secured Notes are redeemable commencing March 1, 2017 at 107.875% of the principal amount redeemed, which decreases to 105.250% on March 1, 2018, to 102.625% on March 1, 2019 and to 100% on or after March 1, 2020. Avaya Inc. may redeem all or part of the notes at any time prior to March 1, 2017 at 100% of the principal amount redeemed plus a “make-whole” premium. In addition, Avaya Inc. may redeem up to 35% of the original aggregate principal balance of the notes at any time prior to March 1, 2016 with the net proceeds of certain equity offerings at 110.5% of the aggregate principal amount redeemed. Upon the occurrence of specific kinds of changes of control, Avaya Inc. will be required to make an offer to purchase the 10.50% Senior Secured Notes at 101% of their principal amount. If Avaya Inc. or any of its restricted subsidiaries engages in certain asset sales, under certain circumstances Avaya Inc. will be required to use the net proceeds to make an offer to purchase the 10.50% Senior Secured Notes at 100% of their principal amount.
The 10.50% Senior Secured Notes are secured by substantially all of the assets of Avaya Inc. and substantially all of Avaya Inc.’s U.S. 100%-owned subsidiaries (other than with respect to real estate). The notes and the corresponding guarantees are secured on a junior priority basis to Avaya Inc.’s ABL Credit Agreement, Avaya Inc.’s Cash Flow Credit Agreement, Avaya Inc.’s existing 7% Senior Secured Notes due 2019, Avaya Inc.’s existing 9% Senior Secured Notes due 2019 and any future senior obligations by a junior priority lien on substantially all of Avaya Inc. and the guarantors’ assets, other than any real estate.
Avaya Inc.’s Cash Flow Credit Agreement, ABL Credit Agreement, and indentures governing its notes contain a number of covenants that, among other things and subject to certain exceptions, restrict Avaya Inc.’s ability and the ability of certain of its subsidiaries to: (a) incur or guarantee additional debt and issue or sell certain preferred stock; (b) pay dividends on, redeem or repurchase capital stock; (c) make certain acquisitions or investments; (d) incur or assume certain liens; (e) enter into transactions with affiliates; (f) merge or consolidate with another company; (g) transfer or otherwise dispose of assets; (h) redeem subordinated debt; (i) incur obligations that restrict the ability of its subsidiaries to make dividends or other payments to Avaya Holdings Corp. or Avaya Inc.; and (j) create or designate unrestricted subsidiaries. They also contain customary affirmative covenants and events of default. As of September 30, 2014 and September 30, 2013, Avaya Inc. was not in default under any of these agreements.
The weighted average interest rate of the Company’s outstanding debt as of September 30, 2014 and 2013 was 6.9% and 7.4%, respectively.
Annual maturities of long-term debt (excluding unaccreted discount of $21 million), for the next five years ending September 30 and thereafter, consist of:
| In millions |
||||
| 2015 |
$ | 38 | ||
| 2016 |
39 | |||
| 2017 |
168 | |||
| 2018 |
3,116 | |||
| 2019 |
1,299 | |||
| 2020 and thereafter |
1,384 | |||
|
|
|
|||
| $ | 6,044 | |||
|
|
|
|||
F-34
Table of Contents
Capital Lease Obligations
Included in other liabilities is $59 million and $21 million of capital lease obligations as of September 30, 2014 and 2013, respectively.
On August 20, 2014, the Company entered into an agreement to outsource certain delivery services associated with the Avaya Private Cloud Services business. That agreement also included the sale of specified assets owned by the Company for $40 million, which are being leased-back by Avaya and accounted for as a capital lease. Additionally, under the terms of the agreement, additional financings are available to Avaya and its subsidiaries of up to $24 million per year for the sole purpose of financing the use of equipment for the performance of services under the agreement until the expiration or termination of the agreement, provided that no material adverse change with respect to the Company has occurred or is continuing as of the date any such financing is requested.
11. Derivatives and Other Financial Instruments
Interest Rate Swaps
From time to time, the Company has entered into interest rate swap agreements to manage the amount of its floating rate debt in order to reduce its exposure to variable rate interest payments associated with certain borrowings under the Cash Flow Credit Agreement. As of September 30, 2013 each of these agreements has reached maturity and there are no outstanding interest rate swap agreements.
The fair value of each interest rate swap that is designated and qualifies as a cash flow hedge under ASC 815 is reflected as an asset or liability in the Consolidated Balance Sheets, reported as a component of other comprehensive income (loss) and reclassified to earnings in the same period or periods during which the hedged transaction affects earnings. Gains and losses on derivative instruments representing hedge ineffectiveness are recognized in current earnings. The fair value of each interest rate swap is estimated as the net present value of their projected cash flows at the balance sheet date.
The following table summarizes the (gains) and losses of the interest rate contracts qualifying and designated as cash flow hedging instruments:
| Fiscal years ended September 30, |
||||||||
| In millions |
2013 | 2012 | ||||||
| (Gain) loss on interest rate swaps |
||||||||
| Recognized in other comprehensive loss |
$ | (13 | ) | $ | (18 | ) | ||
|
|
|
|
|
|||||
| Reclassified from accumulated other comprehensive loss into interest expense |
$ | 13 | $ | 25 | ||||
|
|
|
|
|
|||||
| Recognized in operations (ineffective portion) |
$ | — | $ | — | ||||
|
|
|
|
|
|||||
Foreign Currency Forward Contracts
The Company utilizes foreign currency forward contracts primarily to manage short-term exchange rate exposures on certain receivables, payables and intercompany loans residing on foreign subsidiaries’ books, which are denominated in currencies other than the subsidiary’s functional currency. When those items are revalued into the subsidiaries’ functional currencies at the month-end exchange rates, the fluctuations in the exchange rates are recognized in the Consolidated Statements of Operations as other (expense) income, net. Changes in the fair value of the Company’s foreign currency forward contracts used to offset these exposed items are also recognized in the Consolidated Statements of Operations as other (expense) income, net in the period in which the exchange rates change.
F-35
Table of Contents
The losses of the foreign currency forward contracts included in other (expense) income, net were $4 million, $10 million, and $4 million for fiscal 2014, 2013, and 2012, respectively.
The notional amount of the Company’s financial instruments represents the face amount of the contractual arrangements and the basis on which U.S. dollars are to be exchanged. It is not a measure of market or credit exposure. The following table summarizes these notional amounts that principally represent the equivalent in U.S. dollars for contracts in their respective currencies:
| September 30, | ||||||||
| In millions |
2014 |
2013 |
||||||
| Indian rupee |
$ | 66 | $ | 38 | ||||
| Japanese yen |
28 | 22 | ||||||
| Euros |
21 | 14 | ||||||
| Swiss franc |
10 | 11 | ||||||
| British pound sterling |
19 | 11 | ||||||
| Chinese yuan |
24 | 7 | ||||||
| All other foreign currencies |
55 | 46 | ||||||
|
|
|
|
|
|||||
| $ | 223 | $ | 149 | |||||
|
|
|
|
|
|||||
Preferred Series B Embedded Derivative
As discussed more fully in Note 16 “Capital Stock”, the Company has issued preferred series B containing certain features which are considered an embedded derivative under generally accepted accounting principles. This embedded derivative was separated from the host contract (i.e. the preferred stock) and recognized as a current liability on the Consolidated Balance Sheet at fair value. When the embedded derivative is revalued at each balance sheet date, the changes in the fair value are recognized in the Consolidated Statement of Operations as other income (expense), net. In fiscal 2014, 2013 and 2012, the loss on the preferred series B embedded derivative included in other income (expense), net was $22 million, $11 million and $6 million, respectively.
The following table summarizes the estimated fair value of derivatives:
| In millions |
September 30, 2014 | September 30, 2013 | ||||||||||||||||||||||
| Balance Sheet Location |
Total | Foreign Currency Forward Contracts |
Series B Preferred Embedded Derivative |
Total | Foreign Currency Forward Contracts |
Series B Preferred Embedded Derivative |
||||||||||||||||||
| Other current assets |
$ | — | $ | — | $ | — | $ | 1 | $ | 1 | $ | — | ||||||||||||
| Other current liabilities |
$ | (51 | ) | (2 | ) | (49 | ) | (27 | ) | — | (27 | ) | ||||||||||||
|
|
|
|
|
|
|
|
|
|
|
|
|
|||||||||||||
| Net Liability |
$ | (51 | ) | $ | (2 | ) | $ | (49 | ) | $ | (26 | ) | $ | 1 | $ | (27 | ) | |||||||
|
|
|
|
|
|
|
|
|
|
|
|
|
|||||||||||||
12. Fair Value Measures
Pursuant to the accounting guidance for fair value measurements and its subsequent updates, fair value is defined as the price that would be received from selling an asset or paid to transfer a liability in an orderly transaction between market participants at the measurement date. When determining the fair value measurements for assets and liabilities required or permitted to be recorded at fair value, the Company considers the principal or most advantageous market in which it would transact and it considers assumptions that market participants would use when pricing the asset or liability.
F-36
Table of Contents
Fair Value Hierarchy
The accounting guidance for fair value measurements also requires an entity to maximize the use of observable inputs and minimize the use of unobservable inputs when measuring fair value. A financial instrument’s categorization within the fair value hierarchy is based upon the lowest level of input that is significant to the fair value measurement. The inputs are prioritized into three levels that may be used to measure fair value:
Level 1: Inputs that reflect quoted prices for identical assets or liabilities in active markets that are observable.
Level 2: Inputs that reflect quoted prices for similar assets or liabilities in active markets; quoted prices for identical or similar assets or liabilities in markets that are not active; or model-derived valuations in which significant inputs are observable or can be derived principally from, or corroborated by, observable market data.
Level 3: Inputs that are unobservable to the extent that observable inputs are not available for the asset or liability at the measurement date.
Asset and Liabilities Measured at Fair Value on a Recurring Basis
Assets and liabilities measured at fair value on a recurring basis as of September 30, 2014 and 2013 were as follows:
| September 30, 2014 | ||||||||||||||||
| Fair Value Measurements Using | ||||||||||||||||
| In millions |
Total | Quoted Prices in Active Markets for Identical Instruments (Level 1) |
Significant Other Observable Inputs (Level 2) |
Significant Unobservable Inputs (Level 3) |
||||||||||||
| Other Non-Current Assets: |
||||||||||||||||
| Investments |
$ | 1 | $ | 1 | $ | — | $ | — | ||||||||
|
|
|
|
|
|
|
|
|
|||||||||
| Other Current Liabilities: |
||||||||||||||||
| Preferred series B embedded derivative |
$ | 49 | $ | — | $ | — | $ | 49 | ||||||||
| Foreign currency forward contracts |
2 | — | 2 | — | ||||||||||||
|
|
|
|
|
|
|
|
|
|||||||||
| $ | 51 | $ | — | $ | 2 | $ | 49 | |||||||||
|
|
|
|
|
|
|
|
|
|||||||||
| September 30, 2013 | ||||||||||||||||
| Fair Value Measurements Using | ||||||||||||||||
| In millions |
Total | Quoted Prices
in Active Markets for Identical Instruments (Level 1) |
Significant Other Observable Inputs (Level 2) |
Significant Unobservable Inputs (Level 3) |
||||||||||||
| Other Current Assets: |
||||||||||||||||
| Foreign currency forward contracts |
$ | 1 | $ | — | $ | 1 | $ | — | ||||||||
|
|
|
|
|
|
|
|
|
|||||||||
| Other Non-Current Assets: |
||||||||||||||||
| Investments |
$ | 2 | $ | 1 | $ | 1 | $ | — | ||||||||
|
|
|
|
|
|
|
|
|
|||||||||
| Other Current Liabilities: |
||||||||||||||||
| Preferred Series B embedded derivative |
$ | 27 | $ | — | $ | — | $ | 27 | ||||||||
|
|
|
|
|
|
|
|
|
|||||||||
Foreign Currency Forward Contracts
Foreign currency forward contracts classified as Level 2 assets and liabilities are priced using quoted market prices for similar assets or liabilities in active markets.
F-37
Table of Contents
Investments
Investments classified as Level 2 assets and liabilities are priced using quoted market prices for identical assets which are subject to infrequent transactions (i.e. a less active market).
Preferred Series B Embedded Derivative
The preferred series B embedded derivative classified as a Level 3 liability is priced by calculating the difference in the fair value of the preferred series B with and without the aggregated embedded features. To estimate the fair value of the preferred series B a Binomial Lattice model was used. Significant inputs into the binomial lattice model include the total equity value of the Company, risk-free rate, volatility, and expected term.
The following table presents the changes in the fair value of the preferred series B embedded derivative for fiscal 2013 and 2014.
| In millions |
Preferred Series B Embedded Derivative |
|||
| Balance as of October 1, 2012 |
$ | 16 | ||
| Change in fair value |
11 | |||
|
|
|
|||
| Balance as of September 30, 2013 |
27 | |||
| Change in fair value |
22 | |||
|
|
|
|||
| Balance as of September 30, 2014 |
$ | 49 | ||
|
|
|
|||
Assets and Liabilities Measured at Fair Value on a Nonrecurring Basis
During the three months ended March 31, 2013, the Company performed an impairment test of goodwill for the ITPS reporting unit. Using level 3 inputs, the Company estimated the implied fair value of its goodwill to be $44 million as compared with a carrying value of $133 million and recorded an impairment to goodwill of $89 million. Refer to Note 5, “Divestiture of Government IT Professional Services Business,” for further discussion of the Company’s ITPS reporting unit accounted for as a discontinued operation. No other assets and liabilities were measured at fair value on a nonrecurring basis during fiscal 2014 or 2013.
Fair Value of Financial Instruments
The fair values of cash and cash equivalents, accounts receivable, accounts payable and accrued expenses, to the extent the underlying liability will be settled in cash, approximate carrying values because of the short-term nature of these instruments.
The estimated fair value of the amounts borrowed under Avaya Inc.’s revolving credit facilities at September 30, 2014 were estimated based on a Level 2 input using discounted cash flow techniques. Significant inputs to the discounted cash flow model include projected future cash flows based on projected LIBOR rates, and the average margin for companies with similar credit ratings and similar maturities. The estimated fair values of all other amounts borrowed under the Company’s financing arrangements at September 30, 2014 and September 30, 2013 were estimated based on a Level 2 input using quoted market prices for Avaya Inc.’s debt which is subject to infrequent transactions (i.e. a less active market).
F-38
Table of Contents
The estimated fair values of the amounts borrowed under Avaya Inc.’s credit agreements at September 30, 2014 and September 30, 2013 are as follows:
| September 30, 2014 | September 30, 2013 | |||||||||||||||
| In millions |
Principal Amount |
Fair Value |
Principal Amount |
Fair Value |
||||||||||||
| 9.75% senior unsecured cash pay notes due November 1, 2015 |
$ | — | $ | — | $ | 58 | $ | 57 | ||||||||
| 10.125%/10.875% senior unsecured PIK toggle notes due November 1, 2015 |
— | — | 92 | 91 | ||||||||||||
| Variable rate senior secured multi-currency asset-based revolving credit facility due October 26, 2016 |
40 | 38 | — | — | ||||||||||||
| Variable rate senior secured multi-currency revolver due October 26, 2016 |
90 | 86 | — | — | ||||||||||||
| Variable rate senior secured term B-3 loans due October 26, 2017 |
2,102 | 2,002 | 2,127 | 1,898 | ||||||||||||
| Variable rate senior secured term B-4 loans due October 26, 2017 |
1 | 1 | 1 | 1 | ||||||||||||
| Variable rate senior secured term B-5 loans due March 31, 2018 |
— | — | 1,141 | 1,078 | ||||||||||||
| Variable rate senior secured term B-6 loans due March 31, 2018 |
1,128 | 1,116 | — | — | ||||||||||||
| 7% senior secured notes due April 1, 2019 |
1,009 | 975 | 1,009 | 941 | ||||||||||||
| 9% senior secured notes due April 1, 2019 |
290 | 294 | 290 | 281 | ||||||||||||
| 10.50% senior secured notes due March 1, 2021 |
1,384 | 1,204 | 1,384 | 1,110 | ||||||||||||
|
|
|
|
|
|
|
|
|
|||||||||
| Total |
$ | 6,044 | $ | 5,716 | $ | 6,102 | $ | 5,457 | ||||||||
|
|
|
|
|
|
|
|
|
|||||||||
13. Income Taxes
The (provision for) benefit from income taxes of continuing operations is comprised of U.S. federal, state and foreign income taxes. A reconciliation of the Company’s loss from continuing operations before income taxes at the U.S. federal statutory rate to the (provision for) benefit from income taxes of continuing operations is as follows:
| Fiscal years ended September 30, |
||||||||||||
| In millions |
2014 | 2013 | 2012 | |||||||||
| Income tax benefit computed at the U.S. federal statutory rate of 35% |
$ | 93 | $ | 123 | $ | 130 | ||||||
| State and local income taxes, net of federal income tax effect |
10 | 29 | 3 | |||||||||
| Tax differentials on foreign earnings |
(26 | ) | (27 | ) | 6 | |||||||
| Taxes on unremitted foreign earnings and profits |
26 | (22 | ) | (51 | ) | |||||||
| Adjustment to deferred taxes |
29 | — | 9 | |||||||||
| Audit settlements |
2 | (21 | ) | (18 | ) | |||||||
| Credits and other taxes |
(13 | ) | (10 | ) | — | |||||||
| Rate changes |
(6 | ) | (5 | ) | — | |||||||
| U.S. tax on foreign source income |
(29 | ) | (23 | ) | (20 | ) | ||||||
| Other differences—net |
4 | 4 | — | |||||||||
| Valuation allowance |
(141 | ) | (13 | ) | (55 | ) | ||||||
|
|
|
|
|
|
|
|||||||
| (Provision for) benefit from income taxes of continuing operations |
$ | (51 | ) | $ | 35 | $ | 4 | |||||
|
|
|
|
|
|
|
|||||||
F-39
Table of Contents
The following table presents the U.S. and foreign components of loss from continuing operations before income taxes and the (provision for) benefit from income taxes of continuing operations:
| Fiscal years ended September 30, |
||||||||||||
| In millions |
2014 | 2013 | 2012 | |||||||||
| LOSS FROM CONTINUING OPERATIONS BEFORE INCOME TAXES: |
||||||||||||
| U.S. |
$ | (195 | ) | $ | (308 | ) | $ | (223 | ) | |||
| Foreign |
(69 | ) | (46 | ) | (149 | ) | ||||||
|
|
|
|
|
|
|
|||||||
| Loss from continuing operations before income taxes |
$ | (264 | ) | $ | (354 | ) | $ | (372 | ) | |||
|
|
|
|
|
|
|
|||||||
| (PROVISION FOR) BENEFIT FROM INCOME TAXES OF CONTINUING OPERATIONS: |
||||||||||||
| CURRENT |
||||||||||||
| Federal |
$ | 1 | $ | (1 | ) | $ | — | |||||
| State and local |
10 | 1 | (2 | ) | ||||||||
| Foreign |
(40 | ) | (66 | ) | (43 | ) | ||||||
|
|
|
|
|
|
|
|||||||
| (29 | ) | (66 | ) | (45 | ) | |||||||
|
|
|
|
|
|
|
|||||||
| DEFERRED |
||||||||||||
| Federal |
(12 | ) | 81 | 50 | ||||||||
| State and local |
(1 | ) | 18 | 6 | ||||||||
| Foreign |
(9 | ) | 2 | (7 | ) | |||||||
|
|
|
|
|
|
|
|||||||
| (22 | ) | 101 | 49 | |||||||||
|
|
|
|
|
|
|
|||||||
| (Provision for) benefit from income taxes of continuing operations |
$ | (51 | ) | $ | 35 | $ | 4 | |||||
|
|
|
|
|
|
|
|||||||
The components of deferred tax assets and liabilities as of September 30, 2014 and 2013 are as follows:
| September 30, | ||||||||
| In millions |
2014 | 2013 | ||||||
| DEFERRED INCOME TAX ASSETS: |
||||||||
| Benefit obligations |
$ | 667 | $ | 646 | ||||
| Accrued liabilities |
— | 89 | ||||||
| Net operating losses / credit carryforwards |
1,221 | 1,151 | ||||||
| Property, plant and equipment |
34 | 49 | ||||||
| Other |
— | 3 | ||||||
| Valuation allowance |
(1,639 | ) | (1,508 | ) | ||||
|
|
|
|
|
|||||
| Gross deferred income tax assets |
283 | 430 | ||||||
|
|
|
|
|
|||||
| DEFERRED INCOME TAX LIABILITIES: |
||||||||
| Goodwill and intangible assets |
(346 | ) | (432 | ) | ||||
| Other |
(19 | ) | (19 | ) | ||||
| Accrued liabilities |
(94 | ) | (130 | ) | ||||
|
|
|
|
|
|||||
| Gross deferred income tax liabilities |
(459 | ) | (581 | ) | ||||
|
|
|
|
|
|||||
| Net deferred income tax liabilities |
$ | (176 | ) | $ | (151 | ) | ||
|
|
|
|
|
|||||
During fiscal 2014 the Company recorded immaterial corrections to the prior year disclosure of deferred income tax assets and liabilities resulting in a decrease to deferred income tax assets of $38 million associated with net operating losses, an increase to deferred income tax liabilities of $43 million associated with impairment recaptures, a decrease to deferred income tax assets of $21 million associated with benefit obligations and corresponding decreases to the related valuation allowance of $102 million. The correction had no impact on the
F-40
Table of Contents
Consolidated Statement of Operations, Consolidated Balance Sheet, or Consolidated Statement of Cash Flows. In addition to the revised table above, the effective tax rate table was revised appropriately for the same components.
In addition, during the third quarter of fiscal 2014 and the fourth quarter of fiscal 2012, the Company recorded corrections to prior period deferred tax assets and liabilities for certain non-U.S. legal entities. These adjustments decreased the provision for income taxes of continuing operations by $6 million and $9 million in fiscal 2014 and 2012, respectively. Prior to these adjustments the Company’s provision for income taxes of continuing operations was $57 million for the year ended September 30, 2014 and $5 million for the year ended September 30, 2012. The Company evaluated each correction in relation to the quarter and fiscal year in which it was recorded, as well as the periods in which the adjustment originated, and concluded that each adjustment was not material to the current period or any prior quarter or year.
As of September 30, 2014, the Company had tax-effected net operating loss (“NOL”) carryforwards of $1,143 million, comprised of $595 million for U.S. federal, state and local taxes and $548 million for foreign taxes, including $215 million and $287 million in Germany and Luxembourg, respectively. U.S. federal and state NOL carryforwards expire through the year 2023, with the majority expiring in excess of 8 years. The majority of foreign NOL carryforwards have no expiration. Additionally, the Company has various other tax credit carry-forwards totaling $78 million, of which $54 million expire within 5 to 15 years while the remaining have no expiration.
As a result of the Merger in October 2007, a significant change in the ownership of the Company occurred which, pursuant to Section 382 of the Internal Revenue Code, will limit on an annual basis the Company’s ability to utilize its pre-Merger U.S. federal NOLs and U.S. federal tax credits. The Company’s NOLs and credits will continue to be available to offset taxable income and tax liabilities (until such NOLs and credits are either used or expire) subject to the Section 382 annual limitation. If the annual limitation amount is not fully utilized in a particular tax year, then the unused portion from that particular tax year will be added to the annual limitation in subsequent years. On June 9, 2011, the Company filed with the Securities and Exchange Commission a registration statement on Form S-1 (as updated from time to time) relating to a proposed initial public offering of its common stock. The Company does not believe that this share issuance will itself, or when aggregated with other prior shareholder ownership changes during the applicable testing period, cause an ownership change that would further limit, on an annual basis, its ability to utilize its current U.S. federal net operating losses and U.S. federal tax credits. Under German tax law any change in excess of 25% would limit the amount of NOL carryforward available for use in future periods. Depending on market conditions, share issuance related to a proposed initial public offering may result in an ownership change under German law that would limit our ability to utilize our current German NOL carryforward.
At September 30, 2014, the valuation allowance of $1,639 million is comprised of $1,068 million, $296 million, $224 million and $51 million related to the U.S., Germany, Luxembourg, and other foreign subsidiaries, respectively. In assessing the realization of deferred tax assets, the Company considers whether it is more likely than not that some portion or all of the deferred tax assets will not be realized. Primarily as a result of significant book taxable losses incurred subsequent to the Merger, the Company’s deferred tax assets exceed its deferred tax liabilities, exclusive of the U.S. deferred tax liabilities associated with indefinite-lived intangible assets. The Company is in a three-year cumulative book taxable loss position in the U.S and other significant tax jurisdictions and expects to continue to incur significant interest expense related to its debt and amortization and depreciation expense associated with the Merger and acquisition of NES.
The Company considered the scheduled reversal of deferred tax assets and liabilities, projected future taxable income, and certain tax planning strategies in assessing the realization of its deferred tax assets. Based on this assessment, the Company determined that it is more likely than not that the deferred tax assets in certain significant jurisdictions, including the U.S., Canada, Ireland, Germany, Luxembourg, Spain and France, will not be realized to the extent they exceed the scheduled reversal of deferred tax liabilities.
F-41
Table of Contents
In fiscal 2014, 2013, and 2012 the increase (decrease) in the Company’s valuation allowance was $131 million, $53 million, and $83 million, respectively. The changes to the valuation allowance are associated with the changes in the Company’s deferred tax assets primarily as a result of additional NOLs and the tax effects related to other comprehensive income. In fiscal 2013, and 2012, as a result of the charges to other comprehensive income for these tax effects the Company recognized an income tax benefit of continuing operations in the Consolidated Statement of Operations and less valuation allowance was required against the Company’s deferred tax assets. In fiscal 2014, the increase in the Company’s valuation allowance is partially offset by the immaterial correction to the prior year disclosure discussed above. The recognition of valuation allowances will continue to adversely affect the Company’s effective income tax rate.
As of September 30, 2012, the Company changed its indefinite reinvestment of undistributed foreign earnings assertion with respect to its non-U.S. subsidiaries. As of September 30, 2014, the Company has an outside basis difference of $389 million with a deferred tax liability of $61 million with respect to earnings and profits of $114 million. The Company is permanently reinvested on the remaining basis difference and estimates the unrecorded deferred tax liability to be approximately $106 million. During fiscal 2014, the Company recorded a reduction to its deferred tax liability of $33 million related to foreign earnings and profits which was offset by an increase in valuation allowance.
Included in noncurrent liabilities at September 30, 2014 is $257 million of unrecognized tax benefits (“UTBs”) associated with uncertain tax positions and an additional $22 million of accrued interest and penalties related to these amounts. The Company estimates that approximately $101 million of UTBs would affect the effective tax rate if recognized. At this time, the Company is unable to make a reasonably reliable estimate of the timing of payments in connection with these tax liabilities. The Company’s policy is to include interest and penalties related to its uncertain tax positions within the (provision for) benefit from income taxes. Included in the (provision for) benefit from income taxes of continuing operations in fiscal 2014, 2013 and 2012 is interest expense of $2 million, $1 million and $2 million, respectively. The Company files corporate income tax returns with the federal government in the U.S. and with multiple U.S. state and local jurisdictions and non-U.S. tax jurisdictions. In the ordinary course of business these income tax returns will be examined by the tax authorities. The Internal Revenue Service has concluded its examination of the Company’s U.S. federal income tax returns for fiscal years ended September 30, 2007, 2008 and 2009, including the period from October 1, 2007 through October 26, 2007. The settlement had an inconsequential impact on the benefit from income taxes of continuing operations for fiscal 2012. Various state, local, and foreign income tax returns, such as the Italy, Sweden, and Ireland, are under examination by taxing authorities for tax years ranging from 2001 through 2013. It is reasonably possible that the total amount of UTB will increase or decrease in the next 12 months as a result of these examinations; however, quantification of an estimated range cannot be made at this time.
F-42
Table of Contents
The following table summarizes the changes in the gross UTB liability for fiscal 2014, 2013 and 2012:
| In millions |
||||
| Gross UTB balance at October 1, 2011 |
$ | 224 | ||
| Additions based on tax positions relating to the period |
27 | |||
| Additions based on tax positions relating to prior periods |
(1 | ) | ||
| Settlements with taxing authorities |
(4 | ) | ||
| Statute of limitations expirations |
(1 | ) | ||
|
|
|
|||
| Gross UTB balance at September 30, 2012 |
245 | |||
| Additions based on tax positions relating to the period |
21 | |||
| Change to tax positions relating to prior periods |
4 | |||
| Settlements with taxing authorities |
(1 | ) | ||
| Statute of limitations expirations |
(5 | ) | ||
|
|
|
|||
| Gross UTB balance at September 30, 2013 |
264 | |||
| Additions based on tax positions relating to the period |
23 | |||
| Change to tax positions relating to prior periods |
(27 | ) | ||
| Statute of limitations expirations |
(3 | ) | ||
|
|
|
|||
| Gross UTB balance at September 30, 2014 |
$ | 257 | ||
|
|
|
|||
14. Benefit Obligations
Pension, Postretirement and Postemployment Benefits
The Company sponsors non-contributory defined benefit pension plans covering a portion of its U.S. employees and retirees, and postretirement benefit plans covering a portion of its U.S. retirees that include healthcare benefits and life insurance coverage. Certain non-U.S. operations have various retirement benefit programs covering substantially all of their employees. Some of these programs are considered to be defined benefit pension plans for accounting purposes.
The Company froze benefit accruals and additional participation in the pension and postretirement plans for its U.S. management employees effective December 31, 2003. The Company also amended the postretirement plan for its U.S. management employees effective January 1, 2013, to terminate retiree dental coverage and to cease providing medical and prescription drug coverage to a retiree, dependent, or lawful spouse who has attained age 65. On July 14, 2014, the Company approved an amendment to the postretirement plan for its U.S. management employees effective January 1, 2015, which reduces the Company’s maximum contribution toward the cost of providing benefits under the plan. The impact of the plan amendment was a $3 million reduction to the accumulated postretirement benefit obligation as of July 31, 2014.
Effective November 25, 2013 and January 31, 2014, the Company entered into a two-year contract extension with the Communications Workers of America (“CWA”) and the International Brotherhood of Electrical Workers (“IBEW”), respectively. With the contract extension, the contract with CWA and the contract with the IBEW now terminate on June 13, 2016. The contract extensions did not affect the Company’s obligation for pension and postretirement benefits available to U.S. employees of the Company who are represented by the CWA or IBEW (“represented employees”).
The Company’s general funding policy with respect to the qualified pension plans is to contribute amounts at least sufficient to satisfy the minimum amount required by applicable law and regulations, or to directly pay benefits where appropriate. Contributions to the U.S. pension plans were $160 million, $108 million and $101 million in fiscal 2014, 2013 and 2012 respectively. Contributions to the U.S. pension plans were $7 million, $6 million and $6 million for certain pension benefits that were not pre-funded, and $153 million, $102 million
F-43
Table of Contents
and $95 million to satisfy the minimum statutory funding requirements, in fiscal 2014, 2013 and 2012, respectively. Contributions to the non-U.S. pension plans were $27 million, $25 million and $22 million in fiscal 2014, 2013 and 2012, respectively. In fiscal 2015, the Company estimates that it will make contributions of $7 million for certain U.S. pension benefits that are not pre-funded, contributions totaling $92 million to satisfy the minimum statutory funding requirements in the U.S. and contributions totaling $29 million for non-U.S. plans.
Most post-retirement medical benefits are not pre-funded. Consequently, the Company makes payments directly to the claims administrator as retiree medical benefit claims are disbursed. These payments are funded by the Company up to the maximum contribution amounts specified in the plan documents and contract with the CWA and IBEW, and contributions from the participants, if required. In addition to these payments, in compliance with the terms of the contract with the CWA and IBEW, at the beginning of each calendar year 2010 through 2012, the Company contributed an additional $5 million to the represented employees’ post-retirement health trust to fund retirement medical benefits for the U.S. represented employees. At the end of each calendar year, any unused portion of the contributions is carried forward to offset the subsequent year’s retiree medical and dental costs, if any, which would otherwise be the obligation of the retirees. As a result, contributions plus payments for retiree medical and dental benefits were $45 million, $52 million and $58 million in fiscal 2014, 2013 and 2012 respectively. In fiscal 2015, the Company estimates that its payments for retiree medical and dental benefits will total $40 million.
A reconciliation of the changes in the benefit obligations and fair value of assets of the defined benefit pension and postretirement plans, the funded status of the plans, and the amounts recognized in the Consolidated Balance Sheets is provided in the table below:
| Pension
Benefits U.S. |
Pension
Benefits Non-U.S. |
Postretirement Benefits |
||||||||||||||||||||||
| September 30, | September 30, | September 30, | ||||||||||||||||||||||
| In millions |
2014 | 2013 | 2014 | 2013 | 2014 | 2013 | ||||||||||||||||||
| CHANGE IN BENEFIT OBLIGATION |
||||||||||||||||||||||||
| Benefit obligation as of beginning of period |
$ | 3,174 | $ | 3,542 | $ | 596 | $ | 571 | $ | 500 | $ | 564 | ||||||||||||
| Service cost |
5 | 6 | 7 | 7 | 2 | 3 | ||||||||||||||||||
| Interest cost |
145 | 137 | 21 | 21 | 22 | 20 | ||||||||||||||||||
| Employee contributions |
— | — | — | — | 13 | 13 | ||||||||||||||||||
| Amendments |
— | — | — | — | (3 | ) | — | |||||||||||||||||
| Actuarial loss (gain) |
249 | (284 | ) | 57 | (5 | ) | 14 | (31 | ) | |||||||||||||||
| Benefits paid |
(240 | ) | (229 | ) | (26 | ) | (23 | ) | (62 | ) | (69 | ) | ||||||||||||
| Exchange rate movements |
— | — | (39 | ) | 25 | — | — | |||||||||||||||||
| Curtailments, settlements and other |
— | 2 | — | — | — | — | ||||||||||||||||||
|
|
|
|
|
|
|
|
|
|
|
|
|
|||||||||||||
| Benefit obligation as of end of period |
$ | 3,333 | $ | 3,174 | $ | 616 | $ | 596 | $ | 486 | $ | 500 | ||||||||||||
|
|
|
|
|
|
|
|
|
|
|
|
|
|||||||||||||
| CHANGE IN PLAN ASSETS |
||||||||||||||||||||||||
| Fair value of plan assets as of beginning of period |
$ | 2,176 | $ | 2,271 | $ | 51 | $ | 47 | $ | 164 | $ | 153 | ||||||||||||
| Actual return on plan assets |
226 | 26 | 12 | (1 | ) | 13 | 15 | |||||||||||||||||
| Employer contributions |
160 | 108 | 27 | 25 | 45 | 52 | ||||||||||||||||||
| Employee contributions |
— | — | — | — | 13 | 13 | ||||||||||||||||||
| Benefits paid |
(240 | ) | (229 | ) | (26 | ) | (23 | ) | (62 | ) | (69 | ) | ||||||||||||
| Exchange rate movements |
— | — | (4 | ) | 2 | — | — | |||||||||||||||||
| Curtailments, settlements and other |
(1 | ) | — | — | 1 | — | — | |||||||||||||||||
|
|
|
|
|
|
|
|
|
|
|
|
|
|||||||||||||
| Fair value of plan assets as of end of period |
$ | 2,321 | $ | 2,176 | $ | 60 | $ | 51 | $ | 173 | $ | 164 | ||||||||||||
|
|
|
|
|
|
|
|
|
|
|
|
|
|||||||||||||
F-44
Table of Contents
| Pension
Benefits U.S. |
Pension
Benefits Non-U.S. |
Postretirement Benefits |
||||||||||||||||||||||
| September 30, | September 30, | September 30, | ||||||||||||||||||||||
| In millions |
2014 | 2013 | 2014 | 2013 | 2014 | 2013 | ||||||||||||||||||
| AMOUNT RECOGNIZED IN THE CONSOLIDATED BALANCE SHEETS CONSISTS OF: |
||||||||||||||||||||||||
| Noncurrent assets |
$ | — | $ | — | $ | 1 | $ | 1 | $ | — | $ | — | ||||||||||||
| Accrued benefit liability, current |
(7 | ) | (7 | ) | (27 | ) | (27 | ) | (40 | ) | (46 | ) | ||||||||||||
| Accrued benefit liability, noncurrent |
(1,005 | ) | (991 | ) | (530 | ) | (519 | ) | (273 | ) | (290 | ) | ||||||||||||
|
|
|
|
|
|
|
|
|
|
|
|
|
|||||||||||||
| Net amount recognized |
$ | (1,012 | ) | $ | (998 | ) | $ | (556 | ) | $ | (545 | ) | $ | (313 | ) | $ | (336 | ) | ||||||
|
|
|
|
|
|
|
|
|
|
|
|
|
|||||||||||||
| AMOUNT RECOGNIZED IN ACCUMULATED OTHER COMPREHENSIVE LOSS (PRE-TAX) CONSISTS OF: |
||||||||||||||||||||||||
| Net prior service cost (credit) |
$ | 4 | $ | 5 | $ | — | $ | — | $ | (52 | ) | $ | (62 | ) | ||||||||||
| Net actuarial loss (gain) |
1,054 | 943 | 142 | 97 | 81 | 73 | ||||||||||||||||||
|
|
|
|
|
|
|
|
|
|
|
|
|
|||||||||||||
| Net amount recognized |
$ | 1,058 | $ | 948 | $ | 142 | $ | 97 | $ | 29 | $ | 11 | ||||||||||||
|
|
|
|
|
|
|
|
|
|
|
|
|
|||||||||||||
As a result of restructuring initiatives during fiscal 2013 the U.S. pension and postretirement plans for salaried employees experienced a curtailment. A $2 million loss was recognized with respect to curtailment of the U.S. pension plan and a $11 million gain was recognized with respect to curtailment of the U.S. postretirement plan.
In fiscal 2012, the Company completed acquisitions which included a defined benefit pension plan consisting of a projected benefit obligation and plan assets both valued at $3 million as of the acquisition date. Also, as a result of restructuring initiatives during fiscal 2012, the U.S. pension and postretirement plans for represented employees, and certain non-U.S. pension plans experienced a curtailment. The impact of the curtailment on the projected benefit obligation for these plans was a $1 million increase, $2 million decrease, and $3 million increase, respectively.
The following table provides the accumulated benefit obligation for all defined benefit pension plans and information for pension plans with an accumulated benefit obligation in excess of plan assets:
| U.S. Plans | Non -U.S. Plans |
|||||||||||||||
| September 30, | September 30, | |||||||||||||||
| In millions |
2014 | 2013 | 2014 | 2013 | ||||||||||||
| Accumulated Benefit Obligation for all plans |
$ | 3,333 | $ | 3,174 | $ | 599 | $ | 577 | ||||||||
| Plans with Accumulated Benefit Obligation in Excess of Plan Assets |
||||||||||||||||
| Projected Benefit Obligation |
$ | 3,333 | $ | 3,174 | $ | 612 | $ | 592 | ||||||||
| Accumulated Benefit Obligation |
$ | 3,333 | $ | 3,174 | $ | 595 | $ | 573 | ||||||||
| Fair Value of Plan Assets |
$ | 2,321 | $ | 2,176 | $ | 54 | $ | 46 | ||||||||
F-45
Table of Contents
Estimated future benefits expected to be paid in each of the next five fiscal years, and in aggregate for the five fiscal years thereafter, are presented below:
| Pension Benefits | Other Benefits |
Federal Prescription Drug Subsidy Receipts |
||||||||||||||
| In millions |
US | Non-U.S. | ||||||||||||||
| 2015 |
$ | 219 | $ | 27 | $ | 45 | $ | 2 | ||||||||
| 2016 |
218 | 26 | 41 | 3 | ||||||||||||
| 2017 |
217 | 26 | 37 | 3 | ||||||||||||
| 2018 |
216 | 26 | 35 | 3 | ||||||||||||
| 2019 |
216 | 28 | 32 | 4 | ||||||||||||
| 2020—2024 |
1,077 | 138 | 142 | 20 | ||||||||||||
|
|
|
|
|
|
|
|
|
|||||||||
| Total |
$ | 2,163 | $ | 271 | $ | 332 | $ | 35 | ||||||||
|
|
|
|
|
|
|
|
|
|||||||||
The components of net periodic benefit cost (credit) for the pension plans are provided in the table below:
| Pension Benefits -U.S. | Pension Benefits - Non-U.S. | |||||||||||||||||||||||
| Year ended September 30, | Year ended September 30, | |||||||||||||||||||||||
| In millions |
2014 | 2013 | 2012 | 2014 | 2013 | 2012 | ||||||||||||||||||
| Components of net periodic benefit cost (credit) |
||||||||||||||||||||||||
| Service cost |
$ | 5 | $ | 6 | $ | 6 | $ | 7 | $ | 7 | $ | 7 | ||||||||||||
| Interest cost |
145 | 137 | 149 | 21 | 21 | 22 | ||||||||||||||||||
| Expected return on plan assets |
(168 | ) | (162 | ) | (171 | ) | (2 | ) | (2 | ) | (2 | ) | ||||||||||||
| Amortization of unrecognized prior service cost |
1 | 1 | 1 | — | — | — | ||||||||||||||||||
| Amortization of previously unrecognized net actuarial loss |
82 | 120 | 101 | 4 | 5 | — | ||||||||||||||||||
| Curtailment, settlement loss |
— | 2 | 2 | — | — | 3 | ||||||||||||||||||
|
|
|
|
|
|
|
|
|
|
|
|
|
|||||||||||||
| Net periodic benefit cost |
$ | 65 | $ | 104 | $ | 88 | $ | 30 | $ | 31 | $ | 30 | ||||||||||||
|
|
|
|
|
|
|
|
|
|
|
|
|
|||||||||||||
The components of net periodic benefit cost (credit) for the postretirement plans are provided in the table below:
| Postretirement Benefits - U.S. | ||||||||||||
| Year ended September 30, | ||||||||||||
| In millions |
2014 | 2013 | 2012 | |||||||||
| Components of net periodic benefit cost (credit) |
||||||||||||
| Service cost |
$ | 2 | $ | 3 | $ | 3 | ||||||
| Interest cost |
22 | 20 | 30 | |||||||||
| Expected return on plan assets |
(11 | ) | (10 | ) | (11 | ) | ||||||
| Amortization of unrecognized prior service cost |
(13 | ) | (14 | ) | 1 | |||||||
| Amortization of previously unrecognized net actuarial loss |
4 | 7 | 8 | |||||||||
| Curtailment, settlement gain |
— | (11 | ) | — | ||||||||
|
|
|
|
|
|
|
|||||||
| Net periodic benefit cost (credit) |
$ | 4 | $ | (5 | ) | $ | 31 | |||||
|
|
|
|
|
|
|
|||||||
F-46
Table of Contents
Other changes in plan assets and benefit obligations recognized in other comprehensive loss are provided in the table below:
| Pension Benefits - U.S. | Pension Benefits -Non-U.S. | Postretirement Benefits -U.S. | ||||||||||||||||||||||
| Year ended September 30, | Year ended September 30, | Year ended September 30, | ||||||||||||||||||||||
| In millions |
2014 | 2013 | 2014 | 2013 | 2014 | 2013 | ||||||||||||||||||
| Net loss (gain) |
$ | 193 | $ | (148 | ) | $ | 49 | $ | (2 | ) | $ | 12 | $ | (36 | ) | |||||||||
| Prior service cost (credit) |
— | — | — | — | (3 | ) | — | |||||||||||||||||
| Amortization of prior service cost (credit) |
(1 | ) | (1 | ) | — | — | 13 | 14 | ||||||||||||||||
| Amortization of net loss (gain) |
(82 | ) | (120 | ) | (4 | ) | (5 | ) | (4 | ) | (7 | ) | ||||||||||||
| Prior service cost (credit) and net loss (gain) recognition due to curtailment |
— | — | — | — | — | 11 | ||||||||||||||||||
|
|
|
|
|
|
|
|
|
|
|
|
|
|||||||||||||
| Total recognized in other comprehensive loss |
$ | 110 | $ | (269 | ) | $ | 45 | $ | (7 | ) | $ | 18 | $ | (18 | ) | |||||||||
|
|
|
|
|
|
|
|
|
|
|
|
|
|||||||||||||
| Total recognized in net periodic benefit cost and other comprehensive loss |
$ | 175 | $ | (165 | ) | $ | 75 | $ | 24 | $ | 22 | $ | (23 | ) | ||||||||||
|
|
|
|
|
|
|
|
|
|
|
|
|
|||||||||||||
The estimated amounts to be amortized from accumulated other comprehensive income/loss into net periodic benefit cost during fiscal 2015 are provided in the table below:
| In millions |
Pension Benefits - US |
Pension Benefits - Non-US |
Postretirement Benefits |
|||||||||
| Amortization of prior service cost |
$ | 1 | $ | — | $ | (13 | ) | |||||
| Recognized net actuarial loss |
97 | 8 | 5 | |||||||||
|
|
|
|
|
|
|
|||||||
| $ | 98 | $ | 8 | $ | (8 | ) | ||||||
|
|
|
|
|
|
|
|||||||
The weighted average assumptions used to determine the benefit obligation for the pension and postretirement plans are provided in the table below:
| Pension Benefits - U.S. |
Pension Benefits - Non-U.S. |
Postretirement Benefits |
||||||||||||||||||||||
| September 30, | September 30, | September 30, | ||||||||||||||||||||||
| 2014 | 2013 | 2014 | 2013 | 2014 | 2013 | |||||||||||||||||||
| Weighted-average assumptions used to determine benefit obligations |
||||||||||||||||||||||||
| Discount rate |
4.21 | % | 4.75 | % | 2.63 | % | 3.61 | % | 4.17 | % | 4.62 | % | ||||||||||||
| Rate of compensation increase |
4.00 | % | 4.00 | % | 2.96 | % | 3.44 | % | 4.00 | % | 4.00 | % | ||||||||||||
F-47
Table of Contents
The weighted average assumptions used to determine the net periodic benefit cost for the pension and postretirement plans are provided in the tables below:
| Pension Benefits -U.S. | Pension Benefits - Non-U.S. | |||||||||||||||||||||||
| Year ended September 30, | Year ended September 30, | |||||||||||||||||||||||
| 2014 | 2013 | 2012 | 2014 | 2013 | 2012 | |||||||||||||||||||
| Weighted-average assumptions used to determine net periodic benefit cost |
||||||||||||||||||||||||
| Discount rate |
4.75 | % | 3.94 | % | 4.65 | % | 3.61 | % | 3.61 | % | 4.99 | % | ||||||||||||
| Expected return on plan assets |
8.00 | % | 8.00 | % | 8.50 | % | 4.19 | % | 4.25 | % | 5.11 | % | ||||||||||||
| Rate of compensation increase |
4.00 | % | 4.00 | % | 4.00 | % | 3.44 | % | 3.37 | % | 3.37 | % | ||||||||||||
| Postretirement Benefits | ||||||||||||
| Year ended September 30, | ||||||||||||
| 2014 | 2013 | 2012 | ||||||||||
| Weighted-average assumptions used to determine net periodic benefit cost |
||||||||||||
| Discount rate |
4.62 | % | 3.81 | % | 4.58 | % | ||||||
| Expected return on plan assets |
6.90 | % | 7.00 | % | 7.50 | % | ||||||
| Rate of compensation increase |
4.00 | % | 4.00 | % | 4.00 | % | ||||||
The discount rate is subject to change each year, consistent with changes in rates of return on high-quality fixed-income investments currently available and expected to be available during the expected benefit payment period. The Company selects the assumed discount rate for its U.S. pension and postretirement plans by applying the rates from the AonHewitt AA Only and AonHewitt AA Only Above Median yield curves to the expected benefit payment streams and develops a rate at which it is believed the benefit obligations could be effectively settled. The Company follows a similar process for its non-U.S. pension plans by applying the published AonHewitt Euro AA corporate bond yield curve. Based on the published rates as of September 30, 2014, the Company used a weighted average discount rate of 4.21% for the U.S. pension plans, 2.63% for the non-U.S. pension plans, and 4.17% for the postretirement plans, decreases of 54, 98, and 45 basis points, respectively, when compared to September 30, 2013. As of September 30, 2014, this had the effect of increasing the projected U.S. pension benefit obligation and the accumulated postretirement benefit obligation by approximately $181 million, the projected non-U.S. pension benefit obligation by approximately $86 million and the accumulated postretirement benefit obligation by approximately $20 million. For fiscal 2015, this will have the effect of increasing the U.S. pension and postretirement service cost by less than $1 million.
The expected long-term rate of return on U.S. pension and postretirement plan assets is selected by applying forward-looking capital market assumptions to the strategic asset allocation approved by the governing body for each plan. The forward-looking capital market assumptions are developed by an investment adviser and reviewed by the Company for reasonableness. The return and risk assumptions consider such factors as anticipated long-term performance of individual asset classes, risk premium for active management based on qualitative and quantitative analysis, and correlations of the asset classes that comprise the asset portfolio.
Based on an analysis of the U.S. qualified pension plans completed in fiscal 2014, the expected long-term rate of return for fiscal 2015 will be 8.0% unchanged from fiscal 2014. A 25 basis point change in the expected long-term rate of return will result in approximately a $6 million change in pension expense.
Based on an analysis of the postretirement plans completed in fiscal 2014, the acceptable range around the long-term targeted asset allocation was broadened to allow more flexibility in shifting between equity securities and fixed income securities depending upon the funded status of the plans. As a result of an increase in the allocation to fixed income securities, and the forward looking capital market assumptions for these securities, the expected long-term rate of return for fiscal 2015 was changed to 5.9%, a reduction of 100 basis points from fiscal 2014. A 25 basis point change in the expected long-term rate of return will result in a change in postretirement expense of less than $1 million.
F-48
Table of Contents
The assumed health care cost trend rates for postretirement benefit plans were as follows:
| September 30, 2014 |
September 30, 2013 |
|||||||
| Health care cost trend rate assumed for next year |
7.2 | % | 7.7 | % | ||||
| Rate to which the cost trend rate is assumed to decline (ultimate trend rate) |
5.0 | % | 5.0 | % | ||||
| Year that the rate reaches the ultimate trend rate |
2025 | 2022 | ||||||
The Company’s cost for postretirement healthcare claims is capped and the projected postretirement healthcare claims exceed the cap. Therefore, postretirement healthcare trend rates have no effect on the amounts reported for the postretirement health care plan. As of September 30, 2014, neither a one-percentage-point increase nor a one-percentage-point decrease in the Company’s healthcare cost trend rates would have a material impact on the postretirement benefit obligation and the service and interest cost components of net periodic benefit cost.
The weighted-average asset allocation of the pension and postretirement plans by asset category and target allocation is as follows:
| Pension
Plan Assets - U.S. |
Pension
Plan Assets -Non- U.S. |
Postretirement Plan Assets |
||||||||||||||||||||||||||||||
| September 30, | Long-term Target |
September 30, | September 30, | Long-term Target |
||||||||||||||||||||||||||||
| Asset Category |
2014 | 2013 | 2014 | 2013 | 2014 | 2013 | ||||||||||||||||||||||||||
| Equity Securities |
28 | % | 27 | % | 26 | % | 6 | % | 6 | % | 39 | % | 49 | % | 45 | % | ||||||||||||||||
| Debt Securities |
49 | % | 48 | % | 45 | % | 78 | % | 75 | % | 61 | % | 51 | % | 55 | % | ||||||||||||||||
| Hedge Funds |
8 | % | 8 | % | 10 | % | — | % | — | % | — | % | — | % | — | % | ||||||||||||||||
| Private Equity |
4 | % | 5 | % | 3 | % | — | % | — | % | — | % | — | % | — | % | ||||||||||||||||
| Real Estate |
4 | % | 4 | % | 4 | % | — | % | — | % | — | % | — | % | — | % | ||||||||||||||||
| Commodities |
2 | % | 3 | % | 3 | % | — | % | — | % | — | % | — | % | — | % | ||||||||||||||||
| Other (1) |
5 | % | 5 | % | 9 | % | 16 | % | 19 | % | — | % | — | % | — | % | ||||||||||||||||
|
|
|
|
|
|
|
|
|
|
|
|
|
|
|
|
|
|||||||||||||||||
| Total |
100 | % | 100 | % | 100 | % | 100 | % | 100 | % | 100 | % | 100 | % | 100 | % | ||||||||||||||||
|
|
|
|
|
|
|
|
|
|
|
|
|
|
|
|
|
|||||||||||||||||
| (1) | The Other category for U.S. pension plan assets includes cash/cash equivalents and derivative financial instruments, and payables/receivables for pending transactions. The other category for non-U.S. pension assets includes insurance contracts with a guaranteed interest credit. |
The Company’s asset investment strategy focuses on maintaining a diversified portfolio of professionally managed assets designed to optimize returns subject to a prudent level of risk. Risk management practices include diversification across asset classes and investment styles and periodic rebalancing toward asset allocation targets. An asset-liability study is performed on an annual basis for the pension plans, and on an as-necessary basis for the postretirement plans, to determine the optimal asset mix to meet future benefit obligations. The most recent asset-liability studies were completed in fiscal 2014 for the pension and postretirement plans.
As part of the Company’s investment and risk management strategy, the U.S. pension plans enter into both derivatives and long bond portfolios to minimize their sensitivity to interest rate movements. The derivative financial instruments used in support of the interest rate risk management investment strategy include forwards, futures, and swaps. The use of derivative financial instruments for speculative purposes is prohibited by the Company’s investment policy.
Also, as part of the Company’s investment strategy, the U.S. pension plans invest in hedge funds, real estate funds, private equity and commodities to provide additional uncorrelated returns. All funds are broadly diversified to minimize exposure to any one specific investment.
F-49
Table of Contents
The fair value of plan assets is determined by the trustee, and reviewed by the Company, using unadjusted quoted prices in an active market (classified as Level 1 within the fair value hierarchy) when available. Assets for which quoted market prices are not available are valued using other observable valuation inputs (classified as Level 2 within the fair value hierarchy) when available. Level 2 inputs include quoted prices for similar assets in an active market, quoted prices for identical or similar assets in an inactive market, and observable inputs other than quoted prices such as reported trades, unadjusted broker/dealer quotes, etc. Assets for which neither quoted prices nor sufficient observable market data is available are valued using unobservable inputs (classified as Level 3 within the fair value hierarchy). Typically, an unobservable input is the value provided by a limited partnership, which is reviewed for reasonableness based on benchmark performance and review of audited financial statements when available. Because of the inherent uncertainty of valuation, estimated fair values may differ significantly from the fair values that would have been used had quoted prices in an active market existed.
The following tables summarize the fair value of the U.S. pension plans assets by asset class:
| Fair Value Measurements of U.S. Pension Assets as of September 30, 2014 |
||||||||||||||||
| In millions |
Level 1 | Level 2 | Level 3 | Total | ||||||||||||
| Cash and cash equivalents (a) |
$ | 1 | $ | 5 | $ | — | $ | 6 | ||||||||
| U.S. Government debt securities (b) |
— | 247 | — | 247 | ||||||||||||
| Corporate debt securities: (c) |
||||||||||||||||
| Investment grade |
— | 300 | — | 300 | ||||||||||||
| High-yield |
— | 86 | — | 86 | ||||||||||||
| Other debt securities |
— | 7 | — | 7 | ||||||||||||
| Equity securities: (d) |
||||||||||||||||
| U.S. large/mid-cap |
82 | — | — | 82 | ||||||||||||
| U.S. small cap |
30 | — | — | 30 | ||||||||||||
| Non-U.S. equity |
74 | — | — | 74 | ||||||||||||
| Real estate (e) |
— | 8 | 77 | 85 | ||||||||||||
| Private equity (f) |
— | — | 80 | 80 | ||||||||||||
| Investment funds: (g) |
||||||||||||||||
| Cash and cash equivalents |
— | 126 | — | 126 | ||||||||||||
| Investment grade corporate debt |
— | 328 | — | 328 | ||||||||||||
| High-yield debt |
47 | — | — | 47 | ||||||||||||
| Emerging market debt |
— | 120 | — | 120 | ||||||||||||
| U.S. equity |
— | 215 | — | 215 | ||||||||||||
| Non-U.S. equity |
— | 154 | — | 154 | ||||||||||||
| Emerging market equity |
— | 97 | — | 97 | ||||||||||||
| Multi-strategy hedge funds (h) |
— | 173 | 11 | 184 | ||||||||||||
| Commodities (i) |
— | 56 | — | 56 | ||||||||||||
| Derivative instruments (j) |
— | 5 | — | 5 | ||||||||||||
| Other plan liabilities, net |
— | (8 | ) | — | (8 | ) | ||||||||||
|
|
|
|
|
|
|
|
|
|||||||||
| Total plan assets at fair value |
$ | 234 | $ | 1,919 | $ | 168 | $ | 2,321 | ||||||||
|
|
|
|
|
|
|
|
|
|||||||||
F-50
Table of Contents
| Fair Value Measurements of U.S. Pension Assets as of September 30, 2013 |
||||||||||||||||
| In millions |
Level 1 | Level 2 | Level 3 | Total | ||||||||||||
| U.S. Government debt securities (b) |
$ | — | $ | 248 | $ | — | $ | 248 | ||||||||
| Corporate debt securities (c): |
||||||||||||||||
| Investment grade |
— | 261 | — | 261 | ||||||||||||
| High-yield |
— | 80 | — | 80 | ||||||||||||
| Equity securities (d): |
||||||||||||||||
| U.S. large/mid-cap |
72 | — | — | 72 | ||||||||||||
| U.S. small cap |
27 | — | — | 27 | ||||||||||||
| Non-U.S. equity |
74 | — | — | 74 | ||||||||||||
| Real estate (e) |
— | 8 | 73 | 81 | ||||||||||||
| Private equity (f) |
— | — | 100 | 100 | ||||||||||||
| Investment funds (g): |
||||||||||||||||
| Cash and cash equivalents |
— | 107 | — | 107 | ||||||||||||
| Investment grade corporate debt |
— | 290 | — | 290 | ||||||||||||
| High-yield debt |
43 | — | — | 43 | ||||||||||||
| Emerging market debt |
— | 115 | — | 115 | ||||||||||||
| U.S. equity |
— | 187 | — | 187 | ||||||||||||
| Non-U.S. equity |
— | 147 | — | 147 | ||||||||||||
| Emerging market equity |
— | 91 | — | 91 | ||||||||||||
| Multi-strategy hedge funds (h) |
— | 177 | 8 | 185 | ||||||||||||
| Commodities (i) |
— | 60 | — | 60 | ||||||||||||
| Derivative instruments (j) |
— | (9 | ) | — | (9 | ) | ||||||||||
| Other plan assets, net |
— | 17 | — | 17 | ||||||||||||
|
|
|
|
|
|
|
|
|
|||||||||
| Total plan assets at fair value |
$ | 216 | $ | 1,779 | $ | 181 | $ | 2,176 | ||||||||
|
|
|
|
|
|
|
|
|
|||||||||
| (a) | Includes cash collateral, certificates of deposit, commercial paper, securities issued or guaranteed by the U.S. government or its agencies with less than one year to maturity, and repurchase agreements which are valued at cost plus accrued interest. |
| (b) | Includes U.S. treasury bonds, notes and inflation linked bonds, as well as FNMA pools, which are generally valued using institutional bid evaluations from various contracted pricing vendors. Institutional bid evaluations are estimated prices that represent the price a dealer would pay for a security. Pricing inputs to the institutional bid evaluation vary by security, and include benchmark yields, reported trades, unadjusted broker/dealer quotes, issuer spreads, bids, offers or other observable market data. |
| (c) | Includes investment grade corporate bonds diversified across various business sectors, as well as collateralized mortgage obligations and asset backed securities, which are generally valued using institutional bid evaluations from various contracted pricing vendors. Institutional bid evaluations are estimated prices that represent the price a dealer would pay for a security. Pricing inputs to the institutional bid evaluation vary by security, and include benchmark yields, reported trades, unadjusted broker/dealer quotes, issuer spreads, bids, offers or other observable market data. |
| (d) | Includes U.S. and non-U.S. corporate stocks, which are generally valued using the composite close price from an active exchange. The composite close price is the last trade of the day and can come from any exchange on which the security trades. Generally, the last trade of the day comes from the primary exchange; therefore, the composite close and the primary close price are generally the same. |
| (e) | Includes open ended real estate commingled funds, close ended real estate limited partnerships, and insurance company separate accounts that invest primarily in U.S. office, lodging, retail and residential real estate. The insurance company separate accounts and the commingled funds account for their portfolio of assets at fair value and calculate the net asset value per share/unit (“NAV”) on either a monthly or quarterly basis. Shares can be redeemed at the NAV on a quarterly |
F-51
Table of Contents
| basis, provided a written redemption request is received in advance (generally 45—90 days) of the redemption date. Therefore, the undiscounted NAV is used as the fair value measurement. For limited partnerships, the fair value of the underlying assets and the capital account for each investor is determined by the General Partner (“GP”). The valuation techniques used by the GP generally consist of unobservable inputs such as discounted cash flow analysis, analysis of recent comparable sales transactions, actual sale negotiations and bona fide purchase offers received from third parties. The partnerships are typically funded over time as capital is needed to fund asset purchases, and distributions from the partnerships are received as the partnerships liquidate their underlying asset holdings. Therefore, the life cycle for a typical investment in a real estate limited partnership is expected to be approximately 10 years from initial funding. |
| (f) | Includes limited partner interests in various limited partnerships (“LP”) that invest primarily in U.S. and non-U.S. investments either directly, or through other partnerships or funds with a focus on venture capital, buyouts, expansion capital, or companies undergoing financial distress or significant restructuring. The fair value of the net assets of the LPs and of the capital account of each investor is determined by the GP of each LP. Marketable securities held by the LPs are valued based on the closing price on the valuation date on the exchange where they are principally traded and may be adjusted for legal restrictions, if any. Investments without a public market are valued based on assumptions made and valuation techniques used by the GP, which consist of unobservable inputs. Such valuation techniques may include discounted cash flow analysis, analysis of recent comparable sales transactions, actual sale negotiations and bona fide purchase offers received from third parties. The LPs are typically funded over time as capital is needed to fund purchases, and distributions are received as the partnerships liquidate their underlying asset holdings. There have not been any new commitments to private equity since 2007, and no new commitments are expected under current asset allocation targets. Therefore, full liquidation of all existing LPs is expected to be completed by the year 2019. |
| (g) | Includes open-end funds and unit investment trusts that invest in various asset classes including: U.S. corporate debt, emerging market debt, U.S. equity and non-U.S equity. The funds account for their portfolio of assets at fair value and calculate the NAV of the fund on either a daily or monthly basis, and shares can be redeemed at the NAV. Therefore, the undiscounted NAV as reported by the funds is used as the fair value measurement. |
| (h) | Includes hedge fund of funds and hedge funds that pursue multiple strategies to diversify risks and reduce volatility. The funds account for their portfolio of assets at fair value and calculate the NAV of their fund on a monthly basis. The funds limit the frequency of redemptions to manage liquidity and protect the interests of the fund and its shareholders. Several of the funds, with a fair value totaling $11 million as of September 30, 2014, are in the process of liquidation and cannot provide an estimate as to when the liquidation will be completed. However, since trades (purchases and redemptions) are executed using the NAV as calculated on the trade date, the undiscounted NAV as reported by the fund is used as the fair value measurement. |
| (i) | Consists of partnership interests in limited liability companies (“LLC”) that invest in long-only, unleveraged portfolios of exchange-traded, U.S. dollar-denominated futures and forward contracts in tangible commodities. The NAV of each LLC is determined at the end of each month. The underlying futures and forward contracts are valued based upon the settlement price on the exchanges where they are traded, and where there is no settlement price, value is based upon the last trade price. An investor can withdraw all or any portion of its capital account effective as of the last day of the calendar month. |
| (j) | Includes futures, options and swap agreements. Futures and options are generally valued using the last trade price at which a specific contract/security was last traded on the primary exchange, which is provided by a contracted vendor. If pricing is not available from the contracted vendor, then pricing is obtained from other sources such as Bloomberg, broker bid, ask/offer quotes or the investment manager. Swaps and swaptions are generally valued by one of several contracted pricing vendors who use inputs such as interdealer broker rates and benchmark yields to create a swap yield curve and determine price based on the terms of the swap. If pricing is not available |
F-52
Table of Contents
| through one of the contracted vendors, then pricing is obtained from another source such as the investment manager, who obtains the mark -to-market value from the counterparty and applies this value to the current face of the trade to determine price. |
The following tables summarize the changes in fair value of Level 3 U.S. pension plan assets:
| Level 3 U.S. Pension Plan Asset Activity | ||||||||||||||||||||
| Fiscal year ended September 30, 2014 | ||||||||||||||||||||
| In millions |
Corporate Debt Securities |
Real Estate | Private Equity |
Hedge Funds | Total | |||||||||||||||
| Balance at October 1, 2013 |
$ | — | $ | 73 | $ | 100 | $ | 8 | $ | 181 | ||||||||||
| Realized gains/(losses) |
— | — | (1 | ) | — | (1 | ) | |||||||||||||
| Unrealized gains/(losses) relating to investments still held at the end of the period |
— | 12 | 13 | 1 | 26 | |||||||||||||||
| Purchases, sales and settlements (net) |
— | (8 | ) | (32 | ) | (3 | ) | (43 | ) | |||||||||||
| Transfers in/(out) |
— | — | — | 5 | 5 | |||||||||||||||
|
|
|
|
|
|
|
|
|
|
|
|||||||||||
| Balance at September 30, 2014 |
$ | — | $ | 77 | $ | 80 | $ | 11 | $ | 168 | ||||||||||
|
|
|
|
|
|
|
|
|
|
|
|||||||||||
| Level 3 U.S. Pension Plan Asset Activity | ||||||||||||||||||||
| Fiscal year ended September 30, 2013 | ||||||||||||||||||||
| In millions |
Corporate Debt Securities |
Real Estate | Private Equity |
Hedge Funds | Total | |||||||||||||||
| Balance at October 1, 2012 |
$ | 5 | $ | 70 | $ | 123 | $ | 29 | $ | 227 | ||||||||||
| Realized gains/(losses) |
— | 3 | (10 | ) | — | (7 | ) | |||||||||||||
| Unrealized gains relating to investments still held at the end of the period |
— | 8 | 27 | — | 35 | |||||||||||||||
| Purchases, sales and settlements (net) |
— | (8 | ) | (40 | ) | (1 | ) | (49 | ) | |||||||||||
| Transfers in/(out) |
(5 | ) | — | — | (20 | ) | (25 | ) | ||||||||||||
|
|
|
|
|
|
|
|
|
|
|
|||||||||||
| Balance at September 30, 2013 |
$ | — | $ | 73 | $ | 100 | $ | 8 | $ | 181 | ||||||||||
|
|
|
|
|
|
|
|
|
|
|
|||||||||||
The following table summarizes the fair value of the non-U.S. pension plan assets by asset class:
| Fair Value Measurements of Non-U.S. Pension
Assets as of September 30, 2014 |
||||||||||||||||
| In millions |
Level 1 | Level 2 | Level 3 | Total | ||||||||||||
| Investment funds: |
||||||||||||||||
| Equity securities |
$ | — | $ | 4 | $ | — | $ | 4 | ||||||||
| Debt securities |
— | 2 | — | 2 | ||||||||||||
| Insurance contracts (a) |
— | 54 | — | 54 | ||||||||||||
|
|
|
|
|
|
|
|
|
|||||||||
| Total plan assets at fair value |
$ | — | $ | 60 | $ | — | $ | 60 | ||||||||
|
|
|
|
|
|
|
|
|
|||||||||
| Fair Value Measurements of Non-U.S. Pension
Assets as of September 30, 2013 |
||||||||||||||||
| In millions |
Level 1 | Level 2 | Level 3 | Total | ||||||||||||
| Investment funds: |
||||||||||||||||
| Equity securities |
$ | — | $ | 3 | $ | — | $ | 3 | ||||||||
| Debt securities |
— | 2 | — | 2 | ||||||||||||
| Insurance contracts (a) |
— | 46 | — | 46 | ||||||||||||
|
|
|
|
|
|
|
|
|
|||||||||
| Total plan assets at fair value |
$ | — | $ | 51 | $ | — | $ | 51 | ||||||||
|
|
|
|
|
|
|
|
|
|||||||||
F-53
Table of Contents
| (a) | Most non-U.S. pension plans are funded through insurance contracts, which provide for a guaranteed interest credit, and a profit-sharing adjustment based on the actual performance of the underlying investment assets of the insurer. The fair value of the contract is determined by the insurer based on the premiums paid by the Company plus interest credits plus the profit-sharing adjustment less benefit payments. The underlying assets of the insurer are invested in compliance with local rules or law, which tend to require a high allocation to fixed income securities. For example, in the Netherlands, where the pension plan assets account for 75% of the Company’s total non-U.S. pension assets, the insurer’s underlying asset allocation at September 30, 2014 was 100% bonds. |
The following table summarizes the fair value of the postretirement plans assets by asset class:
| Fair Value Measurements of Postretirement Assets as of September 30, 2014 |
||||||||||||||||
| In millions |
Level 1 | Level 2 | Level 3 | Total | ||||||||||||
| Investment funds: |
||||||||||||||||
| Blended asset fund (a) |
$ | 11 | $ | — | $ | — | $ | 11 | ||||||||
| Group life insurance contracts (b) |
— | 162 | — | 162 | ||||||||||||
|
|
|
|
|
|
|
|
|
|||||||||
| Total plan assets at fair value |
$ | 11 | $ | 162 | $ | — | $ | 173 | ||||||||
|
|
|
|
|
|
|
|
|
|||||||||
| Fair Value Measurements of Postretirement Assets as of September 30, 2013 |
||||||||||||||||
| In millions |
Level 1 | Level 2 | Level 3 | Total | ||||||||||||
| Investment funds: |
||||||||||||||||
| Blended asset fund (a) |
$ | 10 | $ | — | $ | — | $ | 10 | ||||||||
| Group life insurance contracts (b) |
— | 154 | — | 154 | ||||||||||||
|
|
|
|
|
|
|
|
|
|||||||||
| Total plan assets at fair value |
$ | 10 | $ | 154 | $ | — | $ | 164 | ||||||||
|
|
|
|
|
|
|
|
|
|||||||||
| (a) | An investment in a broadly diversified registered investment company (mutual fund). As of September 30, 2014, the fund asset allocation was approximately 70% fixed income securities, 21% U.S. equity and 9% non-U.S. equity. The fund values its security holdings each business day as of the close of regular trading on the New York Stock Exchange and computes a NAV by dividing the total fair value of its assets minus liabilities by the number of fund shares outstanding. The fair value of the Plan’s investment in the fund is calculated by multiplying the NAV by the number of shares held by the Plan. |
| (b) | The group life insurance contracts are held in a reserve of an insurance company that provides for investment of pre-funding amounts in a family of pooled separate accounts. The fair value of each group life insurance contract is primarily determined by the value of the units it owns in the pooled separate accounts that back the policy. Each of the pooled separate accounts provides a unit NAV on a daily basis, which is based on the fair value of the underlying assets owned by the account. The postretirement plans can transact daily at the unit NAV without restriction. As of September 30, 2014, the asset allocation of the pooled separate accounts in which the contracts invest was approximately 60% fixed income securities, 22% U.S. equity securities and 18% non-U.S. equity securities. |
Savings Plans
Substantially all of the Company’s U.S. employees are eligible to participate in savings plans sponsored by the Company. The plans allow employees to contribute a portion of their compensation on a pre-tax and after-tax basis in accordance with specified guidelines. Avaya matches a percentage of employee contributions up to certain limits. From March 1, 2009 through March 31, 2010, the Company suspended its contributions to all non-
F-54
Table of Contents
represented employees. Pursuant to a 2009 agreement, the Company suspended its contributions to all represented employees during the period January 1, 2010 through December 31, 2010. The Company’s expense related to these savings plans was $7 million, $10 million and $18 million in fiscal 2014, 2013 and 2012, respectively.
15. Share-based Compensation
Post-Merger Equity Incentive Plan
The Avaya Holdings Corp. Amended and Restated 2007 Equity Incentive Plan (“2007 Plan”) governs the issuance of equity awards, including restricted stock units (“RSUs”) and stock options, to eligible plan participants. Key employees, directors, and consultants of the Company may be eligible to receive awards under the 2007 Plan. Each stock option, when vested and exercised, and each RSU, when vested, entitles the holder to receive one share of common stock, subject to certain restrictions on their transfer and sale as defined in the 2007 Plan and related award agreements. On August 13, 2014, the Compensation Committee approved the amendment and restatement of the 2007 Plan, which was approved by the stockholders of the Company effective November 20, 2014, to make an additional 6,009,248 shares available for issuance, increasing the total amount of shares of its common stock available for issuance under the 2007 Plan to 55,857,405, in addition to 2,984,125 shares of common stock underlying certain continuation awards and other awards that were permitted to be issued at the time of the Merger.
Option Awards
Under the 2007 Plan, stock options may not be granted with an exercise price of less than the fair market value of the underlying stock on the date of grant. Share-based compensation expense recognized in the Consolidated Statements of Operations is based on awards ultimately expected to vest. Forfeitures are estimated at the time of grant and revised, if necessary, in subsequent periods if actual forfeitures differ from those estimates in accordance with the authoritative guidance. All options awarded under the 2007 Plan expire the earlier of ten years from the date of grant or upon cessation of employment, in which event there are limited exercise provisions allowed for vested options.
During the period from October 27, 2007 through September 30, 2009, the Company granted time-based, performance-based “EBITDA,” and market-based “multiple-of-money” options to purchase common stock. Options granted during the period October 27, 2007 through September 30, 2008 have an exercise price of $5.00, and options granted during the year ended September 30, 2009 have an exercise price of $3.80, which was the fair market value (as defined under the 2007 Plan) of the underlying shares at the time granted.
In November 2009, the Compensation Committee of the Company’s Board of Directors approved a stock option exchange program through which individuals holding stock options having exercise prices of $5.00 and $3.80 per share could exchange them on a one-option-for-one-option basis, for replacement options with an exercise price of $3.00 per share, the fair market value (as defined under the 2007 Plan) of the underlying shares at the time of exchange, and with new vesting terms. The replacement options issued to participants in the exchange program include time-based and market-based multiple-of-money options.
During the period November 18, 2009 through October 1, 2012, the Company granted time-based and multiple-of-money options to purchase common stock.
On February 25, 2013, the Compensation Committee of the Company’s Board of Directors approved a stock option exchange program through which individuals holding multiple-of-money and EBITDA stock options could exchange them on a three-for-one basis for RSUs. The tender offer was closed on April 30, 2013 and 45,500 EBITDA and 10,159,189 multiple-of-money options were tendered for exchange. In connection with the exchange offer, 3,401,654 replacement RSUs were granted which have an effective grant date of May 6, 2013. The replacement RSUs vested in full in December 2013.
F-55
Table of Contents
Subsequent to October 1, 2012, the Company granted time-based options to purchase common stock. As a result of the stock option exchange programs offered in November 2009 and February 2013, outstanding stock options at September 30, 2014 consist of time-based stock options and those EBITDA and multiple-of-money stock options that were not tendered for exchange.
Time-based options vest over their performance periods and are payable in shares of common stock upon vesting and exercise. The performance period for time-based options is generally three to four years, with the exception of 5,850,000 time-based options granted during fiscal 2010 which vested 20% on December 18, 2009, the date on which the closing of the NES acquisition was completed, and 20% annually thereafter for the following four years. Compensation expense equal to the fair value of the option measured on the grant date is recognized utilizing graded attribution over the requisite service period.
EBITDA options vest in equal installments each year over a four-year period assuming annual EBITDA targets are met. In the event that any annual EBITDA target is not met, cumulative targets would permit catch-up vesting in subsequent years should these annual EBITDA targets be achieved on a cumulative basis. The fair value of EBITDA options was measured on the date of grant. Compensation expense is recorded utilizing graded attribution over the requisite service period. Vesting, and therefore compensation expense, is estimated at the time that the achievement of the annual or cumulative EBITDA targets become probable. Compensation expense is adjusted for subsequent changes in the expected outcome of the annual and cumulative EBITDA targets until the vesting date.
Multiple-of-money options vest upon the achievement of defined returns on the Sponsors’ initial investment in the Company. Because vesting of the multiple-of-money market-based options is outside the control of the Company and the award recipients, compensation expense relative to the multiple-of-money options must be recognized upon the occurrence of a triggering event (e.g., sale or initial public offering of the Company). Achievement of defined returns on the Sponsors’ initial investment may also cause any unvested portion of the EBITDA options to vest.
The following table summarizes option awards under the 2007 Plan (excluding the continuation options, as discussed below):
| Options (in 000s) |
Time-based | EBITDA | Multiple-of- Money |
Total | Weighted Average Exercise Price |
Fair Value at Date of Grant (in 000s) |
||||||||||||||||||
| Outstanding—October 1, 2013 |
22,347 | 23 | 749 | 23,119 | $ | 3.22 | $ | 43,440 | ||||||||||||||||
| Granted |
9,091 | — | — | 9,091 | $ | 2.37 | 14,054 | |||||||||||||||||
| Exercised |
— | — | — | — | $ | — | — | |||||||||||||||||
| Forfeited |
(5,887 | ) | — | (268 | ) | (6,155 | ) | $ | 3.10 | (10,946 | ) | |||||||||||||
|
|
|
|
|
|
|
|
|
|
|
|||||||||||||||
| Outstanding—September 30, 2014 |
25,551 | 23 | 481 | 26,055 | $ | 2.95 | $ | 46,548 | ||||||||||||||||
|
|
|
|
|
|
|
|
|
|
|
|||||||||||||||
For fiscal 2014, 2013 and 2012, the weighted-average grant-date fair value of options granted during the year was $1.55, $1.39, and $1.68, respectively. The fair value of option awards is determined at the date of grant utilizing the Cox-Ross-Rubinstein (“CRR”) binomial option pricing model which is affected by the fair value of the Company’s common stock as well as a number of complex and subjective assumptions. Expected volatility is based primarily on a combination of the historical volatility and estimates of implied volatility of the Company’s peer group. The peer group is periodically reviewed by management and the Compensation Committee of the Company’s Board of Directors for consistency with the Company’s business strategy, the businesses and markets in which the Company operates, and the Company’s competitive landscape. The risk-free interest rate assumption was derived from reference to the U.S. Treasury Spot rates for the expected term of the stock options. The dividend yield assumption is based on the Company’s current intent not to issue a dividend under its
F-56
Table of Contents
dividend policy. The expected holding period assumption was estimated based on the Company’s historical experience. The underlying assumptions used in the valuation were as follows:
| Fiscal years ended September 30, | ||||||||||||
| 2014 | 2013 | 2012 | ||||||||||
| weighted-average assumptions/inputs: |
||||||||||||
| Stock price |
$ | 2.38 | $ | 2.81 | $ | 4.22 | ||||||
| Expected term |
5 | 5 | 5 | |||||||||
| Volatility |
81.87 | % | 62.76 | % | 54.15 | % | ||||||
| Risk-free rate |
1.38 | % | 0.74 | % | 0.84 | % | ||||||
| Dividend yield |
— | % | — | % | — | % | ||||||
For fiscal 2014, 2013 and 2012, the Company recognized share-based compensation associated with these options of $8 million, $3 million and $5 million, respectively, which is included in costs and operating expenses. At September 30, 2014, there was $10 million of unrecognized share-based compensation that the Company expects to recognize as expense over the next four years associated with 2007 Plan options. The expected expense does not include any compensation associated with the multiple-of-money and EBITDA awards. At September 30, 2014 there are 13,656,459 vested and exercisable options outstanding with a weighted average exercise price of $3.18, a fair value at the date of grant of $27 million, an intrinsic value of less than $1 million, and a weighted average remaining contractual term of 6 years. At September 30, 2014, there are 24,598,550 options that are currently exercisable or expected to vest over the next four years. These options have a weighted average exercise price of $2.95, a fair value at the date of grant of $45 million, an intrinsic value of $2 million and a weighted average remaining contractual term of 7 years.
During fiscal 2014 there were no options exercised. During fiscal 2013 and 2012, 89,250 and 1,093,806 options were exercised with an intrinsic value of less than $1 million and $1 million, respectively.
Restricted Stock Units
The Company has issued RSUs each of which represents the right to receive one share of the Company’s common stock when fully vested. The fair value of the common stock underlying the RSUs was estimated by the Compensation Committee of the Company Board of Directors at the date of grant.
During fiscal 2014, the Company awarded 9,764,906 time-based RSUs in the ordinary course of business with an aggregate fair value at the date of grant of $23 million. Certain of these awards contain an additional performance-based upside provision. If the performance-based metric is met, additional RSUs with a maximum aggregate value of $3 million will be awarded, based on the fair market value of a share common stock on the date of grant. As of September 30, 2014 no additional RSUs had been awarded.
For fiscal 2014, 2013 and 2012, the Company recognized compensation expense associated with RSUs of $17 million, $8 million, and $3 million, respectively.
F-57
Table of Contents
As of September 30, 2014, there was $14 million of unrecognized share based compensation associated with RSUs that the Company expects to recognize as expense through October 2017. The following table summarizes the RSUs granted under the 2007 Plan:
| Nonvested Shares |
Shares | |||
| Non-vested shares at October 1, 2011 |
732,500 | |||
| Granted |
1,956,115 | |||
| Forfeited |
(220,682 | ) | ||
| Vested |
(547,046 | ) | ||
|
|
|
|||
| Non-vested shares at September 30, 2012 |
1,920,887 | |||
| Granted |
6,541,439 | |||
| Forfeited |
(710,743 | ) | ||
| Vested |
(1,416,680 | ) | ||
|
|
|
|||
| Non-vested shares at September 30, 2013 |
6,334,903 | |||
| Granted |
9,764,906 | |||
| Forfeited |
(1,201,823 | ) | ||
| Vested |
(8,124,854 | ) | ||
|
|
|
|||
| Non-vested shares at September 30, 2014 |
6,773,132 | |||
|
|
|
|||
Continuation Awards
At the time of the closing of the Merger, fully vested options to purchase shares of Avaya Inc. held by certain members of management that were not exercised before the Merger were substituted for fully-vested stock options to purchase 1,592,970 shares of common stock having the same intrinsic value of $6 million (“continuation options”). The continuation options have an exercise price of $1.25. As of September 30, 2014, 1,474,618 of these continuation options had been exercised, with the remaining 118,352 continuation options expiring unexercised.
Additionally, following the closing of the Merger, fully vested performance based RSUs of Avaya Inc. held by certain members of management were substituted for 1,331,155 fully-vested RSUs of the Company, having the same intrinsic value of $7 million (“continuation units”). Prior to October 2012, 592,054 continuation units were canceled and during October 2012, shares of common stock were distributed with respect to the remaining 799,101 continuation units.
In accordance with the 2007 Plan, the continuation options and continuation units do not detract from the authorized shares under the 2007 Plan.
16. Capital Stock
Capital Stock
The certificate of incorporation, as amended and restated, authorizes the Company to issue up to 750,000,000 shares of Common Stock with a par value of $.001 per share and 250,000 shares of Preferred Stock with a par value of $0.001 per share.
Preferred Stock
Preferred Series A
On December 19, 2009 the Company issued 125,000 shares of Series A preferred stock (“preferred series A”) with detachable warrants to purchase up to 38.5 million common shares at a price of $3.25 per share
F-58
Table of Contents
which expire December 19, 2019. The aggregate proceeds from the issuance of the preferred series A and associated warrants were $125 million and were used to partially fund the acquisition of NES. The preferred series A shares are non-voting, redeemable at the Company’s election and have a liquidation preference of $1,000 per share plus cumulative, compounded quarterly, accrued unpaid dividends at a rate of 5 percent per annum in cash.
Funds affiliated with Silver Lake and TPG provided an aggregate of $78 million of the cash proceeds from the issuance of the preferred series A shares and the warrants, with each sponsor-affiliated group providing $39 million of the cash proceeds. Based on their contributed cash, the Silver Lake and TPG funds each received 38,864 preferred series A shares and warrants to purchase up to 11,958,192 common shares. Under the terms of the preferred stock agreement, the preferred series A shares are redeemable at the Company’s election only; however, because affiliates of Silver Lake and TPG control the board of directors and hold a substantial portion of the preferred series A shares, they could trigger a demand for redemption at their discretion and therefore, the preferred series A shares have been classified in the mezzanine section between debt and stockholders’ deficiency in the Consolidated Balance Sheets.
In accordance with GAAP, the Company allocated the aggregate proceeds received at closing between the preferred series A shares and warrants issued based on their relative fair values at December 19, 2009. The estimated fair value of the preferred series A shares on December 19, 2009 was $85 million, which was estimated using the discounted cash flow analysis based on the Company’s current borrowing rates for similar types of borrowing arrangements (e.g. Level 2 Input). The warrants have a term of 10-years, have an exercise price of $3.25 per share and an aggregate estimated fair value of $71.5 million. The fair value of each warrant was determined utilizing the CRR binomial option model under the following assumptions: estimated fair value of underlying stock of $3.00; expected term to exercise of 10 years; expected volatility of 48.8%; risk-free interest rate of 3.6%; and no dividend yield. The Company allocated the cash proceeds of $125 million received to the preferred series A shares and warrants based on their relative fair values, or $68 million and $57 million, respectively. Contemporaneously, the Company recorded a discount accretion of $57 million to the carrying amount of the preferred series A at the date of issuance, so that the carrying amount will equal the original redemption amount of $125 million.
As of September 30, 2014, the carrying value of the preferred series A was $159 million, which includes $34 million of accumulated and unpaid dividends as well as $57 million of discount accretion. As of September 30, 2013, the carrying value of the preferred series A was $151 million, which includes $26 million of accumulated and unpaid dividends as well as $57 million of discount accretion.
Preferred Series B
On May 29, 2012 the Company issued 48,921 shares of preferred series B with detachable warrants to purchase up to 24.5 million common shares at a price of $4.00 per share which expire May 29, 2022. The aggregate proceeds from the issuance of the preferred series B and associated warrants were $196 million and were used to partially fund the acquisition of Radvision. The preferred series B shares are non-voting and earn cumulative dividends at a rate of 8 percent per annum, compounded annually, whether or not declared, and are payable in cash or additional shares of preferred series B at the Company’s option. Preferred series B dividends must be paid prior to dividends on any other series or classes of the Company’s stock. Additionally, holders of preferred series B participate in any dividends payable on shares of the Company’s common stock on an as converted basis.
The preferred series B are redeemable at the Company’s election. The Redemption Price is equal to (1) 110% of the Original Purchase Price of $4,000 per share which increases by 10% on each anniversary of the date of issuance up to 150% following the fourth anniversary of the date of issuance, plus (2) any accrued and unpaid dividends. Upon consummation of a Qualified Public Offering or, if so determined by the Required Holders, an Initial Public Offering (as each such term is defined in the agreement), the preferred series B will
F-59
Table of Contents
mandatorily convert into common stock at the Conversion Price as described below or will be redeemed for cash at the option of the holders at the Redemption Price in effect at such time. However, if the Total Leverage Ratio (as defined in the Cash Flow Credit Agreement), after giving effect to such Qualified Public Offering or Initial Public Offering and the application of the proceeds there from, would be greater than 5.0, the preferred series B will mandatorily convert into common stock. The preferred series B is convertible into common stock at a Conversion Price equal to the lesser of (1) $4.00 per share (subject to certain anti-dilution provisions) or (2) the offering price per share in a Qualified Public Offering or an Initial Public Offering.
If a Qualified Public Offering or an Initial Public Offering has not occurred, on or after 5 years from the date of issuance, the preferred series B are redeemable in cash at the option of the holders at the Redemption Price in effect at such time.
Upon liquidation, the holders of the preferred series B are entitled to the greater of (1) the amount which would be receivable if such preferred series B was converted into common stock immediately prior to the liquidation event, or (2) the Redemption Price in effect at such time. Such payment must be made in preference to any other distribution to the holders of any other series and classes of the Company’s stock.
The preferred series B were issued to funds affiliated with Silver Lake and TPG. Because the preferred series B shares are redeemable at the Company’s election at any time and affiliates of Silver Lake and TPG control the board of directors, the holders of the preferred series B could trigger a demand for redemption. In addition, the preferred series B is redeemable at the option of the holders in certain cases. As a result, the preferred series B shares have been classified in the mezzanine section between debt and stockholders’ deficiency in the Consolidated Balance Sheets.
In accordance with GAAP, the Company allocated the aggregate proceeds received at closing between the preferred series B shares and the warrants. The estimated fair value of the preferred series B on May 29, 2012 was $210 million, which was estimated using a Binomial Lattice model. The warrants had an aggregate fair value of $27 million. The fair value of each warrant was $1.11 and was estimated utilizing the CRR binomial option under the following assumptions: estimated fair value of underlying stock of $1.75 per share; expected term to exercise of 10 years; expected volatility of 70%; risk-free interest rate of 1.7%; and no dividend yield. The Company allocated the cash proceeds of $196 million received to the preferred series B shares and warrants based on their relative fair values, or $173 million and $23 million, respectively.
Because the preferred series B shares contain certain features which are required to be bifurcated and accounted for as a derivative instrument, a portion of the $173 million of cash proceeds allocated to the preferred series B shares was assigned to the embedded derivative and recognized as a liability in the Consolidated Balance Sheets. The amount assigned to the embedded derivative or $10 million, was equivalent to the fair value of such features and was determined by estimating the fair value of the preferred series B with and without such features.
Contemporaneous to the allocation of the preferred series B proceeds, the Company recorded discount accretion of $33 million to the carrying amount of the preferred series B at the date of issuance. Additionally, the Company is recording periodic accretion to the Redemption Price.
As of September 30, 2014, the carrying value of the preferred series B was $300 million, which includes $38 million of accumulated and unpaid dividends, $66 million of accretion to the Redemption Price, as well as $33 million of discount accretion at the date of issuance. As of September 30, 2013, the carrying value of the preferred series B was $263 million, which includes $21 million of accumulated and unpaid dividends, $46 million of accretion to the Redemption Price, as well as $33 million of discount accretion at the date of issuance.
Warrants
In connection with the financing of the acquisition of NES, on December 18, 2009, the Company issued warrants to purchase 100 million shares of its common stock of which 61.5 million warrants were issued in
F-60
Table of Contents
connection with the incremental B-2 term loans and 38.5 million warrants were issued in connection with the issuance of the preferred series A. The warrants have an exercise price of $3.25 per share and are exercisable any time prior to December 18, 2019.
In connection with the financing of the acquisition of Radvision, on May 29, 2012, the Company issued warrants to purchase 24.5 million shares of its common stock in connection with the issuance of the preferred series B. The warrants have an exercise price of $4.00 per share and are exercisable any time prior to May 29, 2022.
All such warrants have a cashless exercise feature, contain customary adjustment provisions for stock splits, capital reorganizations and certain other distributions and are currently outstanding as of September 30, 2014.
17. Net Loss Per Share
The following table sets forth the computation of basic and diluted net loss per share of common stock as discussed in Note 2, “Summary of Significant Accounting Policies—Net Loss Per Share”:
| Fiscal years ended September 30, |
||||||||||||
| In millions, except per share amounts | 2014 | 2013 | 2012 | |||||||||
| Numerator: |
||||||||||||
| Loss from continuing operations |
$ | (315 | ) | $ | (319 | ) | $ | (368 | ) | |||
| Dividends on Series A preferred stock |
(8 | ) | (7 | ) | (7 | ) | ||||||
| Dividends on Series B preferred stock |
(17 | ) | (16 | ) | (5 | ) | ||||||
| Accretion on Series B preferred stock |
(20 | ) | (20 | ) | (59 | ) | ||||||
|
|
|
|
|
|
|
|||||||
| Loss from continuing operations attributable to common stockholders |
(360 | ) | (362 | ) | (439 | ) | ||||||
| Income (loss) from discontinued operations, net of income taxes |
62 | (57 | ) | 14 | ||||||||
|
|
|
|
|
|
|
|||||||
| Net loss attributable to common stockholders |
$ | (298 | ) | $ | (419 | ) | $ | (425 | ) | |||
|
|
|
|
|
|
|
|||||||
| Denominator: |
||||||||||||
| Weighted average common shares—basic and diluted |
495.4 | 489.8 | 489.6 | |||||||||
|
|
|
|
|
|
|
|||||||
| Basic and diluted loss per share attributable to common stockholders: |
||||||||||||
| Loss from continuing operations per share—basic and diluted |
$ | (0.73 | ) | $ | (0.74 | ) | $ | (0.90 | ) | |||
| (Loss) income from discontinued operations per share—basic and diluted |
0.13 | (0.12 | ) | 0.03 | ||||||||
|
|
|
|
|
|
|
|||||||
| Net loss per share—basic and diluted |
$ | (0.60 | ) | $ | (0.86 | ) | $ | (0.87 | ) | |||
|
|
|
|
|
|
|
|||||||
The Company’s preferred stock and unvested restricted stock units are participating securities which require the application of the two-class method to calculate basic and diluted earnings per share. Under the two-class method, undistributed earnings are allocated to common stock and the participating securities according to their respective participating rights in undistributed earnings, as if all the earnings for the period had been distributed. Basic net loss is computed by dividing the net loss attributable to common stockholders by the weighted average number of common shares outstanding during the period. Net loss attributable to common stockholders is increased for preferred stock dividends earned during the period. No allocation of undistributed earnings to participating securities was performed for periods with net losses as such securities do not have a contractual obligation to share in the losses of the Company.
For periods with net losses, all potentially dilutive common shares consisting of stock options, restricted stock units, convertible preferred stock and warrants are antidilutive.
18. Reportable Segments
Avaya conducts its business operations in three segments. Two of those segments, Global Communications Solutions (“GCS”) and Avaya Networking (“Networking”), make up Avaya’s Enterprise Collaboration Solutions (“ECS”) product portfolio. The third segment contains Avaya’s services portfolio and is called Avaya Global Services (“AGS”).
F-61
Table of Contents
The GCS segment primarily develops, markets, and sells unified communications and contact center products by integrating multiple forms of communications, including telephone, e-mail, instant messaging and video. Avaya’s Networking segment’s portfolio of products offers integrated networking products which are scalable across customer enterprises. The AGS segment develops, markets and sells comprehensive end-to-end global service offerings that allow customers to evaluate, plan, design, implement, monitor, manage and optimize complex enterprise communications networks.
For internal reporting purposes, the Company’s chief operating decision maker makes financial decisions and allocates resources based on segment profit information obtained from the Company’s internal management systems. Management does not include in its segment measures of profitability selling, general, and administrative expenses, research and development expenses, amortization of intangible assets, and certain discrete items, such as charges relating to restructuring actions, impairment charges, and merger-related costs as these costs are not core to the measurement of segment management’s performance, but rather are controlled at the corporate level.
Summarized financial information relating to the Company’s reportable segments is shown in the following table:
| Fiscal year ended September 30, |
||||||||||||
| In millions |
2014 | 2013 | 2012 | |||||||||
| REVENUE |
||||||||||||
| Global Communications Solutions |
$ | 1,953 | $ | 2,096 | $ | 2,390 | ||||||
| Avaya Networking |
243 | 242 | 284 | |||||||||
|
|
|
|
|
|
|
|||||||
| Enterprise Collaboration Solutions |
2,196 | 2,338 | 2,674 | |||||||||
| Avaya Global Services |
2,175 | 2,241 | 2,347 | |||||||||
| Unallocated Amounts(1) |
— | (1 | ) | (2 | ) | |||||||
|
|
|
|
|
|
|
|||||||
| $ | 4,371 | $ | 4,578 | $ | 5,019 | |||||||
|
|
|
|
|
|
|
|||||||
| GROSS PROFIT |
||||||||||||
| Global Communications Solutions |
$ | 1,241 | $ | 1,276 | $ | 1,387 | ||||||
| Avaya Networking |
107 | 101 | 115 | |||||||||
|
|
|
|
|
|
|
|||||||
| Enterprise Collaboration Solutions |
1,348 | 1,377 | 1,502 | |||||||||
| Avaya Global Services |
1,220 | 1,223 | 1,189 | |||||||||
| Unallocated Amounts(1) |
(69 | ) | (70 | ) | (143 | ) | ||||||
|
|
|
|
|
|
|
|||||||
| 2,499 | 2,530 | 2,548 | ||||||||||
| OPERATING EXPENSES |
||||||||||||
| Selling, general and administrative |
1,531 | 1,512 | 1,617 | |||||||||
| Research and development |
379 | 445 | 464 | |||||||||
| Amortization of acquired intangible assets |
227 | 228 | 227 | |||||||||
| Restructuring and impairment charges, net |
165 | 200 | 147 | |||||||||
| Acquisition-related costs |
— | 1 | 4 | |||||||||
|
|
|
|
|
|
|
|||||||
| 2,302 | 2,386 | 2,459 | ||||||||||
|
|
|
|
|
|
|
|||||||
| OPERATING INCOME (LOSS) |
197 | 144 | 89 | |||||||||
| INTEREST EXPENSE, LOSS ON EXTINGUISHMENT OF DEBT AND OTHER INCOME (EXPENSE), NET |
(461 | ) | (498 | ) | (461 | ) | ||||||
|
|
|
|
|
|
|
|||||||
| LOSS FROM CONTINUING OPERATIONS BEFORE INCOME TAXES |
$ | (264 | ) | $ | (354 | ) | $ | (372 | ) | |||
|
|
|
|
|
|
|
|||||||
F-62
Table of Contents
| Fiscal year ended September 30, |
||||||||
| In millions |
2014 | 2013 | ||||||
| ASSETS: |
||||||||
| Global Communications Solutions |
$ | 1,590 | $ | 1,618 | ||||
| Avaya Networking |
26 | 52 | ||||||
|
|
|
|
|
|||||
| Enterprise Collaboration Solutions |
1,616 | 1,670 | ||||||
| Avaya Global Services |
2,628 | 2,623 | ||||||
| Unallocated Assets(2) |
2,990 | 3,356 | ||||||
|
|
|
|
|
|||||
| Total |
$ | 7,234 | $ | 7,649 | ||||
|
|
|
|
|
|||||
| (1) | Unallocated Amounts in Gross Profit include the effect of the amortization of acquired technology intangibles and costs that are not core to the measurement of segment management’s performance, but rather are controlled at the corporate level. Unallocated Amounts in Revenue and Gross Profit also include the impacts of certain fair value adjustments recorded in purchase accounting in connection with the acquisitions. |
| (2) | Unallocated Assets consist of cash and cash equivalents, accounts receivable, deferred income tax assets, property, plant and equipment, acquired intangible assets, assets of discontinued operations and other assets. Unallocated Assets are managed at the corporate level and are not identified with a specific segment. |
Geographic Information
Financial information relating to the Company’s revenue and long-lived assets by geographic area is as follows:
| Revenue (1) | ||||||||||||
| Years ended September 30, | ||||||||||||
| In millions |
2014 | 2013 | 2012 | |||||||||
| U.S. |
$ | 2,267 | $ | 2,430 | $ | 2,634 | ||||||
| International: |
||||||||||||
| EMEA |
1,234 | 1,239 | 1,349 | |||||||||
| APAC—Asia Pacific |
445 | 457 | 497 | |||||||||
| Americas International—Canada and Latin America |
425 | 452 | 539 | |||||||||
|
|
|
|
|
|
|
|||||||
| Total International |
2,104 | 2,148 | 2,385 | |||||||||
|
|
|
|
|
|
|
|||||||
| Total revenue |
$ | 4,371 | $ | 4,578 | $ | 5,019 | ||||||
|
|
|
|
|
|
|
|||||||
| Long-Lived Assets (2) | ||||||||
| September 30, | ||||||||
| In millions |
2014 | 2013 | ||||||
| U.S. |
$ | 162 | $ | 207 | ||||
| International: |
||||||||
| EMEA |
81 | 89 | ||||||
| APAC—Asia Pacific |
24 | 24 | ||||||
| Americas International—Canada and Latin America |
14 | 14 | ||||||
|
|
|
|
|
|||||
| Total International |
119 | 127 | ||||||
|
|
|
|
|
|||||
| Total |
$ | 281 | $ | 334 | ||||
|
|
|
|
|
|||||
| (1) | Revenue is attributed to geographic areas based on the location of customers. |
| (2) | Represents property, plant and equipment, net. |
F-63
Table of Contents
19. Accumulated Other Comprehensive Loss
The components of accumulated other comprehensive loss are summarized as follows:
| In millions |
Change
in unamortized pension, postretirement and postemployment benefit-related items |
Foreign Currency Translation |
Unrealized loss on term loan interest rate swap |
Other | Accumulated Other Comprehensive Loss |
|||||||||||||||
| Balance as of October 1, 2011 |
$ | (1,111 | ) | $ | (50 | ) | $ | (14 | ) | $ | (3 | ) | $ | (1,178 | ) | |||||
| Other comprehensive (loss) income before reclassifications |
(38 | ) | 37 | (7 | ) | 1 | (7 | ) | ||||||||||||
| Amounts reclassified to earnings |
94 | — | 25 | 2 | 121 | |||||||||||||||
| Provision for income taxes |
(54 | ) | — | (7 | ) | (1 | ) | (62 | ) | |||||||||||
|
|
|
|
|
|
|
|
|
|
|
|||||||||||
| Balance as of September 30, 2012 |
(1,109 | ) | (13 | ) | (3 | ) | (1 | ) | (1,126 | ) | ||||||||||
| Other comprehensive income (loss) before reclassifications |
193 | (47 | ) | — | — | 146 | ||||||||||||||
| Amounts reclassified to earnings |
88 | — | 13 | — | 101 | |||||||||||||||
| (Provision for) benefit from income taxes |
(121 | ) | 4 | (10 | ) | — | (127 | ) | ||||||||||||
|
|
|
|
|
|
|
|
|
|
|
|||||||||||
| Balance as of September 30, 2013 |
(949 | ) | (56 | ) | — | (1 | ) | (1,006 | ) | |||||||||||
| Other comprehensive (loss) income before reclassifications |
(251 | ) | 7 | — | — | (244 | ) | |||||||||||||
| Amounts reclassified to earnings |
50 | — | — | — | 50 | |||||||||||||||
| (Provision for) benefit from income taxes |
— | — | — | — | — | |||||||||||||||
|
|
|
|
|
|
|
|
|
|
|
|||||||||||
| Balance as of September 30, 2014 |
$ | (1,150 | ) | $ | (49 | ) | $ | — | $ | (1 | ) | $ | (1,200 | ) | ||||||
|
|
|
|
|
|
|
|
|
|
|
|||||||||||
The amounts reclassified out of accumulated other comprehensive loss into the Consolidated Statements of Operations prior to the impact of income taxes, with line item location, were as follows:
| Fiscal years ended September 30, |
||||||||||||||
| In millions |
2014 | 2013 | 2012 | Line item in Statement of Operations | ||||||||||
| Change in unamortized pension, postretirement and postemployment benefit-related items |
$ | 13 | $ | 21 | $ | 24 | Costs—Products | |||||||
| 13 | 21 | 24 | Costs—Services | |||||||||||
| 20 | 36 | 37 | Selling, general and administrative | |||||||||||
| 4 | 10 | 9 | Research and development | |||||||||||
|
|
|
|
|
|
|
|||||||||
| 50 | 88 | 94 | ||||||||||||
| Unrealized loss on term loan interest rate swap |
— | 13 | 25 | Interest expense | ||||||||||
| Other |
— | — | 2 | Other (expense) income, net | ||||||||||
|
|
|
|
|
|
|
|||||||||
| $ | 50 | $ | 101 | $ | 121 | |||||||||
|
|
|
|
|
|
|
|||||||||
F-64
Table of Contents
20. Related Party Transactions
Both Avaya Holdings Corp. and Avaya Inc. are party to a Management Services Agreement with Silver Lake Management Company, L.L.C., an affiliate of Silver Lake, and TPG Capital Management, L.P., an affiliate of TPG, collectively “the Managers,” pursuant to which the Managers provide management and financial advisory services to the Company. Pursuant to the Management Services Agreement, the Managers receive a monitoring fee of $7.0 million per annum and reimbursement on demand for out-of-pocket expenses incurred in connection with the provision of such services. In the event of a financing, acquisition, disposition or change of control transaction involving the Company during the term of the Management Services Agreement, the Managers have the right to require the Company to pay a fee equal to customary fees charged by internationally-recognized investment banks for serving as a financial advisor in similar transactions. The Management Services Agreement may be terminated at any time by the Managers, but otherwise has an initial term ending on December 31, 2017 that automatically extends each December 31st for an additional year unless earlier terminated by us or the Managers. The term has automatically extended seven times since the execution of the agreement such that the current term is December 31, 2024. In the event that the Management Services Agreement is terminated, the Company is required to pay a termination fee equal to the net present value of the monitoring fees that would have been payable during the remaining term of the Management Services Agreement. Therefore, if the management services agreement were terminated as of September 30, 2014, the termination fee would be calculated using the current term ending December 31, 2024. In accordance with the Management Services Agreement, the Company recorded $7 million of monitoring fees per year during fiscal 2014, 2013 and 2012.
In December 2013, the Company and TPG Capital Management, L.P. executed a letter agreement reducing the portion of the monitoring fees owed to TPG Capital Management, L.P. by $1 million for fiscal 2014 and thereafter on an annual basis by less than $1 million. The Company also agreed to pay Messrs. Mohebbi and Rittenmeyer in aggregate less than $1 million annually.
The Sponsors are private equity firms that have investments in companies that do business with Avaya. For fiscal 2014, 2013, and 2012, the Company recorded $27 million, $6 million, and $7 million, respectively, associated with sales of the Company’s products and services to companies in which one or both of the Sponsors have investments. For fiscal 2014, 2013 and 2012, the Company purchased goods and services of $8 million, less than $1 million, and $2 million, respectively from companies in which one or both of the Sponsors have investments.
Charles Giancarlo and Greg Mondre are Directors of each of Avaya Holdings Corp. and Avaya Inc. and they hold the positions of Special Advisor and Managing Partner and Managing Director, respectively, of Silver Lake. John W. Marren, Afshin Mohebbi and Ronald Rittenmeyer are Directors of each of Avaya Holdings Corp. and Avaya Inc. and they hold the positions of Partner, Senior Advisor and Senior Advisor, respectively, of TPG.
Ronald A. Rittenmeyer serves on the Board of Directors of each of Avaya Holdings Corp. and Avaya Inc. and served as Chairman, President and Chief Executive Officer of Expert Global Solutions, Inc. (formerly known as NCO Group, Inc.), or Expert Global Solutions, a global provider of business process outsourcing services until June 2014. During fiscal 2014 and 2013, the Company recorded $9 million and $9 million, respectively, associated with sales of the Company’s products and services to Expert Global Solutions.
Kiran Patel serves on the Board of Directors of Avaya Holdings Corp. and Avaya Inc., and also serves a trustee of The Charles Schwab Family of Funds, or Charles Schwab, a mutual fund company, and, until September 2013, served as Executive Vice President and General Manager, Small Business Group of Intuit, Inc., or Intuit, a provider of financial software solutions for consumers and small businesses. During fiscal 2014, the Company recorded less than $1 million associated with sales of the Company’s products and services to Charles Schwab. During fiscal 2013, the Company recorded less than $1 million and $2 million, respectively associated with sales of the Company’s products and services to Charles Schwab and Intuit, respectively.
F-65
Table of Contents
Gary B. Smith serves on the Board of Directors of Avaya Holdings Corp. and Avaya Inc. and also serves as president, Chief Executive Officer and Director of Ciena Corporation, or Ciena, a network infrastructure company. In each of fiscal 2014, 2013 and 2012, the Company recorded less than $1 million associated with sales of the Company’s products and services to Ciena. The Company also purchased goods and services of less than $1 million from Ciena in each of fiscal 2014, 2013 and 2012.
During fiscal 2013 and 2012, affiliates of TPG held some of the Company’s outstanding term loans under the Cash Flow Credit Agreement. In fiscal 2013, certain of the term B-1 loans held by those affiliates were converted to term B-5 loans, $22 million of which were repaid in connection with the issuance of the 9% Senior Secured Notes. Based on the amount of the term loans that were held during fiscal 2013 and 2012, and consistent with the terms of the loan, those affiliates received payments of principal and interest (inclusive of amounts paid by Avaya Inc. in connection with the issuance of the 9% Senior Secured Notes) aggregating approximately $23 million and $4 million, respectively.
During fiscal 2013 and 2012, an affiliate of Silver Lake held some of Avaya Inc.’s outstanding term loans under the Cash Flow Credit Agreement. In fiscal 2013 the outstanding term B-1 loans held by such affiliate were converted to term B-5 loans. Based on the amount of the term loans term B-3, and term B-5 loans that were held by an affiliate of Silver Lake during fiscal 2013, 2012 and 2011, and that were held by such affiliate during fiscal 2013 and 2012, and consistent with the terms of the loan, that affiliate received payments of principal and interest aggregating approximately $5 million and $10 million, respectively.
On October 29, 2012, December 21, 2012 and February 13, 2013, Avaya Inc. amended the terms of its credit facilities in connection with certain refinancing transactions. Lenders who provided consents in connection with the amendments and/or agreed to have loans that they held in one tranche of term loans converted to another received certain fees. Affiliates of Silver Lake received less than $1 million in each of these transactions. Affiliates of TPG received less than $1 million in each of the 2012 transactions.
As of September 30, 2014 and 2013 affiliates of Silver Lake and TPG held no outstanding principal amounts of term loans under the Cash Flow Credit Agreement.
See Note 10, “Financing Arrangements” for further details on the financing arrangements.
In connection with the financing of the NES acquisition, the Company issued shares of its Series A Preferred Stock. As of September 30, 2014, affiliates of TPG owned 38,864.13 shares of the Company’s Series A Preferred Stock and affiliates of Silver Lake owned 38,864.13 shares of the Company’s Series A Preferred Stock.
In connection with the financing of the Radvision acquisition, the Company issued shares of its convertible non-voting Series B Preferred Stock to affiliates of TPG and Silver Lake. As of September 30, 2014, affiliates of TPG owned 32,649 shares of the Company’s preferred Series B Preferred Stock and affiliates of Silver Lake owned 32,649 shares of the Company’s preferred Series B Preferred Stock.
21. Commitments and Contingencies
Legal Proceedings
In the ordinary course of business, the Company is involved in litigation, claims, government inquiries, investigations and proceedings, including, but not limited to, those identified below, relating to intellectual property, commercial, employment, environmental and regulatory matters.
The Company believes that it has meritorious defenses in connection with its current lawsuits and material claims and disputes, and intends to vigorously contest each of them.
F-66
Table of Contents
Based on the Company’s experience, management believes that the damages amounts claimed in a case are not a meaningful indicator of the potential liability. Claims, suits, investigations and proceedings are inherently uncertain and it is not possible to predict the ultimate outcome of cases.
Other than as described below, in the opinion of the Company’s management based upon information currently available to the Company, while the outcome of these lawsuits, claims and disputes is uncertain, the likely results of these lawsuits, claims and disputes are not expected, either individually or in the aggregate, to have a material adverse effect on the Company’s financial position, results of operations or cash flows, although the effect could be material to the Company’s results of operations or cash flows for any interim reporting period.
Antitrust Litigation
In 2006, the Company instituted an action in the U.S. District Court, District of New Jersey, against defendants Telecom Labs, Inc., TeamTLI.com Corp. and Continuant Technologies, Inc. (“TLI/Continuant”) and subsequently amended its complaint to include certain individual officers of these companies as defendants. Defendants purportedly provide maintenance services to customers who have purchased or leased the Company’s communications equipment. The Company asserts in its amended complaint that, among other things, defendants, or each of them, engaged in tortious conduct by improperly accessing and utilizing the Company’s proprietary software, including passwords, logins and maintenance service permissions, to perform certain maintenance services on the Company’s customers’ equipment. TLI/Continuant filed counterclaims against the Company alleging that the Company has violated the Sherman Act’s prohibitions against anticompetitive conduct through the manner in which the Company sells its products and services. TLI/Continuant sought to recover the profits they claim they would have earned from maintaining Avaya’s products, and asked for injunctive relief prohibiting the conduct they claim is anticompetitive. The trial commenced on September 9, 2013. On January 8, 2014, the Court issued an opinion dismissing the Company’s affirmative claims. With respect to TLI/Continuant’s counterclaims, on March 27, 2014, a jury found against the Company on two of eight claims and awarded damages of $20 million. Under the federal antitrust laws, the jury’s award is subject to automatic trebling, or $60 million.
Following the jury verdict, TLI/Continuant sought an injunction regarding the Company’s ongoing business operations. On June 30, 2014, a federal judge rejected the demands of TLI/Continuant’s proposed injunction and stated that “only a narrow injunction is appropriate.” Instead, the judge issued an order relating to customers who purchased an Avaya PBX system between January 1, 1990 and April 30, 2008 only. Those customers and their agents will have free access to the on demand maintenance commands that were installed on their systems at the time of the purchase transaction. The Company has six months from the date of the injunction to enable such access. The court specified that this right “does not extend to access on a system purchased after April 30, 2008.” Consequently, the injunction affects only systems sold more than six years ago. The judge denied all other requests TLI/Continuant made in its injunction filing.
The Company and TLI/Continuant filed post-trial motions seeking to overturn the jury’s verdict, which motions were denied. In September 2014, the Court entered judgment in the amount of $63 million, which included the jury’s award of $20 million, subject to automatic trebling, or $60 million, plus prejudgment interest in the amount of $3 million. On October 10, 2014, the Company filed a Notice of Appeal, and on October 23, 2014, TLI/Continuant filed a Notice of Conditional Cross-Appeal. On October 23, 2014, the Company filed its supersedeas bond with the Court in the amount of $63 million, which includes an amount for post-judgment interest and stays execution of the judgment while the matter is on appeal. The Company secured posting of the bond through the issuance of a letter of credit under its existing credit facilities. On November 10, 2014, TLI/Continuant made an application for attorneys’ fees, expenses and costs, seeking approximately $60 million, which the Company intends to contest. Once required, and in order to stay the enforcement of any award for attorney’s fees, expenses and costs, on appeal or otherwise, the Company will post a bond in the amount of the award for attorney’s fees, expenses and costs, plus interest. The Company expects to secure posting of the bond through existing resources and may use any or a combination of the issuance of one or more letters of credit under its existing credit facilities and cash on hand.
F-67
Table of Contents
The Company continues to believe that TLI/Continuant’s claims are without merit and unsupported by the facts and law, and the Company intends to defend this matter, including by filing its appeal to the United States Court of Appeals for the Third Circuit. No loss reserve has been provided for this matter.
In the event TLI/Continuant ultimately succeed in subsequent appeals, any potential loss could be material. At this time an outcome cannot be predicted and, as a result, the Company cannot be assured that this case will not have a material adverse effect on the manner in which it does business, its financial position, results of operations, or cash flows.
Intellectual Property
In the ordinary course of business, the Company is involved in litigation alleging it has infringed upon third parties’ intellectual property rights, including patents; some litigation may involve claims for infringement against customers by third parties relating to the use of Avaya’s products, as to which the Company may provide indemnifications of varying scope to certain customers. These matters are on-going and the outcomes are subject to inherent uncertainties. As a result, the Company cannot be assured that any such matter will not have a material adverse effect on its financial position, results of operations or cash flows.
Other
In October 2009, a group of former employees of Avaya’s former Shreveport, Louisiana manufacturing facility brought suit in Louisiana state court, naming as defendants Alcatel-Lucent USA, Inc., Lucent Technologies Services Company, Inc., and AT&T Technologies, Inc. The former employees allege hearing loss due to hazardous noise exposure from the facility dating back over forty years, and stipulate that the total amount of each individual’s damages does not exceed $50,000. In February 2010 plaintiffs amended their complaint to add the Company as a named defendant. There are 101 plaintiffs in the case. Defendants’ motion to dismiss plaintiffs’ complaint was denied on April 30, 2012. At this time an outcome cannot be predicted however, because the amounts of the claims individually and in the aggregate are not material, the Company believes the outcome of this matter will not have a material adverse effect on the manner in which it does business, its financial position, results of operations, or cash flows.
General
The Company records accruals for legal contingencies to the extent that it has concluded it is probable that a liability has been incurred and the amount of the loss can be reasonably estimated. No estimate of the possible loss or range of loss in excess of amounts accrued, if any, can be made at this time regarding the matters specifically described above because the inherently unpredictable nature of legal proceedings may be exacerbated by various factors, including: (i) the damages sought in the proceedings are unsubstantiated or indeterminate; (ii) discovery is not complete; (iii) the proceeding is in its early stages; (iv) the matters present legal uncertainties; (v) there are significant facts in dispute; (vi) there are a large number of parties (including where it is uncertain how much liability, if any, will be shared among multiple defendants); or (vii) there is a wide range of potential outcomes.
Product Warranties
The Company recognizes a liability for the estimated costs that may be incurred to remedy certain deficiencies of quality or performance of the Company’s products. These product warranties extend over a specified period of time generally ranging up to two years from the date of sale depending upon the product subject to the warranty. The Company accrues a provision for estimated future warranty costs based upon the historical relationship of warranty claims to sales. The Company periodically reviews the adequacy of its product warranties and adjusts, if necessary, the warranty percentage and accrued warranty reserve, which is included in other current and non-current liabilities in the Consolidated Balance Sheets, for actual experience.
F-68
Table of Contents
| In millions |
||||
| Balance as of October 1, 2012 |
$ | 16 | ||
| Reductions for payments and costs to satisfy claims |
(16 | ) | ||
| Accruals for warranties issued during the period |
16 | |||
|
|
|
|||
| Balance as of September 30, 2013 |
16 | |||
| Reductions for payments and costs to satisfy claims |
(13 | ) | ||
| Accruals for warranties issued during the period |
10 | |||
|
|
|
|||
| Balance as of September 30, 2014 |
$ | 13 | ||
|
|
|
|||
Guarantees of Indebtedness and Other Off-Balance Sheet Arrangements
Letters of Credit
As of September 30, 2014, the Company had outstanding an aggregate of $120 million in irrevocable letters of credit which ensure the Company’s performance or payment to third parties. Included in this amount is $79 million issued under its $535 million committed revolving credit facilities, which facilities are available through October 26, 2016. Also included is $41 million of letters of credit issued under uncommitted facilities. As discussed above under “Legal Proceedings,” on October 23, 2014, the Company issued a $63 million letter of credit under its existing credit facilities to support the supersedeas bond filed with the U.S. District Court.
Surety Bonds
The Company arranges for the issuance of various types of surety bonds, such as license, permit, bid and performance bonds, which are agreements under which the surety company guarantees that the Company will perform in accordance with contractual or legal obligations. These bonds vary in duration although most are issued and outstanding from three months to three years. These bonds are backed by $8 million of the Company’s letters of credit. If the Company fails to perform under its obligations, the maximum potential payment under these surety bonds is $18 million as of September 30, 2014. Historically, no surety bonds have been drawn upon. As discussed above under “Legal Proceedings,” on October 23, 2014, the Company filed a supersede as bond with the U.S. District Court in the amount of $63 million.
Purchase Commitments and Termination Fees
The Company purchases components from a variety of suppliers and a limited number of contract manufacturers to provide manufacturing services for its products. During the normal course of business, in order to manage manufacturing lead times and to help assure adequate component supply, the Company enters into agreements with contract manufacturers and suppliers that allow them to produce and procure inventory based upon forecasted requirements provided by the Company. If the Company does not meet these specified purchase commitments, it could be required to purchase the inventory, or in the case of certain agreements, pay an early termination fee. Historically, the Company has not been required to pay a charge for not meeting its designated purchase commitments with these suppliers, but has been obligated to purchase certain excess inventory levels from its outsourced manufacturers due to actual sales of product varying from forecast and due to transition of manufacturing from one vendor to another.
The Company’s outsourcing agreements with its two most significant contract manufacturers automatically renew in July and September for successive periods of twelve months each, subject to specific termination rights for the Company and the contract manufacturers. All manufacturing of the Company’s products is performed in accordance with either detailed requirements or specifications and product designs furnished by the Company and is subject to rigorous quality control standards.
F-69
Table of Contents
On August 20, 2014, the Company entered into an agreement to outsource certain delivery services associated with the Avaya Private Cloud Services business. The agreement has an initial term of five years, which the parties may agree to extend for an additional three year period, and is subject to specific termination charges in the event of early termination of the agreement. The actual termination charges will vary depending on the reason for termination, date of termination, and the extent to which the supplier incurs termination or cancellation fees under contracts entered into in connection with the provisions of services under the agreement.
Product Financing Arrangements
The Company sells products to various resellers that may obtain financing from certain unaffiliated third-party lending institutions. For the Company’s product financing arrangement with resellers outside the U.S., in the event participating resellers default on their payment obligations to the lending institution, the Company is obligated under certain circumstances to guarantee repayment to the lending institution. The repayment amount fluctuates with the level of product financing activity. The guaranteed repayment amount was less than $1 million as of September 30, 2014. The Company reviews and sets the maximum credit limit for each reseller participating in this financing arrangement. Historically, there have not been any guarantee repayments by the Company. The Company has estimated the fair value of this guarantee as of September 30, 2014, and has determined that it is not material, however, there can be no assurance that the Company will not be obligated to repurchase inventory under this arrangement in the future.
Long-Term Cash Incentive Bonus Plan
The Company has established a long-term incentive cash bonus plan (“LTIP”). Under the LTIP, the Company will make cash awards available to compensate certain key employees upon the achievement of defined returns on the Sponsors’ initial investment in the Company (a “triggering event”). The Company has authorized LTIP awards covering a total of $60 million, of which $32 million in awards were outstanding as of September 30, 2014. The Company will begin to recognize compensation expense relative to the LTIP awards upon the occurrence of a triggering event (e.g., a sale or initial public offering). As of September 30, 2013, no compensation expense associated with the LTIP has been recognized.
Credit Facility Indemnification
In connection with its obligations under the credit facilities described in Note 10, “Financing Arrangements,” the Company has agreed to indemnify the third-party lending institutions for costs incurred by the institutions related to changes in tax law or other legal requirements. While there have been no amounts paid to the lenders pursuant to this indemnity in the past, there can be no assurance that the Company will not be obligated to indemnify the lenders under this arrangement in the future.
Transactions with Alcatel-Lucent
Pursuant to the Contribution and Distribution Agreement effective October 1, 2000, Lucent Technologies, Inc. (now Alcatel-Lucent) contributed to the Company substantially all of the assets, liabilities and operations associated with its enterprise networking businesses (the “Company’s Businesses”) and distributed the Company’s stock pro-rata to the shareholders of Lucent (“distribution”). The Contribution and Distribution Agreement, among other things, provides that, in general, the Company will indemnify Alcatel-Lucent for all liabilities including certain pre-distribution tax obligations of Alcatel-Lucent relating to the Company’s Businesses and all contingent liabilities primarily relating to the Company’s Businesses or otherwise assigned to the Company. In addition, the Contribution and Distribution Agreement provides that certain contingent liabilities not allocated to one of the parties will be shared by Alcatel-Lucent and the Company in prescribed percentages. The Contribution and Distribution Agreement also provides that each party will share specified portions of contingent liabilities based upon agreed percentages related to the business of the other party that exceed $50 million. The Company is unable to determine the maximum potential amount of other future payments, if any, that it could be required to make under this agreement.
F-70
Table of Contents
The Tax Sharing Agreement governs Alcatel-Lucent’s and the Company’s respective rights, responsibilities and obligations after the distribution with respect to taxes for the periods ending on or before the distribution. Generally, pre-distribution taxes or benefits that are clearly attributable to the business of one party will be borne solely by that party and other pre-distribution taxes or benefits will be shared by the parties based on a formula set forth in the Tax Sharing Agreement. The Company may be subject to additional taxes or benefits pursuant to the Tax Sharing Agreement related to future settlements of audits by state and local and foreign taxing authorities for the periods prior to the Company’s separation from Alcatel-Lucent.
Leases
The Company leases land, buildings and equipment under agreements that expire in various years through 2026. Rental expense under operating leases, excluding any lease termination costs incurred related to the Company’s restructuring programs, was $107 million, $107 million and $112 million for fiscal 2014, 2013 and 2012, respectively.
The table below sets forth future minimum lease payments, net of sublease income, due under non-cancelable operating leases, of which $81 million of such payments have been accrued for as of September 30, 2014 in accordance with accounting principles generally accepted in the U.S. pertaining to restructuring and exit activities.
| In millions |
||||
| 2015 |
$ | 93 | ||
| 2016 |
80 | |||
| 2017 |
62 | |||
| 2018 |
55 | |||
| 2019 and thereafter |
129 | |||
|
|
|
|||
| Future minimum lease payments |
$ | 419 | ||
|
|
|
|||
The table below sets forth future minimum lease payments, due under non-cancelable capitalized leases as of September 30, 2014.
| In millions |
||||
| 2015 |
$ | 19 | ||
| 2016 |
17 | |||
| 2017 |
16 | |||
| 2018 |
12 | |||
| 2019 and thereafter |
3 | |||
|
|
|
|||
| Future minimum lease payments |
67 | |||
| Less: Imputed Interest |
(8 | ) | ||
|
|
|
|||
| Present value of net minimum lease payments |
$ | 59 | ||
|
|
|
|||
F-71
Table of Contents
22. Quarterly information (unaudited)
| First Quarter |
Second Quarter |
Third Quarter |
Fourth Quarter |
Total | ||||||||||||||||
| In millions, except per share amounts | ||||||||||||||||||||
| Fiscal Year Ended September 30, 2014 |
||||||||||||||||||||
| Revenue |
$ | 1,131 | $ | 1,060 | $ | 1,054 | $ | 1,126 | $ | 4,371 | ||||||||||
| Gross profit |
640 | 597 | 607 | 655 | 2,499 | |||||||||||||||
| Operating income |
87 | — | 48 | 62 | 197 | |||||||||||||||
| (Provision for) benefit from income taxes of continuing operations |
(26 | ) | (1 | ) | 8 | (32 | ) | (51 | ) | |||||||||||
| Loss from continuing operations |
(59 | ) | (120 | ) | (87 | ) | (49 | ) | (315 | ) | ||||||||||
| Income from discontinued operations, net of income taxes |
3 | 27 | 2 | 30 | 62 | |||||||||||||||
| Net loss |
(56 | ) | (93 | ) | (85 | ) | (19 | ) | (253 | ) | ||||||||||
| Net loss attributable to common stockholders |
(67 | ) | (104 | ) | (96 | ) | (31 | ) | (298 | ) | ||||||||||
| Loss from continuing operations per share—basic and diluted |
$ | (0.15 | ) | $ | (0.26 | ) | $ | (0.19 | ) | $ | (0.13 | ) | $ | (0.73 | ) | |||||
| Income from discontinued operations per share—basic and diluted |
$ | 0.01 | $ | 0.05 | $ | 0.00 | $ | 0.07 | $ | 0.13 | ||||||||||
| Net loss per share—basic and diluted |
$ | (0.14 | ) | $ | (0.21 | ) | $ | (0.19 | ) | $ | (0.06 | ) | $ | (0.60 | ) | |||||
| Fiscal Year Ended September 30, 2013 |
||||||||||||||||||||
| Revenue |
$ | 1,207 | $ | 1,086 | $ | 1,116 | $ | 1,169 | $ | 4,578 | ||||||||||
| Gross profit |
659 | 579 | 618 | 674 | 2,530 | |||||||||||||||
| Operating income |
18 | 12 | 5 | 109 | 144 | |||||||||||||||
| Benefit from (provision for) income taxes of continuing operations |
10 | (7 | ) | 3 | 29 | 35 | ||||||||||||||
| (Loss) income from continuing operations |
(85 | ) | (108 | ) | (140 | ) | 14 | (319 | ) | |||||||||||
| Income (loss) from discontinued operations, net of income taxes |
4 | (80 | ) | 8 | 11 | (57 | ) | |||||||||||||
| Net (loss) income |
(81 | ) | (188 | ) | (132 | ) | 25 | (376 | ) | |||||||||||
| Net (loss) income attributable to common stockholders |
$ | (91 | ) | $ | (199 | ) | $ | (143 | ) | $ | 12 | $ | (419 | ) | ||||||
| (Loss) income from continuing operations per share—basic and diluted |
$ | (0.20 | ) | $ | (0.24 | ) | $ | (0.31 | ) | $ | 0.01 | $ | (0.74 | ) | ||||||
| Income (loss) from discontinued operations per share—basic and diluted |
$ | 0.01 | $ | (0.17 | ) | $ | 0.02 | $ | 0.02 | $ | (0.12 | ) | ||||||||
| Net (loss) income per share—basic and diluted |
$ | (0.19 | ) | $ | (0.41 | ) | $ | (0.29 | ) | $ | 0.03 | $ | (0.86 | ) | ||||||
23. Condensed Financial Information of Parent Company
Avaya Holdings Corp. has no material assets or standalone operations other than its ownership in Avaya Inc. and its subsidiaries.
There are significant restrictions on the Company’s ability to obtain funds from any of its subsidiaries through dividends, loans or advances. Accordingly, these condensed financial statements have been presented on a “Parent-only” basis. Under a Parent-only presentation, the Company’s investments in its consolidated subsidiaries are presented under the equity method of accounting. These Parent-only financial statements should be read in conjunction with the Company’s Consolidated Financial Statements.
The following tables present the financial position of Avaya Holdings Corp. as of September 30, 2014 and 2013 and the results of its operations and cash flows for the years ended September 30, 2014, 2013 and 2012.
F-72
Table of Contents
Avaya Holdings Corp.
Condensed Balance Sheets
| September 30, | ||||||||
| In millions |
2014 | 2013 | ||||||
| Cash and cash equivalents |
$ | — | $ | 1 | ||||
| Other current assets |
1 | — | ||||||
|
|
|
|
|
|||||
| TOTAL |
$ | 1 | $ | 1 | ||||
|
|
|
|
|
|||||
| LIABILITIES, DEFICIENCY IN EXCESS OF INVESTMENT IN AVAYA INC., PREFERRED STOCK AND STOCKHOLDERS’ DEFICIENCY |
||||||||
| Due to Avaya Inc. |
$ | 6 | $ | 6 | ||||
| Other current liabilities |
49 | 27 | ||||||
| Note payable to Avaya Inc. |
18 | 18 | ||||||
| Deficiency in excess of investment in Avaya Inc. |
3,069 | 2,669 | ||||||
| Commitments and contingencies |
||||||||
| Equity awards on redeemable shares |
21 | 5 | ||||||
| Preferred stock, Series B |
300 | 263 | ||||||
| Preferred stock, Series A |
159 | 151 | ||||||
| Stockholders’ deficiency |
(3,621 | ) | (3,138 | ) | ||||
|
|
|
|
|
|||||
| TOTAL |
$ | 1 | $ | 1 | ||||
|
|
|
|
|
|||||
Avaya Holdings Corp.
Condensed Statements of Operations
| Years ended September 30, | ||||||||||||
| In millions |
2014 | 2013 | 2012 | |||||||||
| Equity in net loss of Avaya Inc. |
$ | (231 | ) | $ | (364 | ) | $ | (344 | ) | |||
| Change in fair value of Preferred Series B derivative |
(22 | ) | (11 | ) | (6 | ) | ||||||
| Securities registration fees |
— | (1 | ) | (3 | ) | |||||||
| Interest expense |
— | — | (1 | ) | ||||||||
|
|
|
|
|
|
|
|||||||
| LOSS BEFORE INCOME TAXES |
(253 | ) | (376 | ) | (354 | ) | ||||||
| Provision for income taxes |
— | — | — | |||||||||
|
|
|
|
|
|
|
|||||||
| NET LOSS |
(253 | ) | (376 | ) | (354 | ) | ||||||
| Less: Accretion and accrued dividends on Series A and Series B preferred stock |
(45 | ) | (43 | ) | (71 | ) | ||||||
|
|
|
|
|
|
|
|||||||
| NET LOSS ATTRIBUTABLE TO COMMON STOCKHOLDERS |
$ | (298 | ) | $ | (419 | ) | $ | (425 | ) | |||
|
|
|
|
|
|
|
|||||||
Avaya Holdings Corp.
Condensed Statements of Comprehensive Loss
| Years ended September 30, | ||||||||||||
| In millions |
2014 | 2013 | 2012 | |||||||||
| Net loss |
$ | (253 | ) | $ | (376 | ) | $ | (354 | ) | |||
| Equity in comprehensive (loss) income of Avaya Inc. |
(194 | ) | 120 | 52 | ||||||||
|
|
|
|
|
|
|
|||||||
| Comprehensive loss |
$ | (447 | ) | $ | (256 | ) | $ | (302 | ) | |||
|
|
|
|
|
|
|
|||||||
F-73
Table of Contents
Avaya Holdings Corp.
Condensed Statements of Cash Flows
| Years ended September 30, | ||||||||||||
| In millions |
2014 | 2013 | 2012 | |||||||||
| Net loss |
$ | (253 | ) | $ | (376 | ) | $ | (354 | ) | |||
| Adjustments to reconcile net loss to net cash used by operating activities |
||||||||||||
| Equity in net loss of Avaya Inc. |
231 | 364 | 344 | |||||||||
| Change in fair value of Preferred Series B derivative |
22 | 11 | 6 | |||||||||
| Changes in operating assets and liabilities |
(1 | ) | 1 | 4 | ||||||||
|
|
|
|
|
|
|
|||||||
| Net cash from operating activities |
(1 | ) | — | — | ||||||||
|
|
|
|
|
|
|
|||||||
| Investing activities: |
||||||||||||
| Investment in Avaya Inc. |
— | — | (196 | ) | ||||||||
| Acquisition of businesses, net of cash acquired |
— | (10 | ) | (22 | ) | |||||||
|
|
|
|
|
|
|
|||||||
| Net cash used for investing activities |
— | (10 | ) | (218 | ) | |||||||
|
|
|
|
|
|
|
|||||||
| Financing activities: |
||||||||||||
| Proceeds from loan from Avaya Inc. |
— | 10 | 8 | |||||||||
| Issuance of preferred stock and warrants |
— | — | 196 | |||||||||
|
|
|
|
|
|
|
|||||||
| Net cash provided by financing activities |
— | 10 | 204 | |||||||||
|
|
|
|
|
|
|
|||||||
| Net decrease in cash and cash equivalents |
(1 | ) | — | (14 | ) | |||||||
| Cash and cash equivalents at beginning of year |
1 | 1 | 15 | |||||||||
|
|
|
|
|
|
|
|||||||
| Cash and cash equivalents at end of year |
$ | — | $ | 1 | $ | 1 | ||||||
|
|
|
|
|
|
|
|||||||
24. Subsequent Events
The financial statements of Avaya Holdings Corp. are substantially comprised of the financial statements of Avaya Inc., which issued its annual financial statements on November 26, 2014. Accordingly, the Company has evaluated transactions for consideration as recognized subsequent events in the annual financial statements through the date of November 26, 2014. Additionally, the Company has evaluated transactions that occurred as of the issuance of these financial statements, December 5, 2014, for purposes of disclosure of unrecognized subsequent events.
F-74
Table of Contents
Table of Contents
PART II
INFORMATION NOT REQUIRED IN PROSPECTUS
| Item 13. | Other Expenses of Issuance and Distribution |
The following table sets forth the fees and expenses, other than the underwriting discounts and commissions, payable by us in connection with the registration of the shares of common stock hereunder. All amounts are estimates except the Securities and Exchange Commission registration fee and the FINRA filing fee.
| Securities and Exchange Commission registration fee |
$ | 116,100 | ||
| FINRA filing fee |
75,500 | |||
| Stock exchange listing fee |
* | |||
| Printing and engraving expenses |
* | |||
| Legal fees and expenses |
* | |||
| Accounting fees and expenses |
* | |||
| Transfer Agent and Registrar fees |
* | |||
| Miscellaneous expenses |
* | |||
| Total Expenses |
$ | * |
| * | To be filed by amendment. |
| Item 14. | Indemnification of Directors and Officers |
Section 102(b)(7) of the DGCL enables a corporation in its original certificates of incorporation or an amendment thereto to eliminate or limit the personal liability of a director for violations of the director’s fiduciary duty, except (i) for any breach of the director’s duty of loyalty to the corporation or its stockholders, (ii) for acts or omissions not in good faith or which involve intentional misconduct or a knowing violation of law, (iii) for liability of directors for unlawful payment of dividends or unlawful stock purchase or redemptions pursuant to Section 174 of the DGCL or (iv) for any transaction from which a director derived an improper personal benefit. Our certificate of incorporation includes a provision that eliminates the personal liability of directors for monetary damages for actions taken as a director to the fullest extent authorized by the DGCL.
Section 145(a) of the DGCL provides in relevant part that a corporation may indemnify any person who was or is a party or is threatened to be made a party to any threatened, pending or completed action, suit or proceeding (other than an action by or in the right of the corporation) by reason of the fact that such person is or was a director or officer of the corporation, or is or was serving at the request of the corporation as a director or officer of another entity, against expenses (including attorneys’ fees), judgments, fines and amounts paid in settlement actually and reasonably incurred by such person in connection with such action, suit or proceeding if such person acted in good faith and in a manner such person reasonably believed to be in or not opposed to the best interests of the corporation, and, with respect to any criminal action or proceeding, had no reasonable cause to believe such person’s conduct was unlawful. The termination of any action, suit or proceeding by judgment, order, settlement, conviction or upon a plea of nolo contendere or its equivalent, shall not, of itself, create a presumption that such person did not act in good faith and in a manner which such person reasonably believed to be in or not opposed to the best interests of the corporation, and, with respect to any criminal action or proceeding, had reasonable cause to believe that such person’s conduct was lawful.
Section 145(b) of the DGCL provides in relevant part that a corporation may indemnify any person who was or is a party or is threatened to be made a party to any threatened, pending or completed action or suit by or in the right of the corporation to procure a judgment in its favor by reason of the fact that the person is or was a director or officer of the corporation, or is or was serving at the request of the corporation as a director or officer of another entity, against expenses (including attorneys’ fees) actually and reasonably incurred by such person in connection with the defense or settlement of such action or suit if the person acted in good faith and in a manner the person reasonably believed to be in or not opposed to the best interests of the corporation and except that no indemnification shall be made in respect of any claim, issue or matter as to which such person shall have been
II-1
Table of Contents
adjudged to be liable to the corporation unless and only to the extent that the Court of Chancery or the court in which such action or suit was brought shall determine upon application that, despite the adjudication of liability but in view of all the circumstances of the case, such person is fairly and reasonably entitled to indemnity for such expenses which the Court of Chancery or such other court shall deem proper.
Our certificate of incorporation that will be in effect upon the closing of this offering will provide that we will indemnify our directors and officers to the fullest extent permitted by law. Our certificate of incorporation also will provide that the indemnification and advancement of expenses provided by, or granted pursuant to the certificate of incorporation, are not exclusive of any other rights to which those seeking indemnification or advancement of expenses may be entitled under any bylaw, agreement, vote of stockholders or otherwise. Section 145(f) of the DGCL further provides that a right to indemnification or to advancement of expenses arising under a provision of the certificate of incorporation shall not be eliminated or impaired by an amendment to such provision after the occurrence of the act or omission which is the subject of the civil, criminal, administrative or investigative action, suit or proceeding for which indemnification or advancement of expenses is sought.
We have also entered into indemnification agreements with certain of our directors and officers. Such agreements generally provide for indemnification by reason of being our director or officer, as the case may be. These agreements are in addition to the indemnification provided by our charters and bylaws.
We have also obtained officers’ and directors’ liability insurance that insures against liabilities that officers and directors of the registrant may, in such capacities, incur. Section 145(g) of the DGCL provides that a corporation shall have power to purchase and maintain insurance on behalf of any person who is or was a director or officer of the corporation, or is or was serving at the request of the corporation as a director or officer of another entity, against any liability asserted against such person and incurred by such person in any such capacity, or arising out of such person’s status as such, whether or not the corporation would have the power to indemnify such person against such liability under that section.
| Item 15. | Recent Sales of Unregistered Securities |
Equity Securities
In connection with the closing of the Merger, on October 26, 2007, we issued 1,592,970 Continuation Options with an exercise price of $1.25 per share, and 1,331,155 continuation units resulting from the rollover of certain equity awards. For more information on continuation options and continuation units issued in connection with the Merger, see “Executive Compensation—Elements of Executive Officer Compensation—Long-Term Incentives.” Of the continuation options issued on the closing of the Merger, options representing shares of 1,037,609 and 125,600 shares were exercised in fiscal years 2009 and 2010, respectively, resulting in the issuance of common stock representing 380,347 and 42,026 shares, during each of fiscal years 2009 and 2010, respectively. In fiscal year 2008, continuation units representing 358,814 shares were cancelled. The continuation options, continuation units and net shares were issued without registration in reliance on the exemptions afforded by Section 4(a)(2) of the Securities Act and pursuant to Rule 506 of Regulation D promulgated under the Securities Act.
During the year ended September 30, 2008, we granted to certain eligible participants 110,000 restricted stock units and options to purchase 39,185,000 shares of common shares under the 2007 Plan. The exercise price for each of these options was $5.00 per share. During the year ended September 30, 2008, options representing 8,570,000 shares were cancelled. The restricted stock units and options were issued without registration in reliance on the exemption afforded by Section 4(a)(2) of the Securities Act, as a transaction by an issuer not involving a public offering, or Rule 701 promulgated under Section 3(b) of the Securities Act, as a transaction pursuant to a compensatory benefit plan.
During the year ended September 30, 2009, we granted to certain eligible participants 730,789 restricted stock units and options to purchase 12,555,000 common shares under the 2007 Plan. The exercise price for each of these options was $3.80 per share. During the year ended September 30, 2009 options representing 11,874,469
II-2
Table of Contents
shares were cancelled. The restricted stock units and options were issued without registration in reliance on the exemption afforded by Section 4(a)(2) of the Securities Act, as a transaction by an issuer not involving a public offering, or Rule 701 promulgated under Section 3(b) of the Securities Act, as a transaction pursuant to a compensatory benefit plan.
Following the completion of fiscal year 2009, we extended an offer to our outstanding stock option holders to exchange their existing stock options having an exercise price equal to or greater than $3.80 per share for new stock options in a one-for-one option exchange. The new “replacement” stock options were awarded on November 17, 2009 (“replacement option date of grant”) following the completion of the exchange offer, have an exercise price of $3.00 per share, which was the fair market value of a share of our common stock on the replacement option date of grant, and have new vesting provisions. In aggregate there were 30,890,000 stock options eligible for exchange, for which 28,595,000 were validly tendered in the offer. No consideration was paid to the registrant by any recipient. The replacement stock options were issued without registration in reliance on the exemptions afforded by Section 3(a)(9) of the Securities Act, as an exchange by the issuer with its existing security holders without commission.
The purchase price for the NES acquisition was funded, in part, with the issuance on December 18, 2009 of (a) warrants to acquire 100,000,000 shares of our common stock at a price of $3.25 per share, which warrants are exercisable at any time prior to December 18, 2019 at an exercise price of $3.25 per share, and (b) 125,000 shares of our Series A Preferred Stock. The issuance of warrants and Series A Preferred Stock was consummated without registration in reliance on the exemption afforded by Section 4(a)(2) of the Securities Act as a transaction by an issuer not involving a public offering. All of the shares of our Series A Preferred Stock will be redeemed with the proceeds of this offering.
During the year ended September 30, 2010, we granted to certain eligible participants 495,000 restricted stock units and options to purchase 17,925,000 common shares under the 2007 Plan, excluding options granted in conjunction with the exchange offer noted above. The exercise price for each of these options was $3.00 per share. During the year ended September 30, 2010 restricted stock units representing 15,000 shares, and options representing 5,086,487 shares were cancelled, exclusive of the options cancelled in the exchange offer. The restricted stock units and options were issued without registration in reliance on the exemption afforded by Section 4(a)(2) of the Securities Act, as a transaction by an issuer not involving a public offering, or Rule 701 promulgated under Section 3(b) of the Securities Act, as a transaction pursuant to a compensatory benefit plan.
During the year ended September 30, 2011, we granted to certain eligible participants 305,000 restricted stock units and options to purchase 6,870,000 common shares under the 2007 Plan. Options granted prior to May 2011 have an exercise price of $3.00 per share and options granted subsequent to May 2011 have an exercise price or $4.40 per share. During the year ended September 30, 2011 restricted stock units representing 65,789 shares, and options representing 7,353,528 shares were cancelled. The restricted stock units and options were issued without registration in reliance on the exemption afforded by Section 4(a)(2) of the Securities Act, as a transaction by an issuer not involving a public offering, or Rule 701 promulgated under Section 3(b) of the Securities Act, as a transaction pursuant to a compensatory benefit plan.
During the three months ended December 31, 2011, we granted to certain eligible participants 778,182 restricted stock units and options to purchase 2,027,253 common shares under the 2007 Plan. The exercise price for each of these options was $4.40 per share. During the three months ended December 31, 2011 restricted stock units representing 50,000 shares, and options representing 1,869,422 shares were cancelled. The restricted stock units and options were issued without registration in reliance on the exemption afforded by Section 4(a)(2) of the Securities Act, as a transaction by an issuer not involving a public offering, or Rule 701 promulgated under Section 3(b) of the Securities Act, as a transaction pursuant to a compensatory benefit plan.
The purchase price for the Radvision acquisition was funded, in part, with the issuance on May 29, 2012 of (a) warrants to acquire 24,460,642 shares of our common stock at a price of $4.00 per share, which warrants are exercisable at any time prior to May 29, 2022 at an exercise price of $4.00 per share, and (b) 48,921 shares of our Series B Preferred Stock, which is convertible at any time at a price equal to the lesser of (1) $4.00 per share (subject to certain anti-dilution provisions) and (2) the offering price per share in this offering. The issuance of
II-3
Table of Contents
warrants and Series B Preferred Stock was consummated without registration in reliance on the exemption afforded by Section 4(a)(2) of the Securities Act as a transaction by an issuer not involving a public offering.
During the year ended September 30, 2012, we granted to certain eligible participants 1,956,115 restricted stock units and options to purchase 5,762,253 common shares under the 2007 Plan. Options granted prior to May 2012 have an exercise price of $4.40 per share and options granted subsequent to May 2012 have an exercise price of $4.00 per share. During the year ended September 30, 2012 restricted stock units representing 220,682 shares, and options representing 9,916,162 shares were cancelled. The restricted stock units and options were issued without registration in reliance on the exemption afforded by Section 4(a)(2) of the Securities Act, as a transaction by an issuer not involving a public offering, or Rule 701 promulgated under Section 3(b) of the Securities Act, as a transaction pursuant to a compensatory benefit plan.
Following the completion of fiscal year 2012, we extended an offer to certain of our outstanding stock option holders to exchange certain of their existing stock options for restricted stock units. Option holders who participated in the exchange program received three “replacement” restricted stock units for each stock option exchanged. The new restricted stock units were awarded on May 6, 2013 (“replacement RSU date of grant”) following the completion of the exchange offer and have new vesting provisions. The fair market value of a share of our common stock on the replacement RSU date of grant was equal to or less than the exercise price of each option exchanged. In aggregate there were 11,494,439 stock options eligible for exchange, for which 10,204,689 were validly tendered in the offer. No consideration was paid to the registrant by any recipient. In connection with the exchange offer, 3,401,654 replacement RSUs were granted. The replacement restricted stock units were issued without registration in reliance on the exemptions afforded by Section 3(a)(9) of the Securities Act, as an exchange by the issuer with its existing security holders without commission.
During the year ended September 30, 2013, we granted to certain eligible participants 3,139,785 restricted stock units (excluding the replacement restricted stock units in the exchange offer described above) and options to purchase 3,263,469 common shares under the 2007 Plan. Options granted from October 1, 2012 through November 30, 2012 have an exercise price of $4.00 per share, options granted from December 2012 through March 31, 2013 have an exercise price of $3.00 per share and options granted from April 1, 2013 through September 30, 2013 have an exercise price of $2.25 per share. During the year ended September 30, 2013 restricted stock units representing 710,743 shares, and options representing 8,198,305 shares were cancelled, excluding those options tendered for exchange in connection with the exchange offer. The restricted stock units and options were issued without registration in reliance on the exemption afforded by Section 4(a)(2) of the Securities Act, as a transaction by an issuer not involving a public offering, or Rule 701 promulgated under Section 3(b) of the Securities Act, as a transaction pursuant to a compensatory benefit plan.
During the year ended September 30, 2014, we granted to certain eligible participants 9,764,906 restricted stock units and options to purchase 9,091,089 common shares under the 2007 Plan. Options granted from October 1, 2013 through February 11, 2014 have an exercise price of $2.25. Options granted from February 12, 2014 through August 12, 2014 have an exercise price of $2.75. Options granted from August 13, 2014 through September 30, 2014 have an exercise price of $2.50. During the year ended September 30, 2014, restricted stock units representing 1,201,823 shares, and options representing 6,154,719 shares were cancelled. The restricted stock units and options were issued without registration in reliance on the exemption afforded by Section 4(a)(2) of the Securities Act, as a transaction by an issuer not involving a public offering, or Rule 701 promulgated under Section 3(b) of the Securities Act, as a transaction pursuant to a compensatory benefit plan.
With regard to the foregoing, to the extent an individual acquires shares of our common stock upon exercise of a stock option or vesting of a restricted stock unit, those shares are subject to the restrictions on transfer and other provisions contained in a stockholders’ agreement.
Debt Securities
On October 24, 2008, Avaya Inc. issued $700 million of senior unsecured cash-pay notes and $750 million of senior unsecured PIK toggle notes upon conversion of the senior cash-pay loans and the senior PIK toggle loans. The issuance of the senior unsecured cash-pay notes and senior unsecured PIK toggle notes was conducted
II-4
Table of Contents
pursuant to the exemptions afforded by Section 4(a)(2) of the Securities Act, as a transaction by an issuer not involving a public offering. The interest rate for the cash-pay notes is fixed at 9.75% and the interest rates for the cash interest and PIK interest portions of the PIK-toggle notes are fixed at 10.125% and 10.875%, respectively. In connection with the conversion of the senior cash-pay loans and the senior PIK toggle loans, Avaya Inc. and the guarantors of the outstanding notes entered into a registration rights agreement in which they agreed, among other things, to file a registration statement to exchange the notes for similar notes registered under the Securities Act. The registration statement on Form S-4 registering such notes was filed with the Securities and Exchange Commission on December 23, 2009 and declared effective on January 14, 2010.
On February 11, 2011, Avaya Inc. issued $1,009 million aggregate principal amount of its 7.00% Senior Secured Notes due 2019 at an issue price of 100% of the principal amount of the notes, pursuant to the exemptions afforded by Section 4(a)(2) of the Securities Act, as a transaction by an issuer not involving a public offering, to “qualified institutional buyers” in the United States as defined in Rule 144A of the Securities Act, and outside the United States pursuant to Regulation S under the Securities Act. These notes mature on April 1, 2019 and bear interest at a rate of 7.00% per annum, payable semi-annually on April 1 and October 1 of each year, commencing on October 1, 2011. All of the proceeds from the offering were used to repay term B-2 loans outstanding under Avaya Inc.’s senior secured credit facility.
On December 21, 2012, Avaya Inc. issued $290 million aggregate principal amount of its 9.00% Senior Secured Notes due 2019 at an issue price of 100% of the principal amount of the notes, pursuant to the exemptions afforded by Section 4(a)(2) of the Securities Act, as a transaction by an issuer not involving a public offering, to “qualified institutional buyers” in the United States as defined in Rule 144A of the Securities Act, and outside the United States pursuant to Regulation S under the Securities Act. These notes mature on April 1, 2019 and bear interest at a rate of 9.00% per annum, payable semi-annually on April 1 and October 1 of each year, commencing on April 1, 2013. All of the proceeds from the offering were used to repay term B-5 loans outstanding under Avaya Inc.’s senior secured credit facility.
On March 7, 2013, Avaya Inc. completed an exchange offer in which $642 million of its 9.75% senior unsecured cash-pay notes due 2015 and $742 million of 10.125%/10.875% senior unsecured PIK toggle notes due November 1, 2015 were exchanged for $1,384 million of 10.50% senior secured notes due March 1, 2021. The 10.50% Senior Secured Notes were issued at par, bear interest at a rate of 10.50% per annum and mature on March 1, 2021. The 10.5% Senior Secured Notes were issued without registration in reliance on the exemptions afforded by Section 4(a)(2) of the Securities Act, as a transaction by an issuer not involving a public offering, to “qualified institutional buyers” in the United States as defined in Rule 144A of the Securities Act, and outside the United States pursuant to Regulation S under the Securities Act.
| Item 16. | Exhibits and Financial Statement Schedules |
(a) Exhibits
| Exhibit |
Exhibit Title | |||
| 1.1 | Form of Underwriting Agreement* | |||
| 3.1 | Amended and Restated Certificate of Incorporation of Avaya Holdings Corp. (to be effective upon completion of this offering)* | |||
| 3.2 | Amended and Restated By-Laws of Avaya Holdings Corp. (to be effective upon completion of this offering)* | |||
| 4.1 | Exchange Note Indenture, dated as of October 24, 2008, by and among Avaya Inc., the Guarantors named therein and The Bank of New York Mellon, as Trustee (Incorporated by reference to Exhibit 4.1 to Avaya Inc.’s Registration Statement on Form S-4 filed with the SEC on December 23, 2009) | |||
| 4.2 | Supplemental Indenture, dated as of February 19, 2010, by and among Avaya Government Solutions Inc., Integrated Information Technology Corporation, AC Technologies, Inc. and The Bank of New York Mellon, as Trustee (Incorporated by reference to Exhibit 4.5 to Avaya Inc.’s Quarterly Report on Form 10-Q filed with the SEC on May 13, 2010) | |||
II-5
Table of Contents
| Exhibit |
Exhibit Title | |||
| 4.3 | Supplemental Indenture, dated as of July 20, 2012, among RADVision, Inc., AvayaLive Inc. and The Bank of New York Mellon, as Trustee (Incorporated by reference to Exhibit 4.1 to Avaya Inc.’s Quarterly Report on Form 10-Q filed with the SEC on August 14, 2012) | |||
| 4.4 | Supplemental Indenture dated February 15, 2013 between Avaya Inc. and The Bank of New York Mellon Trust Company, N.A., as Trustee (Incorporated by reference to Exhibit 4.3 to Avaya Inc.’s Current Report on Form 8-K filed with the SEC on March 7, 2013) | |||
| 4.5 | Form of 9.75% Senior Unsecured Notes due 2015 (included in the Exchange Note Indenture filed as Exhibit 4.1) | |||
| 4.6 | Form of 10.125%/10.875% Senior PIK Toggle Unsecured Notes due 2015 (included in the Exchange Note Indenture filed as Exhibit 4.1) | |||
| 4.7 | Indenture dated February 11, 2011 by and among Avaya Inc., the Guarantors party thereto and The Bank of New York Mellon Trust Company, N.A., as Trustee (Incorporated by reference to Exhibit 4.1 to Avaya Inc.’s Quarterly Report on Form 10-Q filed with the SEC on February 14, 2011) | |||
| 4.8 | Supplemental Indenture, dated as of July 20, 2012, among RADVision, Inc., AvayaLive Inc. and The Bank of New York Mellon, as Trustee and Collateral Agent (Incorporated by reference to Exhibit 4.2 to Avaya Inc.’s Quarterly Report on Form 10-Q filed with the SEC on August 14, 2012) | |||
| 4.9 | Pledge and Security Agreement dated February 11, 2011 by and among Avaya Inc., certain subsidiaries of Avaya Inc. from time to time party thereto and The Bank of New York Mellon Trust Company, N.A., as Collateral Agent (Incorporated by reference to Exhibit 4.3 to Avaya Inc.’s Quarterly Report on Form 10-Q filed with the SEC on February 14, 2011) | |||
| 4.10 | Supplement No. 1 dated as of July 20, 2012, to the Pledge and Security Agreement, dated as of February 11, 2011, by and among Avaya Inc., certain subsidiaries of Avaya Inc. from time to time party thereto and The Bank of New York Mellon Trust Company, N.A., as Notes Collateral Agent. (Incorporated by reference to Exhibit 10.3 to Avaya Inc.’s Quarterly Report on Form 10-Q filed with the SEC on August 14, 2012) | |||
| 4.11 | Form of 7% Senior Secured Notes due 2019 (Incorporated by reference to Exhibit 4.2 to Avaya Inc.’s Quarterly Report on Form 10-Q filed with the SEC on February 14, 2011) | |||
| 4.12 | Indenture dated December 21, 2012 by and among Avaya Inc., the Guarantors party thereto and The Bank of New York Mellon Trust Company, N.A., as Trustee (Incorporated by reference to Exhibit 4.1 to Avaya Inc.’s Current Report on Form 8-K filed with the SEC on December 21, 2012) | |||
| 4.13 | Form of 9% Senior Secured Note due 2019 (Incorporated by reference to Exhibit 4.2 to Avaya Inc.’s Current Report on Form 8-K filed with the SEC on December 21, 2012) | |||
| 4.14 | Pledge and Security Agreement dated December 21, 2012 by and among Avaya Inc., certain subsidiaries of Avaya Inc. from time to time party thereto and The Bank of New York Mellon Trust Company, N.A., as Notes Collateral Agent (Incorporated by reference to Exhibit 4.3 to Avaya Inc.’s Current Report on Form 8-K filed with the SEC on December 21, 2012) | |||
| 4.15 | Indenture dated March 7, 2013 by and among Avaya Inc., the guarantors party thereto and The Bank of New York Mellon Trust Company, N.A., as Trustee (Incorporated by reference to Exhibit 4.1 to Avaya Inc.’s Current Report on Form 8-K filed with the SEC on March 7, 2013) | |||
| 4.16 | Form of 10.50% Senior Secured Note due 2021 (Incorporated by reference to Exhibit 4.2 to Avaya Inc.’s Current Report on Form 8-K filed with the SEC on March 7, 2013) | |||
| 4.17 | Pledge and Security Agreement dated as of March 7, 2013 among Avaya Inc., the guarantors party thereto and The Bank of New York Mellon Trust Company, N.A., as Notes Collateral Agent (Incorporated by reference to Exhibit 4.4 to Avaya Inc.’s Current Report on Form 8-K filed with the SEC on March 7, 2013) | |||
II-6
Table of Contents
| Exhibit |
Exhibit Title | |||
| 4.18 | Amended and Restated Registration Rights Agreement dated as of December 18, 2009, by and among Sierra Holdings Corp. (n/k/a Avaya Holdings Corp.), TPG Partners V, L.P., TPG FOF V-A, L.P., TPG FOF V-B, L.P., Silver Lake Partners II, L.P., Silver Lake Technology Investors II, L.P., Silver Lake Partners III, L.P., Silver Lake Technology Investors III, L.P., Sierra Co-Invest, LLC and Sierra Co-Invest II, LLC (previously filed as Exhibit 4.11 to this Registration Statement on June 9, 2011) | |||
| 4.19 | Second Amended and Restated Registration Rights Agreement dated as of May 29, 2012, by and among Sierra Holdings Corp., TPG Partners V, L.P., TPG FOF V-A, L.P., TPG FOF V-B, L.P., Silver Lake Partners II, L.P., Silver Lake Technology Investors II, L.P., Silver Lake Partners III, L.P., Silver Lake Technology Investors III, L.P., Sierra Co-Invest, LLC and Sierra Co-Invest II, LLC (previously filed as Exhibit 4.19 to this Registration Statement on December 3, 2013)** | |||
| 4.20 | Senior Manager Registration and Preemptive Rights Agreement, dated as of October 26, 2007, by and among Sierra Holdings Corp. and the individual members of management listed on Schedule A thereto (previously filed as Exhibit 4.12 to this Registration Statement on June 9, 2011)** | |||
| 4.21 | Specimen Common Stock Certificate of Avaya Holdings Corp.* | |||
| 4.22 | Certificate of Designations of Series A Preferred Stock of Avaya Holdings Corp. (previously filed as Exhibit 4.9 to this Registration Statement on June 9, 2011)** | |||
| 4.23 | Certificate of Designation for Series B Preferred Stock of Avaya Holdings Corp.* | |||
| 4.24 | Form of Warrant, dated December 18, 2009 (previously filed as Exhibit 4.10 to this Registration Statement on June 9, 2011)** | |||
| 4.25 | Form of Warrant, dated May 29, 2012* | |||
| 5.1 | Opinion of Ropes & Gray LLP* | |||
| 10.1 | Purchase Agreement dated February 8, 2011 between Avaya Inc. and Morgan Stanley & Co. Incorporated, as Representative for the several Initial Purchasers identified therein (Incorporated by reference to Exhibit 10.1 to Avaya Inc.’s Quarterly Report on Form 10-Q filed with the SEC on February 14, 2011) | |||
| 10.2 | Purchase Agreement dated December 18, 2012 between Avaya Inc., the Guarantors party thereto and Citigroup Global Markets Inc., as Representative for the several Initial Purchasers identified therein (Incorporated by reference to Exhibit 10.1 to Avaya Inc.’s Current Report on Form 10-K filed with the SEC on December 21, 2012) | |||
| 10.3 | Credit Agreement, dated as of October 26, 2007, by and among Avaya Inc., as Borrower, Sierra Holdings Corp. (n/k/a Avaya Holdings Corp.), Citibank, N.A., as Administrative Agent, Swing Line Lender and L/C Issuer, the other lenders party thereto, Morgan Stanley Senior Funding, Inc., as Syndication Agent, JPMorgan Chase Bank, N.A., as Documentation Agent, and Citigroup Global Markets Inc., Morgan Stanley Senior Funding, Inc., and J.P. Morgan Securities Inc., as Joint Lead Arrangers and Joint Bookrunners (Incorporated by reference to Exhibit 10.1 to Avaya Inc.’s Registration Statement on Form S-4 filed with the SEC on December 23, 2009) | |||
| 10.4 | Amendment No. 1 to Credit Agreement, dated as of December 18, 2009, among Avaya Inc., the lenders party thereto and Citibank, N.A., as Administrative Agent (Incorporated by reference to Exhibit 10.5 to Avaya Inc.’s Registration Statement on Form S-4 filed with the SEC on December 23, 2009) | |||
| 10.5 | Amendment No. 2 to Credit Agreement dated February 11, 2011, by and among Avaya Inc., Citibank, N.A., as Administrative Agent, and each lender party thereto, amending Credit Agreement, dated as of October 26, 2007, by and among Avaya Inc., Sierra Holdings Corp. (n/k/a Avaya Holdings Corp.), Citibank, N.A., as Administrative Agent, Swing Line Lender and L/C Issuer and each lender party thereto (Incorporated by reference to Exhibit 10.2 to Avaya Inc.’s Quarterly Report on Form 10-Q filed with the SEC on February 14, 2011) | |||
II-7
Table of Contents
| Exhibit |
Exhibit Title | |||
| 10.6 | Amended and Restated Credit Agreement dated February 11, 2011, by and among Avaya Inc., Sierra Holdings Corp. (n/k/a Avaya Holdings Corp.), Citibank N.A., as Administrative Agent, Swing Line Lender and L/C Issuer, and each lender from time to time party thereto (Incorporated by reference to Exhibit 10.3 to Avaya Inc.’s Quarterly Report on Form 10-Q filed with the SEC on February 14, 2011) | |||
| 10.7 | Amendment No. 3 to Credit Agreement dated August 8, 2011, by and among Avaya Inc., Citibank, N.A., as Administrative Agent, and each lender party thereto, amending the Amended and Restated Credit Agreement, dated as of February 11, 2011, by and among Avaya Inc., Avaya Holdings Corp., Citibank, N.A., as Administrative Agent, Swing Line Lender and L/C Issuer and each lender party thereto (Incorporated by reference to Exhibit 10.1 to Avaya Inc.’s Quarterly Report on Form 10-Q filed with the SEC on August 11, 2011) | |||
| 10.8 | Amendment No. 4 to Credit Agreement, dated as of October 29, 2012, among Avaya Inc., Citibank, N.A., as Administrative Agent, and the lenders party thereto (Incorporated by reference to Exhibit 10.3 to Avaya Inc.’s Current Report on Form 8-K filed with the SEC on November 2, 2012) | |||
| 10.9 | Second Amended and Restated Credit Agreement, dated as of October 29, 2012, among Avaya Inc., Avaya Holdings Corp., Citibank N.A., as Administrative Agent, Swing Line Lender and L/C Issuer, and each lender from time to time party thereto* (Incorporated by reference to Exhibit 10.4 to Avaya Inc.’s Current Report on Form 8-K filed with the SEC on November 2, 2012) | |||
| 10.10 | Amendment No. 5 to Credit Agreement, dated as of December 21, 2012, among Avaya Inc., Citibank, N.A., as Administrative Agent, and the lenders party thereto (Incorporated by reference to Exhibit 10.1 to Avaya Inc.’s Current Report on Form 8-K filed with the SEC on December 21, 2012) | |||
| 10.11 | Third Amended and Restated Credit Agreement, dated as of December 21, 2012, among Avaya Inc., Avaya Holdings Corp., Citibank N.A., as Administrative Agent, Swing Line Lender and L/C Issuer, and each lender from time to time party thereto (Incorporated by reference to Exhibit 10.2 to Avaya Inc.’s Current Report on Form 8-K filed with the SEC on December 21, 2012) | |||
| 10.12 | Amendment No. 6 to Credit Agreement, dated as of February 13, 2013, among Avaya Inc., Citibank, N.A., as Administrative Agent, and the lenders party thereto (Incorporated by reference to Exhibit 10.3 to Avaya Inc.’s Current Report on Form 8-K filed with the SEC on February 19, 2013) | |||
| 10.13 | Amendment No. 7 to Credit Agreement, dated as of March 12, 2013, among Avaya Inc., Citibank, N.A., as Administrative Agent, and the lenders party thereto (Incorporated by reference to Exhibit 10.1 to Avaya Inc.’s Current Report on Form 8-K filed with the SEC on March 14, 2013) | |||
| 10.14 | Amendment No. 8 to Credit Agreement, dated as of February 5, 2014, among Avaya Inc., Citibank N.A., as Administrative Agent, and the lenders party thereto (Incorporated by reference to Exhibit 10.1 to Avaya Inc.’s Current Report on Form 8-K filed with the SEC on February 11, 2014) | |||
| 10.15 | Pledge and Security Agreement, dated as of October 26, 2007, by and among Avaya Inc., as Borrower, Sierra Holdings Corp. (n/k/a Avaya Holdings Corp.), certain subsidiaries of Avaya Inc. identified therein and Citibank, N.A., as Administrative Agent (Incorporated by reference to Exhibit 10.2 to Avaya Inc.’s Registration Statement on Form S-4 filed with the SEC on December 23, 2009) | |||
| 10.16 | Supplement No. 1 dated as of February 15, 2008, to the Pledge and Security Agreement, dated as of October 26, 2007, by and among Avaya Inc., certain subsidiaries of Avaya Inc. from time to time party thereto and The Bank of New York Mellon Trust Company, N.A., as Notes Collateral Agent. (Incorporated by reference to Exhibit 10.6 to Avaya Inc.’s Quarterly Report on Form 10-Q filed with the SEC on August 14, 2012) | |||
| 10.17 | Supplement No. 2 dated as of January 29, 2010, to the Pledge and Security Agreement, dated as of October 26, 2007, by and among Avaya Inc., as Borrower, Sierra Holdings Corp. (n/k/a Avaya Holdings Corp.), certain subsidiaries of Avaya Inc. identified therein and Citibank, N.A., as Administrative Agent. (Incorporated by reference to Exhibit 10.6 to Avaya Inc.’s Quarterly Report on Form 10-Q filed with the SEC on August 14, 2012) | |||
II-8
Table of Contents
| Exhibit |
Exhibit Title | |||
| 10.18 | Supplement No. 3 dated as of July 20, 2012, to the Pledge and Security Agreement, dated as of October 26, 2007, by and among Avaya Inc., as Borrower, Avaya Holdings Corp., certain subsidiaries of Avaya Inc. identified therein and Citibank, N.A., as Administrative Agent. (Incorporated by reference to Exhibit 10.2 to Avaya Inc.’s Quarterly Report on Form 10-Q filed with the SEC on August 14, 2012) | |||
| 10.19 | Guaranty, dated as of October 26, 2007, by and among Sierra Holdings Corp. (n/k/a Avaya Holdings Corp.), certain subsidiaries of Avaya Inc. identified therein and Citibank, N.A., as Administrative Agent (Incorporated by reference to Exhibit 10.3 to Avaya Inc.’s Registration Statement on Form S-4 filed with the SEC on December 23, 2009) | |||
| 10.20 | Supplement No. 1 dated as of February 15, 2008, to the Guaranty, dated as of October 26, 2007, by and among Sierra Holdings Corp. (n/k/a Avaya Holdings Corp.), certain subsidiaries of Avaya Inc. from time to time party thereto and Citibank, N.A., as Administrative Agent (Incorporated by reference to Exhibit 10.10 to Avaya Inc.’s Quarterly Report on Form 10-Q filed with the SEC on August 14, 2012) | |||
| 10.21 | Supplement No. 2 dated as of January 29, 2010, to the Guaranty, dated as of October 26, 2007, by and among Sierra Holdings Corp. (n/k/a Avaya Holdings Corp.), certain subsidiaries of Avaya Inc. from time to time party thereto and Citibank, N.A., as Administrative Agent (Incorporated by reference to Exhibit 10.7 to Avaya Inc.’s Quarterly Report on Form 10-Q filed with the SEC on August 14, 2012) | |||
| 10.22 | Supplement No. 3 dated as of July 20, 2012, to the Guaranty, dated as of October 26, 2007, by and among Avaya Holdings Corp., certain subsidiaries of Avaya Inc. from time to time party thereto and Citibank, N.A., as Administrative Agent (Incorporated by reference to Exhibit 10.4 to Avaya Inc.’s Quarterly Report on Form 10-Q filed with the SEC on August 14, 2012) | |||
| 10.23 | Credit Agreement, dated as of October 26, 2007, by and among Avaya Inc., as Parent Borrower, the several subsidiary borrowers party thereto, Sierra Holdings Corp. (n/k/a Avaya Holdings Corp.), Citicorp USA, Inc., as Administrative Agent and Swing Line Lender, Citibank, N.A., as L/C Issuer, the other lenders party thereto, Morgan Stanley Senior Funding, Inc., as Syndication Agent, JPMorgan Chase Bank, N.A., as Documentation Agent, and Citigroup Global Markets Inc., Morgan Stanley Senior Funding, Inc. and J.P. Morgan Securities Inc., as Joint Lead Arrangers and Joint Bookrunners (Incorporated by reference to Exhibit 10.4 to Avaya Inc.’s Registration Statement on Form S-4 filed with the SEC on December 23, 2009) | |||
| 10.24 | Amendment No. 1 to Credit Agreement, dated as of August 8, 2011, by and among Avaya Inc., the several subsidiary borrowers party thereto, Citicorp USA, Inc., as Administrative Agent and the lenders party thereto, amending the Credit Agreement, dated as of October 26, 2007, by and among Avaya Inc., the several subsidiary borrowers party thereto, Avaya Holdings Corp., Citicorp USA, Inc., as Administrative Agent and the lenders party thereto (Incorporated by reference to Exhibit 10.2 to Avaya Inc.’s Quarterly Report on Form 10-Q filed with the SEC on August 11, 2011) | |||
| 10.25 | Amendment No. 2 to Credit Agreement, dated as of October 29, 2012, among Avaya Inc., the several Subsidiary Borrowers party thereto, Citicorp USA, Inc., as Administrative Agent, and the lenders party thereto (Incorporated by reference to Exhibit 10.1 to Avaya Inc.’s Current Report on Form 8-K filed with the SEC on November 2, 2012) | |||
| 10.26 | Amended and Restated Credit Agreement, dated as of October 29, 2012, among Avaya Inc., the several Subsidiary Borrowers party thereto, Avaya Holdings Corp., Citicorp USA, Inc., as Administrative Agent and Swing Line Lender, Citibank, N.A., as L/C Issuer, and each lender from time to time party thereto (Incorporated by reference to Exhibit 10.2 to Avaya Inc.’s Current Report on Form 8-K filed with the SEC on November 2, 2012) | |||
II-9
Table of Contents
| Exhibit |
Exhibit Title | |||
| 10.27 | Amendment No. 3 to Credit Agreement, dated as of February 13, 2013, among Avaya Inc., the several Subsidiary Borrowers party thereto, Citicorp USA, Inc., as Administrative Agent, and the lenders party thereto (Incorporated by reference to Exhibit 10.3 to Avaya Inc.’s Current Report on Form 8-K filed with the SEC on February 19, 2013) | |||
| 10.28 | Pledge and Security Agreement, dated as of October 26, 2007, by and among Avaya Inc., as Parent Borrower, Sierra Holdings Corp. (n/k/a Avaya Holdings Corp.), certain subsidiaries of Avaya Inc. identified therein, as Subsidiary Borrowers and Citicorp USA, Inc., as Administrative Agent (Incorporated by reference to Exhibit 10.6 to Avaya Inc.’s Registration Statement on Form S-4 filed with the SEC on December 23, 2009) | |||
| 10.29 | Supplement No. 1 dated as of February 15, 2008, to the Pledge and Security Agreement, dated as of October 26, 2007, by and among Avaya Inc., as Parent Borrower, Sierra Holdings Corp. (n/k/a Avaya Holdings Corp.), certain subsidiaries of Avaya Inc. identified therein, as Subsidiary Borrowers and Citicorp USA, Inc., as Administrative Agent. (Incorporated by reference to Exhibit 10.8 to Avaya Inc.’s Quarterly Report on Form 10-Q filed with the SEC on August 14, 2012) | |||
| 10.30 | Supplement No. 2 dated as of January 29, 2010, to the Pledge and Security Agreement, dated as of October 26, 2007, by and among Avaya Inc., as Parent Borrower, Sierra Holdings Corp. (n/k/a Avaya Holdings Corp.), certain subsidiaries of Avaya Inc. identified therein and Citibank, N.A., as Administrative Agent. (Incorporated by reference to Exhibit 10.5 to Avaya Inc.’s Quarterly Report on Form 10-Q filed with the SEC on August 14, 2012) | |||
| 10.31 | Supplement No. 3 dated as of July 20, 2012, to the Pledge and Security Agreement, dated as of October 26, 2007, by and among Avaya Inc., as Parent Borrower, Avaya Holdings Corp., certain subsidiaries of Avaya Inc. identified therein, as Subsidiary Borrowers and Citicorp USA, Inc., as Administrative Agent. (Incorporated by reference to Exhibit 10.1 to Avaya Inc.’s Quarterly Report on Form 10-Q filed with the SEC on August 14, 2012) | |||
| 10.32 | Guaranty, dated as of October 26, 2007, by and among Sierra Holdings Corp., certain subsidiaries of Avaya Inc. from time to time party thereto and Citicorp USA, Inc., as Administrative Agent (Incorporated by reference to Exhibit 10.7 to Avaya Inc.’s Registration Statement on Form S-4 filed with the SEC on December 23, 2009) | |||
| 10.33 | Executive Employment Agreement, dated as of December 22, 2008, by and among Kevin J. Kennedy, Avaya Inc. and Sierra Holdings Corp. (Incorporated by reference to Exhibit 10.8 to Avaya Inc.’s Registration Statement on Form S-4 filed with the SEC on December 23, 2009) | |||
| 10.34 | Amendment to Executive Employment Agreement, dated October 12, 2009 among Kevin J. Kennedy, Avaya Inc. and Sierra Holdings Corp. (Incorporated by reference to Exhibit 10.9 to Avaya Inc.’s Registration Statement on Form S-4 filed with the SEC on December 23, 2009) | |||
| 10.35 | Avaya Inc. Involuntary Separation Plan for Senior Officers, as amended (Incorporated by reference to Exhibit 10.10 to Avaya Inc.’s Registration Statement on Form S-4 filed with the SEC on December 23, 2009) | |||
| 10.36 | Form of Indemnity Agreement between Sierra Holdings Corp., Avaya Inc. and certain directors of the Registrant (Incorporated by reference to Exhibit 10.11 to Avaya Inc.’s Registration Statement on Form S-4 filed with the SEC on December 23, 2009) | |||
| 10.37 | Form of Indemnity Agreement between Sierra Holdings Corp., Avaya Inc. and certain officers of the Registrant (Incorporated by reference to Exhibit 10.12 to Avaya Inc.’s Registration Statement on Form S-4 filed with the SEC on December 23, 2009) | |||
| 10.38 | Avaya Inc. Savings Restoration Plan, as amended (Incorporated by reference to Exhibit 10.13 to Avaya Inc.’s Registration Statement on Form S-4 filed with the SEC on December 23, 2009) | |||
II-10
Table of Contents
| Exhibit |
Exhibit Title | |||
| 10.39 | Avaya Inc. Short Term Incentive Plan (Incorporated by reference to Exhibit 10.14 to Avaya Inc.’s Registration Statement on Form S-4 filed with the SEC on December 23, 2009) | |||
| 10.40 | Management Services Agreement, dated as of October 2, 2007, by and among Sierra Holdings Corp., Avaya Inc. (as successor by merger to Sierra Merger Corp.), TPG Capital, L.P. and Silver Lake Management Company III, L.L.C. (Incorporated by reference to Exhibit 10.15 to Avaya Inc.’s Registration Statement on Form S-4 filed with the SEC on December 23, 2009) | |||
| 10.41 | Letter Agreement, dated as of December 12, 2013, by and among Avaya Holdings Corp., Avaya Inc. and TPG Capital Management, L.P. (Incorporated by reference to Exhibit 10.1 to Avaya Inc.’s Current Report on Form 8-K filed with the SEC on December 17, 2013) | |||
| 10.42 | Avaya Holdings Corp. Second Amended and Restated 2007 Equity Incentive Plan (Incorporated by reference to Exhibit 10.41 to Avaya Inc.’s Annual Report on Form 10-K filed with the SEC on November 26, 2014) | |||
| 10.43 | Form of Avaya Holdings Corp. Second Amended and Restated 2007 Equity Incentive Plan Restricted Stock Unit Award Agreement (Incorporated by reference to Exhibit 10.42 to Avaya Inc.’s Annual Report on Form 10-K filed with the SEC on November 26, 2014) | |||
| 10.44 | Form of Avaya Holdings Corp. Second Amended and Restated 2007 Equity Incentive Plan Non-Statutory Stock Option Award Agreement (Incorporated by reference to Exhibit 10.43 to Avaya Inc.’s Annual Report on Form 10-K filed with the SEC on November 26, 2014) | |||
| 10.45 | Avaya Inc. Executive Committee 2011-2013 Performance Recognition Plan (Incorporated by reference to Exhibit 10.1 to Avaya Inc.’s Quarterly Report on Form 10-Q filed with the SEC on May 12, 2011) | |||
| 10.46 | Avaya Inc. Executive Committee Performance Recognition Plan as amended and restated effective as of October 1, 2013 (Incorporated by reference to Exhibit 10.2 to Avaya Inc.’s Current Report on Form 8-K filed with the SEC on December 17, 2013) | |||
| 10.47 | Form of Award Agreement for the Avaya Inc. Executive Committee 2011-2013 Performance Recognition Plan (Incorporated by reference to Exhibit 10.2 to Avaya Inc.’s Quarterly Report on Form 10-Q filed with the SEC on May 12, 2011) | |||
| 10.48 | Form of Award Agreement for the Avaya Inc. Executive Committee Performance Recognition Plan for 2014-2015 (Incorporated by reference to Exhibit 10.39 to Avaya Inc.’s Annual Report on Form 10-K filed with the SEC on December 12, 2012) | |||
| 10.49 | Management Stockholders’ Agreement, dated as of October 26, 2007, by and among Sierra Holdings Corp., the Majority Stockholders (as defined therein) and the individuals listed on Schedule A thereto (previously filed as Exhibit 10.25 to this Registration Statement on June 9, 2011)** | |||
| 10.50 | Form of Amended and Restated Stockholders’ Agreement, by and among TPG Partners V, L.P., TPG FOF V-A, L.P., TPG FOF V-B, L.P., Silver Lake Partners II, L.P., Silver Lake Technology Investors II, L.P., Silver Lake Partners III, L.P., Silver Lake Technology Investors III, L.P., Sierra Co-Invest, LLC, Sierra Co-Invest II, LLC and Avaya Holdings Corp.* | |||
| 10.51 | Form of Award Agreement for 2012 Sales Incentive Program (Incorporated by reference to Exhibit 10.28 to Avaya Inc.’s Annual Report on Form 10-K filed with the SEC on December 9, 2011) | |||
| 10.52 | Form of Segment Transformation Growth Incentive cash award agreement dated July 2013 (Incorporated by reference to Exhibit 10.1 to Avaya Inc.’s Quarterly Report on Form 10-Q filed with the SEC on August 9, 2013) | |||
| 10.53 | Form of Segment Transformation Growth Incentive restricted stock unit award agreement dated July 2013 (Incorporated by reference to Exhibit 10.2 to Avaya Inc.’s Quarterly Report on Form 10-Q filed with the SEC on August 9, 2013) | |||
II-11
Table of Contents
| Exhibit |
Exhibit Title | |||
| 10.54 | Stock Purchase Agreement, dated as of February 16, 2014, by and among Avaya Inc., Avaya Government Solutions, Inc., Avaya Federal Solutions, Inc., and Camber Corporation (Incorporated by reference to Exhibit 2.1 to Avaya Inc.’s Current Report on Form 8-K filed with the SEC on February 21, 2014) | |||
| 10.55 | Avaya Holdings Corp. 2014 Equity Incentive Plan* | |||
| 10.56 | Avaya Holdings Corp. Employee Stock Purchase Plan* | |||
| 21.1 | List of Subsidiaries* | |||
| 23.1 | Consent of PricewaterhouseCoopers LLP | |||
| 23.2 | Consent of Ropes & Gray LLP (included in the opinion filed as Exhibit 5.1)* | |||
| 24.1 | Powers of Attorney (included in the signature pages of this Registration Statement) | |||
| * | To be filed by amendment. |
| ** | Previously filed. |
(b) Financial Statement Schedules
All schedules are omitted because the required information is presented within consolidated financial statements included in the prospectus that is part of this registration statement.
| Item 17. | Undertakings |
(a) The undersigned registrant hereby undertakes to provide to the underwriter at the closing specified in the underwriting agreements certificates in such denominations and registered in such names as required by the underwriter to permit prompt delivery to each purchaser.
(b) Insofar as indemnification for liabilities arising under the Securities Act of 1933 may be permitted to directors, officers and controlling persons of the registrant pursuant to the foregoing provisions, or otherwise, the registrant has been advised that in the opinion of the Securities and Exchange Commission such indemnification is against public policy as expressed in the Act and is, therefore, unenforceable. In the event that a claim for indemnification against such liabilities (other than the payment by the registrant of expenses incurred or paid by a director, officer or controlling person of the registrant in the successful defense of any action, suit or proceeding) is asserted by such director, officer or controlling person in connection with the securities being registered, the registrant will, unless in the opinion of its counsel the matter has been settled by controlling precedent, submit to a court of appropriate jurisdiction the question whether such indemnification by it is against public policy as expressed in the Act and will be governed by the final adjudication of such issue.
(c) The undersigned registrant hereby undertakes that:
1. For purposes of determining any liability under the Securities Act of 1933, the information omitted from the form of prospectus filed as part of this registration statement in reliance upon Rule 430A and contained in a form of prospectus filed by the registrant pursuant to Rule 424(b)(1) or (4) or 497(h) under the Securities Act shall be deemed to be part of this registration statement as of the time it was declared effective.
2. For the purpose of determining any liability under the Securities Act of 1933, each post-effective amendment that contains a form of prospectus shall be deemed to be a new registration statement relating to the securities offered therein, and the offering of such securities at that time shall be deemed to be the initial bona fide offering thereof.
II-12
Table of Contents
SIGNATURES
Pursuant to the requirements of the Securities Act of 1933, the registrant has duly caused this registration statement to be signed on its behalf by the undersigned, thereunto duly authorized in the City of Santa Clara, State of California, on the 5th day of December, 2014.
| Avaya Holdings Corp. | ||||
| By: | /s/ DAVID VELLEQUETTE | |||
|
| ||||
| Name: | David Vellequette | |||
| Title: | Senior Vice President and Chief Financial Officer | |||
* * * *
POWER OF ATTORNEY
The undersigned directors and officers of Avaya Holdings Corp. hereby appoint each of David Vellequette and Amy Fliegelman Olli, as attorney-in-fact for the undersigned, with full power of substitution for, and in the name, place and stead of the undersigned, to sign and file with the Securities and Exchange Commission under the Securities Act of 1933, any and all amendments (including post-effective amendments) and exhibits to this registration statement on Forms S-1 (or any other registration statement for the same offering that is to be effective upon filing pursuant to Rule 462(b) under the Securities Act of 1933) and any and all applications and other documents to be filed with the Securities and Exchange Commission pertaining to the registration of the securities covered hereby, with full power and authority to do and perform any and all acts and things whatsoever requisite and necessary or desirable, hereby ratifying and confirming all that said attorney-in-fact, or his substitute or substitutes, may lawfully do or cause to be done by virtue hereof.
Pursuant to the requirements of the Securities Act of 1933, this registration statement has been signed by the following persons in the capacities and on the dates indicated.
| Signature |
Title |
Date | ||
| * Kevin J. Kennedy |
Director, President and Chief Executive Officer (Principal Executive Officer) |
December 5, 2014 | ||
| /S/ DAVID VELLEQUETTE David Vellequette |
Senior Vice President and Chief Financial Officer (Principal Financial Officer) |
December 5, 2014 | ||
| * Kevin J. MacKay |
Vice President, Controller and Chief Accounting Officer (Principal Accounting Officer) |
December 5, 2014 | ||
| * Charles H. Giancarlo |
Chairman of the Board of Directors | December 5, 2014 | ||
| /S/ MARY HENRY Mary Henry |
Director | December 5, 2014 | ||
| * John W. Marren |
Director | December 5, 2014 | ||
II-13
Table of Contents
| Signature |
Title |
Date | ||
| * Afshin Mohebbi |
Director | December 5, 2014 | ||
| * Greg K. Mondre |
Director | December 5, 2014 | ||
| /S/ KIRAN PATEL Kiran Patel |
Director | December 5, 2014 | ||
| /S/ RONALD RITTENMEYER Ronald Rittenmeyer |
Director | December 5, 2014 | ||
| * Gary B. Smith |
Director | December 5, 2014 | ||
| *By: |
/S/ DAVID VELLEQUETTE | |
|
| ||
| David Vellequette Attorney-in-Fact | ||
II-14
Table of Contents
EXHIBIT INDEX
| Exhibit |
Exhibit Title | |||
| 1.1 | Form of Underwriting Agreement* | |||
| 3.1 | Amended and Restated Certificate of Incorporation of Avaya Holdings Corp. (to be effective upon completion of this offering)* | |||
| 3.2 | Amended and Restated By-Laws of Avaya Holdings Corp. (to be effective upon completion of this offering)* | |||
| 4.1 | Exchange Note Indenture, dated as of October 24, 2008, by and among Avaya Inc., the Guarantors named therein and The Bank of New York Mellon, as Trustee (Incorporated by reference to Exhibit 4.1 to Avaya Inc.’s Registration Statement on Form S-4 filed with the SEC on December 23, 2009) | |||
| 4.2 | Supplemental Indenture, dated as of February 19, 2010, by and among Avaya Government Solutions Inc., Integrated Information Technology Corporation, AC Technologies, Inc. and The Bank of New York Mellon, as Trustee (Incorporated by reference to Exhibit 4.5 to Avaya Inc.’s Quarterly Report on Form 10-Q filed with the SEC on May 13, 2010) | |||
| 4.3 | Supplemental Indenture, dated as of July 20, 2012, among RADVision, Inc., AvayaLive Inc. and The Bank of New York Mellon, as Trustee (Incorporated by reference to Exhibit 4.1 to Avaya Inc.’s Quarterly Report on Form 10-Q filed with the SEC on August 14, 2012) | |||
| 4.4 | Supplemental Indenture dated February 15, 2013 between Avaya Inc. and The Bank of New York Mellon Trust Company, N.A., as Trustee (Incorporated by reference to Exhibit 4.3 to Avaya Inc.’s Current Report on Form 8-K filed with the SEC on March 7, 2013) | |||
| 4.5 | Form of 9.75% Senior Unsecured Notes due 2015 (included in the Exchange Note Indenture filed as Exhibit 4.1) | |||
| 4.6 | Form of 10.125%/10.875% Senior PIK Toggle Unsecured Notes due 2015 (included in the Exchange Note Indenture filed as Exhibit 4.1) | |||
| 4.7 | Indenture dated February 11, 2011 by and among Avaya Inc., the Guarantors party thereto and The Bank of New York Mellon Trust Company, N.A., as Trustee (Incorporated by reference to Exhibit 4.1 to Avaya Inc.’s Quarterly Report on Form 10-Q filed with the SEC on February 14, 2011) | |||
| 4.8 | Supplemental Indenture, dated as of July 20, 2012, among RADVision, Inc., AvayaLive Inc. and The Bank of New York Mellon, as Trustee and Collateral Agent (Incorporated by reference to Exhibit 4.2 to Avaya Inc.’s Quarterly Report on Form 10-Q filed with the SEC on August 14, 2012) | |||
| 4.9 | Pledge and Security Agreement dated February 11, 2011 by and among Avaya Inc., certain subsidiaries of Avaya Inc. from time to time party thereto and The Bank of New York Mellon Trust Company, N.A., as Collateral Agent (Incorporated by reference to Exhibit 4.3 to Avaya Inc.’s Quarterly Report on Form 10-Q filed with the SEC on February 14, 2011) | |||
| 4.10 | Supplement No. 1 dated as of July 20, 2012, to the Pledge and Security Agreement, dated as of February 11, 2011, by and among Avaya Inc., certain subsidiaries of Avaya Inc. from time to time party thereto and The Bank of New York Mellon Trust Company, N.A., as Notes Collateral Agent. (Incorporated by reference to Exhibit 10.3 to Avaya Inc.’s Quarterly Report on Form 10-Q filed with the SEC on August 14, 2012) | |||
| 4.11 | Form of 7% Senior Secured Notes due 2019 (Incorporated by reference to Exhibit 4.2 to Avaya Inc.’s Quarterly Report on Form 10-Q filed with the SEC on February 14, 2011) | |||
| 4.12 | Indenture dated December 21, 2012 by and among Avaya Inc., the Guarantors party thereto and The Bank of New York Mellon Trust Company, N.A., as Trustee (Incorporated by reference to Exhibit 4.1 to Avaya Inc.’s Current Report on Form 8-K filed with the SEC on December 21, 2012) | |||
II-15
Table of Contents
| Exhibit |
Exhibit Title | |||
| 4.13 | Form of 9% Senior Secured Note due 2019 (Incorporated by reference to Exhibit 4.2 to Avaya Inc.’s Current Report on Form 8-K filed with the SEC on December 21, 2012) | |||
| 4.14 | Pledge and Security Agreement dated December 21, 2012 by and among Avaya Inc., certain subsidiaries of Avaya Inc. from time to time party thereto and The Bank of New York Mellon Trust Company, N.A., as Notes Collateral Agent (Incorporated by reference to Exhibit 4.3 to Avaya Inc.’s Current Report on Form 8-K filed with the SEC on December 21, 2012) | |||
| 4.15 | Indenture dated March 7, 2013 by and among Avaya Inc., the guarantors party thereto and The Bank of New York Mellon Trust Company, N.A., as Trustee (Incorporated by reference to Exhibit 4.1 to Avaya Inc.’s Current Report on Form 8-K filed with the SEC on March 7, 2013) | |||
| 4.16 | Form of 10.50% Senior Secured Note due 2021 (Incorporated by reference to Exhibit 4.2 to Avaya Inc.’s Current Report on Form 8-K filed with the SEC on March 7, 2013) | |||
| 4.17 | Pledge and Security Agreement dated as of March 7, 2013 among Avaya Inc., the guarantors party thereto and The Bank of New York Mellon Trust Company, N.A., as Notes Collateral Agent (Incorporated by reference to Exhibit 4.4 to Avaya Inc.’s Current Report on Form 8-K filed with the SEC on March 7, 2013) | |||
| 4.18 | Amended and Restated Registration Rights Agreement dated as of December 18, 2009, by and among Sierra Holdings Corp. (n/k/a Avaya Holdings Corp.), TPG Partners V, L.P., TPG FOF V-A, L.P., TPG FOF V-B, L.P., Silver Lake Partners II, L.P., Silver Lake Technology Investors II, L.P., Silver Lake Partners III, L.P., Silver Lake Technology Investors III, L.P., Sierra Co-Invest, LLC and Sierra Co-Invest II, LLC (previously filed as Exhibit 4.11 to this Registration Statement on June 9, 2011) | |||
| 4.19 | Second Amended and Restated Registration Rights Agreement dated as of May 29, 2012, by and among Sierra Holdings Corp., TPG Partners V, L.P., TPG FOF V-A, L.P., TPG FOF V-B, L.P., Silver Lake Partners II, L.P., Silver Lake Technology Investors II, L.P., Silver Lake Partners III, L.P., Silver Lake Technology Investors III, L.P., Sierra Co-Invest, LLC and Sierra Co-Invest II, LLC (previously filed as Exhibit 4.19 to this Registration Statement on December 3, 2013)** | |||
| 4.20 | Senior Manager Registration and Preemptive Rights Agreement, dated as of October 26, 2007, by and among Sierra Holdings Corp. and the individual members of management listed on Schedule A thereto (previously filed as Exhibit 4.12 to this Registration Statement on June 9, 2011)** | |||
| 4.21 | Specimen Common Stock Certificate of Avaya Holdings Corp.* | |||
| 4.22 | Certificate of Designations of Series A Preferred Stock of Avaya Holdings Corp. (previously filed as Exhibit 4.9 to this Registration Statement on June 9, 2011)** | |||
| 4.23 | Certificate of Designation for Series B Preferred Stock of Avaya Holdings Corp.* | |||
| 4.24 | Form of Warrant, dated December 18, 2009 (previously filed as Exhibit 4.10 to this Registration Statement on June 9, 2011)** | |||
| 4.25 | Form of Warrant, dated May 29, 2012* | |||
| 5.1 | Opinion of Ropes & Gray LLP* | |||
| 10.1 | Purchase Agreement dated February 8, 2011 between Avaya Inc. and Morgan Stanley & Co. Incorporated, as Representative for the several Initial Purchasers identified therein (Incorporated by reference to Exhibit 10.1 to Avaya Inc.’s Quarterly Report on Form 10-Q filed with the SEC on February 14, 2011) | |||
| 10.2 | Purchase Agreement dated December 18, 2012 between Avaya Inc., the Guarantors party thereto and Citigroup Global Markets Inc., as Representative for the several Initial Purchasers identified therein (Incorporated by reference to Exhibit 10.1 to Avaya Inc.’s Current Report on Form 10-K filed with the SEC on December 21, 2012) | |||
II-16
Table of Contents
| Exhibit |
Exhibit Title | |||
| 10.3 | Credit Agreement, dated as of October 26, 2007, by and among Avaya Inc., as Borrower, Sierra Holdings Corp. (n/k/a Avaya Holdings Corp.), Citibank, N.A., as Administrative Agent, Swing Line Lender and L/C Issuer, the other lenders party thereto, Morgan Stanley Senior Funding, Inc., as Syndication Agent, JPMorgan Chase Bank, N.A., as Documentation Agent, and Citigroup Global Markets Inc., Morgan Stanley Senior Funding, Inc., and J.P. Morgan Securities Inc., as Joint Lead Arrangers and Joint Bookrunners (Incorporated by reference to Exhibit 10.1 to Avaya Inc.’s Registration Statement on Form S-4 filed with the SEC on December 23, 2009) | |||
| 10.4 | Amendment No. 1 to Credit Agreement, dated as of December 18, 2009, among Avaya Inc., the lenders party thereto and Citibank, N.A., as Administrative Agent (Incorporated by reference to Exhibit 10.5 to Avaya Inc.’s Registration Statement on Form S-4 filed with the SEC on December 23, 2009) | |||
| 10.5 | Amendment No. 2 to Credit Agreement dated February 11, 2011, by and among Avaya Inc., Citibank, N.A., as Administrative Agent, and each lender party thereto, amending Credit Agreement, dated as of October 26, 2007, by and among Avaya Inc., Sierra Holdings Corp. (n/k/a Avaya Holdings Corp.), Citibank, N.A., as Administrative Agent, Swing Line Lender and L/C Issuer and each lender party thereto (Incorporated by reference to Exhibit 10.2 to Avaya Inc.’s Quarterly Report on Form 10-Q filed with the SEC on February 14, 2011) | |||
| 10.6 | Amended and Restated Credit Agreement dated February 11, 2011, by and among Avaya Inc., Sierra Holdings Corp. (n/k/a Avaya Holdings Corp.), Citibank N.A., as Administrative Agent, Swing Line Lender and L/C Issuer, and each lender from time to time party thereto (Incorporated by reference to Exhibit 10.3 to Avaya Inc.’s Quarterly Report on Form 10-Q filed with the SEC on February 14, 2011) | |||
| 10.7 | Amendment No. 3 to Credit Agreement dated August 8, 2011, by and among Avaya Inc., Citibank, N.A., as Administrative Agent, and each lender party thereto, amending the Amended and Restated Credit Agreement, dated as of February 11, 2011, by and among Avaya Inc., Avaya Holdings Corp., Citibank, N.A., as Administrative Agent, Swing Line Lender and L/C Issuer and each lender party thereto (Incorporated by reference to Exhibit 10.1 to Avaya Inc.’s Quarterly Report on Form 10-Q filed with the SEC on August 11, 2011) | |||
| 10.8 | Amendment No. 4 to Credit Agreement, dated as of October 29, 2012, among Avaya Inc., Citibank, N.A., as Administrative Agent, and the lenders party thereto (Incorporated by reference to Exhibit 10.3 to Avaya Inc.’s Current Report on Form 8-K filed with the SEC on November 2, 2012) | |||
| 10.9 | Second Amended and Restated Credit Agreement, dated as of October 29, 2012, among Avaya Inc., Avaya Holdings Corp., Citibank N.A., as Administrative Agent, Swing Line Lender and L/C Issuer, and each lender from time to time party thereto* (Incorporated by reference to Exhibit 10.4 to Avaya Inc.’s Current Report on Form 8-K filed with the SEC on November 2, 2012) | |||
| 10.10 | Amendment No. 5 to Credit Agreement, dated as of December 21, 2012, among Avaya Inc., Citibank, N.A., as Administrative Agent, and the lenders party thereto (Incorporated by reference to Exhibit 10.1 to Avaya Inc.’s Current Report on Form 8-K filed with the SEC on December 21, 2012) | |||
| 10.11 | Third Amended and Restated Credit Agreement, dated as of December 21, 2012, among Avaya Inc., Avaya Holdings Corp., Citibank N.A., as Administrative Agent, Swing Line Lender and L/C Issuer, and each lender from time to time party thereto (Incorporated by reference to Exhibit 10.2 to Avaya Inc.’s Current Report on Form 8-K filed with the SEC on December 21, 2012) | |||
| 10.12 | Amendment No. 6 to Credit Agreement, dated as of February 13, 2013, among Avaya Inc., Citibank, N.A., as Administrative Agent, and the lenders party thereto (Incorporated by reference to Exhibit 10.3 to Avaya Inc.’s Current Report on Form 8-K filed with the SEC on February 19, 2013) | |||
| 10.13 | Amendment No. 7 to Credit Agreement, dated as of March 12, 2013, among Avaya Inc., Citibank, N.A., as Administrative Agent, and the lenders party thereto (Incorporated by reference to Exhibit 10.1 to Avaya Inc.’s Current Report on Form 8-K filed with the SEC on March 14, 2013) | |||
II-17
Table of Contents
| Exhibit |
Exhibit Title | |||
| 10.14 | Amendment No. 8 to Credit Agreement, dated as of February 5, 2014, among Avaya Inc., Citibank N.A., as Administrative Agent, and the lenders party thereto (Incorporated by reference to Exhibit 10.1 to Avaya Inc.’s Current Report on Form 8-K filed with the SEC on February 11, 2014) | |||
| 10.15 | Pledge and Security Agreement, dated as of October 26, 2007, by and among Avaya Inc., as Borrower, Sierra Holdings Corp. (n/k/a Avaya Holdings Corp.), certain subsidiaries of Avaya Inc. identified therein and Citibank, N.A., as Administrative Agent (Incorporated by reference to Exhibit 10.2 to Avaya Inc.’s Registration Statement on Form S-4 filed with the SEC on December 23, 2009) | |||
| 10.16 | Supplement No. 1 dated as of February 15, 2008, to the Pledge and Security Agreement, dated as of October 26, 2007, by and among Avaya Inc., certain subsidiaries of Avaya Inc. from time to time party thereto and The Bank of New York Mellon Trust Company, N.A., as Notes Collateral Agent. (Incorporated by reference to Exhibit 10.6 to Avaya Inc.’s Quarterly Report on Form 10-Q filed with the SEC on August 14, 2012) | |||
| 10.17 | Supplement No. 2 dated as of January 29, 2010, to the Pledge and Security Agreement, dated as of October 26, 2007, by and among Avaya Inc., as Borrower, Sierra Holdings Corp. (n/k/a Avaya Holdings Corp.), certain subsidiaries of Avaya Inc. identified therein and Citibank, N.A., as Administrative Agent. (Incorporated by reference to Exhibit 10.6 to Avaya Inc.’s Quarterly Report on Form 10-Q filed with the SEC on August 14, 2012) | |||
| 10.18 | Supplement No. 3 dated as of July 20, 2012, to the Pledge and Security Agreement, dated as of October 26, 2007, by and among Avaya Inc., as Borrower, Avaya Holdings Corp., certain subsidiaries of Avaya Inc. identified therein and Citibank, N.A., as Administrative Agent. (Incorporated by reference to Exhibit 10.2 to Avaya Inc.’s Quarterly Report on Form 10-Q filed with the SEC on August 14, 2012) | |||
| 10.19 | Guaranty, dated as of October 26, 2007, by and among Sierra Holdings Corp. (n/k/a Avaya Holdings Corp.), certain subsidiaries of Avaya Inc. identified therein and Citibank, N.A., as Administrative Agent (Incorporated by reference to Exhibit 10.3 to Avaya Inc.’s Registration Statement on Form S-4 filed with the SEC on December 23, 2009) | |||
| 10.20 | Supplement No. 1 dated as of February 15, 2008, to the Guaranty, dated as of October 26, 2007, by and among Sierra Holdings Corp. (n/k/a Avaya Holdings Corp.), certain subsidiaries of Avaya Inc. from time to time party thereto and Citibank, N.A., as Administrative Agent (Incorporated by reference to Exhibit 10.10 to Avaya Inc.’s Quarterly Report on Form 10-Q filed with the SEC on August 14, 2012) | |||
| 10.21 | Supplement No. 2 dated as of January 29, 2010, to the Guaranty, dated as of October 26, 2007, by and among Sierra Holdings Corp. (n/k/a Avaya Holdings Corp.), certain subsidiaries of Avaya Inc. from time to time party thereto and Citibank, N.A., as Administrative Agent (Incorporated by reference to Exhibit 10.7 to Avaya Inc.’s Quarterly Report on Form 10-Q filed with the SEC on August 14, 2012) | |||
| 10.22 | Supplement No. 3 dated as of July 20, 2012, to the Guaranty, dated as of October 26, 2007, by and among Avaya Holdings Corp., certain subsidiaries of Avaya Inc. from time to time party thereto and Citibank, N.A., as Administrative Agent (Incorporated by reference to Exhibit 10.4 to Avaya Inc.’s Quarterly Report on Form 10-Q filed with the SEC on August 14, 2012) | |||
| 10.23 | Credit Agreement, dated as of October 26, 2007, by and among Avaya Inc., as Parent Borrower, the several subsidiary borrowers party thereto, Sierra Holdings Corp. (n/k/a Avaya Holdings Corp.), Citicorp USA, Inc., as Administrative Agent and Swing Line Lender, Citibank, N.A., as L/C Issuer, the other lenders party thereto, Morgan Stanley Senior Funding, Inc., as Syndication Agent, JPMorgan Chase Bank, N.A., as Documentation Agent, and Citigroup Global Markets Inc., Morgan Stanley Senior Funding, Inc. and J.P. Morgan Securities Inc., as Joint Lead Arrangers and Joint Bookrunners (Incorporated by reference to Exhibit 10.4 to Avaya Inc.’s Registration Statement on Form S-4 filed with the SEC on December 23, 2009) | |||
II-18
Table of Contents
| Exhibit |
Exhibit Title | |||
| 10.24 | Amendment No. 1 to Credit Agreement, dated as of August 8, 2011, by and among Avaya Inc., the several subsidiary borrowers party thereto, Citicorp USA, Inc., as Administrative Agent and the lenders party thereto, amending the Credit Agreement, dated as of October 26, 2007, by and among Avaya Inc., the several subsidiary borrowers party thereto, Avaya Holdings Corp., Citicorp USA, Inc., as Administrative Agent and the lenders party thereto (Incorporated by reference to Exhibit 10.2 to Avaya Inc.’s Quarterly Report on Form 10-Q filed with the SEC on August 11, 2011) | |||
| 10.25 | Amendment No. 2 to Credit Agreement, dated as of October 29, 2012, among Avaya Inc., the several Subsidiary Borrowers party thereto, Citicorp USA, Inc., as Administrative Agent, and the lenders party thereto (Incorporated by reference to Exhibit 10.1 to Avaya Inc.’s Current Report on Form 8-K filed with the SEC on November 2, 2012) | |||
| 10.26 | Amended and Restated Credit Agreement, dated as of October 29, 2012, among Avaya Inc., the several Subsidiary Borrowers party thereto, Avaya Holdings Corp., Citicorp USA, Inc., as Administrative Agent and Swing Line Lender, Citibank, N.A., as L/C Issuer, and each lender from time to time party thereto (Incorporated by reference to Exhibit 10.2 to Avaya Inc.’s Current Report on Form 8-K filed with the SEC on November 2, 2012) | |||
| 10.27 | Amendment No. 3 to Credit Agreement, dated as of February 13, 2013, among Avaya Inc., the several Subsidiary Borrowers party thereto, Citicorp USA, Inc., as Administrative Agent, and the lenders party thereto (Incorporated by reference to Exhibit 10.3 to Avaya Inc.’s Current Report on Form 8-K filed with the SEC on February 19, 2013) | |||
| 10.28 | Pledge and Security Agreement, dated as of October 26, 2007, by and among Avaya Inc., as Parent Borrower, Sierra Holdings Corp. (n/k/a Avaya Holdings Corp.), certain subsidiaries of Avaya Inc. identified therein, as Subsidiary Borrowers and Citicorp USA, Inc., as Administrative Agent (Incorporated by reference to Exhibit 10.6 to Avaya Inc.’s Registration Statement on Form S-4 filed with the SEC on December 23, 2009) | |||
| 10.29 | Supplement No. 1 dated as of February 15, 2008, to the Pledge and Security Agreement, dated as of October 26, 2007, by and among Avaya Inc., as Parent Borrower, Sierra Holdings Corp. (n/k/a Avaya Holdings Corp.), certain subsidiaries of Avaya Inc. identified therein, as Subsidiary Borrowers and Citicorp USA, Inc., as Administrative Agent. (Incorporated by reference to Exhibit 10.8 to Avaya Inc.’s Quarterly Report on Form 10-Q filed with the SEC on August 14, 2012) | |||
| 10.30 | Supplement No. 2 dated as of January 29, 2010, to the Pledge and Security Agreement, dated as of October 26, 2007, by and among Avaya Inc., as Parent Borrower, Sierra Holdings Corp. (n/k/a Avaya Holdings Corp.), certain subsidiaries of Avaya Inc. identified therein and Citibank, N.A., as Administrative Agent. (Incorporated by reference to Exhibit 10.5 to Avaya Inc.’s Quarterly Report on Form 10-Q filed with the SEC on August 14, 2012) | |||
| 10.31 | Supplement No. 3 dated as of July 20, 2012, to the Pledge and Security Agreement, dated as of October 26, 2007, by and among Avaya Inc., as Parent Borrower, Avaya Holdings Corp., certain subsidiaries of Avaya Inc. identified therein, as Subsidiary Borrowers and Citicorp USA, Inc., as Administrative Agent. (Incorporated by reference to Exhibit 10.1 to Avaya Inc.’s Quarterly Report on Form 10-Q filed with the SEC on August 14, 2012) | |||
| 10.32 | Guaranty, dated as of October 26, 2007, by and among Sierra Holdings Corp., certain subsidiaries of Avaya Inc. from time to time party thereto and Citicorp USA, Inc., as Administrative Agent (Incorporated by reference to Exhibit 10.7 to Avaya Inc.’s Registration Statement on Form S-4 filed with the SEC on December 23, 2009) | |||
| 10.33 | Executive Employment Agreement, dated as of December 22, 2008, by and among Kevin J. Kennedy, Avaya Inc. and Sierra Holdings Corp. (Incorporated by reference to Exhibit 10.8 to Avaya Inc.’s Registration Statement on Form S-4 filed with the SEC on December 23, 2009) | |||
II-19
Table of Contents
| Exhibit |
Exhibit Title | |||
| 10.34 | Amendment to Executive Employment Agreement, dated October 12, 2009 among Kevin J. Kennedy, Avaya Inc. and Sierra Holdings Corp. (Incorporated by reference to Exhibit 10.9 to Avaya Inc.’s Registration Statement on Form S-4 filed with the SEC on December 23, 2009) | |||
| 10.35 | Avaya Inc. Involuntary Separation Plan for Senior Officers, as amended (Incorporated by reference to Exhibit 10.10 to Avaya Inc.’s Registration Statement on Form S-4 filed with the SEC on December 23, 2009) | |||
| 10.36 | Form of Indemnity Agreement between Sierra Holdings Corp., Avaya Inc. and certain directors of the Registrant (Incorporated by reference to Exhibit 10.11 to Avaya Inc.’s Registration Statement on Form S-4 filed with the SEC on December 23, 2009) | |||
| 10.37 | Form of Indemnity Agreement between Sierra Holdings Corp., Avaya Inc. and certain officers of the Registrant (Incorporated by reference to Exhibit 10.12 to Avaya Inc.’s Registration Statement on Form S-4 filed with the SEC on December 23, 2009) | |||
| 10.38 | Avaya Inc. Savings Restoration Plan, as amended (Incorporated by reference to Exhibit 10.13 to Avaya Inc.’s Registration Statement on Form S-4 filed with the SEC on December 23, 2009) | |||
| 10.39 | Avaya Inc. Short Term Incentive Plan (Incorporated by reference to Exhibit 10.14 to Avaya Inc.’s Registration Statement on Form S-4 filed with the SEC on December 23, 2009) | |||
| 10.40 | Management Services Agreement, dated as of October 2, 2007, by and among Sierra Holdings Corp., Avaya Inc. (as successor by merger to Sierra Merger Corp.), TPG Capital, L.P. and Silver Lake Management Company III, L.L.C. (Incorporated by reference to Exhibit 10.15 to Avaya Inc.’s Registration Statement on Form S-4 filed with the SEC on December 23, 2009) | |||
| 10.41 | Letter Agreement, dated as of December 12, 2013, by and among Avaya Holdings Corp., Avaya Inc. and TPG Capital Management, L.P. (Incorporated by reference to Exhibit 10.1 to Avaya Inc.’s Current Report on Form 8-K filed with the SEC on December 17, 2013). | |||
| 10.42 | Avaya Holdings Corp. Second Amended and Restated 2007 Equity Incentive Plan (Incorporated by reference to Exhibit 10.41 to Avaya Inc.’s Current Report on Form 10-K filed with the SEC on November 26, 2014) | |||
| 10.43 | Form of Avaya Holdings Corp. Second Amended and Restated 2007 Equity Incentive Plan Restricted Stock Unit Award Agreement (Incorporated by reference to Exhibit 10.42 to Avaya Inc.’s Current Report on Form 10-K filed with the SEC on November 26, 2104) | |||
| 10.44 | Form of Avaya Holdings Corp. Second Amended and Restated 2007 Equity Incentive Plan Non-Statutory Stock Option Award Agreement (Incorporated by reference to Exhibit 10.43 to Avaya Inc.’s Annual Report on Form 10-K filed with the SEC on November 26, 2014) | |||
| 10.45 | Avaya Inc. Executive Committee 2011-2013 Performance Recognition Plan (Incorporated by reference to Exhibit 10.1 to Avaya Inc.’s Quarterly Report on Form 10-Q filed with the SEC on May 12, 2011) | |||
| 10.46 | Avaya Inc. Executive Committee Performance Recognition Plan as amended and restated effective as of October 1, 2013 (Incorporated by reference to Exhibit 10.2 to Avaya Inc.’s Current Report on Form 8-K filed with the SEC on December 17, 2013) | |||
| 10.47 | Form of Award Agreement for the Avaya Inc. Executive Committee 2011-2013 Performance Recognition Plan (Incorporated by reference to Exhibit 10.2 to Avaya Inc.’s Quarterly Report on Form 10-Q filed with the SEC on May 12, 2011) | |||
| 10.48 | Form of Award Agreement for the Avaya Inc. Executive Committee Performance Recognition Plan for 2014-2015 (Incorporated by reference to Exhibit 10.39 to Avaya Inc.’s Annual Report on Form 10-K filed with the SEC on December 12, 2012) | |||
| 10.49 | Management Stockholders’ Agreement, dated as of October 26, 2007, by and among Sierra Holdings Corp., the Majority Stockholders (as defined therein) and the individuals listed on Schedule A thereto (previously filed as Exhibit 10.25 to this Registration Statement on June 9, 2011)** | |||
II-20
Table of Contents
| Exhibit |
Exhibit Title | |||
| 10.50 | Form of Amended and Restated Stockholders’ Agreement, by and among TPG Partners V, L.P., TPG FOF V-A, L.P., TPG FOF V-B, L.P., Silver Lake Partners II, L.P., Silver Lake Technology Investors II, L.P., Silver Lake Partners III, L.P., Silver Lake Technology Investors III, L.P., Sierra Co-Invest, LLC, Sierra Co-Invest II, LLC and Avaya Holdings Corp.* | |||
| 10.51 | Form of Award Agreement for 2012 Sales Incentive Program (Incorporated by reference to Exhibit 10.28 to Avaya Inc.’s Annual Report on Form 10-K filed with the SEC on December 9, 2011) | |||
| 10.52 | Form of Segment Transformation Growth Incentive cash award agreement dated July 2013 (Incorporated by reference to Exhibit 10.1 to Avaya Inc.’s Quarterly Report on Form 10-Q filed with the SEC on August 9, 2013) | |||
| 10.53 | Form of Segment Transformation Growth Incentive restricted stock unit award agreement dated July 2013 (Incorporated by reference to Exhibit 10.2 to Avaya Inc.’s Quarterly Report on Form 10-Q filed with the SEC on August 9, 2013) | |||
| 10.54 | Stock Purchase Agreement, dated as of February 16, 2014, by and among Avaya Inc., Avaya Government Solutions Inc., Avaya Federal Solutions, Inc. and Camber Corporation (Incorporated by reference to Exhibit 2.1 to Avaya Inc.’s Current Report on Form 8-K filed with the SEC on February 21, 2014) | |||
| 10.55 | Avaya Holdings Corp. 2014 Equity Incentive Plan* | |||
| 10.56 | Avaya Holdings Corp. Employee Stock Purchase Plan* | |||
| 21.1 | List of Subsidiaries* | |||
| 23.1 | Consent of PricewaterhouseCoopers LLP | |||
| 23.2 | Consent of Ropes & Gray LLP (included in the opinion filed as Exhibit 5.1)* | |||
| 24.1 | Powers of Attorney (included in the signature pages of this Registration Statement) | |||
| * | To be filed by amendment. |
| ** | Previously filed. |
II-21