Attached files
| file | filename |
|---|---|
| 8-K - CURRENT REPORT OF MATERIAL EVENTS OR CORPORATE CHANGES - Lightstone Value Plus REIT V, Inc. | a14-25612_18k.htm |
Exhibit 99.1
|
|
Behringer Harvard Opportunity REIT II, Inc. Third Quarter 2014 Update Lakewood Flats, Dallas, TX |
|
|
Dial-In and Replay Information To listen to today’s call: Dial: 888-287-5534 Conference ID: 1132578 For a replay of today’s call: Dial: 888-203-1112 Conference ID: 1132578 |

|
|
Forward-Looking Statements This presentation contains forward-looking statements, including discussion and analysis of the financial condition of us and our subsidiaries and other matters. These forward-looking statements are not historical facts but are the intent, belief or current expectations of our management based on their knowledge and understanding of our business and industry. Words such as “may,” “anticipates,” “expects,” “intends,” “plans,” “believes,” “seeks,” “estimates,” “would,” “could,” “should” and variations of these words and similar expressions are intended to identify forward-looking statements. We intend that such forward-looking statements be subject to the safe harbor provisions created by Section 27A of the Securities Act of 1933 and Section 21E of the Securities Exchange Act of 1934. These statements are not guarantees of future performance and are subject to risks, uncertainties and other factors, some of which are beyond our control, are difficult to predict and could cause actual results to differ materially from those expressed or forecasted in the forward-looking statements. Forward-looking statements that were true at the time made may ultimately prove to be incorrect or false. We caution you not to place undue reliance on forward-looking statements, which reflect our management's view only as of the date of this presentation. We undertake no obligation to update or revise forward-looking statements to reflect changed assumptions the occurrence of unanticipated events or changes to future operating results. |
|
|
Forward-Looking Statements Factors that could cause actual results to differ materially from any forward-looking statements made in the presentation include but are not limited to: market and economic challenges experienced by the U.S. and global economies or real estate industry as a whole and the local economic conditions in the markets in which our properties are located; our ability to make accretive investments in a diversified portfolio of assets; our ability to retain our executive officers and other key personnel of our advisor, our property manager and their affiliates; conflicts of interest arising out of our relationships with our advisor and its affiliates; future changes in market factors that could affect the ultimate performance of our development or redevelopment projects, including but not limited to construction costs, plan or design changes, schedule delays, availability of construction financing, performance of developers, contractors and consultants, and growth in rental rates and operating costs; the availability of cash flow from operating activities for distributions, if any; our level of debt and the terms and limitations imposed on us by our debt agreements; the availability of credit generally, and any failure to obtain debt financing at favorable terms or a failure to satisfy the conditions and requirements of that debt; our ability to secure leases at favorable rental rates; unfavorable changes in laws or regulations impacting our business, our assets or our key relationships; and factors that could affect our ability to qualify as a real estate investment trust. The forward-looking statements should be read in light of these and other risk factors identified in the “Risk Factors” section of our Annual Report on Form 10-K for the year ended December 31, 2013, as filed with the Securities and Exchange Commission. |
|
|
Agenda Notable Events Strategy Review Financial Review Portfolio Updates Questions Lakes of Margate, Margate, FL |
|
|
Estimated Share Valuation New estimated per-share value of $9.72 Increase of $0.13 per share Compares with previous adjusted per-share value of $9.59 Previous adjusted per share value is the result of the $0.50 per share special cash distribution paid in September 2014 Special cash distribution reduced the $10.09 share price established in August 2013 New per-share value reflects: Our ability to manage portfolio consistent with value-creation objectives The strength of investment selection process and asset management practices Our ability to take advantage of value-creating opportunities |
|
|
Growth in Total Value Total Value Walk-Through November 2014 August 2013 Share Price $9.72 $10.09 Cumulative Regular Distributions 1 1.77 1.77 Special Cash Distribution (2012) 0.50 0.50 Special Cash Distribution (2014) 0.50 - Total Value $12.49 $12.36 1 Based on a share purchased at $10.00 on April 1, 2008 |
|
|
ESV Allocation (1) Accounted for as an investment in unconsolidated joint venture on our condensed consolidated balance sheet at September 30, 2014. (per share data) Oct. 31, 2014 ESV Aug. 1, 2013 ESV Change Real estate: Operating 16.19 $ 16.01 $ 0.18 $ Mezzanine loan investment (1) 0.53 0.53 - Cash and cash equivalents 2.92 2.64 0.28 Restricted cash 0.17 0.27 (0.10) Notes payable (8.78) (8.20) (0.58) Other assets and liabilities (0.20) (0.27) 0.07 Noncontrolling interests (1.11) (0.89) (0.22) Estimated net asset value per share 9.72 $ 10.09 $ (0.37) $ Estimated enterprise value premium - - - Total estimated value per share 9.72 $ 10.09 $ (0.37) $ Less Special Distribution - (0.50) 0.50 Total estimated value per share, as adjusted 9.72 $ 9.59 $ 0.13 $ Allocation of Estimated Share Value |
|
|
© 2014 Behringer Valuation Methodology* • Engaged Capright Property Advisors LLC and obtained their opinions regarding: • The “as is” market value of the Company’s real estate investments • The reasonableness of the methodology and valuation conclusions of the Advisor for the Company’s other assets and liabilities • Board of directors approved the new ESV on November 21, 2014 * For more information about the estimated valuation, please refer to the Company’s Form 8-K filed with the SEC on December 2, 2014. |

|
|
Operating Strategy 1875 Lawrence, Denver, CO Adhere to our proven investment strategy, which has: Improved portfolio performance Generated attractive returns Maintain a strong balance sheet, which provides flexibility to execute Stabilize and grow cash flow of existing portfolio of assets Complete selective asset sales Consider special cash distributions from asset sales |
|
|
© 2014 Behringer Notable Events • $0.50 per share special cash distribution paid on September 18, 2014 • Acquired Lakewood Flats, a 435-unit multifamily community in Dallas • Contract price: $60.5 million • OP2 invested $27 million of equity • Property is 94% leased • Contract to sell Babcock Self Storage • Expect to close in late-2014/early-2015 • Jason Hall elected CFO • Continues to serve as chief accounting officer Lakewood Flats, Dallas, TX |

|
|
© 2014 Behringer Financial Review Selected Same-Store Data (Per share) 2014 2013 Change Funds From Operations $0.02 ($0.04) $0.06 2014 2013 Change Funds From Operations $0.06 ($0.07) $0.13 Three Months Ended September 30, Nine Months Ended September 30, Funds From Operations (1) ($ amounts in thousands) 2014 2013 Change % Change Rental Revenue - Same Store 6,832 $ 6,561 $ 271 $ 4.1% Property Operating Expenses - Same Store 2,668 $ 2,475 $ 193 $ 7.8% Hotel Revenue 3,812 $ 3,982 $ (170) $ -4.3% Hotel Operating Expenses 3,028 $ 3,008 $ 20 $ 0.7% 2014 2013 Change % Change Rental Revenue - Same Store 14,668 $ 14,018 $ 650 $ 4.6% Property Operating Expenses - Same Store 4,952 $ 4,690 $ 262 $ 5.6% Hotel Revenue 12,313 $ 10,994 $ 1,319 $ 12.0% Hotel Operating Expenses 9,037 $ 8,496 $ 541 $ 6.4% Three Months Ended September 30, Nine Months Ended September 30, (1) For a reconciliation of Funds From Operations to Net Income, refer to Current Report on Form 8-K filed on December 4, 2014. |

|
|
Financial Review (cont.) (In thousands) Sept. 30, Dec. 31, 2014 2013 Change Total assets $384,257 $414,375 ($30,118) Notes payable $193,243 $212,037 ($18,794) Total liabilities $202,818 $221,586 ($18,768) Selected Balance Sheet Data |
|
|
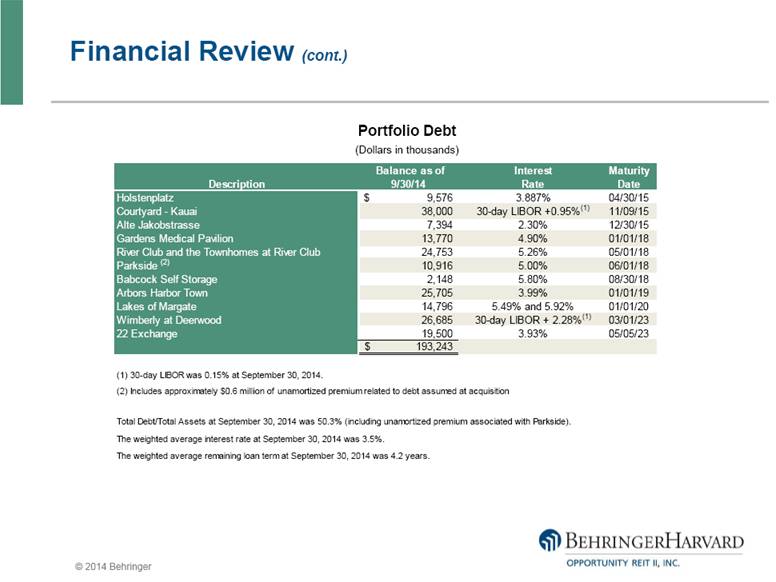
© 2014 Behringer Financial Review (cont.) (Dollars in thousands) Portfolio Debt Interest Maturity Description 9/30/14 Rate Date Holstenplatz 9,576 $ 3.887% 04/30/15 Courtyard - Kauai 38,000 30-day LIBOR +0.95%(1) 11/09/15 Alte Jakobstrasse 7,394 2.30% 12/30/15 Gardens Medical Pavilion 13,770 4.90% 01/01/18 River Club and the Townhomes at River Club 24,753 5.26% 05/01/18 Parkside (2) 10,916 5.00% 06/01/18 Babcock Self Storage 2,148 5.80% 08/30/18 Arbors Harbor Town 25,705 3.99% 01/01/19 Lakes of Margate 14,796 5.49% and 5.92% 01/01/20 Wimberly at Deerwood 26,685 30-day LIBOR + 2.28%(1) 03/01/23 22 Exchange 19,500 3.93% 05/05/23 193,243 $ (1) 30-day LIBOR w as 0.15% at September 30, 2014. (2) Includes approximately $0.6 million of unamortized premium related to debt assumed at acquisition Total Debt/Total Assets at September 30, 2014 w as 50.3% (including unamortized premium associated w ith Parkside). The w eighted average interest rate at September 30, 2014 w as 3.5%. The w eighted average remaining loan term at September 30, 2014 w as 4.2 years. Balance as of |
|
|
Behringer Harvard Opportunity REIT II Portfolio GERMAN OFFICE INVESTMENTS Holstenplatz Alte Jakobstrasse River Club 22 Exchange STUDENT HOUSING INVESTMENTS MULTIFAMILY INVESTMENTS Parkside Apartments Lakes of Margate Arbors Harbor Town Wimberly at Deerwood Courtyard by Marriott - Kauai Babcock Self Storage Gardens Medical Pavilion Prospect Park Development Mezzanine Financing Lakewood Flats Under Contract |
|
|
Courtyard Marriott Kauai, Hawaii Year-over-year improvement in key operating measures (year to date through September 30) Revenues: +12% Occupancy rate: +3 pct. pts. ADR: +10% RevPar: +13% NOI: +33% Tropical storms adversely impacted operations Affected Q3 performance Will affect Q4 performance Courtyard by Marriott at Coconut Beach, Kauai, HI |
|
|
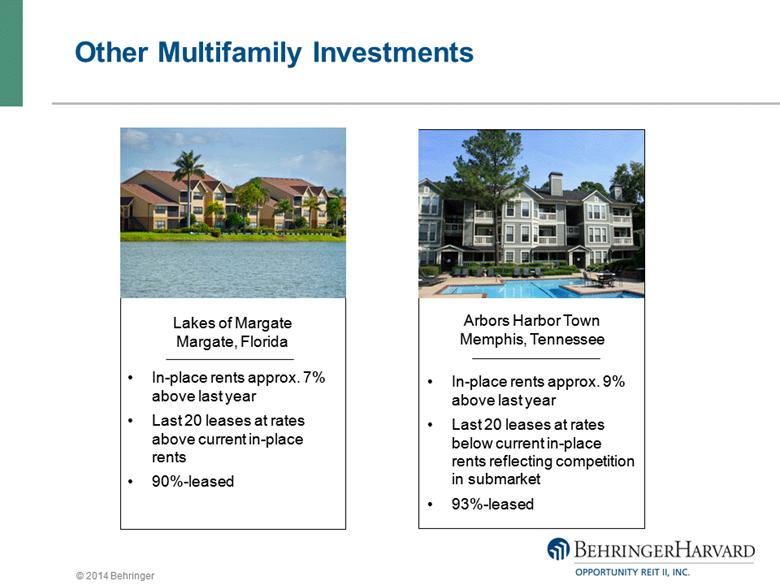
Arbors Harbor Town Memphis, Tennessee In-place rents approx. 9% above last year Last 20 leases at rates below current in-place rents reflecting competition in submarket 93%-leased Other Multifamily Investments Lakes of Margate Margate, Florida In-place rents approx. 7% above last year Last 20 leases at rates above current in-place rents 90%-leased |
|
|
Other Multifamily Investments (cont.) Parkside Apartments Sugar Land, Texas Early stages of renovation Last 20 leases at rates nearly 5% above current in-place rents 89%-leased Wimberly at Deerwood Jacksonville, Florida Renovations completed In-place rents approx. 7% above last year Last 20 leases at rates above current in-place rents 93%-leased |

|
|
River Club Athens, Georgia Currently 100% leased for 2014/15 academic year Encouraging results from pre-leasing campaign Strategy is to build upon current occupancy base and grow revenues Student Housing Investments 22 Exchange Akron, Ohio Currently 85% leased for 2014/15 academic year Recently kicked off pre-leasing campaign Transitioning to new property manager |

|
|
Playback Information Representatives may log on to the password-protected portion of the Behringer website (www.behringerinvestments.com) for a playback of today’s call Investors may dial toll free (888) 203-1112 and use conference ID 1132578 to access a playback of today’s call Replays will be available until January 2, 2015 |