Attached files
| file | filename |
|---|---|
| 8-K - 8-K - SquareTwo Financial Corp | a8kforbamlpresentation12-2.htm |

SQUARETWO FINANCIAL CORPORATION DELIVERING THE December 3, 2014

SAFE HARBOR PROVISIONS 2 Certain statements made in this presentation are forward-looking statements under the Private Securities Litigation Reform Act of 1995. These can be identified by words such as "intend," "believe," and "expect," and phrases using those or similar terms. Specifically, statements relating to projections of future proceeds, revenue, income, profitability, cash flow, non-GAAP financial measures such as Adjusted EBITDA, Estimated Remaining Proceeds (“ERP”), and our ability to expand and utilize flexibility under our credit facility are forward-looking statements. These forward‐looking statements are not guarantees of our future performance and are subject to risks and uncertainties that could cause actual results to differ materially from the results contemplated by the forward‐looking statements. Factors that could affect our results and cause them to materially differ from those contained in the forward looking statements include those that we discuss in “Risk Factors” or comparable headings in our December 31, 2013 Form 10-K filed with the SEC. Adjusted EBITDA and ERP are supplemental measures of our performance and purchased debt asset value, respectively, that are not required by, or presented in accordance with, accounting principles generally accepted in the U.S., also known as “GAAP.” They are not measurements of our financial performance or asset value under GAAP and should not be considered as alternatives to net income, asset value, or any other performance measures derived in accordance with GAAP, or as alternatives to cash flows from operating activities or a measure of our liquidity. We believe adjusted EBITDA is representative of our cash flow generation that can be used to purchase charged-off receivables, pay down or service debt, pay income taxes, and for other uses. ERP represents the expected cash proceeds of our then-current purchased debt portfolios over a nine year period. You are, however, cautioned not to place undue reliance on adjusted EBITDA and ERP.

SquareTwo Financial Headquarters Denver, Colorado SQUARETWO OVERVIEW • Top five Fresh Consumer & Commercial debt buyer in U.S • Assist companies and consumers in resolving debt commitments • Award-winning, proprietary technology and analytics • Unique Business Model with closed loop network • Integrated compliance management system • KRG Holding – Private equity owner since 2005 • Capital structure includes $290M of bonds • Current revolver capacity of $245M 3

ACCOUNT LIFECYCLE 4 ($ 000’s) *For illustration purposes only. Market pricing, returns and costs to collect fluctuate as a result of multiple variables. Time Acquisition Purchase date Approximately 100-120 purchases made annually Non-legal Collections – 50% to 60% 40 – 45% in 1st 6 months Cash proceeds collected by call centers via letters or phone calls Legal Collections – 35% to 40% 2–6 years (Majority after 3 years) Cash proceeds collected by Branch offices via legal processes Other - 5% to 10% Gross Proceeds: $500 Throughout collection cycle Recourse, BK Proceeds, and Court Cost Recoveries Gross Proceeds 2.25x gross ROI Costs to Collect Payments to Branch offices/call centers and Court Cost expenditures Other SG&A Back office and administrative costs Net Proceeds 1.3x net ROI $3,900 ($350) ($2,500) $6,750 Gross Proceeds: $2,500 Face Value: $30,000 Cost @ 10%: $3,000 Gross Proceeds: $3,750

5 INDUSTRY EVOLUTION Federal Regulation • CFPB regulatory authority has resulted in tighter controls and practices throughout industry. • OCC regulation on 4th party risk has forced banks to increase buyer diligence strengthening relationships with the industry’s top buyers. Banking Environment • Financial institutions are heavily focused on compliance and control, customer experience, brand protection and reputation risk. • Dramatic decrease in number of approved buyers across all financial institutions. Large Banks will approve 3-5 buyers, down from 30+ just 3 years ago. Industry Progression • Market dominated by 3-5 large sophisticated buyers who can maintain the cost of broad scale compliance management systems. • Inability to keep up with changing regulations, increasing compliance investment requirements, and higher portfolio prices have forced middle and small market organizations out of the market. BANKING ENVIRONMENT INDUSTRY PROGRESSION FEDERAL REGULATION The debt buying industry has evolved over the last three years…

CLOSED LOOP NETWORK 6 • One system of record throughout account lifecycle regardless of account location • Integrated compliance management system maintained systemically • Centralized back office and management services are scalable as Network grows

7 FINANCIAL OVERVIEW • Long history of fulfilling purchasing commitments to our banking partners since 1994 • Purchased $37.6 billion of face paying credit issuers $2.6 billion • Current year purchases expected to be 20% higher than bottom of last cycle • Revolver group relationships are very strong dating back to 2005 • Current rating agency ratings of B- S&P; B2 Moody’s * Annualized based on YTD actuals as of 9/30/2014. Annualized amounts will fluctuate based on actual Q4 data. $- $100 $200 $300 $400 $500 $600 $700 2000 2001 2002 2003 2004 2005 2006 2007 2008 2009 2010 2011 2012 2013 2014* Mi llio ns Purchases & Proceeds Purchases Proceeds

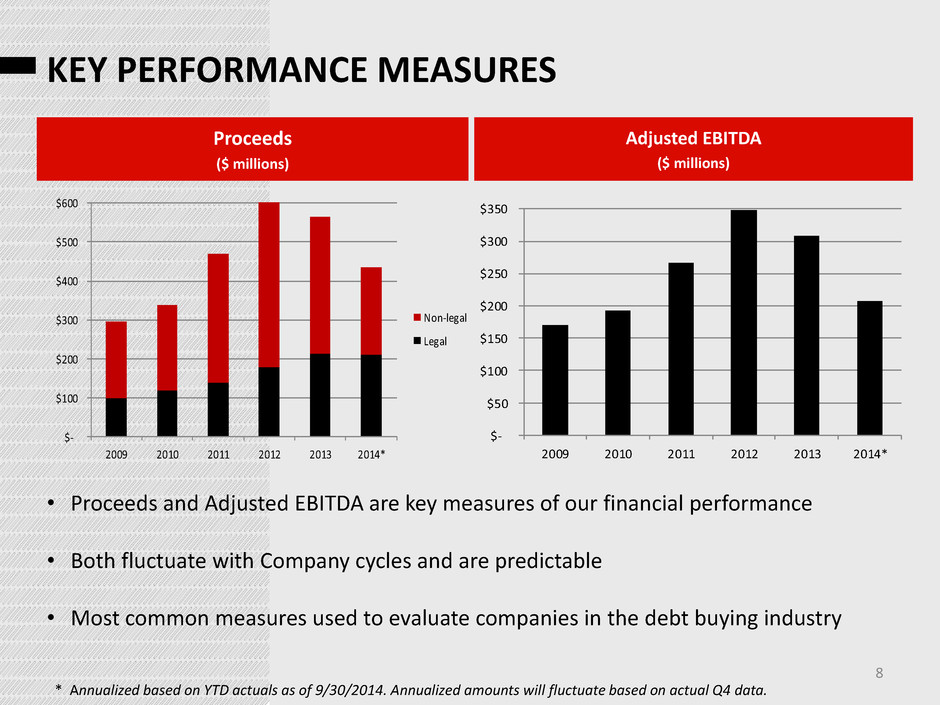
8 KEY PERFORMANCE MEASURES Proceeds ($ millions) Adjusted EBITDA ($ millions) • Proceeds and Adjusted EBITDA are key measures of our financial performance • Both fluctuate with Company cycles and are predictable • Most common measures used to evaluate companies in the debt buying industry * Annualized based on YTD actuals as of 9/30/2014. Annualized amounts will fluctuate based on actual Q4 data. $- $100 $200 $300 $400 $500 $600 2009 2010 2011 2012 2013 2014* Non-legal Legal $- $50 $100 $150 $200 $250 $300 $350 2009 2010 2011 2012 2013 2014*

9 KEY LIQUIDITY MEASURES ERP ($ millions) Liquidity ($ millions) • Estimated Remaining Proceeds (“ERP”) represents the expected cash proceeds of the current portfolio without additional purchases • Liquidity represents availability under our revolving line of credit and operating cash * 2014 liquidity is as of 9/30/14. $- $100 $200 $300 $400 $500 $600 $700 $800 $900 $1,000 2009 2010 2011 2012 2013 3Q 2014 $- $20 $40 $60 $80 $100 2010 2011 2012 2013 3Q 2014

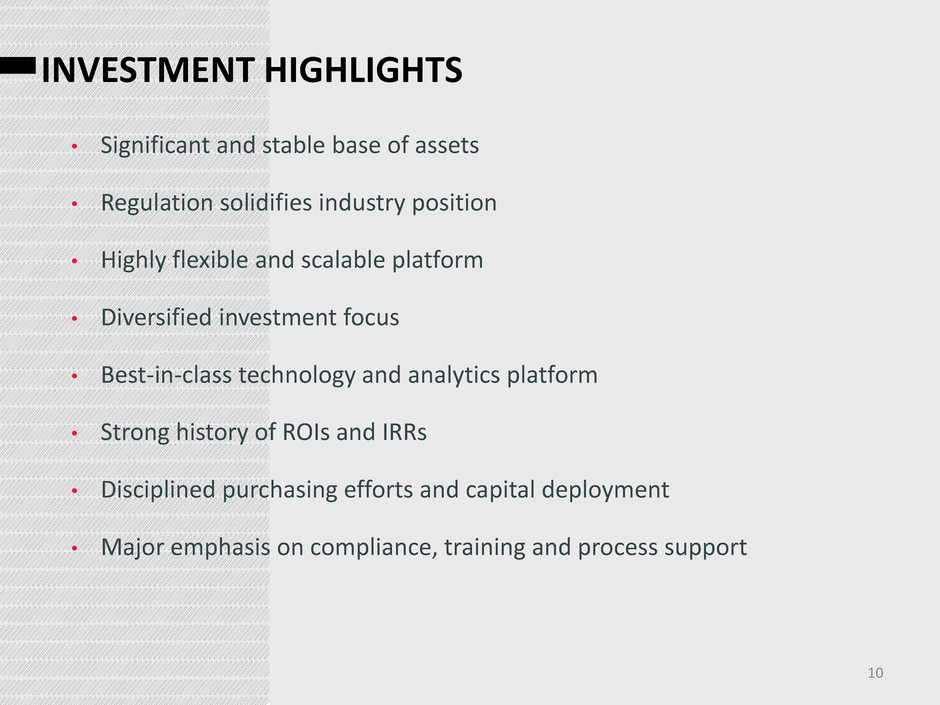
INVESTMENT HIGHLIGHTS 10 • Significant and stable base of assets • Regulation solidifies industry position • Highly flexible and scalable platform • Diversified investment focus • Best-in-class technology and analytics platform • Strong history of ROIs and IRRs • Disciplined purchasing efforts and capital deployment • Major emphasis on compliance, training and process support

QUESTIONS?
