Attached files
| file | filename |
|---|---|
| 8-K - CIRRUS LOGIC, INC. 8-K - CIRRUS LOGIC, INC. | a50995347.htm |
Exhibit 99.1
NASDAQ London Investor Program Presentation December 3, 2014 CIRRUS LOGIC
Safe Harbor Statement Except for historical information contained herein, the matters set forth in this presentation contain forward-looking statements, including industry market projections; our revenue growth opportunities; future product releases; and forecasted revenue, gross margin, R&D and SG&A expenses and and acquisition related costs associated with the fair value write up of acquired inventory. These forward-looking statements are based on our current expectations, estimates and assumptions and are subject to certain risks and uncertainties that could cause actual results to differ materially from our current expectations, estimates and assumptions and the forward-looking statements made in this presentation. These risks and uncertainties include, but are not limited to, the risk factors listed in our Form 10-K for the year ended March 29, 2014, and in other filings with the Securities and Exchange Commission. The foregoing information concerning our business outlook represents our outlook as of the date of this presentation, and we undertake no obligation to update or revise any forward-looking statements, whether as a result of new developments or otherwise.2
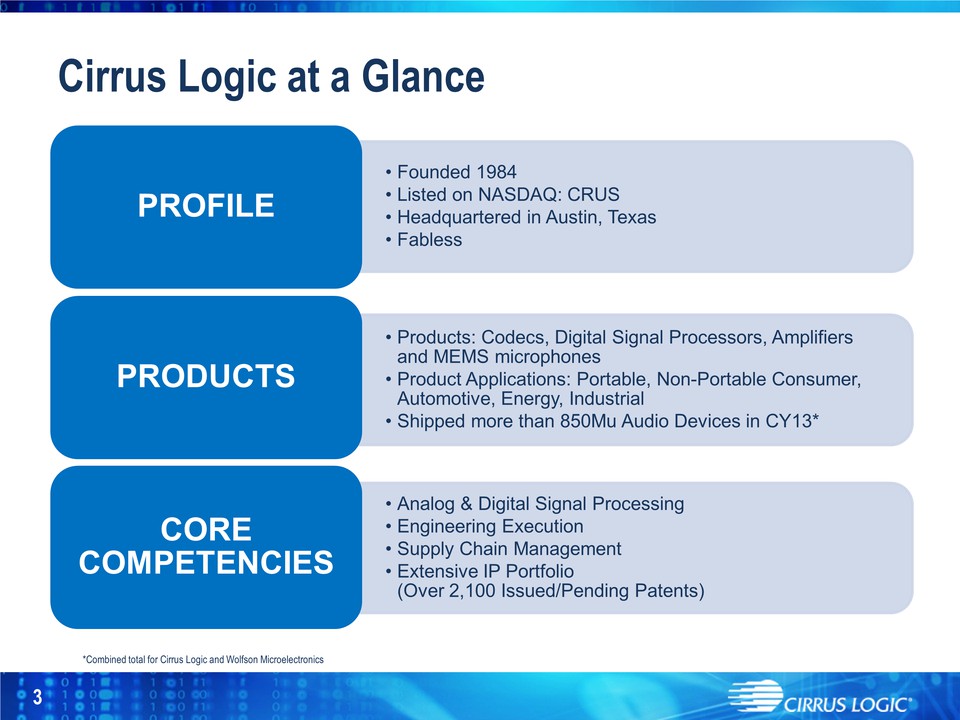
Cirrus Logic at a Glance • Founded 1984 • Listed on NASDAQ: CRUS • Headquartered in Austin, Texas • Fabless PROFILE • Products: Codecs, Digital Signal Processors, Amplifiers and MEMS microphones • Product Applications: Portable, Non-Portable Consumer, Automotive, Energy, Industrial • Shipped more than 850Mu Audio Devices in CY13* PRODUCTS • Analog & Digital Signal Processing • Engineering Execution • Supply Chain Management • Extensive IP Portfolio (Over 2,100 Issued/Pending Patents) CORE COMPETENCIES 3 *Combined total for Cirrus Logic and Wolfson Microelectronics
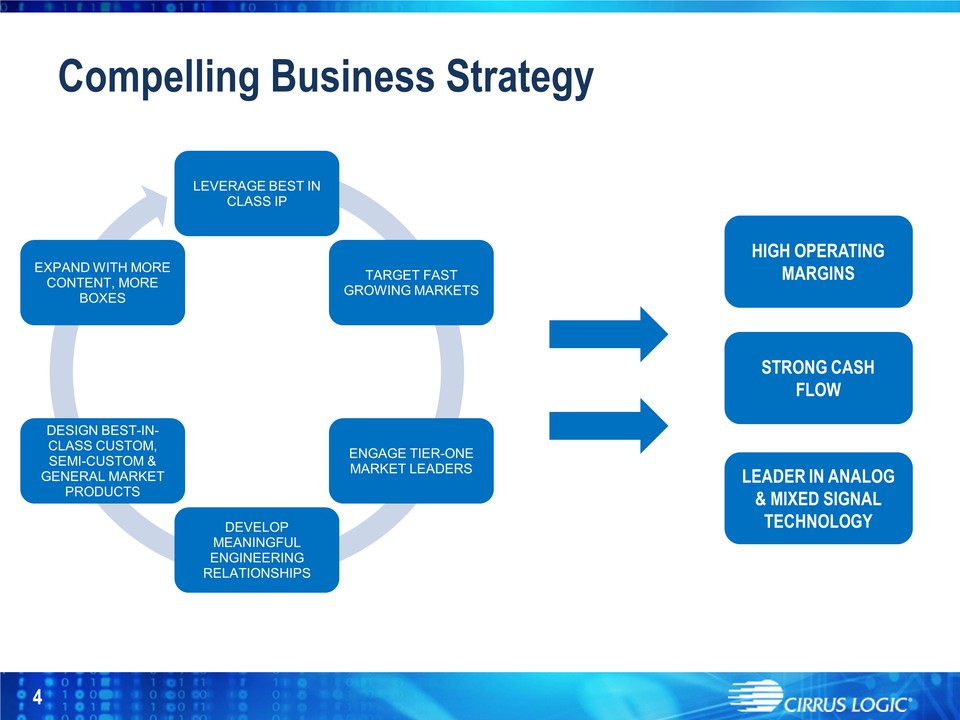
Compelling Business Strategy LEVERAGE BEST IN CLASS IP TARGET FAST GROWING MARKETS ENGAGE TIER-ONE MARKET LEADERS DEVELOP MEANINGFUL ENGINEERING RELATIONSHIPS DESIGN BEST-INCLASS CUSTOM, SEMI-CUSTOM & GENERAL MARKET PRODUCTS EXPAND WITH MORE CONTENT, MORE BOXES HIGH OPERATING MARGINS STRONG CASH FLOW LEADER IN ANALOG & MIXED SIGNAL TECHNOLOGY4
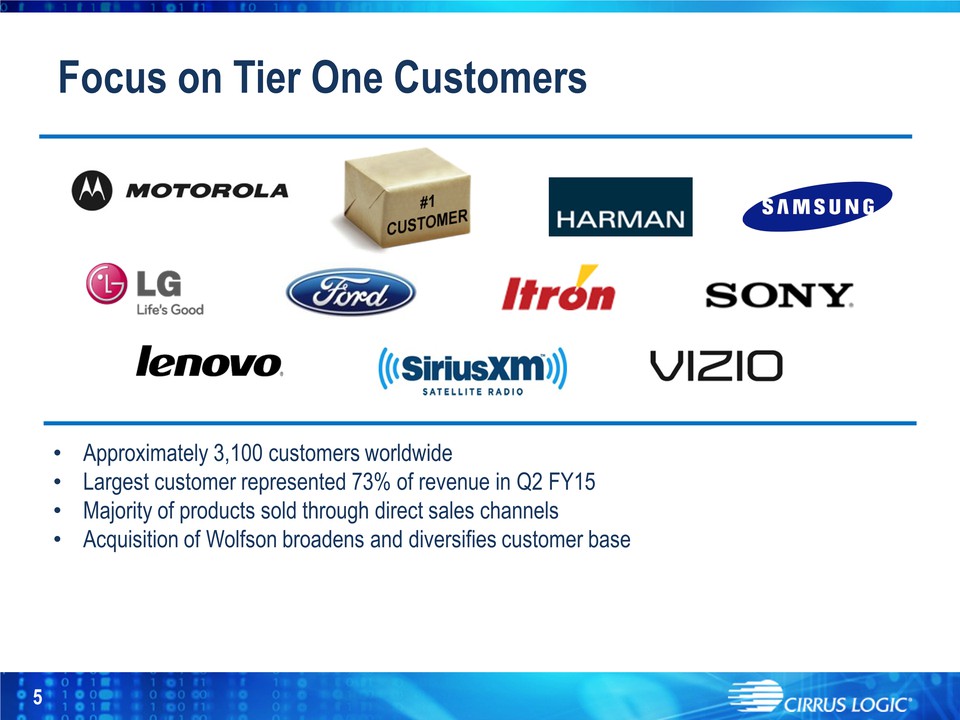
Focus on Tier One Customers • Approximately 3,100 customers worldwide • Largest customer represented 73% of revenue in Q2 FY15 • Majority of products sold through direct sales channels • Acquisition of Wolfson broadens and diversifies customer base 5

Unique Corporate Culture “Best Places to Work” 2011, 2012, 2013 & 2014 6
PRODUCT OVERVIEW 7
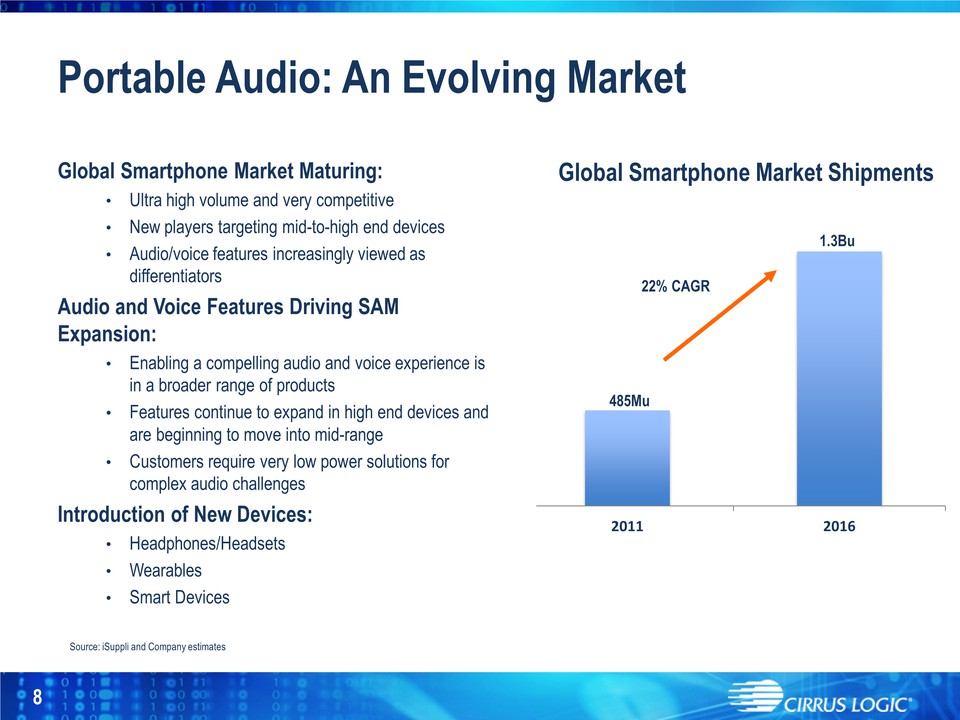
2011 2016 Portable Audio: An Evolving Market Source: iSuppli and Company estimates Global Smartphone Market Shipments 1.3Bu 485Mu 22% CAGR 8 Global Smartphone Market Maturing: • Ultra high volume and very competitive • New players targeting mid-to-high end devices • Audio/voice features increasingly viewed as differentiators Audio and Voice Features Driving SAM Expansion: • Enabling a compelling audio and voice experience is in a broader range of products • Features continue to expand in high end devices and are beginning to move into mid-range • Customers require very low power solutions for complex audio challenges Introduction of New Devices: • Headphones/Headsets • Wearables • Smart Devices 8
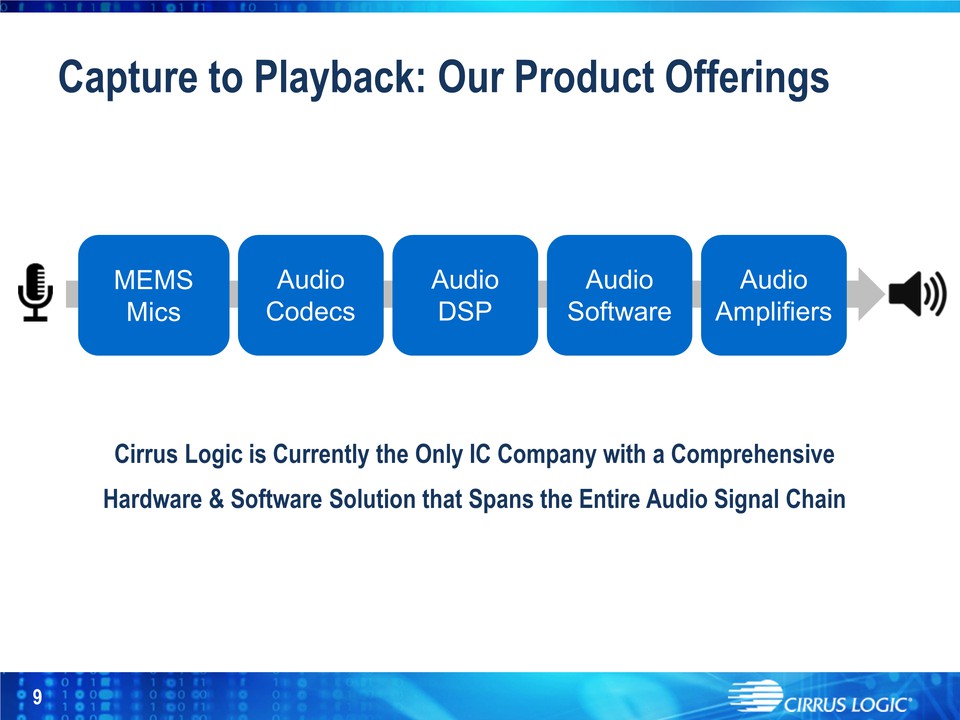
Audio Codecs Audio Amplifiers Audio DSP MEMS Mics Audio Software Capture to Playback: Our Product Offerings Cirrus Logic is Currently the Only IC Company with a Comprehensive Hardware & Software Solution that Spans the Entire Audio Signal Chain 9
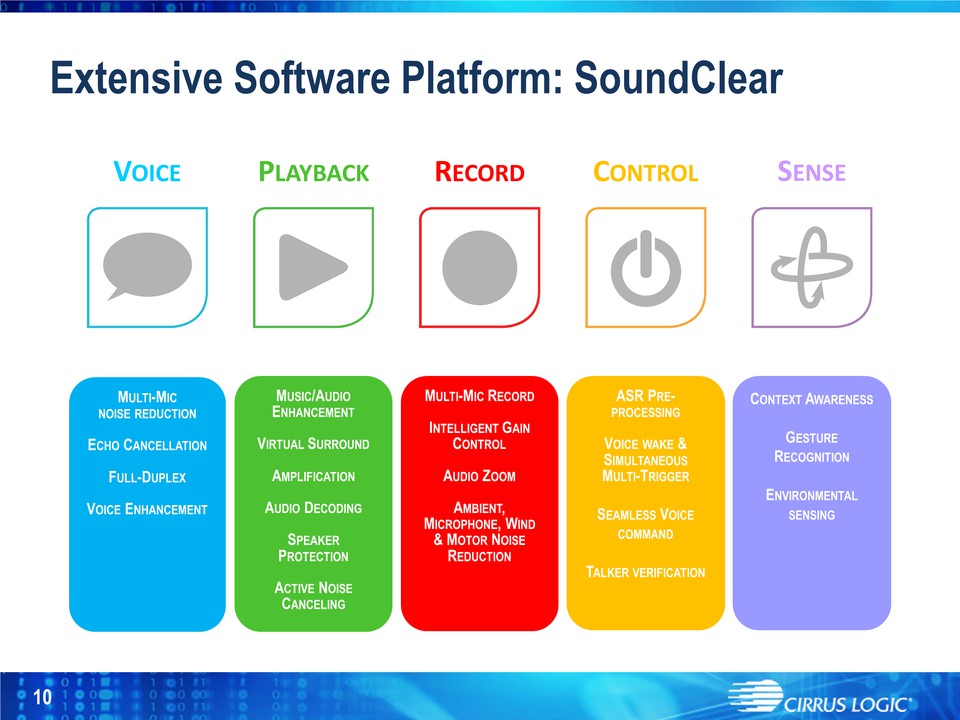
Extensive Software Platform: SoundClear 10 CONTROL ASR PREPROCESSING VOICE WAKE & SIMULTANEOUS MULTI-TRIGGER SEAMLESS VOICE COMMAND TALKER VERIFICATION PLAYBACK MUSIC/AUDIO ENHANCEMENT VIRTUAL SURROUND AMPLIFICATION AUDIO DECODING SPEAKER PROTECTION ACTIVE NOISE CANCELING RECORD MULTI-MIC RECORD INTELLIGENT GAIN CONTROL AUDIO ZOOM AMBIENT, MICROPHONE, WIND & MOTOR NOISE REDUCTION SENSE CONTEXT AWARENESS GESTURE RECOGNITION ENVIRONMENTAL SENSING VOICE MULTI-MIC NOISE REDUCTION ECHO CANCELLATION FULL-DUPLEX VOICE ENHANCEMENT
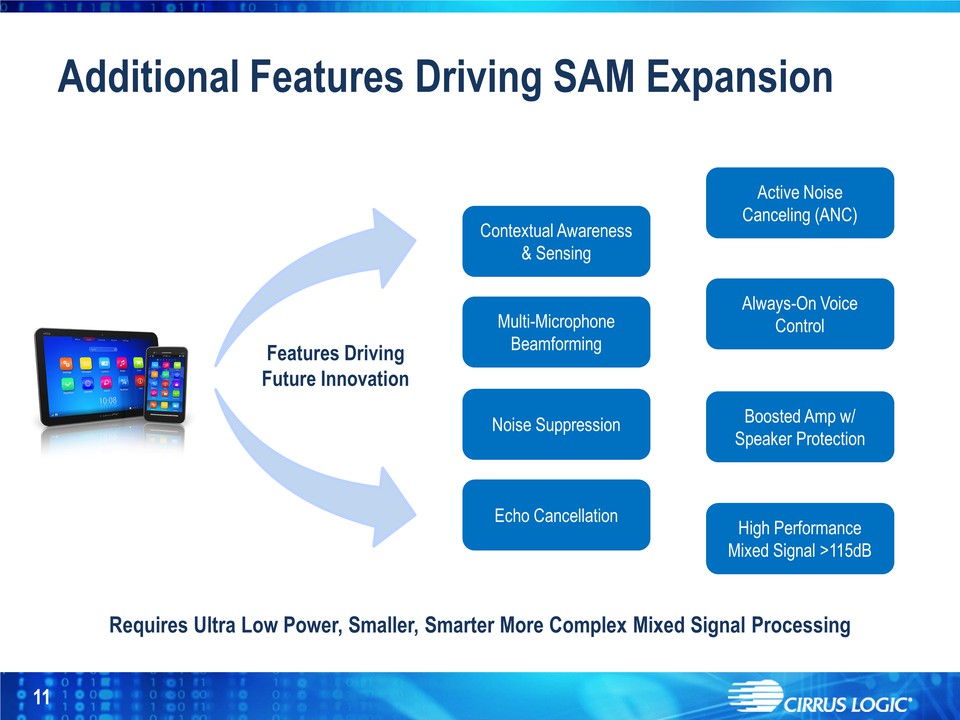
Additional Features Driving SAM Expansion Features Driving Future Innovation Multi-Microphone Beamforming High Performance Mixed Signal >115dB Active Noise Canceling (ANC) Boosted Amp w/ Speaker Protection Always-On Voice Control Noise Suppression Echo Cancellation Contextual Awareness & Sensing Requires Ultra Low Power, Smaller, Smarter More Complex Mixed Signal Processing 11
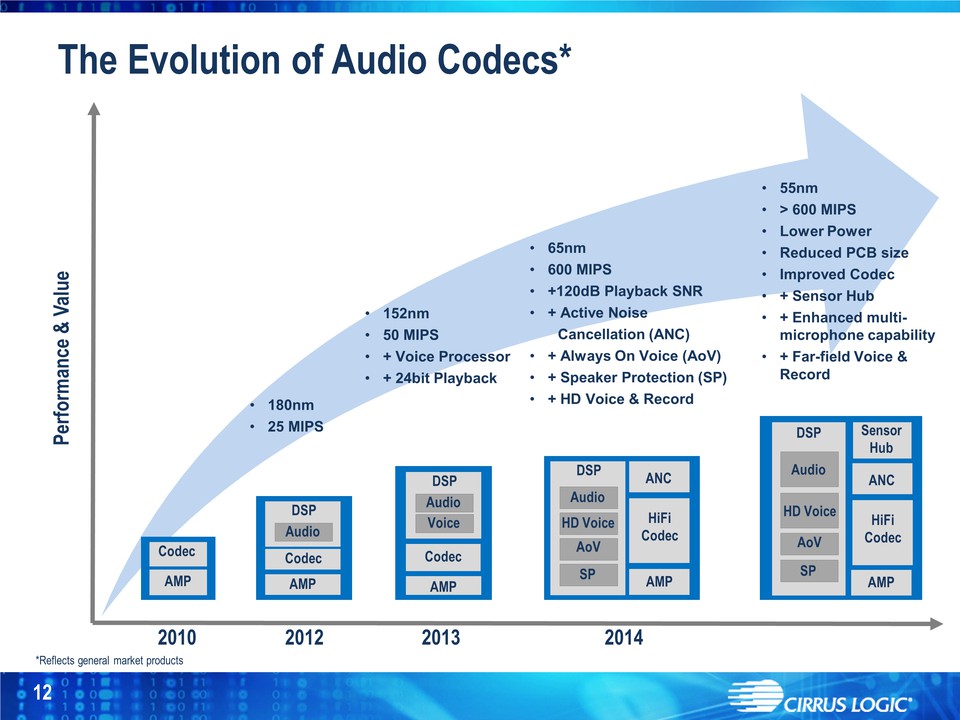
The Evolution of Audio Codecs* 12 Performance & Value 2014 2013 2012 HiFi Codec ANC AMP AMP AMP Sensor Hub • 180nm • 25 MIPS • 152nm • 50 MIPS • + Voice Processor m• + 24bit Playback • 65nm • 600 MIPS • +120dB Playback SNR • + Active Noise Cancellation (ANC) • + Always On Voice (AoV) • + Speaker Protection (SP) • + HD Voice & Record • 55nm • > 600 MIPS • Lower Power • Reduced PCB size • Improved Codec • + Sensor Hub • + Enhanced multimicrophone capability • + Far-field Voice & Record Codec AMP 2010 *Reflects general market products Codec Codec DSP Audio Voice DSP AoV Audio HD Voice SP AoV SP DSP HiFi Codec ANC AMP DSP Audio HD Voice Audio 12
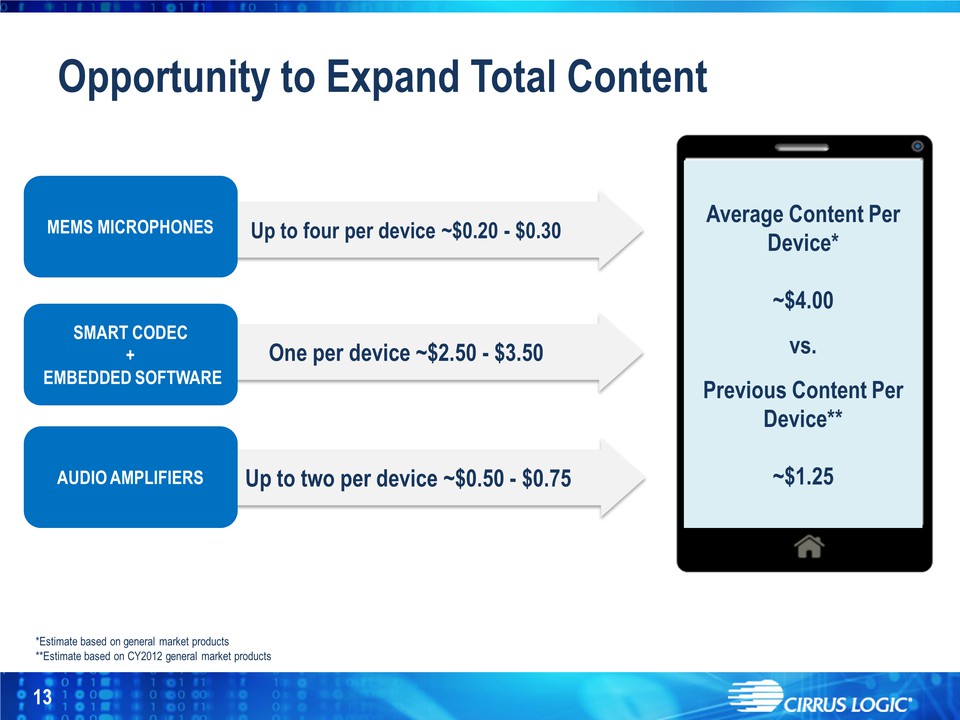
Opportunity to Expand Total Content 13 Up to four per device ~$0.20 - $0.30 MEMS MICROPHONES One per device ~$2.50 - $3.50 Up to two per device ~$0.50 - $0.75 SMART CODEC + EMBEDDED SOFTWARE AUDIO AMPLIFIERS Average Content Per Device*$4.00 vs. Previous Content Per Device** $1.25 *Estimate based on general market products**Estimate based on CY2012 general market products 13
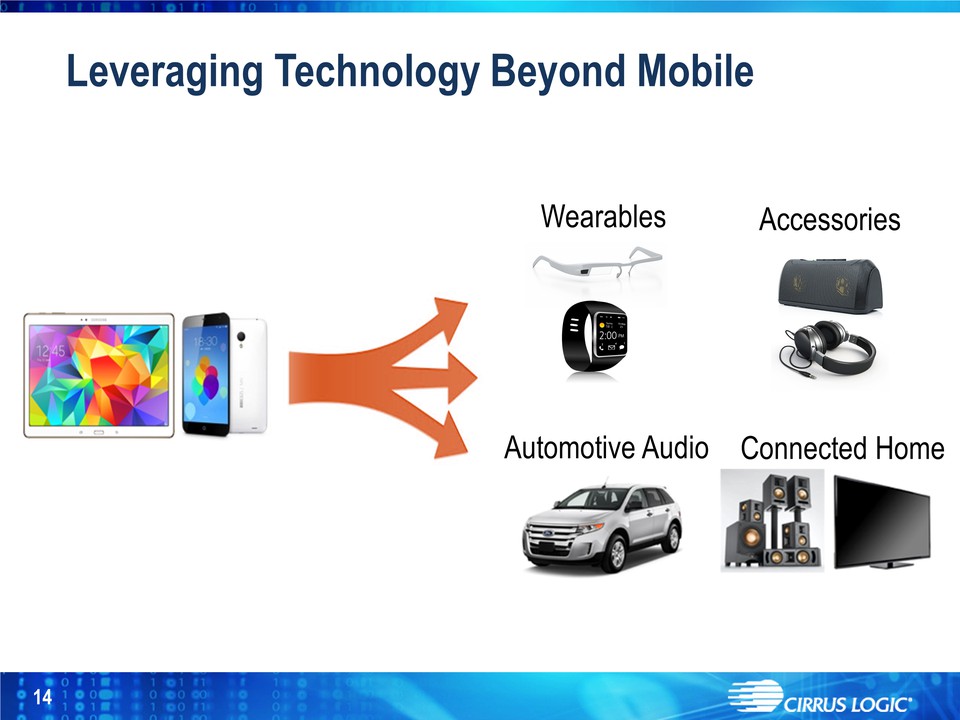
Leveraging Technology Beyond Mobile Connected Home Automotive Audio Wearables Accessories 14
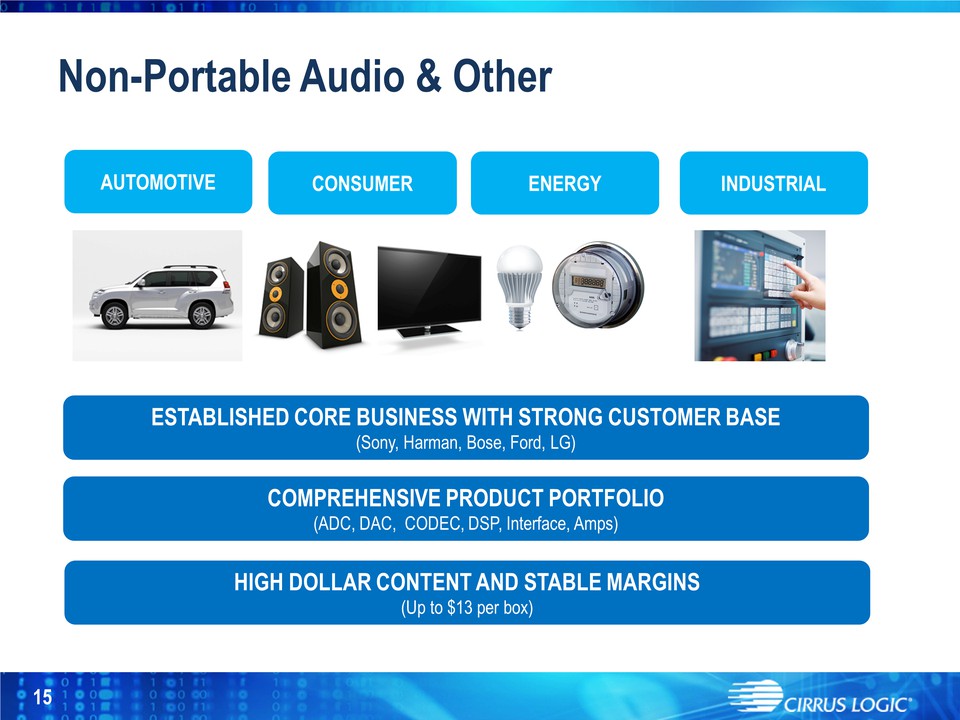
Non-Portable Audio & Other CONSUMER AUTOMOTIVE ESTABLISHED CORE BUSINESS WITH STRONG CUSTOMER BASE (Sony, Harman, Bose, Ford, LG) COMPREHENSIVE PRODUCT PORTFOLIO (ADC, DAC, CODEC, DSP, Interface, Amps) ENERGY INDUSTRIAL HIGH DOLLAR CONTENT AND STABLE MARGINS (Up to $13 per box) 15
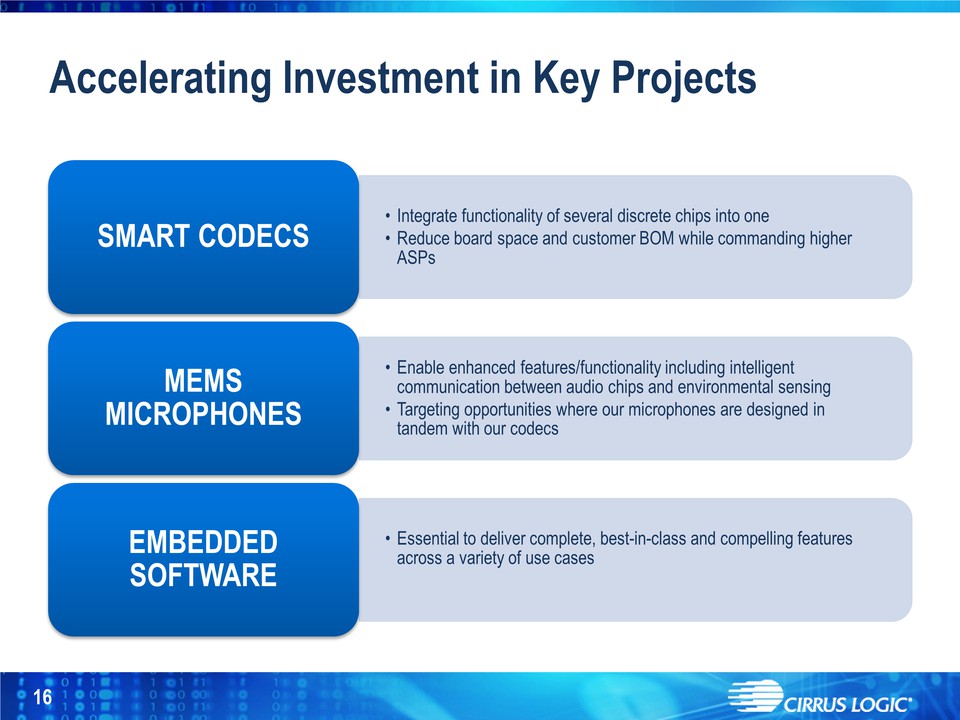
Accelerating Investment in
Key Projects • Integrate functionality of several discrete chips into
one • Reduce board space and customer BOM while commanding higher ASPs
SMART CODECS • Enable enhanced features/functionality including
intelligent communication between audio chips and environmental sensing
• Targeting opportunities where our microphones are designed in tandem
with our codecs MEMS MICROPHONES • Essential to deliver complete,
best-in-class and compelling features across a variety of use cases
EMBEDDED SOFTWARE 16
Cirrus Logic’s Advantage 17

FINANCIALS 18
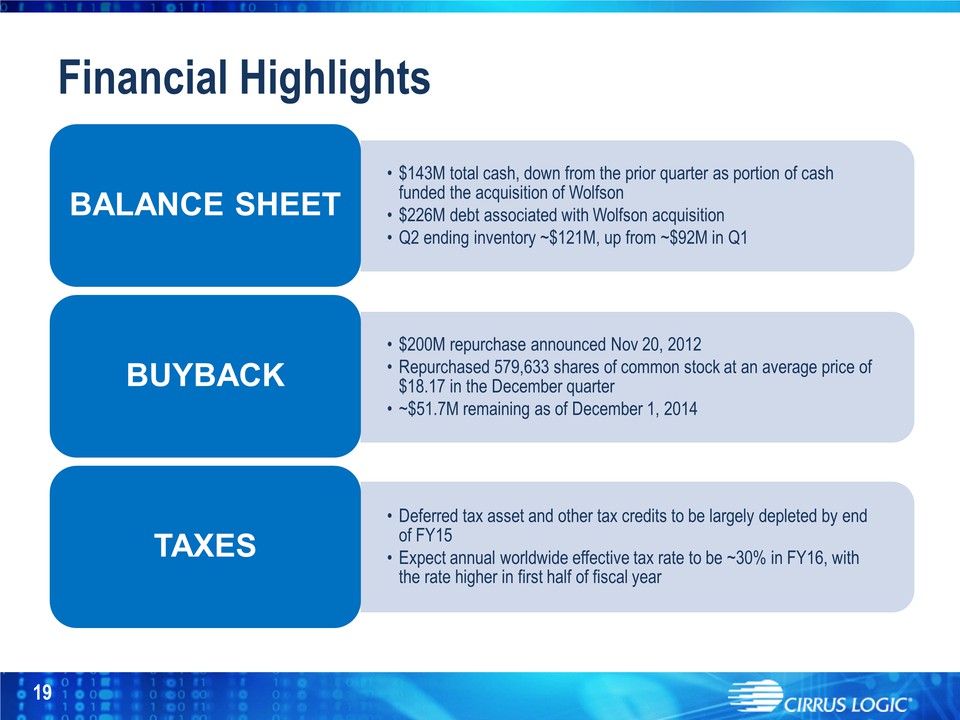
19 Financial Highlights • $143M total cash, down from the prior quarter as portion of cash funded the acquisition of Wolfson • $226M debt associated with Wolfson acquisition • Q2 ending inventory ~$121M, up from ~$92M in Q1 BALANCE SHEET • $200M repurchase announced Nov 20, 2012 • Repurchased 579,633 shares of common stock at an average price of $18.17 in the December quarter • $51.7M remaining as of December 1, 2014 BUYBACK • Deferred tax asset and other tax credits to be largely depleted by end of FY15 • Expect annual worldwide effective tax rate to be ~30% in FY16, with the rate higher in first half of fiscal year TAXES
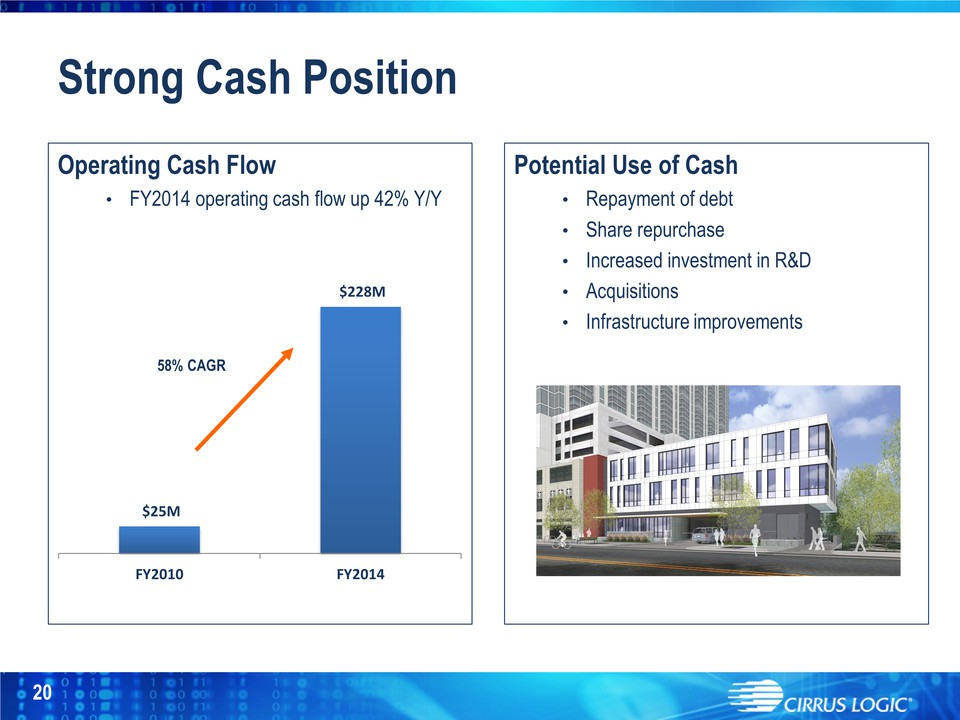
$25M $228M FY2010 FY2014 Operating Cash Flow • FY2014 operating cash flow up 42% Y/Y Strong Cash Position 20 58% CAGR Potential Use of Cash • Repayment of debt • Share repurchase • Increased investment in R&D • Acquisitions • Infrastructure improvements 20
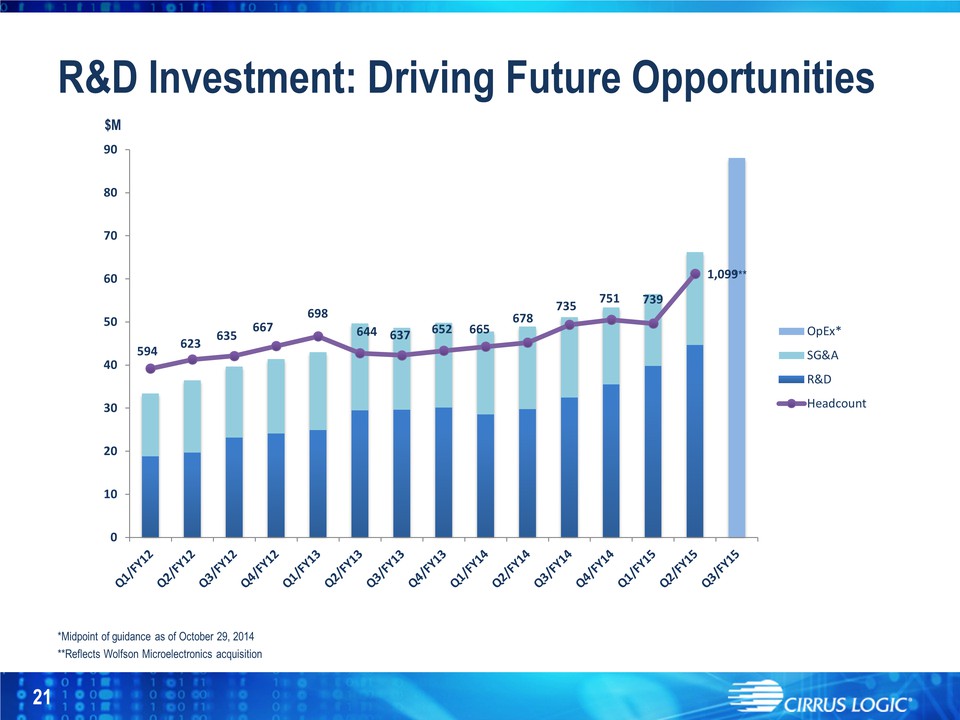
R&D Investment: Driving Future Opportunities *Midpoint of guidance as of October 29, 2014 **Reflects Wolfson Microelectronics acquisition $M 21 594 623 635 667 698 644 637 652 665 678 735 751 739 1,099 0 10 20 30 40 50 60 70 80 90 OpEx* SG&A R&D Headcount **21
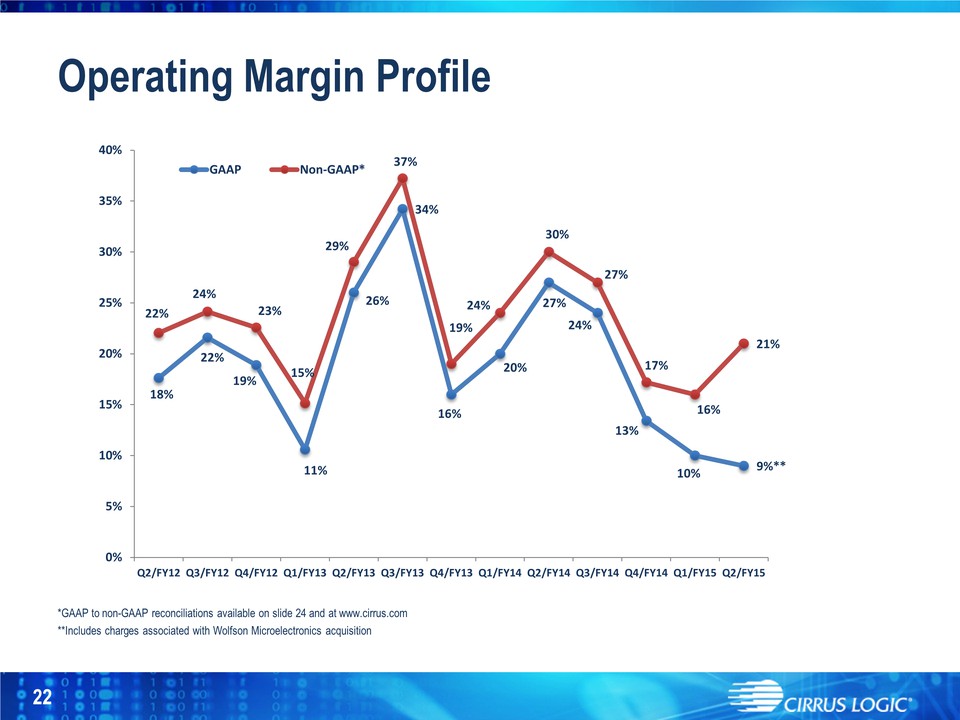
Operating Margin Profile *GAAP to non-GAAP reconciliations available on slide 23 and at w ww.cirrus.com **Includes charges associated with Wolfson Microelectronics acquisition 18% 22% 19% 11% 26% 34% 16% 20% 27% 24% 13% 10% 9%** 22% 24% 23% 15% 29% 37% 19% 24% 30% 27% 17% 16% 21% 0% 5% 10% 15% 20% 25% 30% 35% 40% Q2/FY12 Q3/FY12 Q4/FY12 Q1/FY13 Q2/FY13 Q3/FY13 Q4/FY13 Q1/FY14 Q2/FY14 Q3/FY14 Q4/FY14 Q1/FY15 Q2/FY15 GAAP Non-GAAP* 22
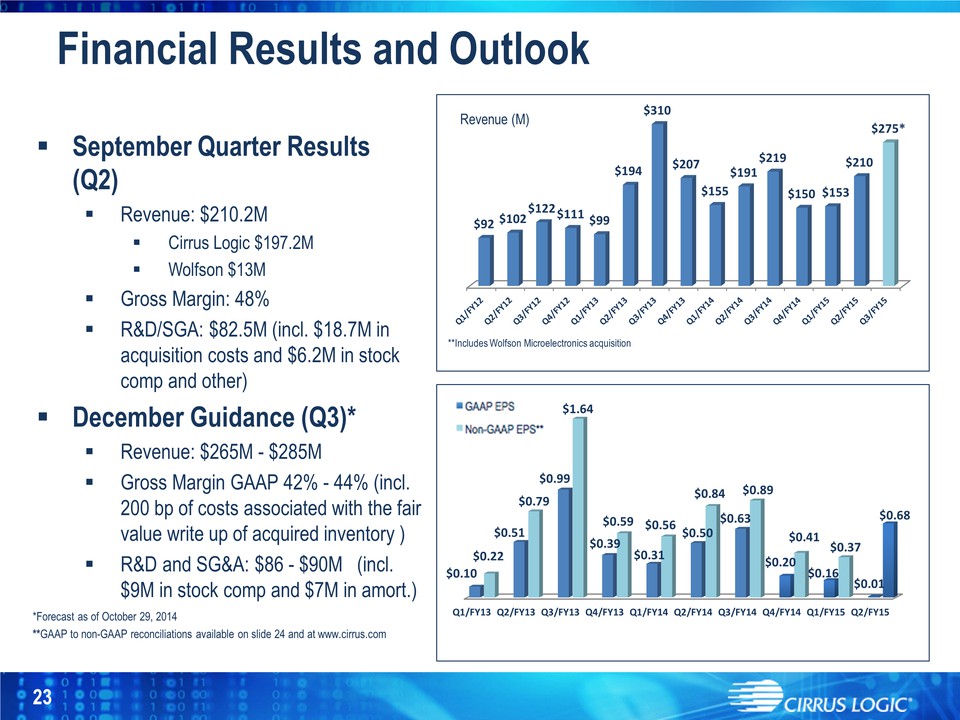
September Quarter Results (Q2) Revenue: $210.2M Cirrus Logic $197.2M Wolfson $13M Gross Margin: 48% R&D/SGA: $82.5M (incl. $18.7M in acquisition costs and $6.2M in stock comp and other) December Guidance (Q3)* Revenue: $265M - $285M Gross Margin GAAP 42% - 44% (incl. 200 bp of costs associated with the fair value write up of acquired inventory ) R&D and SG&A: $86 - $90M (incl. $9M in stock comp and $7M in amort.)*Forecast as of October 29, 2014 **GAAP to non-GAAP reconciliations available on slide 23 and at www.cirrus.com Financial Results and Outlook **Includes Wolfson Microelectronics acquisition Revenue (M) Q1/FY13 Q2/FY13 Q3/FY13 Q4/FY13 Q1/FY14 Q2/FY14 Q3/FY14 Q4/FY14 Q1/FY15 Q2/FY15 $0.10 $0.22 $0.51 $0.79 $0.99 $1.64 $0.39 $0.59 $0.31 $0.56 $0.50 $0.84 $0.63 $0.89 $0.20 $0.41 $0.16 $0.37 $0.01 $0.68 $92 $102 $122 $111 $99 $194 $310 $207 $155 $191 $219 $150 $153 $210 $275* 23
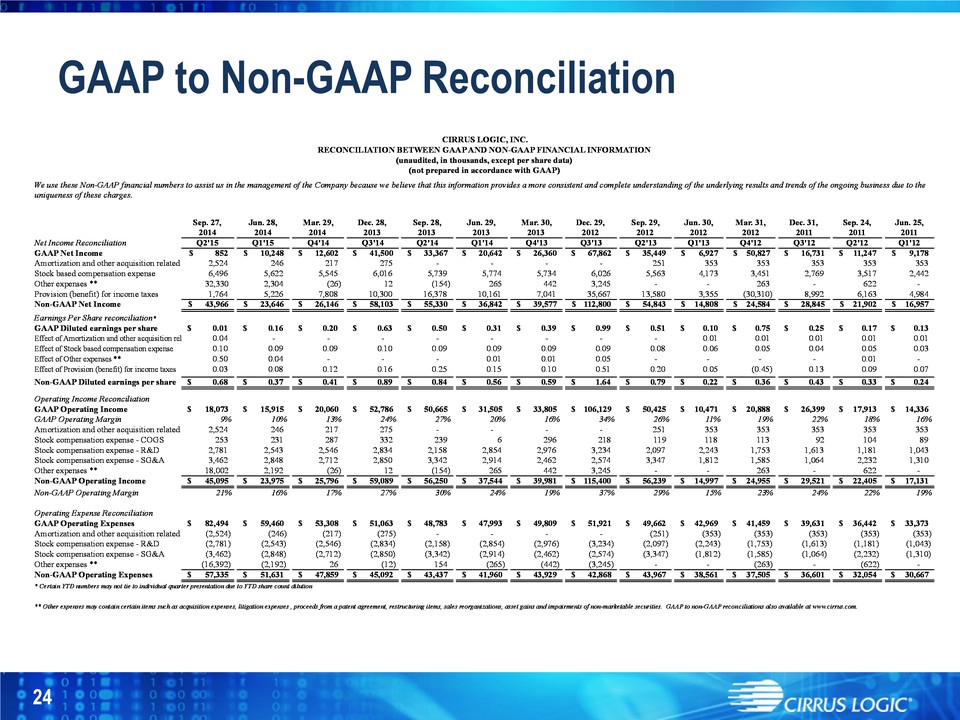
GAAP to Non-GAAP Reconciliation 24 Net Income Reconciliation GAAP Net Income Amortization and other acquisition related Stock based compensation expense Other expenses ** Provision (benefit) for income taxes We use these Non-GAAP financial numbers uniqueness of these charges. Sep. 27, Jun. 28, Mar. 29, Dec. 28, Sep. 28, Jun. 29, Mar. 30, Dec. 29, Sep. 29, Jun. 30, Mar. 31, Dec. 31, Sep. 24, Jun. 25, 2014 2014 2014 2013 2013 2013 2013 2012 2012 2012 2012 2011 2011 2011 Q2'15 Q1'15 Q4'14 Q3'14 Q2'14 Q1'14 Q4'13 Q3'13 Q2'13 Q1'13 Q4'12 Q3'12 Q2'12 Q1'12 852 $ 10,248 $ 12,602 $ 41,500 $ 33,367 $ 20,642 $ 26,360 $ 67,862 $ 35,449 $ 6,927 $ 50,827 $ 16,731 $ 11,247 $ 9,178 $ 2,524 246 217 275 - - - - 251 353 353 353 353 353 6,496 5,622 5,545 6,016 5,739 5,774 5,734 6,026 5,563 4,173 3,451 2,769 3,517 2,442 32,330 2,304 (26) 12 (154) 265 442 3,245 - - 263 - 622 - 1,764 5,226 7,808 10,300 16,378 10,161 7,041 35,667 13,580 3,355 (30,310) 8,992 6,163 4,984 s to assist us in the management of the Company because we believe that this information provides a more consistent and complete understanding of the underlying results and trends of the ongoing business due to the RECONCILIATION BETWEEN GAAPAND NON-GAAP FINANCIAL INFORMATION (unaudited, in thousands, except per share data) (not prepared in accordance with GAAP) CIRRUS LOGIC, INC. Non-GAAP Net Income Earnings Per Share reconciliation* GAAP Diluted earnings per share Effect of Amortization and other acquisition rel Effect of Stock based compensation expense Effect of Other expenses ** Effect of Provision (benefit) for income taxes Non-GAAP Diluted earnings per share Operating Income Reconciliation GAAP Operating Income GAAP Operating Margin Amortization and other acquisition related Stock compensation expense – COGS Stock compensation expense - R&D Stock compensation expense - SG&A Other expenses ** Non-GAAP Operating Income Non-GAAP Operating Margin Operating Expense Reconciliation GAAP Operating Expenses Amortization and other acquisition related Stock compensation expense - R&D Stock compensation expense - SG&A Other expenses ** Non-GAAP Operating Expenses * Certain YTD numbers may not tie to individual quart 43,966 $ 23,646 $ 26,146 $ 58,103 $ 55,330 $ 36,842 $ 39,577 $ 112,800 $ 54,843 $ 14,808 $ 24,584 $ 28,845 $ 21,902 $ 16,957 $ 0.01 $ 0.16 $ 0.20 $ 0.63 $ 0.50 $ 0.31 $ 0.39 $ 0.99 $ 0.51 $ 0.10 $ 0.75 $ 0.25 $ 0.17 $ 0.13 $ 0.04 - - - - - - - - 0.01 0.01 0.01 0.01 0.01 0.10 0.09 0.09 0.10 0.09 0.09 0.09 0.09 0.08 0.06 0.05 0.04 0.05 0.03 0.50 0.04 - - - 0.01 0.01 0.05 - - - - 0.01 - 0.03 0.08 0.12 0.16 0.25 0.15 0.10 0.51 0.20 0.05 (0.45) 0.13 0.09 0.07 0.68 $ 0.37 $ 0.41 $ 0.89 $ 0.84 $ 0.56 $ 0.59 $ 1.64 $ 0.79 $ 0.22 $ 0.36 $ 0.43 $ 0.33 $ 0.24 $ 18,073 $ 15,915 $ 20,060 $ 52,786 $ 50,665 $ 31,505 $ 33,805 $ 106,129 $ 50,425 $ 10,471 $ 20,888 $ 26,399 $ 17,913 $ 14,336 $ 9% 10% 13% 24% 27% 20% 16% 34% 26% 11% 19% 22% 18% 16% 2,524 246 217 275 - - - - 251 353 353 353 353 353 253 231 287 332 239 6 296 218 119 118 113 92 104 89 2,781 2,543 2,546 2,834 2,158 2,854 2,976 3,234 2,097 2,243 1,753 1,613 1,181 1,043 3,462 2,848 2,712 2,850 3,342 2,914 2,462 2,574 3,347 1,812 1,585 1,064 2,232 1,310 18,002 2,192 (26) 12 (154) 265 442 3,245 - - 263 - 622 - 45,095 $ 23,975 $ 25,796 $ 59,089 $ 56,250 $ 37,544 $ 39,981 $ 115,400 $ 56,239 $ 14,997 $ 24,955 $ 29,521 $ 22,405 $ 17,131 $ 21% 16% 17% 27% 30% 24% 19% 37% 29% 15% 23% 24% 22% 19% 82,494 $ 59,460 $ 53,308 $ 51,063 $ 48,783 $ 47,993 $ 49,809 $ 51,921 $ 49,662 $ 42,969 $ 41,459 $ 39,631 $ 36,442 $ 33,373 $ (2,524) (246) (217) (275) - - - - (251) (353) (353) (353) (353) (353) (2,781) (2,543) (2,546) (2,834) (2,158) (2,854) (2,976) (3,234) (2,097) (2,243) (1,753) (1,613) (1,181) (1,043) (3,462) (2,848) (2,712) (2,850) (3,342) (2,914) (2,462) (2,574) (3,347) (1,812) (1,585) (1,064) (2,232) (1,310) (16,392) (2,192) 26 (12) 154 (265) (442) (3,245) - - (263) - (622) - 57,335 $ 51,631 $ 47,859 $ 45,092 $ 43,437 $ 41,960 $ 43,929 $ 42,868 $ 43,967 $ 38,561 $ 37,505 $ 36,601 $ 32,054 $ 30,667 $ ter presentation due to YTD share count dilution ** Other expenses may contain certain items such as acquisition expenses, litigation expenses , proceeds from a patent agreement, restructuring items, sales reorganizations, asset gains and impairments of non-marketable securities. GAAP to non-GAAP reconciliations also available at www.cirrus.com. 24
CIRRUS LOGIC 25