Attached files
| file | filename |
|---|---|
| 8-K - 8-K - ARO Liquidation, Inc. | aro-20141202x8xk.htm |
| EX-99.1 - EXHIBIT 99.1 - ARO Liquidation, Inc. | q314-exhibit991.htm |

1 Third Quarter 2014 Financial Results

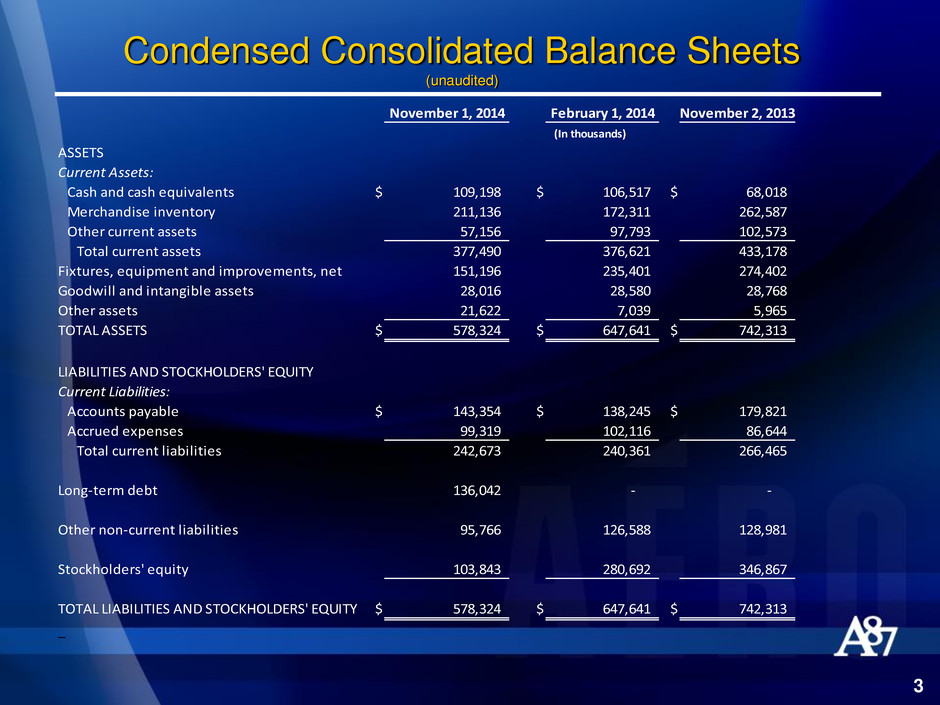
Condensed Consolidated Balance Sheets (unaudited) 3 November 1, 2014 February 1, 2014 November 2, 2013 ASSETS Current Assets: Cash and cash equivalents $ 109,198 $ 106,517 $ 68,018 Merchandise inventory 211,136 172,311 262,587 Other current assets 57,156 97,793 102,573 Total current assets 377,490 376,621 433,178 Fixtures, equipment and improvements, net 151,196 235,401 274,402 Goodwill and intangible assets 28,016 28,580 28,768 Other assets 21,622 7,039 5,965 TOTAL ASSETS $ 578,324 $ 647,641 $ 742,313 LIABILITIES AND STOCKHOLDERS' EQUITY Current Liabilities: Accounts payable $ 143,354 $ 138,245 $ 179,821 Accrued expenses 99,319 102,116 86,644 Total current liabilities 242,673 240,361 266,465 Long-term debt 136,042 - - Other non-current liabilities 95,766 126,588 128,981 Stockholders' equity 103,843 280,692 346,867 TOTAL LIABILITIES AND STOCKHOLDERS' EQUITY $ 578,324 $ 647,641 $ 742,313 _ (In thousands)
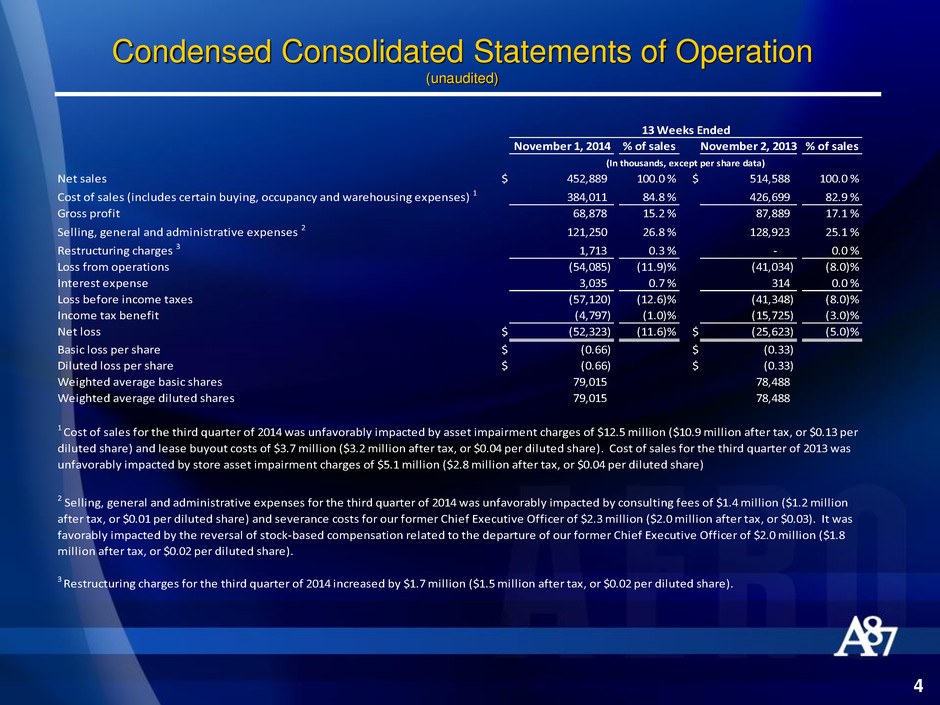
Condensed Consolidated Statements of Operation (unaudited) 4 November 1, 2014 % of sales November 2, 2013 % of sales Net sales $ 452,889 100.0 % $ 514,588 100.0 % Cost of sales (includes certain buying, occupancy and warehousing expenses) 1 384,011 84.8 % 426,699 82.9 % Gross profit 68,878 15.2 % 87,889 17.1 % Selling, general and administrative expenses 2 121,250 26.8 % 128,923 25.1 % Restructuring charges 3 1,713 0.3 % - 0.0 % Loss from operations (54,085) (11.9)% (41,034) (8.0)% Interest expense 3,035 0.7 % 314 0.0 % Loss before income taxes (57,120) (12.6)% (41,348) (8.0)% Income tax benefit (4,797) (1.0)% (15,725) (3.0)% Net loss $ (52,323) (11.6)% $ (25,623) (5.0)% Basic loss per share $ (0.66) $ (0.33) Diluted loss per share $ (0.66) $ (0.33) Weighted average basic shares 79,015 78,488 Weighted average diluted shares 79,015 78,488 13 Weeks Ended 2 Selling, general and administrative expenses for the third quarter of 2014 was unfavorably impacted by consulting fees of $1.4 million ($1.2 million after ax, or $0.01 per diluted share) and severance costs for our former Chief Executive Officer of $2.3 million ($2.0 million after tax, or $0.03). It was favorably impacted by the reversal of stock-based compensation related to the departure of our former Chief Executive Officer of $2.0 million ($1.8 million after tax, or $0.02 per diluted share). 3 Restructuring charges for the third quarter of 2014 increased by $1.7 million ($1.5 million after tax, or $0.02 per diluted share). (In thousands, except per share data) 1 Cost of sales for the third quarter of 2014 was unfavorably impacted by asset impairment charges of $12.5 million ($10.9 million after tax, or $0.13 per diluted share) and lease buyout costs of $3.7 million ($3.2 million after tax, or $0.04 per diluted share). Cost of sales for the third quarter of 2013 was unfavorably impacted by store asset impairment charges of $5.1 million ($2.8 million after tax, or $0.04 per diluted share)

Reconciliation of Net Loss and Diluted Loss Per Share (In thousands, except per share data) (Unaudited) 5 Net Loss Diluted EPS Net Loss Diluted EPS As reported $ (52,323) $ (0.66) $ (25,623) $ (0.33) Asset impairment charges 1 10,929 0.13 2,769 0.04 Lease buyout costs 1 3,206 0.04 - - Other restructuring charges 1,500 0.02 - - Consulting fees 2 1,195 0.01 - - Severance for former CEO 2,027 0.03 - - Reversal of stock-based compensation related to departure of CEO (1,781) (0.02) - - As adjusted $ (35,247) $ (0.45) $ (22,854) $ (0.29) 2 Rec r ed in selling, general and administrative expenses in the statement of operations for the third quarter of 2014. The following table presents a reconciliation of net loss and diluted loss per share ("EPS") on a GAAP basis to the non-GAAP adjusted basis: November 1, 2014 November 2, 2013 13 weeks ended 1 Recorded in cost of sales in the statement of operations for the respective periods. The Company believes that the disclosure of adjusted net loss and adjusted loss per diluted share, which are non-GAAP financial measures, provides investors with useful information to help them better understand the Company's results.
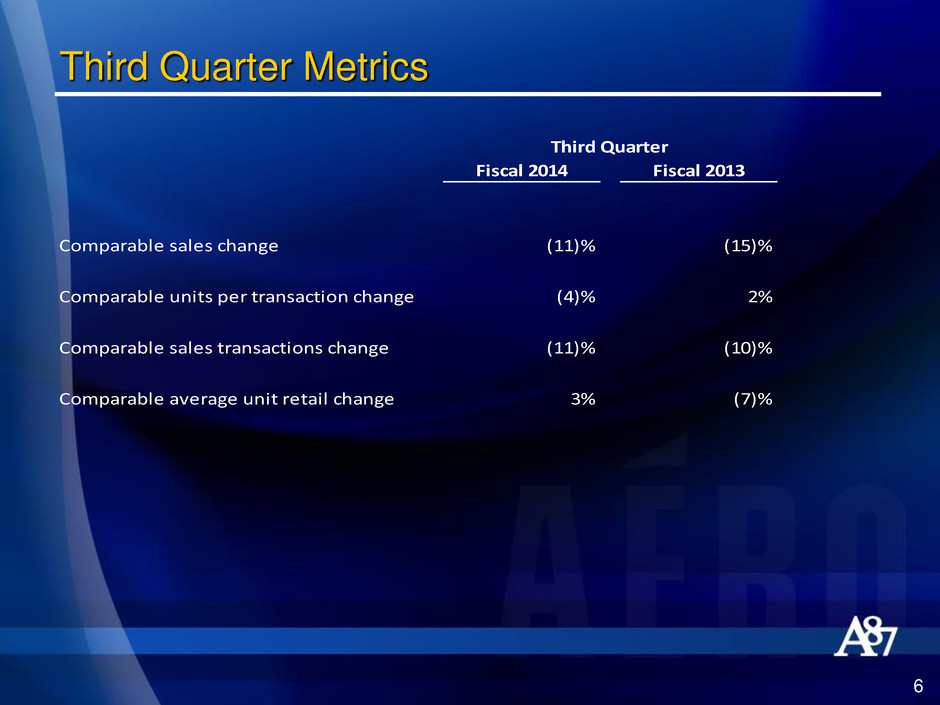
6 Third Quarter Metrics Fiscal 2014 Fiscal 2013 Comparable sales change (11)% (15)% Comparable units per transaction change (4)% 2% Comparable sales transactions change (11)% (10)% Comparable average unit retail change 3% (7)% Third Quarter

Third Quarter Metrics 7 November 1, 2014 November 2, 2013 Average square footage change (4)% 3 % Stores open at end of period 1,052 1,124 Total square footage at end of period 3,912,039 4,158,414 Change in total inventory over comparable period (20)% (5)% Change in inventory per retail square foot (16)% (11)% over comparable period 13 Weeks Ended
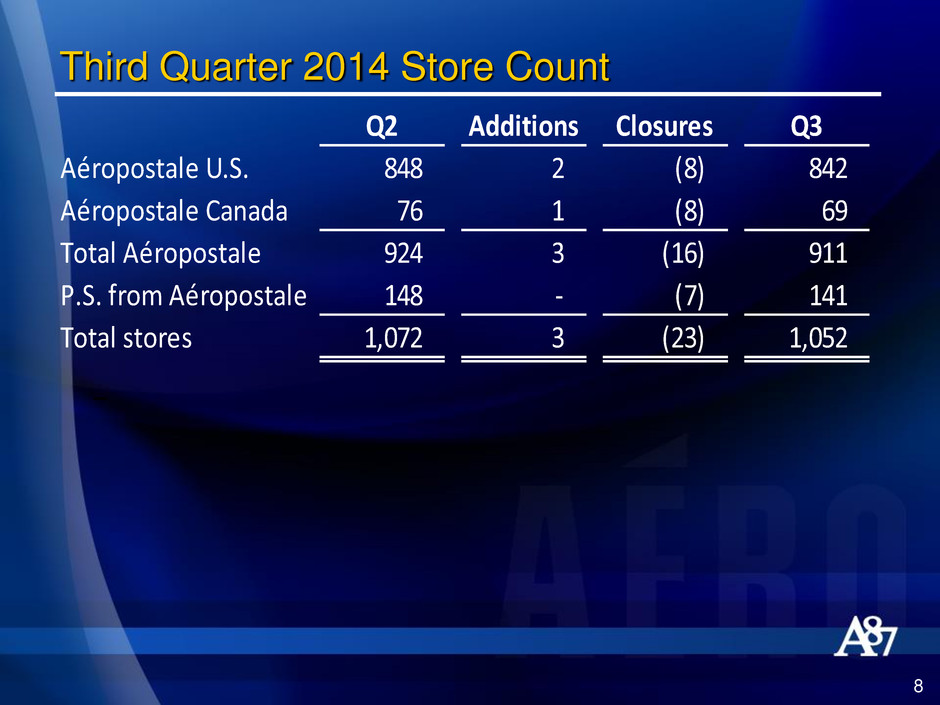
8 Third Quarter 2014 Store Count Q2 Additions Closures Q3 Aéropostale U.S. 848 2 (8) 842 Aéropostale Canada 76 1 (8) 69 Total Aéropostale 924 3 (16) 911 P.S. from Aéropostale 148 - (7) 141 Total stores 1,072 3 (23) 1,052 _
