Attached files
| file | filename |
|---|---|
| 8-K - FORM 8-K - InfuSystem Holdings, Inc | d829474d8k.htm |
 InfuSystem
Holdings, Inc. Shareholder Presentation
December 1, 2014
Exhibit 99.1 |
 Safe Harbor
Statement Certain statements contained in this presentation are forward-looking
statements and are based on future expectations, plans and prospects for the business
and operations of InfuSystem Holdings, Inc. (“InfuSystem” or “the
Company”) that involve a number of risks and uncertainties. In connection with the “safe harbor”
provisions of the Private Securities Litigation Reform Act of 1995, the Company is identifying
certain factors that could cause actual results to materially differ from those
indicated by these forward-looking statements. Those factors, risks and
uncertainties include, but are not limited to: potential changes in overall healthcare
reimbursement, including CMS competitive bidding; sequestration; concentration of customers;
increased focus on early detection of cancer; competitive treatments; dependency on
Medicare Supplier Number; availability of chemotherapy drugs; global financial
conditions; changes and enforcement of state and federal laws; dependency on suppliers;
risks associated with acquisitions and joint ventures, including integration risks; US
Healthcare Reform; relationships with healthcare professionals and organizations; technological
changes related to infusion therapy; [dependency on websites and intellectual property;
dependency on key personnel; dependency on banking relationships; risks associated with
our common stock, as well as any litigation to which the Company may be subject from
time to time; and other risk factors as discussed in the Company’s annual report
on Form 10-K for the year ended December 31, 2013 and in subsequent filings
made by the Company from time to time with the Securities and Exchange Commission (the
“SEC”), which can be obtained via the SEC’s Edgar website or by
contacting the Company or the SEC. Forward-looking statements in this
presentation are made as of December 1, 2014, and, unless required by law, the Company
disclaims any duty to supplement, update or revise such statements, whether as a result of
subsequent developments, changed expectations or otherwise. The Company regularly
posts important information to the investors section of its website.
|
 Summary
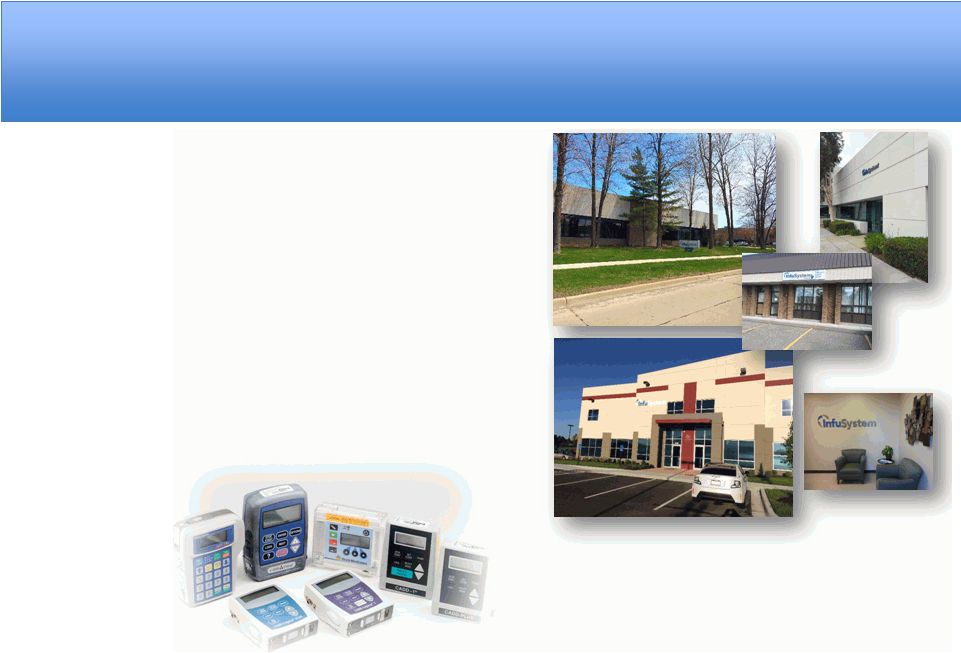
InfuSystem is a growing healthcare company that
provides infusion pumps and related products and
services for patients in the home, in oncology clinics,
ambulatory surgery centers, and other sites of care
from five locations serving all 50 States and
Canada.
We deliver improved patient satisfaction
and outcomes with world-class quality, both in and
out of the home environment.
The company's
market share and profitable growth is predicated on
expansion into new therapies, increased use of
electronic connectivity, development of new
products and services, and strategic geographic
expansion.
Confidential Information of InfuSystem Holdings, Inc.
3 |
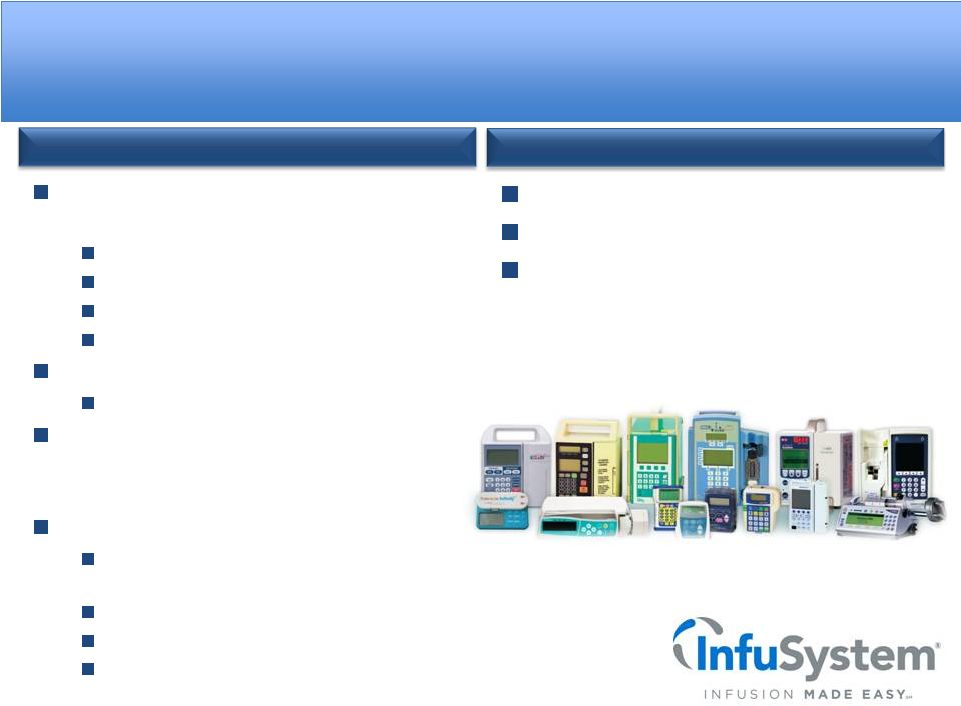 InfuSystem
- “Infusion Made Easy”
9 mos YTD September 30, 2014
(1)
Revenues $50.2M (Up 11%)
AEBITDA $11.5M (Up 2%)
Market Cap $64.0M @ $2.87 (as of
11/20/14)
Company Overview
Provides infusion pumps and related
products and services for patients in:
The Patient’s Home
Oncology Clinics
Ambulatory Surgery Centers
And Other Sites of Care
Serves all 50 States & Canada
from 5 locations
Improves outcomes and delivers high
patient satisfaction with world-class ISO
and CHAP accredited quality
Profitable growth is predicated on:
Growth of oncology and orthopedic
surgery
Increased electronic connectivity
New products and services
Strategic geographic expansion
(1) Free Cash Flow = Adjusted EBITDA less CapEx and Purchases of
Medical Equipment
“The right pump, the right place, and the right time.
Working and patient ready.” |
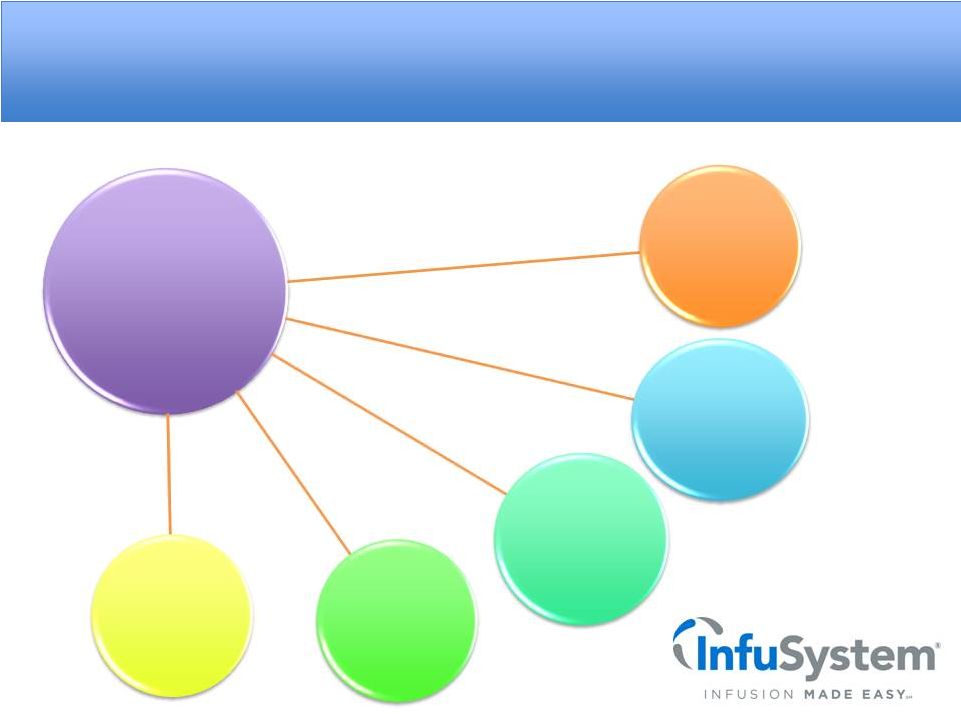
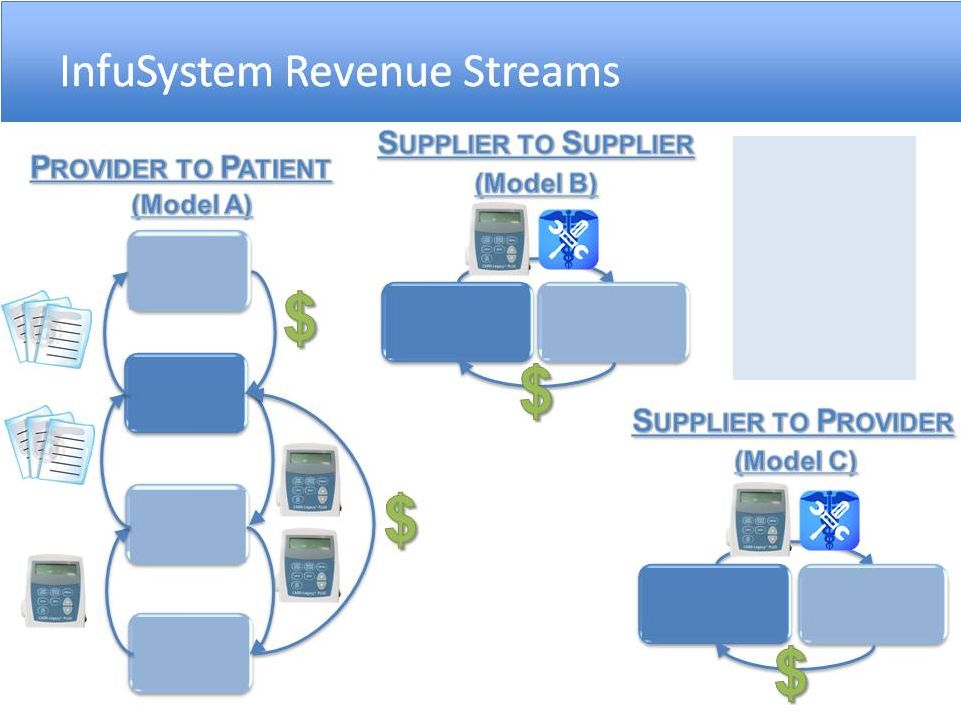 InfuSystem
Manufacturer,
Rental
Companies
Insurance
Company
InfuSystem
Clinic
Patient
InfuSystem
Clinic, Hospital,
Home Infusion
Sales &
Sales &
Rental
Rental
revenue
revenue
via 3
via 3
revenue
revenue
streams.
streams.
Patient
Co-pay &
Deductible |
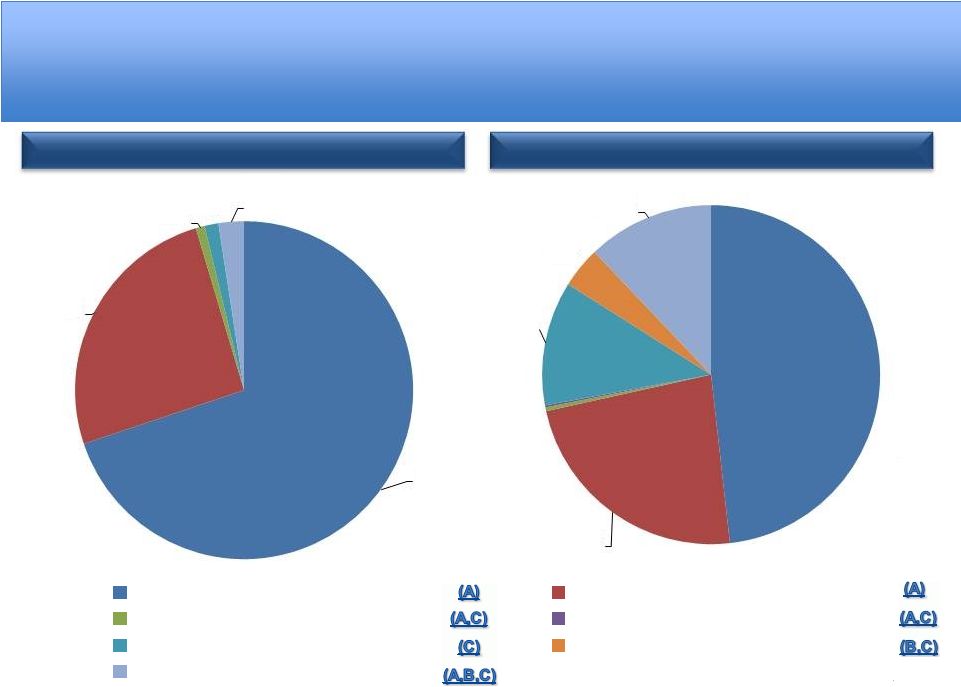 Revenue
Diversification 2009 Revenues $39M
2014 Revenues (Annualized 9m)
70%
26%
1%
1%
2%
48%
23%
12%
4%
12%
Rentals -
Colorectal Cancer
Rentals -
Other Cancers
Rentals -
Infectious Disease
Rentals -
Pain Management
Rentals -
Hospitals/Home Care
Rentals -
Service & Repair
Sales -
Equip, Consumables |
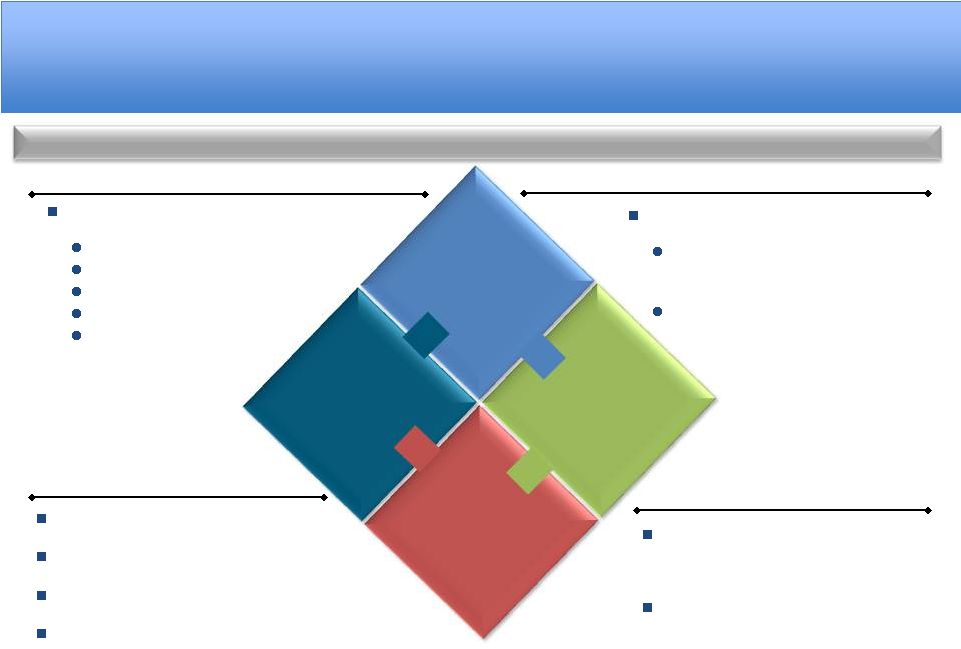
 InfuSystem
Provider Niche – Therapy Started in
Clinic
Total
Total
Home
Home
Infusion
Infusion
Market
Market
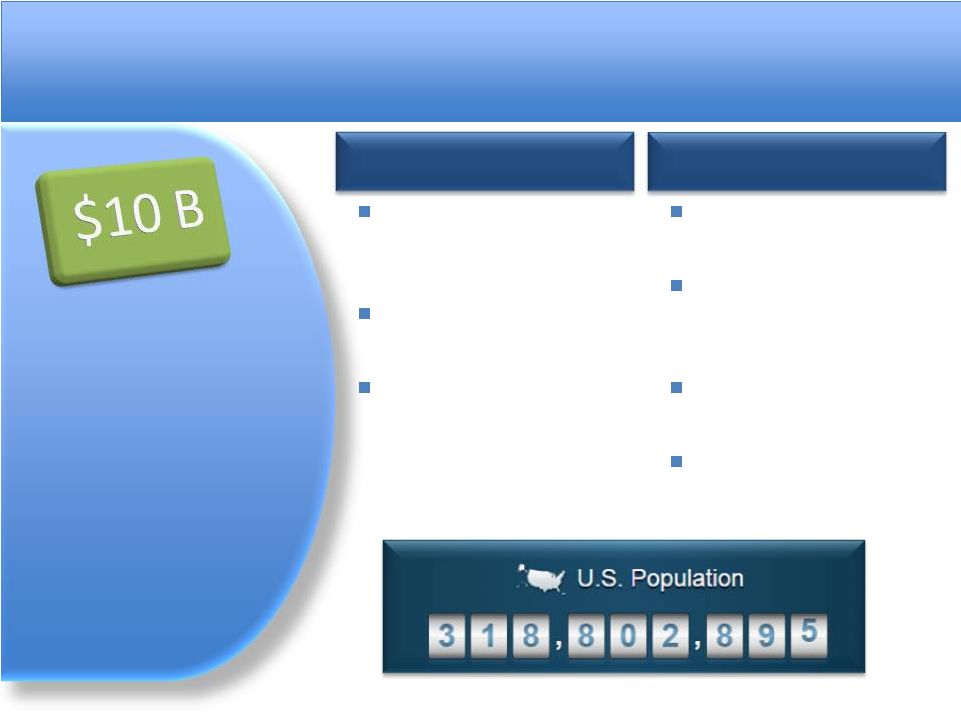
Chemotherapy at Home
InfuSystem is the market
leader with over 1,600
practice sites served
Estimated over $200 M
market.
Cancer rates growing
Nerve Block at Home
5.69M orthopedic
surgeries annually
50% are projected to be
Continuous Peripheral
Nerve Block Candidates
Estimated $700 M
market
Growing therapy |
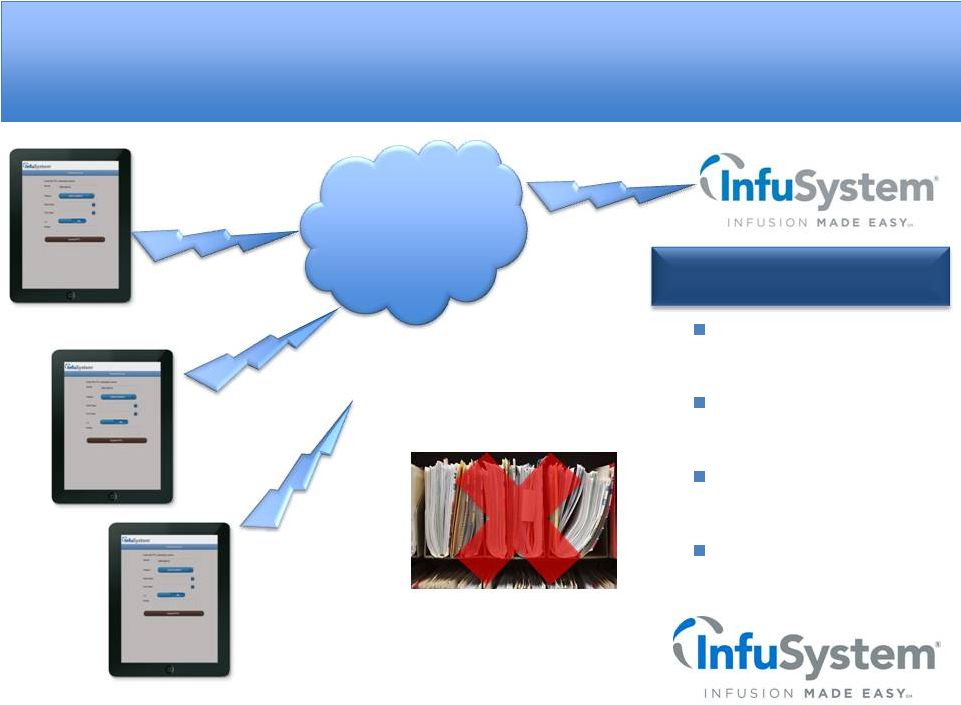 Electronic
Connectivity through Electronic Medical Record (EMR) Interface
Electronic
Data
Exchange
Interface Effects
Fuels market share
gains
Efficiency advantage
vs smaller players
Greater revenue per
employee
Greater customer
satisfaction |
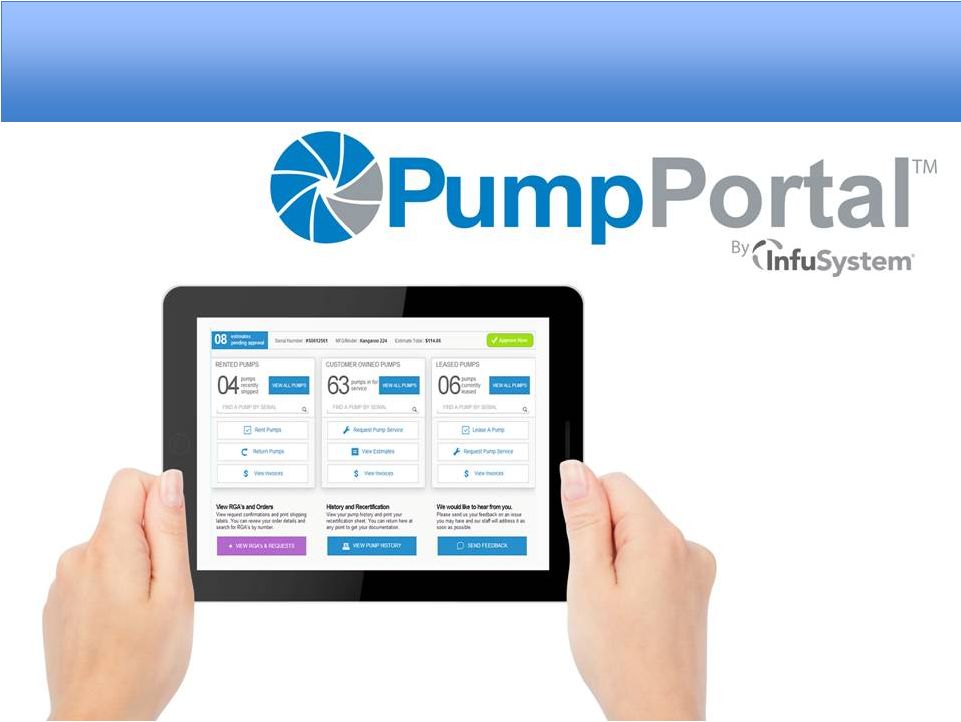 Lifecycle
Management – Infusion Pumps
Total Pump Fleet Management
•
Online, Anytime
•
Order New Pumps
•
Schedule Service & Repair
•
Access Recertification Docs |
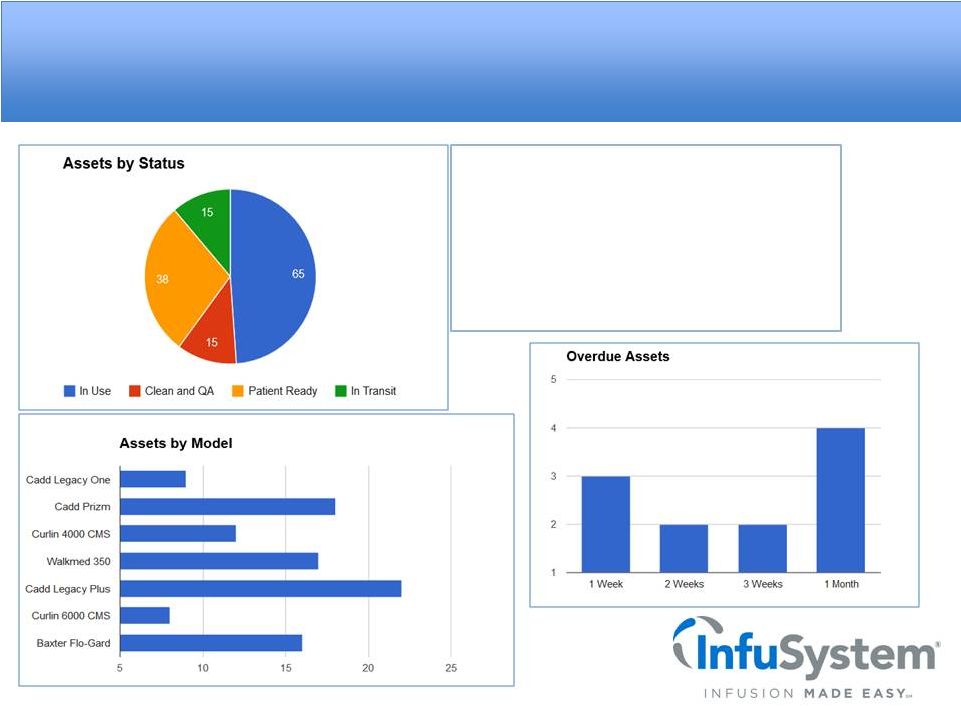 Lifecycle
Management – Asset Tracking
Smart Metrics
Loss Threat Count
11
Loss Threat Percent
3%
Assets Under Par
7
30 Day Average Daily Check-Outs
6 |
 High Patient
Satisfaction Scores |
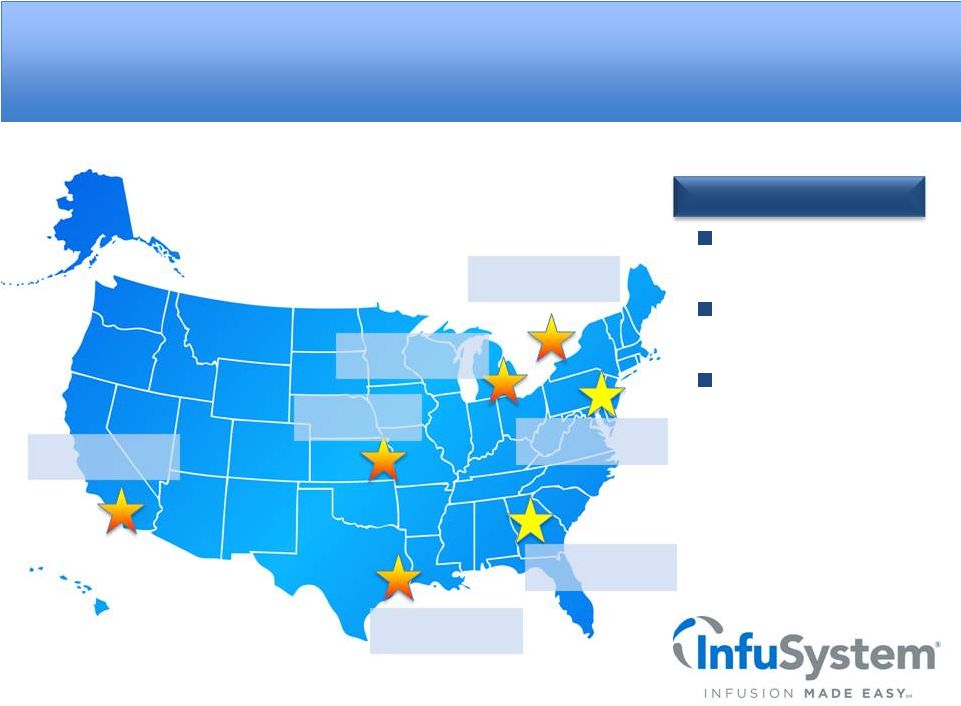 For Faster
Turnaround and Improved Utilization Kansas City
Service Center
Madison Heights
Service Center
Future Northeast
Service Center
Future Southeast
Service Center
Los Angeles Area
Service Center
Houston
Service Center
Toronto Canada
Service Center
InfuSystem Distribution
Reduced cost of air
shipments
Improved
utilization of pumps
Increased market
share of same-day
rental market |
 New Products
& Services Pain Management Service
Catheter care kits
Pole-mounted pump sales
and rentals in oncology
Smart Pump Services
Infusion disposals including
IV administration sets &
chemo safety |
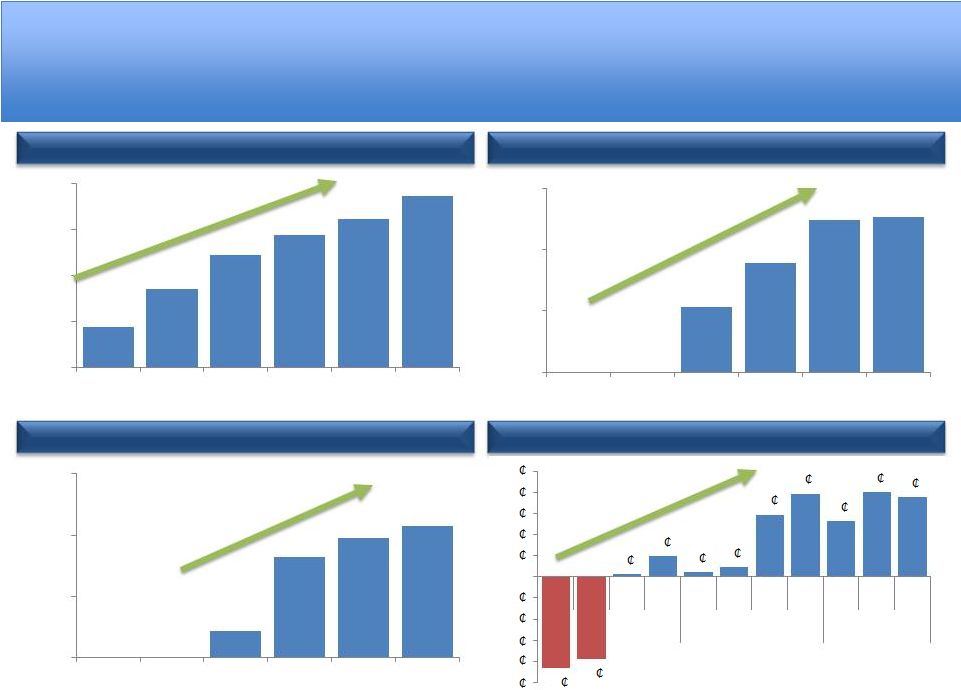 Financial
Overview Adjusted EBITDA (1)
Revenues
Free Cash Flow (1)
Basic EPS
(1) Free Cash Flow = Adjusted EBITDA less CapEx and Net Purchases of Medical
Equipment $38,964
$47,229
$54,637
$58,828
$62,280
$67,404
$30m
$40m
$50m
$60m
$70m
FY2009
FY2010
FY2011
FY2012
FY2013
LTM 3Q14
Revenues
Growing
$10,256
$13,126
$15,962
AEBITDA
Growing
$16,153
$6m
$10m
$14m
$18m
FY2011
FY2012
FY2013
LTM 3Q14
(1) Per 8K filed 3/28/13 for yrs 2011 and 2012
$5,754
$10,568
$11,839
$12,604
$4m
$8m
$12m
$16m
FY2011
FY2012
FY2013
LTM 3Q14
FCF
Growing
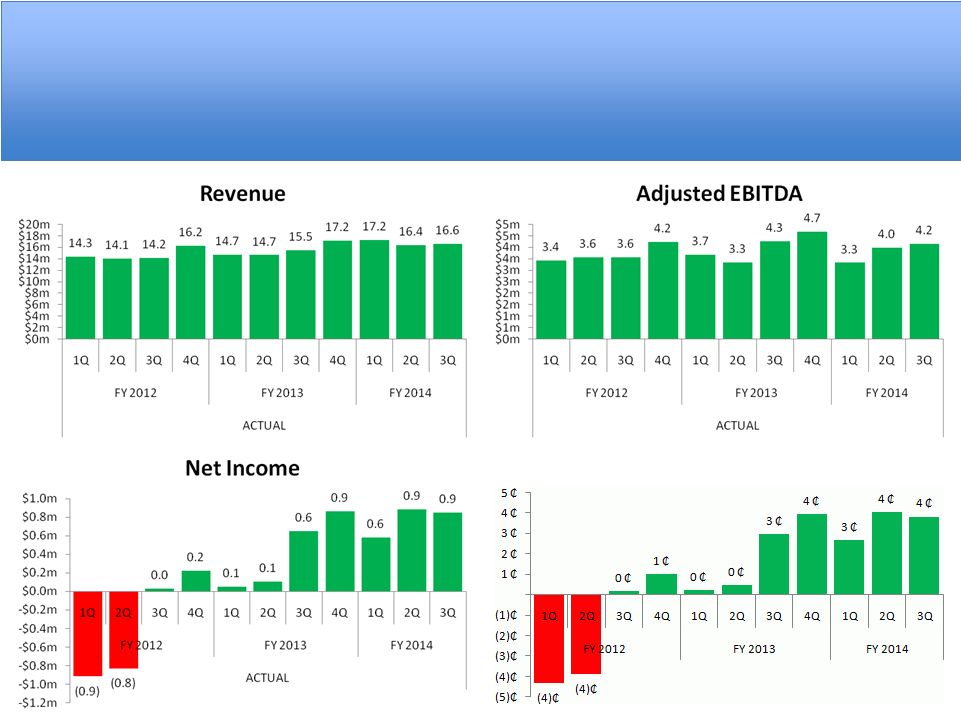
0
1
0
0
3
4
3
4
4
(4)
(4)
(5)
(4)
(3)
(2)
(1)
1
2
3
4
5
1Q
2Q
3Q
4Q
1Q
2Q
3Q
4Q
1Q
2Q
3Q
FY 2012
FY 2013
FY 2014
EPS Profitable &
Growing |
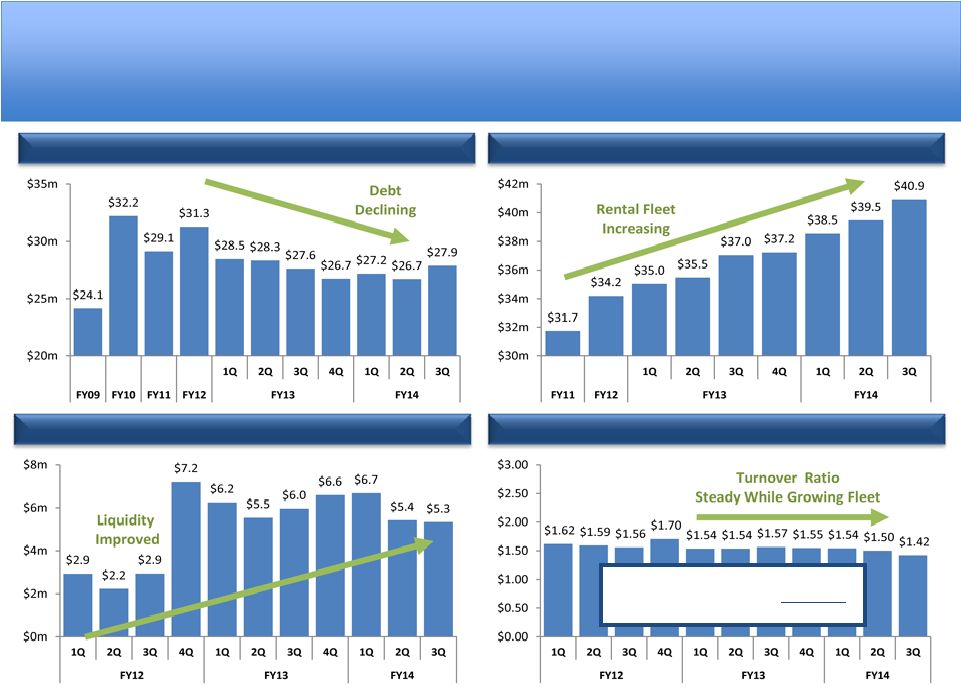 Uses of Free
Cash Flow Every $1.00 invested in the rental fleet
returns ~$1.50 in revenue every year
for the life of the pump
Total Debt
PP&E and Medical Equipment in Service (at cost)
Unrestricted Liquidity
Medical Equipment Turnover Ratio |
 Positioned For
Growth Market Trends
•
InfuSystem is uniquely
positioned to take efficient
advantage of growing
market trends in…
•
Oncology
•
Orthopedic surgery
•
Growth of home infusion
Leadership
•
Experienced Medical
Industry Executives
•
Focused on improving
patient satisfaction and
outcomes
•
Supported by World Class -
ISO and CHAPS Accredited -
facilities and motivated
employee
Strategy
•
Increased use of electronic
connectivity
•
Expanding geographic
footprint
•
Expanding into new
therapies, products and
services |
 Where Does
This Take INFU? Aging Population and Cancer Growth
More Patients Home IV , Commercial Pay
Recognizing Value, CMS Competitive Bidding
Peripheral Nerve Block and Smart Pump Growth
Revenue Growth in High Single Digits Through 2015 |
 Thank You for
Your Interest! IR Contact Info:
The Dilenschneider Group
212-922-0900
Rob Swadosh, rswadosh@dgi-nyc.com |
 Appendix: INFU
Overview |
 Increasing
Therapy Offerings to Payors Payor
Surgery
Infectious
Disease
Oncology
Special
Disease
States |
 Full Line
Multi-Therapy & Multi-Point Offering HOW we provide TPP/DP/Service
Pumps Device & Pharma
Manufacturer,
Distributor, GPO, ACO
Partners
Provider
Patient
Payor |
 InfuSystem
Niche – Extension of Clinic to Home
25-year old business model in
DME billing
At home, at work, at play, all
while receiving the drug
High satisfaction scores
24/7 on-call oncology nurses
Proven outcomes with
continuous home infusion
Oncology, Post Surgical Pain,
Special Disease States
Bills patient insurance
250+ Commercial and
Government Payor
Contracts
Commercial Payors
reimburse more
therapies than CMS
Awarded contracts in
all 9
MSAs (1 of 3
National Vendors)
Average cuts of ~21%
for our category, per
CMS ($250,000 per yr)
Ambulatory Home Infusion
TPP Payor Contracts |
 Rentals, Sales
& Service to Providers Pump Experts
Direct sales, rental, and
lease of device and
supplies in US and
Canada
Pump Broker Expertise –
ability to acquire and
dispose of CAP EX in cost
effective way
Asset management,
rental and lease
Annual Pump
Recertification
Preventative
Maintenance
Warranty
World-Class ISO Certified
service facilities
Regional Distribution
West, South, East &
Canada
28+ Certified Technicians
Pump Rentals, Sales and
Asset Management
Preventative Maint.
Repair |
 Offering
Infusion to All Points of Care Provider
Oncology
Acute
Care
Emergency
Services
Long Term
Care
Home
Infusion |
 Compelling
Value Proposition In-House Service & Repairs
Convenience & Flexibility
Pre-Owned Equipment Expertise
One-Stop Shopping Solution
Convenience and flexibility of rentals and
financing minimize customer capital outlays
Rental and financing eliminates the need for
in-house maintenance/service
Option to own, rent or finance –
designed to fit
customers’
operating and financial parameters
Shorter and longer-term financing options
One-stop shopping solution for ambulatory large
volume pump and other movable medical devices
Sales
Rentals
Supplies
Service
Financing
World-class biomedical repair and
service for pumps, defibrillators and
most other general medical
equipment
Allows InfuSystem to purchase, clean,
repair and certify any used medical
equipment the Company buys for
subsequent sale, rental or financing to
customers
Complementary core competencies allow InfuSystem to offer superior selection, flexibility,
pricing and services “ONE-STOP SHOP”
SERVICE &
REPAIRS
CONVENIENCE &
FLEXIBILITY
PRE-OWNED
EQUIPMENT
EXPERTISE
Unique ability to source and deploy pre-
owned movable medical equipment
Consistent, fair and knowledgeable
market maker for pre-owned pump
disposals
Market knowledge results in attractive
equipment acquisition costs |
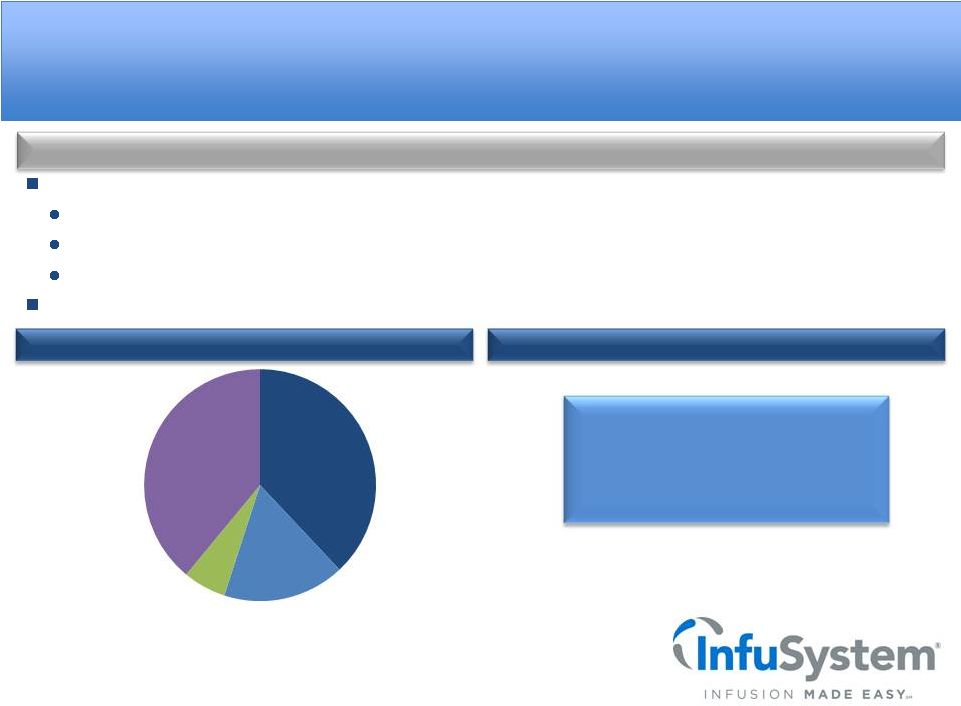 Payor &
Customer Mix Leading Cancer Institution Customers
Revenue by Payor (FY2013)
High diversification of providers and payors
No single healthcare provider represents more than 7% of Third-Party Payor revenues
Strong payor mix among Medicare, other commercial insurers, Blue Cross/Blue Shield, and
Medicaid Approximately 6% of revenues received directly from patients through
co-pays or otherwise Broad coverage further diversifies revenue streams
InfuSystem has strong relationships with the largest third-party payors and the leading
cancer institutions 9 of 10 of the Top
Ten Cancer
Treatment Centers
CMS: Centers for Medicare and Medicaid Services
Medicare and
Medicaid
38%
BCBS
17%
Patient
6%
Commercial
39% |
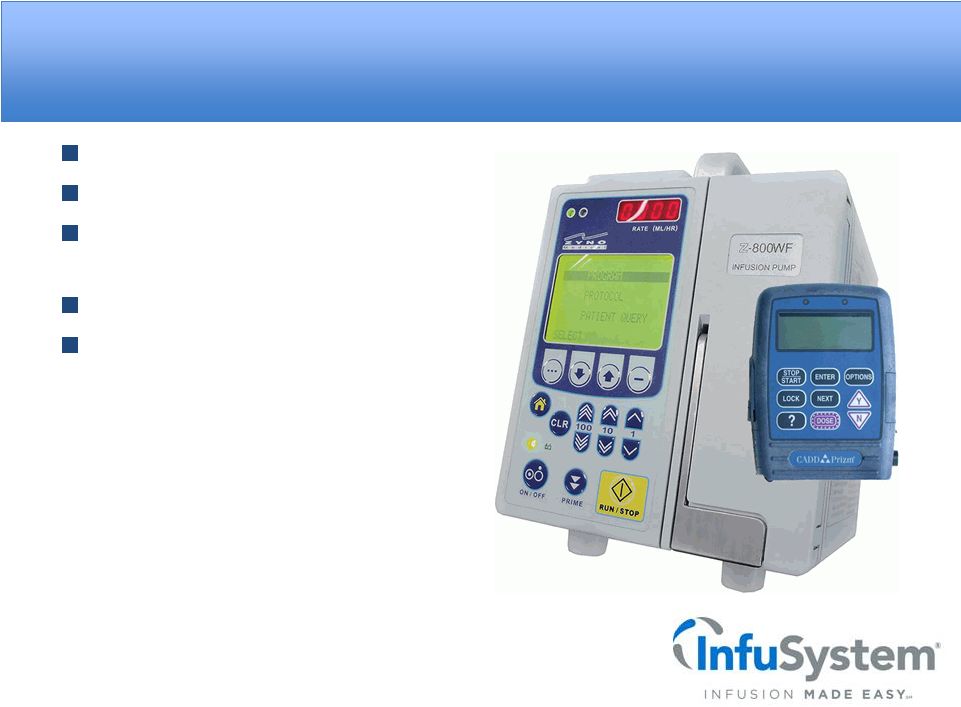
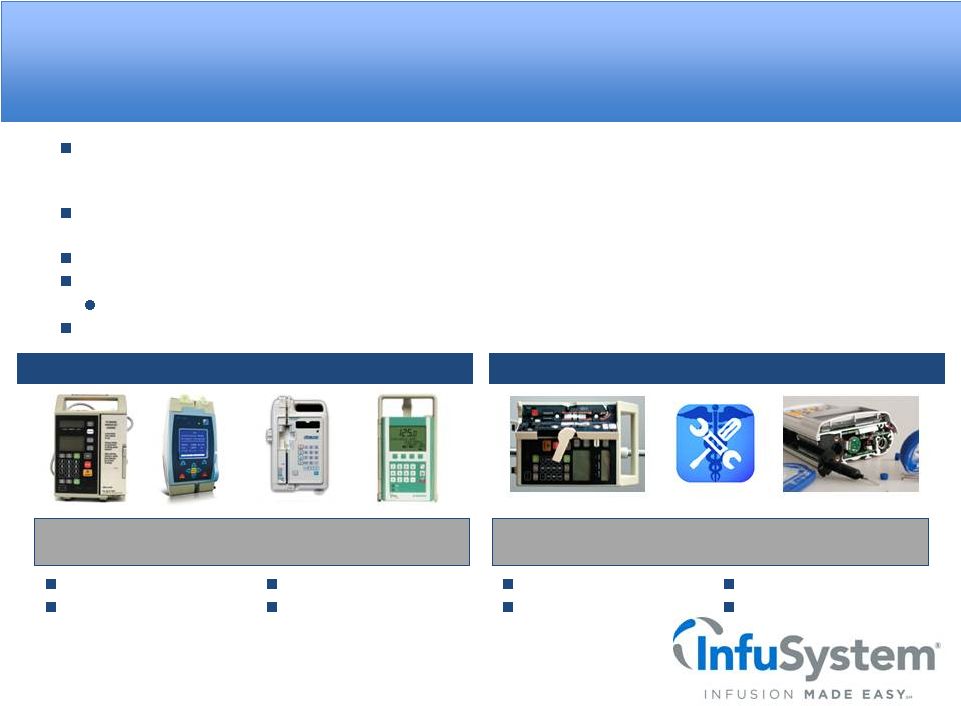 Infusion
pumps Enteral pumps
Direct Payor Business Model
Service & Repair
Products
InfuSystem sells, rents and finances a wide variety of new
and used large volume and ambulatory pumps
InfuSystem services and repairs both its own fleet of
pumps and many types of other movable medical
equipment
Syringe pumps
Ambulatory pumps
Large volume pumps
Ambulatory pumps
Fluid collection
Medical equipment
InfuSystem’s Direct Payor business is focused primarily on the sale, rental, financing
and accompanying service of movable
medical
equipment
to
hospitals
and
alternate
care
sites
who
pay
InfuSystem
directly
–
no
third-party
reimbursement
Founded in 1998 and headquartered in Olathe, KS with distribution/service centers in Santa Fe
Springs, CA and Mississauga, Ontario
InfuSystem services –
ISO 9001 -
and repairs movable medical equipment
Leading provider to alternate site healthcare facilities and hospitals in the United States
and Canada Home infusion providers, long-term care, physician clinics, research
facilities, etc. Transacts
directly
with
healthcare
providers
–
no
third-party
reimbursement
revenue |
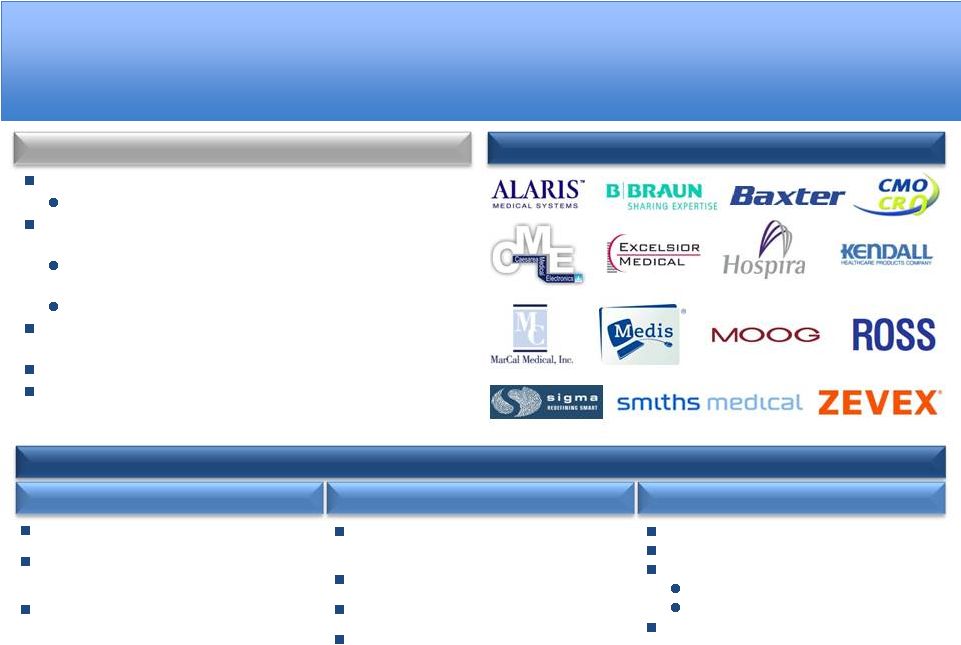 InfuSystem
offers new pumps from top brands Broker-dealer trading desk
In addition, over 70 models and versions of pre-owned pumps
are offered
Pre-owned pumps are re-built and certified by in-house
biomedical technicians to be patient ready
Warranty offered on pre-owned pumps
A variety of financing options to fit customers’
operating,
budgeting and financing parameters
Nationwide, industry-leading ISO 9001 service programs
Launching branch service center in Houston
Direct Payor Offerings
Pre-Owned & New Pumps from Top Manufacturers
Full Spectrum of Ownership Options for Customers
Sales
Rental
Asset Management
Renting new or pre-owned equipment
Rent pumps by the day, week or month to
match swings in patient count
Free shipping on all rentals
Industry leader in sales of pre-owned
equipment, creating significant savings
Competitive pricing on new equipment
Option to sell back pre-owned pumps
Leasing plans offered
ISO 9001 Service offered
Service plans offered
Local service expansion
2 existing; 1 planned
Coordinate with TPP
Loaner pumps available
Leading Provider of New and Pre-Owned Pumps |
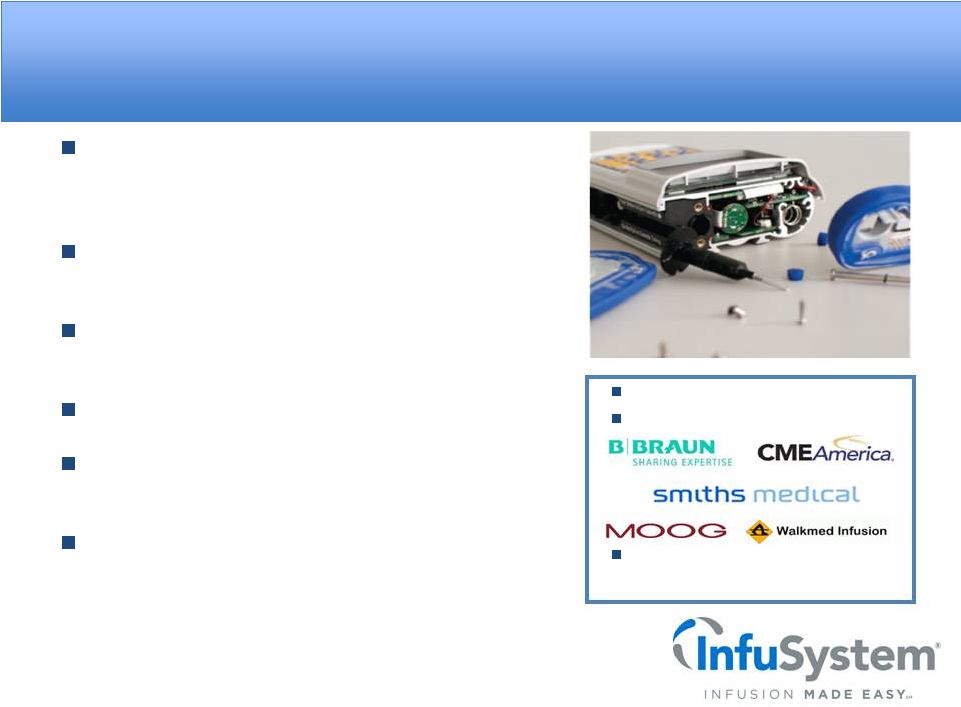 Medical
Equipment Service & Repair In addition to supporting and repairing
InfuSystem’s in-house fleet, the Company certifies,
recalibrates, repairs and services a variety of
infusion pumps
Pumps require scheduled maintenance and
calibration in accordance with manufacturer’s
specifications and regulatory guidelines
Service and repair capabilities on high demand
services reaching end of life that are no longer
supported by manufacturers
ISO certification and an established quality system
strengthens relationships with major customers
Provides InfuSystem an opportunity to establish a
business relationship with customers that acquired
pumps through other sources
Continuing and increased need for compliance
with current as well as anticipated regulations
28 highly qualified service technicians
5 major manufacturer relationships:
3 service centers, located in California,
Toronto and Kansas |
 Competitive
Bidding Overview InfuSystem was not involved in Round 1 nor
Round 2 of Competitive Bidding
CMS announced a Recompete of Round 1
competitive bidding on April 17th
External infusion pumps/supplies added as a
new product category
A supplier must bid on all items within the
product category to have its RFP considered
Recompete covers 9 Metropolitan Statistical
Areas (MSAs)
Competitive Bidding Overview
InfuSystem’s Response to Competitive Bidding
InfuSystem has engaged consultants and industry
professionals to discuss directly with CMS, advise
on positioning the Company for potential
regulatory changes, and facilitate potential
strategic partnership opportunities
InfuSystem was awarded contracts in all 9 MSAs
with average cuts of ~21% for our category per
CMS. 1 of 3 National Vendors to receive
contracts in all 9 markets.
“Competitive environment will vary in accordance
with the level of cuts by CMS”
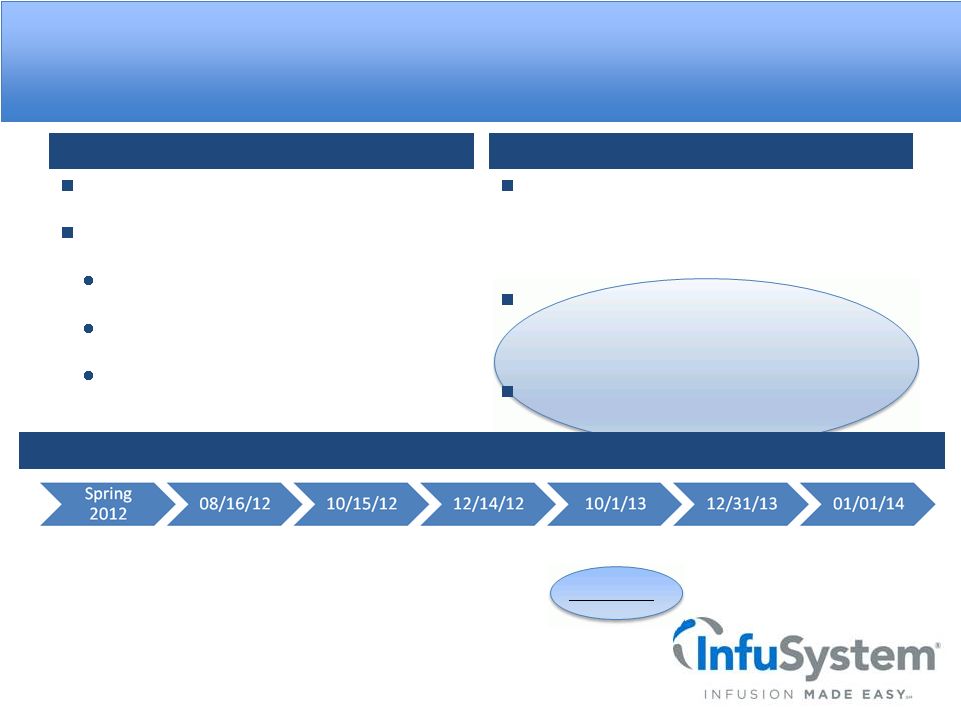
CMS Competitive Bidding “Target”
Timetable
CMS will institute some form of competitive
CMS will institute some form of competitive
bidding nationwide by January 2016.
bidding nationwide by January 2016.
CMS began the pre-
bidding supplier
awareness program
CMS announced bidding
schedule, start bidder
education and begin a
bidder registration period
Bid window
opens
Current Round 1 bid
contracts expire
CMS announces Round
1 Recompete bid
results –
INFU impact
$250K annually
Bid window
closes
Implementation of
Round 1 bid contracts
and prices |
 Quarterly
Financial History Basic EPS |
 Detailed
Historical P&L (000's)
12/31/09
12/31/10
12/31/11
12/31/12
12/31/13
9M 2013
9M 2014
Net revenues:
Rentals
46,795
$
53,471
$
55,962
$
41,556
44,150
Product sales
7,842
5,357
6,318
3,547
6,077
Net revenues:
38,964
47,229
54,637
58,828
62,280
45,103
50,227
Cost of Revenues:
Product, service and supply costs
6,200
7,730
9,128
9,165
11,274
8,174
9,024
Pump depreciation and loss on disposal
4,127
5,954
10,154
6,752
7,327
4,836
5,474
Gross Profit
28,637
33,545
35,355
42,911
43,679
32,093
35,729
Provision for doubtful accounts
4,006
4,515
4,099
5,251
6,534
4,782
4,811
Amortization of intangibles
1,827
2,259
2,662
2,734
2,618
1,972
1,876
Asset impairment charges
0
0
67,592
0
0
0
0
Selling and marketing
5,258
7,087
9,371
9,864
9,658
7,281
7,762
General and administrative
12,218
20,622
17,987
23,062
18,973
14,622
14,723
Operating income profit/(loss)
5,328
(938)
(66,356)
2,000
5,896
3,436
6,557
Total other gain/(loss)
(3,577)
(2,285)
(2,221)
(4,152)
(3,196)
(2,307)
(2,329)
Profit/(loss) before income taxes
1,751
(3,223)
(68,577)
(2,152)
2,700
1,129
4,228
Income tax benefit/(expense)
(977)
1,371
23,134
663
(1,031)
(324)
(1,907)
Net income/(loss)
774
$
(1,852)
$
(45,443)
$
(1,489)
$
1,669
$
805
$
2,321
$
EBITDA
11,199
$
7,745
$
(57,336)
$
9,590
$
14,230
$
9,747
$
11,054
$
EBITDA (ex. Impairment charges)
11,199
$
7,745
$
10,256
$
9,590
$
14,230
$
9,747
$
11,054
$
Adjusted EBITDA
N/A
N/A
10,256
$
13,126
$
15,954
$
11,271
$
11,471
$ |
 Detailed
Historical BS (000's)
12/31/09
12/31/10
12/31/11
12/31/12
12/31/13
6/30/14
9/30/14
ASSETS
Current Assets:
Cash and cash equivalents
7,750
$
5,014
$
799
$
2,326
$
1,138
$
1,041
$
1,902
$
Accounts receivable - total, net of allowance
5,517
6,679
7,448
8,511
10,697
10,768
11,505
Inventory
925
1,699
1,309
1,339
1,234
1,485
1,589
Prepaid expenses and other current assets
395
750
934
684
518
712
621
Deferred income taxes
125
1,147
682
1,971
2,296
2,296
2,296
Total Current Assets
14,712
15,289
11,172
14,831
15,883
16,302
17,913
Total PP&E and Medical Equipment
13,499
16,672
17,672
16,564
18,974
20,017
22,397
Deferred debt issuance costs, net
781
658
421
2,362
1,817
1,505
1,349
Total Goodwill and Intangible assets, net
85,491
97,344
28,221
25,541
24,182
24,287
24,461
Deferred income taxes
0
0
18,187
17,806
16,300
15,376
14,696
Other assets
207
401
590
419
217
248
208
Total Assets
114,690
$
130,364
$
76,263
$
77,523
$
77,373
$
77,735
$
81,024
$
LIABILITIES AND STOCKHOLDERS' EQUITY
Current Liabilities:
Accounts payable - total
1,306
$
2,016
$
4,063
$
2,144
$
4,736
$
4,101
$
4,570
$
Accrued expenses and other
1,573
4,631
2,235
4,098
3,187
2,573
3,303
Derivative liabilities
2,670
183
258
0
0
0
0
Current portion of long-term debt
5,501
5,551
6,576
3,953
5,118
3,871
4,238
Total Current Liabilities
11,050
12,381
13,132
10,195
13,041
10,545
12,111
Long-term debt, net of current portion
18,640
26,646
22,551
27,315
21,609
22,829
23,631
Deferred income taxes
3,314
5,788
0
0
0
0
0
Other liabilities
221
406
415
0
0
0
0
Total Liabilities
33,225
$
45,221
$
36,098
$
37,510
$
34,650
$
33,374
$
35,742
$
Total Stockholders' Equity
81,465
$
85,143
$
40,165
$
40,013
$
42,723
$
44,361
$
45,282
$
Total Liabilities and Equity
114,690
$
130,364
$
76,263
$
77,523
$
77,373
$
77,735
$
81,024
$
Total Debt
24,141
$
32,197
$
29,127
$
31,268
$
26,727
$
26,700
$
27,869
$
Net Debt
16,391
$
27,183
$
28,328
$
28,942
$
25,589
$
25,659
$
25,967
$ |
 Comparison to
Other Infusion Companies Stock Comparison
As of 11/20/14
BioScrip
Infu
Stock Price
$ 5.99
2.85
52 Week hi
$ 9.05
4.50
52 Week lo
$ 5.44
1.70
Average Volume
1,000,850
174,194
In $ millions
Market Cap
$411.1m
$63.3m
P/E Ratio
(trailing)
N/A
20.29x
P/E Ratio
(forward)
75.12x
8.82x
Enterprise Value
$821.4m
$89.5m
Revenues (ttm)
$1,030m
$60.8m
Net Income (ttm)
$(93.6)m
$3.18m
EBITDA (ttm)
$(3.5)m
$16.7m
EBITDA Margin (% of rev)
N/A
27.4%
EV / EBITDA
N/A
5.4x
EBITDA Anlayst (FY2014)
$55.0m
17.4
EV / EBITDA
14.9x
5.1x
Stock Comparison
Source: Yahoo Finance
•
INFU has no direct small DME
niche public company comp.
•
One often mentioned is
BioScrip Inc. (BIOS), but like
most other potential comps it is
broadly diversified beyond the
infusion sector. |