Attached files
| file | filename |
|---|---|
| 8-K - 8-K - ACI WORLDWIDE, INC. | d829158d8k.htm |
    ACI Worldwide
(ACIW) Investor Conferences
December 2014
Exhibit 99.1 |
 MEETS THE CHALLENGE OF CHANGE
Private Securities Litigation Reform Act of 1995
Safe Harbor For Forward-Looking Statements
This presentation contains forward-looking statements based on current
expectations that involve a number of risks and uncertainties. The
forward-looking statements are made pursuant to safe harbor provisions
of the Private Securities Litigation Reform Act of 1995. A discussion
of these forward-looking statements and
risk
factors
that
may
affect
them
is
set
forth
at
the
end
of
this
presentation.
The Company assumes no obligation to update any forward-looking statement in
this presentation, except as required by law.
2 |
 MEETS THE CHALLENGE OF CHANGE
About ACI Worldwide
•
High
quality
products
and
services
drive
strong
renewal
rates
on
a
large
installed user base of over 5,000 customers
•
Long-term, blue-chip, geographically diverse customer base with low
customer concentration
•
Subscription-based model drives recurring revenue and provides stability
and predictability to our operations
•
Large contractual backlog provides earnings visibility and allows our
management to optimally manage the size and infrastructure of the
business
•
Leading payments transformation with Universal Payments (UP)
•
Management team has an established track record of operational
excellence and significant industry experience
2013
Pro Forma Revenue
$1023 Million
2013
Pro Forma Adjusted EBITDA
$273 Million
9/30/2014
60-Month Backlog
$4.1 Billion
Founded in 1975,
ACI is a leading provider
of electronic payments
and transaction banking
software solutions for
financial institutions,
retailers, processors and
billers worldwide
Note: Pro Forma Revenue is presented on a Non-GAAP basis that adds back the Deferred Revenue
Fair Value
Adjustment.
Pro
Forma
Adjusted
EBITDA
excludes
transaction
and
litigation
expenses.
Both
metrics
are
presented
on
a
pro
forma
basis
for
the
ORCC
and
OPAY
acquisitions.
3 |
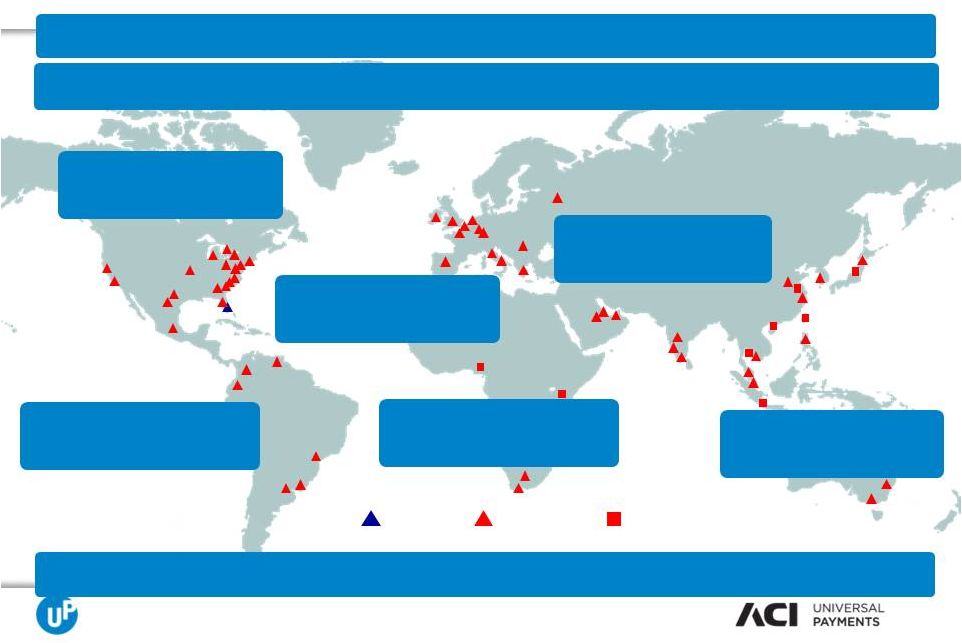 Global
Distribution and Customer Base: The Leader in the Mega and Large FIs
Market Headquarters
Regional
Offices
Distributors
AMERICAS
1,950+ customers
EMEA
500+ customers
ASIA/PACIFIC
150+ customers
5,000+ customers in over 80 countries rely on ACI solutions
Customers: ~ 180
processors globally
Customers: ~ 290
retailers globally
Customers: 3600+
US billers
18 of the top 20 and 67 of the top 100 global banks are customers
~ 4,500
employees in 36 countries
4
MEETS THE CHALLENGE OF CHANGE |
 MEETS THE CHALLENGE OF CHANGE
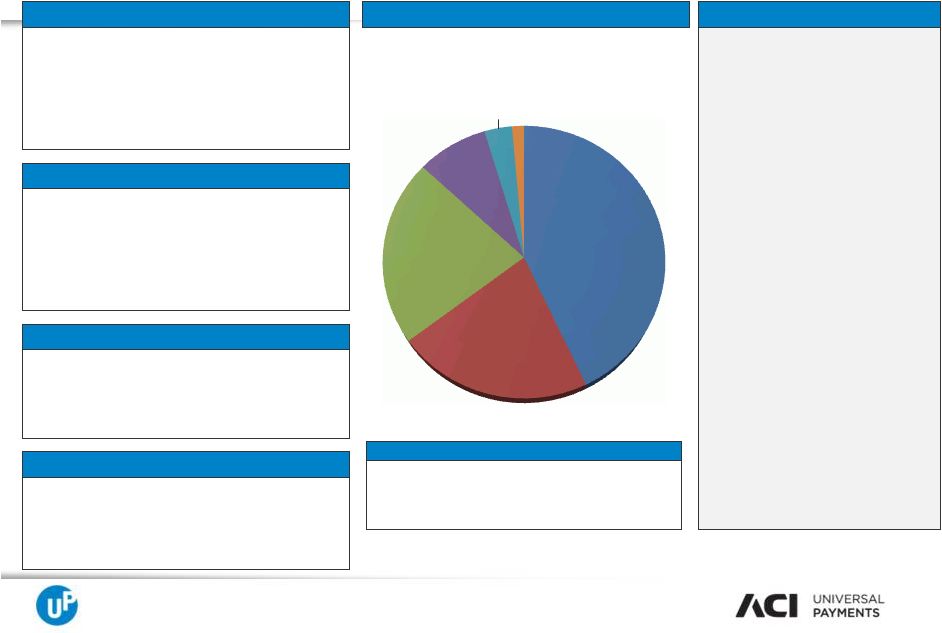
ACI is a Leading Provider of Electronic Payments and
Transaction Banking Solutions
•
Tools to prevent payment transaction
fraud and enterprise financial crimes
•
Case management
Fraud
•
Internet-based electronic bill payment and
presentment (EBPP)
•
Transaction-based, hosted services for
banks and billers
•
Automated collection application
Bill Pay / Collections
•
Consumer and Business Internet Banking,
Mobile, Trade Finance and Branch
Automation sold to large banks globally as
license or hosted subscription services
•
Consumer and small biz Internet and
mobile banking sold to US community FIs
and credit unions as hosted, subscription
Online Banking
•
Software sold to global banks that enables
the providing of treasury services to large
corporates
•
High value wire transfers, Low Value Bulk
Payments and SWIFT messaging
Wholesale Payments
•
Software sold directly to banks and
payment processors
•
Solutions help authenticate, authorize,
acquire, clear and settle electronic
consumer payments
•
Payments acquiring and authorization
solution for retailers
Retail Payments
1
Financial
Insights
-
Worldwide
Payments
Market
Sizing
2012
and
3
Party
Consultant
Note: Revenue figures represent FY 2014 GAAP Revenue on a pro forma basis for the OPAY and ReD
acquisitions. ACI Product Family Revenue %
Highlights
In a highly fragmented
market, we control 6% of
the market spend
1
Software facilitates over
120 billion consumer
transactions per year;
scales to thousands per
second
~1/3 of all domestic SWIFT
transactions
Enables over $13 trillion in
payments each day
Software designed for
“Five nines availability”
2/3 of all Fed
wires
5
Retail Payments
and Merchant
43%
Online Banking
and Branch 22%
Bill Payment
22%
Fraud 8%
Wholesale 3%
Other 1%
rd |
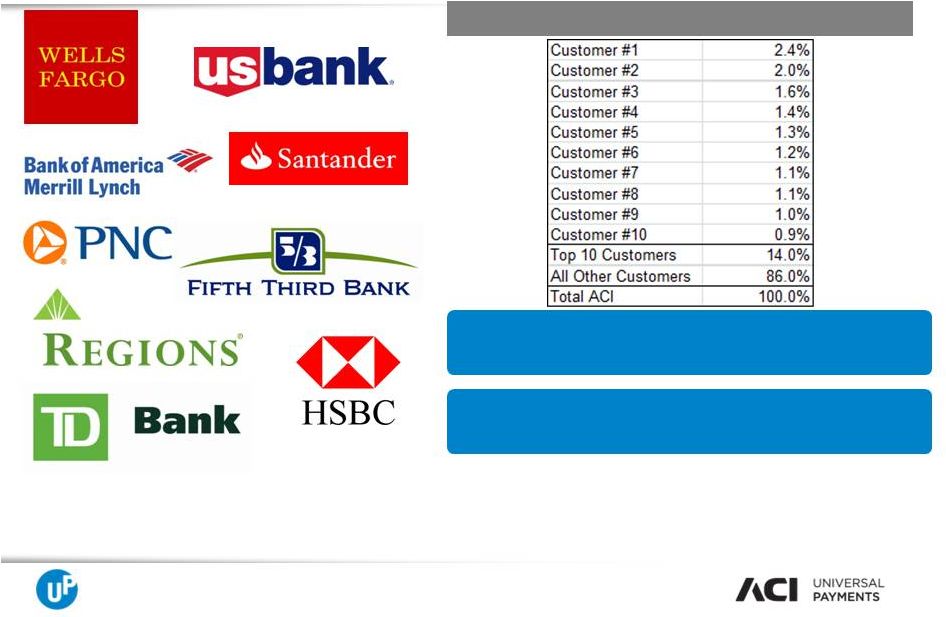 Diverse
Customer Base of Top Global Banks, Processors, Billers and Retailers Provide
Significant Cross Sell Opportunities FY 2013 Revenue by Customer
No single customer represents more than 3% of
consolidated revenue
On average, customers use 3 ACI products or less
representing a large cross sell opportunity
6
MEETS THE CHALLENGE OF CHANGE |
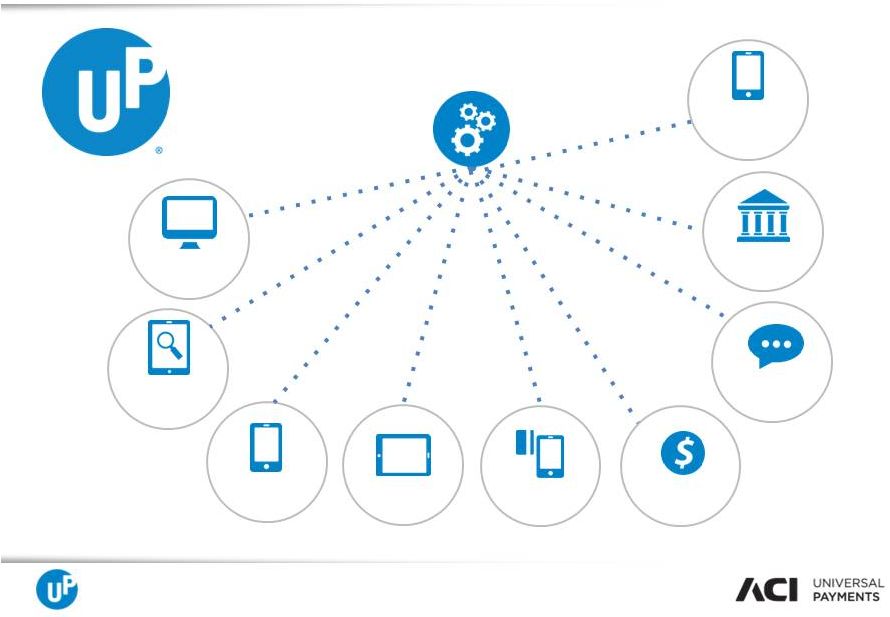
 Delivering an Omni-channel
Customer Experience
for one of the world’s
largest banks
CHALLENGE
•
Aspirations to be the primary bank of its
customers held back by inconsistent
experience caused by legacy technology
•
Improve cross sell and retention rates
BENEFITS
•
Significant operating cost improvements
•
New
channels
deployed
in
4
months
instead
of
18,
reducing deployment costs by 80%
•
Payment analytics improves cross sell and retention
•
Consistent
payment
experience
MEETS THE CHALLENGE OF CHANGE |
 Complex
Payments Environment Leads to Inconsistent Customer Experience
CORE BANKING
Core interface
Before
Online banking
AML
Call center
Branch system
Payment engine
Mobile
POS
ATM
Payment engine
Payment engine
Fraud
detection
Fraud
detection
Fraud
detection
Payment engine
Tablet
Payment engine
8
MEETS THE CHALLENGE OF CHANGE |
 CORE
BANKING SYSTEM Payment engine
Fraud
detection and
AML
Branch
system
Online banking
Mobile
POS
ATM
Tablet
After
Streamlined, Consistent
Omni-channel Experience
Call center
Future payment
types and
channels
MEETS THE CHALLENGE OF CHANGE |
 MEETS THE CHALLENGE OF CHANGE
Attractive trends will drive growth opportunities for ACI
1
Source:
Financial
Insights
-
Worldwide
Payments
Market
Sizing
2012
and
3rd
Party
Consultant
2
Source: McKinsey “Dynamic Changes in the Global Payments Industry”,
2012 Industry
Dynamics
2
Customer Trends
Market
Sizing
1
•
Shift from paper to electronic
•
Compounding regulatory requirements
•
Revenue and profitability pressures
•
Complexity from globalization
FIs looking to transform their businesses by:
•
Driving down unit costs
•
Launching new products quicker
•
Reducing risks
•
Improving customer satisfaction and loyalty
•
Vendor Consolidation
•
Total addressable market is ~$20bn in 2013 and growing 7-8% overall
•
~50% of addressable market is in-sourced (homegrown) applications
•
Global transaction volume growth expected to be 9% CAGR through 2020
•
Increasing fraud costs
•
Convergence of payments; real-time
•
Legacy systems increasingly difficult to
update
Favorable Industry and Customer Trends
10 |
 MEETS THE CHALLENGE OF CHANGE
Strategy to Drive Superior Performance
Continued Focus on Control, Profitability and Growth
•
Continue to increase recurring revenue base
•
Expand customer relationships by cross-selling (on average customers use 3 ACI
products or less)
•
Lead payments transformation with Universal Payments delivering
technology- enabled efficiencies
•
Expand geographically
Growth
Drivers
•
Expand margins through operating leverage and process-driven operating
philosophy •
Realize cost synergies derived from recent acquisitions
Continuous
Improvements to
Drive Margin
Expansion
•
Buy, build or partner to fill-in product gaps or expand customer base
•
Recent acquisitions have added product, scale and market breadth
ORCC acquisition provided ACI with a full-service Bill Payment platform for
Online Banking and Billers
OPAY acquisition expanded bill payment reach into key new verticals incl.
Federal, State & Local government, taxes and higher education
Disciplined
Acquisition /
Investment Strategy
11 |
 FINANCIAL OVERVIEW |
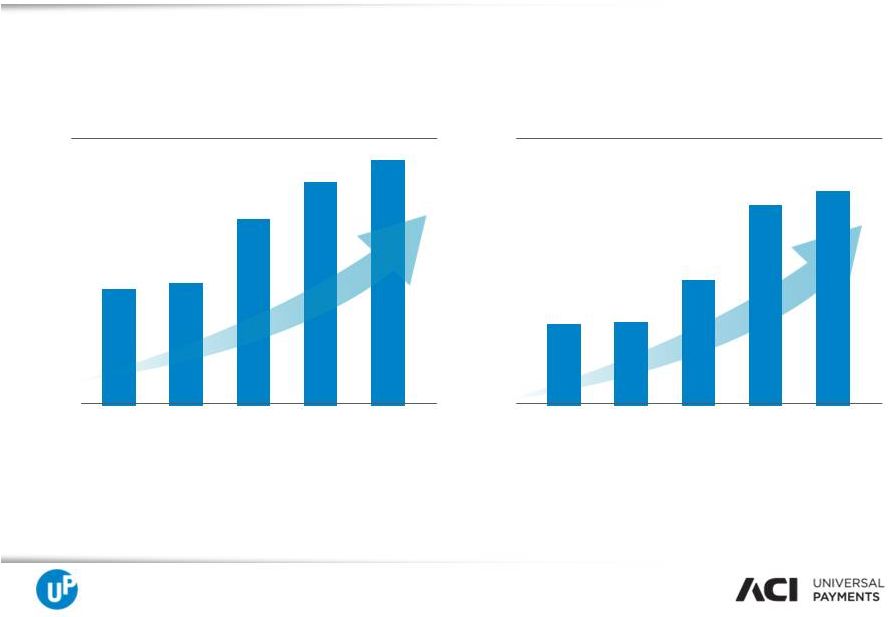 MEETS THE CHALLENGE OF CHANGE
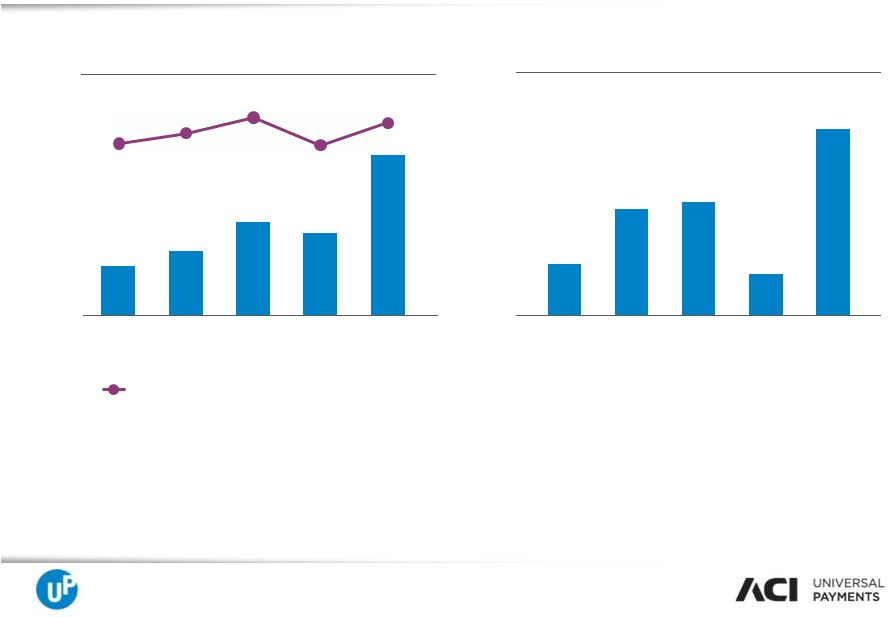
$4,114
$1,566
$1,617
$2,416
$3,861
2010
2011
2012
2013
2014 E
2010
2011
2012
2013
Q3 2014
SNET 20%+ CAGR
$315
$330
$501
$600
$660+
Renewal rates across ACI products >96%
>95% of our contracts are transaction-based
NET NEW SALES BOOKINGS
HISTORICAL 60-MONTH BACKLOG
25%+ CAGR
(millions)
(millions)
Bookings Growth Leads to Large Backlog
Provides Revenue and Earnings Visibility
13 |
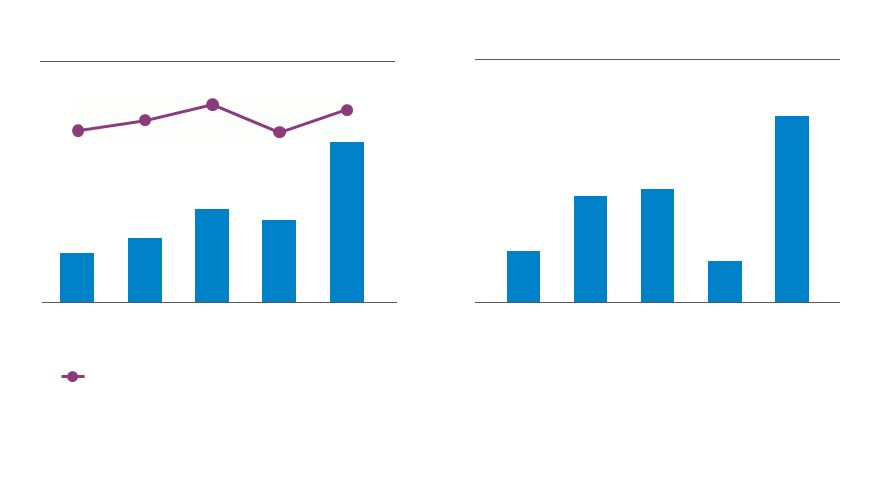
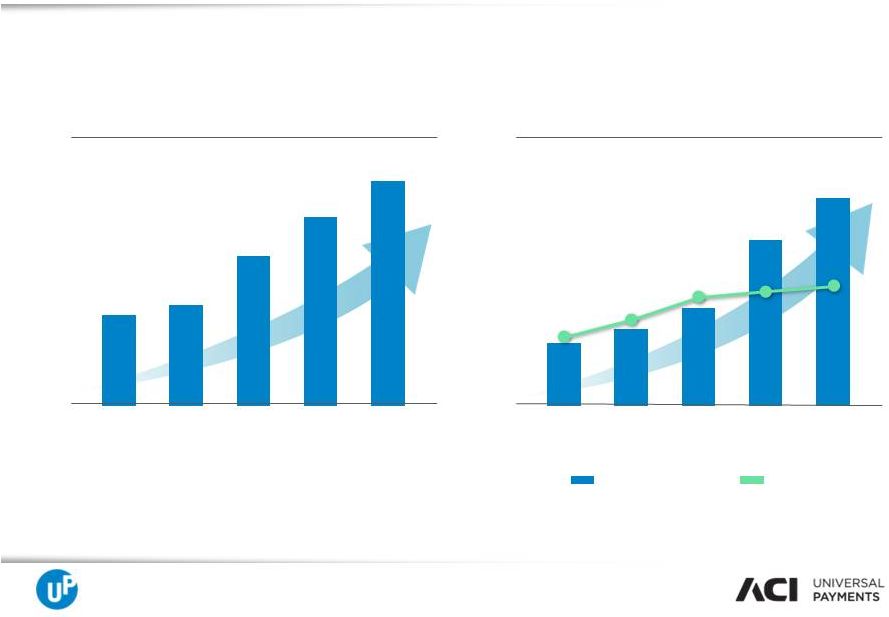 MEETS THE CHALLENGE OF CHANGE
$1,035 E
$418
$465
$689
$871
$270 E
$88
$113
$191
$239
2010
2011
2012
2013
2014E
NON-GAAP REVENUE
2010
2011
2012
2013
2014E
ADJUSTED EBITDA
30%
21%
24%
28%
29%
Adjusted EBITDA
% Net Margin
25% CAGR
32% CAGR
(millions)
(millions)
2013 revenue geographic mix: 63% Americas, 26% EMEA and 11% Asia/Pacific
ACI’s Financial Summary, 2010 –
2014
Notes:
2014E represents midpoint of guidance range
14
Net Margin based on net revenues, or gross revenues adjusted for pass through interchange fees of $38
million in 2013 and $120 million in 2014 |
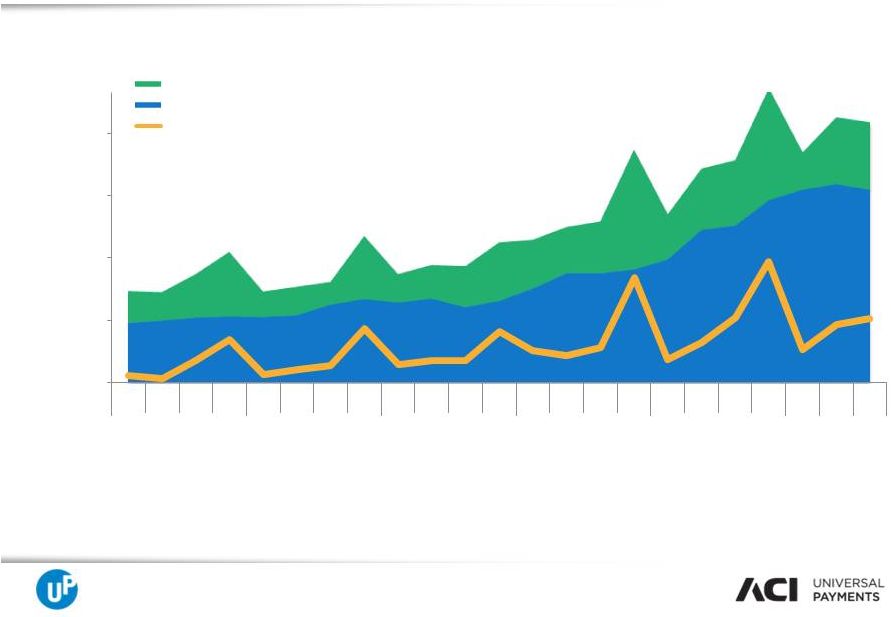 MEETS THE CHALLENGE OF CHANGE
Q2
Q3
•
Monthly Recurring Revenue predictable & growing, now >70% of total
revenue •
Non-recurring revenue is strongest in Q4
•
EBITDA margin spikes follow revenue
Fixed Costs Provide Leverage in Model
15
$0
$60
$120
$180
$240
Q1
Q2
Q3
Q4
Q1
Q2
Q3
Q4
Q1
Q2
Q3
Q4
Q1
Q2
Q3
Q4
Q1
Q2
Q3
Q4
Q1
Non Recurring Revenue: Ongoing Implementations, Services, Capacity Sales and
Annual License Fees Monthly Recurring Revenue: SaaS Subscriptions &
Transactions, Maint and License Fees (Paid Monthly, Quarterly only) Adjusted
EBITDA |
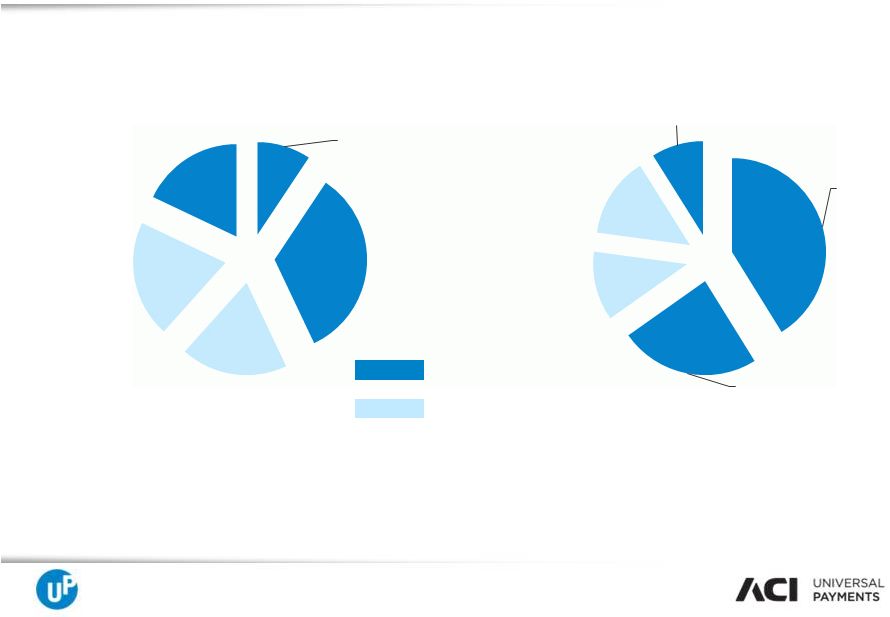 MEETS THE CHALLENGE OF CHANGE
SaaS Subscriptions and Transactions Contribution Growth
2009 segment contribution
2013 segment contribution
•
SaaS Subscriptions & Transactions have grown from ~10% to over 40%
•
Overall monthly recurring revenues have grown from ~60% to over 70%
•
Note: 2013 percentages based normalized for ORCC and OPAY
Monthly recurring segments
Non recurring segments
16
SaaS
subscriptions &
transactions
41%
Maintenance
24%
Services
12%
Initial licenses
fees
14%
Monthly license
fees
9%
SaaS
subscriptions &
transactions,
10%
Maintenance,
32%
Services,
20%
Initial licenses
fees, 20%
Monthly
license fees,
18% |
    MEETS THE CHALLENGE OF CHANGE
$30
$63
$67
$24
$151
2009
2010
2011
2012
2013
OPERATING FREE CASH FLOW
2009
2010
2011
2012
2013
$10
$13
$19
$17
CAPITAL EXPENDITURES
% of Non-GAAP Revenue
Low capital expenditures needed to maintain
existing client base
ACI generates strong free cash flow
•
NOLs starting to contribute and cash taxes
much lower than GAAP
(millions)
(millions)
Low Cap Ex and Strong Cash Flow
17
$33
3%
4%
3%
4%
3% |
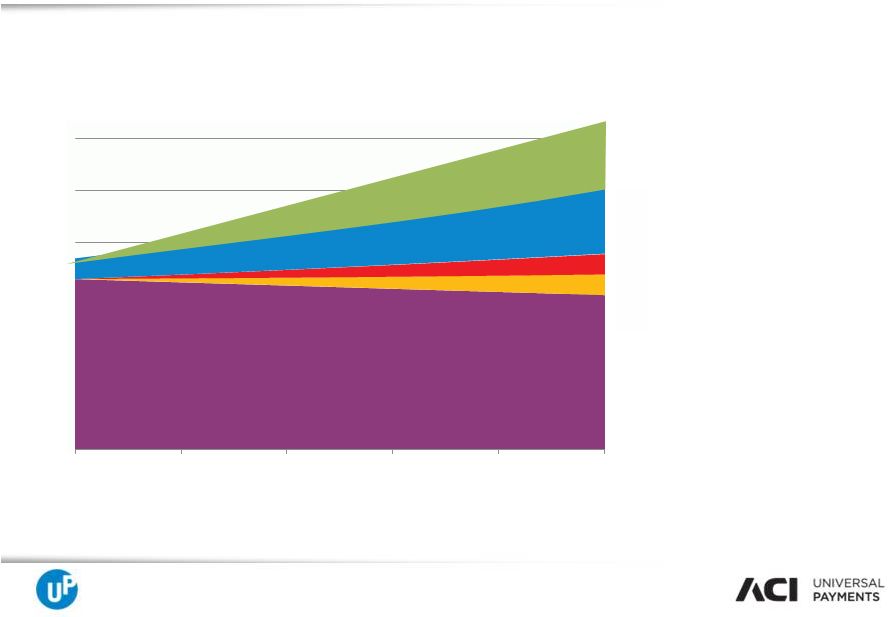 MEETS THE CHALLENGE OF CHANGE
+
+
+
+
•
Existing customer base and low customer attrition provide baseline for future
revenue •
Competitive positioning and high R&D spending provides pricing power
•
Electronic payment growth at 6-8% CAGR
•
Cross sales typically account for 2/3 of net new business
Cross sales and new customer wins
+
Backlog is Foundation, Cross Sales Add Growth
18
Start
Year 1
Year 2
Year 3
Year 4
Year 5
Transaction growth (both in SaaS revenue &
incremental transaction-based licenses)
Price increases
Annual inflation increases
60-mo backlog (recurring only) |
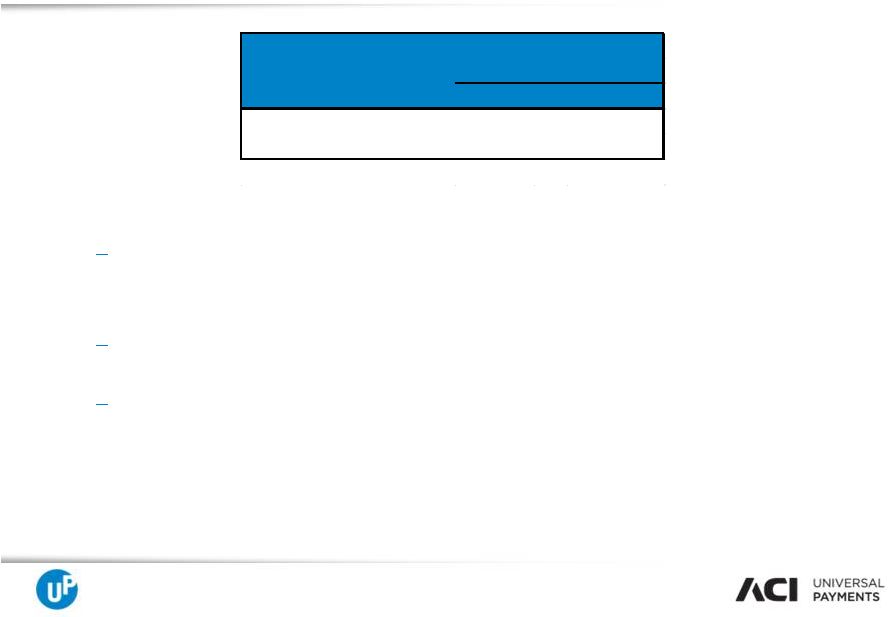 MEETS THE CHALLENGE OF CHANGE
2014 Guidance
•
Guidance
•
Notes
19
Sales
bookings,
net
of
term
extensions,
growth
rate
for
the
year
is
expected
to
be
in the double digits
These metrics exclude approximately $18 to $20 million in significant
transaction- related
expenses
and
include
$2
million
for
the
deferred
revenue
adjustments
Guidance assumes estimates for non-cash purchase accounting adjustments,
intangible valuations and deferred revenue adjustment
Key Metrics
Low
High
Non-GAAP Revenue
$1,025
$1,045
Adjusted EBITDA
$265
$275
$s in millions
2014 Guidance |
 MEETS THE CHALLENGE OF CHANGE
Financial Summary –
Five-year Targets
•
Organic revenue growth
Mid-to-upper single digits
•
Adjusted EBITDA margin
100 bps expansion per year
•
Operating free cash flow
Track adjusted EBITDA growth
•
Sales net of term extension growth
High single digits
20 |
 The
Advantage
•
Leading market position
•
High retention and renewal rates
•
Significant recurring revenue
•
Scalable, fixed-cost model
with improving margin
•
Low cash investment required
High-quality Software Model
Drives Superior Performance
21
MEETS THE CHALLENGE OF CHANGE |
 MEETS THE CHALLENGE OF CHANGE
Non-GAAP Financial Measures
22
To
supplement
our
financial
results
presented
on
a
GAAP
basis,
we
use
the
non-GAAP
measure
indicated
in
the
tables,
which
exclude
certain
business
combination
accounting
entries
related
to
the
acquisitions
of
Online
Resources
and
S1
and
significant
transaction
related
expenses,
as
well
as
other
significant
non-cash
expenses
such
as
depreciation,
amortization
and
share-based
compensation,
that
we
believe
are
helpful
in
understanding
our
past
financial
performance
and
our
future
results.
The
presentation
of
these
non-GAAP
financial
measures
should
be
considered
in
addition
to
our
GAAP
results
and
are
not
intended
to
be
considered
in
isolation
or
as
a
substitute
for
the
financial
information
prepared
and
presented
in
accordance
with
GAAP.
Management
generally
compensates
for
limitations
in
the
use
of
non-GAAP
financial
measures
by
relying
on
comparable
GAAP
financial
measures
and
providing
investors
with
a
reconciliation
of
non-GAAP
financial
measures
only
in
addition
to
and
in
conjunction
with
results
presented
in
accordance
with
GAAP.
We
believe
that
these
non-GAAP
financial
measures
reflect
an
additional
way
of
viewing
aspects
of
our
operations
that,
when
viewed
with
our
GAAP
results,
provide
a
more
complete
understanding
of factors and trends affecting our business. Certain non-GAAP measures
include: Non-GAAP
revenue:
revenue
plus
deferred
revenue
that
would
have
been
recognized
in
the
normal
course
of
business
by
S1
and
Online
Resources
if
not
for
GAAP
purchase
accounting
requirements.
Non-GAAP
revenue
should
be
considered
in
addition
to,
rather
than
as
a
substitute for, revenue.
Non-GAAP
operating
income:
operating
income
plus
deferred
revenue
that
would
have
been
recognized
in
the
normal
course
of
business
by
S1
and
Online
Resources
if
not
for
GAAP
purchase
accounting
requirements
and
significant
transaction
related
expenses.
Non-GAAP
operating
income should be considered in addition to, rather than as a substitute for,
operating income. Adjusted
EBITDA:
net
income
plus
income
tax
expense,
net
interest
income
(expense),
net
other
income
(expense),
depreciation,
amortization
and
non-cash
compensation,
as
well
as
deferred
revenue
that
would
have
been
recognized
in
the
normal
course
of
business
by
S1
and
Online
Resources
if
not
for
GAAP
purchase
accounting
requirements
and
significant
transaction
related
expenses.
Adjusted
EBITDA
should
be
considered in addition to, rather than as a substitute for, operating income.
|
 MEETS THE CHALLENGE OF CHANGE
Non-GAAP Financial Measures
Non-GAAP Revenue (millions)
2010
2011
2012
2013
Revenue
418
$
465
$
667
$
865
$
Deferred revenue fair value adjustment
-
-
22
6
Non-GAAP revenue
418
$
465
$
689
$
871
$
23
Adjusted EBITDA (millions)
2010
2011
2012
2013
Net income (loss)
27
$
46
$
49
$
64
$
Plus:
Income tax expense (benefit)
22
18
16
29
Net interest expense
1
1
10
27
Net other expense
4
1
-
3
Depreciation expense
6
8
13
19
Amortization expense
20
21
38
51
Non-cash compensation expense
8
11
15
14
Adjusted EBITDA
88
106
141
207
Deferred revenue fair value adjustment
-
-
22
6
Employee related actions
-
-
11
11
Facility closure costs
-
-
5
2
IT exit costs
-
-
3
-
Other significant transaction related
expenses
-
7
9
13
Adjusted EBITDA excluding significant
transaction related expenses
88
$
113
$
191
$
239
$ |
 MEETS THE CHALLENGE OF CHANGE
ACI
is
also
presenting
operating
free
cash
flow,
which
is
defined
as
net
cash
provided
by
operating
activities,
plus
payments
associated
with
the
cash
settlement
of
acquisition
related
options
and
significant
acquired
opening
balance
sheet
liabilities,
plus
net
after-tax
payments
associated
with
employee-related
actions
and
facility
closures,
net
after-tax
payments
associated
with
significant
transaction
related
expenses,
net
after-tax
payments
associated
with
IBM
IT
outsourcing
transition
and
termination,
and
less
capital
expenditures.
Operating
free
cash
flow
is
considered
a
non-GAAP
financial
measure
as
defined
by
SEC
Regulation
G.
We
utilize
this
non-GAAP
financial
measure,
and
believe
it
is
useful
to
investors,
as
an
indicator
of
cash
flow
available
for
debt
repayment
and
other
investing
activities,
such
as
capital
investments
and
acquisitions.
We
utilize
operating
free
cash
flow
as
a
further
indicator
of
operating
performance
and
for
planning
investing
activities.
Operating
free
cash
flow
should
be
considered
in
addition
to,
rather
than
as
a
substitute
for,
net
cash
provided
by
operating
activities.
A
limitation
of
operating
free
cash
flow
is
that
it
does
not
represent
the
total
increase
or
decrease
in
the
cash
balance
for
the
period.
This
measure
also
does
not
exclude
mandatory
debt
service
obligations
and,
therefore,
does
not
represent
the
residual
cash
flow
available
for
discretionary
expenditures.
We
believe
that
operating
free
cash
flow
is
useful
to
investors
to
provide
disclosures
of
our
operating
results
on
the
same
basis
as
that
used
by
our
management.
Non-GAAP Financial Measures
Reconciliation of Operating Free Cash Flow
(millions)
2009
2010
2011
2012
2013
Net cash provided (used) by operating
activities
44
$
81
$
83
$
(9)
$
138
$
Net after-tax payments associated with
employee-related actions
3
-
-
6
10
Net after-tax payments associated with facility
closures
-
-
-
3
1
Net after-tax payments associated with
significant transaction related expenses
-
-
4
9
18
Net after-tax payments associated with cash
settlement of acquisition related options
-
-
-
10
10
Payments associated with acquired opening
balance sheet liabilties
-
-
-
-
5
Net after-tax payments associated with IBM IT
Outsourcing Transition
1
1
1
2
Plus IBM Alliance liability repayment
-
-
-
21
-
Less capital expenditures
(10)
(13)
(19)
(17)
(33)
Less IBM Alliance technical enablement
expenditures
(7)
(6)
(2)
-
-
Operating Free Cash Flow
30
$
63
$
67
$
24
$
151
$
24 |
 MEETS THE CHALLENGE OF CHANGE
ACI
also
includes
backlog
estimates,
which
include
all
software
license
fees,
maintenance
fees
and
services
specified
in
executed
contracts,
as
well
as
revenues
from
assumed
contract
renewals
to
the
extent
that
we
believe
recognition
of
the
related
revenue
will
occur
within
the
corresponding
backlog
period.
We
have
historically
included
assumed
renewals
in
backlog
estimates
based
upon
automatic
renewal
provisions
in the executed contract and our historic experience with customer renewal rates.
Backlog
is
considered
a
non-GAAP
financial
measure
as
defined
by
SEC
Regulation
G.
Our
60-month
backlog
estimate
represents
expected
revenues from existing customers using the following key assumptions:
Estimates
of
future
financial
results
are
inherently
unreliable.
Our
backlog
estimates
require
substantial
judgment
and
are
based
on
a
number
of
assumptions
as
described
above.
These
assumptions
may
turn
out
to
be
inaccurate
or
wrong,
including
for
reasons
outside
of
management’s
control.
For
example,
our
customers
may
attempt
to
renegotiate
or
terminate
their
contracts
for
a
number
of
reasons,
including
mergers,
changes
in
their
financial
condition,
or
general
changes
in
economic
conditions
in
the
customer’s
industry
or
geographic
location,
or
we
may
experience
delays
in
the
development
or
delivery
of
products
or
services
specified
in
customer
contracts
which
may
cause
the
actual
renewal
rates
and
amounts
to
differ
from
historical
experiences.
Changes
in
foreign
currency
exchange
rates
may
also
impact
the
amount
of
revenue
actually
recognized
in
future
periods.
Accordingly,
there
can
be
no
assurance
that
contracts
included
in
backlog
estimates
will
actually
generate
the specified revenues or that the actual revenues will be generated within the
corresponding 60-month period. Backlog should be considered in addition
to, rather than as a substitute for, reported revenue and deferred revenue.
Non-GAAP Financial Measures
25
•
Maintenance
fees
are
assumed
to
exist
for
the
duration
of
the
license
term
for
those
contracts
in
which
the
committed
maintenance
term
is less than the committed license term.
•
License,
facilities
management,
and
software
hosting
arrangements
are
assumed
to
renew
at
the
end
of
their
committed
term
at
a
rate
consistent with our historical experiences.
•
Non-recurring
license
arrangements
are
assumed
to
renew
as
recurring
revenue
streams.
•
Foreign
currency
exchange
rates
are
assumed
to
remain
constant
over
the
60-month
backlog
period
for
those
contracts
stated
in
currencies other than the U.S. dollar.
•
Our
pricing
policies
and
practices
are
assumed
to
remain
constant
over
the
60-month
backlog
period. |
 MEETS THE CHALLENGE OF CHANGE
Forward-Looking Statements
All of the foregoing forward-looking statements are expressly qualified by the
risk factors discussed in our filings with the Securities and Exchange
Commission. Such factors include but are not limited to, increased competition, the performance of our strategic product, BASE24-
eps, demand for our products, restrictions and other financial covenants in our
credit facility, consolidations and failures in the financial services
industry, customer reluctance to switch to a new vendor, the accuracy of
management’s backlog estimates, the maturity of certain products, our
strategy to migrate customers to our next generation products, ratable or deferred
recognition of certain revenue associated with customer migrations and the
maturity of certain of our products, failure to obtain renewals of customer contracts or to obtain such renewals on favorable
terms, delay or cancellation of customer projects or inaccurate project completion
estimates, volatility and disruption of the capital and credit markets
and
adverse
changes
in
the
global
economy,
our
existing
levels
of
debt,
impairment
of
our
goodwill
or
intangible
assets,
litigation,
future acquisitions, strategic partnerships and investments, risks related to the
expected benefits to be achieved in the transaction with Online Resources,
OPAY and ReD, the complexity of our products and services and the risk that they may contain hidden defects or be subjected to
security breaches or viruses, compliance of our products with applicable
legislation, governmental regulations and industry standards, our compliance
with privacy regulations, the protection of our intellectual property in intellectual property litigation, the cyclical nature of our revenue
and earnings and the accuracy of forecasts due to the concentration of revenue
generating activity during the final weeks of each quarter, business
interruptions or failure of our information technology and communication systems, our offshore software development activities, risks
from operating internationally, including fluctuations in currency exchange rates,
exposure to unknown tax liabilities, and volatility in our stock
price. For a detailed discussion of these risk factors, parties
that are relying on the forward-looking statements should review our filings
with the Securities and Exchange Commission, including our most recently
filed Annual Report on Form 10-K, Registration Statement on Form S-4, and
subsequent reports on Forms 10-Q and 8-K.
26
This presentation contains forward-looking statements based on current expectations that involve a
number of risks and uncertainties. Generally, forward-looking statements do not
relate strictly to historical or current facts and may include words or phrases such as “believes,”
“ will,” “expects,” “anticipates,” “intends,” and words and
phrases of similar impact. The forward-looking statements are made pursuant to
safe harbor provisions of the Private Securities Litigation Reform Act of 1995.
Forward-looking statements in this presentation include, but are not limited to, statements
regarding:
(i) expectations regarding 2014 financial guidance, including non-GAAP revenue, adjusted EBITDA,
and net new sales bookings;
(ii) expectations regarding five year targets, including future increases in organic revenue,
adjusted EBITDA margin, operating free cash flow, and sales net of term extension.
|