Attached files
| file | filename |
|---|---|
| 8-K - CURRENT REPORT - PALL CORP | pallcorp_8kxq1fy2015.htm |
| EX-99.1 - PRESS RELEASE, DATED NOVEMBER 25, 2014 (FURNISHED PURSUANT TO ITEM 2.02) - PALL CORP | exhibit991_q1fy15.htm |

Better Lives. Better Planet.SM This presentation is the Confidential work product of Pall Corporation and no portion of this presentation may be copied, published, performed, or redistributed without the express written authority of a Pall corporate officer © 2014 Pall Corporation Q1 FY 2015 Financial Results November 25, 2014 Exhibit 99.2

2 The matters discussed in this presentation contain “forward-looking statements” as defined in the Private Securities Litigation Reform Act of 1995. Results for the first quarter of fiscal year 2015 are preliminary until our Form 10-Q is filed with the Securities and Exchange Commission on or before December 10, 2014. Forward-looking statements are those that address activities, events or developments that we intend, expect, project, believe or anticipate will or may occur in the future. All statements regarding future performance, earnings projections, earnings guidance, management’s expectations about our future cash needs and effective tax rate, and other future events or developments are forward-looking statements. Forward-looking statements are those that use terms such as “may,” “will,” “expect,” “believe,” “intend,” “should,” “could,” “anticipate,” “estimate,” “forecast,” “project,” “plan,” “predict,” “potential,” and similar expressions. Forward-looking statements contained in this and other written and oral reports are based on management’s assumptions and assessments in light of past experience and trends, current conditions, expected future developments and other relevant factors. Our forward-looking statements are subject to risks and uncertainties and are not guarantees of future performance, and actual results, developments and business decisions may differ materially from those envisaged by our forward-looking statements. Such risks and uncertainties include, but are not limited to, those discussed in Part I-Item 1A.-Risk Factors in the 2014 Form 10-K, and other reports we file with the Securities and Exchange Commission, including: the impact of disruptions in the supply of raw materials and key components for our products from suppliers, including limited or single source suppliers; the impact of terrorist acts, conflicts and wars or natural disasters; the extent to which special U.S. and foreign government laws and regulations, such as the Foreign Corrupt Practices Act and the U.K. Bribery Act, and regulations and procurement policies and practices, including regulations on import-export control, may expose us to liability or impair our ability to compete in international markets; the impact of a significant disruption in, or breach in security of, our information technology systems or we fail to implement, manage or integrate new systems, software and technologies successfully; the impact of economic, political, social and regulatory instability in emerging markets, and other risks characteristic of doing business in emerging markets; fluctuations in foreign currency exchange rates and interest rates; our ability to successfully complete or integrate acquisitions; product defects and unanticipated use or inadequate disclosure with respect to our products; our ability to develop innovative and competitive new products; the impact of global and regional economic conditions and legislative and political developments; our ability to comply with a broad array of regulatory requirements; the loss of one or more members of our senior management team and our ability to recruit and retain qualified management personnel; changes in the demand for our products and business relationships with key customers and suppliers; changes in product mix and product pricing, particularly with systems products and associated hardware and devices for our consumable filtration products; our ability to deliver our backlog on time; increases in manufacturing and operating costs and/or our ability to achieve the savings anticipated from our structural cost improvement initiative; the impact of environmental, health and safety laws and regulations, and violations; our ability to enforce patents or protect proprietary products and manufacturing techniques; costs and outcomes of pending or future litigation and the availability of insurance or indemnification rights; changes in our effective tax rate; the impact of certain risks associated with potential labor disruptions; our ability to compete effectively in domestic and global markets; and the effect of the restrictive covenants in our debt facilities. Factors or events that could cause our actual results to differ may emerge from time to time, and it is not possible for us to predict all of them. We make these statements as of the date of this disclosure and undertake no obligation to update them, whether as a result of new information, future developments or otherwise. Management uses certain non-GAAP measurements to assess the Company’s current and future financial performance. The non-GAAP measurements do not replace the presentation of the Company’s GAAP financial results. These measurements provide supplemental information to assist management in analyzing the Company’s financial position and results of operations. The Company has chosen to provide this information to facilitate meaningful comparisons of past, present and future operating results and as a means to emphasize the results of ongoing operations. Reconciliations of the non-GAAP financial measures used throughout this presentation to the most directly comparable GAAP measures appear at the end of this presentation in the Appendix and are also available on Pall’s website at www.pall.com/investor. Forward-Looking Statements

3 Conference Call Information Dial-In: Toll-Free 855.356.7268 International 706.634.1981 Replay: Toll-Free 855.859.2056 International 404.537.3406 Conference ID: 29298729 Internet: www.pall.com/investor Pall’s Stax™ Depth Filter System, scalable modules for pre-filtration and clarification in lab, pilot and process scale biopharmaceutical applications

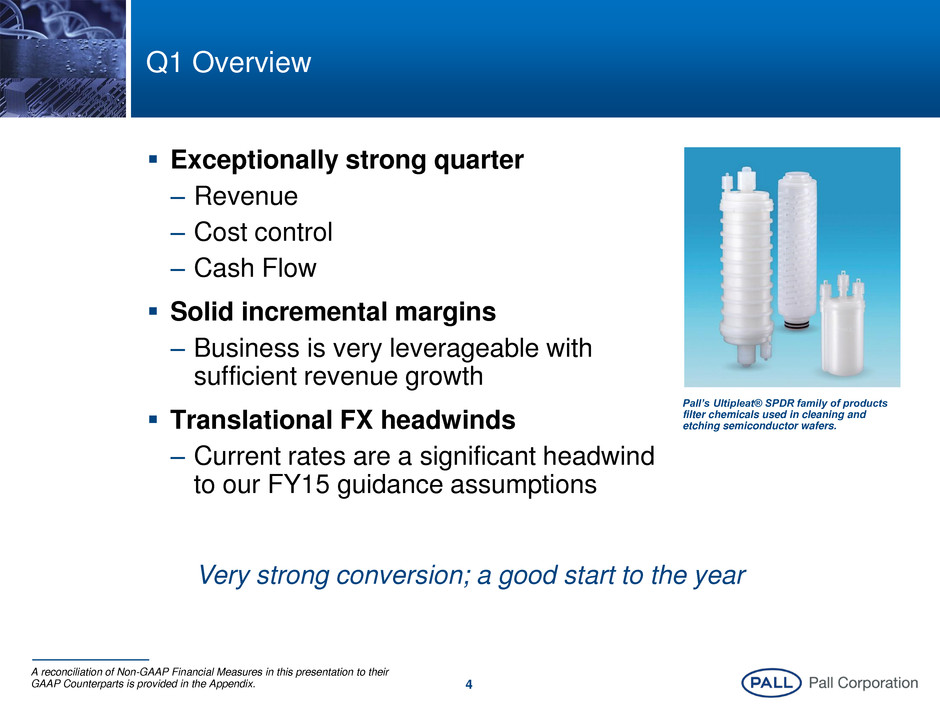
4 Q1 Overview Exceptionally strong quarter – Revenue – Cost control – Cash Flow Solid incremental margins – Business is very leverageable with sufficient revenue growth Translational FX headwinds – Current rates are a significant headwind to our FY15 guidance assumptions Very strong conversion; a good start to the year A reconciliation of Non-GAAP Financial Measures in this presentation to their GAAP Counterparts is provided in the Appendix. Pall’s Ultipleat® SPDR family of products filter chemicals used in cleaning and etching semiconductor wafers.

5 $630 $696 $- $200 $400 $600 $800 Revenue % Growth Excluding FX FY 2014 FY 2015 Q1 Financial Summary Dollars in millions, except EPS data A reconciliation of Non-GAAP Financial Measures in this presentation to their GAAP Counterparts is provided in the Appendix. 17.1% 19.2% 10.0% 15.0% 20.0% Operating Profit Margin FY 2014 FY 2015 Pro forma EPS Bridge $0.70 $0.89 $0.30 $0.60 $0.90 Pro forma EPS % Growth FY 2014 FY 2015 +27% +13% +210 bps Q1 FY2014 0.70$ EBIT 0.23 Sharecount 0.03 Tax Rate (0.02) Translational FX (0.05) Q1 FY2015 0.89$

6 Life Sciences Consumables $323 +12% Industrial Consumables $282 +13% Industrial Systems $62 +16% Life Sciences Systems $29 +28% 41% 46% 9% 4% Q1 Sales by Segment Dollars in millions Percentages outside pie charts and in box represent sales change excluding FX Percentages inside pie charts represent percent of total sales A reconciliation of Non-GAAP Financial Measures in this presentation to their GAAP Counterparts is provided in the Appendix Life Sciences: $352 (+14%) Industrial: 344 (+13%) Total Sales: $696 (+13%)

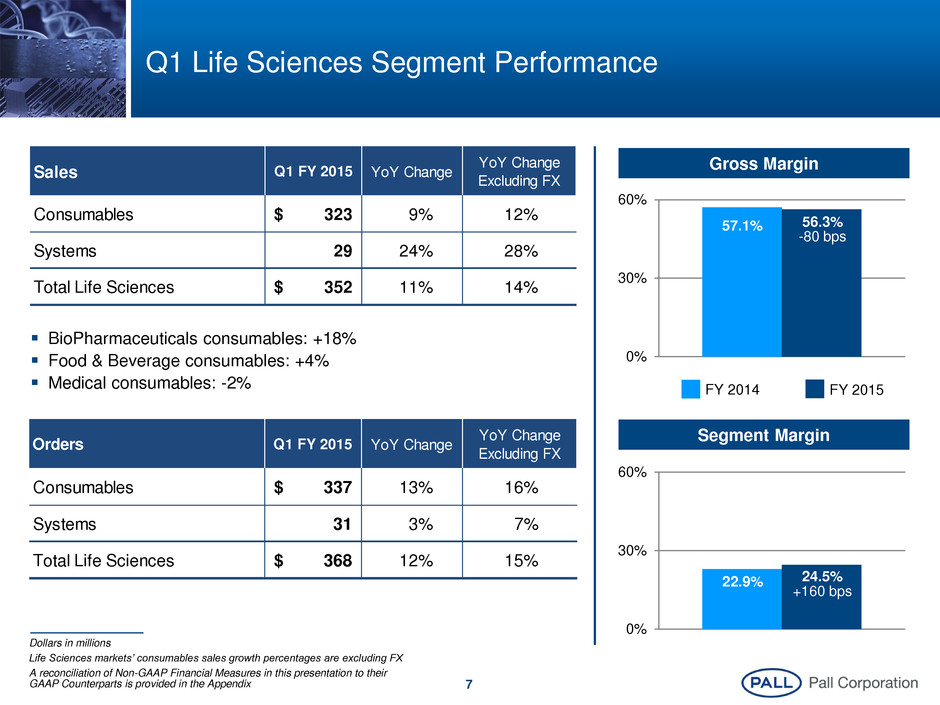
7 Q1 Life Sciences Segment Performance Dollars in millions Life Sciences markets’ consumables sales growth percentages are excluding FX A reconciliation of Non-GAAP Financial Measures in this presentation to their GAAP Counterparts is provided in the Appendix 0% 30% 60% 56.3% -80 bps 57.1% 0% 30% 60% 24.5% +160 bps 22.9% FY 2014 FY 2015 Gross Margin Segment Margin BioPharmaceuticals consumables: +18% Food & Beverage consumables: +4% Medical consumables: -2% Sales Q1 FY 2015 YoY Change YoY Change Excluding FX Consumables 323$ 9% 12% Systems 29 24% 28% Total Life Sciences 352$ 11% 14% Orders Q1 FY 2015 YoY Change YoY Change Excluding FX Consumables 337$ 13% 16% Systems 31 3% 7% Total Life Sciences 368$ 12% 15%

8 Q1 Industrial Segment Performance Gross Margin Segment Margin Process Technologies consumables: +19% Aerospace consumables: +6% Microelectronics consumables: +8% 0% 30% 60% 47.3% +110 bps 46.2% 0% 30% 60% 18.7% +250 bps 16.2% FY 2014 FY 2015 Sales Q1 FY 2015 YoY Change YoY Change Excluding FX Consumables 282$ 10% 13% Systems 62 12% 16% Total Industrial 344$ 11% 13% Orders Q1 FY 2015 YoY Change YoY Change Excluding FX Consumables 276$ 4% 6% Systems 45 3% 8% Total Industrial 321$ 4% 7% Dollars in millions Industrial markets’ consumables sales growth percentages are excluding FX A reconciliation of Non-GAAP Financial Measures in this presentation to their GAAP Counterparts is provided in the Appendix

9 Cash Flow and Working Capital(1) Operating Cash Flow 115$ 86$ CapEx (10) (19) Free Cash Flow 104$ 67$ Other Significant Sources/(Uses) of Cash: Dividends (30) (28) Notes Payable 300 90 Share Repurchase (300) (125) YTD FY15 YTD FY14 Dollars in millions (1) Figures include the impact of rounding Net debt of $182mm as of October 31, 2014

10 Media Technology Enhances Our Position “Taking share while building the moat” Ultimate Barriers Competition Pall Position Product Channel Applications Regulatory Novel Filter Formats/ IP Media IP Excellence in Supply

11 1.50 1.55 1.60 1.65 1.70 1.75 Aug-13 Oct-13 Jan-14 Apr-14 Jul-14 GBP / USD FX Update Recent FX Trends FY14 Revenue by Currency Source: Bloomberg, as of 11/21/2014 Dollars in millions Revenue by functional currency $798 $797 $218 $177 $173 $626 Other 22% RMB 6% GBP 6% JPY 8% USD 29% EUR 29% FY15 FY14 1.20 1.30 1.40 1.50 Aug-13 Oct-13 Jan-14 Apr-14 Jul-14 EUR / USD 1.244 CURR PLAN 1.35 1.57 95 105 115 125 Aug-13 Oct-13 Jan-14 Apr-14 Jul-14 118.3 USD / JPY CURR PLAN 102 Unfavorable Favorable 1.24 CURR PLAN 1.69 18

12 FY 2015 Revised Outlook Previous (8/28/14) Updated (11/25/14) Pall Revenue Growth: Total: Organic ex-Fx: Mid-to-high single-digit Low-to-mid single-digit Low to mid single-digit Mid single-digit Segment Revenue Growth: Life Sciences ex-Fx: Industrial ex-Fx: Mid-to-high single-digit Mid-to-high single-digit High single-digit No change Pro Forma EPS: $3.75 – $3.95 No change FX Rates Assumed: Euro/USD: 1.35 Euro/GBP: 0.80 USD/Yen: 102 Euro/USD: 1.25(1) Euro/GBP: 0.79(1) USD/Yen: 117(1) We’ve adjusted our outlook to match the current foreign exchange landscape (1) Rates assumed for the balance of the fiscal year for guidance

Better Lives. Better Planet.SM This presentation is the Confidential work product of Pall Corporation and no portion of this presentation may be copied, published, performed, or redistributed without the express written authority of a Pall corporate officer © 2014 Pall Corporation Appendix

14 Appendix: Q1 Earnings and FY 2015 Estimates Reconciliation of Non-GAAP Financial Measures Diluted EPS as reported 0.81$ 0.63$ 3.77$ Discrete Items: ROTC after pro forma tax effect 0.08 0.07 0.08 Total discrete items 0.08 0.07 0.08 Pro forma diluted EPS 0.89$ 0.70$ 3.85$ FY 2015 (Estimates at Midpoint) Q1 FY15 Q1 FY14

15 Appendix: Q1 Sales By Market & Technology Reconciliation of Non-GAAP Financial Measures Q1 FY15 Q1 FY15 Estimated Impact of FX Q1 FY15 Estimate Excluding FX Q1 FY14 % Change Excluding FX Life Sciences Consumables Sales: BioPharmaceuticals 226,605$ (5,625)$ 232,230$ 196,118$ 18.4% Food & Beverage 43,168 (2,109) 45,277 43,569 3.9% Medical 53,446 (1,225) 54,671 55,717 -1.9% Consumables Total 323,219$ (8,959)$ 332,178$ 295,404$ 12.4% Systems Sales 29,245$ (798)$ 30,043$ 23,542$ 27.6% Total Life Sciences 352,464$ (9,757)$ 362,221$ 318,946$ 13.6% Industrial Consumables Sales: Process Technologies 144,926$ (3,885)$ 148,811$ 125,078$ 19.0% Aerospace 61,811 (334) 62,145 58,771 5.7% Microelectronics 75,166 (1,715) 76,881 71,416 7.7% Consumables Total 281,903$ (5,934)$ 287,837$ 255,265$ 12.8% Systems Sales 62,125$ (2,284)$ 64,409$ 55,568$ 15.9% Total Industrial 344,028$ (8,218)$ 352,246$ 310,833$ 13.3% Total Pall 696,492$ (17,975)$ 714,467$ $ 629,779 13.4% Dollars in thousands

16 Appendix: Q1 Orders by Segment Reconciliation of Non-GAAP Financial Measures Dollars in thousands Q1 FY15 Q1 FY15 Estimated Impact of FX Q1 FY15 Estimate Excluding FX Q1 FY14 % Change Excluding FX Life Sciences Orders: Consumables 337,471$ (9,499)$ 346,970$ 299,140$ 16.0% Systems 30,869 (1,240) 32,109 29,995 7.0% Life Sciences Total 368,340$ (10,739)$ 379,079$ 329,135$ 15.2% Industrial Orders: Consumables 276,022$ (5,299)$ 281,321$ 264,664$ 6.3% Systems 45,262 (2,208) 47,470 43,911 8.1% Industrial Total 321,284$ (7,507)$ 328,791$ 308,575$ 6.6% Total Pall 689,623$ (18,247)$ 707,870$ 637,710$ 11.0%

17 Appendix: Q1 Organic Sales Growth by Segment Reconciliation of Non-GAAP Financial Measures Q1 FY15 Q1 FY14 Percent Change Q1 FY15 Impact of FX % Change Excluding FX Life Sciences Sales: Organic 339,322$ 318,946$ 6.4% (9,757)$ 9.4% Acquisitions 13,142 - - Total Life Sciences Sales 352,464$ 318,946$ 10.5% (9,757)$ 13.6% Industrial : Organic 327,139$ 310,833$ 5.2% (8,218)$ 7.9% Acquisitions 16,889 - - Total Industrial Sales 344,028$ 310,833$ 10.7% (8,218)$ 13.3% Total Pall : Orga ic 666,461$ 629,779$ 5.8% (17,975)$ 8.7% Acquisitions 30,031 - - Total Pall Sales 696,492$ 629,779$ 10.6% (17,975)$ 13.4% Dollars in thousands

18 Appendix: Q1 Operating Profit Reconciliation of Non-GAAP Financial Measures Operating Profit Q1 FY15 Q1 FY14 Life Sciences segment profit 86,480$ 73,045$ Industrial segment profit 64,232 50,482 Total segment profit 150,712$ 123,527$ General corporate expenses (16,737) (15,964) Operating profit 133,975$ 107,563$ % of Sales 19.2% 17.1% ROTC 9,240 9,198 Interest expense, net 6,702 5,977 Earnings before income taxes 118,033$ 92,388$ Dollars in thousands
