Attached files
| file | filename |
|---|---|
| 8-K - 8-K - LOCAL Corp | d827232d8k.htm |
 Exhibit 99.1 |
 2
Corporate
Overview
–
Q4
2014
Certain matters being discussed by Local Corporation’s management today include
forward looking statements which are made pursuant to the Safe Harbor provisions
of section 21-E of the Securities Exchange Act of 1934. Investors are cautioned that
statements which are not strictly historical statements, including statements
concerning future expected financial performance, management objectives and
plans for future operations, our relationships with strategic or other partners, the
release of new
products or services or enhancements to existing products or
services, our expectations regarding potential acquisitions and the future
performance of past acquisitions including our ability to realize expected synergies,
trends in the market for our current or planned products or services, and market
acceptance of our products or services, constitute forward looking statements. The
forward looking statements include, but are not limited to, any statements containing the words
“expect”, “anticipate”, “estimates”, “believes”, “should”, “could”
“may”, “possibly”, and similar expressions and the negatives thereof. These
forward looking statements involve a number of risks and uncertainties that could cause
actual results to differ materially from the forward looking statements. Those risks
and uncertainties are detailed in the company’s filings from time to time with the
Securities and Exchange Commission. The information contained in the forward
looking statements is provided as of the date of such oral statements and the
company disclaims any obligation to update such statements.
Adjusted EBITDA is defined as net income (loss) excluding: provision for income
taxes; interest and other income (expense), net; depreciation; amortization; stock-
based compensation charges; gain or loss on derivatives’ revaluation; net income
(loss) from discontinued operations; LEC receivables reserve; finance-related
charges; accrued lease liability/asset; severance charges; and an expense related
to a settlement accrual.
Adjusted EBITDA, as defined above, is not a measurement under GAAP. Adjusted
EBITDA is reconciled to net loss and loss per share, which we believe are the most
comparable GAAP measures, at the end of this presentation. Management believes
that Adjusted EBITDA provides useful information to investors about the company’s
performance because it eliminates the effects of period-to-period changes in
income from interest on the company’s cash and marketable securities, expense
from the company’s financing transactions and the costs associated with income
tax expense, capital investments, stock-based compensation expense, warrant
revaluation charges, and non-recurring charges which are not directly attributable to
the underlying performance of the company’s business operations. Management
uses Adjusted EBITDA in evaluating the overall performance of the company’s
business operations. A
limitation of non-GAAP Adjusted EBITDA is that it excludes items that often have a
material effect on the company’s net income and earnings per common share calculated in
accordance with GAAP. Therefore, management compensates for this limitation by using Adjusted
EBITDA in conjunction with GAAP net loss and loss per share measures. The company believes
that Adjusted EBITDA provides investors with an additional tool for evaluating the
company’s core performance, which management uses in its own evaluation of overall
performance, and as a base-line for assessing the future earnings potential of the
company. While the GAAP results are more complete, the company prefers to allow investors to
have this supplemental metric since, with reconciliation to GAAP (as noted above), it may
provide greater insight into the company’s financial results. The non-GAAP
measures should be viewed as a supplement to, and not as a substitute for, or
superior to, GAAP net income or earnings per share.
|
 3
Our strategy
Corporate
Overview
–
Q4
2014
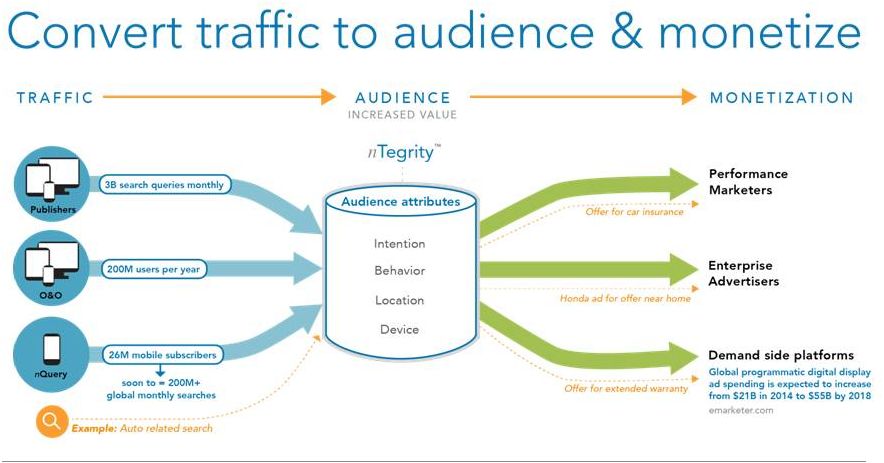
Reach
3B impressions
per month
Audience
226M consumers
Intent
Locally-focused
consumer search
Technology
Patented content &
localization engine
To aggregate and curate the most relevant
local content
for consumers and present it wherever and
however the consumer searches
for information while providing significant reach and value to our
advertisers and partners. |
 •
Local Audience Network
•
Hosted Mobile Search
•
O&O Properties
•
Network
4
•
Mobile is the fastest growing
segment
of
search
&
mobile
local
ad revenues are projected to grow
>3X in 5 yr. to $15.7B in 2018*
•
Global
programmatic
digital
display ad spending is expected to
increase from $21B in 2014 to
$55B by 2018**
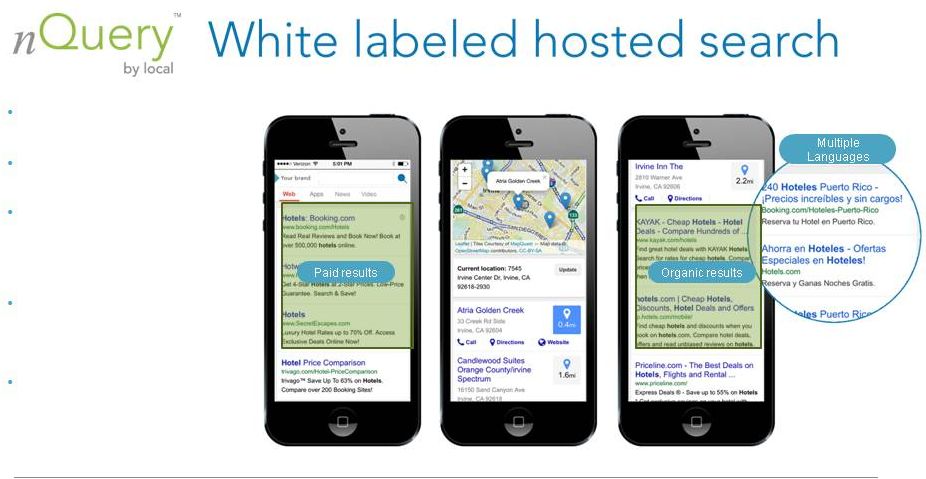
•
nQuery
™
–
hosted
local
search
opens up new enterprise
channels and markets
•
nTegrity
™
–
will
detect,
analyze
and
decide
the
best
delivery
of
content and ads
•
IP
–
Licensing
and
strategic
opportunities
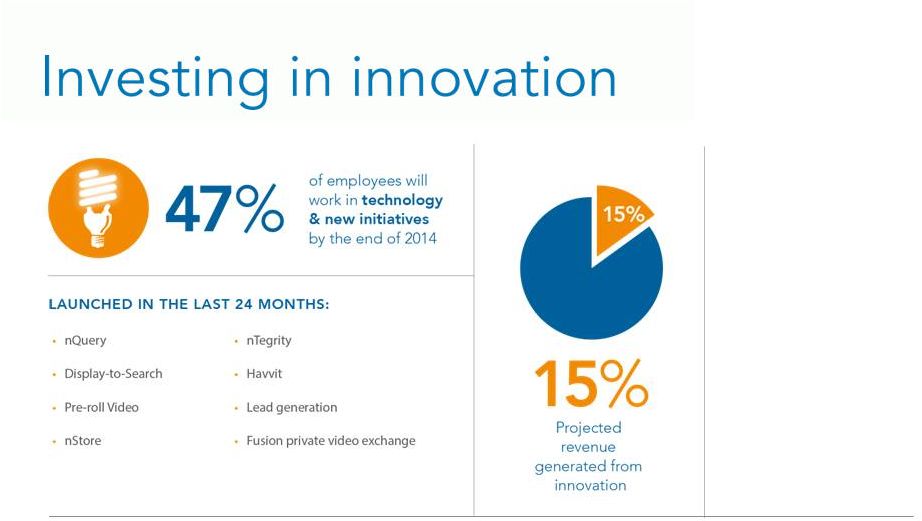
•
Reduced debt by $4.5M
million during Q3
•
Took cost savings actions
during Q4 with expected
$2.6M
in annual savings
•
7 consecutive quarters
of positive adjusted EBITDA
growth
*BIA/Kelsey 2014
** emarketer.com
Corporate
Overview
–
Q4
2014
Market
opportunity is
growing
Diversified
revenue
streams
Innovation yields
competitive
advantages
Improving
financial
outlook |
 5
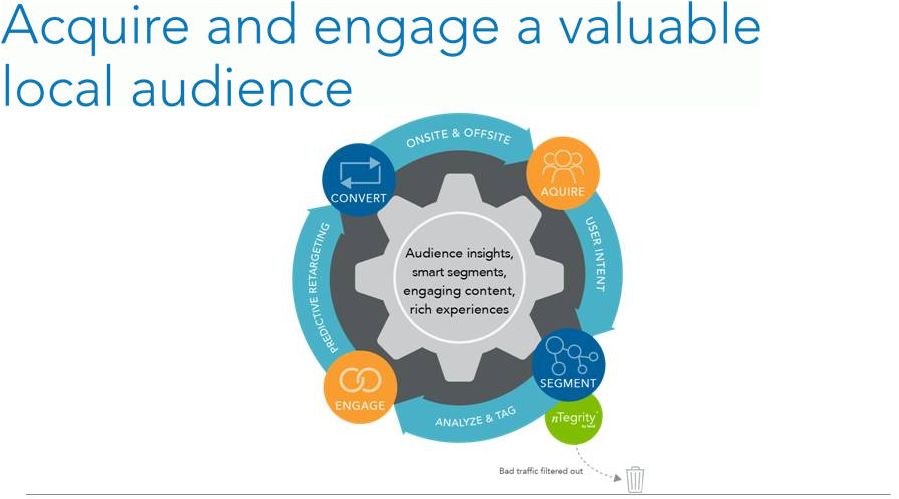
Given nPression Score
Visibility •
Authenticity •
Validity
226M high intent, local consumers annually
•
Desktop
•
Mobile
•
Apps
•
Carriers
•
WiFi
TM
Corporate
Overview
–
Q4
2014
•
Display
•
Video
•
Mobile
•
Search
•
Local.com
•
nQuery
•
nPress
•
Publisher Partner network |
 6
An advanced technology that filters and scores
traffic based on a multitude of data, and in the
future will detect, analyze and decide the most
successful delivery of content and ads
Quality traffic based on:
nTegrity
Corporate
Overview
–
Q4
2014
Paid Search feed
served to qualified
audience |
 7
Corporate
Overview
–
Q4
2014 |
 8
Corporate
Overview
–
Q4
2014
1
2
3
Putting advertisers in front of a premium, high-intent local audience
Reaching valuable mobile consumers through search in North and
South America.
Quickly connect with the most receptive consumers though our
programmatic solution
Single
platform
to
reach
consumers
across
Local.com,
nPress, nQuery,
and publisher partner network
Integrate
organic
content
and
search
ads
into
our
mobile
search
platform
Providing
valuable
insights
through
our
local
audience
network |
 9
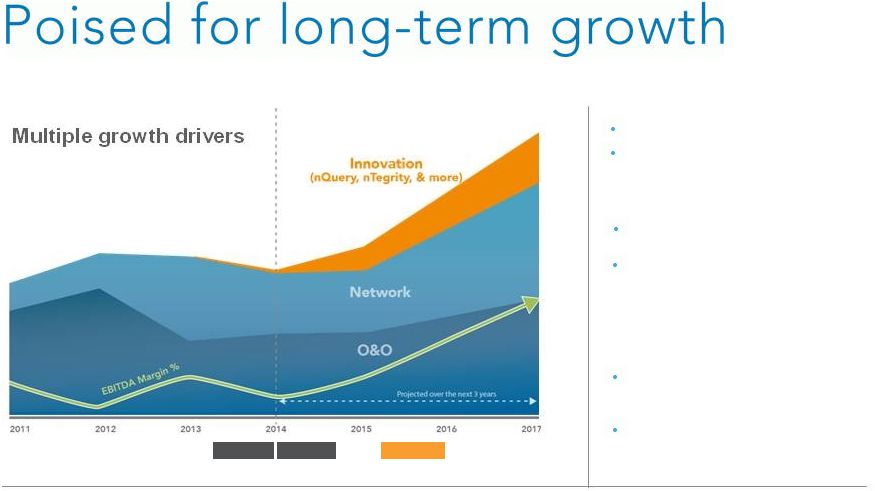
*Estimate
Note: See reconciliation of Adjusted EBITDA to GAAP net income at presentation
end Stabilize
Execute
GROW
Focusing on key initiatives
Expect expanding EBITDA
margin*
Scaling business
*Based on forecast from 2014 to 2017
Corporate
Overview
–
Q4
2014
Monetizing local audience and
growing mobile search
Realigned organization
Driving growth without significant
incremental cost
Leveraging existing technology
platform, core development team and
corporate infrastructure
Expect $2.6M in annual cost savings
and improved Adjusted EBITDA
profitability
Increasing revenue on more profitable
business lines |
 Local Labs serves as a
digital technology lab and
incubator focused on
innovating the digital
ecosystem that converges
around the digital
consumer.
Local Labs
Business Model Target
10
Corporate
Overview
–
Q4
2014 |
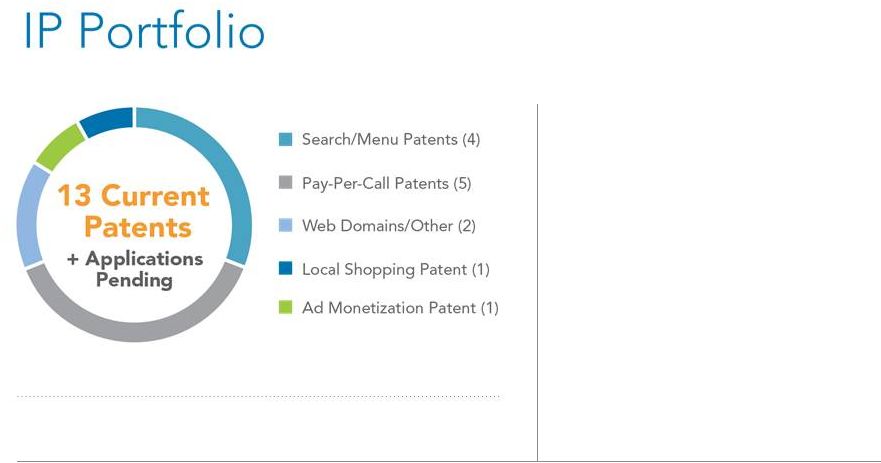 11
The patent descriptions herein do not constitute the legal opinion or advice of the
patent owner or their counsel. The reader is encouraged to seek the advice
of their own counsel regarding the scope
of any domestic or foreign patents.
Settlement reached
In September, the lawsuit against Fry's
Electronics regarding the infringement of Local's
U.S. patent 7062453, (‘453’) patent, which covers
messaging systems for dynamic networked
commerce architecture, was settled to the mutual
satisfaction of the parties and Fry's Electronics
agreed to license the patent.
Continuing our efforts
to enforce our intellectual property rights.
We believe we have the opportunity
for
strong monetization of our
proven patents.
Corporate
Overview
–
Q4
2014 |
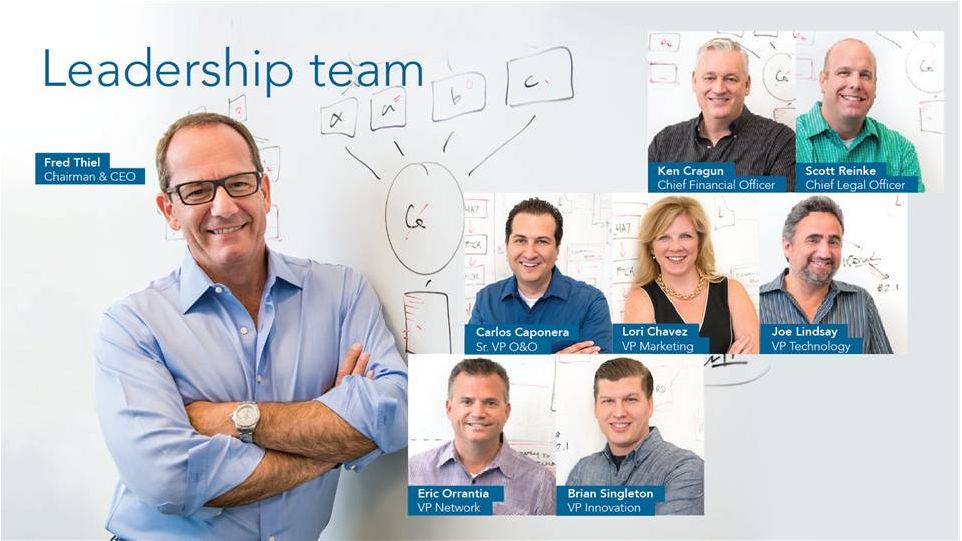 |
 13
Fred Thiel
Chairman of the Board & Chief Executive Officer
John M. Payne
Director
David M. Hughes
Director
Norman K. Farra, Jr.
Lead Director
Corporate
Overview
–
Q4
2014
Director since January 2013, chairman since May 2014
25+ years leading technology, data communications, Internet, Big
Data, digital media and software companies
Formerly CEO at GameSpy Industries and Lantronix (LTRX) and
executive at Triton Pacific Capital Partners, TechStarter Ventures
and Graham Partners
•
Director since August 2005
•
20+ years of strategic leadership experience and investment
banking
•
Aegis Capital, Corp., R.F. Lafferty & Co. Inc., Cresta Capital
Strategies, LLC, GunnAllen Financial Inc.
Director since June 2014
15+ years of executive leadership experience with specialties in
global digital marketing, SEO and SEM
CEO of The Search Agency, a global digital marketing company
United Online, Inc., Boston Consulting Group, Mercer Management
Consulting
Serving on boards of Spark Networks (NYSE: LOV), YPOLA & The
Huron University College Foundation USA
Director since August 2005 and lead independent director from
December 2005 to October 2011
30+ years of strategic leadership experience
Adjunct professor of marketing and strategy for the Executive MBA
Program at Pepperdine University, since 1998 and the University of
San Diego, since 2010
Serving currently as director of Lantronix, Inc. and was previously
director of ADC Telecommunication, Inc. and Primal Solutions, Inc.
John E. Rehfeld
Director
Director since June 2014
30+ years of experience leading public and private companies
specializing
in
early
stage
software
and
technology
companies
as
well
as significant IP licensing strategies
CEO of SimpleAir, Inc., an inventor-owned technology licensing
company with mobile interests and intellectual property assets
Stamps.com (NASDAQ: STMP), Day Software (SWX: DAYN), CEO of
10+ digital technology and enterprise security companies
Serving as MD Outset Ventures and as an advisory board member for
Digital Offering LLC. |
 14
Q3 Highlights
Financials
Innovation
Corporate
Overview
–
Q4
2014
Total revenue of $18.1M,
O&O revenue up 31% y-o-y
Adjusted EBITDA $407K
Cash from operating activities of $3.0M
Reduced debt by $4.5M
RKV of $201, up from $180 in Q313
$4.3M in total cash and $4.3M in debt
as of Sept. 30
th
Announced annual cost savings actions of
approximately $2.6M
Updated 2014 guidance:
Revenue
$87M
-
$90M
Adjusted
EBITDA
$2.0M
-
$2.4M
Expanding reach with the expected
launch of nQuery
TM
solution with a top
five global carrier
Launched our advanced traffic quality
solution nTegrity
TM
Building and monetizing our Local
audience with proprietary traffic quality
tools
Note: Since we cannot predict the valuation of the warrant liability and the conversion
option liability, we cannot reasonably project our GAAP net income (loss). We,
therefore, cannot provide GAAP guidance, but we do report GAAP results. An explanation of the Company’s use of Non-GAAP measures is set forth on Slide 12 |
 Fred
Thiel Chairman & CEO
fred@local.com
Local
Corporation
|
7555
Irvine
Center
Drive
|
Irvine
CA
92618
|
949.784.0800
|
www.localcorporation.com
Ken Cragun
CFO
kcragun@local.com
15
Corporate
Overview
–
Q4
2014 |
 16
Corporate
Overview
–
Q4
2014 |
 17
•
Rich, relevant local content
•
500M annual searches
•
Growing mobile segments in local jobs,
coupons and apartment rentals
•
Most popular segments
>
Home services
>
Medical
>
Legal
>
Restaurant
Corporate
Overview
–
Q4
2014
•
Advertiser partner CTR >40% |
 18
Corporate
Overview
–
Q4
2014
>
Chinese
>
Portuguese
>
Spanish
>
English
Several languages:
Biz Dev conversations open
with several global carriers
& MVNOs
Launching top 5 mobile
carrier in South America
~200M+ searches per
month
10M US smartphone
searches per month
26M mobile
subscribers activated |
 19
•
Rich, relevant local content
•
100% organic audience
•
Traffic across all 50 states
•
50% mobile traffic and growing
•
Categories & performance similar
to Local.com
Featured partners include:
+ hundreds more
Corporate
Overview
–
Q4
2014 |
 •
Hundreds of
publisher partner
sites
•
25M search queries
per day*
•
Traffic scored
through
nTegrity
TM
to
ensure it is a valid
impression
20
*As of November 2014
Corporate
Overview
–
Q4
2014 |
 21
Corporate
Overview
–
Q4
2014 |
 22
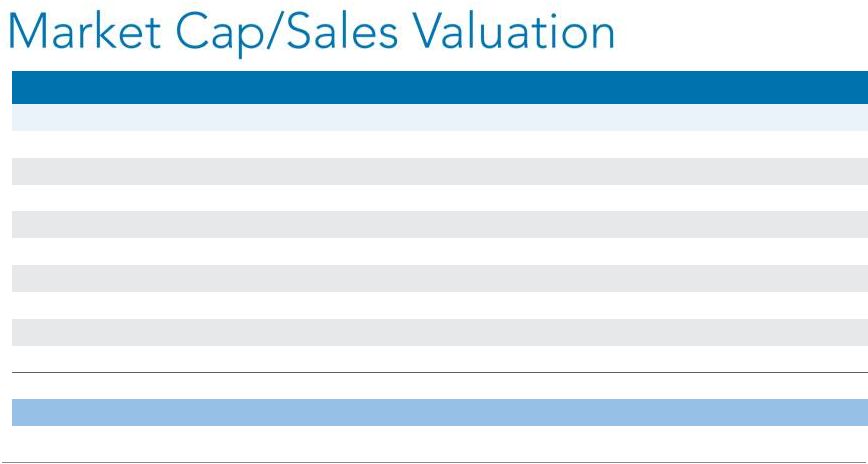
*Estimate
Company
Symbol
Price
Market Cap
(in millions)
2014E Sales
(in millions)
Market Cap/Sales
Blucora, Inc.
BCOR
$ 14.23
$ 570.7
$ 575.0
1.0
The Rubicon Project, Inc.
RUBI
$ 13.04
$ 451.4
$ 123.0
3.7
Angie's List, Inc.
ANGI
$ 5.96
$ 338.8
$ 314.0
1.1
Marchex, Inc.
MCHX
$ 3.58
$ 151.8
$ 177.0
0.9
Autobytel Inc.
ABTL
$ 10.74
$ 99.3
$ 106.0
0.9
Yelp, Inc.
YELP
$ 58.00
$ 4,183.0
$ 376.0
11.1
Travelzoo Inc.
TZOO
$ 12.72
$ 186.7
$ 145.0
1.3
XOXO Group Inc.
XOXO
$ 13.98
$ 354.6
$ 141.0
2.5
Demand Media
DMD
$ 5.68
$ 106.9
$ 168.0
0.6
Rocket Fuel Inc.
FUEL
$ 17.78
$ 726.3
$ 416.0
1.7
Average
2.5
Local Corporation
LOCM
$ 1.40
$ 32.0
$ 88.5
0.4
Corporate
Overview
–
Q4
2014 |
 23
Corporate
Overview
–
Q4
2014
This document includes the non-GAAP financial measure of “Adjusted EBITDA” which
we define as net income (loss) excluding: provision for income taxes; interest and
other income (expense), net; depreciation; amortization; stock based compensation
charges; gain or loss on derivatives’ revaluation, net income (loss) from discontinued
operations; gain on sale of Rovion; impairment charges; LEC receivables reserve;
finance related charges; accrued lease liability/asset; and severance charges.
Adjusted EBITDA, as defined above, is not a measurement under GAAP. Adjusted
EBITDA is reconciled to net income (loss) which we believe is the most comparable
GAAP measure. A reconciliation of net income (loss) to Adjusted EBITDA is set forth
within this presentation.
Management believes that Adjusted EBITDA provides useful information to investors
about the company’s performance because it eliminates the effects of period-to-period
changes in income from interest on the company’s cash and marketable securities,
expense from the company’s financing transactions and the costs associated with
income tax expense, capital investments, stock-based compensation expense, LEC
receivables reserve, warrant revaluation charges; finance related charges; accrued
lease liability; and severance charges which are not directly attributable to the
underlying performance of the company’s business operations. Management uses
Adjusted EBITDA in evaluating the overall performance of the company’s business
operations.
A limitation of non-GAAP Adjusted EBITDA is that it excludes items that often have
a material effect on the company’s net income and earnings per common share
calculated in accordance with GAAP. Therefore, management compensates for this
limitation by using Adjusted EBITDA in conjunction with net income (loss) and net
income (loss) per share measures. The company believes that Adjusted EBITDA
provides investors with an additional tool for evaluating the company’s core
performance, which management uses in its own evaluation of overall performance,
and as a base-line for assessing the future earnings potential of the company.
While the GAAP results are more complete, the company prefers to allow investors
to have this supplemental metric since, with reconciliation to GAAP; it may provide
greater insight into the company’s financial results. The non-GAAP measures
should be viewed as a supplement to, and not as a substitute for, or superior to,
GAAP net income (loss) or earnings (loss) per share.
|
 24
Description
FY-09
FY-10
FY-11
FY-12
FY-13
FY-14*
Adjusted EBITDA
$3,041
$13,775
$3,247
$777
$4,533
$2,200
Less interest and other income (expense), net
(27)
(275)
(413)
(425)
(2,321)
(2,100)
Less provision for income taxes
(158)
(102)
(178)
(111)
(139)
(100)
Less amortization of intangibles
(2,524)
(5,734)
(4,864)
(3,611)
(912)
(700)
Less depreciation
(734)
(1,418)
(3,182)
(3,658)
(3,896)
(4,000)
Less stock-based compensation
(2,364)
(2,911)
(3,442)
(2,533)
(1,619)
(800)
Less LEC receivable reserve
-
-
-
(1,407)
(1,721)
-
Less net loss from discontinued operations
-
-
(6,899)
(14,250)
(3,740)
-
Plus gain on sale of Rovion
-
-
-
1,458
-
-
Plus revaluation of warrants
(2,981)
887
2,633
202
1,100
-
Less Geo-Tag settlement
-
-
-
-
(550)
-
Less non-recurring charges
(520)
-
(1,461)
(684)
(1,108)
(1,800)
GAAP Net income (loss)
$(6,267)
$4,222
$(14,559)
$(24,242)
$(10,373)
$(7,300)
Note: Since we cannot predict the valuation of the warrant liability and the
conversion option liability, we cannot reasonably project our GAAP net income (loss).
*Midline of current guidance
Corporate
Overview
–
Q4
2014
We, therefore, cannot provide GAAP guidance, but we do report GAAP results. An
explanation of the Company’s use of Non-GAAP measures is set forth on Slide 12 |
 25
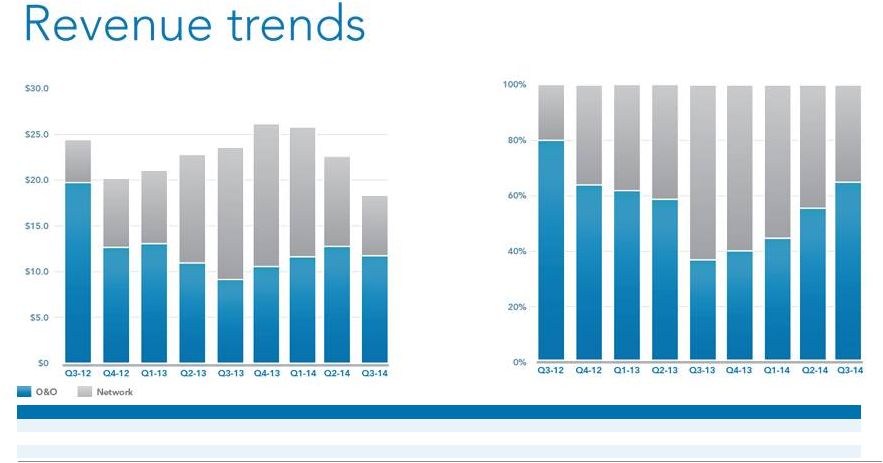
$ in Millions
Q3-12
Q4-12
Q1-13
Q2-13
Q3-13
Q4-13
Q1-14
Q2-14
Q3-14
Network
$ 5.0
$ 7.6
$ 8.3
$ 11.6
$ 14.5
$ 16.1
$ 14.8
$ 9.9
$ 6.4
O&O
$ 19.4
$ 12.9
$ 13.2
$ 11.1
$ 8.9
$ 10.7
$ 11.4
$ 12.6
$ 11.7
Consolidated Revenue
$ 24.4
$ 20.6
$ 21.5
$ 22.7
$ 23.5
$ 26.8
$ 26.2
$ 22.5
$ 18.1
Corporate
Overview
–
Q4
2014
% of Total Revenue by Business Unit
Quarterly Revenues by Business Unit
20%
80%
37%
63%
39%
61%
51%
49%
$5.0
$19.4
$7.6
$12.9
$8.3
$13.2
$11.6
$11.1
$14.5
$8.9
62%
38%
60%
40%
$16.1
$10.7
$24.4
$20.6
$21.5
$22.7
$23.5
$26.8
$14.8
$11.4
$26.2
56%
44%
$22.5
$9.9
$12.6
44%
56%
$18.1
$6.4
$11.7
36%
64% |