Attached files
| file | filename |
|---|---|
| EXCEL - IDEA: XBRL DOCUMENT - Ceres, Inc. | Financial_Report.xls |
| EX-31.2 - EXHIBIT 31.2 - Ceres, Inc. | v392377_ex31-2.htm |
| EX-21.1 - EXHIBIT 21.1 - Ceres, Inc. | v392377_ex21-1.htm |
| EX-23.1 - EXHIBIT 23.1 - Ceres, Inc. | v392377_ex23-1.htm |
| EX-31.1 - EXHIBIT 31.1 - Ceres, Inc. | v392377_ex31-1.htm |
| EX-32.1 - EXHIBIT 32.1 - Ceres, Inc. | v392377_ex32-1.htm |
UNITED STATES
SECURITIES AND EXCHANGE COMMISSION
Washington, D.C. 20549
Form 10-K
| x | ANNUAL REPORT PURSUANT TO SECTION 13 OR 15(d) OF THE SECURITIES EXCHANGE ACT OF 1934 |
For the fiscal year ended August 31, 2014
| ¨ | TRANSITION REPORT PURSUANT TO SECTION 13 OR 15(d) OF THE SECURITIES EXCHANGE ACT OF 1934 |
For the transition period from to
Commission file number: 001-35421
Ceres, Inc.
(Exact name of registrant as specified in its charter)
| Delaware | 33-0727287 |
| (State of incorporation) |
(I.R.S. Employer Identification No.) |
|
1535 Rancho Conejo Boulevard Thousand Oaks, CA |
91320 |
| (Address of principal executive offices) | (Zip code) |
Telephone: (805) 376-6500
(Registrant’s telephone number including area code)
Securities registered pursuant to Section 12(b) of the Act:
| Title of Each Class | Name of Each Exchange on Which Registered |
| Common Stock, $0.01 par value per share | The Nasdaq Stock Market LLC |
Securities registered pursuant to Section 12(g) of the Act: Not Applicable
Indicate by check mark if the registrant is a well-known seasoned issuer, as defined in Rule 405 of the Securities Act. Yes ¨ No x
Indicate by check mark if the registrant is not required to file reports pursuant to Section 13 or Section 15(d) of the Exchange Act. Yes ¨ No x
Indicate by check mark whether the registrant: (1) has filed all reports required to be filed by Section 13 or 15(d) of the Securities Exchange Act of 1934 during the preceding 12 months (or for such shorter period that the registrant was required to file such reports), and (2) has been subject to such filing requirements for the past 90 days. Yes x No ¨
Indicate by check mark whether the registrant has submitted electronically and posted on its corporate Web site, if any, every Interactive Data File required to be submitted and posted pursuant to Rule 405 of Regulation S-T during the preceding 12 months (or for such shorter period that the registrant was required to submit and post such files). Yes x No ¨
Indicate by check mark if disclosure of delinquent filers pursuant to Item 405 of Regulation S-K is not contained herein, and will not be contained, to the best of registrant’s knowledge, in definitive proxy or information statements incorporated by reference into Part III of this Form 10-K or any amendment to this Form 10-K. ¨
Indicate by check mark whether the registrant is a large accelerated filer, an accelerated filer, a non-accelerated filer, or a smaller reporting company. See the definitions of “large accelerated filer,” “accelerated filer” and “smaller reporting company” in Rule 12b-2 of the Exchange Act. (Check one):
| Large accelerated filer | ¨ | Accelerated filer | ¨ | ||
| Non-accelerated filer | x (Do not check if a smaller reporting company) | Smaller reporting company | ¨ |
Indicate by check mark whether the registrant is a shell company (as defined in Rule 12b-2 of the Exchange Act.) Yes ¨ No x
Under the Jumpstart Our Business Startups Act of 2012, or the JOBS Act, Ceres, Inc. qualifies as an “emerging growth company,” as defined under the JOBS Act.
As of February 28, 2014 (the last business day of the registrant’s most recently completed second fiscal quarter), the aggregate market value of the registrant’s Common Stock held by non-affiliates of the registrant was approximately $14,150,207 (based on the last reported trading price of the Common Stock of $1.43 per share on that date, as reported on the Nasdaq Global Market).
As of November 7, 2014, there were 48,265,633 shares of Common Stock outstanding.
TABLE OF CONTENTS
| i |
Certain statements that we make from time to time, including statements contained in this Annual Report on Form 10-K constitute “forward-looking statements” within the meaning of Section 27A of the Securities Act of 1933, as amended, or the Securities Act, and Section 21E of the Securities Exchange Act of 1934, as amended, or the Exchange Act. All statements, other than statements of historical facts contained in this Annual Report on Form 10-K, including statements regarding our efforts to develop and commercialize our products, anticipated yields and product performance, our short-term and long-term business strategies, market and industry expectations and future results of operations and financial position, including anticipated cost savings from our plan to align expenditures and liquidity, are forward-looking statements. In many cases, you can identify forward-looking statements by terms such as “may”, “will”, “should”, “expect”, “plan”, “anticipate”, “could”, “intend”, “target”, “project”, “contemplate”, “believe”, “estimate”, “potential”, “continue” or other similar words.
We based these forward-looking statements largely on our current expectations and projections about future events or trends that we believe may affect our business and financial performance. These forward-looking statements involve known and unknown risks and uncertainties that may cause our actual results, performance or achievements to materially differ from any future results, performance or achievements expressed or implied by these forward-looking statements. We have described in item 1A, under the heading entitled “Risk Factors,” and elsewhere in this Annual Report on Form 10-K the material risks and uncertainties that we believe could cause actual results to differ from these forward-looking statements. Because forward-looking statements are inherently subject to risks and uncertainties, some of which we cannot predict or quantify, you should not rely on these forward-looking statements as guarantees of future results, performance or achievements.
The forward-looking statements in this Annual Report on Form 10-K represent our views as of the date of this Annual Report on Form 10-K. We undertake no obligation to update publicly, except to the extent required by law, any forward-looking statements for any reason after the date of this Annual Report on Form 10-K to conform these statements to actual results or to changes in our expectations.
You should read this Annual Report on Form 10-K and the documents that we reference in this Annual Report on Form 10-K and have filed with the Securities and Exchange Commission, or the SEC, with the understanding that our actual future results, levels of activity, performance and events and circumstances may be materially different from what we expect.
Unless otherwise indicated in this Annual Report on Form 10-K, “Ceres”, “our company”, “the Company”, “we”, “us” and “our” refer to Ceres, Inc. and our subsidiaries, Ceres Sementes do Brasil Ltda., Ceres Agrotechnologies Intl LLC and CS Semillas de México, S. de L. de C.V.
Our logos, “Ceres®”, “Blade®”, PersephoneTM and “Skyscraper®” and other trademarks or service marks of Ceres, Inc. appearing in this Annual Report on Form 10-K are the property of Ceres, Inc. This Annual Report on Form 10-K contains additional trade names, trademarks and service marks of other companies. We do not intend our use or display of other companies’ trade names, trademarks or service marks to imply relationships with, or endorsement or sponsorship of us by, these other companies.
This Annual Report on Form 10-K contains references to acres, hectares, gallons and liters. In the United States, blendstock fuels are typically measured and sold in gallons. In other parts of the world, the standard unit is liters. The following table sets forth the conversion factor between metrics.
| 1 Hectare | = | 2.471 Acres | |
| 1 Gallon | = | 3.785 Liters |
Based on the Exchange Rate of the Central Bank of Brazil, on November 7, 2014, one Real was equivalent to 0.40 U.S. dollars.
| ii |
Our Company
We are an agricultural biotechnology company that develops and markets seeds to produce crops for bioenergy and other markets that utilize plant biomass. We use a combination of advanced plant breeding, biotechnology and bioinformatics to develop seed products that we believe address the limitations of first-generation bioenergy feedstocks, such as corn and sugarcane. These technology platforms, which can increase crop productivity, improve quality, reduce crop inputs and improve cultivation on marginal land, have broad application across multiple crops, including food, feed, fiber and fuel crops.
One of our largest immediate commercial opportunities is in Brazil where we are pursuing multiple markets for our sorghum products. We market our sweet sorghum hybrids as a ‘‘drop-in’’ feedstock to complement existing feedstock supplies and extend the operating season of Brazilian sugarcane-to-ethanol mills. We also market our high biomass sorghum products to mills and other agri-industrial facilities for use in generating electricity, heat and steam. Biomass feedstocks grown from our seeds can also be used for the production of second-generation biofuels and bio-based chemicals. Due to the similarities among crops developed for bioenergy and those developed for livestock consumption, we believe that certain of our seed products may have application in the hay and forage feed market. Our upstream position in the value chain allows us to be largely independent of the success of any particular conversion technology or end use.
We believe that crops such as corn, rice and sugarcane can benefit from many of the traits and genetic technologies we are developing for bioenergy crops, such as traits that provide drought tolerance. We have also generated many biotech traits specifically for cereal crops, such as rice, that increase grain yields and provide greater yield stability across different environments. To date, our field evaluations have largely confirmed earlier results obtained in greenhouse and laboratory settings, and we believe that based on these multiple confirmations, we have an industry leading biotech trait technology pipeline, with applications in food, feed, fiber and fuel crops.
We market and sell our seed products under our Blade brand. In certain crops, including corn, rice and sugarbeet, we have out-licensed a portion of our traits and gene technology to existing market participants and continue to pursue opportunities to out-license these technologies, among other go-to-market strategies. We also market our proprietary genome viewer software, known as Persephone, to plant and biomedical researchers.
We believe that the strength of our technology has been validated by our receipt of multiple competitive grants as well as collaborations with leading companies in crop science, such as Syngenta Biotechnology and Bayer CropScience. In July 2014, our Brazilian subsidiary was selected for a competitive grant of up to approximately 10 million reais, or 4 million U.S. dollars, as well as a government subsidized credit facility for up to approximately 67.5 million reais, or 27 million U.S. dollars, from the Brazilian government under its PAISS Agricola initiative, which provides funding for transformational technologies in agriculture. Historically, we also have received a United States Agency for International Development, or USAID, grant and one of the U.S. Department of Energy’s first Advanced Research Project Agency for Energy, or ARPA-E, grants, among other federal and state grants. We also have significant intellectual property rights to our technology platforms, traits and seed products.
Commercial Evaluations of Our Sorghum Products in Brazil
Since 2010, we have completed various field evaluations of our sorghum products in Brazil with approximately 50 ethanol mills, mill suppliers and agri-industrial facilities. During this time, our sorghum seeds were planted and harvested using existing equipment and fermented into ethanol or combusted for electricity generation without retrofitting or altering the existing mills or industrial facilities. We believe these experiences have demonstrated the “drop-in” nature of our both our sweet and high-biomass sorghum products, and along with higher yielding products in our pipeline, will serve as the basis for expanded adoption of these product lines as a feedstock for ethanol and power production in Brazil and other markets.
| 1 |
With industrial processing of sorghum feedstock generally well established in Brazil, we believe that field performance — primarily yields of sugars that can be fermented to ethanol — will largely determine the scale and pace at which our current and future sweet sorghum products will be adopted. Based on industry feedback, we believe that minimum average yields in the range of 2,500 to 3,000 liters of ethanol per hectare will be necessary to achieve broad adoption. While we achieved yields in this range in the 2013-2014 growing season in Brazil with multiple products in multiple regions, we expect that the 2014-2015 growing season in Brazil will be necessary to validate results. Additional growing seasons beyond the 2014-2015 season may be required to fully demonstrate this yield performance across numerous geographies and for our products to gain broad adoption.
For our high-biomass types, based on industry feedback, we believe that minimum average yields per hectare in the range of 30 to 40 metric tons of biomass, measured at 50% moisture content, will be necessary to achieve broad adoption. However, recent water shortages and increasing demand for power in Brazil have led to a spike in electricity prices. We believe these market conditions have made yields as low as approximately 28 metric tons per hectare economically attractive at current electricity prices.
2014 – 2015 Sorghum Growing Season in Brazil
For the 2014-2015 season, we expect to evaluate our products with more than 50 customers, which include, among others, ethanol mills and multi-mill conglomerates that we estimate are collectively responsible for more than 30% of the sugarcane crushed in Brazil. For the 2014-2015 sorghum growing season in Brazil, total plantings of our sorghum products are expected to cover up to approximately 5,000 hectares, compared to approximately 1,000 hectares planted the previous season. The increase in planted area is due primarily to increased demand for high biomass sorghum for power generation. Plantings also include small, multi-hybrid evaluations designed to determine yield potential, identify the best performing hybrids for specific regions and demonstrate various crop management practices.
To meet immediate demand for biomass for power generation and to facilitate the development of a supply chain for sorghum biomass, we will provide agronomy and crop management services for certain customers this season under our sales incentive and promotional programs, which include offtake agreements for sorghum biomass produced under our direction or management. Revenue for these plantings will be based upon yields of biomass per hectare rather than seed sales. We expect the majority of high biomass sorghum hectares this season to be planted under these sales incentive and promotional programs.
In addition to utilizing our sorghum seed products to grow feedstock for bioenergy, this season we initiated sales of our sorghum for use as livestock feed and forage, following successful evaluations in the U.S. and Brazil.
Prior Sweet Sorghum Growing Seasons in Brazil
We believe that the improvement of top yields achieved by the mills since 2010 – 2011 reflect an overall trend of improvement. The following summarizes the results of our previous sorghum growing seasons:
| 2 |
2013 – 2014 Growing Season. For the 2013–2014 sorghum growing season in Brazil, plantings consisted of both sweet and high biomass sorghum product types. Our products were planted with 49 customers, including ethanol mills and mill suppliers, across 55 different locations. These plantings primarily consisted of small, multi-hybrid evaluations designed to determine yield potential, identify the best performing hybrids for specific regions and demonstrate various crop management practices. Our agronomists worked more closely with our customers and took a greater role in implementing or helping implement these crop management practices than in prior growing seasons. Several mills planted larger evaluations in the 2013-2014 growing season. Total plantings of our commercial and pre-commercial sorghum hybrids covered approximately 1,000 hectares compared to approximately 3,000 hectares for the previous season due primarily to a greater focus among mills on field performance, which can be determined at a smaller scale than evaluations needed for confirming industrial performance. Calculated yields of ethanol per hectare from our sweet sorghum products were more than 35% higher on average than the previous season, primarily as a result of product improvements and better crop management, and despite dry and hot conditions that affected the company’s sorghum evaluation areas for part of the growing season. Ethanol yields from 40 customer evaluation sites ranged from approximately 950 to 4,200 liters per hectare, according to company calculations. Twenty-eight evaluations sites achieved a minimum of 2,500 liters with one or more hybrids. In addition, several of our high biomass sorghum hybrids achieved average yields that we believe met or exceeded minimum yields levels needed for commercialization. Top yields exceeded 35 metric tons per hectare, as measured at 50% moisture content. Based on anecdotal customer reports, we believe our portfolio of sorghum hybrids largely outyielded competing products at multiple locations where side-by-side comparisons were available. Variations in ethanol and biomass yields were primarily due to differences in growing conditions during the season, as well as anticipated variation in the adaptation range and performance of individual hybrids under evaluation. Fifteen customer evaluation sites were lost or did not provide meaningful yield data due to weather or other causes such as herbicide drift. Based on the positive results of the 2013-2014 growing season, we commercialized several new sweet and high biomass sorghum products to support larger scale customer evaluations.
2012 – 2013 Growing Season. For the 2012 – 2013 sorghum growing season in Brazil, our products were planted by or for more than 30 mills through a combination of seed sales, agronomy and crop management services and product evaluations. We collected yield results from approximately two-thirds of the mills that planted our hybrids; the remaining mills reported incomplete results, did not complete the evaluation or chose not to report results. For mills that reported results, yields of fermentable sugars were approximately 50% higher on average than the previous season, primarily as a result of product improvements related to biomass quality and productivity, better crop management and more favorable growing conditions at most planting locations. Ethanol yields from our products ranged from approximately 450 to 3,600 liters per hectare, according to mill and company calculations. Mills representing the top 20% of yields, and which generally followed established crop management practices, achieved average yields ranging from 2,100 to 3,300 liters per hectare. Lower yields were primarily due to deviations from recommended crop management protocols, weather related delays during planting and disease infection late in the growing season.
2010 – 2011 and 2012 – 2012 Growing Seasons. In the 2010 – 2011 growing season, in collaboration with several mills, we completed commercial-scale evaluations on approximately 250 hectares of our sweet sorghum. The primary purpose of these evaluations was to demonstrate proof of concept rather than productivity. Calculated ethanol yields ranged from approximately 650 to 1,000 liters per hectare for the 2010 – 2011 growing season based on results from two mills. During the following 2011 – 2012 season, we completed our first sales of sweet sorghum, which amounted to greater than 3,000 hectares to more than a dozen mills. These evaluations included a greater number of hybrids and more variable growing conditions over a broader range of geographies than the previous year. Proof of concept was again confirmed, and at a greater scale, although yields were less than optimal primarily due to severe drought conditions that affected agricultural crops in the region, including sugarcane and sweet sorghum. Calculated ethanol yields ranged from 300 to 2,100 liters per hectare for the 2011 – 2012 growing season based on results from 14 mills.
Mills use a variety of measurements and a complex formula to determine ethanol yields per hectare. Methodologies and assumptions used in these calculations can vary, and are therefore subject to greater variability than a controlled environment. Field evaluations are subject to significant variability from year to year, including differing locations, trial designs, soil types, products planted, agronomic practices and growing conditions, and therefore, results are not directly comparable. Moreover, results from smaller scale evaluations may not be indicative of yields that can be achieved in larger-sized commercial plantings, which are affected by greater variability.
| 3 |
Market Opportunities
Our advanced plant breeding, biotechnology and bioinformatics platforms, which can increase crop productivity, improve quality, reduce crop inputs and improve cultivation on marginal land, have broad application across multiple markets and crops, including food, feed, fiber and fuel crops.
Bioenergy
The world continues to seek economically and environmentally sound alternatives to fossil fuel-based transportation fuels, chemicals and power. We believe bioenergy is one of the few viable replacements for fossil fuels, particularly petroleum. Unlike other renewable technologies, biofuels are intended to utilize existing vehicles and transportation fuel infrastructure. Similarly, biopower, unlike wind and solar power, can provide baseload and dispatchable generation of renewable electricity. Despite the potential of biofuels, first-generation biofuel feedstocks have demonstrated their limitations in terms of scale, perceived competition with food production, net energy balance and dependence on government subsidies. Similarly, current sources of biomass, such as forestry residues and agricultural wastes, are limited in scale and are not optimized for use in bioenergy. They are also by-products derived from other processes and therefore subject to supply disruptions.
Our dedicated energy crops provide an attractive combination of high yield density, high net energy balances, low input requirements, the ability to grow on marginal land and, as a dedicated source of feedstock, the potential to be tailored for specific production and refining processes. As a result, we believe that dedicated energy crops will become a critical component for the growth of the biofuel, bio-based chemicals and biopower markets.
Brazil. One of our largest immediate commercial opportunities is in Brazil where we are pursuing multiple markets for our sorghum products. In Brazil, sugarcane is the predominant feedstock for ethanol and a major source of feedstock for power generation. According to the USDA, there are approximately 400 sugar and ethanol mills in Brazil, including approximately 350 mills in the Center-South of the country, where our field evaluations are located. The sugar and ethanol mills have a combined crush capacity of over 600 million metric tons, according to the United States Department of Agriculture, or USDA. Based on published reports, we estimate that the top 20 mill groups accounted for approximately 40% of the total crushing capacity. Due to the inherent limitations of sugarcane physiology and growth patterns, Brazilian mill operators typically obtain sugarcane that makes mill operation economically feasible approximately 200 days per year, based on a report issued by the Brazilian Ministry of Agriculture’s crop forecasting agency, Companhia Nacional de Abastecimento (Conab), dated May 2012. We believe that mill operators are seeking alternatives that will allow them to increase production utilization of their existing mills beyond their current operating schedule in order to maximize their market opportunity. Conab estimates that approximately 9.1 million hectares of sugarcane are cultivated in Brazil, with approximately 11% of this area replanted annually, or renewed, according market surveys reported in August 2013 and August 2014. We believe that a significant portion of annual renewal areas, along with other under-utilized land, represent a market opportunity of one million hectares for sweet sorghum production once we consistently demonstrate economically attractive yields. We believe that the lower production costs of sweet sorghum compared to sugarcane provides an attractive incentive. Based on our analysis and reports from industry research firms Informa Economics FNP and Agrosecurity, we estimate that total sweet sorghum production costs on a marginal cost basis range from approximately 2,850 to 3,050 Brazilian reais per hectare compared to sugarcane, which we estimate costs approximately 6,000 reais per hectare on an annualized basis to produce. Moreover, the current crush capacity in Brazil must increase to meet expected domestic demand. The Brazilian government’s energy research institute, Empresa de Pesquisa Energética, or EPE, projects that Flex Fuel vehicles will comprise 76% of light duty vehicles in Brazil in 2022, up from 53% in 2012. This increase is expected to significantly increase the size of the ethanol market in Brazil.
In Brazil, our sorghum products also can be used to generate electricity. Ethanol mills typically combust sugarcane bagasse, the leftover biomass from ethanol production, to generate onsite power. For mills connected to the grid, excess electricity production provides an additional source of revenue. Biomass is also used as a source of power and heat for other agribusiness and industrial sectors. Wood is the primary feedstock. Based on field and industrial evaluations with mills and other industrial companies, we believe that sorghum has a number of favorable attributes as a biopower feedstock and can be utilized as a supplementary source of biomass, especially during the offseason or periods of sugarcane bagasse shortages. Based on current biomass usage in Brazil, we estimate that potential market size for high biomass sorghum is approximately one million hectares.
| 4 |
Biopower in Other Geographies. Our dedicated energy crops can be used to generate electricity in existing solid-fuel power facilities, such as coal-fired generating plants. In the U.S., Europe and other geographies, the conversion of biomass to power has traditionally been fueled by bio-based waste products and residues from the paper and timber industries. We believe this practice has limited the size, location, efficiency and scale of biomass power generation because power producers cannot reliably secure long-term supplies of consistent quality feedstock. We believe we will see a material increase in demand for biopower in the event that additional renewable energy legislation is passed in the United States, Europe or other regions that requires a higher percentage of generation from low-carbon sources or provides equal production incentives for the co-firing of biomass with coal, as are currently available for wind and solar power. Based on industry feedback, we believe that our products can be cost competitive with existing biopower feedstocks and, assuming that our products meet various biomass quality specifications, can be used by existing utilities and power producers.
Cellulosic Biofuels and Bio-Based Chemicals. According to a 2011 report published by International Energy Agency, or IEA, biofuel production could reach approximately 112 billion gallons per year by 2030, up from 26 billion gallons in 2010. To meet these targets, the IEA believes feedstock production would need to increase to 150 million acres in 2030, up from 75 million acres in 2010. We believe quadrupling the volume of biofuels while only doubling the feedstock production acres will require higher yielding second-generation feedstocks, like our dedicated energy crops. We believe that our dedicated energy crops and traits have the potential to become the common denominator in a broad array of bio-based products, including ethanol, butanol, jet fuel, diesel-like molecules and gasoline-like molecules, and can enable the development of larger-scale processing facilities.
Food, Feed and Fiber Crops
Row Crops. Approximately 432 million acres of biotechnology crops were planted globally in 2013, according to a February 2014 report published by the International Service for the Acquisition of Agri-Biotech Applications. The global market value of biotechnology crop seeds was approximately $15.6 billion, as reported in the same report. In the United States, we estimate, based on the price differential between conventional seed varieties and similar varieties with a trait, that retail premiums for traits and stacked trait combinations in food, feed and fiber crops range from approximately $10 to $50 per acre, depending on crop and geography. As people in many countries become more affluent, they tend to consume more of their dietary protein in the form of meat and dairy products, driving the demand for animal feed grains and forage higher. Therefore, greater production of food, feed, and fiber will require higher crop productivity levels among all crops over time. In order to continue the productivity gains made in many crops over the past 75 years, and to do so in a more sustainable manner, we believe that advanced breeding methods, and biotech traits, in particular, will be required to produce higher performance crops that make more productive use of cultivated land, as well as to develop more robust, stress-tolerant crops that can grow under more difficult conditions and on marginal land. Our belief is consistent with historical yield improvements achieved via plant breeding and the adoption of agricultural biotechnology.
Forage Crops. There are similarities among crops developed for bioenergy and those developed for livestock consumption, and we believe that certain of our seed products and traits may have application in the hay and forage feed market. Globally, the market for forage feed was valued at approximately $85 billion in 2013, according to a 2014 report from Transparency Market Research. Due to increased global consumption of meat and dairy products, demand for forage feed and hay is expected to continue to increase. In the United States, approximately 40 million acres were planted with non-alfalfa forage crops in 2013, according to the USDA. We believe that growers of forage crops, including vertically integrated businesses such as dairies, will need to seek additional sources of forage as well as utilize more marginal quality cropland, or cropland with limited water availability, to meet their feedstock requirements. Based on evaluations with universities and dairies, we believe that certain of our products have a number of favorable attributes for forage feed, such as high yields and lower water requirements, as well as competitive production costs relative to corn and certain hay crops.
| 5 |
Global Sugar. Sugarcane is cultivated on approximately 25 million hectares worldwide, according to the United Nations’ Food and Agriculture Organization crop database, FAOSTAT. We believe that a number of our biotech traits could provide significant benefits to sugarcane production, such as higher juice and sugar yields and greater resilience to drought and other stress conditions. Biotech solutions are particularly attractive in sugarcane since improvements through plant breeding have been cumbersome and slow compared to other crops. We also believe that sweet sorghum can be developed into a crop with yields and sucrose levels that are high enough to complement sugarcane as a source of crystalized table sugar. Today, it is not possible to economically produce crystalized table sugar from sweet sorghum on a standalone basis due to the mix of sugars in the plant and the relatively lower sucrose levels compared to sugarcane. However, we have demonstrated at pilot scale trial that crystalized sugar can be produced from sweet sorghum on a blended basis. We also have hybrids early in our development pipeline that have demonstrated sucrose purity levels that may be high enough to produce crystalized sugar. Due in part to sweet sorghum’s ability to grow rapidly and lower production costs relative to sugarcane, we believe that sweet sorghum could be an attractive complement or alternative to sugarcane outside of our immediate opportunity in the Brazilian ethanol market.
Genomics and Bioinformatics Technologies
Bioinformatics Software. We use bioinformatics tools, such as our Persephone genome browser, to develop new seed product and traits. We believe that Persephone has applications outside of the plant sciences, such as in biomedical research, where genomics data is analyzed and viewed in a similar manner to plants. The genomics and bioinformatics markets are growing rapidly. According to a May 2014 industry report from Allied Market Research, the bioinformatics market alone is forecast to grow from $3.4 billion in 2013 to $12.8 billion by 2020. Bioinformatics involves the development and storage methods that help in the organizing, analyzing, and retrieving of biological information. Today, a genome can be sequenced in a few hours for several thousand dollars – a task that took 13 years and $2.7 billion to accomplish during the Human Genome Project. Gathering genetic data is no longer a bottleneck for scientific researchers; however, a major hurdle remains in the efficient organization, analysis, and interpretation of the data. We expect that the low cost and widespread application of DNA sequencing and genetic testing in both plant and medical research will require improved software tools, like our Persephone software, to visualize, explore and mine genetic data. Based on internal performance metrics, and those reported by our current collaborators, we believe that our Persephone software offers a number of competitive performance advantages and has applications across a number of life science technology platforms that utilize genomics data.
Competitive Strengths
We believe that we possess a number of competitive strengths that position us to become a leading provider of seeds, traits and bioinformatics technologies, including:
Commercial Products Available Today
We currently have a number of commercially available seed product lines, including sorghum and switchgrass. Our sweet sorghum and high biomass sorghum hybrids have been successfully planted, harvested and processed in Brazil at commercial scale. We believe that the experience of using our products as a ‘‘drop-in’’ feedstock for the past four growing seasons, as well as new higher yielding hybrids in our product portfolio, will serve as the basis for expanded adoption of these product lines as a feedstock for ethanol and power production in Brazil and other markets.
Attractive Business Model
Seed businesses traditionally incur significant research and development expenditures and have long product development time lines, but benefit from a combination of high gross margins, low capital expenditure requirements and intellectual property protection. Once developed, seeds require little physical infrastructure or production cost to be replicated for sale. Seeds are typically priced, however, based on a share of the value created to the customer as opposed to their cost of production. In general, seed costs to growers are a relatively small percentage of their total production cost, but the performance of those seeds is critical to the growers’ economics. We believe we can position our business to take advantage of low production costs relative to the high value of our products to our customers.
| 6 |
Innovative R&D Technology Platforms
To develop higher performing varieties and traits, we use several advanced research and development methods, including biotechnology, marker-assisted breeding and genomics. We believe that our innovative integrated breeding and biotechnology approach allows us to efficiently identify traits, effectively introduce these traits into crops, and more quickly commercialize new and improved seeds and traits for the market. We have both biotech traits and non-biotech traits. Our biotech traits for high biomass yield, nitrogen use efficiency, drought tolerance and altered flower development, among others, have been successfully evaluated in the field; however, they are still at least four years away from commercialization. We believe we were one of the first companies to implement the practice of developing biotech traits using two test species, rather than just one, which we believe allows us to select gene-trait combinations that enhance commercial crops more successfully. We also utilize a proprietary gene stack discovery method to identify the best performing combinations of genes and gene promoters, which regulate gene expression and play a critical role in the effectiveness of biotech traits. We believe that our ability to continue to apply our advanced research and development methods will enable us to further enhance our proprietary germplasm and traits portfolios going forward.
Extensive Proprietary Portfolios of Germplasm and Traits
While many companies have developed portfolios of germplasm or traits, we believe we are one of the only companies focused on dedicated energy crops that has large portfolios of both field-validated traits and germplasm, which includes thousands of specimens and breeding lines, as well as multiple pools of regionally adapted germplasm spanning northern temperate to tropical climates. Having both germplasm and field-validated trait portfolios allows us to leverage the synergies created by combining the two and facilitates innovation in a way that would not be possible with germplasm or traits alone. We believe new market entrants would need to cultivate several generations of germplasm to achieve performance equivalent to our current product portfolio, by which time we believe we will have further evolved our germplasm. Therefore, we believe our proprietary position would be difficult and time-consuming to replicate.
Validated, Robust Bioinformatics Platform
We have established our Persephone bioinformatics software as a preeminent genome browser, displacing incumbent solutions at major life science companies. The software includes a number of proprietary data management optimizations to quickly fetch and render very large datasets. This speed enables more dynamic visualizations, intuitive discovery and greater insights into genomics data. We believe that our direct experience using Persephone internally and our ability to continually develop and launch new versions with additional features and functions will enable us to further establish our market position in the plant sciences and expand into new markets, such as biomedical research and diagnostics.
Management Team with Significant Industry Experience
Our management team includes top scientists and industry experts that have extensive experience in the field of agricultural biotechnology and possesses a deep understanding of a variety of agricultural, chemical and industrial biotechnology businesses, including the seed industry, as well as our regional markets of Brazil, the United States and Europe.
Our Strategy
Our objective is to be the leading provider of seeds and traits to a variety of bioenergy markets, including first-generation biofuels, such as ethanol, as well as cellulosic biofuels, biopower and bio-based chemicals We also plan to pursue other opportunities to leverage our traits, germplasm and technology platforms in food, feed and fiber crops. Key elements of our business strategy include:
| 7 |
Expand Our Presence in Brazil
Brazil represents one of our largest immediate commercial opportunities and we have prioritized both product development and commercial resources for this market. Since our first industrial-scale trials in 2010 − 2011, we have significantly increased yields of fermentable sugars and biomass, and expect to continue to develop and launch new and improved sorghum products. We also continue to build commercial relationships directly with ethanol mills, agri-industrial facilities and their feedstock suppliers. While government policies have placed considerable economic pressure on ethanol production in Brazil, current market conditions are favoring the use of our sorghum products for electricity generation at mills and other agri-industrial facilities. We believe the adoption of sorghum in Brazil can follow similar rapid adoption curves seen for other seed and agricultural innovations. Our belief is based on the drop-in nature of our sorghum products and industry feedback which indicates that rapid adoption can occur once customers reliably achieve economically attractive yields with our products.
Pursue Additional Markets for Our Technology, Germplasm and Genes
We intend to pursue additional markets for our genetic technology, germplasm and genes. For example, we believe crops such as corn, rice and sugarcane can benefit from many of the traits and genetic technologies we are developing, such as traits that provide drought tolerance. We have also generated many biotech traits specifically for cereal crops, such as rice, that increase grain yields and provide greater yield stability across environments. We have chosen primarily to be a technology provider or a trait provider to companies in the food, feed and fiber sectors, however, for certain crops and markets within these sectors, we may explore direct marketing channels. We also intend to evaluate additional uses for our current crops. For example, based in part on purchases of our hybrids for use as livestock feed and forage, we are currently evaluating commercial interest in our seed products by forage producers in the U.S. and Brazil.
Expand Customer Base for Persephone
We intend to increase the number of customers utilizing our Persephone software as their primary genome browser through both client-server installations at major life science companies as well as a planned Software as a Service (SaaS) edition that targets the larger market of individual researchers. We plan to evaluate a beta version of our SaaS edition during our second fiscal quarter, which begins in December. To support ongoing customer satisfaction and attract new customers, we also intend to continue to enhance the functionality and features, and the overall performance of Persephone. We believe that Persephone has applications outside of the plant sciences, such as in biomedical research, where genomics data is analyzed and viewed in a similar manner to plants.
Continue Innovation and New Product Development
We are continuing to develop innovative solutions using a broad range of technological tools, including genomics, biotechnology and proprietary bioinformatics in order to produce crop varieties with improved yields and other performance characteristics. We believe we can accomplish these goals by finding innovative ways to utilize and combine traits and germplasm to further enhance our products.
Continue to Build Our Intellectual Property Portfolio
We believe we have established a strong intellectual property position in plant genes, traits and energy crop germplasm, based on the nature, size and filing dates of our patent portfolio and plant variety protection certificates. We believe we are one of the few companies focused on dedicated energy crops that have this combination of intellectual property assets. We use our integrated technology platforms to continually improve our products and develop innovations that will further strengthen our intellectual property position.
Our Technology Platforms
Our integrated technology platforms are a combination of existing genetic assets, specifically germplasm and traits, and competencies in genomics and gene mapping, biotechnology and bioinformatics. Integration of these platforms allows us to improve our existing genetic assets as well as develop and commercialize new products from them.
| 8 |
We believe we are one of the only companies focused on dedicated energy crops that has large portfolios of both field-validated traits and germplasm, which includes thousands of specimens and breeding lines, as well as multiple pools of regionally adapted germplasm spanning northern temperate to tropical climates. We have also identified to date numerous genes and their relatives from different species that significantly enhance agriculturally relevant traits. Having both germplasm and field-validated trait portfolios allows us to leverage the synergies created by combining the two and facilitates innovation in a way that would not be possible with germplasm or traits alone.
We believe that our innovative integrated breeding and biotechnology approach allows us to efficiently identify traits, effectively express these traits in crops, and more quickly commercialize new and improved seeds and traits for the market.
Germplasm
We believe we have the most comprehensive germplasm collections for our energy crops. Our belief is based on the diversity and nature of the entries we have and how well they have been evaluated, measured and cataloged. Germplasm comprises collections of parental lines and other genetic resources representing the diversity of a crop, the attributes of which are inherited from generation to generation. Germplasm is a key strategic asset since it forms the basis of plant breeding programs. Our early entry into the energy crop industry has allowed us to acquire access to valuable germplasm through strategic collaborations with leading institutions. We are currently involved in three major germplasm development collaborations, each with a history of successful research and germplasm development in an energy crop. When we sell varieties developed during such collaborations, or based on the results of such collaborations, we will typically pay our collaborators royalties on net sales of such varieties.
Traits
We are able to further improve the quality of our future product offerings by adding our proprietary traits to our germplasm collections. The majority of our traits are developed through biotechnology, also known as genetic engineering. Biotechnology allows us to precisely add traits not readily achievable through conventional breeding methods. In most cases, the same trait can be added to multiple crops with similar effect. In some instances, a gene introduced through biotechnology may confer more than one beneficial trait, such as salt tolerance and drought tolerance. Our strategy is to focus on genes that have shown large, step increases in performance, and whose benefits are largely maintained across multiple species.
We believe we were one of the first companies to implement the practice of developing biotech traits using two test species, rather than just one, which allows us to more successfully select gene-trait combinations that enhance commercial crops. Our current portfolio includes genes that have been shown to substantially increase sugar levels or biomass growth per plant as well as genes that have been shown to increase biomass under normal and reduced levels of nitrogen fertilizer. We have genes that allow plants to use water more efficiently and/or recover from water deficits more readily. We also have genes that have been shown to provide tolerance and enhanced recovery to both acute and prolonged salt stress, as well as withstand toxic levels of aluminum in the soil. In addition, we are developing genes that have demonstrated enhanced conversion of biomass to fermentable sugars and genes that regulate flower development.
Our biotech traits are at various stages of development in our pipeline. We are currently evaluating their performance in various target crops primarily through replicated, multi-year field evaluations. These evaluations are designed to validate the function of the gene and measure the performance of the biotech trait in a specific crop. To date, our field evaluations have largely confirmed previous results obtained in greenhouse and laboratory settings.
The commercial development of biotech traits in commercial crops is a multi-year process. Following transformation, when the selected gene is inserted in a target crop, the resulting plants are evaluated in the greenhouse for one to two years, and then in the field to confirm results for two to four years. Following field trials, specific gene-trait combinations are typically selected and, if required, submitted for regulatory approval, or deregulation, which has historically been a multi-year process in the United States and Brazil. Assuming these averages, we believe that we could introduce our first regulated biotech trait or traits to the market in 2018 at the earliest.
| 9 |
We also develop non-biotech traits, including Skyscraper, a commercially available trait that provides a significant increase in biomass yields. Since Skyscraper was identified and developed using molecular marker technology, we have been able to rapidly incorporate it into our elite breeding lines and commercial products.
We intend to price our traits based on the added value they create, which can vary by crop and geography. For our biotech traits, we are considering various pricing models, including separate annual trait fees per acre as well as blended seed and trait prices. For our commercial Skyscraper trait, a per-bag trait fee is included in the seed price. In row crops, we have licensed and intend to license our traits to existing market participants. These licensing agreements are expected to vary by crop, geography, the nature and economic benefit of the trait, and how well advanced the trait is within our pipeline. Future payments to us may be based on a percentage of sales or other performance metrics or milestones.
Research and Development Programs
In order to maintain the lead we have established through our combination of superior germplasm and field-validated traits, we have developed research and development expertise that we believe will allow us to continue to improve our offerings over time. To develop higher performing seeds and traits, we deploy a variety of research and development methods and tools, including genomics, conventional and marker-assisted breeding, agronomy and other genomics-based technologies.
For the fiscal years ended August 31, 2014, 2013 and 2012, we invested $14.2 million, $16.4 million, and $19.2 million, respectively, on research and development, with the main emphasis on breeding and traits.
Genomics
Plant genomics involves the large-scale, simultaneous study of large numbers of genes, their effects and their interactions. One of our strengths in genomics involves our ability to organize the genetic data we amass into actionable information via proprietary relational databases, software and algorithms. In general, we have focused our research efforts on determining gene function, gene regulation and finding which genes enhance desirable traits. In addition to identifying novel gene-trait combinations, our genomics tools allow us to work with large groups of genes and complex biological processes controlled by multiple genes.
In order to capitalize upon our internal catalog of genetic information as well as information in the public realm, we developed our own proprietary software, including our Persephone genome viewer software, which serves as an important tool for locating, mapping and annotating genetic information in plants. We have used Persephone in our marker-assisted breeding and biotech trait pipelines to speed the development of elite parental breeding lines and improved sorghum hybrids. This software program has been non-exclusively licensed to Syngenta Biotechnology and Bayer CropScience. We are also developing a Software as a Service (SaaS) edition of Persephone and plan to evaluate a beta version of the SaaS edition during our second fiscal quarter, which begins in December.
Conventional and Marker-Assisted Breeding
Plant breeding is the act of bringing together specific parent plants to produce a new offspring plant. This cross creates a new plant that will contain a mixture of the characteristics of its parents. The offspring are tested under various conditions to determine which has the superior combination of desired attributes. Further improvements are made by mating and continuing selection of superior parents and offspring through succeeding generations. Plant breeding allows researchers to identify plants with the most favorable combination of desired characteristics to serve as both parental lines and products. In addition to conventional plant breeding, we believe that our genomics expertise makes the identification of proprietary molecular markers more direct and more comprehensive, which allows us to select key crop characteristics more rapidly and accurately than conventional plant breeding alone. Marker-assisted breeding integrates molecular biology and information systems with plant breeding to identify and flag important genetic sequences so that they can be readily found in seeds or plant tissue at any stage of plant development. This platform allows us to track and select the most effective combination of genes, increase the number of progenies and breeding lines created at early stages in the breeding program, and cull them using marker-based selection thereby making greater gains per breeding cycle. Markers are especially useful when seeking to combine multiple non-biotech traits into elite commercial lines.
| 10 |
Agronomy
The performance of plant varieties and traits is influenced by the growing environment, which includes climate, day length, soil quality, pests, length of the growing season and crop management practices. Our network of field trials extends across numerous hardiness zones and regions. This network provides regional performance data and market fit information to support our research and commercialization efforts. Since 2013, we significantly expanded the number of locations and scope of field evaluations of our pre-commercial products and advanced breeding materials in Brazil in order to better position our future products among various geographies, growing conditions and production practices.
Our Current Product Lines and Product Pipeline
Sorghum
Our sorghum products include sweet, high biomass and forage types. Sweet sorghum is a type of sorghum that accumulates free sugars in its stalk much like sugarcane. It is sown by seed, grows faster than sugarcane, and typically requires substantially less water and nitrogen fertilizer than sugarcane to grow to harvestable maturity. To produce ethanol, sweet sorghum juice is extracted through crushing in existing sugarcane equipment, and then fermented to fuel. The leftover biomass, called bagasse, is combusted for biopower like sugarcane bagasse. Because sweet sorghum plants mature more quickly than sugarcane, and reach optimal sugar levels at different times of the year, we believe existing sugar-to-ethanol mills can complement their feedstock supply and extend their operational season through the use of our sweet sorghum product by up to 60 days. Our current sweet sorghum product line consists of improved, proprietary seed varieties and hybrids developed through conventional and marker-assisted breeding.
High biomass sorghum is a type of sorghum which is developed and grown primarily for enhanced biomass yield potential as opposed to sugar or juice content. High biomass sorghum is well suited for the generation of renewable electric power and the creation of cellulosic biofuels. Like other types of sorghum, high biomass types are seed propagated, and generally require less water and nitrogen fertilizer than Brazilian sugarcane and U.S.-grown corn. There are many similarities with sweet types and, in fact, some hybrids can be utilized for either purpose, depending on when they are planted and harvested, and how the crop is managed. Our current high biomass sorghum product line consists of improved hybrids developed through conventional and marker-assisted breeding.
Forage sorghum is a type of sorghum that shares many of the characteristics of sweet and high biomass types. It is grown primarily as silage for livestock. Our current forage products consists of improved hybrids selected from our sweet and high biomass product development pipeline. During the 2014 growing season in the United States, we completed pilot commercial sales of our forage sorghum hybrids. These hybrids have demonstrated competitive yield advantages in both company and university trials. In one university-led evaluation, with other seed companies, for example, we achieved the highest milk production yield per acre, which is a key metric for dairy operations. Results from small scale evaluations and research settings are not a guarantee of future commercial performance, and further evaluations will be necessary to confirm results. However, based on such results, we plan to move forward with larger-scale commercial efforts in the United States. We are targeting sales in the several thousands of acres for the 2015 growing season in the United States. We are also marketing our forage sorghum hybrids in Brazil.
Based on the product candidates in our pipeline today, we expect to continually improve our commercial product line with higher yielding hybrids. We also plan to develop and launch a number of product innovations that provide greater flexibility in harvest time and end use, as well as other benefits, to our mill customers. In advanced hybrid field evaluations, where field evaluation plots are smaller, irrigated and managed more closely than commercial fields, ethanol yields from our later-stage product candidates exceeded 5,300 liters per hectare. Other experimental hybrids earlier in our product development pipeline demonstrated yields exceeding 6,000 liters per hectare. In addition, later-stage high biomass sorghum product candidates achieved yields well over 50 metric tons of biomass per hectare, measured at 50% moisture content. While we do not expect to achieve these yield levels at commercial scale at the present time, these research-stage results demonstrate the genetic potential of hybrids already in our pipeline. Further testing will be required to confirm these research results, and lower yields are expected as hybrids are advanced to larger-sized plantings which are affected by greater variability in weather, soil and other growing conditions.
We are also developing sorghum hybrids with biotech traits that offer higher yields. In a 2014 U.S. field evaluation, one of our leading biotech traits provided a greater than 20% biomass yield advantage in a commercial-type sorghum. We plan to continue to optimize the trait for potential use in the U.S. forage sorghum market as early as 2018. Should performance improvements be confirmed at commercial-scale, we believe that hybrids with this trait could provide us with a significant performance advantage over competitor seed products.
| 11 |
Switchgrass
Switchgrass is a perennial grass that tolerates a wide range of environmental conditions and offers high biomass yield potential compared to many other perennial grasses and crop plants. It generally requires substantially less water and nitrogen fertilizer than corn, and can grow under semi-arid conditions. Like sorghum, switchgrass is seed propagated. As a perennial, switchgrass is generally not harvested for sale during the first year when the crop is being established. A properly managed stand of switchgrass may persist for a decade. However, we believe that producers will likely choose to upgrade to a new variety as new generations of switchgrass seeds with even higher yields or more desirable characteristics become available. Our current switchgrass products have demonstrated higher biomass yields on average over comparable varieties depending on the variety and trial location. In our development pipeline, we have switchgrass varieties that can offer additional increases in biomass, including the first hybrid switchgrass developed for bioenergy. These pre-commercial products represent an important step in switchgrass plant breeding and have shown significant yield increases over our current products.
Miscanthus
The Miscanthus genus includes several perennial species that have potential as dedicated energy crops. The most common variety adopted in the United States and Europe to date is a sterile hybrid of two miscanthus species. While biomass yields for this hybrid may exceed those of switchgrass within its region of adaptation, very large-scale production is not commercially feasible at this time due to prohibitive establishment costs and propagation speed. Through our collaboration with the Institute of Biological, Environmental, and Rural Sciences of Aberystwyth University in Wales, U.K., or IBERS, and the Sustainable Bioenergy Centre of the U.K.’s Biotechnology and Biological Sciences Research Council (BBSRC,) we are developing seed-propagated varieties that have the same high-yielding attributes of comparable vegetatively propagated miscanthus hybrids, yet with establishment costs and propagation speed more comparable to other energy crops. Extending the region of adaptation is another focus area.
Food, Feed and Fiber Crops
Due to the conservation across species of mechanisms underlying traits, crops such as corn, rice and sugarcane can benefit from many of the biotech traits we have developed for use in our crops. This provides us with an additional market for our technology and genes, and mitigates the cost and risk of trait development. Based on results to date, we believe we have an industry-leading biotech trait technology pipeline, with applications in numerous food, feed and fiber crops. We have chosen primarily to be a technology provider or a trait provider to companies in this sector, however, for certain crops and markets within these sectors, we may explore direct marketing channels.
In June 2014, we initiated field evaluations of a number of our leading biotech traits in sugarcane in South America. These evaluations are designed to measure the performance of our traits in leading commercial varieties, with a goal of advancing the best plants for broader evaluation. We expect to increase the scope and scale of our biotech trait development activities in sugarcane with funding we expect to receive under the Brazilian government’s PAISS program. In addition to sugarcane, a number of our biotech traits are being introduced and evaluated in sugarbeet through our collaboration with a leading seed company in this market.
We have also generated many biotech traits specifically for cereal crops, such as rice, that increase grain yields and provide greater yield stability across environments. Some of these have demonstrated double-digit percentage yield increases in rice, relative to average annual yield improvements for grain of approximately 1%, as reported by Economic Botany. In rice, our biotech traits for high grain yield and greater yield stability have advanced well past proof-of-concept, and are moving forward to the next stage of development, which will lead to field evaluations of our biotech traits in hybrid rice. The process of introducing these traits into hybrid rice parental lines is currently underway by our commercialization partner, who is preparing for field evaluations. These field evaluations must receive required government permits before proceeding. To date, our partner has not received these permits and we are unable to predict when or if these permits will be issued. In China, field evaluations of several our biotech traits and gene stacks in corn have been completed and results are expected by the end of calendar year 2014.
| 12 |
Seed Production and Operations
The production of commercial-scale quantities of seeds requires the multiplication of seeds through a succession of plantings and seed harvests. We produce commercial seed either on leased land managed by us or with contract seed producers. Healthy seeds can remain saleable for several years if stored under optimal conditions. In the United States, we receive, condition, treat, package and warehouse our seed grown in the northern hemisphere at our seed warehouse and order fulfillment center in Amarillo, Texas. We anticipate that we will be able to warehouse and process up to 8 to 10 million pounds of seed annually at this facility, or about 1.5 million or 2 million acres of commercial switchgrass or sorghum production. In Brazil and other countries in South America, we contract with growers to produce our seeds. In addition, we work with several third parties who have complete production and packaging capabilities to complement our own production capabilities. All of these seeds are processed, packaged and warehoused by third parties who are experienced in these functions. This method of production is able to supply enough seeds to plant up to 250,000 hectares of commercial sorghum. In the event we begin to generate orders in this range, we may invest in our own facilities to be able to handle production amounts capable of planting 2 million or more hectares of commercial sorghum.
Sales and Marketing
We primarily market and distribute our seed products directly to our customers under the trade name, Blade. These customers have included ethanol mills, utilities, independent power producers, agri-industrial facilities, cellulosic biofuel companies, individual growers and grower cooperatives. We are positioning Blade in the marketplace as a premium brand that represents quality, innovation and value across multiple seed markets. As a result, we price our proprietary products based on their added value, and not on production costs. Our seed prices are determined based on a series of complex considerations, including the best alternative use of land and perceived added value to growers, mills and other customers. Our pricing philosophy is to share a portion of the added value we create with our customers.
In Brazil, our market development activities typically include field evaluations of our current and experimental seed products. These generally small-scale evaluations provide new and prospective customers an opportunity to gain first-hand experience with our Blade products as well as identify the best mix of seed varieties for their growing conditions and harvest timelines. For customers with greater experience with our products, we sell and supply various seed products to support larger, commercial-scale evaluations and uses. For the 2014-2015 growing season in Brazil, the retail price for our sorghum products has ranged from 240 to 265 Brazilian reais per hectare. We have offered leading mill groups and agri-industrial customers the opportunity to participate in sales incentive and promotional programs, which we are using to encourage customers to adopt our products sooner and at larger scale. Under the programs, we expect to incur additional costs of sales for crop management and agronomy support services, which we expect to be reimbursed from revenue generated through biomass sales. Depending on biomass yields per hectare, we may incur certain unreimbursed costs for seed, crop production and agronomy services provided under these programs.
While the markets for second-generation biofuels, bio-based chemicals and biopower markets are developing more slowly than the renewable fuels industry originally anticipated, we believe these markets could represent a significant opportunity. We have adjusted the pace and nature of our product development and marketing activities with these extended timelines in mind. In these markets, we are building our customer base primarily by forming collaborations with biorefineries, power generators and biomass users at their existing, planned and future facility locations. In the United States, our market development activities have typically included agronomy trials, harvest and handling evaluations, test conversions or burns, various post-harvest assays, and supply chain analysis. These tests have confirmed that biomass from our energy grasses can be converted and processed into various fuels or bio-based products. We have conducted similar activities in Europe, although to a lesser extent than in the United States or Brazil at this time. In Europe, we are also working with local institutions to build brand recognition and to advance our research, especially in miscanthus, through our collaboration with IBERS and the U.K.’s Biotechnology and Biological Sciences Research Council (BBSRC).
| 13 |
Major Research Collaborations
Texas A&M University
In August 2007, we entered into an agreement with The Texas A&M University System, or Texas A&M, for the development and commercialization of high biomass sorghum, sweet sorghum and selected related crops as energy crops, together with the discovery of molecular markers for certain traits. The agreement was amended and restated in September 2011 and provides us with exclusive access to a highly regarded sorghum breeding program and the extensive sorghum genetics, breeding and genomics infrastructure of Texas A&M through September 2026. This agreement provides exclusive options and licenses to defined sorghum germplasm, elite sorghum breeding lines, parental lines, advanced hybrids and genomic markers. We fund the majority of the activities performed by Texas A&M pursuant to our Amended and Restated Sponsored Research Agreement, or the Sponsored Research Agreement. The specific research projects and budgets undertaken pursuant to such agreement will be determined by an Executive Committee comprised of two members from each of Texas A&M and us as set forth in the Sponsored Research Agreement. Ownership of intellectual property rights on results from the program work are allocated based on inventorship. Pursuant to our Sponsored Research Agreement and Amended and Restated Intellectual Property Rights Agreement, or the IP Rights Agreement, we have an option to obtain an exclusive world-wide commercial license to results of the program. Texas A&M has agreed not to conduct any activities in the field of our collaboration under an agreement which would grant rights to a third party during the term of our Sponsored Research Agreement. Our Sponsored Research Agreement expires in September 2026, unless terminated earlier pursuant to customary contract termination provisions or program inactivity. Our licenses on results of the joint program survive termination of the Sponsored Research Agreement and survive until, on a country-by-country basis, the expiration of all registered or patented intellectual property rights of Texas A&M covering the licensed line. Under the Sponsored Research Agreement, we were obligated to enter into good faith negotiations regarding our provision to Texas A&M of certain in-kind research support for Texas A&M’s use in performing project activities under the agreement. We satisfied this obligation by entering into a software license, use and access agreement with Texas Agrilife Research in April 2012, pursuant to which we provide them with up to two years of access to our proprietary Persephone genome viewer software, and by providing other relevant information.
We have entered into two exclusive world-wide license agreements with Texas A&M for sorghum lines. The terms of such exclusive license agreements provide that the licenses expire on a country-by-country basis upon the expiration of all registered or patented intellectual property rights of Texas A&M covering the licensed line. Pursuant to such agreements, we pay Texas A&M a royalty on sales of varieties developed using the licensed line at a rate that decreases from low double digits to low single digit rates as a percentage of sales when the licensed line is combined with lines from other sources to develop a variety. We also pay Texas A&M a royalty in the low double digits as a percentage of license income if we grant sublicenses and minimum royalties creditable against royalties on sales. Royalty rates for our current commercial varieties developed using lines licensed from Texas A&M are in the mid single digits as a percentage of sales. Minimum royalties payable to Texas A&M under these agreements escalate on a yearly basis and range from zero to $5,000 per year. We also bear reasonable expenses for intellectual property protection. Further, pursuant to our Amended and Restated Sponsored Research Agreement and Amended and Restated Intellectual Property Rights Agreement, we have an option to obtain an exclusive world-wide commercial license with the right to grant sublicenses to the inventions and sorghum lines resulting from our sponsored program. As of August 31, 2014, aggregate upfront license fees that have been paid or have become due to Texas A&M under these agreements have been $7,000. There are no milestone payments payable under our agreements with Texas A&M. Pursuant to the IP Rights Agreement, we issued warrants in December 2011 to Texas A&M to purchase 66,666 shares of our common stock at an exercise price equal to $14.30. The warrants expire on September 24, 2026 and, subject to certain conditions, vest in equal installments on the fifth, tenth and fifteenth anniversary of the IP Rights Agreement.
| 14 |
The Samuel Roberts Noble Foundation, Inc.
In May 2006, we entered into an agreement with the Samuel Roberts Noble Foundation, Inc., or the Noble Foundation, a non-profit agricultural institute, for the development and commercialization of switchgrass. This relationship provides us access to extensive breeding infrastructure and exclusive licenses to elite switchgrass varieties, breeding lines and advanced cultivars. We use our markers and other genomics technologies to expand the conventional and molecular breeding program in switchgrass at the Noble Foundation. The collaboration further encompasses the development of agronomic systems and management practices for switchgrass. Our funding commitments under this agreement are determined jointly with the Noble Foundation on a three-year project basis. All germplasm and plant varieties resulting from the joint program are jointly owned by us and the Noble Foundation, while the ownership of other intellectual property rights is allocated based on inventorship, except that Noble Foundation inventions resulting from projects to which we provide a financial contribution are jointly owned. Further, pursuant to our Master Research Agreement, the Noble Foundation has agreed to grant us an exclusive world-wide license with the right to grant sublicenses to exploit commercially the results of our joint collaboration program, subject to paying the Noble Foundation a reasonable remuneration to be negotiated in good faith. There are no upfront license fees or milestone payments payable under any of our agreements with the Noble Foundation. The Noble Foundation has agreed not to collaborate with or perform any activities for the benefit of or grant any rights to third parties in the field of switchgrass without our prior written consent, subject to certain exceptions. This agreement expires in May 2026, unless terminated earlier pursuant to customary contract termination provisions or under certain circumstances, for example if either party ceases substantially all activities in switchgrass, if the institutional mission, purpose or structure of the Noble Foundation changes substantially and adversely affects the Noble Foundation’s ability to satisfy its obligations under the agreement, or if no active collaborative research projects exist for more than two years.
We have entered into exclusive license agreements with the Noble Foundation for three switchgrass varieties, which the Noble Foundation has licensed on an exclusive basis from the University of Georgia Research Foundation, or UGARF. Such agreements provide that we will file for intellectual property protection on such varieties at our expense in the joint names of the Noble Foundation and UGARF. The term of each such exclusive license agreement is, on a jurisdiction-by-jurisdiction basis, the longer of the duration of the intellectual property rights covering the licensed variety or 15 years from the first sale of the licensed variety in such jurisdiction. Pursuant to one agreement, we pay the Noble Foundation a royalty on sales that ranges from mid single digits to low double digits as a percentage of sales and a royalty on license income in low double digits as a percentage of license income if we grant sublicenses and minimum royalties creditable against royalties on sales and license income. Pursuant to the second agreement, we pay the Noble Foundation a royalty on sales in mid single digits as a percentage of sales, a royalty on license income in the low double digits as a percentage of license income if we grant sublicenses and minimum royalties creditable against royalties on sales and license income. The minimum royalties payable to the Noble Foundation under these agreements escalate on a yearly basis and range from $2,500 to $20,000 per year, per variety. In addition, we have an outstanding exclusive option to enter into an exclusive license to two switchgrass varieties, which the Noble Foundation has the exclusive option to license, or to the extent exercised, an exclusive license from UGARF. Such option is exercisable at any time, by Ceres providing written notice to Noble, but no later than twelve months from the respective release date of the subject switchgrass variety. The respective release dates have not been set yet. The royalty rates on such varieties are not yet determined.
| 15 |
Institute of Biological, Environmental and Rural Sciences of Aberystwyth University
In April 2007, we entered into an agreement with IBERS for morphological characterization, genetic evaluation, and the development and commercialization of miscanthus species as an energy crop. This relationship provides us access to an extensive scientific research infrastructure and an exclusive world-wide license with the right to grant sublicenses to exploit commercially the results of our joint collaboration program, subject to paying IBERS a reasonable remuneration to be negotiated in good faith, including exclusive licenses to miscanthus germplasm, breeding lines and varieties produced by IBERS, except that IBERS has a non-exclusive license in the United Kingdom to varieties resulting from the joint program. We use our expertise in genomics-based technologies and plant breeding to expand the miscanthus breeding program at IBERS. Our funding commitments under this agreement are determined jointly with IBERS on a project basis. All germplasm and plant varieties resulting from the joint program are jointly owned by us and IBERS, while the ownership of other intellectual property rights is allocated based on inventorship, except that IBERS inventions resulting from projects to which we provide a certain financial contribution are jointly owned. Unless otherwise agreed, license agreements for released varieties will be based on a model license agreement, the duration of which will be until the expiration of the intellectual property rights covering the variety in a given jurisdiction, or in those jurisdictions in which the licensed variety is sold but no such intellectual property rights are obtained, until the tenth anniversary of the first sale of such variety in such jurisdiction. Pursuant to the model license agreement, we have agreed to pay royalties based on sales that range from low to mid single digits as a percentage of sales and royalties on license income at a rate to be negotiated. To date, we have not entered into any specific license agreements with IBERS. IBERS has agreed not to collaborate with or perform any activities for the benefit of or grant any rights to third parties in the field of miscanthus without our prior written consent, subject to certain exceptions. This agreement expires on March 31, 2022, unless terminated earlier pursuant to customary contract termination provisions or under certain circumstances, for example if either party ceases substantially all activities in miscanthus, or if no active collaborative research projects exist for more than two years. We have entered into a collaboration agreement with IBERS and certain other U.K. academic and commercial entities pursuant to which certain research and development activities covered by our original collaboration agreement with IBERS have been integrated into a collaborative project involving these parties. The collaboration project benefits from funding by certain U.K. government agencies, however, we anticipate that we will continue to fund our obligations at current levels including providing some of our ongoing activities as contributions in kind. This arrangement does not involve any significant modification to our intellectual property and commercialization rights as set forth in our original collaboration agreement with IBERS. There are no upfront license fees, milestone payments or minimum royalties payable under our agreement with IBERS
Chinese Academy of Agricultural Sciences
Our high-throughput field evaluations of rice are conducted in China by the Institute of Crop Sciences of the Chinese Academy of Agricultural Sciences, or ICS. Pursuant to our Collaboration Agreement for rice, ICS performs transformation of rice with our genes, evaluates the transformed rice plants in the field according to detailed protocols, and reports results and observations to us. We own all results and intellectual property resulting from such activities. We pay ICS for the services pursuant to an agreed upon budget. The program is due to expire on December 31, 2015. We believe, and our results have confirmed, that by selecting genes that perform similarly in both of our model plant species, we can readily identify superior genes among thousands of candidates.
Monsanto Company
In April 2002, we entered into a multi-year discovery and development collaboration with Monsanto Company focused on applying genomics technologies to identify genes that provide improvements in corn, soybean and certain other row crops. Pursuant to this agreement, Monsanto licensed rights to a portion of our trait discovery pipeline in certain row crops in exchange for license payments over several years. Monsanto also funded a research program with us, which was completed in 2007. The term of this agreement continues for the life of the last patent licensed pursuant to the agreement. The licenses granted to Monsanto are royalty-bearing, subject to patent protection. The intellectual property rights on inventions conceived by us pursuant to the collaboration vest in us and Monsanto has certain licenses to the results of the collaboration activities for certain row crops. We believe the $137 million transaction with Monsanto, a market leader in crop biotechnology, validated our technology platforms and provided us a channel to begin to deploy our traits into corn, soybean and other commodity crops. We remain free under this agreement to develop and commercialize the genes and traits developed under this collaboration for deployment in our energy crops and certain other crops such as rice. We can also develop and exclusively license to third parties genes not covered under this agreement and which we have subsequently developed for use in corn, soybean and other row crops.
| 16 |
Research Activity Costs
At August 31, 2014, the future minimum payments under our research collaboration agreements are as follows:
| (in thousands) | ||||
| 2015 | $ | 863 | ||
| 2016 | 694 | |||
| 2017 | 125 | |||
| $ | 1,682 | |||
Enabling Technologies
We have developed or acquired licenses to certain technologies that we deem necessary or useful for the development of biotech traits, which while under development remain several years away from commercialization. Such licenses include a non-exclusive license from Monsanto to a transformation technology and certain other technologies, pursuant to which we will pay Monsanto a royalty on sales in the low single digits as a percentage of sales of products covered by the licensed patents. This agreement with Monsanto will terminate upon the expiration of the last patent under certain patent rights listed in the agreement. Such licenses further include an exclusive license with Cambridge Enterprise Ltd. (formerly known as Cambridge University Technical Services Ltd.) to a technology developed at the University of Cambridge (United Kingdom) to regulate gene activity, pursuant to which we will pay a royalty on sales in the low single digits as a percentage of sales of products covered by the licensed patents and a royalty in the low single digits as a percentage of license income. Pursuant to the agreement, the maximum milestone payments payable by us are $250,000. All such milestone payments have been made. The agreement with Cambridge Enterprise Ltd. will expire on the date of the expiration of the last-to-expire patent licensed under the agreement. We expect that the presently issued U.S. patent under this agreement will expire in 2023.
Intellectual Property
We seek to protect our plant genes, traits, germplasm and other technology and know-how under patent, plant variety protection, plant breeders’ rights, copyright, trademark and trade secret laws. Protection of products, technology and trade secrets is also maintained using confidential disclosure agreements entered into by our employees, consultants and potential and actual third party collaborators. From time to time, we align our intellectual property strategy and portfolio with our business objectives, which since November 2012, has resulted in a reduction in the total number of issued patents, exclusively licensed rights to patents and pending patent applications. As of November 7, 2014, we owned or had exclusive licensed rights to approximately 93 issued patents and approximately 87 pending patent applications in the United States and in various foreign jurisdictions. The patents for Ceres-developed inventions are set to expire beginning in 2020. Our patents or patent applications generally relate to compositions of matter for DNA and protein sequences, plants and plant parts, methods of improving plants and seed products. In addition, we hold numerous granted rights or pending applications for patents and Plant Variety Protection certificates for our commercial varieties, hybrids and inbreds, as well as for methods for the improvement, production, and use of various crops. Our filings in foreign jurisdictions, such as Europe and Brazil are generally targeted to the products we plan to offer in those respective markets. We continue to file new patent applications, for which terms generally extend 20 years from the filing date in the United States. The duration of plant variety protection and plant breeder’s rights protection varies among jurisdictions, e.g., the duration is 20 years from issue in the United States, 25 years from filing in Europe, and 15 years from grant of a Provisional Certificate of Protection in Brazil. Our registered and pending trademarks in the United States and in selected foreign countries include Ceres, Blade, Persephone and Skyscraper.
| 17 |
Government Grant Awards
Grant awards help mitigate the costs and risks of developing new products and have historically allowed us to broaden the scope and speed of our research and development activities. Over the past five years, we have received grants from the DOE, the USDA, the USAID, and the joint USDA/DOE BRDI program as well as state-level grants. Our grant revenue totaled $1.6 million in the fiscal year ended August 31, 2014. In July 2014, our Brazilian subsidiary was selected for a competitive grant and a multi-year credit facility to fund a product development project for sorghum and sugarcane for up to approximately 85 million reais, or 34.7 million U.S. dollars, under the government’s PAISS Agricola program. The project consists of a non-repayable grant of up to approximately 10 million reais, or 4 million U.S. dollars, and a government-subsidized credit facility for up to approximately 67.5 million reais, or 27 million U.S. dollars. The company is expected to fund up to approximately 7.5 million reais, or 3 million U.S. dollars, of the project. We have completed the required application and have received approval in principle for the grant and credit facility. Subject to the completion of customary documentation and financial guarantees to be provided by Ceres, we expect to draw the first tranche of the non-repayable grant during our second fiscal quarter and the first tranche of the credit facility during our third fiscal quarter.
Significant Customers
For the fiscal year ended August 31, 2014, USAID, ARPA-E, Exelus, and Syngenta represented 41.9%, 17.5%, 16.5% and 11.6% of our revenues, respectively. For the fiscal year ended August 31, 2013, Syngenta, ARPA-E, USAID and Campbell Soup Company represented 22.5%, 21.2%, 20.2% and 14.5% of our revenues, respectively.
Competition
The renewable energy, seed, agricultural biotechnology and genomics industries are rapidly evolving and new competitors with competing technologies and products are regularly entering the market. We expect to compete with other providers of seed and vegetative propagation materials in the market for our crops as well as other developers of biotech traits, genetic technologies and bioinformatics software. Based on our experience with customers, we believe the primary competitive factors in the seed industry are yield, product quality, performance, scale, price, reliable supply and sustainability. We believe that the competitive factors affecting the market for our Persephone software include product functionality and features, performance, price, ease of product implementation and quality of customer support services. We believe that our products and services currently compete favorably with respect to such factors. However, we may not be able to maintain our competitive position against current and potential competitors.
In the seed industry, our principal competitors may include major international agrochemical and agricultural biotechnology corporations, such as Advanta India Limited, The Dow Chemical Company, Monsanto Company, Pioneer Hi-Bred (DuPont), KWS Saat AG and Syngenta AG, all of which have substantially greater resources to dedicate to research and development, production or marketing than we have and some of which are selling competitive products in our markets. We also face direct competition from other seed companies, biotechnology companies, and from academic and government research institutions. In the genomics and bioinformatics market, we face direct competition from academic and government-funded research institutions as well as commercial software developers. In addition, well established companies, such as Illumina, Inc., F.Hoffmann-La Roche Ltd. and Google Inc., may expand the scope of their current analytical software and services to include visualization and exploration functions and features similar to Persephone. We are unable to predict what effect evolution of these industries and potential new entrants may have on price, selling strategies, intellectual property or our competitive position.
Regulatory Matters
Some of our products and operations are subject to complex regulations.
U.S. Regulatory Process for Our Biotechnology Products
Under the Plant Protection Act of 2000, regulatory approval is required before the introduction, including the environmental release, interstate movement, and importation, of certain genetically engineered organisms, which encompasses many of our biotechnology products. The primary U.S. regulatory agency overseeing field testing and deregulation for commercialization of our biotechnology products is the United States Department of Agriculture, or USDA. Should our products intended for the U.S. market include herbicide-tolerance or pesticidal traits, they would fall under the additional regulatory oversight of the Environmental Protection Agency, or EPA. Moreover, review by the Food and Drug Administration, or FDA, would be required for our biotechnology products should they be intended for food or animal feed uses. The Biotechnology Regulatory Services, or BRS, within the USDA’s Animal and Plant Health Inspection Service, or APHIS, has direct oversight of the field testing and deregulation of our biotechnology products. The permitting process for the establishment of initial field tests typically ranges from two to four months, but can be significantly longer for novel products or circumstances. If successful, APHIS authorizes field testing for a period in a specific location. We routinely apply to APHIS for field testing permits for our biotech traits, and have received the necessary permit for the 2014 growing season.
| 18 |
We must petition APHIS to deregulate certain of our biotechnology products before being able to commercialize the product. The petition process is a multi-year process that varies based on a number of factors, including the extent of the supporting information required, the nature and extent of review by APHIS, including the type and scope of the environmental review conducted, and the number and types of public comments received. Deregulation of a product is not a guaranteed outcome when a petition to deregulate a biotechnology plant is submitted to APHIS. Some of our biotechnology products are not regulated by APHIS. For instance, at our request, APHIS confirmed to us that, based on our description of the origin and development of certain of our biotech traits, certain experimental sorghum and switchgrass lines were not regulated articles. We believe that the ruling from APHIS will make it more cost-effective for us to develop these traits in energy and forage crops. As a member of the Excellence Through Stewardship organization, we continue to follow standard stewardship procedures for field evaluations of traits that have been granted non-regulated status by APHIS. Such traits may still be subject to other applicable regulatory authorities such as EPA and FDA.
Brazilian Regulatory Process for Our Biotechnology Products
In Brazil, the approval of biotechnology products is regulated by the National Technical Commission of Biosafety, Comissao Tecnica Nacional de Biosseguranca, or CTNBio, under the Ministry of Science and Technology. The application process for approval of a biotechnology product is generally an iterative process with the applicant providing data for review and consideration as requested by CTNBio. Prior to commercialization, biotechnology products must also be approved by the National Biosafety Council, or CNBS, which reviews any socio-economic aspects or national interests that may be implicated. In March 2012, we received a Certificate of Quality in Biosafety from CTNBio, which allows us to submit requests to import and evaluate plants with traits developed through biotechnology at our plant breeding facility in Centralina, Minas Gerais. We have not obtained approval in Brazil for field trials of our biotech traits, however, we are conducting such field trials in the U.S. and other countries. Our current commercial product offerings in Brazil do not include biotech traits and, therefore, are not subject to CTNBio oversight.
European Regulatory Process for Our Biotechnology Products
The European Union, or EU, has established a legal framework for activities involving what it describes as “genetically modified
organisms,” or GMOs, and some of our biotechnology products will fall within the scope of this legislation. Product development
field trials and commercial introduction are primarily governed by European Directive 2001/18/EC and, in cases where our biotechnology
products or derivatives thereof are intended to be used as food or feed, or could end up in food or feed, Regulation (EC) No 1829/2003.
Under EU legislation, regulatory approval is required before conducting product development field trials or commercially introducing
such products. The legislation also provides principles for environmental and food safety risk assessment by expert advisory panels.
While approval procedures within the EU are harmonized, there are differences among member states. The GMO regulatory framework
itself as well as guidance and recommendations from expert advisory panels are also updated regularly. In addition, the political
acceptance of biotech traits crops is known to differ considerably between member states and between consecutive governments in
a member state. Therefore, it is not possible to predict the outcome of any application made in the EU. Our current products offerings
in the EU do not include biotech traits and are not subject to regulatory oversight for GMOs. However, we do anticipate introducing
biotechnology products in the EU in the future.
Other Regulation
Phytosanitary Certification. Nearly all countries, including the United States and Brazil, and many local jurisdictions, require phytosanitary certificates to import seed or plant materials. These certificates, issued by government agricultural inspectors where seeds or plants are produced or packaged, attest that seeds or plants are clean, free of prohibited impurities and have been tested for the presence of various pathogens that can be carried in or on the seeds or plant tissue. We obtain such certificates when necessary, including in connection with the use of our seeds for research or sample testing.
| 19 |
Seed and Plant Variety Registration. Seed and plant variety registration provides an organized system for protecting seed and plant variety owners as well as growers from misleading marketing practices. Registration of seed and plant varieties is voluntary in the United States under the Federal Seed Act. Applicants must attest that their product is phenotypically unique; that is, verifiably different from varieties that currently exist in the market. A similar system exists in Brazil, the European Union and many other countries; however, the registration process itself may be more regulated, and is sometimes required prior to the commencement of seed sales. In Brazil, sorghum requires two seasons of trial data to be registered, which must be completed prior to the commencement of sales. We have received the necessary governmental variety registrations for the sorghum varieties we are marketing in Brazil. Similarly, in the European Union, two years of field trials with a national authority are typically required to receive registration. Registration is required prior to the commencement of sales for new sorghum seed varieties; there is no registration requirement for switchgrass or miscanthus at this time.
Regulation of Laboratory and Greenhouse Activities. The use of genetically engineered organisms in laboratory and greenhouse facilities is subject to rules intended to ensure that such organisms are handled safely and do not pose an unacceptable risk to human health or the environment. Our current biosafety level requires a low level of containment for experiments involving our plants with biotechnology traits. In addition, our laboratory and field activities inherently involve the use of potentially hazardous materials, which are subject to health, safety and environmental regulations. Our infrastructure, procedures and equipment are designed to meet our obligations under these regulations. We perform recurring internal and third-party audits and provide employees ongoing training and support, as required.
Employees
As of November 7, 2014, we had 81 full-time employees. We consider our employee relations to be good. None of our U.S. employees are represented by a labor union or collective bargaining agreement.
About Ceres
We were incorporated in Delaware in March 1996 under the name Ceres, Inc. Our principal offices are located at 1535 Rancho Conejo Blvd., Thousand Oaks, CA 91320 and our telephone number is (805) 376-6500. Our website address is www.ceres.net. We do not incorporate the information on our website into this Annual Report on Form 10-K.
Available Information
We file or furnish periodic reports, including our annual reports on Form 10-K, our quarterly reports on Form 10-Q and current reports on Form 8-K, proxy statements and other information with the SEC. Such reports, proxy statements and other information may be obtained by visiting the Public Reference Room of the SEC at 100 F Street, NE, Washington, D.C. 20549, by calling the SEC at (800) SEC-0330 or by sending an email to the SEC at publicinfo@sec.gov. In addition, the SEC maintains a website (www.sec.gov) that contains reports, proxy and information statements, and other information regarding issuers that file electronically. Our reports, proxy statements and other information are also made available, free of charge, on our investor relations website at http://investor.ceres.net as soon as reasonably practicable after we electronically file such information with the SEC. References to our corporate website address in this Annual Report on Form 10-K are intended to be inactive textual references only, and none of the information contained on our website is part of this report or incorporated in this report by reference.
| 20 |
| Item 1A. | Risk Factors |
Risks Related to Our Business
We have a history of net losses; we expect to continue to incur net losses and we may not achieve or maintain profitability.
With the exception of the fiscal years ended December 31, 2003, 2005 and 2006, we have incurred net losses each fiscal year since our inception. As of August 31, 2014, we had an accumulated deficit of $303.9 million. We expect to incur additional losses for at least the next several years as we continue move forward with our commercialization activities, invest in our research and development programs and develop new products. The extent of our future net losses will depend, in part, on our product sales growth and revenue from collaborations and government grants, and on the level of our operating expenses. To date, substantially all of our revenue has been derived from collaboration agreements and government grants, and we have had very limited revenue from seed sales. Over the next several years, we expect our revenue will shift from being derived primarily from collaborations and government grants to product sales. However, due in part to the variability of the yields achieved in previous seasons in Brazil and the slower than expected development of the market for cellulosic biofuels and biopower, we expect product sales to grow more modestly than originally anticipated. While we achieved favorable results with multiple products in multiple regions during the 2013-2014 growing season in Brazil, further optimizations and additional hybrids will be needed to consistently achieve economically attractive yields across wide-area plantings, and it is difficult to predict the performance of new products until they have been evaluated for multiple years in targeted regions. We expect that the 2014-2015 growing season in Brazil will be necessary to validate results achieved in the 2013-2014 growing season in Brazil. Additional growing seasons beyond the 2014-2015 season may be required to fully demonstrate this yield performance across numerous geographies and for our products to gain broad adoption. Our ability to generate future revenue will depend upon our ability to meet our obligations under our collaborations and government grants, to enter into new collaborations or out-licensing agreements and to successfully commercialize our products. The market for seeds for dedicated energy crops is relatively new and still developing and our success in generating revenue from product sales depends in large part on the success of our sorghum products in Brazil and in the future on the adoption of other crops, traits or genetic technologies. Even if we do achieve profitability, we may not be able to sustain or increase our profitability on a quarterly or annual basis.
Our products are in the early stages of commercialization and we have generated minimal sales from our products.
Our existing products are in the early stages of commercialization and our efforts to commercialize our products may not be successful. Our product sales for the years ended August 31, 2013 and August 31, 2014 were minimal and were derived mainly from sales to third parties that were evaluating our products. We began selling seeds in the Brazilian market in November 2011 and in the U.S. in 2009. As of August 31, 2014, product sales, which include both seed sales and biomass sold under our various sales incentive and promotional programs, have been approximately $1.6 million in the aggregate. We are also focusing on additional new market opportunities, including the forage feed and bioinformatics software markets. We cannot guarantee that as a new entrant to these markets, we will be successful in commercializing our products and services, recouping development and commercialization-related expenses, or competing against established market participants. If we are not able to bring our existing products or new products and services with significant commercial potential to market in a timely manner, we will not be successful in building a sustainable or profitable business.
One of our largest immediate commercial opportunities is the Brazilian ethanol and biopower market, where we have only completed a limited number of evaluations and commercial-scale production of our sorghum products.
Since 2010, we have completed various commercial-scale evaluations of our sorghum products in Brazil with ethanol mills and mill suppliers. During this time, various plantings suffered from reduced yields due wholly or in part to weather, soil conditions, planting and harvest timing, product adaptation, failure to follow our crop management recommendations or other causes. To the extent that the results of our plantings wholly or in part do not meet our collaborators’ expectations, we may experience a significant delay in commercializing our sorghum products in Brazil. Moreover, lower than expected yields could discourage the mill owners that planted our seeds from planting our seeds again, at similar or greater scale, and discourage other mill owners from trying our sorghum products. For example, total plantings of our sorghum products covered approximately 1,000 hectares for the 2013 – 2014 sorghum growing season and approximately 3,000 hectares for the previous season, both of which are less than we originally anticipated. The future success of our sorghum products in Brazil will depend on our customers’ ability or willingness to devote proper resources, including land, to our products and the timing of planting and harvesting of our sorghum products, as well as the development of a supply chain for sorghum biomass. To the extent that our sorghum products do not result in expected yields, we may have difficulty convincing customers to purchase or trial our current and future sorghum products.
| 21 |
The markets for our dedicated energy crops are not well established and may take years to develop or may never develop and our growth depends, to a large extent, on customer adoption of our dedicated energy crops.
We sell proprietary seeds to produce dedicated energy crops for the renewable energy market, which is not well established and is evolving. Although our sweet sorghum products are targeted for use as a feedstock to produce ethanol, ethanol has historically been produced from corn in the United States and sugarcane in Brazil and we will need to continue to demonstrate on a commercial scale that sweet sorghum can reliably be used as a cost-efficient feedstock for ethanol production. To date, we have demonstrated on a limited scale that our products can achieve economically attractive yields within their area of adaptation, provided that our crop management protocols are followed and plantings receive adequate rainfall; however, further optimizations and additional hybrids will be needed to consistently achieve economically attractive yields across wide-area plantings. Based on industry feedback, we believe that minimum average yields in the range of 2,500 to 3,000 liters of ethanol per hectare will be necessary to achieve broad adoption. While we achieved yields in this range in the 2013-2014 growing season in Brazil with multiple products in multiple regions, we expect that the 2014-2015 growing season in Brazil will be necessary to validate results. Additional growing seasons beyond the 2014-2015 season may be required to fully demonstrate this yield performance across numerous geographies and for our products to gain broad adoption. Cellulosic biofuels have been produced on a limited scale from woody biomass, such as wood chips, or agricultural residues, and we will need to demonstrate on a commercial scale that biomass grown from our seed products, including switchgrass and high biomass sorghum, can be used as cost-efficient feedstock for the production of biofuels, biopower and other bio-based products.
Currently the market for dedicated energy crops is not well established, primarily because of the lack of infrastructure to support the development of this market, including the lack of commercial-scale production facilities capable of converting cellulosic feedstocks, referred to as cellulosic biorefineries. Existing first-generation ethanol biorefineries are not capable of using cellulosic feedstocks to produce ethanol. The development of this industry is also dependent, in large part, upon the efforts of many companies to improve conversion technologies which will play a significant role in enabling more cost-effective means of converting biomass into energy. A delay in the construction of cellulosic biorefineries or a failure to meaningfully improve conversion technologies could curtail one of our significant market opportunities. Even if cellulosic biorefineries are established in the future, they may elect to use agricultural residues, waste material or woody biomass as feedstocks rather than dedicated energy crops, resulting in the lack of a robust market for our products.
Traditionally the market for biopower, which is the generation of electric power from combusting biomass, has been fueled mainly by bio-based waste products from the paper, timber and sugarcane industries. In the U.S. and Europe, we believe that expansion of this market will be driven by governmental policies such as additional state and new federal mandates that require a certain percentage or absolute amount of electricity be generated from renewable sources by specified dates or production tax credits for co-firing biomass. We cannot predict the effect that existing legislation or the lack of legislation will have on the development of the biopower market in the United States or European. To the extent that the market does not develop or biopower producers elect to continue to rely on bio-based waste products from the paper and timber industries, rather than dedicated energy crops, our market opportunity will be limited.
| 22 |
Our crops are new and most growers will require substantial instruction to successfully establish, grow and harvest crops grown from our seeds.
As part of our product development activities and customer support, we provide agricultural producers and biomass procurers with information and protocols regarding the establishment, management, harvest, transportation and storage of our energy crops for use in bioenergy. In addition to seed selections, such crop management recommendations may include equipment selection, planting and harvest timing, application of crop protection chemicals or herbicides and storage systems. However, during previous growing seasons in Brazil, variability in yield was due in part to deviations from our recommended crop management practices. As a result, in certain cases, we participated directly in, and incurred certain unreimbursed costs for, seed, crop production and agronomy services in Brazil. We continue to provide this support in the 2014 – 2015 growing season in Brazil. While some of our crops, such as sorghum and switchgrass, have been grown for other uses, the crop management practices required for energy crop production are still new and are evolving. Our general or specific protocols may not apply to all circumstances, may not be sufficient, or may be incorrect, leading to reduced yields, crop failures or other production problems or losses by our customers or collaborators. Such failures may harm our customer or collaborator relationships, our reputation and our ability to successfully market our products, and may lead to liability claims against us. Further, the use of our seeds may require a change in current planting, rotation or agronomic practices.
Methodologies and assumptions for calculating ethanol yields per hectare, a key performance metric among our mill customers in Brazil, are not standardized and therefore subject to greater variation and interpretation than results from a controlled environment.
Mills use a variety of measurements and a complex formula to determine ethanol yields per hectare, which we believe is a key metric in determining the profitability of sweet sorghum and its relative attractiveness to other competing opportunities. When calculating ethanol yield per hectare, mills consider the number of metric tons of sweet sorghum biomass per hectare and the amount of fermentable sugars per metric ton to determine the volumes of ethanol that can be produced. Methodologies and assumptions used in these calculations can vary, and are therefore subject to greater variability than a controlled environment. In addition, methodologies and assumptions commonly utilized in sugarcane-to-ethanol production have been shown to underestimate actual ethanol yields from sweet sorghum. Should mills rely upon methodologies and assumptions that underreport actual ethanol yields per hectare, our products may be disadvantaged, and we may have difficulty convincing mills or their suppliers to purchase or trial our current and future sorghum products.
Our sales incentive and promotional programs for the 2014 – 2015 season in Brazil may result in costs in excess of our seed sales revenue.
For the 2014 – 2015 sorghum growing season in Brazil, we have offered customers the opportunity to participate in sales incentive and promotional programs. In connection these programs, we expect to incur additional costs of sales for crop management and agronomy support services, which we expect to be reimbursed from revenue generated through biomass sales. Depending on biomass yields per hectare, we may incur certain unreimbursed costs for seed, crop production and agronomy services provides under these programs. While we believe that this program will facilitate the adoption of our products in Brazil, we have limited experience with the performance of these products at a large scale as well as what level of yield shortfalls to expect across wide area plantings, which are subject to the vagaries of weather and the environment. During the 2012 – 2013 season in Brazil, crop management services performed under our promotional programs totaled $1.7 million, which was greater than our product sales in Brazil. Customers may insist that we repeat these sales incentive and promotional programs in future seasons, exposing us to ongoing costs.
Our biotech products are not yet available for commercial use.
Our business strategy going forward includes the introduction of crops with genetically engineered, or biotech, traits. The commercial development of biotech traits in commercial crops is a multi-year process. Following transformation, when the selected gene is inserted in a target crop, the resulting plants are evaluated in the greenhouse for one to two years, and then in the field to confirm results for two to four years. Following field trials, specific gene-trait combinations are typically selected and, if required, submitted for regulatory approval, or deregulation, which has historically been a multi-year process in the United States and Brazil. Assuming these averages, we believe that we could introduce our first regulated biotech trait or traits to the market in 2018 at the earliest. By contrast, our existing sweet sorghum, switchgrass and high biomass sorghum products have all been created through the use of conventional and marker-assisted breeding. As a result, even if these products are successfully sold and adopted by customers, they do not necessarily demonstrate our ability to successfully develop, market and sell biotechnology products. If we are not able to bring our existing products or new products with significant commercial potential to market in a timely manner, we will not be successful in building a sustainable or profitable business.
| 23 |
The pricing for our products, including our sorghum products for the Brazilian market, may be negatively affected by factors outside our control.
Our products are in the early stages of commercialization and there is no established market for them. We have based the pricing of our products on our assessment of the value that our products provide to the customer, rather than on the cost of production. We may include trait fees in our seed prices, but our potential customers may be unwilling to pay such fees. If our customers attribute a lower value to our products than we do, they may not be willing to pay the premium prices we expect to charge. Pricing levels may also be negatively affected if our products are unsuccessful in producing the yields we expect. In addition, if our competitors are able to develop competitive products and offer them at lower prices, we may be forced to lower our prices.
The customers we are targeting in Brazil are generally large mill owners and agri-industrial facilities with long operating histories. They will have significant leverage in negotiating commercial relationships with us. As a result, we do not know whether these pricing negotiations will result in adequate margins or accurately reflect our pricing strategies, which could have a material adverse effect on our results of operations.
Our business will be adversely affected if the field trials being conducted by our collaborators or potential customers fail to perform as expected.
We and our collaborators and potential customers are currently conducting field trials of our products in various geographies around the world. We have limited control over field trials that are conducted by third parties and are dependent on their ability to follow our suggested protocols. There are various reasons these trials may fail to succeed, including weather, disease or pests, planting our seeds too late in the growing seasons or the incorrect use of fertilizers, and we have in the past conducted trials that we believe failed to fully meet the expectations of our collaborators. Statements by our collaborators or potential customers about negative field trial experiences could harm our reputation and the decision by these parties not to proceed with large-scale trials or seed purchases based on negative results could harm our business, revenue and profitability.
Environmental factors, including weather, moisture, and pest infestations, may negatively affect the crops grown from our seeds or our seed inventories.
The plants grown from our seeds are subject to the vagaries of the weather and the environment, either of which can reduce crop yields. Weather conditions and natural disasters, such as heavy rains, hurricanes, hail, floods, tornados, freezing conditions, drought, fire or other natural disasters, can affect the timing of planting or harvesting and the acreage planted, as well as yields. The effects of disease, pests, fungi, bacteria and insect infestations can also be unpredictable and devastating to crops, potentially rendering all or a substantial portion of the affected harvests unsuitable for use. In addition, our crops and harvests may be adversely affected by climate change resulting from global warming, including changes in precipitation patterns and the increased frequency of extreme weather events. Each of these weather and environmental factors affects geographic regions differently. Should these or other environmental factors adversely affect the crops grown from our products, growers may be unable or unwilling to purchase our seeds or they may choose to purchase other seeds deemed better adapted to the particular climatic or environmental conditions they are facing. For example, South-Central Brazil experienced a significant drought during the 2011 – 2012 growing season, which resulted in reduced yields and increased variability in the performance of our sweet sorghum products. This experience adversely affected the demand for our seeds.
The quality of our seed inventory could deteriorate due to a variety of factors, including the passage of time, temperature variations, moisture, insects, fungi, bacteria, disease or pests. If the quality of our seed inventory were to deteriorate below an acceptable level, the value of our seed inventory would decrease significantly and we might not be able to meet product demand. Should a substantial portion of our seed inventory be damaged by moisture, insects, fungi, bacteria, disease or pests, our business and financial condition could be materially and adversely harmed.
| 24 |
Our seed business is highly seasonal and subject to weather conditions and other factors beyond our control, which may cause our sales and operating results to fluctuate significantly.
The sale of seeds is dependent upon planting and growing seasons, which vary from year to year, and are expected to result in both highly seasonal patterns and substantial fluctuations in quarterly sales and profitability. Our product sales for the years ended August 31, 2012, August 31, 2013 and August 31, 2014 were minimal and, accordingly, we have not yet experienced the full nature or extent to which our business may be seasonal. We expect that sales of our seeds in Brazil will typically be higher in our first and second fiscal quarters, due to the timing of the planting decisions made by our customers. As we increase our sales in our current markets, and as we expand into new markets in different geographies, it is possible that we may experience different seasonality patterns in our business. Weather conditions and natural disasters, such as heavy rains, hurricanes, hail, floods, tornadoes, freezing conditions, drought or fire, also affect decisions by our customers about the types and amounts of seeds to plant and the timing of harvesting and planting such seeds. Disruptions that cause delays by our customers in harvesting or planting can result in the movement of orders to a future quarter, which would negatively affect the quarter and cause fluctuations in our operating results.
A decline in the price of petroleum-based products may reduce the demand for many of our products and adversely affect our business.
We believe that some of the projected demand for renewable alternatives to fossil fuels is a result of the high cost of oil and petroleum. We anticipate that most of our product sales will be driven by the demand for alternatives to petroleum-based products. When the price of oil falls, and periods of lower oil prices are sustained, demand for biofuels or other bio-based products could also decline. Declining oil prices, or forecasts of a future decline in oil prices, may adversely affect the prices for renewable energy products and the prices we can obtain from our potential customers or cause potential customers to not buy our products, which could materially and adversely affect our operating results. We believe that our market opportunity to sell sweet sorghum and high biomass sorghum seeds in Brazil is based, at least in part, on the shortages Brazil has encountered in producing sufficient quantities of sugarcane-based ethanol and electric power to satisfy local demand. We cannot predict whether these shortages will be sustained or whether the Brazilian market will experience periods of ethanol and power shortages in the future.
A significant increase in the price of sugar relative to the price of ethanol may reduce demand for our sweet sorghum and may otherwise adversely affect our business.
We are marketing our sweet sorghum varieties in Brazil as a “drop-in” feedstock to complement existing feedstock supplies and extend the operating season of Brazilian sugarcane-to-ethanol mills. However, if the price of sugar, which is produced from sugarcane and which cannot be produced from sweet sorghum alone today, rises significantly relative to the price of ethanol, it may become more profitable for ethanol mill operators to grow sugarcane even in adverse conditions, such as through the expansion of sugarcane fields to marginal land or the extension of the sugarcane harvesting season. During sustained periods of significantly higher sugar prices, demand for our seeds may decrease, which could materially and adversely affect our operating results.
The cropland made available by our customers for sorghum production may be limited by the relative attractiveness of producing other crops.
The decision to devote land and resources to a particular crop is dependent on many factors, some of which are outside of our control. To the extent that mill owners and growers select other potentially more profitable crops over our products, the cropland available for our products within a given geography and the overall size of our market opportunity may be limited. For example, increases in the price of certain commodities, such as soybean and corn, may encourage growers to dedicate more land to these crops instead of sorghum. Moreover, while our sorghum products are intended to be produced as a complementary crop to sugarcane production, certain sugarcane cropping systems in Brazil could limit the land available for sorghum. For example, mill owners and growers may endeavor to maximize sugar yields by growing sugarcane for approximately 18 months rather than the more typical 12 to 15 months. Such plantings would typically occur at the same time as our sorghum plantings, and depending on the relative costs and expected yields of each crop, could limit the number of hectares that mill owners and growers plant with our products.
| 25 |
Our failure to accurately forecast demand for our seeds could result in an unexpected shortfall or surplus that could negatively affect our results of operations or our brand.
Because of the length of time it takes to produce commercial quantities of seeds, we must make seed production decisions well in advance of product bookings. For example, we must determine our expected demand for our sorghum varieties approximately six months in advance of delivery, on average, while growers or mill operators make seed purchase decisions sometimes as late as 30 days in advance of planting. Our ability to accurately forecast demand can be adversely affected by a number of factors outside of our control, including changes in market conditions, environmental factors, such as pests and diseases, and adverse weather conditions. A shortfall in the supply of our products may reduce product sales revenue, damage our reputation in the market and adversely affect customer relationships. Any surplus in the amount of seed we have on hand, may negatively impact cash flows, reduce the quality of our inventory and ultimately result in write-offs of inventory. Any failure on our part to produce sufficient inventory or overproduction of a particular product could harm our business, results of operations and financial condition. Additionally, our customers may generally cancel an order or request a decrease in quantity at any time prior to delivery of the seed, which may lead to a surplus of our products. Even after delivery, a customer may occasionally return our seeds.
The performance of our sweet sorghum products in Brazil may be adversely affected by delays to the start of the Brazilian ethanol production season.
Once a mill begins to crush sugarcane or other feedstock, it generally seeks a continuous supply of the feedstock to run its mill without interruption until the feedstock is depleted. Should the sugarcane harvest season be delayed due to weather or other factors, a mill may choose to delay the harvest of sweet sorghum to avoid the downtime caused by a supply gap between a season-extending crop like sweet sorghum and sugarcane, which occurred during the 2011 – 2012 and 2012 – 2013 seasons. Since our sweet sorghum grows quickly and maintains its peak sugars for one to two weeks, depending on growing conditions, delays in harvesting beyond this time period may result in lower sugar volumes per hectare as well as other potential production issues as mature plants begin to decline and may lodge, a condition where the stems bend or break. Such issues could impact growers’ perception of the quality or usefulness of our products and, as a result, their willingness to purchase these products from us in the future.
Our product development efforts use complex integrated technology platforms and require substantial time and resources to develop and our efforts may not be successful or the rate of product improvement may be slower than expected.
The development of successful agricultural products using complex technology discovery platforms such as ours requires significant levels of investment in research and development, including field testing, to demonstrate their effectiveness and can take several years or more. For the fiscal year ended August 31, 2014, we spent $14.2 million on research and development. We intend to continue to spend significant amounts on research and development in the future to continue to improve the performance of our products and to develop new products. Our substantial investment in research and development may not result in significant product revenues, particularly over the next several years. To date, companies have developed and commercialized relatively few dedicated energy crops, and no dedicated energy crops with biotech traits.
Development of new or improved agricultural products involves risks of failure inherent in the development of products based on innovative and complex technologies. These risks include the possibility that:
| · | our products will fail to perform as expected in the field or fail to perform consistently; |
| · | our products will not receive necessary regulatory permits and governmental clearances in the markets in which we intend to sell them; |
| · | our products will be viewed as too expensive by our potential customers compared to competitive products; |
| · | our products will be difficult to produce on a large scale or will not be economical to grow; |
| · | proprietary rights of third parties will prevent us, our collaborators, or our licensees from marketing our products; and |
| 26 |
| · | third parties may develop superior or equivalent products. |
Loss of or damage to our germplasm collection would significantly slow our product development efforts.
We have access to comprehensive collections of germplasm for sorghum, switchgrass and miscanthus, in part, through strategic collaborations with leading institutions. Germplasm comprises collections of genetic resources covering the diversity of a crop, the attributes of which are inherited from generation to generation. Germplasm is a key strategic asset since it forms the basis of plant breeding programs. To the extent that we lose access to these germplasm collections because of the termination or breach of our collaboration agreements, our product development capabilities could be negatively impacted. In addition, loss of or damage to our germplasm collections would significantly impair our research and development activities. Although we restrict access to our germplasm at our research facilities to protect this valuable resource, we cannot guarantee that our efforts to protect our germplasm collection will be successful. The destruction or theft of a significant portion of our germplasm collection would adversely affect our business and results of operations.
The successful commercialization of our products depends on our ability to produce high quality seeds cost-effectively on a large scale.
The production of commercial-scale quantities of seeds requires the multiplication of the seeds through a succession of plantings and seed harvests, and if the product is a hybrid, it must be produced from parental lines, which are mated under controlled conditions. The cost-effective production of high quality, high-volume quantities of some of our products depends on our ability to scale our production processes to produce seeds in sufficient quantity to meet demand. We cannot assure you that our existing or future seed production techniques will enable us to meet our large-scale production goals cost-effectively for the products in our pipeline. Even if we are successful in developing ways to increase seed yields and enhance seed quality, we may not be able to do so cost-effectively or on a timely basis, which could adversely affect our ability to achieve profitability. If we are unable to maintain or enhance the quality of our seeds as we increase our production capacity, including through the expected use of third parties, we may experience reductions in customer demand, higher costs and increased inventory write-offs.
We depend, in part, on third parties to produce our seeds.
We produce commercial seed either on leased land managed by us or with contract seed producers. Our primary production sites are located in the United States and Brazil. We also multiply seeds in other countries in North and South America. In order to meet increased demand for our seeds, we will need to enter into additional land leases or arrangements with contract seed producers. If we need to engage contract seed producers, we may not be able to identify suitable producers in a specific region and if we do, we do not know whether they will have available capacity when we need their production services, that they will be willing to dedicate a portion of their production capacity to our products or that we will be able to enter into an agreement with them on acceptable terms. If any contract seed producer that we engage fails to perform its obligations as expected or breaches or terminates their agreements with us, or if we are unable to secure the services of such third parties when and as needed, we may lose opportunities to generate revenue from product sales.
We are at the beginning stages of developing our Blade brand and we have limited experience in marketing and selling our products and will need to expand our sales and marketing infrastructure.
We are in the beginning phases of building brand awareness for our crops. To date, we have had limited experience selling our products. We currently have limited resources to market and sell our products on a commercial-scale across various geographic regions. As of November 7, 2014, we had approximately 10 employees in various sales, marketing and business development functions. Developing our sales and marketing infrastructure and gaining the necessary expertise will require that we hire additional sales and marketing personnel, which could take longer than we expect and may require significant resources. We may be unable to grow our sales and marketing or business development infrastructure to adequately cover the geographic regions where we see the most opportunity, which could slow the adoption of our products and the growth of product revenue.
| 27 |
We face significant competition in all areas of our business, and if we do not compete effectively, our business will be harmed.
The renewable energy, seed, agricultural biotechnology and genomics industries are rapidly evolving and new competitors with competing technologies and products are regularly entering the market. We expect to compete with other providers of seed and vegetative propagation materials in the market for our crops as well as other developers of biotech traits, genetic technologies and bioinformatics software.
We anticipate that as our seed products gain market acceptance, competitors will be attracted to this opportunity and produce their own seed varieties. Second, we believe that new as yet unannounced crops will be introduced into the renewable energy market and that existing energy crops will attempt to gain even greater market share. Existing crops, such as corn, sugarcane and oil palm trees, currently dominate the biofuels market. As new products enter the market, our products may become obsolete or our competitors’ products may be more effective, or more effectively marketed and sold, than our products. Changes in technology and customer preferences may result in short product life cycles. To remain competitive, we will need to develop new products and enhance and improve our existing products in a timely manner. Our failure to maintain our competitive position could have a material adverse effect on our business and results of operations.
In the seed industry, our principal competitors may include major international agrochemical and agricultural biotechnology corporations, such as Advanta India Limited, The Dow Chemical Company, Monsanto Company, Pioneer Hi Bred (DuPont), KWS Saat AG and Syngenta AG, all of which have substantially greater resources to dedicate to research and development, production, and marketing than we have and some of which are selling competitive products in our markets. We also face direct competition from other seed companies and biotechnology companies, and from academic and government research institutions. New competitors may emerge, including through consolidation within the seed or renewable energy industry. We are unable to predict what effect evolution of the industry may have on price, selling strategies, intellectual property or our competitive position.
In the broader market for renewable energy, we expect to face competition from other potential feedstocks, such as biomass residues from food crops, forestry trimmings and municipal waste materials, other renewable alternatives, such as algae, solar and wind-generated electricity, and other energy crops. There are multiple technologies that process biomass into biofuels and we have yet to determine compatibility of our feedstocks with all of these processes. Our failure to develop new or enhanced products that are compatible with these alternative technologies, or a lack of market acceptance of our products as the common denominator in a broad array of bio-based products that are alternatives to petroleum based products, could have an adverse effect on our business. Significant developments in alternative technologies, such as the inexpensive and large-scale storage of solar or wind-generated energy, may materially and adversely affect our business in ways that we do not currently anticipate.
In the genomics and bioinformatics market, we face direct competition from academic and government-funded research institutions as well as commercial software developers. In addition, well established companies, such as Illumina, Inc., F.Hoffmann-La Roche Ltd. and Google Inc., may expand the scope of their current analytical software and services to include visualization and exploration functions and features similar to Persephone. We are unable to predict what effect evolution of these industries and potential new entrants may have on price, selling strategies, intellectual property or our competitive position.
A portion of our revenue to date is generated from our collaboration agreements and we must meet our obligations under these agreements in order to be entitled to the revenue streams from these agreements.
Historically, a significant portion of our revenue has been generated from payments to us under collaborative research agreements with third parties and we continue to opportunistically pursue new strategic collaborations. We are obligated under these agreements to perform research activities over a particular period of time. Certain of our agreements may entitle us to milestone payments in the event the specified milestone is met. If we fail to perform our obligations under these agreements or any new collaborative research agreements we may enter into in the future, our revenues may decrease, or our collaborative partners may terminate or fail to renew the agreements. In addition, any of our collaborators may fail to perform their obligations as expected, which may hinder our research and development efforts. We and our collaborators may disagree as to which party had rights to intellectual property developed under the agreements. Disagreements with our collaborators could develop and any conflict with a collaborator may negatively affect our relationship with one or more existing collaborators or our ability to enter into future collaboration agreements.
| 28 |
Our results of operations will be affected by the level of royalty payments that we are required to pay to third parties.
We are a party to license agreements with third party collaborators, including Texas A&M and the Noble Foundation, that require us to remit royalty payments to these third parties if we incorporate their licensed intellectual property into our products. While we are currently working on developing numerous products that incorporate aspects of this intellectual property, we have to date only sold small amounts of such products. The amount of royalties that we could owe under these license agreements is a function of our sales and the applicable royalty rates depend on a number of factors, including the portion of our third-party collaborator’s intellectual property that is present in our products.
Because of our historical limited sales volume, we have had little experience in calculating royalties under these license agreements and it is unclear exactly how much of this licensed intellectual property will be included in any final products we offer for commercial sale. As a result we cannot precisely predict the amount, if any, of royalties we will owe in the future. If, once we commence sales of these products, we determine that the products include more intellectual property of our third party collaborators than we had previously determined, or if our calculations of royalty payments are incorrect, we may owe more royalties, which could negatively affect our results of operations. As our product sales increase, we may, from time-to-time, disagree with our third party collaborators as to the appropriate royalty rate and the resolution of such disputes may be costly and may consume management’s time. Furthermore, we may enter into additional license agreements in the future, which may also include royalty payments.
We are also a party to license agreements pursuant to which we have received licenses on certain intellectual property related to biotechnology products. When we commence sales of our biotechnology products in the future, or grant licenses to third parties to commercialize such products, we will be required to remit royalty payments to the parties from whom we have licensed intellectual property that covers such products.
A significant portion of our revenue to date is generated from government grants and continued availability of government grant funding is uncertain and contingent on compliance with the requirements of the grant.
Historically, a significant portion of our revenue has been generated from payments to us from government entities in the form of government grants whereby we are reimbursed for certain expenses incurred in connection with our research and development activities, subject to our compliance with the specific requirements of the applicable grant, including rigorous documentation requirements. To the extent that we do not comply with these requirements, our expenses incurred may not be reimbursed. Any of our existing grants or new grants that we may obtain in the future may be terminated or modified.
Our ability to obtain grants or incentives from government entities in the future is subject to the availability of funds under applicable government programs and approval of our applications to participate in such programs. The application process for these grants and other incentives is highly competitive. We may not be successful in obtaining any additional grants, loans or other incentives. Recent political focus on reducing spending at the U.S. federal and state levels may continue to reduce the scope and amount of funds dedicated to renewable energy products, if such funds will continue to be available at all. To the extent that we are unsuccessful in being awarded any additional government grants in the future, we would lose a potential source of revenue.
Our government grants may subject us to government audits, which could expose us to penalties.
We may be subject to audits by government agencies as part of routine audits of our activities funded by our government grants. As part of an audit, these agencies may review our performance, cost structures and compliance with applicable laws, regulations and standards and the terms and conditions of the grant. If any of our costs are found to be allocated improperly, the costs may not be reimbursed and any costs already reimbursed for such contract may have to be refunded. Accordingly, an audit could result in a material adjustment to our results of operations and financial condition. Moreover, if an audit uncovers improper or illegal activities, we may be subject to civil and criminal penalties and administrative sanctions.
| 29 |
The biofuel and biopower industries are highly dependent upon government subsidies and economic incentives, and any changes in such subsidies or incentives could materially and adversely affect the growth of the industry and our ability to sell dedicated energy crops.
The market for renewable energy in the United States is heavily influenced by government subsidies, economic incentives and tax credits and other regulatory initiatives that impact the production, distribution and adoption of renewable energy products. For example, the United States Renewable Fuel Standard program, or RFS, called for 18 billion gallons of the liquid transportation fuels sold in 2014 to come from renewable biofuels. The U.S. Energy Independence and Security Act of 2007 increases the volume of renewable fuel required to be blended into transportation fuel to 36 billion gallons per year by 2022. Of this amount, the RFS currently states that 16 billion gallons of renewable biofuels used annually by 2022 must be cellulosic biofuel, such as could be created by our switchgrass product. The RFS has been modified in the past and may be modified again in the future. In the United States, the administrator of the Environmental Protection Agency, or EPA, may waive certain renewable fuel standards to avert economic harm or in response to inadequate supply. The administrator of the EPA is also required to reduce the mandate for cellulosic biofuel use if projected supply for a given year falls below a minimum threshold for that year. For example, because the supply of cellulosic biofuel was projected to be very limited in 2014, the EPA proposed that the final volume standard for cellulosic biofuel for 2014 was 17 million gallons, well below the 1.75 billion gallon volume target originally specified in the Energy Independence and Security Act. Any reduction in, or waiver of, mandated requirements for fuel alternatives may cause demand for renewable biofuels to grow more slowly or decline. Our business strategy in the United States is based, in part, on these standards remaining in place. Waivers of, or reduction in, the RFS or similar mandates, could have a material adverse effect on our ability to successfully grow demand for our cellulosic feedstock products in the United States.
In biopower, the reduction of, or failure to implement, certain government mandates, such as Renewable Electricity Standards in the U.S. or taxes on carbon emissions, as well as incentives, subsidies and tax credits to generate electric power from low-carbon sources, may adversely affect the viability of this market opportunity in the U.S.
In addition, the United States Congress has passed legislation that extends tax credits or other economic incentives for, among other things, the production of certain renewable fuel products. For example, the United States adopted the Renewable Energy Production Tax Credit that provides federal tax incentives for renewable energy projects. We cannot provide assurances that these tax credits or other economic incentives will remain in place. Any future reduction in or phasing out or elimination of existing tax credits, subsidies and other incentives in the United States and foreign markets for renewable biofuels, or any inability of us or our prospective customers to access such credits, subsidies and other incentives, may adversely affect demand for, and increase the overall cost of our renewable transportation fuels, which would adversely affect the prospects for our business.
We believe that government incentives and economic initiatives in Europe and other countries will also affect demand for our dedicated energy crops. For example, in the United Kingdom, which is a potential export market for U.S.-grown biomass, independent power providers are required to obtain a certain portion of their power from renewable resources. Any reduction or termination of government incentives or economic initiatives outside the United States could also have a material adverse effect on our business.
Compliance with applicable government regulations, particularly with respect to biotechnology products, is time-consuming and costly.
There are certain regulatory requirements affecting the field testing and commercialization of our biotechnology products in each of the markets in which we operate. In the United States, the U.S. Department of Agriculture, or USDA, must review and deregulate many of our biotechnology products prior to commercial sale. The Biotechnology Regulatory Services, or BRS, within the USDA’s Animal and Plant Health Inspection Service, or APHIS, has direct oversight of the field testing and deregulation of our regulated biotechnology products. The deregulation process for these biotechnology products is a costly, multi-year process, with no guarantee of success. The length of the deregulation process varies based on a number of factors, including the extent of the supporting information required, the nature and extent of review by the USDA, including the type and scope of the environmental review conducted, and the number and types of public comments received. For example, after the initial filing of a petition for deregulation, the USDA may ask for additional data, including data on new areas of inquiry that might require us to conduct additional field tests or analyses, which may cause delays in the deregulation process. Deregulation of a product is not a guaranteed outcome. The USDA or other regulators may also impose costly monitoring requirements on the planting of our biotechnology products.
| 30 |
In Brazil, the commercialization of biotechnology products is regulated by the National Technical Commission of Biosafety, Comissão Técnica Nacional de Biossegurança , or CTNBio under the Ministry of Science and Technology. The approval process involves data collection and analysis, environmental impact assessments and public hearings on certain products. We anticipate introducing biotechnology products in Brazil in the future. At such time, we will be subject to the approval processes dictated by CTNBio.
We have not yet applied for deregulation for any of our biotech traits. Any delays in obtaining or failure to obtain deregulation or regulatory approval, as the case may be, for any of the biotechnology products in our pipeline could delay or prevent the commercialization of our products. Regulatory authorities can block the sale or import of our products or can impose conditions that delay production and sale of our products, or that make the sale of our products technically or commercially unfeasible.
Before the USDA will review and deregulate our biotechnology products subject to regulation, the USDA requires us to obtain permits to plant and test these products, and there are similar permitting requirements in Brazil, China and India. In determining whether to grant a field test permit and what conditions to impose, regulators consider any significant impacts that field tests may have on the environment and on endangered or threatened species. In the United States, the permitting process for the initial field tests typically ranges from two to four months, but this time period can be significantly longer for novel products or circumstances. There can be no assurance that we will not encounter material delays in the future as we test new biotechnology products. While to date our permits for our U.S. field trial locations have been obtained with minimal delays, we have not yet obtained approval for our first field trial permit request for several traits for sorghum in Brazil. Field evaluations of our traits in rice have been affected recently by regulatory delays in India as well. If we are not able to obtain the necessary field test permits or if there are significant delays in the permitting process, the commercialization of our products may be delayed or prevented and our business and results of operations may be adversely affected. A prolonged delay in the regulatory process could adversely affect our ability to generate product revenues.
Ethical, legal, environmental and social concerns about biotechnology products could limit or prevent the use of our products and technologies, which could negatively affect our ability to generate revenue.
Some of our products in development contain biotech traits. The commercial success of our products that contain biotech traits may be adversely affected by claims that biotechnology plant products are unsafe for consumption or use, pose risks of damage to the environment and create legal, social and ethical dilemmas. For example, some countries, primarily in the European Union, have instituted a de facto moratorium on the planting of some genetically engineered seeds. The import of biomass grown from genetically engineered seeds may also be regulated by the European Union. While we are not currently selling seeds containing biotech traits into the European Union, we plan to do so in the future. In addition, Brazil’s biosafety law prohibits the use, sale, registration, patenting and licensing of genetic use restriction technologies, which are a class of genetic engineering technologies that allow companies to introduce seeds whose sterile offspring cannot reproduce, preventing farmers from re-planting seeds from their harvest. While our current sweet sorghum products are not subject to this restriction, we may in the future introduce biotech traits that may be subject to such regulation. If we are not able to overcome these concerns and comply with these regulations, our products may not achieve market acceptance. Any of the risks discussed below could result in expenses, delays or other impediments to our development programs or the market acceptance and commercialization of our products that contain biotech traits. Our ability to develop and commercialize one or more of our technologies and products could be limited or prevented by the following factors:
| · | Public attitudes about the safety and environmental hazards of, and ethical concerns over, genetic research and biotechnology products, which could influence public acceptance of our technologies and products; |
| · | Public attitudes regarding, and potential changes to laws governing, ownership of genetic material, which could weaken our intellectual property rights with respect to our genetic material and discourage collaborators from supporting, developing or commercializing our products and technologies; |
| 31 |
| · | Governmental reaction to negative publicity concerning genetically engineered plants, which could result in greater government regulation of genetic research and derivative products; and |
| · | Failure to maintain or secure consumer confidence in, or to maintain or receive governmental approvals for, our products. |
We cannot predict whether or when any jurisdiction will change its regulations with respect to biotechnology products. Problems with any product could lead to increased scrutiny or regulation for our products. Limitations on the development of biotechnology products could be imposed that could delay, prevent or make more costly the development of such products, which would negatively affect our ability to commercialize products using our traits.
Advocacy groups have engaged in publicity campaigns and filed lawsuits in various countries against companies and regulatory authorities, seeking to halt biotechnology approval activities or influence public opinion against genetically engineered products. On occasion, there has been vandalism and destruction of property of companies in the biotechnology industry.
Our non-biotechnology products, the products of third parties or the environment may be negatively affected by the unintended appearance of our transgenes.
The development and commercial success of our non-biotechnology products may be delayed or negatively affected because of adverse public perception or regulatory concerns about the safety of our products and the potential effects of these products on other plants, animals, human health and the environment. The potential for unintended but unavoidable trace amounts, sometimes called “adventitious presence,” of transgenes in conventional seed, or in the grain or products produced from conventional or organic crops, is another factor that could affect general public acceptance of these traits. For example, our current sorghum and switchgrass products have been produced exclusively through conventional breeding and have not been genetically engineered by us. It is possible, however, that trace amounts of our transgenes are nevertheless in our conventional products. In addition, trace amounts of transgenes may unintentionally be found outside our containment area in the products of third parties, which may result in negative publicity and claims of liability brought by such third parties against us. Furthermore, in the event of an unintended dissemination of our genetically engineered materials to the environment, we could be subject to claims by multiple parties, including environmental advocacy groups, as well as governmental actions such as mandated crop destruction, product recalls or additional stewardship practices and environmental cleanup or monitoring.
Ethical, legal and social concerns about land use could limit or prevent the widespread adoption of our products, which could negatively affect our ability to generate revenue.
The commercial success of our products also may be adversely affected by claims that the production of bioenergy displaces land that would otherwise be used for food and feed production, leading to shortages and higher prices for food and feed commodities. Droughts and crop failures that occur from time to time may exacerbate these claims. These claims are based, in part, on the assumption that there is a scarcity of available land for crop production, productivity is uniform across the globe and that productivity will remain flat over time. While these assumptions are not universally accepted, their acceptance by legislatures or advocacy groups could harm our ability to sell our products. The increased use of land for bioenergy production may also lead to claims that the increased planting of other crops in other regions may cause land clearing, such as in the Brazilian rainforest, and subsequent greenhouse gas releases — a theory known as indirect land use change. This theory proposes that such indirect effects, and their related greenhouse gas emissions should be applied to the emissions life cycle of bioenergy feedstocks, including dedicated energy crops. The perception that our products are resulting in higher greenhouse gas emissions could disadvantage our products related to other potential energy sources, or make it more difficult for our products to meet regulatory requirements for reduced emissions.
| 32 |
Development and commercialization, if any, of our products may incur scrutiny under the Convention on Biological Diversity Treaty.
The Convention on Biological Diversity, or the Convention, is an international treaty that was adopted at the Earth Summit in Rio de Janeiro, Brazil in 1992. The treaty provides that if a company uses genetic resources, such as an indigenous plant, from a participating country to develop a product, then such company must obtain the prior informed consent of the participating country and owes fair and equitable compensation to such country. Although the United States is not a participating country, most countries where we currently obtain or may obtain germplasm in the future, have ratified the treaty and are currently participants in the Convention. We may fall under scrutiny of the Convention with respect to the development or commercialization of any of our products derived from the germplasm originating from any of the countries that are participants in the Convention. There can be no assurances that the government of a participating country will not assert that it is entitled to fair and equitable compensation from us. Such compensation, if demanded, may make commercialization of our products not feasible.
Our business is affected by changes in general economic conditions and a prolonged downturn could affect the demand for our products and our ability to fund our working capital.
Economic conditions in the United States, Brazil and Europe could adversely affect our efforts to achieve profitability. The purchasing decisions of utilities, mill operators, growers and other potential customers, and their ability to timely pay for our products, are impacted by their economic health. We have extended credit to our customers for our seed products or for certain planting and crop management services that we have provided from time to time and may continue to do so in the future. For instance, during the 2014 – 2015 sweet sorghum productions season, we may extend credit to participants in certain of our sales incentive and promotional programs in Brazil. These credit practices may expose us to credit risk of utilities, mill operators and growers and other potential customers, and combined with the seasonality of our sales, make us dependent on our ability to fund our working capital requirements through other means. If the current economic conditions in Brazil continue or worsen, the economic health of our customers and potential customers could further deteriorate.
The Brazilian government’s policies and current economic conditions have made ethanol less competitive in the market and placed considerable economic pressure on ethanol producers in Brazil, which may reduce demand and slow adoption of our sorghum products and adversely affect our business.
The Brazilian government’s tax policies and efforts to contain inflation by blocking state-run Petroleo Brasileiro from raising gasoline prices have made ethanol less competitive in a market and placed considerable economic pressure on ethanol producers. Prices for crude oil and oil products are occasionally set below prices prevailing in the world oil markets. Meanwhile agricultural and industrial production costs for ethanol have risen. Faced with higher production costs and reduced margins, our customers may be unwilling to evaluate our products, or require higher yields per hectare than our current hybrids are expected to achieve, which could limit both the scale and pace of adoption, or delay adoption until these higher yield expectations are met. Moreover, these economic pressures are expected to lead to additional mills closures, which could reduce the total market size for our products.
Our activities are currently conducted at a limited number of locations, which makes us susceptible to damage or business disruptions caused by natural disasters.
Our headquarters and certain research and development operations are located at a single facility in Thousand Oaks, California. We have a breeding facility in Brazil, with additional breeding and agronomy trials situated in select locations across the world. Our primary seed production sites are located in the United States and Brazil. We also multiply seeds in other countries in North and South America. Warehousing for seed storage is located primarily in Texas and the state of São Paulo, Brazil. We take precautions to safeguard our facilities, including insurance, health and safety protocols, and off-site storage of critical research results and computer data. However, a natural disaster, such as a hurricane, fire, flood, tornado or earthquake, could cause substantial delays in our operations, damage or destroy our equipment, inventory or development projects, and cause us to incur additional expenses.
| 33 |
We rely on the experience and expertise of our senior management team and other key personnel.
We depend on the experience and expertise of our senior management team and other key personnel, many of whom have been with our company for more than a decade. Our senior management team and key personnel bring extensive experience in the seed industry, agricultural biotechnology and plant genetics. The loss or unavailability of key members of our senior management team or other key personnel could impact the execution of our business strategy and make it more difficult to maintain and expand our important relationships in the bioenergy industry. The replacement of key members of our senior management team or other key personnel likely would involve significant time and costs.
If we are unable to recruit or retain qualified personnel, particularly in Brazil, our development and commercialization efforts may be significantly delayed.
Competition for qualified personnel is intense among agricultural biotechnology, software and other technology-based businesses, particularly for personnel with the appropriate level of education, experience and training. We may not be able to recruit and retain such personnel at compensation levels consistent with our existing compensation structure. Appreciation of the Brazilian Real against the U.S. dollar would make it more difficult for us to meet compensation expectations of Brazilian personnel. In addition, in making employment decisions, job candidates often consider the value of equity they may receive in connection with their employment. Therefore, significant volatility and decline in the price of our stock may adversely affect our ability to attract or retain personnel. Competition for qualified personnel in Brazil is particularly intense due to the importance of the agricultural industry in Brazil and the recent increased activity levels of U.S. agricultural or renewable energy companies in Brazil. If we lose qualified personnel or are unable to attract, retain and integrate additional highly trained and motivated personnel, particularly for our research and development activities, our ability to advance our product development and continue our commercialization efforts may be delayed or unsuccessful.
Any restructuring actions and cost reduction measures that we undertake may not deliver the expected results and these actions may adversely affect our business.
We continue to review our cost structure and may implement restructuring or cost saving initiatives from time to time. For example, on October 11, 2013, we commenced a plan intended to further align our expenditures with our near-term commercial opportunity in Brazil, shift Northern Hemisphere sorghum breeding activities to a more appropriate location, deemphasize research and development for U.S. cellulosic feedstocks, reduce costs and conserve cash. These types of measures and their implementation may interfere with our ability to achieve our business objectives, may be difficult to manage and may increase the likelihood of turnover of other key employees, all of which may have an adverse impact on our business. In addition, we cannot be sure that any cost reduction initiatives will be as successful in reducing our overall expenses as expected or that additional costs will not offset any such reductions. If our operating costs are higher than we expect or if we do not maintain adequate control of our costs and expenses, our operating results will suffer.
Unexpected fluctuations in our quarterly operating results may cause our stock price to fluctuate widely.
Due in part to our significant research and development and production costs and general and administrative expenses, even a small decline in revenue could disproportionately affect our quarterly operating results and could cause such results to differ materially from expectations. If this occurs, we may fail to meet analyst and investor expectations, which could cause our stock price to decline. Other factors that could affect our quarterly operating results or cause them to differ materially from expectations include:
| · | demand for and acceptance of our products; |
| · | weather conditions or the occurrence of natural disasters; |
| · | changes in government regulations and incentives; |
| · | competitive pressures; and |
| · | unanticipated delays or problems in the introduction of new products. |
| 34 |
We may require additional financing in the future and may not be able to obtain such financing on favorable terms, if at all, which could force us to delay, reduce or eliminate our research and development activities.
We will continue to need capital to fund our research and development projects, to commercialize our products and to provide working capital to fund other aspects of our business. As of August 31, 2014, we believe that our existing cash and cash equivalents and marketable securities will provide adequate resources to fund our operations, including research and development expenses, planned capital expenditures and working capital requirements for the next 12 to 15 months. In order to fund our operations beyond that time, we believe we will need to raise additional funds. If future financings involve the issuance of equity securities, our existing stockholders would suffer dilution. If we are able to raise additional debt financing, we may be subject to restrictive covenants that limit our operating flexibility. We may not be able to raise sufficient additional funds on terms that are favorable to us, if at all. If we fail to raise sufficient funds and continue to incur losses, our ability to fund our operations, take advantage of strategic opportunities, develop and commercialize products or technologies, or otherwise respond to competitive pressures could be significantly limited. If this happens, we may be forced to delay or terminate research and development programs or the commercialization of products, curtail operations or obtain funds through collaborative and licensing arrangements that may require us to relinquish commercial rights, or grant licenses to our technology on terms that are not favorable to us. If adequate funds are not available, we will not be able to successfully execute on our business strategy or continue our business.
We expect to derive a portion of our revenues from markets outside the United States, including Brazil, which will subject us to additional business risks.
Changes in exchange rates between the U.S. dollar and other currencies will result in increases or decreases in our costs and earnings, and also may affect the book value of our assets outside the United States. To date, most of our contracts have been entered into in the United States and accordingly have been denominated in U.S. dollars. Going forward we anticipate that our sales will be denominated in the local currency of the country in which the sale occurs. In addition, most of our operating expenses to date have been denominated in the currencies of the countries in which our operations are located, primarily the United States and Brazil. As a result, while our revenue and operating expenses are mostly hedged on a transactional basis, the translation of our operating results into U.S. dollars may be adversely impacted by strengthening U.S. currency.
In addition, international operations are subject to a number of other risks and uncertainties, including:
| · | changes in political, social or economic conditions; |
| · | tariffs, trade protection measures and trade agreements; |
| · | import or export licensing requirements; |
| · | changes in regulatory requirements; |
| · | reduced protection for intellectual property rights in some countries; |
| · | economic downturns, civil disturbances or political instability; |
| · | difficulties and costs of staffing and managing international operations; |
| · | fluctuations in currency exchange rights; |
| · | land reform movements; |
| · | price controls; |
| · | nationalization; and potentially burdensome taxation. |
In the past, the Brazilian economy was characterized by frequent and occasionally extensive intervention by the Brazilian government and unstable economic cycles. The Brazilian government has changed in the past, and may change in the future, monetary, taxation, credit, tariff and other policies to influence the course of Brazil’s economy. For example, the government’s actions to control inflation have at times involved setting wage and price controls, adjusting interest rates, imposing taxes and exchange controls and limiting imports into Brazil. The Brazilian government has also in the past placed significant restrictions on the ability of foreign persons and companies to acquire property in Brazil. We have no control over, and cannot predict, what policies or actions the Brazilian government may take in the future. Any of these actions could adversely affect our international operations and, consequently, our results of operations.
| 35 |
Our ability to use our net operating loss carryforwards to offset future taxable income may be subject to certain limitations.
As of August 31, 2014, we had approximately $247.2 million of federal, $174.1 million of state and $24.3 million of foreign net operating loss carryforwards, or collectively the NOLs, available to offset future taxable income, if any, which expire in varying amounts from 2018 through 2034 for federal tax purposes and from 2015 through 2034 for state tax purposes if unused. The carryforward period for the foreign net operating loss is indefinite. It is possible that we will not generate taxable income in time to use these NOLs before their expiration. In addition, under Section 382 of the Code (as defined below), a corporation that undergoes an “ownership change” is subject to limitations on its ability to utilize its pre-change federal NOLs to offset future taxable income. We have not completed a Section 382 analysis to determine if an ownership change has occurred or if one will occur as the result of this offering of shares. Until such analysis is completed, we cannot be sure that the full amount of the existing federal NOLs will be available to us, even if we do generate taxable income before their expiration.
We use hazardous materials in our business. Any claims relating to improper handling, storage or disposal of these materials could be time consuming and costly.
Our research and development processes involve the controlled use of hazardous materials, including chemical and biological materials. Federal, state and local laws and regulations govern the use, manufacture, storage, handling and disposal of these materials. Our operations also produce hazardous waste. We cannot eliminate entirely the risk of accidental contamination or discharge and any resultant injury from these materials. We may face liability for any injury or contamination that results from our use or the use by third parties of these materials, which depending on the severity of the injury or contamination could be significant. In addition, compliance with applicable environmental laws and regulations may be expensive, and current or future environmental regulations may impair our research, development or production efforts.
We may suffer liabilities relating to soil and/or groundwater contamination at current and former properties and at third-party sites to which we sent hazardous wastes for disposal.
We are exposed to environmental risks associated with the ownership and operation of real property and the disposal of hazardous wastes. Environmental laws can require current owners and operators of real property to remediate soil and groundwater contamination even if such contamination was caused by another party, such as a former owner or operator. These laws can also require companies to clean up real property that they formerly owned or operated if releases of hazardous materials or wastes occurred during the period of their ownership or operation. Moreover, in certain circumstances these laws require companies to clean up third-party sites to which hazardous wastes were sent for disposal, notwithstanding that the original disposal activity accorded with all regulatory requirements. The discovery of previously unknown contamination at our current or former facilities, or at third-party sites to which we sent hazardous wastes for disposal, could require us to conduct or fund expensive cleanup efforts, which could materially and adversely affect our operating results.
We may be sued for product liability and if such lawsuits were determined adversely, we could be subject to substantial damages.
We may be held liable if any product we develop, or any product that uses or incorporates, any of our technologies, causes injury or is found otherwise unsuitable during product testing, production, marketing or sale. For example, the detection of unintended biotechnology material in pre-commercial seed, commercial seed varieties or the crops and products produced may result in the inability to market the crops grown, resulting in potential liability for us as the seed producer or technology provider. In the event this was to occur, we could be subject to claims by multiple parties based not only on the cost of our products but also on their lost profits and business opportunities. In addition, the detection of unintended biotechnology material in our seeds or in the environment could result in governmental actions such as mandated crop destruction, product recalls or environmental cleanup or monitoring. Concerns about seed quality related to biotechnology could also lead to additional regulations being imposed on our business, such as regulations related to testing procedures, mandatory governmental reviews of biotechnology advances, or the integrity of the food supply chain from the farm to the finished product.
| 36 |
We currently have limited product liability insurance coverage and additional insurance may be prohibitively expensive, or may not fully cover potential liabilities. If we are unable to obtain sufficient insurance coverage at an acceptable cost or otherwise or if the amount of any claim against us exceeds the coverage under our policy, we may face significant expenses.
Interruptions or delays in service from our third-party data center hosting facilities could impair the delivery of our planned cloud-based Persephone service and harm our business.
We are planning to launch a cloud-based edition of our Persephone software. For this subscription service we intend to serve our software customers from third-party data center hosting facilities. Any damage to, or failure of, our systems generally could result in interruptions in our service. Interruptions in our service may reduce our revenue, cause us to issue credits or pay penalties, cause customers to terminate their subscriptions and adversely affect our renewal rates and our ability to attract new customers. Our business will also be harmed if our customers and potential customers believe our service is unreliable.
Our software products are complex, which makes it difficult to innovate and avoid costs related to correction of program errors.
Despite testing by us, our software programs, like all software programs generally, may contain a number of undetected errors or “bugs” when we first introduce them or as new versions are released. We do not discover some errors until we have installed the product and our customers have used it. Errors may result in the delay or loss of revenues, diversion of software engineering resources, material non-monetary concessions, negative media attention, or increased service or warranty costs as a result of performance or warranty claims that could lead to customer dissatisfaction, resulting in litigation, damage to our reputation, and impaired demand for our products. Correcting bugs may result in increased costs and reduced acceptance of our software products in the marketplace. Further, such errors could subject us to claims from our customers for significant damages, and we cannot assure you that courts would enforce the provisions in our customer agreements that limit our liability for damages.
Some of our products contain open source software which may pose particular risks to our proprietary software and products.
We use open source software in some of our products and expect to use open source software in the future. From time to time, we may face claims from third parties claiming ownership of, or demanding release of, the open source software or derivative works that we developed using such software, which could include our proprietary source code, or otherwise seeking to enforce the terms of the applicable open source license. These claims could result in litigation, could require us to make our software source code freely available, purchase a costly license or cease offering the implicated products or services unless and until we can re-engineer them to avoid infringement. This re-engineering process could require significant additional research and development resources, and we may not be able to complete it successfully. In addition to risks related to license requirements, use of certain open source software can lead to greater risks than use of third-party commercial software, as open source licensors generally do not provide warranties or controls on the origin of software. Any of these risks could be difficult to eliminate or manage, and, if we do not address them effectively, could have a negative effect on our ability to develop and use our products that contain open source software. Additionally, compliance with open source licensing requirements is complex and challenging. Failure to comply with these requirements could have an adverse effect on our business and prospects.
| 37 |
Risks Related to our Intellectual Property
Our inability to adequately protect our proprietary technologies and products could harm our competitive position.
Our success depends in part on our ability to obtain patents and maintain adequate protection of our other intellectual property for our technologies and products in the United States and other countries. The laws of some foreign countries do not protect proprietary rights to the same extent as the laws of the United States, and many companies have encountered significant problems in protecting their proprietary rights in these foreign countries. These problems can be caused by, for example, a lack of rules and methods for defending intellectual property rights. Many countries, including Brazil, do not allow patenting of plants, whether genetically engineered or traditionally bred. Accordingly, our proprietary position for our products in countries such as Brazil relies to a large extent on Plant Variety Protection certificates. This type of protection is more limited than patents in the United States. As a result, Plant Variety Protection certificates may provide only a limited competitive advantage in the marketplace. In many countries, including Brazil, patentability criteria are generally more restrictive and our filings more limited than in the United States, weakening our prospects of obtaining an equal scope of corresponding patent protection. Because Brazil is our initial target market, the lack of more robust patent protection for plant varieties in that country could expose us to the risk of misappropriation of our intellectual property. In addition, the legal systems of certain other countries do not favor the enforcement of patents and other intellectual property protection, particularly those relating to biotechnology. This could make it difficult for us to stop the infringement of our patents or misappropriation of our other intellectual property rights. Proceedings to enforce our patents and other proprietary rights in foreign jurisdictions could result in substantial costs and divert our efforts and attention from other aspects of our business. Accordingly, our efforts to enforce our intellectual property rights in such countries may be inadequate to obtain a significant commercial advantage from the intellectual property that we develop. Even if we enforce our rights aggressively, injunctions, fines and other penalties may be insufficient to deter violations of our intellectual property rights. Changes in either the patent laws or in interpretations of patent laws in the United States and other countries may diminish the value of our intellectual property.
The patent positions of biotechnology companies, including our patent position, are generally uncertain and involve complex legal and factual questions. In many cases, we will be able to protect our proprietary rights from unauthorized use by third parties only to the extent that our proprietary technologies are covered by valid and enforceable patents or Plant Variety Protection certificates. We will apply for patents covering both our technologies and products as we deem appropriate. However, we cannot assure you that any pending or future patent applications held by us will result in an issued patent, or that if patents are issued to us, such patents will provide meaningful protection against competitors or against competitive technologies. Our existing patents and Plant Variety Protection certificates and any future patents or Plant Variety Protection certificates we obtain may not be sufficiently broad to prevent others from practicing our technologies or from developing competing products. Furthermore, others may independently develop similar or alternative technologies or design around our patented technologies. In addition, our patents may be challenged, invalidated or fail to provide us with any competitive advantages.
The value of our intellectual property could diminish due to technological developments or challenges by competitors, making our products less competitive.
Our intellectual property rights are important to the operation of our business and to our early mover advantage in crop biotechnology. We rely on a combination of patents, plant variety protection, plant breeders’ rights, copyrights, trademarks, trade secret laws, confidentiality provisions, and licensing arrangements to establish and protect our intellectual property. However, the importance of technology development and intellectual property protection in the agricultural industry increases the risk that technological advances by others could render our products less competitive. Our business could be negatively affected by any of the following:
| · | our issued patents, Plant Variety Protection certificates, plant breeders’ rights and trademark registrations may be successfully challenged by our competitors; |
| · | our pending patent, Plant Variety Protection certificates, plant breeders’ rights and trademark registration applications may not be allowed or may be challenged successfully by our competitors; |
| · | our products may inadvertently use the technology of others and, therefore, require us to obtain intellectual property licenses from other parties in order for us to sell our products; |
| · | we may be unable to obtain intellectual property licenses that are necessary or useful to our business on favorable terms, or at all; |
| · | new technology that is independently developed by others may supersede our technology and make our products less desirable or more costly in the marketplace; |
| · | competitors may design around our patented technologies or may reverse engineer our trade secret technologies; |
| 38 |
| · | the scope of our Plant Variety Protection certificates in Brazil is narrow and subject to a breeder’s exemption, which allows breeders to use our varieties in a breeding program; as a result, these certificates may not provide a sustained competitive advantage in the marketplace; and |
| · | we do not have any issued patents in Brazil and we may be unable to obtain meaningful patent protection in Brazil, further, the scope of any patents that might issue in Brazil is uncertain and may not be sufficient to deter competition due to restrictions on plant claims under Brazilian patent laws and our limited filings in Brazil. |
While we have exclusive rights to certain proprietary lines of switchgrass, miscanthus, high biomass sorghum and sweet sorghum through our collaborations with leading institutions, other parties may have access to certain lines of switchgrass, miscanthus, high biomass sorghum or sweet sorghum developed or released by such institutions, proprietary lines of such crops from other sources, and publicly available lines of such crops, from which they may develop products that compete with our products.
Litigation or other proceedings or third party claims of infringement could require us to spend time and money and could severely disrupt our business.
Our commercial success depends on not infringing patents or proprietary rights of third parties, nor breaching any licenses or other agreements that we have entered into with regard to our technologies, products and business. The patent positions of biotechnology and seed companies involve complex legal and factual questions and, therefore, enforceability cannot be predicted with certainty. Patents, if issued, may be challenged, invalidated or circumvented. We cannot be sure that relevant patents have not been issued that could block our ability to obtain patents or to operate as we would like without infringing patents or proprietary rights of other parties.
The biotechnology and seed industries have a history of litigation regarding patents and other intellectual property rights. Many biotechnology companies have employed intellectual property litigation as a way to gain a competitive advantage. We cannot assure you that we will not be sued by third parties for infringement of patents they may have relating to biotechnological traits or technologies in various crops.
Should any of our competitors have filed patent applications prior to March 16, 2013 or obtain patents based on patent applications filed before March 16, 2013 that claim inventions also claimed by us, we may have to participate in an interference proceeding declared by the U.S. Patent and Trademark Office to determine priority of invention and, thus, the right to a patent for these inventions in the United States. Such a proceeding could result in substantial cost to us even if the outcome is favorable. Even if successful on priority grounds, an interference proceeding may result in loss of claims based on patentability grounds raised in the proceeding. If we become involved in litigation or interference or post-grant review proceedings declared by the U.S. Patent and Trademark Office to defend our intellectual property rights or as a result of alleged infringement of the rights of others, or oppositions or other intellectual property proceedings outside of the United States, we might have to spend significant amounts of money to resolve such matters. We are aware of a significant number of pending patent applications relating to biotechnological traits or technologies in various crops filed by third parties.
Even if we prevail, litigation, interference or post-grant review proceedings or opposition proceedings could result in significant legal fees and other expenses, could divert our management time and efforts and could severely disrupt our business. Uncertainties resulting from initiation and continuation of any patent or related litigation could harm our ability to compete.
An adverse ruling arising out of any intellectual property dispute could undercut or minimize our intellectual property position. An adverse ruling that our operations violate a third party’s intellectual property rights could also subject us to significant liability for damages, prevent us from using processes or products, or require us to license disputed rights from third parties. Claims of intellectual property infringement against us may require us to enter into costly royalty or license agreements, subject us to substantial damage claims or cause us to stop using such technology absent a license agreement. Although patent and intellectual property disputes in the biotechnology area are often settled through licensing or similar arrangements, costs associated with these arrangements may be substantial and could include ongoing royalties. Furthermore, necessary licenses may not be available to us on satisfactory terms, if at all.
| 39 |
Third parties may infringe on our intellectual property rights, and we may expend significant resources enforcing our rights or be competitively disadvantaged.
If we fail to protect our intellectual property rights from infringement by third parties, our competitive position could suffer, which could make it more difficult to grow our business. We may not be able to detect or prevent infringement of our intellectual property or may lose our competitive position in the market before we do so.
Confidentiality agreements with employees and others may not adequately prevent disclosure of trade secrets and other proprietary information.
In order to protect our proprietary technology and processes, we also rely in part on trade secret protection for our confidential and proprietary information. For example, we consider our genetic transformation methods, markers for marker-assisted breeding and sequence databases as trade secrets. We have taken security measures to protect our trade secrets and proprietary information. These measures may not provide adequate protection for our trade secrets or other proprietary information. We also seek to protect our proprietary information by entering into confidentiality agreements with employees, with potential and actual collaborators and licensees and with consultants and other advisors. These agreements may not effectively prevent disclosure of confidential information and may not provide an adequate remedy in the event of unauthorized disclosure of confidential information. In addition, others may independently develop substantially equivalent proprietary information or techniques and trade secret laws do not allow us to protect against such independent development. Costly and time-consuming litigation could be necessary to enforce and determine the scope of our proprietary rights, and failure to obtain or maintain trade secret protection could adversely affect our competitive business position.
We have received funding from U.S. government agencies that is subject to federal regulation under the Bayh-Dole Act of 1980. Failure to comply with the requirements of the Bayh-Dole Act could negatively affect our intellectual property and have an adverse effect on our business and results of operations.
Some of our research and development activities have been funded by grants from U.S. government agencies. For example, a portion of our research and development used to develop our nitrogen use efficiency trait was funded by a U.S. Department of Energy ARPA-E grant. When new technologies are developed with U.S. government funding, the government obtains certain rights under the Bayh-Dole Act in any resulting patents and technical data, generally including, at a minimum, a nonexclusive, nontransferable license authorizing the government to practice or have practiced the invention or technical data for non-commercial purposes. U.S. government funding must be disclosed in any resulting patent applications, and our rights in such inventions will normally be subject to government license rights, periodic progress reporting, foreign manufacturing restrictions and march-in rights. March-in rights refer to the right of the U.S. government, under certain limited circumstances, to require us to grant a license, which may possibly be an exclusive license, to technology developed under a government grant to a responsible applicant, or, if we refuse, to grant such a license itself. March-in rights can be triggered if the government determines that we have failed to comply with the applicable rules and regulations related to U.S. government funded innovation, or if we have failed, within a reasonable time, to take effective steps to achieve practical application of a technology or, if action is necessary to alleviate health or safety needs, to meet requirements for public use specified by federal regulations or to give preference to U.S. industry. The U.S. government also has the right to take title to these inventions if we fail to disclose the invention to the government and fail to file an application to register the intellectual property within specified time limits and the U.S. government may acquire title in any country in which a patent application is not filed within specified time limits. Additionally, under the Bayh-Dole Act, a party which acquires an exclusive license for an invention that was partially funded by a federal research grant is subject to the following government rights: (x) products using the invention which are sold in the United States are to be manufactured substantially in the United States, unless a waiver is obtained; (y) the government may force the granting of a license to a third party who will make and sell the needed product if the licensee does not pursue reasonable commercialization of a needed product using the invention; and (z) the United States government may use the invention for its own needs. Compliance with the requirements of the Bayh-Dole Act is complex and challenging. If we fail to comply with these guidelines or any other requirements under the Bayh-Dole Act, we may lose our exclusive rights to these products, and we may lose potential revenue derived from the sale of these products. We may also enter into collaborations with entities outside the United States that receive government funding or, in the future, we may apply for government funding from other countries. Regulations in these countries may provide for similar march-in rights. Any government’s rights in our intellectual property may lessen its commercial value, which could adversely affect our business.
| 40 |
Risks Related to Ownership of our Common Stock
The price of our common stock may be volatile which may cause the value of our common stock to decline.
Our stock price has been in the past, and may continue to be subject to wide fluctuations in response to the risk factors contained in, or incorporated by reference into this prospectus, and others beyond our control, including:
| · | the rate of adoption of our products in our target markets; |
| · | actual or projected fluctuations in our financial condition and operating results; |
| · | our cash and cash equivalents position; |
| · | actual or projected changes in our growth rate relative to our competitors; |
| · | actual or projected fluctuations in our competitors’ financial condition or operating results; |
| · | actual cost savings realized from our cost reduction initiatives; |
| · | announcements of technological innovations by us, our collaborators or our competitors; |
| · | announcements by us, our collaborators or competitors of significant acquisitions, strategic partnerships, joint ventures or capital commitments; |
| · | the entry into, modification or termination of collaborative arrangements; |
| · | changes in our customer base; |
| · | additions or departures of key management or other key personnel; |
| · | competition from existing products or new products that may emerge; |
| · | issuances of new or updated research reports by securities or industry analysts; |
| · | fluctuations in the share prices of companies perceived by investors to be comparable to us; |
| · | fluctuations in the size of our public float or trading volume; |
| · | disputes or other developments related to proprietary rights, including patents, litigation matters, the countries in which we source our germplasm, and our ability to obtain patent protection for our technologies; |
| · | disputes or other developments relating to genetically engineered products, including claims of adventitious presence or environmental harm; |
| · | changes in existing laws, regulations and policies applicable to our business and products, including the United States Renewable Fuel Standard program, and the adoption or failure to adopt additional carbon emissions regulations; |
| · | announcements or the expectation of raising additional financing; |
| · | sales of our common stock by us, our insiders or other stockholders; |
| · | the status of our listing on the Nasdaq; |
| · | general market conditions in our industry; and |
| · | general economic conditions effecting the US and Brazil and the other markets in which we operate. |
The stock markets in general, and the markets for biotechnology and renewable energy stocks in particular, have experienced extreme volatility that have affected and continue to affect the trading prices of equity securities of many companies. These market fluctuations often have been unrelated or disproportionate to the operating performance of those companies. These fluctuations, as well as general economic, political and market conditions such as recessions, interest rate changes, international currency fluctuations or regulatory changes may negatively impact the market price of our common stock. In the past, companies that have experienced volatility in the market price of their stock have been subject to securities class action litigation. We may be the target of this type of litigation in the future. Securities litigation against us could result in substantial costs and divert our management’s attention from other business concerns.
| 41 |
Our common stock is thinly traded and there may not be an active, liquid trading market for our common stock.
There is no guarantee that an active trading market for our common stock will be maintained on NASDAQ, or that the volume of trading will be sufficient to allow for timely trades. Investors may not be able to sell their shares quickly or at the latest market price if trading in our stock is not active or if trading volume is limited. In addition, if trading volume in our common stock is limited, trades of relatively small numbers of shares may have a disproportionate effect on the market price of our common stock.
If there are substantial sales of our common stock, or the perception that these sales could occur in the future, the trading price of our common stock could decline.
The trading price of our common stock could decline as a result of sales of a large number of shares of our common stock in the public market. The perception that these sales could occur may also depress the trading price of our common stock. As of November 7, 2014, we had 48,265,633 shares of common stock outstanding. Certain of our stockholders are entitled, under contracts providing for registration rights, to require us to register shares of our common stock owned by them for public sale in the United States. In addition, certain stockholders, including stockholders owning a majority of our outstanding shares as well as current and former employees, are eligible to resell shares of common stock in the public market under Rule 144, which, in the case of our affiliates, would be subject to volume limitations and certain other restrictions under Rule 144. We have also registered 5,381,155 shares of common stock previously issued or reserved for future issuance under our equity compensation plans and agreements. Subject to the satisfaction of applicable exercise periods and vesting requirements, the shares of common stock issued upon exercise of outstanding options will be available for immediate resale in the United States in the open market.
If securities or industry analysts do not publish research or reports about our business or our industry, or publish negative reports about our business or our industry, our stock price and trading volume could decline.
The trading market for our common stock will be influenced by the research and reports that securities or industry analysts publish about us, our business, our industry and our competitors. If one or more of the analysts who cover us change their recommendation regarding our stock adversely, change their opinion of the prospects for our company in a negative manner, or provide more favorable relative recommendations about our competitors, our stock price would likely decline. If one or more of these analysts cease coverage of our company or fail to regularly publish reports on us, we could lose visibility in the financial markets, which could cause our stock price or trading volume to decline.
We are an “emerging growth company,” and we cannot be certain if the reduced disclosure requirements applicable to emerging growth companies will make our common stock less attractive to investors.
We are an “emerging growth company,” as defined in the JOBS Act and, for as long as we continue to be an emerging growth company, we intend to take advantage of exemptions from various reporting requirements applicable to other public companies but not to emerging growth companies, including, but not limited to, not being required to comply with the auditor attestation requirements related to our internal controls over financial reporting pursuant to Section 404 of the Sarbanes-Oxley Act, reduced disclosure obligations regarding executive compensation in our periodic reports and proxy statements and exemptions from the requirements of holding a nonbinding advisory vote on executive compensation and shareholder approval of any golden parachute payments not previously approved. We will remain an “emerging growth company” for up to five years from the date of the completion of our IPO, or until the earlier of (1) the last day of the fiscal year in which our total annual gross revenues exceed $1 billion, (2) the date that we become a “large accelerated filer” as defined in Rule 12b-2 under the Exchange Act, which would occur if the market value of our common equity that is held by non-affiliates exceeds $700 million as of the last business day our most recently completed second fiscal quarter or (3) the date on which we have issued more than $1 billion in non-convertible debt during the preceding three year period. We cannot predict if investors will find our common stock less attractive if we continue to rely on these exemptions. If some investors find our common stock less attractive as a result of any choices that we make to reduce our disclosure, there may be a less active trading market for our common stock and our stock price may be more volatile.
| 42 |
In addition, Section 107 of the JOBS Act provides that an “emerging growth company” can take advantage of the extended transition period provided in Section 7(a)(2)(B) of the Securities Act for complying with new or revised accounting standards. Under this provision, an “emerging growth company” can delay the adoption of certain accounting standards until those standards would otherwise apply to private companies. We have elected to delay such adoption of new or revised accounting standards, and as a result, we may not comply with new or revised accounting standards on the relevant dates on which adoption of such standards is required for public companies that are not emerging growth companies. As a result of such election, our financial statements may not be comparable to the financial statements of other public companies. If some investors find our common stock less attractive as a result, there may be a less active trading market for our common stock and our stock price may be more volatile.
We incur significant costs as a result of operating as a public company, and our management will be required to devote substantial time to comply with the laws and regulations affecting public companies. Failure to implement and maintain the appropriate internal controls over financial reporting could negatively affect our ability to provide accurate and timely financial information.
We became a public company in February 2012. Although we are an emerging growth company as defined under the JOBS Act, as a public company, we incur significant legal, accounting and other expenses that we did not incur as a private company, including costs associated with public company reporting and corporate governance requirements, in order to comply with the rules and regulations imposed by the Sarbanes-Oxley Act, as well as rules implemented by the SEC and the Nasdaq Stock Market. In addition, management and other personnel will need to devote a substantial amount of time to comply with these requirements.
The Sarbanes-Oxley Act requires, among other things, that we maintain effective internal controls over financial reporting. Effective internal controls are necessary for us to provide reliable financial reports and prevent fraud. In addition, Section 404 of the Sarbanes-Oxley Act of 2002 requires us to evaluate and report on our internal control over financial reporting, and have our chief executive officer and chief financial officer certify as to the accuracy and completeness of our financial reports. The process of implementing internal controls and complying with Section 404 is expensive and time consuming, and requires significant attention from management. We cannot be certain that these measures will ensure that we continue to implement and maintain adequate controls over our financial processes and reporting in the future.
Our management has concluded that there are no material weaknesses in our internal controls over financial reporting as of August 31, 2014. However, there can be no assurance that our controls over financial processes and reporting will be effective in the future or that material weaknesses or significant deficiencies in our internal controls will not be discovered in the future. Because of its inherent limitations, internal control over financial reporting may not prevent or detect fraud or misstatements. Failure to implement required new or improved controls, or difficulties encountered in their implementation, could harm our results of operations or cause us to fail to meet our reporting obligations. If we or our independent registered public accounting firm discover a material weakness, the disclosure of that fact, even if quickly remedied, could reduce the market's confidence in our financial statements and cause our stock price to decline.
For so long as we remain an emerging growth company as defined in the JOBS Act, we intend to take advantage of certain exemptions from various reporting requirements that are applicable to public companies that are not emerging growth companies, including, but not limited to, not being required to comply with the auditor attestation requirements of Section 404 of the Sarbanes-Oxley Act. Once we are no longer an emerging growth company or, if prior to such date, we opt to no longer take advantage of the applicable exemption, we will be required to include an opinion from our independent registered public accounting firm on the effectiveness of our internal controls over financial reporting. To date, our independent registered public accounting firm has not expressed an opinion on the effectiveness of our internal controls.
| 43 |
Anti-takeover provisions in our certificate of incorporation and bylaws and under Delaware law could delay or prevent an acquisition of our company, even if the acquisition may be beneficial to our stockholders.
Provisions in our amended and restated certificate of incorporation and our bylaws may delay or prevent an acquisition of our company deemed undesirable by our board of directors. Among other things, our amended and restated certificate of incorporation and bylaws (i) provide for a board of directors that is divided into three classes, with staggered three-year terms, (ii) provide that all stockholder action must be effected at a duly called meeting of the stockholders and not by a consent in writing, (iii) provide that only a majority of our board of directors, the chairman of the board of directors, our chief executive officer or president (in the absence of a chief executive officer) may call a special meeting of the stockholders, (iv) provide for the ability of our board of directors to issue undesignated preferred stock, (v) require that certain amendments to the amended and restated certificate of incorporation be approved by a 66 2/3% stockholder vote, and (vi) establish advance notice requirements for nominations for election to our board of directors and for proposing matters that can be acted upon at stockholders meetings. These provisions may also frustrate or prevent any attempt by our stockholders to replace or remove our current management by making it more difficult for stockholders to replace members of our board of directors who are responsible for appointing the members of our management team. As a Delaware corporation, we are subject to the provisions of Section 203 of the Delaware General Corporation Law, which prohibits, with some exceptions, stockholders owning in excess of 15% of our outstanding stock from merging or combining with us without board of directors or stockholder approval. Although we believe these provisions together provide for an opportunity to receive higher bids by requiring potential acquirers to negotiate with our board of directors, they would apply even if an offer to acquire our company may be considered beneficial by some stockholders and could limit the opportunity for our stockholders to receive a premium for their shares.
We do not expect to declare any dividends in the foreseeable future.
We do not anticipate declaring any cash dividends to holders of our common stock in the foreseeable future. Consequently, investors may need to rely on sales of their common stock after price appreciation, which may never occur, as the only way to realize any future gains on their investment. Investors seeking cash dividends should not purchase our common stock.
Our common stock may be at risk for delisting from NASDAQ in the future, which could adversely affect the liquidity of the trading market for our common stock and the market price of our common stock could decrease. Delisting from NASDAQ could adversely affect our ability to raise additional financing through public or private sales of equity securities, would significantly affect the ability of investors to trade our securities and would negatively affect the value and liquidity of our common stock.
Our common stock is currently listed on the NASDAQ Capital Market. If we fail to adhere to the market’s listing criteria, our common stock may be delisted. Previously, our common stock was listed on the NASDAQ Global Market, and on April 28, 2014, we received a letter from the NASDAQ indicating that we had failed to comply with NASDAQ Listing Rule 5450(a)(1), which requires that we maintain a minimum closing bid price of $1.00 per share, and indicating that we had 180 calendar days to regain compliance. Anticipating that we would not regain compliance with this requirement within the 180-day period, we applied to transfer our common stock to the NASDAQ Capital Market, which became effective on October 27, 2014. Based on our ability to comply with all listing requirements of the NASDAQ Capital Market, other than the minimum bid price rule, the NASDAQ also granted us an additional 180 days, or until April 27, 2015, to regain compliance with the minimum bid price rule.
We intend to continue to monitor the bid price of our common stock. If our common stock does not trade at a level that is likely to regain compliance with the NASDAQ requirements, our Board of Directors may consider other options that may be available to achieve compliance, including implementing a reverse stock split. If at any time before April 27, 2015, the closing bid price of our common stock is at least $1.00 per share for at least ten consecutive business days, we will regain compliance with the price requirement. If we cannot demonstrate compliance by April 27, 2015 or if we do not comply with the terms of the extension granted by NASDAQ, our common stock may then be delisted from Nasdaq.
If our common stock is delisted by NASDAQ, our common stock may be eligible for quotation on an over-the-counter quotation system or on the pink sheets. Upon any such delisting, our common stock would become subject to the regulations of the SEC relating to the market for penny stocks. A penny stock is any equity security not traded on a national securities exchange that has a market price of less than $5.00 per share.
| 44 |
If our common stock were to be delisted, the liquidity of our common stock would be adversely affected and the market price of our common stock could decrease. In addition, if delisted we would no longer be subject to NASDAQ rules, including rules requiring us to have a certain number of independent directors and to meet other corporate governance standards. Our failure to be listed on NASDAQ or another established securities market would have a material adverse effect on the value of your investment in us. Delisting could also have other negative results, including the potential loss of confidence by employees, the loss of institutional investor interest and fewer business development opportunities.
If our common stock is not listed on NASDAQ or another national exchange, the trading price of our common stock is below $5.00 per share and we have net tangible assets of $6,000,000 or less, the open-market trading of our common stock will be subject to the “penny stock” rules promulgated under the Exchange Act. The regulations applicable to penny stocks may severely affect the market liquidity for our common stock and could limit the ability of shareholders to sell securities in the secondary market. In such a case, an investor may find it more difficult to dispose of or obtain accurate quotations as to the market value of our common stock, and there can be no assurance that our common stock will be eligible for trading or quotation on any alternative exchanges or markets. Under these rules, broker-dealers who recommend such securities to persons other than institutional accredited investors must:
• make a special written suitability determination for the purchaser;
• receive the purchaser’s written agreement to the transaction prior to sale;
• provide the purchaser with risk disclosure documents which identify certain risks associated with investing in “penny stocks” and which describe the market for these “penny stocks” as well as a purchaser’s legal remedies; and
• obtain a signed and dated acknowledgment from the purchaser demonstrating that the purchaser has actually received the required risk disclosure document before a transaction in a “penny stock” can be completed.
As a result of these requirements, the market price of our securities may be adversely impacted, and current stockholders may find it more difficult to sell our securities.
| Item 1B. | Unresolved Staff Comments |
None.
| Item 2. | Properties |
Headquarters
Our headquarters is located in Thousand Oaks, California, where we lease approximately 49,000 square feet of office, laboratory and greenhouse space. The lease expires on September 30, 2019. We have one option to extend the lease for an additional term of five years, provided that we give notice to the landlord no more than nine months, nor less than six months prior to the expiration of the term of the lease.
Amarillo Operations
Our primary U.S. seed warehousing, conditioning, packaging and order fulfillment facility is located in Amarillo, Texas. Purchased in 2009, the site consists of approximately 46,000 square feet of office and warehouse space on a 32-acre parcel. We anticipate that we will be able to warehouse and process up to 8 to 10 million pounds of seed annually at this facility.
| 45 |
Brazil
We lease three offices in the Municipalities of Campinas, Uberlândia and Centralina, Brazil. We have a right of first refusal to purchase the property in the event the lessor decides to sell. The leases for these offices expire in 2016. Our plant breeding facility is located in the Municipality of Centralina, State of Minas Gerais, Brazil. The site consists of approximately 450 square meters of office and warehouse space on an approximately 3,876-square-meter parcel. The lease expires in August 2017. We have a right of first refusal in the acquisition of the property. In addition, as part of our plant breeding facility, we lease approximately 58 hectares of cropland under a three-year lease expiring in 2017.
We believe that our facilities in California, Texas and Brazil will adequately meet our needs in the near term.
| Item 3. | Legal Proceedings |
From time to time, we may be involved in litigation relating to claims arising out of our operations. We are not currently a party to any material litigation or other material legal proceedings. We may, however, be involved in material legal proceedings in the future. Such matters are subject to uncertainty and there can be no assurance that such legal proceedings will not have a material adverse effect on our business, results of operations, financial position or cash flows.
| Item 4. | Mine Safety Disclosures |
Not applicable.
| 46 |
| Item 5. | Market for Registrant’s Common Equity, Related Stockholder Matters and Issuer Purchases of Equity Securities |
Market Information
Our common stock trades under the Nasdaq Capital Market under the symbol “CERE”. The high and low sales prices per share of our common stock for fiscal 2014 and 2013 are as follows:
| High | Low | |||||||
| Fiscal 2014 | ||||||||
| First Quarter (September 1, 2013 – November 30, 2013) | $ | 2.14 | $ | 1.16 | ||||
| Second quarter (December 1, 2013 – February 28, 2014) | 1.82 | 1.28 | ||||||
| Third quarter (March 1, 2014 – May 31, 2014) | 1.45 | 0.50 | ||||||
| Fourth quarter (June 1, 2014 – August 31, 2014) | 0.82 | 0.51 | ||||||
| High | Low | |||||||
| Fiscal 2013 | ||||||||
| First Quarter (September 1, 2012 – November 30, 2012) | $ | 8.19 | $ | 3.43 | ||||
| Second quarter (December 1, 2012 – February 28, 2013) | 4.94 | 3.61 | ||||||
| Third quarter (March 1, 2013 – May 31, 2013) | 4.08 | 1.87 | ||||||
| Fourth quarter (June 1, 2013 – August 31, 2013) | 5.60 | 1.10 | ||||||
Holders of Record
On November 7, 2014, there were approximately 172 stockholders of record of our common stock. Stockholders of record do not include a substantially greater number of “street name” holders or beneficial holders of our common stock whose shares are held of record by banks, brokers and other financial institutions.
Dividends
We have never declared or paid cash dividends on our common stock. We currently intend to retain any future earnings and do not expect to declare or pay any cash dividends in the foreseeable future.
Equity Plan Information
Our equity plan information required by this item is incorporated by reference to the information in Part III, Item 12 of this Annual Report on Form 10-K.
Performance Graph
This performance graph shall not be deemed “filed” for purposes of Section 18 of the Exchange Act, or incorporated by reference into any filing of Ceres, Inc. under the Securities Act or the Exchange Act, except as shall be expressly set forth by specific reference in such filing.
The following graph compares our total common stock return with the total return for the Nasdaq U.S. Small Cap Index and the Nasdaq Clean Edge Green Energy Index for the period from February 22, 2012 (the date our common stock commenced trading on the NASDAQ) through August 31, 2014. The data assume an investment of $100 in our common stock at a closing price of $14.80 on February 22, 2012 and in the Nasdaq U.S. Small Cap Index and the NASDAQ Clean Edge Green Energy Index on February 22, 2012. Such returns are based on historical results and are not intended to suggest future performance. Data assumes reinvestment of dividends.
| 47 |
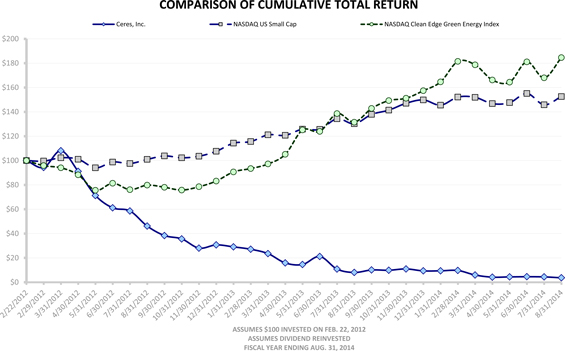
Unregistered Sales of Equity Securities
None.
Use of Proceeds
On February 27, 2012, we completed our initial public offering. We sold 5,750,000 shares of common stock at a price to the public of $13.00 per share, which included the underwriters’ exercise in full of their option to purchase 750,000 additional shares. The offer and sale of our common stock in our initial public offering was registered under the Securities Act pursuant to a registration statement on Form S-1 (File No. 333-174405), which was declared effective by the SEC on February 21, 2012. We raised approximately $65.2 million in net proceeds after deducting underwriting discounts and commissions of $5.2 million and other offering costs of $4.9 million. There has been no material change in the planned use of proceeds from our initial public offering as described in our Prospectus dated February 21, 2012 and filed with the Securities and Exchange Commission.
On March 10, 2014, we completed a registered public offering of 23,000,000 shares of our common stock (including 3,000,000 shares purchased by the underwriter upon the exercise in full of their right to purchase up to an additional 3,000,000 shares to cover over-allotments) at a price to the public of $1.00 per share. The offer and sale of our common stock in our second public offering was registered under the Securities Act pursuant to a registration statement on Form S-1 (File No. 333-193556), which was declared effective by the SEC on March 4, 2014. The Company received approximately $20.8 million of proceeds from the offering, after deducting underwriting discounts and commissions and offering expenses. There has been no material change in the planned use of proceeds from the second public offering as described in our Prospectus dated January 24, 2014 and filed with the Securities and Exchange Commission.
Purchases of Equity Securities by the Issuer and Affiliated Purchasers
None.
| 48 |
Item 6. Selected Financial Data
SELECTED CONSOLIDATED FINANCIAL DATA
The selected consolidated statement of operations data for the fiscal years ended August 31, 2014, 2013 and 2012 and the selected consolidated balance sheet data at August 31, 2014 and 2013 are derived from our audited Consolidated Financial Statements, appearing elsewhere in this Annual Report on Form 10-K. The selected consolidated statement of operations data for the fiscal year ended August 31, 2011 and 2010 and the selected consolidated balance sheet data as of August 31, 2012, 2011 and 2010 have been derived from our audited consolidated financial statements, which are not included in this Annual Report on Form 10-K. Historical results are not necessarily indicative of results for future periods.
You should read the following selected consolidated financial data in conjunction with “Management’s Discussion and Analysis of Financial Condition and Results of Operations” and our Consolidated Financial Statements appearing elsewhere in this Annual Report on Form 10-K.
| Year Ended August 31, | ||||||||||||||||||||
| 2014 | 2013 | 2012 | 2011 | 2010 | ||||||||||||||||
| (In thousands, except per share data) | ||||||||||||||||||||
| Revenues | ||||||||||||||||||||
| Product sales | $ | 146 | $ | 462 | $ | 432 | $ | 116 | $ | 288 | ||||||||||
| Collaborative research and government grants | 2,258 | 4,781 | 4,939 | 6,500 | 6,326 | |||||||||||||||
| Total revenues | $ | 2,404 | 5,243 | 5,371 | 6,616 | 6,614 | ||||||||||||||
| Cost and operating expenses(1) | ||||||||||||||||||||
| Cost of product sales | 3,021 | 6,245 | 2,384 | 2,492 | 2,946 | |||||||||||||||
| Research and development | 14,156 | 16,401 | 19,155 | 19,014 | 16,697 | |||||||||||||||
| Selling, general and administrative | 14,484 | 15,187 | 12,634 | 10,008 | 9,207 | |||||||||||||||
| Total cost and operating expenses(1) | 31,661 | 37,833 | 34,173 | 31,514 | 28,850 | |||||||||||||||
| Loss from operations | $ | (29,257 | ) | (32,590 | ) | (28,802 | ) | (24,898 | ) | (22,236 | ) | |||||||||
| Interest expense | (68 | ) | (46 | ) | (560 | ) | (456 | ) | (153 | ) | ||||||||||
| Interest income | 5 | 126 | 39 | 7 | 23 | |||||||||||||||
| Other (expense) income | - | - | (84 | ) | (11,020 | ) | (152 | ) | ||||||||||||
| Loss before income taxes | $ | (29,320 | ) | (32,510 | ) | (29,407 | ) | (36,367 | ) | (22,518 | ) | |||||||||
| Income tax (expense) benefit | (1 | ) | (1 | ) | (3 | ) | 31 | (65 | ) | |||||||||||
| Net loss | $ | (29,321 | ) | (32,511 | ) | (29,410 | ) | (36,336 | ) | (22,583 | ) | |||||||||
| Basic and diluted net loss per share attributable to common stockholders(2) | $ | (0.81 | ) | (1.31 | ) | (2.18 | ) | (18.34 | ) | (11.70 | ) | |||||||||
| Weighted average outstanding common shares used for net loss per share attributable to common stockholders(2): | ||||||||||||||||||||
| Basic and diluted | 36,205,962 | 24,796,030 | 13,488,336 | 1,981,627 | 1,930,395 | |||||||||||||||
| (1) | Our stock-based compensation expense is as follows (in thousands): |
| 49 |
| Year ended August 31, | ||||||||||||||||||||
| 2014 | 2013 | 2012 | 2011 | 2010 | ||||||||||||||||
| Cost of product sales | $ | 174 | $ | (170 | ) | $ | 152 | $ | — | $ | — | |||||||||
| Research and development | 1,031 | 1,189 | 293 | 1,895 | 409 | |||||||||||||||
| Selling, general and administrative | 1,863 | 2,291 | 1,464 | 815 | 891 | |||||||||||||||
| Total stock-based compensation expense | $ | 3,068 | $ | 3,310 | $ | 1,909 | $ | 2,710 | $ | 1,300 | ||||||||||
| (2) | The basic and diluted loss per share are computed by dividing the net loss attributable to common stockholders by the weighted average number of common shares outstanding during the period. For the periods where we presented losses, all potentially dilutive common shares comprising of stock options, warrants, Convertible Notes and convertible preferred stock are anti-dilutive. |
Our consolidated balance sheet data is as follows (in thousands):
| As of August 31, | ||||||||||||||||||||
| 2014 | 2013 | 2012 | 2011 | 2010 | ||||||||||||||||
| Cash and cash equivalents | $ | 3,423 | $ | 8,881 | $ | 21,069 | $ | 21,911 | $ | 33,055 | ||||||||||
| Working capital | $ | 24,607 | 28,439 | 51,226 | 16,739 | 28,325 | ||||||||||||||
| Total assets | $ | 32,424 | 37,178 | 69,247 | 36,797 | 46,648 | ||||||||||||||
| Common and preferred stock warrant liabilities | $ | - | - | - | 17,726 | 8,911 | ||||||||||||||
| Convertible Notes | $ | - | - | - | 13,630 | - | ||||||||||||||
| Total long-term liabilities | $ | 93 | 175 | 344 | 33,518 | 13,310 | ||||||||||||||
| Convertible preferred stock | $ | - | - | - | 197,502 | 197,502 | ||||||||||||||
| Total stockholders’ equity (deficit) | $ | 27,609 | $ | 33,006 | $ | 62,561 | $ | (204,318 | ) | $ | (170,829 | ) | ||||||||
| 50 |
Item 7. Management’s Discussion and Analysis of Financial Condition and Results of Operations
The following discussion and analysis of our financial condition and results of operations should be read together with our Consolidated Financial Statements and the other financial information appearing elsewhere in this Annual Report on Form 10-K. This Item 7 contains forward-looking statements that involve risks and uncertainties. Please see “Forward-Looking Statements” for a discussion of the uncertainties, risks and assumptions associated with these statements. The results of operations for the periods reflected herein are not necessarily indicative of results that may be expected for future periods, and our actual results may differ materially from those discussed in our forward-looking statements as a result of various factors, including but not limited to those listed under “Risk Factors” in Item 1A of this Annual Report on Form 10-K and those included elsewhere in this Annual Report on Form 10-K.
Overview
We are an agricultural biotechnology company that develops and markets seeds to produce crops for bioenergy and other markets that utilize plant biomass. We use a combination of advanced plant breeding, biotechnology and bioinformatics to develop seed products that we believe address the limitations of first-generation bioenergy feedstocks, such as corn and sugarcane. These technology platforms, which can increase crop productivity, improve quality, reduce crop inputs and improve cultivation on marginal land, have broad application across multiple crops, including food, feed, fiber and fuel crops.
One of our largest immediate commercial opportunities is in Brazil where we are pursuing multiple markets for our sorghum products. We market our sweet sorghum hybrids as a ‘‘drop-in’’ feedstock to complement existing feedstock supplies and extend the operating season of Brazilian sugarcane-to-ethanol mills. We also market our high biomass sorghum products to mills and other agri-industrial facilities for use in generating electricity, heat and steam. Biomass feedstocks grown from our seeds can also be used for the production of second-generation biofuels and bio-based chemicals. Due to the similarities among crops developed for bioenergy and those developed for livestock consumption, we believe that certain of our seed products may have application in the hay and forage feed market. Our upstream position in the value chain allows us to be largely independent of the success of any particular conversion technology or end use.
The seed industry has historically required very little capital to produce, condition and package seeds, and seeds have typically been priced based on a share of the value they create and thus have generated high gross margins. As a producer of proprietary seeds, we believe we are in one of the most attractive segments of the bioenergy value chain —upstream from the capital-intensive refining and conversion of biomass. Therefore, we believe our success is tied to adoption of our products rather than the relative profitability of downstream participants. Our upstream position in the bioenergy value chain also allows us to be largely independent of the success of any particular conversion technology or end use.
We believe crops such as corn, rice and sugarcane can benefit from many of the traits and genetic technologies we are developing for bioenergy crops, such as traits that provide drought tolerance. We have also generated many biotech traits specifically for cereal crops, such as rice, that increase grain yields and provide greater yield stability across different environments.
We market and sell our seed products under our Blade brand. In certain crops, including corn, rice and sugarbeet, we have out-licensed a portion of our traits and gene technology to existing market participants and continue to pursue opportunities to out-license these technologies, among other go-to-market strategies. We also market our proprietary genome viewer software, known as Persephone, to plant and biomedical researchers.
We believe that the strength of our technology has been validated by our receipt of multiple competitive grants as well as collaborations with leading companies in crop science, such as Syngenta Biotechnology and Bayer CropScience. In July 2014, our Brazilian subsidiary was selected for a competitive grant of up to approximately 10 million reais, or 4 million U.S. dollars, as well as a government subsidized credit facility for up to approximately 67.5 million reais, or 27 million U.S. dollars, from the Brazilian government under its PAISS Agricola initiative, which provides funding for transformational technologies in agriculture. Historically, we also have received a United States Agency for International Development, or USAID, grant and one of the U.S. Department of Energy’s first Advanced Research Project Agency for Energy, or ARPA-E, grants, among other federal and state grants. We also have significant intellectual property rights to our technology platforms, traits and seed products.
| 51 |
Since 2010, we have completed various field evaluations of our sorghum products in Brazil with approximately 50 ethanol mills, mill suppliers and agri-industrial facilities. During this time, our sorghum seeds were planted and harvested using existing equipment and fermented into ethanol or combusted for electricity generation without retrofitting or altering the existing mills or industrial facilities. We believe these experiences have demonstrated the “drop-in” nature of both our sweet and high-biomass sorghum products, and along with higher yielding products in our pipeline, will serve as the basis for expanded adoption of these product lines as a feedstock for ethanol and power production in Brazil and other markets.
With industrial processing of sorghum feedstock generally well established in Brazil, we believe that field performance — primarily yields of sugars that can be fermented to ethanol — will largely determine the scale and pace at which our current and future sweet sorghum products will be adopted. Based on industry feedback, we believe that minimum average yields in the range of 2,500 to 3,000 liters of ethanol per hectare will be necessary to achieve broad adoption. While we achieved yields in this range in the 2013-2014 growing season in Brazil with multiple products in multiple regions, we expect that the 2014-2015 growing season in Brazil will be necessary to validate results. Additional growing seasons beyond the 2014-2015 season may be required to fully demonstrate this yield performance across numerous geographies and for our products to gain broad adoption. For our high-biomass types, based on industry feedback, we believe that minimum average yields per hectare in the range of 30 to 40 metric tons of biomass, measured at 50% moisture content, will be necessary to achieve broad adoption. However, recent water shortages and increasing demand for power in Brazil have led to a spike in electricity prices. We believe these market conditions have made yields as low as approximately 28 metric tons per hectare economically attractive at current electricity prices.
For the 2014-2015 season, we expect to evaluate our products with more than 50 customers, which include, among others, ethanol mills and multi-mill conglomerates that we estimate are collectively responsible for more than 30% of the sugarcane crushed in Brazil. For the 2014-2015 sorghum growing season in Brazil, total plantings of our sorghum products are expected to cover up to approximately 5,000 hectares, compared to approximately 1,000 hectares planted the previous season. The increase in planted area is due primarily to increased demand for high biomass sorghum for power generation. Plantings also include small, multi-hybrid evaluations designed to determine yield potential, identify the best performing hybrids for specific regions and demonstrate various crop management practices.
To meet immediate demand for biomass for power generation and to facilitate the development of a supply chain for sorghum biomass, we will provide agronomy and crop management services for certain customers this season under our sales incentive and promotional programs, which include offtake agreements for sorghum biomass produced under our direction or management. Revenue for these plantings will be based upon yields of biomass per hectare rather than seed sales. We expect the majority of high biomass sorghum hectares this season to be planted under these sales incentive and promotional programs.
In addition to utilizing our sorghum seed products to grow feedstock for bioenergy, this season we initiated sales of our sorghum for use as livestock feed and forage, following successful evaluations in the U.S. and Brazil. The results of this season’s evaluations will help determine the commercial potential of this market for our current and future seed products.
We operate in one segment, and accordingly, our results of operations are presented on a consolidated basis. To date the majority of our revenue and expense has been denominated in U.S. dollars and foreign currency fluctuations have not had a significant impact on our historical results of operations. As we continue to penetrate the Brazilian market and enter markets outside the United States, we expect our product sales will be made in local currencies and accordingly, that foreign currency fluctuations will have a greater impact on our operating results.
| 52 |
We generate revenues from government grants, research and development collaboration agreements and from product sales. We began selling products in 2008 and, while our product sales have been minimal to date, we expect product sales to eventually become the primary source of our revenues. We expect future product revenues to include a combination of seed sales, biomass sales, and trait fees, similar to current business models used for food crops incorporating biotech traits. As we continue to develop traits for our products, we expect that a significant portion of our product revenues will be generated from the sale of seeds that include our traits.
Seed inventory costs are computed on a first-in, first-out basis and valued at the lower of cost or market with any excess cost recognized during the period within cost of product sales. When inventory costs exceed expected market value due to obsolescence or lack of demand, inventory write-downs are recorded for the difference between the cost and the market value in the period based our evaluation of such inventory. The recoverability of our seed inventory is dependent on increased customer adoption and acceptance.
We have invested significantly in research, development and technology and applied our proprietary technology platforms to energy crops and expect to continue to invest in research and development focusing on sorghum and Brazil, as well as traits with significant market potential in other crops, like corn, rice and sugarcane. For the fiscal years ended August 31, 2014, 2013 and 2012, we invested $14.2 million, $16.4 million, and $19.2 million, respectively, on research and development, with the main emphasis on breeding and traits. Our other operating expenses are related to selling, general and administrative expenses incurred to establish and build our market presence and business infrastructure.
Historically, we have funded our operations from the proceeds from issuances of convertible preferred stock, warrants, convertible notes, debt financing and common stock and payments from collaborators and government grants. We have experienced significant losses as we invested heavily on research and development and marketing, and those costs have exceeded revenues. As of August 31, 2014, we had an accumulated deficit $303.9 million. We incurred net losses of $29.3 million, $32.5 million and $29.4 million in the years ended August 31, 2014, 2013 and 2012, respectively. We expect to incur additional losses related to the continued development and expansion of our business including research and development, seed production and operations, and sales and marketing. There is no assurance that we will achieve profitable operations, or if achieved, they can be sustained on a continued basis.
In July 2014, our Brazilian subsidiary was selected for a competitive grant and a multi-year credit facility to fund a product development project for sorghum and sugarcane for up to approximately 85 million reais, or 34.7 million U.S. dollars, under the government’s PAISS Agricola program. The project consists of a non-repayable grant of up to approximately 10 million reais, or 4 million U.S. dollars, and a government-subsidized credit facility for up to approximately 67.5 million reais, or 27 million U.S. dollars. The company is expected to fund up to approximately 7.5 million reais, or 3 million U.S. dollars, of the project. We have completed the required application and have received approval in principle for the grant and credit facility. Subject to the completion of customary documentation and financial guarantees to be provided by Ceres, we expect to draw the first tranche of the non-repayable grant during our second fiscal quarter and the first tranche of the credit facility during our third fiscal quarter.
| 53 |
On October 11, 2013, we commenced the implementation of a plan (the “Plan”) intended to further align expenditures with our near-term commercial opportunity in Brazil, shift Northern Hemisphere sorghum breeding activities from College Station, Texas to a more appropriate location, de-emphasize research and development for U.S. cellulosic feedstocks, reduce costs and conserve cash. The actions taken under the Plan, which included, among others, a workforce reduction that impacted 16 positions in the U.S, were completed at August 31, 2014. During 2014, we incurred total charges of approximately $1.6 million with respect to the U.S. workforce reductions, including $0.9 million of one-time severance expenses, $0.4 million for continuation of salary and benefits of certain employees until their work was completed and $0.3 million of other costs. Of the $1.6 million of cash payments made during 2014, $1.0 million, $0.5 million and $0.1 million was recorded to research and development expenses, cost of sales and general and administrative expenses, respectively. These measures delivered cash savings of approximately $4.0 million in fiscal year 2014 and are expected to deliver cash savings of up to approximately $8.0 million annually thereafter. In connection with these measures, we concluded that our facility and certain equipment located in College Station, Texas were no longer held in use and accordingly these assets met the criteria to be classified as held for sale at May 31, 2014. Based on the agreement we entered into to sell this facility and equipment, a determination was made that the net sales price, less selling costs, was below the carrying amount for these assets. The net carrying amount for these assets was approximately $1.2 million and was reduced to an adjusted carrying value of $0.7 million at May 31, 2014. A charge of $0.5 million was recorded to Other expenses during the quarter ended May 31, 2014 to reflect the current fair value for these assets. On June 2, 2014, we completed the sale of this facility and equipment for net cash proceeds of approximately $0.7 million.
| 54 |
Public Offerings
On February 27, 2012, we closed our initial public offering, or the IPO, of 5,750,000 shares of common stock (including 750,000 shares purchased by the underwriters upon the exercise of their right to purchase up to an additional 750,000 shares) at an offering price of $13.00 per share, resulting in net proceeds to us of approximately $65.2 million, after deducting underwriting discounts and commissions and offering expenses.
Upon the closing of the IPO, our outstanding shares of convertible preferred stock were automatically converted into 15,353,221 shares of common stock and our outstanding convertible subordinated notes, or the Convertible Notes, were automatically converted into 1,098,575 shares of common stock. Additionally, our warrants to purchase shares of our common stock issued in connection with the issuance of our Series F Preferred Stock offering, or the Series F Warrants, and Series G Preferred Stock offering, or the Series G Warrants, were marked-to-market upon the IPO closing and we will no longer record any changes in the fair value of these warrants as they are now equity classified. Our warrants to purchase shares of convertible preferred stock issued in connection with certain financing arrangements converted to warrants to purchase shares of common stock upon the IPO closing, and are also now equity classified. As such, we will no longer record any changes in fair value for these warrants.
On March 10, 2014, we completed a registered public offering of 23,000,000 shares of its common stock (including 3,000,000 shares purchased by the underwriter upon the exercise in full of their right to purchase up to an additional 3,000,000 shares to cover over-allotments) at a price to the public of $1.00 per share. We received approximately $20.8 million of proceeds from the offering, after deducting underwriting discounts and commissions and offering expenses. We plan to finance our operations for the next 12-15 months with existing cash and cash equivalents, marketable securities, proceeds from the registered public offering completed on March 10, 2014, and cash inflows from collaboration and grant funding and from product sales.
Key Components of Our Results of Operations
Revenues
To date, our revenues have related to our product sales, collaborative research and government grants.
| • | Product Sales. Product sales are primarily composed of seed and biomass sales. We began selling products in 2008. |
| • | Collaborative Research. Collaborative research revenues generally consist of payments for research and development activities for specific projects. These arrangements may include a combination of non-refundable technology license fees, research and development fees, and/or fees for the achievement of contractually defined milestone events and royalties. |
| • | Government Grants. Government grant revenues consist of payments from government entities. The terms of these grants generally provide us with reimbursement for research and development services and certain types of capital expenditures over a contractually defined period. |
Cost of Product Sales
Cost of product sales consists principally of the cost of labor, raw materials and third-party services related to growing, harvesting, packaging and shipping our seeds, and direct and indirect costs related to our biomass sales. These costs are comprised of the direct costs of our seed production employees, as well as the temporary seasonal labor costs during planting and harvesting times. Third-party services include contract labor, grower payments, crop management services and other professional services related to the cost of product sales. Cost of product sales also consists of input costs such as chemicals and seed production costs. Costs associated with collaboration, research and government grants are not included in cost of product sales but instead are included as research and development expenses. Although historically not significant, future royalty expenses associated with collaboration and license agreements with third parties will be included in cost of product sales. The amount of royalties we owe under these agreements is a function of our sales, and the applicable royalty rates depend on a number of factors, including the portion of our third-party collaborator’s intellectual property that is present in our products. We believe that as we develop our agronomic production operations, we will be able to achieve lower cost of product sales. To date, we have relied principally on third parties for the production of our sweet and biomass sorghum seed for use in Brazil. We believe that as we increase seed production volumes, we will be able to achieve better economies of scale from these third parties. In addition, we intend to produce more of our own seeds in Brazil, which will allow us to further decrease our costs. In the U.S., we are currently producing our switchgrass and sorghum products at our own facility in Texas.
| 55 |
Research and Development
Research and development expenses principally consist of personnel costs related to our research and development staff in support of plant breeding, agronomy, technology development and protection, and exploratory research. Research and development expenses also include costs incurred for laboratory supplies, reimbursable costs associated with government grants and our collaborative agreements, third-party contract payments, consultants and facility and related overhead costs. Also included in research and development expenses are expenses in connection with warrants granted to The Texas A&M University System and The Samuel Roberts Noble Foundation, Inc. The warrants vest based on the achievement of certain research and commercialization milestones or the passage of time. The warrants are accounted for at fair value at each quarter end until the vesting targets are met using the Black Scholes option pricing model. As a publicly traded company, the volatility of our stock price could cause an increase in the warrant fair value and resulting expense charges to research and development.
We do not track our research and development expenditures by project. Our ongoing research and development activities are dedicated to expanding our integrated platforms which consist of a combination of genetic assets, specifically germplasm and traits, and competencies in genomics and biotechnology. Our research and development expenses consist principally of personnel and related costs and at November 7, 2014, we had 41 full-time employees primarily engaged in our research and development activities. Our employees’ work time is spread across multiple research and development methods continuously focused on our technology platforms and to a much lesser extent areas for which we have received government grant awards and collaboration funding. As we obtain data from our efforts, we may elect to reprioritize, delay or discontinue activities in order to focus our resources on more promising research and development methods.
Selling, General and Administrative
Selling, general and administrative expenses consist primarily of personnel costs related to our executive, sales, legal, finance and human resources staff and professional fees including legal and accounting. Selling costs relate to business development and our sales and marketing programs to build brand awareness. We improve our brand awareness through programs including publication of crop management guides, speaking roles at industry events, trade show displays and local-level grower meetings. Costs related to these activities, including travel, are included in selling expenses. While we expect our selling expenses to increase in the near term, we believe that our focus on a relatively small number of customers, particularly in Brazil, where we are primarily marketing our products to mill operators, should allow us to operate with relatively modest overall selling expenses. Since 2012, our selling, general and administrative expenses increased in absolute dollars in order to support product development and the requirements of being a public company. These increases included increased insurance premiums, investor relations expenses, legal and accounting fees associated with the expansion of our business and corporate governance, financial reporting expenses, and other regulatory compliance obligations. We hired additional personnel, particularly in the area of general and administrative activities to support the growth of our business.
| 56 |
Interest Expense
We recognize interest expense on our debt obligations. We expect interest expense to fluctuate in the future with changes in our debt levels.
Interest Income
Interest income consists primarily of interest earned on investments and cash balances. Our interest income will vary each reporting period depending on our average investment and cash balances during the period and market interest rates. We expect interest income to fluctuate in the future with changes in average investment and cash balances and market interest rates.
Other Income (Expense)
Prior to the closing of the IPO, our other income (expense) consisted primarily of the change in the fair value of our convertible preferred warrants, certain of our common stock warrants and the Convertible Notes. Our preferred stock warrants and certain of our common stock warrants were classified as liabilities. Upon the closing of the IPO, our preferred stock warrants converted to equity classified common stock warrants, and the impact to our results of operations from our preferred stock, Convertible Notes and certain of our common stock warrant liabilities was eliminated.
Provision for Income Tax Benefits
Since our inception, we have been subject to income taxes principally in the United States and Brazil, where we established a legal presence in 2010. We anticipate that as we expand our operations outside the United States, we will become subject to taxation based on the foreign statutory rates and our effective tax rate could fluctuate accordingly.
Income taxes are computed using the asset and liability method, under which deferred tax assets and liabilities are determined based on the difference between the financial statement and tax bases of assets and liabilities using enacted tax rates in effect for the year in which the differences are expected to affect taxable income. Valuation allowances are established when necessary to reduce deferred tax assets to the amount expected to be realized.
As of August 31, 2014 and 2013, based on the available information, it is more likely than not that our deferred tax assets will not be realized, and accordingly we have recorded a full valuation allowance against all of our deferred tax assets. As of August 31, 2014, we had approximately $247.2 million of federal, $174.1 million of state and $24.3 million of foreign operating loss carry-forwards available to offset future taxable income, if any, which expire in varying amounts from 2018 through 2034 for federal tax purposes and from 2015 through 2034 for state tax purposes if unused. The carry-forward period for the foreign net operating loss is indefinite. Federal and state laws impose substantial restrictions on the utilization of net operating loss and tax credit carry-forwards in the event of an “ownership change”, as defined in Section 382 of the U.S. Internal Revenue Code of 1986, as amended, or the Internal Revenue Code. We have not completed a Section 382 analysis to determine if a change in ownership has occurred. Until an analysis is completed, there can be no assurance that the existing net operating loss carry-forwards or credits are not subject to significant limitation.
Critical Accounting Policies and Estimates
Our discussion and analysis of our financial condition and results of operations is based upon our consolidated financial statements, which have been prepared in accordance with accounting principles generally accepted in the United States. The preparation of these consolidated financial statements requires us to make estimates and assumptions that affect the reported amounts of assets, liabilities, revenues, expenses and related disclosures. We base our estimates and assumptions on historical experience and on various other factors that we believe to be reasonable under the circumstances. We evaluate our estimates and assumptions on an ongoing basis. The results of our analysis form the basis for making assumptions about the carrying values of assets and liabilities that are not readily apparent from other sources. Our actual results may differ from these estimates under different assumptions or conditions.
| 57 |
We believe the following critical accounting policies involve significant areas of management’s judgments and estimates in the preparation of our financial statements.
Revenue Recognition
Revenues are recognized when the following criteria are met: (1) persuasive evidence of an arrangement exists; (2) transfer of product or technology has been completed or services have been rendered; (3) the fee is fixed or determinable; and (4) collectability is reasonably assured. To date, our primary source of revenues has been derived from research collaborations and government grants and to a lesser extent, product sales.
Product Sales
Product sales are derived from seed and biomass sales, and trait fees. Product sales are recognized, net of discounts and allowances, once passage of title and risk of loss have occurred and contractually specified acceptance criteria have been met, provided all other revenue recognition criteria have also been met.
Collaborative Research and Government Grants
From time to time, we have entered into research and development collaboration agreements with third parties, including a large agriculture supplier, a consumer goods conglomerate and several biofuel producers. In addition, we have received grants from government agencies such as the DOE and the USDA. The research and development collaboration agreements typically provide us with multiple revenue streams, which may include upfront, non-refundable fees for licensing certain of our technologies, fees for research and development activities, and contingent milestone payments upon achievement of contractual criteria.
| • | Technology License Fees. For collaboration agreements in which we have continuing involvement, license fees are recognized on a straight-line basis over the term of the arrangement. Licensing fees are non-refundable and not subject to future performance. |
| • | Government Grants. We receive payments from government entities in the form of government grants. Government grants generally provide us with cost reimbursement for certain types of expenditures in return for research and development activities over a contractually defined period, as well as an allocated portion of our overhead expenses. Revenues from government grants are recognized in the period during which the related costs are incurred, provided that substantially all conditions under which the government grants were provided have been met and we only have perfunctory obligations outstanding. |
| • | Research and Development Fees. Generally, fees for research and development activities are recognized as the services are performed over the performance period, as specified in the respective agreements. Certain of our collaboration agreements require us to deliver research data by specific dates and the collective program plan will result in reaching specific crop characteristics by certain dates. For such arrangements, we recognize revenues based on the approximate percentage of completion of services under the agreement, but the revenue recognized cannot exceed the payments that have accrued to us to date under the agreement. The research and development period is estimated at the inception of each agreement and is periodically evaluated. |
| 58 |
| • | Milestone Payments. Fees that are contingent upon achievement of substantive performance milestones at inception of the agreement are recognized based on the achievement of the milestone, as defined in the respective agreements. |
We recognize deferred revenue to the extent that cash received under the collaboration agreement is in excess of the revenues recognized related to the agreement since the work under the agreement has not yet been performed, or the work has not been fully completed as prescribed in the statement of work at the balance sheet date, which is classified as other current liabilities on the accompanying consolidated balance sheets.
In December 2007, we entered into a development and license agreement with Campbell Soup Company, or Campbell. The agreement provided that we would receive $7.5 million in payments from Campbell over a five-year period provided milestones were met. In addition, the agreement provided that we would be entitled to receive a royalty based on the gross sales of crop varieties created under the agreement. In December 2011, the development and license agreement was amended to extend the $7.5 million in payments from Campbell over a six-year period. We recognized revenue of $0.8 million, $0.9 million and $1.7 million under this agreement in the years ended August 31, 2013, 2012, and 2011, respectively. On November 19, 2012, the development and license agreement was terminated following Campbell’s sale of its vegetable seed assets to a third party. In connection with the termination, Campbell paid us $0.55 million of the remaining $0.63 million due under the agreement, which would otherwise have become payable by Campbell in 2013, in full and complete satisfaction of all remaining financial obligations under the development and license agreement.
We have earned research funding revenues from several agreements with the DOE, the USDA, USAID and several leading biofuel producers whereby we performed research activities and received revenues that partially reimbursed our expenses incurred. Under such grants and agreements, we retained a proprietary interest in the products and technology we developed. These expense reimbursements primarily consisted of direct expense sharing arrangements. We recorded revenue related to these grants of approximately $1.6 million, $2.4 million and $2.4 million in the years ended August 31, 2014, 2013 and 2012, respectively. The cumulative remaining amount to be claimed for all grants outstanding as of August 31, 2014 is approximately $1.7 million.
On December 16, 2008, we entered into a software license and collaboration agreement with Syngenta pursuant to which we provided software, software development and customer support for our Persephone genome viewer software. The agreement was structured into three phases and under the agreement, we received $1.5 million in payments over an approximate 4.5 year period. The software delivered is comprised of multiple elements, which include software, installation, training, customization of software, and software support. On April 16, 2012, the agreement was amended to reflect Syngenta’s acceptance of all software and software support services provided under the original agreement and to allow for the continuation of certain software support services during a post development support period beginning April 16, 2012 and extending until all services are terminated pursuant to the terms of the agreement. We recognized revenues equal to the amount of expense recognized as services were rendered until April 15, 2012, when the software support became the only undelivered element. Beginning April 16, 2012, the unrecognized revenue under the agreement was recognized ratably over the first additional software support period. We recognized revenue totaling $0.3 million, $1.2 million and $0.8 million under this agreement in the years ended August 31, 2014, 2013 and 2012, respectively.
For the fiscal year ended August 31, 2014, USAID, ARPA-E, Exelus, and Syngenta represented 41.9%, 17.5%, 16.5% and 11.6% of our revenues, respectively. For the fiscal year ended August 31, 2013, Syngenta, ARPA-E, USAID and Campbell Soup Company represented 22.5%, 21.2%, 20.2% and 14.5% of our revenues, respectively.
| 59 |
Convertible Notes and Warrant Modification
In August 2011, we completed the sale of $11.4 million aggregate principal amount of the Convertible Notes to nine existing investors in the Company in a private placement. The Convertible Notes were convertible, subject to the terms and conditions set forth therein, into shares of our common stock upon the consummation of a qualified initial public offering of our common stock at a price per share equal to 20% discount from the public offering price, or $10.40. Purchasers of the Convertible Notes included holders of more than 5% of our outstanding capital stock and affiliates of certain of our directors. Additionally, so long as any investors who held warrants to purchase shares of our common stock issued in connection with certain of our preferred stock financings purchased at least their respective full pro rata portion of the Convertible Notes being offered, we agreed to amend the termination provisions of such investors existing warrants such that the warrants no longer expired upon our initial public offering. In January 2012, we amended the Convertible Notes such that the notes would have automatically converted into shares of convertible preferred stock had the initial public offering not consummated by June 30, 2012.
In connection with the offering of the Convertible Notes, warrants to purchase 539,972 shares of common stock issued in connection with our Series F Preferred Stock offering, or the Modified F warrants and all of the warrants issued in connection with our Series G Preferred Stock offering were amended such that they would no longer expire upon the completion of a qualified initial public offering at a price per share greater than or equal to $19.50 per share (subject to certain adjustments) and resulting in aggregate gross proceeds to us and any selling security holders of $40.0 million or more. Warrants to purchase 229,257 shares of common stock issued in connection with the Series F Preferred Stock offering, or the Non-Modified F warrants were not amended and remain outstanding.
We calculated the fair value of the Modified F warrants and the Series G Warrants immediately prior to and subsequent to the modification and determined that the cumulative incremental increase in the fair value of these liability classified warrants associated with this modification to be $9.6 million. Accordingly, we recorded the change in value to other income (expense) in August 2011.
Until such time as the conversion features were triggered, we accounted for the Convertible Notes and various embedded derivatives in accordance with ASC 825-10, the Fair Value Option for Financial Liabilities, whereby we initially and subsequently measured this financial instrument in its entirety at fair value, with the changes in fair value recorded each quarterly reporting period in other income (expense).
We obtained the assistance of a third-party valuation firm in estimating that the fair market value of the Convertible Notes as of August 31, 2011 was $13.6 million. We estimated the fair value of the Convertible Notes upon the closing of the IPO to be $14.3 million. Accordingly, the change in fair value was recorded in other income (expense).
Upon closing of the IPO, the Convertible Notes were revalued and converted into 1,098,575 shares of common stock.
Stock-Based Compensation
We recognize compensation expense related to stock-based compensation, including the awarding of employee and non-employee stock options, based on the grant date estimated fair value. We amortize the fair value of the employee stock options on a straight-line basis over the requisite service period of the award, which is generally the vesting period. Options granted to non-employees are re-measured as the services are performed and the options vest, and any resulting change in value is recognized as expense during the period the related services are rendered. We account for restricted stock grants issued based on the fair market value of our common stock. We estimate the fair value of stock-based compensation awards using the Black-Scholes option pricing model, which requires judgments to be made, including estimating: (i) the expected life of an award; (ii) stock price volatility; and (iii) prior to the IPO, estimating the fair value of our common stock.
The Black-Scholes option-pricing model calculates the estimated fair value of stock options using the following inputs: (i) expected life; (ii) expected volatility; (iii) risk-free interest rate; (iv) expected dividend yield rate; (v) exercise price; and (vi) closing price of our common stock on the date of grant. Due to our limited history of grant activity, we calculate our expected term utilizing the “simplified method” permitted by the SEC, which is the average of the total contractual term of the option and its vesting period. We calculate our expected volatility rate from the historical volatilities of selected comparable public companies within our industry, due to a lack of historical information regarding the volatility of our stock price. We will continue to analyze the historical stock price volatility assumption as more historical data for our common stock becomes available. The risk-free interest rate is based on the U.S. Treasury yield curve in effect at the time of grant for zero coupon U.S. Treasury notes with maturities similar to the option’s expected term. We do not expect to pay dividends. Forfeitures have been estimated based upon our historical and expected forfeiture experience.
| 60 |
The estimated fair value of a stock option using the Black-Scholes option-pricing model is impacted significantly by changes in a company’s stock price. For example, all other assumptions being equal, the estimated fair value of a stock option will increase as the closing price of a company’s stock increases, and vice versa. Prior to the closing of the IPO, we were a private company and, as such, we were required to estimate the fair value of our common stock. In the absence of a public trading market, we determined a reasonable estimate of the then-current fair value of our common stock for purposes of granting stock-based compensation based on multiple criteria. We estimated the fair value of our common stock utilizing methodologies, approaches and assumptions consistent with the American Institute of Certified Public Accountants Practice Aid, “Valuation of Privately-Held-Company Equity Securities Issued as Compensation”, or the AICPA Practice Aid. After the closing of the IPO, the fair value of our common stock is no longer an estimate as it is based upon the closing price of our stock on the NASDAQ Market on the date of grant.
Common and Preferred Stock Warrants Financing
Liability Classified Warrants to Purchase Common Stock
In connection with our Series F Preferred Stock offering in September 2007, we issued warrants to purchase 769,229 shares of common stock at an exercise price of $19.50 per share. The warrants are immediately exercisable. These warrants were reported as a liability at fair value as of each balance sheet date prior to the IPO. Upon the closing of the IPO, these warrants no longer met the requirements for liability classification. As such, these warrants were valued as of the closing date of the IPO with changes being recorded to the statement of operations and were reclassified to additional paid-in capital.
Upon the closing of the IPO, we estimated the fair value of the Non-Modified F Warrants and the Modified F warrants to be $6.3 million based on a risk free rate of 0.40%, expected volatility of 89%, expected term of 3.5 years and 0% dividend yield.
In connection with our Series G Preferred Stock offering in June 2010, we issued warrants to purchase 1,025,640 shares of common stock at an exercise price of $19.50 per share. The warrants are immediately exercisable. These warrants were reported as a liability at fair value as of each balance sheet date prior to the IPO. Upon the closing of the IPO, the common stock warrants no longer met the requirements for liability classification. The warrants were valued as of the closing date of the IPO with changes being recorded to the statement of operations and were reclassified to additional paid-in capital.
Upon the closing of the IPO, we estimated the fair value of these warrants to be $10.6 million based on a risk free rate of 1.64%, expected volatility of 73%, expected term of 8.3 years and 0% dividend yield.
Liability Classified Warrants to Purchase Convertible Preferred Stock
Prior to the IPO, we issued warrants to purchase shares of our convertible preferred stock, or the Preferred Stock Warrants, in connection with certain financing arrangements. We accounted for these warrants as liabilities because the underlying shares of convertible preferred stock were redeemable in the case of a deemed liquidation. We estimated the fair value of our Preferred Stock Warrants using an option-pricing model, which incorporated several estimates and assumptions that were subject to significant management judgment. Changes in fair value at each period end were recorded in other income (expense) in our consolidated statement of operations.
| 61 |
Upon the closing of the IPO, the Preferred Stock Warrants no longer met the requirements for liability classification. The warrants were valued as of the closing date with changes being recorded to the statement of operations and were reclassified to additional paid-in capital.
Upon closing of the IPO, we estimated the fair value of these warrants to be $0.2 million based on a risk free rate of 1.35%, expected volatility of 81%, expected term of 7.96 - 8.01 years and 0% dividend yield.
Seed Inventory
At August 31, 2014 and 2013, seed inventory consisted of work-in-process and included finished goods at August 31, 2014 for costs related to our sorghum seeds in Brazil. When inventory costs exceed expected market value due to obsolescence or lack of demand, inventory write-downs are recorded for the difference between the cost and the market value in the period based on our evaluation of such inventory.
Income Taxes
Income taxes are accounted for under the asset and liability method. Deferred tax assets and liabilities are recognized for the future tax consequences attributable to differences between the financial statement carrying amounts of existing assets and liabilities and their respective tax bases and operating loss and tax credit carryforwards. Deferred tax assets and liabilities are measured using enacted tax rates expected to apply to taxable income in the years in which those temporary differences are expected to be recovered or settled. The effect on deferred tax assets and liabilities of a change in tax rates is recognized in income in the period that includes the enactment date. We record a valuation allowance when it is more likely than not that some of our net deferred tax assets will not be realized. In determining the need for valuation allowances, we consider our projected future taxable income and the availability of tax planning strategies. We have recorded a full valuation allowance to reduce our net deferred tax assets to zero because we have determined that it is more likely than not that our net deferred tax assets will not be realized. If in the future we determine that we will be able to realize any of our net deferred tax assets, we will make an adjustment to the allowance, which would increase our income in the period that the determination is made.
We operate in various tax jurisdictions and are subject to audit by various tax authorities. We recognize the effect of income tax positions only if those positions are more likely than not of being sustained. Recognized income tax positions are measured at the largest amount that is greater than 50% likely of being realized. Changes in recognition or measurement are reflected in the period in which the change in judgment occurs.
Assets Held for Sale
We reclassify long-lived assets to Assets Held for Sale when all required criteria for such reclassification are met. The assets are recorded at the lower of the carrying value or fair value less costs to sell. Assets held for sale must meet the following conditions: (1) management, having authority to approve the action, commits to a plan to sell the asset, (2) the asset is available for immediate sale in its present condition, (3) an active program to locate a buyer and other actions required to complete the plan to sell the asset have been initiated, (4) the sale of the asset is probable, and transfer of the asset is expected to qualify for recognition as a completed sale, within one year, (5) the asset is being actively marketed for sale at a price that is reasonable in relation to its current fair value, and (6) actions required to complete the plan indicate that it is unlikely that significant changes to the plan will be made or that the plan will be withdrawn.
In connection with an agreement we entered into on March 31, 2014 to sell its facility and certain equipment located in College Station, Texas, a determination was made that the assets met the criteria to be classified as held for sale and the fair value for the related assets was in excess of their carrying amount. Accordingly, during 2014, we recorded a charge of $0.5 million to Other expense for the difference between the net carrying amount of these assets of $1.2 million and the net cash proceeds of $0.7 million. On June 2, 2014, we completed the sale of this facility and equipment for net cash proceeds of approximately $0.7 million.
| 62 |
Impairment of Long-Lived Assets
Long-lived assets, such as property and equipment, are reviewed for impairment whenever events or changes in circumstances indicate that the carrying amount of an asset may not be recoverable. Our long-lived assets comprise a single asset group for evaluation purposes. We evaluate whether an impairment indicator occurs primarily based on progress achieved against our business plans. To the extent that an impairment indicator has occurred, recoverability of assets to be held and used is measured by a comparison of the carrying amount of an asset to estimated undiscounted future cash flows expected to be generated by the asset. If the carrying amount of an asset exceeds its estimated undiscounted future cash flows, an impairment charge is recognized in the amount by which the carrying amount of the asset exceeds the fair value of the asset.
On February 3, 2012 our plant breeding and field research station located near College Station, Texas was damaged by a tornado. The impact was limited to structural damage to the building that houses office space, a small laboratory used to evaluate biomass samples and workspace, the small tractor sheds and damage to some agricultural equipment.
In fiscal year 2012, we impaired approximately $1.0 million in assets related to damage at the Texas facility and received insurance proceeds of $1.0 million for repair costs. The remainder of the repairs, which totaled approximately $0.2 million, was completed by November 30, 2012. These remaining repairs were also covered by insurance, subject to our deductible. There were no other impairments during the reporting periods presents.
| 63 |
Results of Operations
The following table sets forth our consolidated results of operations for the periods shown (in thousands):
| Year Ended August 31, | ||||||||||||
| 2014 | 2013 | 2012 | ||||||||||
| Revenues: | ||||||||||||
| Product sales | $ | 146 | $ | 462 | $ | 432 | ||||||
| Collaborative research and government grants | 2,258 | 4,781 | 4,939 | |||||||||
| Total revenues | 2,404 | 5,243 | 5,371 | |||||||||
| Cost and operating expenses: | ||||||||||||
| Cost of product sales | 3,021 | 6,245 | 2,384 | |||||||||
| Research and development | 14,156 | 16,401 | 19,155 | |||||||||
| Selling, general and administrative | 14,484 | 15,187 | 12,634 | |||||||||
| Total cost and operating expenses | 31,661 | 37,833 | 34,173 | |||||||||
| Loss from operations | (29,257 | ) | (32,590 | ) | (28,802 | ) | ||||||
| Interest expense | (68 | ) | (46 | ) | (560 | ) | ||||||
| Interest income | 5 | 126 | 39 | |||||||||
| Other expense | - | - | (84 | ) | ||||||||
| Loss before income taxes | (29,320 | ) | (32,510 | ) | (29,407 | ) | ||||||
| Income tax expense | (1 | ) | (1 | ) | (3 | ) | ||||||
| Net loss | $ | (29,321 | ) | $ | (32,511 | ) | $ | (29,410 | ) | |||
Comparison of Years Ended August 31, 2014 and 2013
Revenues
| Year Ended | ||||||||||||
| August 31, | ||||||||||||
| 2014 | 2013 | Change | ||||||||||
| (In thousands) | ||||||||||||
| Product sales | $ | 146 | $ | 462 | $ | (316 | ) | |||||
| Collaborative research and government grants | 2,258 | 4,781 | (2,523 | ) | ||||||||
| Total revenues | $ | 2,404 | $ | 5,243 | $ | (2,839 | ) | |||||
Our total revenues decreased by $2.8 million to $2.4 million for the year ended August 31, 2014 compared to the year ended August 31, 2013. Collaborative research and government grant revenue decreased by $2.5 million primarily due to the completion of work scheduled under various grants and collaborations and to a lesser extent due to the deferment of certain collaborative research revenue into fiscal year 2015. Product sales decreased by $0.3 million primarily due to reduced biomass sales, which resulted from changes and reductions in our sales incentive and promotional programs for the 2013-2014 sorghum growing season in Brazil.
| 64 |
Cost and Operating Expenses
| Year Ended | ||||||||||||
| August 31, | ||||||||||||
| 2014 | 2013 | Change | ||||||||||
| (In thousands) | ||||||||||||
| Cost of product sales | $ | 3,021 | $ | 6,245 | $ | (3,224 | ) | |||||
| Research and development | 14,156 | 16,401 | $ | (2,245 | ) | |||||||
| Selling, general and administrative | 14,484 | 15,187 | $ | (703 | ) | |||||||
| Total cost and operating expenses | $ | 31,661 | $ | 37,833 | $ | (6,172 | ) | |||||
Cost of Product Sales
Our cost of product sales decreased by $3.2 million to $3.0 million for the year ended August 31, 2014 compared to the same period in the prior year. The decrease was primarily due to reduced expenses of $1.7 million resulting from changes and reductions in crop management services performed under our sales incentive based promotional programs for the 2012-2013 growing season in Brazil, and due to $1.5 million of reduced expenses related to obsolete seed inventory.
Research and Development Expenses
Our research and development expenses decreased by $2.2 million to $14.2 million for the year ended August 31, 2014 compared to the year ended August 31, 2013. In the U.S., research and development expenses decreased by $2.6 million due to reduced external research and development and licensing expenses of $1.9 million, reduced personnel and related expenses of $1.3 million, partially offset by increased laboratory and agricultural supply costs of $0.6 million. In Brazil, research and development expenses increased by $0.4 million primarily as a result of increased personnel and related expenses.
Selling, General and Administrative Expenses
Our selling, general and administrative expenses decreased by $0.7 million to $14.5 million for the year ended August 31, 2014 compared to the prior year. In the U.S., the expenses decreased by $1.9 million due to reduced personnel and related expense of $1.4 million and reduced legal and professional and patent expenses of $0.5 million. Our Brazil expenses increased by $1.2 million as a result of increased expenditures related to establishing and building our market presence and business infrastructure.
Interest Expense, Interest Income and Other (Expense) Income
| Year Ended | ||||||||||||
| August 31, | ||||||||||||
| 2014 | 2013 | Change | ||||||||||
| (In thousands) | ||||||||||||
| Interest expense | $ | (68 | ) | $ | (46 | ) | $ | (22 | ) | |||
| Interest income | 5 | 126 | $ | (121 | ) | |||||||
| Total | $ | (63 | ) | $ | 80 | $ | (143 | ) | ||||
| 65 |
Interest Expense
Interest expense increased $22,000 for the year ended August 31, 2014 compared to the prior year. The increase is related to our Brazil operations.
Interest Income
Interest income decreased $121,000 for the year ended August 31, 2014 compared to the prior year. The decrease was primarily due to lower average cash invested balances and slightly reduced rates of return.
Comparison of Years Ended August 31, 2013 and 2012
Revenues
| Year Ended | ||||||||||||
| August 31, | ||||||||||||
| 2013 | 2012 | Change | ||||||||||
| (In thousands) | ||||||||||||
| Product sales | $ | 462 | $ | 432 | $ | 30 | ||||||
| Collaborative research and government grants | 4,781 | 4,939 | (158 | ) | ||||||||
| Total revenues | $ | 5,243 | $ | 5,371 | $ | (128 | ) | |||||
Our total revenues decreased by $0.2 million to $5.2 million for the year ended August 31, 2013 compared to the year ended August 31, 2012. The decrease was primarily driven by a decrease in collaborative research revenue of approximately $0.1 million as a result of decreased activity under our various collaborations.
| 66 |
Cost and Operating Expenses
| Year Ended | ||||||||||||
| August 31, | ||||||||||||
| 2013 | 2012 | Change | ||||||||||
| (In thousands) | ||||||||||||
| Cost of product sales | $ | 6,245 | $ | 2,384 | $ | 3,861 | ||||||
| Research and development | 16,401 | 19,155 | $ | (2,754 | ) | |||||||
| Selling, general and administrative | 15,187 | 12,634 | $ | 2,553 | ||||||||
| Total cost and operating expenses | $ | 37,833 | $ | 34,173 | $ | 3,660 | ||||||
Cost of Product Sales
Our cost of product sales increased by $3.9 million to $6.2 million for the year ended August 31, 2013 compared to the same period in the prior year. The increase was primarily due to expenses of $2.2 million for obsolete seed inventory relating to our sweet sorghum products and $1.7 million for crop management services performed under sales incentive based promotional programs for the 2012-2013 growing season in Brazil.
Research and Development Expenses
Our research and development expenses decreased by $2.8 million to $16.4 million for the year ended August 31, 2013 compared to the year ended August 31, 2012. In the U.S., research and development expenses decreased due to reduced personnel and related expenses of $1.6 million, reduced external research and development expenses of $0.6 million and reduced laboratory and agricultural supply costs of $0.6 million.
Selling, General and Administrative Expenses
Our selling, general and administrative expenses increased by $2.6 million to $15.2 million for the year ended August 31, 2013 compared to the prior year. The change is attributable to increases in Brazil for personnel and related administrative expenses related to our activities in Brazil.
Interest Expense, Interest Income and Other (Expense) Income
| Year Ended | ||||||||||||
| August 31, | ||||||||||||
| 2013 | 2012 | Change | ||||||||||
| (In thousands) | ||||||||||||
| Interest expense | $ | (46 | ) | $ | (560 | ) | $ | 514 | ||||
| Interest income | 126 | 39 | $ | 87 | ||||||||
| Other expense | - | (84 | ) | $ | 84 | |||||||
| Total | $ | 80 | $ | (605 | ) | $ | 685 | |||||
Interest Expense
Interest expense decreased by $0.5 million for the year ended August 31, 2013 compared to the prior year. The decrease is attributable to reduced debt balances resulting from our repayment of all debt owed under our Loan Agreement with Silicon Valley Bank in May 2012.
Interest Income
Interest income increased by $0.1 million for the year ended August 31, 2013 compared to the prior year. The increase was primarily due to higher average cash invested balances.
| 67 |
Other Expense
Other expense income decreased by $0.1 million for the year ended August 31, 2013 compared to the prior year. The decrease was the result of the fair value changes associated with our warrants and Convertible Notes which upon completion of the IPO are no longer marked to market.
Liquidity and Capital Resources
Since our inception, we have incurred significant net losses, and, as of August 31, 2014, we had an accumulated deficit of $303.9 million. We expect to incur additional losses related to the continued development and expansion of our business including research and development, seed production and operations, and sales and marketing. As of August 31, 2014, we believe that our existing cash and cash equivalents and marketable securities will provide adequate resources to fund our operations, including research and development expenses, planned capital expenditures and working capital requirements for the next 12 to 15 months. We will seek additional funds through collaborations, public or private debt or equity financings or government programs, and may also seek to reduce expenses related to our operations. There are no assurances that such public or private financing of government programs will be available to us or that the terms would be acceptable to us. There is also no assurance that we will achieve profitable operations, or if achieved, that we can sustain them on a continued basis.
On March 10, 2014, we completed a registered public offering of 23,000,000 shares of our common stock (including 3,000,000 shares purchased by the underwriter upon the exercise in full of their right to purchase up to an additional 3,000,000 shares to cover over-allotments) at a price to the public of $1.00 per share, resulting in net proceeds of approximately $20.8 million, after deducting underwriting discounts and commissions and offering expenses. We also issued warrants to purchase an aggregate of 480,000 shares of our common stock to certain affiliated designees of the underwriter as part of the underwriter’s compensation. The warrants are exercisable at any time and from time to time, in whole or in part, beginning on March 4, 2015 and expire on March 4, 2019. The exercise price is $1.50 per share of common stock.
On October 11, 2013, we commenced the implementation of a plan (Plan) intended to further align expenditures with our near-term commercial opportunity in Brazil, shift Northern Hemisphere sorghum breeding activities from College Station, Texas to a more appropriate location, de-emphasize research and development for U.S. cellulosic feedstocks, reduce costs and conserve cash. The actions taken under the Plan, which included, among others, a workforce reduction that impacted 16 positions in the U.S, were completed at August 31, 2014. During 2014, we incurred total charges of approximately $1.6 million with respect to the U.S. workforce reductions, including $0.9 million of one-time severance expenses, $0.4 million for continuation of salary and benefits of certain employees until their work was completed and $0.3 million of other costs. Of the $1.6 million of cash payments made during 2014, $1.0 million, $0.5 million and $0.1 million was recorded to research and development expenses, cost of sales and general and administrative expenses, respectively.
For the years ended August 31, 2014, 2013 and 2012 we used $1.0 million, $0.9 million and $1.3 million, respectively, in cash to fund capital expenditures. We currently anticipate making aggregate capital expenditures of between $0.5 million and $1.0 million for the year ended August 31, 2015.
The following table sets forth a summary of our cash flows for the periods indicated (in thousands):
| Year Ended August 31, | ||||||||||||
| 2014 | 2013 | 2012 | ||||||||||
| Net cash used in operating activities | $ | (22,563 | ) | $ | (27,855 | ) | $ | (25,312 | ) | |||
| Net cash (used in) provided by investing activities | (3,589 | ) | 16,043 | (36,543 | ) | |||||||
| Net cash provided by (used in) financing activities | 20,592 | (180 | ) | 61,275 | ||||||||
| 68 |
Cash Flows from Operating Activities
For all periods presented, we have incurred net losses and net cash used in operating activities. The net cash used in operating activities primarily resulted from significant research and development expenses and seed production costs to develop and produce our seeds and traits. Such expenses and costs have exceeded our revenues, which have primarily been generated from collaborative research and government grants and, to a much lesser extent, product sales.
Net cash outflows of $22.6 million from operating activities during the year ended August 31, 2014 primarily resulted from our net loss of $29.3 million, which was partially offset by non-cash charges of $5.4 million and changes in operating assets of $1.4 million. Non-cash charges primarily included $1.5 million in depreciation expense, $0.3 million in amortization of discounts on marketable securities and $3.1 million in stock-based compensation expense. The net change in our operating assets and liabilities was $1.3 million, primarily consisting of an increase in accounts payable and accrued expenses of $0.4 million, an increase in deferred revenue of $0.4 million and a decrease in accounts receivable of $0.6 million.
Net cash outflows of $27.9 million from operating activities during the year ended August 31, 2013 primarily resulted from our net loss of $32.5 million, which was partially offset by non-cash charges of $6.0 million. Non-cash charges primarily included $1.9 million in depreciation expense, $0.6 million in amortization of discounts on marketable securities and $3.3 million in stock-based compensation expense. The net change in our operating assets and liabilities was $1.4 million, primarily consisting of a decrease in accounts payable and accrued expenses of $1.6 million, a decrease in deferred revenue of $0.7 million and an increase in accounts receivable of $0.2 million, all of which was offset by a decrease in inventories of $0.7 million and a decrease in prepaid expenses and other assets of $0.4 million.
Net cash outflows of $25.3 million from operating activities during the year ended August 31, 2012 primarily resulted from our net loss of $29.4 million, which was partially offset by non-cash charges of $4.1 million. Non-cash charges primarily included $2.1 million in depreciation expense, $1.9 million in stock-based compensation expense and $0.1 million in the fair value of warrants and Convertible Notes. Net change in our operating assets and liabilities was flat and consists of a $2.8 million decrease in deferred offering costs, a $0.5 million decrease in accounts receivable, a $0.1 million decrease in other assets, which was offset by a $1.8 million decrease in accounts payable and accrued expenses, a $0.3 million decrease in deferred revenue and deferred rent, a $0.8 million increase in inventory and a $0.4 million increase in prepaid expenses.
Cash Flows from Investing Activities
Our investing activities consisted primarily of net investment purchases, maturities of investments and capital expenditures.
Net cash used in investing activities was $3.6 million during the year ended August 31, 2014, which resulted from the purchase of marketable securities of $33.1 million and the purchase of property and equipment of $1.0 million, which was mostly offset by the maturity of marketable securities of $29.7 million and proceeds from the sale of the property and equipment of $0.8 million.
Net cash provided by investing activities was $16.0 million during the year ended August 31, 2013, which resulted from the maturity of marketable securities of $32.9 million offset by the purchase of marketable securities of $16.0 million and the purchase of property and equipment of $0.9 million.
Net cash used in investing activities was $36.5 million during the year ended August 31, 2012, which included the $39.2 million purchase of marketable securities and $1.3 million paid for property and equipment purchases, partially offset by $3.0 million resulting from the release of restricted cash and $1.0 million provided by insurance proceeds related to the tornado damage to our plant breeding and field research station located near College Station, Texas.
| 69 |
Cash Flows from Financing Activities
Net cash inflows of $20.6 million from finance activities during the year ended August 31, 2014 was due to $20.8 million net proceeds from the issuance of common stock in connection with our follow-on equity offering, which was partially offset by $0.2 million of payments on capital leases.
Net cash used in finance activities of $0.2 million during the year ended August 31, 2013 resulted from principal payments on debt.
Net cash provided by financing activities of $61.3 million during the year ended August 31, 2012 was due to net IPO proceeds of $65.2 million, borrowings under our Loan Agreement with Silicon Valley Bank of $2.5 million, and stock option exercises of $0.5 million, offset by net principal debt repayments of approximately $6.9 million, including all amounts due and owing under our Loan Agreement with Silicon Valley Bank in connection with our termination of the Loan Agreement.
Contractual Obligations
The following is a summary of our contractual obligations as of August 31, 2014:
| Year Ended | ||||||||||||||||||||||||
| August 31, | ||||||||||||||||||||||||
| For Years Ended August 31, | 2019 and | |||||||||||||||||||||||
| Contractual Obligations | Total | 2015 | 2016 | 2017 | 2018 | Beyond | ||||||||||||||||||
| (In thousands) | ||||||||||||||||||||||||
| Operating Lease Obligations | $ | 3,163 | $ | 689 | 674 | $ | 616 | $ | 560 | $ | 624 | |||||||||||||
| Interest Payments Relating to Long-Term Debt | $ | 27 | 18 | 9 | - | - | - | |||||||||||||||||
| Research Collaboration Agreements | $ | 1,682 | 863 | 694 | 125 | - | - | |||||||||||||||||
| Long-Term Debt | $ | 88 | 70 | 18 | - | - | - | |||||||||||||||||
| Total | $ | 4,960 | $ | 1,640 | $ | 1,395 | $ | 741 | $ | 560 | $ | 624 | ||||||||||||
Off-Balance Sheet Arrangements
We did not have during the periods presented, and we do not currently have, any off-balance sheet arrangements, as defined under SEC rules, such as relationships with unconsolidated entities or financial partnerships, which are often referred to as structured finance or special purpose entities, established for the purpose of facilitating financing transactions that are not required to be reflected on our consolidated balance sheets.
Seasonality
Product sales are dependent upon planting and growing seasons, which vary from year to year, and are expected to result in both highly seasonal patterns and substantial fluctuations in quarterly sales and profitability. Our product sales for the years ended August 31, 2014 and 2013 were minimal and, accordingly, we have not yet experienced the full nature or extent to which our business may be seasonal. We expect that the sale of our seeds and biomass in Brazil to vary primarily between our first, second and third fiscal quarters, due to the timing of the planting, type of sales contract and decisions made by our customers. As we increase our sales in our current markets, and as we expand into new markets in different geographies, it is possible we may experience different seasonality patterns in our business. Weather conditions and natural disasters, such as heavy rains, hurricanes, hail, floods, tornadoes, freezing conditions, drought or fire, also affect decisions by our customers about the types and amounts of seeds to plant and the timing of harvesting and planting such seeds. Disruptions that cause delays by our customers in harvesting or planting can result in the movement of orders to a future quarter, which would negatively affect the quarter and cause fluctuations in our operating results.
| 70 |
Inflation
We believe that inflation has not had a material impact on our results of operations for the years ended August 31, 2014, 2013 and 2012. There can be no assurance that future inflation will not have an adverse impact on our operating results and financial condition.
Recent Accounting Pronouncements
The information contained in Note (2) to the Audited Consolidated Financial Statements under the heading recent accounting pronouncements is hereby incorporated by reference in this Part I, Item 3.
Item 7A. Quantitative and Qualitative Disclosures about Market Risk
We are exposed to the effect of interest rate changes, foreign currency fluctuations and changes in commodity prices. We are also exposed to changes in the general economic conditions in the countries where we conduct business, which currently is substantially all in the United States and Brazil.
Interest Rate Risk
As of August 31, 2014, our exposure to risk for changes in interest rates primarily related to our cash equivalents and marketable securities. We have investments in money market funds, commercial paper and corporate bonds, which all have relatively short term maturities. Accordingly, our interest income fluctuates with short term market conditions. All marketable securities are classified as available for sale and are highly liquid. Due to the relatively short-term nature of our investments, we do not believe that there would be a significant negative impact to our consolidated financial position or results of operations as a result of interest rate fluctuations in the financial markets. While we believe our cash equivalents do not contain excessive risk, we cannot provide absolute assurance that in the future our investments will not be subject to adverse changes in market value. In addition, we maintain significant amounts of cash and cash equivalents at one or more financial institutions that are in excess of federally insured limits. We cannot assure you that we will not experience losses on these deposits.
Prior to completion of the IPO, our exposure to risk for changes in interest rates had primarily related to our equipment loans with Silicon Valley Bank, which were variable-rate debt obligations. At August 31, 2014, we had paid off all amounts due and owing under the equipment loans and have limited interest rate risk related to our indebtedness.
Foreign Currency Risk
We have foreign currency risks related to our operating expenses denominated in currencies other than the U.S. Dollar. Changes in exchange rates between the U.S. Dollar and other currencies will result in increases or decreases in our costs and earnings, and also may affect the book value of our assets outside the United States. To date, most of our contracts have been entered into in the United States and accordingly have been denominated in U.S. Dollars. Going forward we anticipate that our sales will be denominated in the local currency of the country in which the sale occurs. In addition, our operating expenses to date have been denominated in the currencies of the countries in which our operations are located, primarily the United States and Brazil.
Through August 31, 2014, the fluctuations in the Brazil Real and Mexican Peso for our operations in Brazil and Mexico, respectively had no adverse impact on our results of operations as the U.S. Dollar has been strengthening against the Brazil Real. As our international operations in Brazil grow, our results of operations and cash flows will become increasingly subject to fluctuations due to changes in the foreign currency exchange rates. In periods when the U.S. dollar declines in value as compared to the Brazil Real, our foreign-currency based expenses increase when translated into U.S. dollars. To date, we have not hedged the risks associated with foreign currency exchange exposure. As the risks associated with fluctuations in the Brazil Real become greater, we will continue to reassess our approach to managing this risk.
| 71 |
Commodity Risk
Our exposure to market risk for changes in commodity prices currently is minimal. As our commercial operations grow, our exposure will relate mostly to the demand side as our customers are highly exposed to fluctuations in prices of sugar and crude oil and somewhat exposed to fluctuations in agricultural commodities, especially soybean. For example, if the price of sugar, which is produced from sugarcane and which cannot be produced from sweet sorghum today, rises significantly relative to the price of ethanol, it may become more profitable for ethanol mill operators to grow sugarcane even in adverse conditions, such as through the expansion of sugarcane fields to marginal land or the extension of the sugarcane harvesting season. During sustained periods of significantly higher sugar prices, demand for our seeds may decrease, which could materially and adversely affect our operating results. We are also indirectly exposed to fluctuations in soft commodities prices like soybean when we negotiate production contracts with seed producers. We currently do not use derivative financial instruments to hedge any price volatility of agricultural commodities.
| Item 8. | Financial Statements and Supplementary Data |
The consolidated financial statements and supplementary data required by Item 8 are contained in Item 7 and Item 15 of this Annual Report on Form 10-K and are incorporated herein by reference.
| Item 9. | Changes in and Disagreements with Accountants on Accounting and Financial Disclosure |
None.
| Item 9A. | Controls and Procedures |
(a) Evaluation of Disclosure Controls and Procedures
We maintain disclosure controls and procedures, as such term is defined in Rules 13a-15(e) and 15d-15(e) under the Exchange Act, that are designed to provide reasonable assurance that information required to be disclosed by us in the reports that we file or submit under the Exchange Act is recorded, processed, summarized and reported within the time periods specified in the SEC’s rules and forms, and that such information is accumulated and communicated to our management, including our principal executive officer and principal financial officer, as appropriate, to allow timely decisions regarding required financial disclosures.
We conducted an evaluation, under the supervision and with the participation of our management, including our principal executive officer and principal financial officer, of the effectiveness of the design and operation of our disclosure controls and procedures pursuant to Rules 13a-15(b) and 15d-15(b) under the Exchange Act. Based on this evaluation, our principal executive officer and principal financial officer concluded that our disclosure controls and procedures were effective at the reasonable assurance level as of August 31, 2014.
(b) Management’s Report on Internal Control over Financial Reporting
Our management is responsible for establishing and maintaining adequate internal control over financial reporting, as such term is defined in Exchange Act Rules 13a-15(f) and 15d-15(f). Under the supervision and with the participation of our management, including our Chief Executive Officer and Chief Financial Officer, we conducted an evaluation of the effectiveness of our internal control over financial reporting as of August 31, 2014 based on the guidelines established in Internal Control—Integrated Framework (1992) issued by the Committee of Sponsoring Organizations of the Treadway Commission (COSO). Our internal control over financial reporting includes policies and procedures that provide reasonable assurance regarding the reliability of financial reporting and the preparation of financial statements for external reporting purposes in accordance with U.S. generally accepted accounting principles.
| 72 |
Based on the results of our evaluation, our management concluded that our internal control over financial reporting was effective as of August 31, 2014. We reviewed the results of management’s assessment with our Audit Committee.
Because of its inherent limitations, internal control over financial reporting may not prevent or detect misstatements. Projections of any evaluation of effectiveness to future periods are subject to the risk that controls may become inadequate because of changes in conditions, or that the degree of compliance with the policies or procedures may deteriorate.
Because we are an "emerging growth company" as defined in the JOBS Act, we are not currently required to comply with the auditor attestation requirements related to internal controls over financial reporting pursuant to Section 404 of the Sarbanes-Oxley Act.
(c) Changes in Internal Controls over Financial Reporting
No changes in our internal control over financial reporting (as defined in Rules 13a-15(f) and 15d-15(f) under the Exchange Act) occurred during the quarterly period ended August 31, 2014 that have materially affected, or are reasonably likely to materially affect, our internal control over financial reporting.
| 73 |
Item 10. Directors, Executive Officers and Corporate Governance
MANAGEMENT
Executive Officers and Directors
The following table sets forth information regarding our executive officers, directors and key employees as of November 7, 2014.
| Name | Age | Position | ||
| Board of Directors: | ||||
| Cheryl Morley(1)(2) | 60 | Chair of the Board | ||
| Pascal Brandys(1) | 55 | Director | ||
| Raymond Debbane(3) | 59 | Director | ||
| Richard Flavell, Ph.D. | 71 | Director | ||
| Daniel Glat(2) | 58 | Director | ||
| Robert Goldberg, Ph.D.(3) | 70 | Director | ||
| Richard Hamilton, Ph.D. | 52 | Director, President and Chief Executive Officer | ||
| Thomas Kiley(1)(3) | 71 | Director | ||
| Steven Koonin, Ph. D.(1) | 62 | Director | ||
| Other Executive Officers and Key Employees: | ||||
| Paul Kuc | 52 | Chief Financial Officer | ||
| Wilfriede van Assche | 59 | Senior Vice President, General Counsel and Secretary | ||
| Roger Pennell, Ph.D. | 55 | Vice President of Trait Development |
| (1) | Member of Audit Committee |
| (2) | Member of Compensation Committee |
| (3) | Member of the Nominating and Corporate Governance Committee |
Our executive officers are elected by, and serve at the discretion of, our Board of Directors. There are no family relationships among any of our directors and executive officers.
Board of Directors
Cheryl Morley, Chair of the Board
Ms. Morley has served on our Board of Directors since August 2011 and as Chair of the Board since September 2014. She was Senior Vice President of Corporate Strategy with Monsanto Company from 2003 to 2009, president of the Animal Agricultural Group from 1997 to 2003 and held a number of other leadership positions at Monsanto and its subsidiaries from 1983 to 1997. She also led the marketing and business development efforts for Monsanto’s NutraSweet product. Ms. Morley has served as a board member of Fleming Pharmaceuticals since March 2010 and the Missouri Botanical Gardens since June 2006. Ms. Morley has served as a board member and finance committee member for Mercy Health System since June 2012. From March 2009 to October 2010, she served as a board member for Mercy Health Plans. Ms. Morley was chair of the board and a member of the audit and compensation committees of the Nidus Center for Scientific Enterprise from September 2003 to October 2010. She was presiding director, chair of the nominating and governance committee and a member of the audit committee for Indevus Pharmaceuticals from June 2002 to March 2009. She holds a B.S. degree from the University of Arizona and is a Certified Public Accountant. Ms. Morley brings extensive experience in finance, service on numerous boards and an understanding of the seed business to our Board of Directors.
| 74 |
Pascal Brandys, Director
Mr. Brandys has served on our Board of Directors since December 1997 until March 2014. He rejoined the Board in September 2014. Mr. Brandys is the President and managing member of Biobank Technology Ventures, LLC, an early-stage life sciences investment company which he co-founded in 2001. He was previously a co-founder of the genomics company, Genset S.A., and also served as its Chairman and Chief Executive Officer from 1989 to 2000. Mr. Brandys is currently a director of several private companies and previously served as a director of Ilog S.A. and Innogenetics N.V. He holds an M.S. in Economic Systems from Stanford University and is a graduate of the Ecole Polytechnique of Paris. Mr. Brandys brings extensive business experience in the genomics field and experience as an executive and an investment professional to our Board of Directors.
Raymond Debbane, Director
Mr. Debbane has served on our Board of Directors since March 1998. Mr. Debbane has served as President and Chief Executive Officer of The Invus Group, LLC, a New York based multi-billion dollar investment firm which is the exclusive investment advisor of Artal Luxembourg S.A., a shareholder of Ceres, since 1985. Prior to forming The Invus Group in 1985, Mr. Debbane was a manager and consultant for The Boston Consulting Group in Paris, France from 1979 to 1985. He is currently a director of Artal Group S.A. and Lexicon Pharmaceuticals, Inc., as well as a number of private companies in which Artal or Invus, L.P. is an investor. Mr. Debbane is also the Chairman of the board of directors of Weight Watchers International. He holds an M.B.A. from Stanford Graduate School of Business, an M.S. in Food Science and Technology from the University of California, Davis and a B.S. in Agricultural Sciences and Agricultural Engineering from American University of Beirut. Mr. Debbane was originally nominated to serve on our Board of Directors by Artal Luxembourg S.A. pursuant to the terms of a voting agreement. Mr. Debbane brings extensive business and finance experience to our Board of Directors, as well as experience as a director of a number of companies.
Richard Flavell, Ph.D., FRS, CBE, Director
Dr. Flavell has served on our Board of Directors since June 2009. Dr. Flavell joined Ceres in 1998 and served as Chief Scientific Officer from 1998 until October 2012, when he became our Chief Scientific Advisor on a consultancy basis. Since 2001, Dr. Flavell has been an Adjunct Professor in the Department of Molecular, Cellular and Developmental Biology at the University of California, Los Angeles. From 1987 to 1998, Dr. Flavell was the Director of the John Innes Centre in Norwich, England, a premier plant and microbial research institute. He has published over 200 scientific articles, lectured widely and contributed significantly to the development of modern biotechnology in agriculture. Dr. Flavell is an expert in cereal plant genomics, having produced the first molecular maps of plant chromosomes to reveal the constituent sequences. In 1999, Dr. Flavell was named a Commander of the British Empire for his contributions to plant and microbial sciences. Dr. Flavell received his Ph.D. from the University of East Anglia and has been a Fellow of European Molecular Biology Organization since 1990 and of The Royal Society of London since 1998. Dr. Flavell brings extensive experience and knowledge of plant biotechnology to our Board of Directors.
Daniel Glat, Director
Mr. Glat has served on our Board of Directors since June 2013. He has been a principal of Glat & Associates, an agribusiness consultancy firm in Brazil, since June 2011. He previously spent 25 years working for Pioneer Hi-Bred International, Inc., a Dupont business, including 21 years in Brazil. From August 2007 to June 2011, he served as the director for international operations, where he was responsible for Pioneer’s activities in Latin America, Africa and Asia. During this time he also served on the board of directors of Pioneer Hi-Bred International, Inc. From January 1998 to August 2007, Mr. Glat was president of Pioneer’s Brazilian subsidiary, Pioneer Sementes Ltda., having previously held various sales, marketing and business leadership roles at the subsidiary. Mr. Glat owns a farming operation in the Brazilian state of Tocatins. He received his B.S. and M.S. in Agronomy and Plant Genetics from the University of Arizona. Mr. Glat brings considerable international experience in agribusiness to our Board of Directors.
| 75 |
Robert Goldberg, Ph.D., Director
Dr. Goldberg is a Distinguished Professor of Molecular, Cell and Developmental Biology at the University of California, Los Angeles and a founder of Ceres. He has been a Professor at the University of California, Los Angeles since 1976, teaching genetic engineering and studying the genes that are required for seed formation. Dr. Goldberg is a member of the National Academy of Sciences and has consulted extensively in the agriculture and biotechnology industries. Dr. Goldberg has served as a director of Ceres since 1996. Dr. Goldberg received his Bachelor’s Degree in botany from Ohio University, his Ph.D. in plant genetics from the University of Arizona, and was a Postdoctoral Fellow in developmental biology at the California Institute of Technology. Dr. Goldberg brings extensive experience in the agriculture and biotechnology industries to our Board of Directors.
Richard Hamilton, Ph.D., President, Chief Executive Officer and Director
Dr. Hamilton joined Ceres in 1998. He served as our Chief Financial Officer until September 2002, at which time he was appointed President and Chief Executive Officer. He has served on our Board of Directors since 2002. In addition to his leadership role at Ceres, Dr. Hamilton sits on the Keck Graduate Institute Advisory Council and he was a founding member of the Council for Sustainable Biomass Production. He has served on the U.S. Department of Energy’s Biomass Research and Development Technical Advisory Committee and has been active in the Biotechnology Industry Organization where he has served as Vice Chairman of the organization, chaired its Food and Agriculture Governing Board and served in other leadership roles. From 1992 to 1997, Dr. Hamilton was a principal at Oxford Bioscience Partners, one of the leading investors in the genomics field and a founder of Ceres. From 1990 to 1991, he was a Howard Hughes Medical Institute Research Fellow at Harvard Medical School. Dr. Hamilton holds a Ph.D. in molecular biology from Vanderbilt University. Dr. Hamilton brings extensive management experience and biotechnology and renewable energy industry expertise to our Board of Directors.
Thomas Kiley, Director
Mr. Kiley has served as a director of Ceres since May 2003. He became the first general counsel of Genentech in February 1980 and later served as its vice president for corporate development until 1988. Previously, Mr. Kiley practiced intellectual property litigation as a partner of Lyon & Lyon from June 1969 until January 1980. Mr. Kiley has served as a director of Transcept Pharmaceuticals, Inc., a publicly traded pharmaceutical company since February 2004. He also serves as a director of several privately-held development stage companies. From July 1996 to May 2013, Mr. Kiley served as a director of Geron, Inc., a publicly traded biopharmaceutical company. He received his B.S. in chemical engineering from The Pennsylvania State University and his J.D. from The George Washington University School of Law. He is a member of the State Bar of California. Mr. Kiley brings extensive experience as an intellectual property attorney and director of other public companies to our Board of Directors.
Steven Koonin, Ph.D, Director.
Dr. Koonin has served on our Board of Directors since August 2012. He has been the director of the Center for Urban Science and Progress since its creation by New York University in April 2012. Prior to his current role, Dr. Koonin served as Undersecretary for Science at the U.S. Department of Energy from May 2009, following his confirmation by the U.S. Senate, until November 2011. Prior to joining the government, Dr. Koonin spent five years, from March 2004 to May 2009, as Chief Scientist for BP, p.l.c. From September 1975 to July 2006, Dr. Koonin was a professor of theoretical physics at Caltech and was the institute’s Provost from February 1995 to January 2004. His memberships include the U.S. National Academy of Sciences, the American Academy of Arts and Sciences and the Council on Foreign Relations. He has been a member of the JASON advisory group from July 1988 to May 2009, and from November 2011 to present, and served as the group’s chair from 1998 to 2004. He also has served as an independent governor of the Los Alamos and Lawrence Livermore National Security LLCs since July 2012. Dr. Koonin holds a B.S. in Physics from Caltech and a Ph.D. in Theoretical Physics from MIT and has been an adjunct staff member at the Institute for Defense Analyses since 1999. Dr. Koonin brings extensive experience in science, energy and government to our Board of Directors.
| 76 |
Executive Officers
Paul Kuc, Chief Financial Officer
Mr. Kuc joined Ceres in 2008 as Chief Financial Officer, following a 12-year career with Monsanto Company, where he held various regional and global finance positions, including posts in Argentina, Brazil, Canada, Mexico and the United States, with his last position, beginning April 2007, as Lead Worldwide Manufacturing Finance at Seminis, Inc., which was purchased by Monsanto in 2005. At Monsanto, among other responsibilities, he developed and implemented international costing and financial systems for the seed and agricultural biotechnology company. Mr. Kuc began his career, from June 1994 to June 1996, at the pharmaceutical company Eli Lilly and Company. He holds a Master’s of Science degree in Economics from the University of Lodz, Poland and an M.B.A. from the Ivey Business School, University of Western Ontario, Canada.
Wilfriede van Assche, Senior Vice President & General Counsel and Secretary
Ms. van Assche joined Ceres in 2000. She has more than 25 years of legal experience in the plant biotechnology and seed industry. From 1996 until 2000, Ms. van Assche was the General Counsel of the plant biotechnology and seed divisions of Hoechst Schering AgrEvo GmbH and following the merger of Hoechst and Rhone Poulenc, of the same divisions of Aventis, a leading life sciences company that is now part of Bayer AG. Previously, she was the General Counsel of Plant Genetic Systems N.V. from 1988 until its acquisition by Hoechst Schering AgrEvo GmbH in 1996. She began her career with the law firm De Bandt van Hecke (now Linklaters) in Belgium from 1979 until 1982, and was counsel in the legal department of GTE Atea (now Siemens), a telecommunications company, from 1982 until 1988. Ms. van Assche holds a law degree from the University of Leuven and a postgraduate degree from the College of Europe. She is a member of the State Bar of California.
Roger Pennell, Ph.D., Vice President of Trait Development
Dr. Pennell joined Ceres in 1998 and held various research management positions, including Director, Trait Development from 2006 until 2009 when he assumed his current role as Vice President of Trait Development. Dr. Pennell has been an Adjunct Professor in the Department of Molecular, Cellular and Developmental Biology at the University of California, Los Angeles since 2001 and a frequent reviewer for the scientific press. Dr. Pennell holds a Ph.D. from University College London. He performed post-doctoral research at the John Innes Institute and Wageningen Agricultural University, and in 1990 was the recipient of a prestigious Royal Society University Research Fellowship, which he used at University College London and, from 1995, at the Salk Institute. During this time, Dr. Pennell studied cellular and molecular aspects of plant growth, development and disease resistance, and has published more than 40 scientific papers on these subjects.
| 77 |
Board of Directors
Our Board of Directors currently consists of nine members. Our amended and restated certificate of incorporation and our amended and restated bylaws permit our Board of Directors to establish by resolution the authorized number of directors.
Our amended and restated certificate of incorporation and our amended and restated bylaws provide for a classified Board of Directors consisting of three classes, with staggered three-year terms as follows:
| • | Class I directors, whose current term will expire at the annual meeting of stockholders to be held in 2016; | |
| • | Class II directors, whose initial term will expire at the annual meeting of stockholders to be held in 2017; and | |
| • | Class III directors, whose initial term will expire at the annual meeting of stockholders to be held in 2015. |
At each annual meeting of stockholders, upon expiration of the term of a class of directors, directors in that class will be elected for three-year terms at the annual meeting of stockholders held in the year in which that term expires. Each director’s term continues until the election and qualification of his or her successor, or his or her earlier death, resignation or removal. Any increase or decrease in the number of directors will be distributed among the three classes so that, as nearly as possible, each class will consist of one-third of the total number of directors.
The Class I directors consist of Mr. Debbane, Dr. Goldberg, Mr. Kiley and Dr. Koonin; the Class II directors consist of Dr. Flavell and Dr. Hamilton; and the Class III directors consist of Mr. Brandys, Mr. Glat, and Ms. Morley.
The classification of our Board of Directors may have the effect of delaying or preventing changes in our control or management.
Risk Oversight
The Board of Directors is responsible for general oversight of company risk and risk management, and reviews management’s strategies for adequately mitigating and managing the identified risks. Although our Board of Directors administers this risk management oversight function, our Audit Committee supports our Board of Directors in discharging its oversight duties and addressing risks. Our Compensation Committee oversees management of risks relating to our compensation plans and programs. Our Board of Directors expects company management to consider risk and risk management in its business decisions, to develop and monitor risk management strategies and processes for day-to-day activities and to implement risk management strategies adopted by the committees and the Board of Directors.
Director Independence
Our common stock is listed on the Nasdaq Stock Market. Under the rules of the Nasdaq Stock Market, independent directors must comprise a majority of a listed company’s board of directors. In addition, the rules of the Nasdaq Stock Market require that, subject to specified exceptions, each member of a listed company’s audit, compensation and nominating and governance committees be independent. Audit committee members must also satisfy the independence criteria set forth in Rule 10A-3 under the Exchange Act. Under the rules of the Nasdaq Stock Market, a director will only qualify as an “independent director” if, in the opinion of that company’s Board of Directors, that person does not have a relationship that would interfere with the exercise of independent judgment in carrying out the responsibilities of a director.
In order to be considered to be independent for purposes of Rule 10A-3, a member of an audit committee of a listed company may not, other than in his or her capacity as a member of the audit committee, the board of directors, or any other board committee: (1) accept, directly or indirectly, any consulting, advisory, or other compensatory fee from the listed company or any of its subsidiaries; or (2) be an affiliated person of the listed company or any of its subsidiaries.
| 78 |
Our Board of Directors has reviewed its composition, the composition of its committees and the independence of each director. Based upon information requested from and provided by each director concerning his or her background, employment and affiliations, including family relationships, our Board of Directors has determined that none of Messrs. Brandys, Debbane, Glat, Goldberg, Kiley and Koonin and Ms. Morley, representing seven of our nine directors, has a relationship that would interfere with the exercise of independent judgment in carrying out the responsibilities of a director and that each of these directors is “independent” as that term is defined under the rules of the Nasdaq Stock Market.
Our Board of Directors also determined that Messrs. Brandys, Kiley, Koonin and Ms. Morley, who comprise our Audit Committee, and Messrs. Glat and Ms. Morley, who comprise our Compensation Committee, satisfy the independence standards for those committees established by applicable SEC rules and the rules of The Nasdaq Stock Market. In making this determination, our Board of Directors considered the relationships that each non-employee director has with our company and all other facts and circumstances our Board of Directors deemed relevant in determining their independence, including the beneficial ownership of our capital stock held by each non-employee director.
Committees of the Board of Directors
Our Board of Directors has established an Audit Committee, Compensation Committee and a Nominating and Corporate Governance Committee. Each committee has the composition and responsibilities described below.
Audit Committee
Our Audit Committee is comprised of Ms. Morley and Messrs. Kiley, Koonin and Brandys, who is the chair of the Audit Committee. The composition of our Audit Committee meets the requirements for independence under the current Nasdaq Stock Market and SEC rules and regulations. Each member of our Audit Committee possesses financial sophistication as defined under the rules of the Nasdaq Global Market. Ms. Morley and Mr. Brandys are our “Audit Committee financial experts” as that term is defined in Item 407(d)(5)(ii) of Regulation S-K promulgated under the Securities Act. Being an “Audit Committee financial expert” does not impose on Ms. Morley or Mr. Brandys any duties, obligations or liabilities that are greater than are generally imposed on them as a member of our Audit Committee and our Board of Directors. Our Board of Directors has adopted a charter for our Audit Committee, which provides, among other things, that our Audit Committee will:
| • | oversee our accounting and financial reporting processes and audits of our financial statements; |
| • | be directly responsible for the appointment, retention, compensation and oversight of the work of the independent registered public accounting firm; |
| • | have the sole authority to preapprove any non-audit services to be provided by the independent registered public accounting firm and to review with the lead audit partner whether any of the audit team members receive any discretionary compensation from the audit firm with respect to non-audit services performed by the independent registered public accounting firm; |
| • | actively engage in dialogue with the independent registered public accounting firm with respect to any disclosed relationships or services that may impact the objectivity and independence of the independent registered public accounting firm and recommend that the Board of Directors take, appropriate action to oversee the independence of the independent auditor; and |
| • | discuss the adequacy of the Company’s internal control over financial reporting with the independent registered public accounting firm and management and review and discuss any changes implemented by management to address control deficiencies or to make controls more effective. |
| 79 |
Compensation Committee
Our Compensation Committee is comprised of Mr. Glat and Ms. Morley, who is the chair of the Compensation Committee. In addition, Mr. Edmund Olivier was a member and the chair of our Compensation Committee from its inception through his resignation from our Board of Directors in March 2014 and Mr. Walter De Logi was a member of our Compensation Committee from its inception until his death in August 2014. The composition of our Compensation Committee meets the requirements for independence under the current Nasdaq Stock Market and SEC rules and regulations. The purpose of our Compensation Committee is to set compensation policy, administer compensation plans and recommend compensation for executive officers to the Board of Directors. Our Board of Directors has adopted a charter for our Compensation Committee, under which our Compensation Committee will discharge the responsibilities of our Board of Directors relating to compensation of our executive officers, and will, among other things:
| • | establish the Company’s general compensation philosophy; |
| • | review and recommend that our Board of Directors approve the compensation of our executive officers; |
| • | review and recommend that our Board of Directors approve the compensation of our directors; |
| • | review and approve, or recommend that the Board of Directors approve, payouts under annual bonus and other performance-based compensation programs; |
| • | review and recommend that our Board of Directors approve new or existing long-term or equity-based compensation plans or arrangements and administer those plans or arrangements; |
| • | assist in developing succession and continuity plans for the CEO and other executive officers; |
| • | review and consult with the Board of Directors on our compensation and benefit plans to determine whether they create risks that are reasonably likely to have a material adverse effect on the company; and |
| • | review, discuss with management, and approve the compensation, discussion and analysis when required in our public filings. |
Nominating and Corporate Governance Committee
Our Board of Directors has established a Nominating and Corporate Governance Committee. Our Nominating and Corporate Governance Committee is comprised of Messrs. Debbane, Goldberg and Kiley, who is the chair of the Nominating and Corporate Governance Committee. In addition, Mr. Krieger was a member of our Nominating and Corporate Governance Committee from its inception through his resignation from our Board of Directors in May 2014 and Mr. Walter De Logi was a member of our Nominating and Corporate Governance Committee from its inception until his death in August 2014. The composition of our Nominating and Corporate Governance Committee meets the requirements for independence under the current Nasdaq Stock Market and SEC rules and regulations. Our Board of Directors has adopted a charter for our Nominating and Corporate Governance Committee, under which our Nominating and Corporate Governance Committee will, among other things:
| • | identify and recommend director nominees; |
| • | recommend directors to serve on our various committees; and |
| 80 |
| • | implement our corporate governance guidelines. |
The charters of our Audit, Compensation and Nominating and Corporate Governance Committees, and any amendments that may be adopted from time to time, are posted on our website at www.ceres.net.
Compensation Committee Interlocks and Insider Participation
During fiscal 2014, our Compensation Committee consisted of Mr. Glat and Ms. Morley, who is the chair of our Compensation Committee. In addition, Mr. Edmund Olivier was a member and the chair of our Compensation Committee from its inception through his resignation from our Board of Directors in March 2014 and Mr. Walter De Logi was a member of our Compensation Committee from its inception until his death in August 2014. None of them has at any time during the last fiscal year been one of our officers or employees, nor have any of our executive officers served as a member of the Board of Directors, or as a member of the compensation or similar committee, of an entity that has one or more executive officers who served on our Board of Directors or Compensation Committee during fiscal 2014.
Limitation of Liability and Indemnification of Officers and Directors
Our amended and restated certificate of incorporation and our amended and restated bylaws limit the liability of our directors, officers, employees and other agents to the fullest extent permitted by Delaware law. Section 145 of the Delaware General Corporation Law permits indemnification of officers, directors and other agents under certain circumstances and subject to certain limitations. Delaware law also permits a corporation to not hold its directors personally liable for monetary damages for breach of their fiduciary duties as directors, except for liability for:
| • | breach of their duty of loyalty to us or our stockholders; |
| • | acts or omissions not in good faith or that involve intentional misconduct or a knowing violation of law; |
| • | unlawful payments of dividends or unlawful stock repurchases or redemptions as provided in Section 174 of the Delaware General Corporation Law; and |
| • | any transaction from which the director derived an improper personal benefit. |
These limitations of liability do not apply to liabilities arising under the federal or state securities laws and do not affect the availability of equitable remedies such as injunctive relief or rescission. Our amended and restated certificate of incorporation also permits us to secure insurance on behalf of any officer, director, employee or other agent for any liability arising out of his or her actions in this capacity. We have obtained directors’ and officers’ liability insurance to cover certain liabilities described above. We have entered into separate indemnity agreements with each of our directors and executive officers that require us to indemnify such persons against any and all expenses (including attorneys’ fees), witness fees, judgments, fines, settlements and other amounts incurred (including expenses of a derivative action) in connection with any action, suit or proceeding or alternative dispute resolution mechanism, inquiry hearing or investigation, whether threatened, pending or completed, to which any such person may be made a party by reason of the fact that such person is or was a director, an officer or an employee of us or any of our affiliated enterprises, provided that such person must follow the procedures for determining entitlement to indemnification set out in the indemnity agreements. The indemnity agreements also set forth other procedures that will apply in the event of a claim for indemnification thereunder. We believe that these provisions and agreements are necessary to attract and retain qualified persons as executive officers and directors of our company.
At present, there is no pending litigation or proceeding involving any of our directors or executive officers as to which indemnification is required or permitted, and we are not aware of any threatened litigation or proceeding that may result in a claim for indemnification.
| 81 |
The limitation of liability and indemnification provisions in our amended and restated certificate of incorporation and our amended and restated bylaws may discourage stockholders from bringing a lawsuit against directors for breach of their fiduciary duties. They may also reduce the likelihood of derivative litigation against directors and officers, even though an action, if successful, might provide a benefit to us and our stockholders. Our results of operations and financial conditions may be negatively affected to the extent we pay the costs of settlement and damage awards against directors and officers pursuant to these indemnification provisions.
Insofar as indemnification for liabilities arising under the Securities Act may be permitted to directors, executive officers or persons controlling us, we have been informed that, in the opinion of the SEC, such indemnification is against public policy as expressed in the Securities Act and is therefore unenforceable.
Director Compensation
The following table sets forth information concerning the compensation of our directors during the year ended August 31, 2014:
| Name (1) | Fees earned or paid in cash ($) | Option awards($)(2) | All other compensation($) | Total($) | ||||||||||||
| Walter De Logi, Ph.D. (3) | 71,000 | 4,375 | — | 75,375 | ||||||||||||
| Pascal Brandys (4) | 28,125 | — | 28,125 | |||||||||||||
| Raymond Debbane | 33,500 | 4,375 | — | 37,875 | ||||||||||||
| Richard Flavell, Ph.D. | 30,000 | 4,375 | 41,440 | (5) | 75,815 | |||||||||||
| Daniel Glat | 30,375 | 4,375 | — | 34,750 | ||||||||||||
| Robert Goldberg, Ph.D. | 30,000 | 4,375 | — | 34,375 | ||||||||||||
| Thomas Kiley | 43,500 | 4,375 | — | 47,875 | ||||||||||||
| Steven Koonin, Ph. D. | 31,875 | 4,375 | — | 36,250 | ||||||||||||
| David Krieger (6) | 33,500 | 4,375 | — | 37,875 | ||||||||||||
| Cheryl Morley | 54,375 | 4,375 | — | 58,750 | ||||||||||||
| Edmund Olivier (7) | 33,750 | — | 33,750 | |||||||||||||
| (1) | Dr. Hamilton, our President and Chief Executive Officer, is not included in this table as he is an employee of the Company and does not receive additional compensation for his service as a director. All of the compensation paid to Dr. Hamilton for the services he provides to us is reflected in the Summary Compensation Table. |
| (2) | The amounts in the “Option Awards” column reflect the aggregate grant date fair value of stock options granted during fiscal 2014, computed in accordance with ASC Topic 718. The assumptions used by us in determining the grant date fair value of option awards and our general approach to our valuation methodology are set forth in the “Management’s Discussion and Analysis of Financial Condition and Results of Operations — Stock-based Compensation” section of this Annual Report on Form 10-K. These amounts do not correspond to the actual value that may be recognized by the non-employee directors. |
| (3) | On August 5, 2014, the Company announced the death of Dr. Walter De Logi, Chairman of the Board and a co-founder of Ceres. |
| (4) | Mr. Brandys had chosen not to be nominated for the Board of Directors at the 2014 Annual Shareholder Meeting and left the Board of Directors in March 2014. On September 12, 2014, Mr. Brandys was elected to serve as a Class III director for a term beginning September 12, 2014 and expiring at the Company’s annual meeting of stockholders in 2015, to fill the vacancy on the Board. |
| (5) | Represents payments for consulting services performed under Dr. Flavell’s exclusive consultancy agreement described under “Narrative to director compensation table” below. |
| (6) | Mr. Krieger resigned from the Board of Directors in May 2014. |
| (7) | Mr. Olivier had chosen not to be nominated for the Board of Directors at the 2014 Annual Shareholder Meeting and left the Board of Directors in March 2014. |
| 82 |
Narrative to director compensation table.
Based on the recommendation of our Compensation Committee, our Board of Directors has adopted a compensation policy that is applicable to all of our non-employee directors. Under our Amended and Restated Non-employee Director Compensation Program, each non-employee director will receive an annual cash retainer and an annual stock option grant. In addition, upon initial appointment to the Board of Directors, each non-employee director will receive an initial stock option grant. In addition, committee members who serve on one or more of the Audit, Compensation or Nominating and Governance Committee of the Board of Directors will receive, for each committee he or she serves on, either an additional annual cash committee retainer or, in the case of a committee chair, a committee chair retainer paid in lieu of the committee retainer. If we elect a lead/non-executive chair of the Board of Directors, he or she will also receive an additional annual cash lead director retainer. All annual cash retainers are payable on a quarterly basis. The retainer and stock option amounts that we provide are as follows:
| • | an annual retainer of $30,000, payable on a quarterly basis; |
| • | an initial stock option grant to purchase 11,666 shares, to vest annually over three years; |
| • | an annual stock option grant to purchase 5,833 shares, to vest 100% on January 31 of the year following the date of grant; |
| • | an annual retainer for committee members as follows: $7,500 for members of the audit and compensation committees, and $3,500 for members of the nominating and governance committee; |
| • | an annual retainer for committee chairs as follows: $15,000 for the chairs of the audit and compensation committees, and $6,000 for the chair of the nominating and governance committee; |
| • | an additional annual retainer of $30,000 for any non-employee director appointed as lead/non-executive chairman of the board of directors; and |
| • | reimbursement for reasonable out-of-pocket business expenses. |
In connection with his retirement from the position of Chief Scientific Officer in October 2012, we entered into an exclusive consultancy agreement with Dr. Flavell. Pursuant to the consultancy agreement, Dr. Flavell will earn $2,000 per day for 20 to 25 days of service per year, and he agrees not to provide services to any other party in the field of commercial, for profit bioenergy crop activities. The consultancy agreement had an initial term of one year, effective October 11, 2012, and automatically renews for an undetermined amount of time, subject to termination by either party by giving six months’ notice. In June 2013, Dr. Flavell was granted an option to purchase 5,000 shares of our common stock under the Amended and Restated Ceres, Inc. 2011 Equity Incentive Plan, or the 2011 Plan, in connection with his consulting services.
In June 2013, we entered into a consulting agreement with Dr. Goldberg pursuant to which we reimburse him for reasonable out-of-pocket business expenses incurred in the performance of his consulting duties of up to $25,000 per year. In addition, Dr. Goldberg was granted an option to purchase 5,000 shares of our common stock under the 2011 Plan.
Section 16(a) Beneficial Ownership Reporting Compliance
Section 16(a) of the Exchange Act requires our executive officers and directors, and persons who beneficially own more than ten percent of a registered class of our equity securities, to file reports of ownership and changes in ownership of these securities with the SEC. Executive officers, directors and greater than ten percent beneficial owners are required by applicable regulations to furnish us with copies of all Section 16(a) forms they file. Based solely upon a review of the forms furnished to us during or with respect to our most recent fiscal year, all of our directors and executive officers subject to the reporting requirements and each beneficial owner of more than ten percent of our Common Stock satisfied all applicable filing requirements under Section 16(a).
| 83 |
Code of Business Conduct and Ethics
Our Board of Directors has adopted a Code of Business Conduct and Ethics which applies to all directors, officers and employees of Ceres, Inc. and its subsidiaries, including our principal executive officer, principal financial officer, principal accounting officer or controller, or persons performing similar functions. The full text of our Code of Business Conduct and Ethics is available on our website, www.ceres.net, in the “Investor Relations” section.
Item 11. Executive Compensation
Summary Compensation Table
The following table sets forth information regarding compensation earned by our named executive officers for the years ended August 31, 2014 and 2013.
| Name and Principal Position | Year | Salary ($) | Bonus ($)(1) | Stock Awards ($)(2) | Option Awards ($)(2) | All Other Compensation ($) | Total ($) | |||||||||||||||||||||
| Richard Hamilton | 2014 | 466,000 | 168,925 | 103,333 | 163,334 | 10,100 | (3) | 911,692 | ||||||||||||||||||||
| President and Chief Executive Officer | 2013 | 466,000 | — | 262,824 | — | 10,934 | 739,758 | |||||||||||||||||||||
| Paul Kuc | 2014 | 323,000 | 96,900 | 82,667 | 130,666 | 6,263 | (4) | 639,496 | ||||||||||||||||||||
| Chief Financial Officer | 2013 | 323,000 | — | 182,172 | — | 6,582 | 511,754 | |||||||||||||||||||||
| Wilfriede van Assche | 2014 | 300,000 | 90,000 | 16,533 | 26,134 | 10,100 | (5) | 442,767 | ||||||||||||||||||||
| Senior Vice President and General Counsel | 2013 | 300,000 | — | — | 10,295 | 310,295 | ||||||||||||||||||||||
| (1) | For fiscal 2014, bonuses for our named executive officers were determined on a discretionary basis by our Compensation Committee and our Board of Directors. In general, the amount of each named executive officer’s target bonus was not determined by applying any specific formula, but was determined based upon the following: (i) the achievement of company milestones; (ii) the achievement of individual milestones; and (iii) other factors deemed relevant by our Compensation Committee and our Board of Directors. Accordingly, we are disclosing bonus amounts for fiscal 2014 in the “Bonus” column. |
| (2) | The amounts in the “Stock Awards” and “Option Awards” column reflect the aggregate grant date fair value of stock options and restricted stock awards granted during fiscal 2013 and fiscal 2014, as applicable, computed in accordance with ASC Topic 718. The assumptions used by us in determining the grant date fair value of option awards and our general approach to our valuation methodology are set forth in the “Management’s Discussion and Analysis of Financial Condition and Results of Operations — Stock-based Compensation” section of this Annual Report on Form 10-K. These amounts do not correspond to the actual value that may be recognized by the named executive officers. |
| (3) | This amount includes a company matching contribution to our 401(k) plan in the amount of $9,800 and company-paid life insurance premiums in the amount of $300. |
| (4) | This amount includes a company matching contribution to our 401(k) plan in the amount of $5,963 and company-paid life insurance premiums in the amount of $300. |
| (5) | This amount includes a company matching contribution to our 401(k) plan in the amount of $9,800 and company-paid life insurance premiums in the amount of $300. |
| 84 |
Outstanding Equity Awards at Fiscal 2014 Year-End
The following table itemizes outstanding equity awards held by the named executive officers as of August 31, 2014.
| Option Awards | Stock Awards | |||||||||||||||||||||||||
| Name | Option Grant Date | Number
of Securities Underlying Unexercised Options(#) Exercisable (1) * | Number of Securities Underlying Unexercised Options(#) Unexercisable | Option Exercise Price ($)(2) | Option Expiration Date | Number
of Shares or Units of Stock (#) That Have Not Vested ** | Stock Award Grant Date | Market
Value of Shares or Units of Stock ($) That Have Not Vested (3) | ||||||||||||||||||
| Richard Hamilton | 12/19/2002 | 400,000 | (4) | — | 1.95 | 12/18/2015 | ||||||||||||||||||||
| 1/16/2006 | 68,333 | (5) | — | 3.90 | 1/15/2016 | |||||||||||||||||||||
| 12/21/2007 | 187,332 | (6) | — | 6.75 | 12/20/2017 | |||||||||||||||||||||
| 6/23/2011 | 66,666 | (7)(8) | — | 16.77 | 6/22/2021 | |||||||||||||||||||||
| 2/27/2012 | 60,598 | (9)(10) | 72,735 | (9)(10) | 13.00 | 2/26/2022 | ||||||||||||||||||||
| 31,067 | 10/10/2012 | 16,776 | ||||||||||||||||||||||||
| 9/25/2013 | 83,333 | (11)(12) | 83,334 | (11)(12) | 1.24 | 9/24/2023 | ||||||||||||||||||||
| 41,667 | 9/25/2013 | 22,500 | ||||||||||||||||||||||||
| Paul Kuc | 9/3/2008 | 109,999 | (13) | — | 6.75 | 9/2/2018 | ||||||||||||||||||||
| 6/8/2010 | 33,332 | (14) | — | 6.75 | 6/7/2020 | |||||||||||||||||||||
| 6/23/2011 | 13,333 | (7)(8) | — | 16.77 | 6/22/2021 | |||||||||||||||||||||
| 2/27/2012 | 18,709 | (9)(10) | 27,957 | (9)(10) | 13.00 | 2/26/2022 | ||||||||||||||||||||
| 21,534 | 10/10/2012 | 11,628 | ||||||||||||||||||||||||
| 9/25/2013 | 66,666 | (11)(12) | 66,667 | (11)(12) | 1.24 | 9/24/2023 | ||||||||||||||||||||
| 33,334 | 09/25/2013 | 18,000 | ||||||||||||||||||||||||
| Wilfriede van Assche | 1/16/2006 | 34,166 | (5) | — | 3.90 | 1/15/2016 | ||||||||||||||||||||
| 6/8/2010 | 8,333 | (14) | — | 6.75 | 6/7/2020 | |||||||||||||||||||||
| 1/20/2011 | 16,666 | (15) | — | 7.32 | 1/19/2021 | |||||||||||||||||||||
| 6/23/2011 | 13,333 | (7)(8) | — | 16.77 | 6/22/2021 | |||||||||||||||||||||
| 2/27/2012 | 12,346 | (9)(10) | 17,654 | (9)(10) | 13.00 | 2/26/2022 | ||||||||||||||||||||
| 9/25/2013 | 13,333 | (11)(12) | 13,334 | (11)(12) | 1.24 | 9/24/2023 | ||||||||||||||||||||
| 6,667 | 9/25/2013 | 3,600 | ||||||||||||||||||||||||
| * | All stock options issued under our 2010 Stock Option/Stock Issuance Plan, or the 2010 Plan, and our 2000 Stock Option/Stock Issuance Plan, or the 2000 Plan, may be exercised prior to vesting, subject to repurchase rights that expire over the vesting periods indicated in the footnotes below. |
| ** | Unvested shares of restricted stock are generally forfeited if the named executive officer’s employment terminates, except to the extent otherwise provided in an employment agreement or award agreement. The stock awards held by our named executive officers awards may be accelerated upon a change in control of our company, and/or a termination of employment following a change in control, as further described below in “Executive Compensation — Potential Severance Payments upon Termination and upon Termination Following a Change in Control”. |
| (1) | Unless otherwise specified, options granted before 2011 vest as to 25% of the original number of shares on the first anniversary of the vesting commencement date and the remainder of the shares vest ratably each month thereafter until the fourth anniversary of the vesting commencement date. Notwithstanding the foregoing, awards may be accelerated upon a change in control of our company, and/or a termination of employment following a change in control, as further described below in “Executive Compensation — Potential Severance Payments upon Termination and upon Termination Following a Change in Control”. Unvested options granted under the 2010 Plan and the 2000 Plan are subject to early exercise, in which case, until they vest, the shares acquired pursuant to such exercise will be restricted and subject to repurchase by the Company at the exercise price upon the participant’s termination of employment. |
| 85 |
| (2) | The option exercise price for options granted prior to our initial public offering represents the fair market value of our common stock as of the date of grant, as determined by our Board of Directors. The option exercise price for all options granted on February 27, 2012 have an exercise price equal to the initial public offering price per share of our initial public offering. For a discussion of our methodology for determining the fair market value of our common stock, see the “Management’s Discussion and Analysis of Financial Condition and Results of Operations — Critical Accounting Policies and Estimates” section of this Annual Report on Form 10-K. |
| (3) | The market value of stock awards reported is computed by multiplying the number of shares of Restricted Stock granted by $0.54, which was the closing market price of one share of our Common Stock on August 29, 2014. The restricted stock awards granted in fiscal 2013 vest in three equal annual installments beginning October 10, 2013. The restricted stock awards granted in fiscal year 2014 vest in two equal annual installments on July 19, 2014 and July 19, 2015. |
| (4) | The vesting commencement date of this grant is September 23, 2002. The options underlying this grant were originally scheduled to expire on December 18, 2012. On August 15, 2012, we held a Special Meeting of Stockholders, at which the stockholders of the Company approved an amendment to the 2000 Plan to extend the term of such options to thirteen years from their date of grant (subject to the consent of the affected optionholders). Mr. Hamilton consented to the extension of these options to purchase 400,000 shares of common stock on September 10, 2012. |
| (5) | The vesting commencement date of this grant is January 16, 2006. |
| (6) | The vesting commencement date of this grant is December 21, 2007. |
| (7) | All options granted on June 23, 2011, are subject to a five-year vesting schedule with a two-year cliff, with 40% of the options vesting on the second anniversary of the grant date and the remainder vesting ratably each month thereafter until the fifth anniversary of the grant date. |
| (8) | The vesting commencement date of this grant is June 23, 2011. |
| (9) | All options granted on February 27, 2012, are subject to a five-year vesting schedule with a two-year cliff, with 40% of the options vesting on the second anniversary of the grant date and the remainder vesting ratably each month thereafter until the fifth anniversary of the grant date. |
| (10) | The vesting commencement date of this grant is February 27, 2012. |
| (11) | All options granted on September 25, 2013, are subject to a two-year vesting schedule, with 50% of the options vesting on July 19, 2014 and the remaining 50% of the options vesting on July 19, 2015. |
| (12) | The vesting commencement date of this grant is September 25, 2013. |
| (13) | The vesting commencement date of this grant is September 3, 2008. |
| (14) | The vesting commencement date of this grant is June 8, 2010. |
| (15) | The vesting commencement date of this grant is January 20, 2011. |
Potential Payments upon Termination and upon Termination in Connection with a Change in Control
We entered into employment agreements with each of our named executive officers that became effective on September 1, 2011, and which are described in more detail under “Executive Employment Agreements” below. Under these employment agreements, our named executive officers are entitled to certain severance payments and benefits in the event of their termination of employment under certain circumstances, including (i) termination without cause, (ii) resignation for good reason, (iii) termination without cause or resignation for good reason in connection with a change in control of the Company or (iv) termination due to death or disability. In addition, under our 2010 Plan and our 2000 Plan, our named executive officers are entitled to accelerated vesting of outstanding equity awards in the event of their involuntary termination of employment within 12 months after a change in control or other corporate transaction. Under our 2011 Plan, our named executive officers are entitled to accelerated vesting of outstanding equity awards in the event of a qualifying termination of employment, as defined in the 2011 Plan, within six months prior to or 12 months after a change in control or other corporate transaction.
| 86 |
Executive Employment Agreements
We entered into executive employment agreements with each of our named executive officers effective as of September 1, 2011. The terms of each of these agreements are substantially similar, except with respect to each named executive officer’s initial base salary, which is described below.
Each of the executive employment agreements has an initial term of one year, starting on September 1, 2011, with an automatic renewal for additional one-year periods, unless either party gives 90 days’ notice of nonrenewal. The employment agreements provide for an initial annual base salary (to be reviewed by the Compensation Committee annually), a performance bonus and long-term incentive award opportunity as determined by the Compensation Committee, and participation in the Company’s savings, retirement and other welfare benefit plans that the Company may have in place from time to time.
Under the executive employment agreements, if the Company terminates the named executive officer’s employment or does not renew the term of the employment agreement for reasons other than for “cause” or if the named executive officer resigns his or her employment for “good reason”, then he will be entitled to (i) a lump sum severance payment equal to one years’ base salary; (ii) to the extent the termination occurs on or after the midpoint of the Company’s fiscal year, a pro-rated annual bonus and (iii) any other compensation and benefits accrued on or prior to the termination date. The named executive officer (or his or her estate, if applicable) will also receive the foregoing amounts if his or her employment is terminated due to death or disability.
If the named executive officer’s employment is terminated or not renewed by the Company for reasons other than for “cause” or if he resigns from his or her employment for “good reason”, in each case within six months prior to, or within twelve months after, a “change in control”, then he is entitled to a lump sum severance payment equal to two times his or her base salary and any other accrued compensation and benefits. If the named executive officer’s employment is terminated or the term of the employment agreement is not renewed for “cause” or if the named executive officer resigns from his or her employment or does not renew the term for any reason other than “good reason”, then he will be entitled only to compensation and benefits that have accrued on or prior to the termination date.
The named executive officers are obligated to comply with a confidentiality, proprietary information and inventions assignment agreement previously entered into with the Company and non-disparagement covenants under the executive employment agreements. In addition, payments under the agreements will be subject to any clawback or recoupment policies as required under applicable law.
Under the executive employment agreements, the following definitions apply:
| • | “Cause” is defined as (i) a material breach of the employment agreement or any other written agreement with the Company to the extent the breach is not cured within 30 days; (ii) the named executive officer’s conviction or plea of nolo contendere to a felony or another crime involving dishonesty or moral turpitude or which could reflect negatively on or otherwise impair or impede the Company’s operations; (iii) the named executive officer’s engaging in misconduct, negligence, dishonesty, violence or threat of violence that is injurious to the Company; (iv) a material breach of a written policy of the Company or the rules of any governmental or regulatory body applicable to the Company that could result in an adverse effect on the Company or could reflect negatively on or impair the operations of the Company or (v) any other willful misconduct that is materially injurious to the financial condition or business reputation of the Company. |
| • | “Good reason” is defined as any of the following: (i) an adverse change in the named executive officer’s position with the Company that materially reduces his or her level of authority, duties or responsibility; (ii) a reduction of base salary by more than five percent (except a reduction of 15% or less if the reduction is similarly applied to all executives); (iii) a relocation of place of employment by more than 50 miles without the executive’s consent or (iv) a substantial change in the nature or orientation of the Company’s core business such that the Company is no longer substantially engaged in the agricultural biotechnology business. |
| 87 |
| • | A “change in control” means the occurrence of any of the following events: (i) any person or group becomes the beneficial owner of greater than 50% of the Company’s total voting power; (ii) the sale of substantially all of the Company’s assets; or (iii) the consummation of a merger or consolidation of the Company, after which the voting securities of the Company outstanding immediately prior to the event no longer represent 50% or more of the voting power represented by the voting securities of the Company or surviving entity immediately after the event. |
As of the end of August 31, 2014, the salaries of our named executive officers were as follows:
| Name | Post-Offering Salary ($) | |||
| Richard Hamilton | 466,000 | |||
| Paul Kuc | 323,000 | |||
| Wilfriede van Assche | 300,000 | |||
| Item 12. | Security Ownership of Certain Beneficial Owners and Management and Related Stockholder Matters |
The following table sets forth information with respect to the beneficial ownership of our common stock, as of November 7, 2014, by:
| • | each person, or group of affiliated persons, who is known by us to beneficially own more than 5% of our voting securities; | |
| • | each of our directors; | |
| • | each of our named executive officers; and | |
| • | all of our directors and executive officers as a group. |
Beneficial ownership is determined in accordance with the rules of the SEC and generally includes any shares over which the individual or entity has sole or shared voting power or investment power. The information does not necessarily indicate beneficial ownership for any other purpose. Except as indicated in the footnotes to this table and pursuant to applicable community property laws, to our knowledge the persons named in the table below have sole voting and investment power with respect to all shares of common stock beneficially owned.
Percentage ownership of our common stock in the table is based on 48,265,633 shares of our common stock outstanding on November 7, 2014. The number of shares beneficially owned by each person or group as of November 7, 2014 includes shares of common stock that such person or group had the right to acquire on or within 60 days after November 7, 2014, upon the exercise of options and warrants. References to options and warrants in the footnotes of the table below include only options and warrants outstanding as of November 7, 2014 that were exercisable on or within 60 days after November 7, 2014. For the purposes of calculating each person’s or group’s percentage ownership, stock options and warrants exercisable within 60 days after November 7, 2014 are included for that person or group but not the stock options or warrants of any other person or group.
Information in the table is derived from SEC filings made by such persons on Schedule 13D, Schedule 13G and/or under Section 16(a) of the Exchange Act and other information received by us. Except as otherwise set forth below, the address of the beneficial owner is c/o Ceres, Inc., 1535 Rancho Conejo Blvd., Thousand Oaks, CA 91320.
| 88 |
| Name and Address of Beneficial Owner | Number (#) | Percentage (%) | ||||||
| 5% Stockholders | ||||||||
| Artal Luxembourg S.A. (1) | 8,683,914 | 17.81 | % | |||||
| Ambergate Trust (2) | 3,265,232 | 6.70 | ||||||
| Warburg Pincus Private Equity IX, L.P. (3) | 2,922,345 | 6.00 | ||||||
| Directors and Named Executive Officers | ||||||||
| Cheryl Morley (4) | 11,666 | * | ||||||
| Pascal Brandys (5) | 99,190 | * | ||||||
| Raymond Debbane (1)(6) | 32,339 | * | ||||||
| Richard Flavell (7) | 244,645 | * | ||||||
| Daniel Glat (8) | 3,888 | * | ||||||
| Robert Goldberg (9) | 227,087 | * | ||||||
| Richard Hamilton (10) | 1,118,748 | 2.28 | ||||||
| Thomas Kiley (11) | 93,203 | * | ||||||
| Steven Koonin (12) | 13,610 | * | ||||||
| Paul Kuc (13) | 353,874 | * | ||||||
| Wilfriede van Assche (14) | 134,130 | * | ||||||
| All directors and executive officers as a group (12 persons) | 2,539,864 | 5.09 | % | |||||
| * | Less than 1% |
| (1) | Includes 491,747 shares of common stock that may be acquired pursuant to the exercise of warrants held by Artal Luxembourg S.A. Raymond Debbane, one of our directors, is a director of Artal Group S.A. Artal Group S.A. is the parent entity of Artal International S.C.A., which is the parent entity of Artal Luxembourg S.A. Mr. Debbane disclaims beneficial ownership of the shares and shares underlying warrants held by Artal Luxembourg S.A., except to the extent of his pecuniary interest therein. The address for Artal Luxembourg S.A., 10-12 avenue Pasteur, L-2310 Luxembourg. |
| (2) | Represents 2,906,232 shares of common stock held by Rothschild Trust Guernsey Limited as Trustee F/B/O the Ambergate Trust, or Rothschild, and 359,000 shares of common stock held by The address for Rothschild is PO Box 472, St. Julian’s Court, St. Julian’s Avenue, St. Peter Port GY1 6AX, Guernsey. |
| (3) | Includes 461,538 shares of common stock that may be acquired pursuant to the exercise of warrants held by Warburg Pincus Private Equity IX, L.P., a Delaware limited partnership, or WP IX. Warburg Pincus IX GP L.P., a Delaware limited partnership, or WP IX GP, is the general partner of WP IX. WPP GP LLC, a Delaware limited liability company, or WPP GP, is the general partner of WP IX GP. Warburg Pincus Partners L.P., a Delaware limited partnership, or WP Partners, is the sole member of WPP Partners. Warburg Pincus Partners GP LLC, a Delaware limited liability company, or WPP GP LLC, is the general partner of WP Partners. Warburg Pincus & Co., a New York general partnership, or WP, is the managing member of WP Partners. Warburg Pincus LLC, a New York limited liability company, or WP LLC, manages WP IX. Charles R. Kaye and Joseph P. Landy are Managing General Partners of WP and Managing Members and Co-Chief Executive Officers of WP LLC and may be deemed to control the Warburg Pincus entities. Messrs. Kaye and Landy disclaim beneficial ownership of all shares held by the Warburg Pincus entities. The address for the Warburg Pincus entities is 450 Lexington Avenue, New York, NY 10017. |
| (4) | Includes 11,666 shares of common stock issuable pursuant to stock options exercisable within 60 days of November 7, 2014. |
| (5) | Includes 40,624 shares of common stock issuable pursuant to stock options exercisable within 60 days of November 7, 2014. |
| (6) | Includes 11,666 shares of common stock issuable pursuant to stock options exercisable within 60 days of November 7, 2014. |
| (7) | Includes 132,462 shares of common stock issuable pursuant to stock options exercisable within 60 days of November 7, 2014, 4,000 of which are unvested and early exercisable and would be subject to a right of repurchase in our favor upon Dr. Flavell’s cessation of service with us prior to vesting. |
| (8) | Includes 3,888 shares of common stock issuable pursuant to stock options exercisable within 60 days of November 7, 2014. |
| (9) | Includes 188,026 shares of common stock held by The Robert B. Goldberg Revocable Living Trust and 39,061 shares of common stock issuable pursuant to stock options exercisable within 60 days of November 7, 2014. |
| 89 |
| (10) | Includes 82,201 shares of restricted stock held by Dr. Hamilton, 33,333 shares of common stock held by the Richard Hamilton 2011-Ceres GRAT and 873,316 shares of common stock issuable pursuant to stock options exercisable within 60 days of November 7, 2014, 20,000 of which are unvested and early exercisable and would be subject to a right of repurchase in our favor upon Dr. Hamilton’s cessation of service with us prior to vesting. |
| (11) | Includes 56,666 shares of common stock issuable pursuant to stock options exercisable within 60 days of November 7, 2014, Also includes 14,743 shares of common stock held by The Kiley Revocable Trust and 5,128 shares of common stock issuable upon the exercise of warrants held by The Kiley Revocable Trust. |
| (12) | Includes 13,610 shares of common stock issuable pursuant to stock options exercisable within 60 days of November 7, 2014. |
| (13) | Includes 53,101 shares of restricted stock held by Mr. Kuc and 243,507 shares of common stock issuable pursuant to stock options exercisable within 60 days of November 7, 2014, 4,000 of which are unvested and early exercisable and would be subject to a right of repurchase in our favor upon Mr. Kuc’s cessation of service with us prior to vesting. |
| (14) | Includes 13,667 shares of restricted stock held by Ms. van Assche and 98,797 shares of common stock issuable pursuant to stock options exercisable within 60 days of November 7, 2014, 4,000 of which are unvested and early exercisable and would be subject to a right of repurchase in our favor upon Ms. van Assche’s cessation of service with us prior to vesting. |
Equity Compensation Plans
The following table provides information as of August 31, 2014 regarding compensation plans under which our equity securities are authorized for issuance:
| Plan Category | Number of Securities to be Issued Upon Exercise of Outstanding Options | Weighted Average Exercise Price of Outstanding Options | Number of Securities Remaining Available for Future Issuance Under Equity Compensation Plans | |||||||||
| Equity compensation plans approved by stockholders | 3,172,948 | (1) | $ | 5.83 | 1,241,526 | (2) | ||||||
| Equity compensation plans not approved by stockholders | — | — | — | |||||||||
| Total | 3,172,948 | (1) | $ | 5.83 | 1,241,526 | (2) | ||||||
| (1) | Consists of shares underlying stock options granted under our Amended and Restated 2011 Equity Incentive Plan, or the 2011 Plan, our 2010 Stock Option/Stock Issuance Plan, or the 2010 Plan, and our 2000 Stock Option/Stock Issuance Plan, or the 2000 Plan. |
| (2) | Consists of shares issuable under the 2011 Plan and the 2010 Plan. No additional shares are available for future issuance under the 2000 Plan other than in respect of shares underlying outstanding stock options. The shares issuable under the 2011 Plan may be increased by the number of shares that would have been issuable under any stock option granted under the 2010 Plan or the 2000 Plan that were forfeited or that expired without being exercised. No future grants will be made under the 2010 Plan. |
| 90 |
Item 13. Certain Relationships and Related Transactions, and Director Independence
In addition to the compensation arrangements, including employment, termination of employment and change-in-control and indemnification arrangements, discussed above under “Item 10. Management” and “Item 11. Executive Compensation,” the following is a description of each transaction since September 1, 2013, and each currently proposed transaction in which:
| • | we have been or are to be a participant; | |
| • | the amount involved exceeds or will exceed $120,000; and | |
| • | any of our directors, executive officers or holders of more than 5% of any class of our capital stock at the time of the transactions in issue, or any immediate family member of or person sharing the household with any of these individuals, had or will have a direct or indirect material interest. |
Indemnification Arrangements
We have entered into an indemnity agreement with each of our directors and officers. The indemnity agreements and our amended and restated certificate of incorporation and amended and restated bylaws require us to indemnify our directors and officers to the fullest extent permitted by Delaware law. Please see “Management — Limitation of Liability and Indemnification of Officers and Directors”.
Executive Compensation and Employment Arrangements
Please see “Item 11. Executive Compensation” for information on compensation arrangements with our executive officers, including option grants and agreements with executive officers.
Investors’ Rights Agreement
Stockholder Registration Rights
In June 2010, we entered into an Amended and Restated Investors’ Rights Agreement, or the Investors’ Rights Agreement, with our major stockholders pursuant to which we agreed to provide certain rights to those stockholders that are a party to the Investors’ Rights Agreement to register the shares of our common stock (i) issuable upon conversion of outstanding convertible preferred stock, (ii) issued as a dividend or other distribution related to the convertible preferred stock, (iii) currently held or later acquired, and (iv) issuable upon the exercise of warrants held by any stockholder that is party to the agreement. We will bear all expenses incurred in connection with any underwritten registration, including, without limitation, all registration, filing and qualification fees, printers and accounting fees and the reasonable fees of counsel for the selling holders, but excluding underwriting discounts and commissions.
The registration rights provided for under the Investors’ Rights Agreement terminate after the earlier of five years following the consummation of an initial public offering, or any such time as the holder would be able to dispose of all of its registrable securities in any three month period under SEC Rule 144.
Demand Registration Rights
Pursuant to the Investors’ Rights Agreement, if, at any time after six months after the effective date of the first registration statement for a public offering of our securities (other than a registration statement relating either to the sale of securities to our employees pursuant to a stock option, stock purchase or similar plan or an SEC Rule 145 transaction), upon the written request of the holders of at least 15% of the securities covered by the Investors’ Rights Agreement that we file a registration statement under the Securities Act covering the registration of at least 15% of the securities covered by the Investors’ Rights Agreement, then we are required to file a registration statement covering the resale of the common stock requested to be registered. We are not obligated to file a registration statement after we have effected five registration statements pursuant to the Investors’ Rights Agreement or during certain periods prior to and after a registration statement has been filed by the company or, for a period of 90 days in the event the Board of Directors, in its judgment, makes the determination that it would be seriously detrimental to the Company and its shareholders for such registration statement to be filed and is therefore essential to defer the filing of such registration statement.
| 91 |
If an underwriter selected for an underwritten offering advises the holders demanding registration that marketing factors require a limitation on the number of shares to be underwritten, then, subject to certain limitations, the number of shares of registrable securities that may be included in the underwriting will be allocated among all holders of registrable securities in proportion to the amount of our registrable securities owned by each holder.
Piggyback Registration Rights
Pursuant to the Investors’ Rights Agreement, if, subject to certain exceptions, we propose to register any of our stock or other securities under the Securities Act in connection with the public offering of such securities solely for cash, we are required to promptly give such holders written notice of such registration. Upon the written request of each eligible holder, we will, subject to certain limitations, cause to be registered under the Securities Act all such securities that each such holder has requested to be registered.
Related Person Transaction Policy
As provided in our current Audit Committee charter, our Audit Committee is responsible for reviewing and approving all related party transactions on an ongoing basis and must review any potential conflict of interest situations where appropriate.
Director Independence
For a discussion of the independence of our directors, please see “Management — Director Independence” above.
Item 14. Principal Accountant Fees and Services
Independent Registered Public Accounting Firm’s Fees
The following table presents fees billed for professional audit services and other services rendered to us by KPMG LLP for the years ended August 31, 2014 and 2013 (in thousands).
| Year ended August 31, | ||||||||
| 2014 | 2013 | |||||||
| Audit Fees | $ | 658 | $ | 485 | ||||
| Audit-related Fees | 45 | |||||||
| Tax Fees | — | — | ||||||
| All Other Fees | 3 | — | ||||||
| TOTAL | $ | 706 | $ | 485 | ||||
In the above table, in accordance with applicable SEC rules:
| • | The “Audit Fees” category includes aggregate fees billed in the relevant fiscal year for professional services rendered for the audit of annual financial statements, review of financial statements included in Quarterly Reports on Form 10-Q, services rendered in connection with our initial public offering and for services that are normally provided in connection with statutory or regulatory filings or engagements for those fiscal years. | |
| • | The “Audit-Related Fees” category consists of fees billed for professional services rendered in connection audit requirements relating to our government grants. |
| 92 |
| • | “Tax Fees” are fees in the year for professional services for tax compliance, tax advice, and tax planning. We did not incur any fees related to tax services from KPMG LLP in the years ended August 31, 2014 or 2013. |
| • | “All Other Fees” are fees in the year for any products and services not included in the first three categories. We did not incur any fees related to tax services from KPMG LLP in the years ended August 31, 2014 or 2013. |
Audit Committee Pre-approval Policy
Our Audit Committee pre-approves all audit and non-audit services provided by our independent registered public accounting firm, except where pre-approval is not required because such non-audit services are de minimis under the rules of the SEC, in which case subsequent approval may be obtained. In April 2013, our Audit Committee delegated to the Chair of our Audit Committee the authority to pre-approve audit and permissible non-audit services. Our Audit Committee pre-approval policy is set forth in the Audit Committee Charter available at http://investor.ceres.net.
All fees paid to, and all services provided by, KPMG LLP during the years ended August 31, 2014 and 2013 were pre-approved by our Audit Committee.
| 93 |
Item 15. Exhibits and Financial Statement Schedule
(a)(1) Financial Statements
The financial statements listed in the accompanying Index to Consolidated Financial Statements on page F-1 are filed as part of this Annual Report on Form 10-K.
(a)(2) Financial Statement Schedules.
All schedules are omitted because they are not applicable or the required information is shown in the financial statements or notes thereto.
(a)(3) Exhibits
See “Index to Exhibits” beginning on page E-1, which is incorporated by reference herein. The Index to Exhibits lists all exhibits filed with this Annual Report on Form 10-K and identifies which of those exhibits, if any, are management contracts and compensation plans.
| 94 |
Pursuant to the requirements of Section 13 or 15(d) of the Securities Exchange Act of 1934, the registrant has duly caused this Annual Report to be signed on its behalf by the undersigned, thereunto duly authorized, on the 20th day of November, 2014.
| CERES, INC. | ||
| By: | /s/ PAUL KUC | |
| Name: Paul Kuc | ||
| Title: Chief Financial Officer | ||
POWER OF ATTORNEY
KNOW ALL PERSONS BY THESE PRESENTS, that each person whose signature appears below constitutes and appoints Richard Hamilton, Paul Kuc and Wilfriede van Assche, his/her attorney-in-fact, each with the power of substitution, for him/her in any and all capacities, to sign any amendments to this Annual Report, and to file the same, with exhibits thereto and other documents in connections therewith, with the Securities and Exchange Commission, hereby ratifying and conforming all that each of said attorneys-in-fact, or his or her substitutes, may do or cause to be done by virtue of hereof.
Pursuant to the requirements of the Securities Exchange Act of 1934, this Annual Report has been signed below by the following persons on behalf of the registrant and in the capacities and on the dates indicated.
| Signature | Capacity | Date | ||
| /s/ CHERYL MORLEY | Chair of the Board | November 20, 2014 | ||
| Cheryl P. Morley | ||||
| /s/ PASCAL BRANDYS | Director | November 20, 2014 | ||
| Pascal Brandys | ||||
| /s/ RAY DEBBANE | Director | November 20, 2014 | ||
| Raymond Debbane | ||||
| /s/ RICHARD FLAVELL | Director | November 20, 2014 | ||
| Richard Flavell, PhD, FRS, CBE | ||||
| /s/ DANIEL GLAT | Director | November 20, 2014 | ||
| Daniel Glat | ||||
| /s/ BOB GOLDBERG | Director | November 20, 2014 | ||
| Robert Goldberg | ||||
| /s/ RICHARD HAMILTON | President, Chief Executive Officer and Director | November 20, 2014 | ||
| Richard Hamilton, PhD | ||||
| /s/ THOMAS KILEY | Director | November 20, 2014 | ||
| Thomas Kiley | ||||
| /s/ STEVEN KOONIN | Director | November 20, 2014 | ||
| Steven Koonin |
| 95 |
INDEX TO CONSOLIDATED FINANCIAL STATEMENTS
| F-1 |
Report of Independent Registered Public Accounting Firm
The Board of Directors and Stockholders
Ceres, Inc.:
We have audited the accompanying consolidated balance sheets of Ceres, Inc. and subsidiaries as of August 31, 2014 and 2013 and the related consolidated statements of operations, comprehensive loss, stockholders’ equity (deficit), and cash flows for each of the years in the three-year period ended August 31, 2014. These consolidated financial statements are the responsibility of the Company’s management. Our responsibility is to express an opinion on these consolidated financial statements based on our audits.
We conducted our audits in accordance with the standards of the Public Company Accounting Oversight Board (United States). Those standards require that we plan and perform the audit to obtain reasonable assurance about whether the financial statements are free of material misstatement. An audit includes examining, on a test basis, evidence supporting the amounts and disclosures in the financial statements. An audit also includes assessing the accounting principles used and significant estimates made by management, as well as evaluating the overall financial statement presentation. We believe that our audits provide a reasonable basis for our opinion.
In our opinion, the consolidated financial statements referred to above present fairly, in all material respects, the financial position of Ceres, Inc. and subsidiaries as of August 31, 2014 and 2013 and the results of their operations and their cash flows for each of the years in the three-year period ended August 31, 2014, in conformity with U.S. generally accepted accounting principles.
/s/ KPMG LLP
Los Angeles, California
November 20, 2014
| F-2 |
Consolidated Balance Sheets
(In thousands, except share and per share amounts)
| August 31, | ||||||||
| 2014 | 2013 | |||||||
| Assets | ||||||||
| Current assets: | ||||||||
| Cash and cash equivalents | $ | 3,423 | $ | 8,881 | ||||
| Marketable securities | 24,579 | 21,630 | ||||||
| Prepaid expenses | 633 | 791 | ||||||
| Accounts receivable | 370 | 957 | ||||||
| Inventories | 84 | 20 | ||||||
| Other current assets | 240 | 157 | ||||||
| Total current assets | 29,329 | 32,436 | ||||||
| Property and equipment, net | 2,996 | 4,633 | ||||||
| Other assets | 99 | 109 | ||||||
| Total long-term assets | 3,095 | 4,742 | ||||||
| Total assets | $ | 32,424 | $ | 37,178 | ||||
| Liabilities and Stockholders’ Equity | ||||||||
| Current liabilities: | ||||||||
| Accounts payable and accrued expenses | $ | 4,278 | $ | 3,825 | ||||
| Deferred revenue | 356 | - | ||||||
| Deferred rent | 18 | 18 | ||||||
| Current portion of long-term debt | 70 | 154 | ||||||
| Total current liabilities | 4,722 | 3,997 | ||||||
| Deferred rent | 75 | 93 | ||||||
| Long-term debt, net of current portion | 18 | 82 | ||||||
| Total liabilities | 4,815 | 4,172 | ||||||
| Commitments and contingencies | ||||||||
| Stockholders’ equity: | ||||||||
| Common Stock, $0.01 par value; 240,000,000 shares authorized; 48,192,883 shares issued and outstanding at August 31, 2014; 490,000,000 shares authorized; 24,897,199 shares issued and outstanding at August 31, 2013 | 482 | 248 | ||||||
| Additional paid-in capital | 331,627 | 308,038 | ||||||
| Accumulated other comprehensive loss | (595 | ) | (696 | ) | ||||
| Accumulated deficit | (303,905 | ) | (274,584 | ) | ||||
| Total stockholders’ equity | 27,609 | 33,006 | ||||||
| Total liabilities and stockholders’ equity | $ | 32,424 | $ | 37,178 | ||||
See accompanying notes to the consolidated financial statements.
| F-3 |
Consolidated Statements of Operations
(In thousands, except share and per share amounts)
| Year Ended August 31, | ||||||||||||
| 2014 | 2013 | 2012 | ||||||||||
| Revenues: | ||||||||||||
| Product sales | $ | 146 | $ | 462 | $ | 432 | ||||||
| Collaborative research and government grants | 2,258 | 4,781 | 4,939 | |||||||||
| Total revenues | 2,404 | 5,243 | 5,371 | |||||||||
| Cost and operating expenses: | ||||||||||||
| Cost of product sales | 3,021 | 6,245 | 2,384 | |||||||||
| Research and development | 14,156 | 16,401 | 19,155 | |||||||||
| Selling, general and administrative | 14,484 | 15,187 | 12,634 | |||||||||
| Total cost and operating expenses | 31,661 | 37,833 | 34,173 | |||||||||
| Loss from operations | (29,257 | ) | (32,590 | ) | (28,802 | ) | ||||||
| Interest expense | (68 | ) | (46 | ) | (560 | ) | ||||||
| Interest income | 5 | 126 | 39 | |||||||||
| Other expense | - | - | (84 | ) | ||||||||
| Loss before income taxes | (29,320 | ) | (32,510 | ) | (29,407 | ) | ||||||
| Income tax expense | (1 | ) | (1 | ) | (3 | ) | ||||||
| Net loss | $ | (29,321 | ) | $ | (32,511 | ) | $ | (29,410 | ) | |||
| Basic and diluted net loss per share attributable to common stockholders | $ | (0.81 | ) | $ | (1.31 | ) | $ | (2.18 | ) | |||
| Weighted average outstanding common shares used for net loss per shares attributable to common stockholders: | ||||||||||||
| Basic and diluted | 36,205,962 | 24,796,030 | 13,488,336 | |||||||||
See accompanying notes to the consolidated financial statements.
| F-4 |
Consolidated Statements of Comprehensive Loss
(In thousands)
| Year Ended August 31, | ||||||||||||
| 2014 | 2013 | 2012 | ||||||||||
| Net loss | $ | (29,321 | ) | $ | (32,511 | ) | $ | (29,410 | ) | |||
| Other comprehensive income (loss): | ||||||||||||
| Foreign currency translation adjustments | 100 | (395 | ) | (262 | ) | |||||||
| Net unrealized gain (loss) on marketable securities | 1 | (18 | ) | 6 | ||||||||
| Total comprehensive loss | $ | (29,220 | ) | $ | (32,924 | ) | $ | (29,666 | ) | |||
See accompanying notes to the consolidated financial statements.
| F-5 |
Consolidated Statements of Stockholders’ Equity (Deficit)
(In thousands, except share amounts)
| Accumulated | ||||||||||||||||||||||||
| Common Stock | Additional | Other | Total | |||||||||||||||||||||
| Number of | Paid-in | Comprehensive | Accumulated | Stockholders’ | ||||||||||||||||||||
| Shares | Amount | Capital | Loss | Deficit | Equity (Deficit) | |||||||||||||||||||
| Balance at August 31, 2011 | 2,014,168 | 20 | 8,352 | (27 | ) | (212,663 | ) | (204,318 | ) | |||||||||||||||
| Exercise of common stock options | 298,282 | 3 | 535 | - | - | 538 | ||||||||||||||||||
| Common stock issued upon IPO, net of offering costs | 5,750,000 | 58 | 65,100 | - | - | 65,158 | ||||||||||||||||||
| Conversion of convertible notes upon IPO | 1,098,575 | 11 | 14,271 | - | - | 14,282 | ||||||||||||||||||
| Conversion of convertible preferred stock upon IPO | 15,353,221 | 153 | 197,349 | - | - | 197,502 | ||||||||||||||||||
| Cancellation of common stock | (5,817 | ) | - | - | - | - | — | |||||||||||||||||
| Restricted stock issued | 45,100 | - | - | - | - | — | ||||||||||||||||||
| Restricted stock cancelled | (4,500 | ) | - | - | - | - | — | |||||||||||||||||
| Conversion of liability classified warrants to equity classified warrants upon IPO | - | - | 17,158 | - | - | 17,158 | ||||||||||||||||||
| Stock compensation expense | - | - | 1,909 | - | - | 1,909 | ||||||||||||||||||
| Effect of reverse stock split | - | - | (2 | ) | - | - | (2 | ) | ||||||||||||||||
| Net loss | - | - | - | - | (29,410 | ) | (29,410 | ) | ||||||||||||||||
| Foreign currency translation adjustment | - | - | - | (262 | ) | - | (262 | ) | ||||||||||||||||
| Unrealized gain on marketable securities | - | - | - | 6 | - | 6 | ||||||||||||||||||
| Balance at August 31, 2012 | 24,549,029 | 245 | 304,672 | (283 | ) | (242,073 | ) | 62,561 | ||||||||||||||||
| Exercise of common stock options | 23,832 | - | 56 | - | - | 56 | ||||||||||||||||||
| Restricted stock issued | 348,375 | 3 | - | - | - | 3 | ||||||||||||||||||
| Restricted stock cancelled | (24,037 | ) | - | - | - | - | - | |||||||||||||||||
| Stock compensation expense | - | - | 3,310 | - | - | 3,310 | ||||||||||||||||||
| Net loss | - | - | - | - | (32,511 | ) | (32,511 | ) | ||||||||||||||||
| Foreign currency translation adjustment | - | - | - | (395 | ) | - | (395 | ) | ||||||||||||||||
| Unrealized gain on marketable securities | - | - | - | (18 | ) | - | (18 | ) | ||||||||||||||||
| Balance at August 31, 2013 | 24,897,199 | 248 | 308,038 | (696 | ) | (274,584 | ) | 33,006 | ||||||||||||||||
| Common stock issued upon offering, net of costs | 23,000,000 | 230 | 20,521 | - | - | 20,751 | ||||||||||||||||||
| Restricted stock issued | 346,560 | 4 | - | - | - | 4 | ||||||||||||||||||
| Restricted stock cancelled | (50,876 | ) | - | - | - | - | - | |||||||||||||||||
| Stock compensation expense | - | - | 3,068 | - | - | 3,068 | ||||||||||||||||||
| Net loss | - | - | - | - | (29,321 | ) | (29,321 | ) | ||||||||||||||||
| Foreign currency translation adjustment | - | - | - | 100 | - | 100 | ||||||||||||||||||
| Unrealized gain on marketable securities | - | - | - | 1 | - | 1 | ||||||||||||||||||
| Balance at August 31, 2014 | 48,192,883 | $ | 482 | $ | 331,627 | $ | (595 | ) | $ | (303,905 | ) | $ | 27,609 | |||||||||||
See accompanying notes to the consolidated financial statements.
| F-6 |
Consolidated Statements of Cash Flows
(In thousands)
| Year Ended | ||||||||||||
| August 31, | ||||||||||||
| 2014 | 2013 | 2012 | ||||||||||
| Cash flows from operating activities: | ||||||||||||
| Net loss | $ | (29,321 | ) | $ | (32,511 | ) | $ | (29,410 | ) | |||
| Adjustments to reconcile net loss to net cash used in operating activities: | ||||||||||||
| Change in fair value of common and preferred stock warrants and convertible notes | - | - | 84 | |||||||||
| Impairment of assets, net of insurance proceeds | - | 2 | 26 | |||||||||
| Net loss on disposal of assets | 385 | 109 | 30 | |||||||||
| Depreciation | 1,517 | 1,912 | 2,059 | |||||||||
| Amortization of premiums on marketable securities | 288 | 572 | - | |||||||||
| Stock compensation | 3,068 | 3,310 | 1,909 | |||||||||
| Other | 152 | 130 | - | |||||||||
| Changes in operating assets and liabilities: | ||||||||||||
| Prepaid expenses | 113 | 337 | (419 | ) | ||||||||
| Accounts receivable | 589 | (195 | ) | 527 | ||||||||
| Inventories | (61 | ) | 679 | (841 | ) | |||||||
| Deferred offering costs | - | - | 2,775 | |||||||||
| Other assets | (21 | ) | 26 | 59 | ||||||||
| Accounts payables and accrued expenses | 390 | (1,517 | ) | (1,827 | ) | |||||||
| Deferred revenue | 356 | (701 | ) | (223 | ) | |||||||
| Deferred rent | (18 | ) | (8 | ) | (61 | ) | ||||||
| Net cash used in operating activities | (22,563 | ) | (27,855 | ) | (25,312 | ) | ||||||
| Cash flows from investing activities: | ||||||||||||
| Purchases of property and equipment | (1,014 | ) | (892 | ) | (1,265 | ) | ||||||
| Proceeds from sale of property and equipment | 810 | - | - | |||||||||
| Proceeds from insurance | - | - | 1,000 | |||||||||
| Change in restricted cash and investments | - | - | 3,000 | |||||||||
| Purchase of marketable securities (at cost) | (33,085 | ) | (15,944 | ) | (39,278 | ) | ||||||
| Maturities of marketable securities | 29,700 | 32,879 | - | |||||||||
| Net cash (used in) provided by investing activities | (3,589 | ) | 16,043 | (36,543 | ) | |||||||
| Cash flows from financing activities: | ||||||||||||
| Principal payments on debt | (159 | ) | (240 | ) | (6,921 | ) | ||||||
| Proceeds from issuance of debt and preferred stock warrants | - | - | 2,500 | |||||||||
| Proceeds from issuance of common stock, net of underwriters discounts and commissions and offering expenses | 20,751 | 60 | 538 | |||||||||
| Proceeds from issuance of common stock upon IPO, net of underwriters discounts and commissions and offering expenses | - | - | 65,158 | |||||||||
| Net cash provided by (used in) financing activities | 20,592 | (180 | ) | 61,275 | ||||||||
| Effect of foreign currency translation on cash | 102 | (196 | ) | (262 | ) | |||||||
| Net decrease in cash and cash equivalents | (5,458 | ) | (12,188 | ) | (842 | ) | ||||||
| Cash and cash equivalents at beginning of period | 8,881 | 21,069 | 21,911 | |||||||||
| Cash and cash equivalents at end of period | $ | 3,423 | $ | 8,881 | $ | 21,069 | ||||||
See accompanying notes to the consolidated financial statements.
| F-7 |
CERES, INC.
Consolidated Statements of Cash Flows (continued)
(In thousands)
| Year Ended August 31, | ||||||||||||
| 2014 | 2013 | 2012 | ||||||||||
| Supplemental cash flow information: | ||||||||||||
| Interest paid during the year | $ | 46 | $ | 1 | $ | 376 | ||||||
| Income taxes paid during the year | $ | 1 | $ | 1 | $ | 3 | ||||||
| Supplemental schedule of non-cash investing and financing activities: | ||||||||||||
| Additions to property and equipment under capital leases | $ | — | $ | 263 | $ | 489 | ||||||
| Acquisitions of assets under accounts payable & accrued expenses | $ | — | $ | — | $ | 330 | ||||||
| Surrender of common stock applied to stock option exercise | $ | — | $ | — | $ | 90 | ||||||
| Detail of IPO transactions; | ||||||||||||
| Conversion of convertible notes to common stock | $ | — | $ | — | $ | 14,282 | ||||||
| Conversion of convertible preferred stock to common stock | — | — | $ | 197,502 | ||||||||
| Conversion of liability classified warrants to equity classified warrants | — | — | $ | 17,158 | ||||||||
| Total non-cash IPO transactions | $ | — | $ | — | $ | 228,942 | ||||||
See accompanying notes to the consolidated financial statements
| F-8 |
(1) Summary of Significant Accounting Policies
Description of Business
Ceres, Inc. (Company) is an agricultural biotechnology company that develops and markets seeds to produce crops for bioenergy and other markets that utilize plant biomass. The Company uses a combination of advanced plant breeding and biotechnology to develop seed products. These technology platforms, which can increase crop productivity, improve quality, reduce crop inputs and improve cultivation on marginal land, have broad application across multiple crops, including food, feed, fiber and fuel crops.
In January 2010, the Company formed a subsidiary, Ceres Sementes do Brasil Ltda. The Company’s ownership in this subsidiary is 99.9% and the Company’s Chief Executive Officer owns the remaining interest. In May 2014, the Company formed a wholly owned subsidiary, Ceres Agrotechnologies Intl LLC. In May 2014, the Company also formed a subsidiary, CS Semillas de Mexico, S.de L. de C.V. The Company’s ownership in this subsidiary is 99.9% and Ceres Agrotechnologies Intl LLC owns the remaining interest.
On January 24, 2012, the Company filed an amended and restated certificate of incorporation which effected a 1 for 3 reverse stock split of the Company’s issued and outstanding shares of common stock. The par value of the common stock was not adjusted as a result of the reverse stock split. All issued and outstanding shares of common stock and stock options and per share amounts contained in the Company’s consolidated financial statements have been retroactively adjusted to reflect this reverse stock split for all periods presented.
On February 27, 2012, the Company closed its initial public offering (IPO) of 5,750,000 shares of common stock (including 750,000 shares purchased by the underwriters upon the exercise of their option to purchase up to an additional 750,000 shares) at an offering price of $13.00 per share, resulting in net proceeds to the Company of approximately $65,158, after deducting underwriting discounts and commissions and offering expenses. Upon closing of the IPO, all of the Company’s outstanding shares of convertible preferred stock were automatically converted into 15,353,221 shares of common stock, all of the Company’s outstanding convertible subordinated notes (Convertible Notes) were automatically converted into 1,098,575 shares of common stock and all of the Company’s outstanding convertible preferred stock warrants were automatically converted into warrants to purchase a total of 20,511 shares of common stock.
On March 10, 2014, the Company completed a registered public offering of 23,000,000 shares of its common stock (including 3,000,000 shares purchased by the underwriter upon the exercise in full of their right to purchase up to an additional 3,000,000 shares to cover over-allotments) at a price to the public of $1.00 per share. The Company received approximately $20,800 of proceeds from the offering, after deducting underwriting discounts and commissions and offering expenses.
Liquidity
The Company has incurred substantial net losses from operations since its inception, including net losses of $29,321, $32,511 and $29,410 for the years ended August 31, 2014, 2013, and 2012, respectively. As of August 31, 2014 the Company had an accumulated deficit of $303,905.
On October 11, 2013, the Company commenced the implementation of a plan (Plan) intended to further align expenditures with the Company’s near-term commercial opportunity in Brazil, shift Northern Hemisphere sorghum breeding activities from College Station, Texas to a more appropriate location, de-emphasize research and development for U.S. cellulosic feedstocks, reduce costs and conserve cash. The actions taken under the Plan, which included, among others, a workforce reduction that impacted 16 positions in the U.S, were completed at August 31, 2014. During 2014, the Company incurred total charges of approximately $1,600 with respect to the U.S. workforce reductions, including $900 of one-time severance expenses, $400 for continuation of salary and benefits of certain employees until their work was completed and $300 of other costs. Of the $1,600 of cash payments made during the nine months ending May 31, 2014, $1,000, $500 and $100 was recorded to research and development expenses, cost of sales and general and administrative expenses, respectively.
| F-9 |
The Company expects to incur additional losses related to the continued development and expansion of its business, including research and development, seed production and operations, and sales and marketing.
The Company plans to fund its operations for the next 12 to 15 months subsequent to August 31, 2014 with cash and marketable securities currently on hand, and with cash inflows from collaboration and grant funding and from product sales. Management believes that the Company’s cash and cash equivalents and marketable securities at August 31, 2014 are sufficient to fund operations for the next 12 to 15 months.
The Company will seek additional funds through collaborations, public or private debt or equity financings or government programs, and may also seek to reduce expenses related to the Company’s operations. There are no assurances that such public or private financing of government programs will be available to us or that the terms would be acceptable to the Company. There is also no assurance that the Company will achieve profitable operations, or if achieved, that profitable operations can be sustained on a continued basis.
Basis of Presentation
The accompanying consolidated financial statements have been prepared in accordance with the accounting principles generally accepted in the United States of America (GAAP) and with the Rules and Regulations of the Securities and Exchange Commission. The consolidated financial statements include the accounts of the Company and its subsidiaries. All significant intercompany balances and transactions have been eliminated in consolidation.
Use of Estimates
The preparation of financial statements in conformity with accounting principles generally accepted in the United States of America requires management to make estimates and assumptions. This affects the reported amounts of assets and liabilities and disclosure of contingent assets and liabilities at the date of the financial statements and the reported amounts of revenue and expenses during the reporting period. Significant items subject to such estimates and assumptions include the valuation of property and equipment, inventory, deferred tax assets, common stock, convertible preferred stock, stock options, warrant liabilities and convertible notes. Actual results could differ from those estimates.
Cash Equivalents
The Company considers all highly liquid investments, with an original maturity of three months or less when purchased, to be cash equivalents. Cash equivalents totaled $3,423 and $8,881 at August 31, 2014 and 2013, respectively.
Marketable Securities
Marketable securities are classified as available for sale and are recorded at fair value, with the unrealized gains and losses, if any, net of taxes, reported as a component of shareholders’ equity until realized or until a determination is made that an other-than-temporary decline in market value has occurred.
In determining whether an other-than-temporary impairment exists for debt securities, management considers: (1) the length of time and the extent to which the fair value has been less than cost, (2) the financial condition and near-term prospects of the issuer and (3) the intent and ability of the Company to retain its investment in the issuer for a period of time sufficient to allow for any anticipated recovery in fair value. Management has determined that there has been no other-than-temporary impairment of its marketable securities.
| F-10 |
The cost of marketable securities sold is based upon the specific identification method and any realized gains or losses on the sale of investments are reflected as a component of interest income or expense. There were no sales of marketable securities during the years ended August 31, 2014 and 2013.
The Company classifies marketable securities as current or non-current based upon whether such assets are reasonably expected to be realized in cash or sold or consumed during the normal operating cycle of the business.
Financial Instruments
The carrying value of financial instruments such as cash and cash equivalents, accounts receivables, accounts payable, and accrued expenses approximate their fair value due to the short-term nature of these instruments. At each period end, the fair value of the long-term debt approximated carrying value based on interest rates currently available to the Company.
Fair Value of Financial Instruments
Assets and liabilities recorded at fair value in the consolidated financial statements are categorized based upon the level of judgment associated with the inputs used to measure their fair value. Hierarchical levels that are directly related to the amount of subjectivity associated with the inputs to the valuation of these assets or liabilities are as follows:
| • | Level 1 inputs are quoted prices (unadjusted) in active markets for identical assets or liabilities that the Company can access at the measurement date. | |
| • | Level 2 inputs are inputs other than quoted prices included within Level 1 that are observable for the asset or liability, either directly or indirectly. | |
| • | Level 3 inputs are unobservable inputs for the asset or liability. |
The following tables present the Company’s financial assets that were measured at fair value on a recurring basis as of August 31, 2014 and 2013 by level within the fair value hierarchy:
| August 31, 2014 | ||||||||||||||||
| Level 1 | Level 2 | Level 3 | Total | |||||||||||||
| Financial Assets | ||||||||||||||||
| Money market funds | $ | 2,114 | $ | — | $ | — | $ | 2,114 | ||||||||
| Certificates of deposit — available for sale | — | 4,240 | — | 4,240 | ||||||||||||
| Commercial paper — available for sale | — | 5,249 | — | 5,249 | ||||||||||||
| Corporate bonds — available for sale | — | 15,150 | — | 15,150 | ||||||||||||
| Total | $ | 2,114 | $ | 24,639 | $ | — | $ | 26,753 | ||||||||
All of the money market funds and $60 of the certificates of deposit are included in cash and cash equivalents on the consolidated balance sheets.
| F-11 |
| August 31, 2013 | ||||||||||||||||
| Level 1 | Level 2 | Level 3 | Total | |||||||||||||
| Financial Assets | ||||||||||||||||
| Money market funds | $ | 2,310 | $ | — | $ | — | $ | 2,310 | ||||||||
| Certificates of deposit — available for sale | — | 4,555 | — | 4,555 | ||||||||||||
| Commercial paper — available for sale | — | 2,198 | — | 2,198 | ||||||||||||
| Corporate bonds — available for sale | — | 16,076 | — | 16,076 | ||||||||||||
| Total | $ | 2,310 | $ | 22,829 | $ | — | $ | 25,139 | ||||||||
All of the money market funds and $1,199 of the commercial paper are included in cash and cash equivalents on the consolidated balance sheets.
Accounts Receivable
Accounts receivable represents amounts owed to the Company from product sales and collaborative research and government grants. The Company had no amounts reserved for doubtful accounts at August 31, 2014 and 2013 as the Company expected full collection of the accounts receivable balances.
Customers representing greater than 10% of accounts receivable were as follows (in percentages):
| As of August 31, | ||||||||
| Customers | 2014 | 2013 | ||||||
| Customer A | ** | 37.3 | ||||||
| Customer B | 59.5 | 23.1 | ||||||
| Customer E | 25.9 | * | ||||||
| Customer F | ** | 21.8 | ||||||
| * | Less than 10% |
| ** | No balance |
Customers representing greater than 10% of revenues were as follows (in percentages):
| Year Ended August 31, | ||||||||||||
| Customers | 2014 | 2013 | 2012 | |||||||||
| Customer A | 17.5 | 21.2 | 24.7 | |||||||||
| Customer B | 41.9 | 20.2 | 16.8 | |||||||||
| Customer D | ** | 14.5 | 17.4 | |||||||||
| Customer E | 16.5 | * | * | |||||||||
| Customer F | 11.6 | 22.5 | 14.0 | |||||||||
| * | * | |||||||||||
| * | Less than 10% |
| ** | No revenue |
Inventories and Inventory Valuation
At August 31, 2014 and 2013, seed inventory consisted of work-in-process and included finished goods at August 31, 2014 for costs related to the Company’s sorghum seeds in Brazil. When inventory costs exceed expected market value due to obsolescence or lack of demand, inventory write-downs are recorded for the difference between the cost and the market value in the period based on the Company's evaluation of such inventory.
| F-12 |
Property and Equipment
Property and equipment is stated at cost. Depreciation is provided using the straight-line method over the shorter of the estimated useful lives or the remaining life of the lease. Depreciation periods for the Company’s property and equipment are as follows:
| Automobiles and trucks | 3-5 years |
| Office, laboratory, farm and warehouse equipment and furniture | 3-5 years |
| Leasehold improvements | 3-10 years |
| Buildings | 14-39 years |
Assets Held for Sale
The Company reclassifies long-lived assets to Assets Held for Sale when all required criteria for such reclassification are met. The assets are recorded at the lower of the carrying value or fair value less costs to sell. Assets held for sale must meet the following conditions: (1) management, having authority to approve the action, commits to a plan to sell the asset, (2) the asset is available for immediate sale in its present condition, (3) an active program to locate a buyer and other actions required to complete the plan to sell the asset have been initiated, (4) the sale of the asset is probable, and transfer of the asset is expected to qualify for recognition as a completed sale, within one year, (5) the asset is being actively marketed for sale at a price that is reasonable in relation to its current fair value, and (6) actions required to complete the plan indicate that it is unlikely that significant changes to the plan will be made or that the plan will be withdrawn.
In connection with an agreement the Company entered into on March 31, 2014 to sell its facility and certain equipment located in College Station, Texas, a determination was made that the assets met the criteria to be classified as held for sale and the fair value for the related assets was in excess of their carrying amount. Accordingly, the Company recorded a charge of $464 to Other expense for the difference between the net carrying amount of these assets of $1,152 and the net cash proceeds of $688. On June 2, 2014, the Company completed the sale of this facility and equipment for net cash proceeds of $688.
Impairment of Long-Lived Assets
Long-lived assets, such as property and equipment, are reviewed for impairment whenever events or changes in circumstances indicate that the carrying amount of an asset may not be recoverable. To the extent that an impairment indicator has occurred, recoverability of assets to be held and used is measured by a comparison of the carrying amount of an asset to estimated undiscounted future cash flows expected to be generated by the asset. If the carrying amount of an asset exceeds its estimated undiscounted future cash flows, an impairment charge is recognized in the amount by which the carrying amount of the asset exceeds the fair value of the asset.
On February 3, 2012, the Company’s plant breeding and field research station located near College Station, Texas was damaged by a tornado. The impact was limited to structural damage to the building that houses office space and a small laboratory used to evaluate biomass samples and work space. A small greenhouse and tractor sheds, and some agricultural equipment were also damaged.
In fiscal year 2012, the Company impaired $1,026 in assets related to damage at the Texas facility and received insurance proceeds of $1,000 for repair costs. The remainder of the repairs, which totaled approximately $150, were completed by November 30, 2012. These remaining repairs were also covered by insurance, subject to the Company’s deductible.
| F-13 |
Common and Convertible Preferred Stock Warrant Liabilities
Prior to the closing of the IPO, the Company determined that common stock warrants issued to certain holders of convertible preferred stock were not considered indexed to the Company’s common stock and therefore required liability classification. In addition, the Company accounted for its warrants to purchase shares of the Company’s convertible preferred stock that were contingently redeemable as liabilities at fair value on the consolidated balance sheets. These common and convertible preferred stock warrants were subject to re-measurement at each balance sheet date and the changes in fair value, if any, were recognized as other (expense) income.
Upon the closing of the IPO, certain common and convertible preferred stock warrants, previously classified as liabilities were revalued and reclassified to additional paid-in capital as they no longer met the requirements for liability classification given the automatic conversion of the convertible preferred stock to common stock upon consummation of the IPO.
Convertible Preferred Stock
In connection with the Company’s decision to file a registration statement with the Securities and Exchange Commission for the IPO, the Company adopted the provisions of Accounting Standards Codification (ASC) Topic 480-10-S99-3A, Classification and Measurement of Redeemable Securities.
The convertible preferred stock was not redeemable by the Company or at the option of the preferred stockholders. The holders of the Company’s outstanding convertible preferred stock, voting or consenting together as a separate class, controlled the vote of the Company’s stockholders. As a result, the holders of all series of the Company’s convertible preferred stock could vote to approve a change in control under circumstances that would trigger a deemed liquidation under the Company’s certificate of incorporation in effect prior to the IPO. As redemption of the convertible preferred stock through a deemed liquidation was outside the control of the Company, all shares of convertible preferred stock were classified as temporary equity rather than as a component of stockholders’ equity in the Company’s consolidated balance sheets. The carrying value of convertible preferred stock was recorded at its fair value at the date of issue. As discussed in Note (1), all of the outstanding shares of convertible preferred stock were automatically converted into shares of common stock upon the closing of the IPO.
Stock-Based Compensation
The Company accounts for stock-based compensation arrangements with employees using a fair value method under ASC Topic 718, Compensation – Stock Compensation, which requires the recognition of compensation expense for costs related to all stock-based payments including stock options and restricted stock awards.
The fair value method requires the Company to estimate the fair value of stock-based payment awards on the date of grant using an option pricing model. The Company uses an option pricing model to estimate the fair value of stock options granted that are expensed on a straight-line basis over the vesting period. The Company accounts for stock options issued to non-employees based on the estimated fair value of the awards using the option pricing model. The measurement of stock-based compensation to non-employees is subject to periodic adjustments as the underlying equity instruments vest, and the resulting change in value, if any, is recognized in the Company’s consolidated statements of operations during the period the related services are rendered.
The Company accounts for restricted stock awards based on the quoted market price of the Company’s common stock on the date of grant that are expensed on a straight-line basis over the vesting period.
| F-14 |
Revenue Recognition
Revenues are recognized when the following criteria are met: (1) persuasive evidence of an arrangement exists; (2) transfer of product or technology has been completed or services have been rendered; (3) the fee is fixed or determinable; and (4) collectability is reasonably assured. To date, the Company’s primary source of revenues has been derived from collaborative research agreements and government grants and to a lesser extent, product sales.
Product Sales
Product sales are derived from seed and biomass sales, and trait fees. Product sales are recognized, net of discounts and allowances, once passage of title and risk of loss have occurred and contractually specified acceptance criteria have been met, provided all other revenue recognition criteria have also been met.
Collaborative Research and Government Grants
From time to time, the Company has entered into research and development collaboration agreements with third parties, including a large agriculture supplier, a consumer goods conglomerate and several biofuel producers. In addition, the Company has received grants from government agencies such as the Department of Energy (DOE) and the United States Department of Agriculture (USDA). The research and development collaboration agreements typically provide the Company with multiple revenue streams, which may include up-front, non-refundable fees for licensing certain of the Company’s technologies, government grants and fees for research and development activities, and contingent milestone payments based upon achievement of contractual criteria.
| • | Technology License Fees — For collaboration agreements in which the Company has continuing involvement, license fees are recognized on a straight-line basis over the term of the arrangement. Licensing fees are non-refundable and not subject to future performance. |
| • | Government Grants — The Company receives payments from government entities in the form of government grants. Government grants generally provide the Company with cost reimbursement for certain types of expenditures in return for research and development activities over a contractually defined period, as well an allocated portion of overhead expenses. Revenues from government grants are recognized in the period during which the related costs are incurred, provided substantially all the conditions under which the government grants were provided have been met and the Company has only perfunctory obligations outstanding. |
| • | Research and Development Fees — Generally, fees for research and development activities are recognized as the services are performed over the performance period, as specified in the respective agreements. Certain of the Company’s collaboration agreements require the Company to deliver research data by specific dates and that the collective program plan will result in reaching specific crop characteristics by certain dates. For such arrangements, the Company recognizes revenues based on the approximate percentage of completion of services under the agreement, but the revenue recognized cannot exceed payments received by the Company to date under the agreement. The research and development period is estimated at the inception of each agreement and is periodically evaluated. |
| • | Milestone Fees — Fees that are contingent based on achievement of substantive performance milestones at inception of the agreement are recognized based on the achievement of the milestone, as defined in the respective agreements. |
| F-15 |
Deferred Revenue
The Company recognizes deferred revenue to the extent that cash received under the collaboration agreement is in excess of the revenues recognized related to the agreement since the work under the agreement has not yet been performed, or the work has not been fully completed as prescribed in the statement of work at the balance sheet date, which is classified as other current liabilities on the accompanying consolidated balance sheets.
On December 20, 2007, the Company and Campbell Soup Company (Campbell) entered into a development and license agreement under which the Company was working to improve yields of a food product. The agreement provided that the Company would receive $7,500 in payments from Campbell over a five-year period provided milestones were met. In addition, the agreement provided that the Company would be entitled to receive a royalty based on the gross sales of crop varieties created under the agreement. In December 2011, the development and license agreement was amended to extend the $7,500 in payments from Campbell over a six-year period. In November 2012, following Campbell’s sale of its vegetable seed assets to a third party, the development and license agreement, as amended, was terminated and cancelled. In connection with the termination, Campbell paid the Company $550 in full and complete satisfaction of all remaining financial obligations. The Company recognized revenue of $758 and $933 under this agreement in 2013 and 2012, respectively.
The Company has earned research funding revenues from several agreements with the DOE, the USDA, USAID and several leading bio-fuels producers whereby the Company performed research activities and received revenues that partially reimbursed its expenses incurred. Under such grants and agreements, the Company retained a proprietary interest in the products and technology it developed. These expense reimbursements primarily consisted of direct expense sharing arrangements. The Company recorded revenue related to these grants of approximately $1,575, $2,355 and $2,416 in 2014, 2013 and 2012, respectively. The cumulative remaining amount to be claimed for all grants and certain collaboration agreements outstanding as of August 31, 2014 is approximately $1,682.
On December 16, 2008, the Company and Syngenta Biotechnology, Inc. (Syngenta) entered into a software license and collaboration agreement pursuant to which the Company provided software, software development and customer support for certain research application-based software. The agreement was structured into three phases and under the agreement, the Company received $1,500 in payments over an approximate 4.5 year period. The software delivered is comprised of multiple elements, which include software, installation, training, customization of software, and software support. On April 16, 2012, the agreement was amended to reflect Syngenta’s acceptance of all software and software support services provided under the original agreement and to allow for the continuation of certain software support services during a post development support period beginning April 16, 2012 and extending until all services are terminated pursuant to the terms of the agreement. The Company recognized revenues equal to the amount of expense recognized as services were rendered until April 15, 2012, when the software support became the only undelivered element. Beginning April 16, 2012, the unrecognized revenue under the agreement was recognized ratably over the first additional software support period. The Company recognized revenues totaling $278, $1,180 and $750 under this agreement in 2014, 2013 and 2012, respectively.
Research and Development
Research and development expenses principally consist of personnel costs related to the Company’s research and development staff as well as depreciation of research and development assets. Research and development expenses also include costs incurred for laboratory supplies, reimbursable costs associated with government grants and collaborative agreements, third-party contract payments, consultants, facility and related overhead costs.
| F-16 |
Income Taxes
The Company accounts for income taxes in accordance with ASC 740, Income Taxes. Deferred tax assets and liabilities are recognized for the future tax consequences attributable to differences between the financial statement carrying amounts of existing assets and liabilities and their respective tax bases and operating loss and tax credit carryforwards. Deferred tax assets and liabilities are measured using enacted tax rates expected to apply to taxable income in the years in which those temporary differences are expected to be recovered or settled. The effect on deferred tax assets and liabilities of a change in tax rates is recognized in income in the period that includes the enactment date. A valuation allowance is provided for the amount of deferred tax assets that, based on available evidence, are not expected to be realized.
The Company accounts for unrecognized tax benefits also in accordance with ASC 740, Income Taxes, which prescribes a minimum probability threshold that a tax position must meet before a financial statement benefit is recognized. The minimum threshold is defined as a tax position that is more likely than not to be sustained upon examination by the applicable taxing authority, including resolution to any related appeals or litigation, based solely on the technical merits of the position. The Company has no accrual for interest or penalties related to uncertain tax positions at August 31, 2014 and 2013, and did not recognize interest or penalties in the Statements of Operations during the years ended August 31, 2014, 2013 and 2012.
The major jurisdictions in which the Company files income tax returns include the federal and state jurisdictions within the United States and Brazil, where it has a subsidiary. The tax years after 2008 remain open to examination by federal and state taxing jurisdictions and the tax years after 2010 remain open to examination by foreign jurisdictions. However, the Company has NOLs beginning in 1998 which would cause the statute of limitations to remain open for the year in which the NOL was incurred.
Foreign Currency Translation
The Brazilian real is the functional currency of the Company’s subsidiary in Brazil and the Mexican Peso is the functional currency of the Company’s subsidiary in Mexico. Accordingly, assets and liabilities of those operations are translated into United States dollars using the current exchange rate in effect at the balance sheet date and equity accounts are translated into United States dollars using historical rates. Revenues and expenses are translated at the weighted average rate of exchange during the reporting period. Gains and losses from foreign currency translation adjustments are represented as a component of accumulated other comprehensive loss.
Accumulated Other Comprehensive Loss
The Company’s unrealized gains and losses on available-for-sale securities and foreign currency translation adjustments represents the components of comprehensive loss and have been disclosed in the consolidated statements of stockholders’ equity (deficit).
The following summarizes the changes in the balances of each component of accumulated comprehensive income (loss) during the years presented:
| Accumulated | ||||||||||||
| Foreign | Unrealized | Other | ||||||||||
| Currency | Gains (Losses) | Comprehensive | ||||||||||
| Translation | on Securities | Loss | ||||||||||
| Balance at August 31, 2012 | $ | (289 | ) | $ | 6 | $ | (283 | ) | ||||
| Comprehensive loss | (395 | ) | (18 | ) | (413 | ) | ||||||
| Balance at August 31, 2013 | (684 | ) | (12 | ) | (696 | ) | ||||||
| Comprehensive gain | 100 | 1 | 101 | |||||||||
| Balance at August 31, 2014 | $ | (584 | ) | $ | (11 | ) | $ | (595 | ) | |||
| F-17 |
Basic and Diluted Net Loss Per Share
Basic net loss per common share is computed by dividing net loss attributable to common stockholders by the weighted average number of common shares outstanding. Diluted net loss per common share is computed by dividing net loss available to common stockholders by the weighted average number of common shares and dilutive potential common share equivalents then outstanding, to the extent they are dilutive. Potential common shares consist of shares issuable upon the exercise of stock options and warrants (using the treasury stock method), and the weighted average conversion of the convertible preferred stock into shares of common stock (using the if-converted method). Dilutive net loss per share is the same as basic net loss per share for all periods presented because the effects of potentially dilutive items were anti-dilutive.
The following table sets forth the computation of basic and diluted net loss per common share:
| Year Ended | ||||||||||||
| August 31, | ||||||||||||
| 2014 | 2013 | 2012 | ||||||||||
| Net loss | $ | (29,321 | ) | $ | (32,511 | ) | $ | (29,410 | ) | |||
| Basic and diluted net loss per common share | $ | (0.81 | ) | $ | (1.31 | ) | $ | (2.18 | ) | |||
| Basic and diluted weighted average outstanding common shares used for net loss | 36,205,962 | 24,796,030 | 13,488,336 | |||||||||
The following potentially dilutive, common share equivalents were excluded from the calculation of diluted net loss per common share because their effect was anti-dilutive for each of the periods presented:
| Year Ended | ||||||||||||
| August 31, | ||||||||||||
| 2014 | 2013 | 2012 | ||||||||||
| Options to purchase common stock | 3,172,948 | 2,791,556 | 2,778,508 | |||||||||
| Warrants to purchase common stock | 2,562,045 | 2,082,045 | 2,082,045 | |||||||||
| Total | 5,734,993 | 4,873,601 | 4,860,553 | |||||||||
Segment information
Management has determined that it has one business activity and operates in one segment as it only reports financial information on an aggregate and consolidated basis to its Chief Executive Officer, who is the Company’s chief operating decision maker.
Recent Accounting Pronouncements
In July 2013, the FASB issued ASU 2013-11, Income Taxes (Topic 740): Presentation of an Unrecognized Tax Benefit When a Net Operating Loss Carryforward, a Similar Tax Loss, or a Tax Credit Carryforward Exists. ASU 2013-11 requires an entity to present an unrecognized tax benefit as a reduction of a deferred tax asset for a net operating loss (NOL) carryforward, or similar tax loss or tax credit carryforward, rather than as a liability when: (1) the uncertain tax position would reduce the NOL or other carryforward under the tax law of the applicable jurisdiction, and (2) the entity intends to use the deferred tax asset for that purpose. ASU 2013-11 changes existing presentation requirements but does not require new recurring disclosures and is effective for fiscal years, and the interim periods within those years, beginning after December 15, 2013. The Company does not anticipate that the adoption of this ASU will materially change the presentation of its consolidated financial statements.
| F-18 |
In May 2014, the Financial Accounting Standards Board issued the Accounting Standards Update (“ASU”) 2014-09 Revenue from Contracts with Customers (Topic 606). ASU 2014-09 replaces the majority of all U.S. GAAP guidance that currently exists on revenue recognition with a single model to be applied to all contracts with customers. The core principle of ASU 2014-09 is that an entity should recognize revenue to depict the transfer of promised goods or services to customers in an amount that reflects the consideration to which the entity expects to be entitled in exchange for those goods or services.
For a public entity, ASU 2014-09 is effective for annual reporting periods beginning after December 15, 2016, including interim periods within that reporting period. Early application is not permitted. An entity must apply ASU 2014-09 using either the full retrospective approach, by restating all years presented, or the cumulative effect at the date of adoption approach. We are currently assessing the impact that these changes will have on our consolidated financial statements and therefore are unable to quantify such impact or determine the method of adoption.
In August 2014, the FASB issued ASU No. 2014-15, Presentation of Financial Statements - Going Concern Sub-topic 205-40. The new guidance addresses management’s responsibility to evaluate whether there is substantial doubt about an entity’s ability to continue as a going concern and to provide related footnote disclosures. This ASU is effective for interim and annual periods beginning on or after December 15, 2016, and early adoption is permitted. The Company does not expect the adoption of this guidance to have a material impact on its financial position or results of operations.
(2) Marketable Securities
Marketable securities classified as available for sale consisted of the following:
| August 31, 2014 | ||||||||||||||||
| Gross | Gross | |||||||||||||||
| Amortized | Unrealized | Unrealized | ||||||||||||||
| Available for sale securities | Cost | Gain | Loss | Fair Value | ||||||||||||
| Certificates of Deposit | $ | 4,244 | $ | - | $ | (4 | ) | $ | 4,240 | |||||||
| Commercial Paper | 5,249 | - | - | 5,249 | ||||||||||||
| Corporate Bonds | 15,157 | - | (7 | ) | 15,150 | |||||||||||
| Total | $ | 24,650 | $ | - | $ | (11 | ) | $ | 24,639 | |||||||
| August 31, 2013 | ||||||||||||||||
| Gross | Gross | |||||||||||||||
| Amortized | Unrealized | Unrealized | ||||||||||||||
| Available for sale securities | Cost | Gain | Loss | Fair Value | ||||||||||||
| Certificates of Deposit | $ | 4,561 | $ | - | $ | (6 | ) | $ | 4,555 | |||||||
| Commercial Paper | 2,199 | - | (1 | ) | 2,198 | |||||||||||
| Corporate Bonds | 16,081 | 2 | (7 | ) | 16,076 | |||||||||||
| Total | $ | 22,841 | $ | 2 | $ | (14 | ) | $ | 22,829 | |||||||
At August 31, 2014 and 2013, $60 of the certificates of deposit and $1,199 of the commercial paper, respectively, is included in the cash and cash equivalents on the consolidated balance sheets.
There were no marketable securities classified as held-to maturity as of August 31, 2014 and 2013, respectively.
All marketable securities at August 31, 2014 and 2013 are due to mature in one year or less.
(3) Inventories
Inventories consisted of the following:
| August 31, | August 31, | |||||||
| 2014 | 2013 | |||||||
| Work in process | $ | 20 | $ | 20 | ||||
| Seed inventory | 64 | - | ||||||
| Total inventories | $ | 84 | $ | 20 | ||||
| F-19 |
(4) Property and Equipment
Property and equipment are summarized as follows:
| As of | ||||||||
| August 31, | ||||||||
| 2014 | 2013 | |||||||
| Land | $ | 43 | $ | 43 | ||||
| Automobiles and trucks | 1,113 | 796 | ||||||
| Buildings | 1,215 | 3,180 | ||||||
| Office, laboratory, farm and warehouse equipment and furniture | 12,718 | 14,792 | ||||||
| Leasehold improvements | 5,659 | 5,716 | ||||||
| 20,748 | 24,527 | |||||||
| Less accumulated depreciation | (17,752 | ) | (19,894 | ) | ||||
| Property and equipment, net | $ | 2,996 | $ | 4,633 | ||||
(5) Accounts Payable and Accrued Expenses
Accounts payable and accrued expenses consisted of the following:
| As of | ||||||||
| August 31, | ||||||||
| 2014 | 2013 | |||||||
| Accounts payable | $ | 1,406 | $ | 1,289 | ||||
| Accrued payroll and related expenses | 2,303 | 1,020 | ||||||
| Research and development contracts | 123 | 1,098 | ||||||
| Accrued grower commitments | 54 | 38 | ||||||
| Other | 392 | 380 | ||||||
| $ | 4,278 | $ | 3,825 | |||||
(6) Long-Term Debt
Long-term debt is summarized as follows:
| As of | ||||||||
| August 31, | ||||||||
| 2014 | 2013 | |||||||
| Capital Leases | $ | 88 | 236 | |||||
| Less current portion | (70 | ) | (154 | ) | ||||
| $ | 18 | $ | 82 | |||||
The aggregated maturities of debt as of August 31, 2014 are as follows:
| 2015 | $ | 70 | ||
| 2016 | 18 | |||
| $ | 88 |
| F-20 |
(7) Stock-Based Compensation
Equity Plans
The Company has established three equity plans: the Ceres, Inc. 2000 Stock Option/Stock Issuance Plan (2000 Plan), the Ceres, Inc. 2010 Stock Option/Stock Issuance Plan (2010 Plan) and the Amended and Restated Ceres, Inc. 2011 Equity Incentive Plan (2011 Plan, and collectively with the 2000 Plan and the 2010 Plan, the Equity Plans). The Equity Plans provide for grants of Incentive Stock Options (ISOs) to employees and Nonqualified Stock Options (NSOs), stock and restricted stock to employees, directors, and consultants. In addition, the 2011 Plan provides for the grant of other equity based awards such as restricted stock units, stock appreciation rights and deferred stock to employees, directors and consultants. The option term, as determined by the Company’s Board of Directors, may not exceed ten years. Vesting, also determined by the Company’s Board of Directors, generally occurs ratably over four to five years. ISOs and NSOs may be granted at a price per share of not less than the fair market value at the date of grant.
During September 2012, the Company modified options to purchase 403,333 shares of common stock that were scheduled to expire on December 18, 2012 by extending the terms such that the options now expire on December 18, 2015. A modification charge of $157 was recorded in September 2012.
The total number of shares reserved for issuance under the Equity Plans is 6,754,999. At the Company’s 2013 Annual Meeting of Stockholders, the stockholders approved the amendment and restatement of the Ceres, Inc. 2011 Equity Incentive Plan, which increased the maximum aggregate number of shares that may be issued under the plan by 1.5 million shares and prohibits the re-pricing of stock options without stockholder approval. As of August 31, 2014, the Company had 1,241,526 shares available under the 2011 Plan for future grant. The Company does not intend to make further grants under the 2000 Plan or the 2010 Plan.
Stock Option Valuation and Compensation
The Company uses a Black Scholes option pricing model to determine the fair value of stock options. The weighted average grant date fair value of stock option awards was $0.91, $2.64 and $10.40 per option share for 2014, 2013, and 2012, respectively.
The weighted average grant date estimated fair value of the Company’s common stock was $1.28, $3.63 and $14.44 per share for 2014, 2013, and 2012, respectively.
The fair value of employee stock options was estimated using the following weighted-average assumptions:
| Year ended | ||||||||||||
| August 31, | ||||||||||||
| 2014 | 2013 | 2012 | ||||||||||
| Expected term (in years) | 5.50-6.08 | 5.50-6.08 | 5.50-6.46 | |||||||||
| Expected volatility | 83%-87 | % | 87%-88 | % | 78%-81 | % | ||||||
| Risk free interest rate | 1.62%-2.04 | % | 0.82%-1.96 | % | 0.88%-1.35 | % | ||||||
| Expected dividend yield | 0 | % | 0 | % | 0 | % | ||||||
Expected Term — Because of limited employee share option exercises, the Company uses a simplified method in which the expected term of an award is presumed to be mid-point between the vesting date and the expiration date of the award. The expected term for all employee option grants is an average of 3.06 years.
Expected Volatility — The Company estimates the volatility of its common stock by using the historical volatility of a group of comparable companies over the option’s expected term. The decision to use historical volatility of comparable companies was based upon the fact there is limited history of trading activity of the Company’s common stock.
| F-21 |
Risk-Free Interest Rate — The Company bases the risk-free interest rate used in the option valuation model on U.S. Treasury zero-coupon issues with remaining terms similar to the expected term on the options.
Expected Dividend Yield — The Company does not anticipate paying any cash dividends in the foreseeable future.
Stock-based compensation expense included in operating expenses and total intrinsic value of stock options exercised are as follows:
| Year ended | ||||||||||||
| August 31, | ||||||||||||
| 2014 | 2013 | 2012 | ||||||||||
| Stock-based compensation costs for employee stock options | $ | 3,074 | $ | 3,624 | $ | 2,464 | ||||||
| Fair value changes of collaboration warrants | (6 | ) | (314 | ) | (555 | ) | ||||||
| Total stock-based compensation costs included in operating expenses | $ | 3,068 | $ | 3,310 | $ | 1,909 | ||||||
| Intrinsic value of stock options exercised | $ | - | $ | 79 | $ | 3,573 | ||||||
Stock Option Activity
The following summarizes the stock option transactions under the Equity Plans during the periods presented:
| Weighted | ||||||||
| Average | ||||||||
| Shares | Exercise Price | |||||||
| Options outstanding at August 31, 2012 | 2,778,508 | $ | 7.92 | |||||
| Options granted | 315,064 | 3.63 | ||||||
| Options exercised | (23,832 | ) | 2.36 | |||||
| Options forfeited | (278,184 | ) | 7.87 | |||||
| Options outstanding at August 31, 2013 | 2,791,556 | 7.49 | ||||||
| Options granted | 784,037 | 1.27 | ||||||
| Options forfeited | (402,645 | ) | 8.45 | |||||
| Options outstanding at August 31, 2014 | 3,172,948 | $ | 5.83 | |||||
| F-22 |
The following table summarizes information about stock options outstanding and exercisable at August 31, 2014:
| Remaining | Weighted- | Number | Remaining | Weighted- | ||||||||||||||||||||
| Range of | Number | Contractual | Average | Vested and | Contractual | Average | ||||||||||||||||||
| Exercise Price | Outstanding | Life | Exercise Price | Exercisable | Life | Exercise Price | ||||||||||||||||||
| $0.63 - $1.52 | 783,956 | 9.15 | $ | 1.27 | 333,449 | 9.09 | $ | 1.30 | ||||||||||||||||
| $1.80 - $1.95 | 412,999 | 1.27 | $ | 1.95 | 412,999 | 1.27 | $ | 1.95 | ||||||||||||||||
| $3.28 - $5.71 | 484,824 | 4.75 | $ | 3.68 | 330,808 | 3.02 | $ | 3.80 | ||||||||||||||||
| $6.66 - $8.97 | 854,076 | 4.68 | $ | 6.87 | 822,896 | 4.59 | $ | 6.86 | ||||||||||||||||
| $12.10 - $17.16 | 637,093 | 7.27 | $ | 14.16 | 370,244 | 7.24 | $ | 14.26 | ||||||||||||||||
| 3,172,948 | 2,270,396 | |||||||||||||||||||||||
No tax benefits were recorded on compensation costs recognized during the years ended August 31, 2014 and 2013. The tax benefit realized from options exercised during the year ended August 31, 2012 was $32. As of August 31, 2014 and 2013, there were $2,993 and $5,389 of total unrecognized compensation cost related to stock options respectively. That cost is expected to be recognized over a weighted average 2.14 years. The Company’s policy is to issue new shares for options exercised.
Restricted Stock Activity
The following summarizes the restricted stock transactions under the Equity Plans for the periods presented:
| Weighted | ||||||||
| Average | ||||||||
| Grant Date | ||||||||
| Shares | Fair Value | |||||||
| Restricted stock outstanding and unvested at August 31, 2012 | 40,600 | $ | 12.10 | |||||
| Restricted stock granted | 288,375 | 5.24 | ||||||
| Restricted stock vested | (19,100 | ) | 11.42 | |||||
| Restricted stock forfeited | (19,175 | ) | 8.81 | |||||
| Restricted stock outstanding and unvested at August 31, 2013 | 290,700 | 5.55 | ||||||
| Restricted stock granted | 328,260 | 1.31 | ||||||
| Restricted stock vested | (263,023 | ) | 2.12 | |||||
| Restricted stock forfeited | (53,186 | ) | 4.75 | |||||
| Restricted stock outstanding and unvested at August 31, 2014 | 302,751 | $ | 4.07 | |||||
As of August 31, 2014, there was $458 of total unrecognized compensation cost related to restricted stock awards. That cost is expected to be recognized over a weighted average of 1.13 years.
| F-23 |
Stock Activity
During the fiscal year 2014, the Company granted 18,300 shares of common stock under the 2011 Plan with a fair market value of $0.91 per share. The Company recorded $16.7 of expense related to this stock grant. During fiscal year 2013, the Company granted 60,000 shares of common stock under the 2011 Plan with a fair market value of $3.33 per share. The Company recorded $200 of expense in the year ended August 31, 2013 related to this stock grant
(8) Convertible Notes and Warrant Modification
In August 2011, the Company completed the sale of $11,425 aggregate principal amount of the Convertible Notes to nine existing investors in the Company in a private placement. The Convertible Notes were convertible, subject to the terms and conditions set forth therein, into shares of the Company’s common stock upon the consummation of a qualified initial public offering of the Company’s common stock at a price per share equal to 20% discount from the public offering price, or $10.40. Purchasers of the Convertible Notes included holders of more than 5% of the Company’s outstanding capital stock and affiliates of certain of the Company’s directors. Additionally, so long as any investors who held warrants to purchase shares of the Company’s common stock issued in connection with certain of the Company’s preferred stock financings purchased at least their respective full pro rata portion of the Convertible Notes being offered, the Company agreed to amend the termination provisions of such investors existing warrants such that the warrants no longer expired upon the IPO. In January 2012, the Company amended the Convertible Notes such that the notes would have automatically converted into shares of convertible preferred stock had the initial public offering not consummated by June 30, 2012.
In connection with the offering of the Convertible Notes, warrants to purchase 539,972 shares of common stock issued in connection with the Company’s Series F Preferred Stock offering, or the Modified F warrants and all of the warrants issued in connection with the Company’s Series G Preferred Stock offering were amended such that they would not expire upon the consummation of a qualified initial public offering. Warrants to purchase 229,257 shares of common stock issued in connection with the Series F Preferred Stock offering, or the Non-Modified F warrants were not amended and remain outstanding.
The Company calculated the fair value of the modified warrants immediately prior to and subsequent to the modification and determined that the cumulative incremental increase in the fair value of these liability classified warrants associated with this modification to be $9,633. Accordingly, the Company recorded the change in value to other income (expense) in August 2011.
Until such time as the conversion features were triggered, the Company accounted for the Convertible Notes and various embedded derivatives in accordance with ASC 825-10, the Fair Value Option for Financial Liabilities, whereby the Company initially and subsequently measured this financial instrument in its entirety at fair value, with the changes in fair value recorded each quarterly reporting period in other income (expense).
The Company obtained the assistance of a third-party valuation firm in estimating that the fair market value of the Convertible Notes as if August 31, 2011 was $13,630. The Company estimated the fair value of the Convertible Notes upon the closing of the IPO to be $14,282. Accordingly, the change in fair value was recorded in other income (expense).
Upon closing of the IPO, the Convertible Notes were revalued and converted into 1,098,575 shares of common stock (see Note (9))
| F-24 |
(9) Stockholders’ Equity
Initial Public Offering
Upon closing of the IPO (see Note (1)):
| • | the Company’s outstanding shares of convertible preferred stock were automatically converted into 15,353,221 shares of common stock; | |
| • | the Convertible Notes were revalued and converted into 1,098,575 shares of common stock; and | |
| • | the outstanding convertible preferred stock warrants were revalued and automatically converted into warrants to purchase a total of 20,511 shares of common stock. |
Common Stock
On March 7, 2014, the Company held its 2014 Annual Meeting of Stockholders (Annual Meeting). At the Annual Meeting, the stockholders approved an amendment to the Company’s Amended and Restated Certificate of Incorporation which decreased the total number of shares of common stock of the Company from 490,000,000 to 240,000,000. Holders of the Company’s common stock are entitled to dividends as and when declared by the Board of Directors, subject to rights and holders of all classes of stock outstanding having priority rights to dividends. There have been no dividends declared to date. Each share of common stock is entitled to one vote.
Preferred Stock
Pursuant to the Company’s amended and restated certificate of incorporation, the Company is authorized to issue 10,000,000 shares of preferred stock. The Board of Directors has the authority, without action by the Company’s stockholders, to designate and issue shares of preferred stock in one or more series and to fix the rights, preferences, privileges and restrictions thereof.
Common and Preferred Stock Warrants Financing
Warrants issued in connection with Series F Convertible Preferred Stock Financing
In connection with the issuance of the Series F Convertible Preferred Stock in September 2007, the Company issued warrants to purchase 769,229 shares of common stock at an exercise price of $19.50 per share. The warrants are immediately exercisable.
As discussed in Note (1), the common stock warrants issued to the holders of Series F Convertible Preferred Stock were reported as a liability at fair value as of each balance sheet date. Upon closing of the IPO, the common stock warrants no longer met the requirements for liability classification. The warrants were revalued as of the closing date and reclassified to additional paid-in capital.
Upon closing of the IPO, the Company estimated the fair value of certain warrants (Non-Modified F warrants and Modified F warrants) to be $6,301 based on a risk free rate of 0.40%, expected volatility of 89%, expected term of 3.5 years and 0% dividend yield.
Warrants issued in connection with Series G Convertible Preferred Stock Financing
In connection with the issuance of the Series G Convertible Preferred Stock in June 2010, the Company issued warrants to purchase 1,025,640 shares of common stock at an exercise price of $19.50 per share. The warrants are immediately exercisable.
| F-25 |
As discussed in Note (1), the common stock warrants issued to the holders of Series G Convertible Preferred Stock were reported as a liability at fair value as of each balance sheet date. Upon closing of the IPO, the common stock warrants no longer met the requirements for liability classification. The warrants were revalued as of the closing date and reclassified to additional paid-in capital.
Upon closing of the IPO, the Company estimated the fair value of these warrants to be $10,633 based on a risk free rate of 1.64%, expected volatility of 73%, expected term of 8.3 years and 0% dividend yield.
Warrants issued in connection with Borrowing and Loan Agreements
In July 2004, in connection with a borrowing agreement (Borrowing Agreement) entered into with the Bank, the Company issued the Bank warrants to purchase 18,461 shares of the Company’s Series E Convertible Preferred Stock. Upon closing of the IPO, these preferred stock warrants were converted into warrants to purchase 6,153 shares of common stock at $19.50 per share.
In February 2010, in connection with the Loan Agreement (see Note (6)), the Company issued the Bank warrants to purchase 43,076 shares of the Company’s Series F Convertible Preferred Stock. Upon closing of the IPO, these preferred stock warrants were converted into warrants to purchase 14,358 shares of common stock at $19.50 per share.
As discussed in Note (1), the preferred stock warrants issued in connection with the Borrowing Agreement and the Loan Agreement were reported as a liability at fair value as of each balance sheet date. Upon closing of the IPO, these preferred stock warrants no longer met the requirements for liability classification. These preferred stock warrants were revalued as of the closing date and reclassified to additional paid-in capital.
Upon closing of the IPO, the Company estimated the fair value of the Series E and F preferred stock warrants to be $68 and $158, respectively, based on a risk-free interest rate of 1.35%, volatility of 81%, expected term of 7.96 — 8.01 years, and 0% dividend yield.
Warrants issued in connection with Noble Agreement
In May 2006, the Company entered into a collaboration agreement with The Samuel Roberts Noble Foundation, Inc. (Noble) (Noble Agreement) to establish a research program (see Note (13)). In connection with this collaboration, the Company granted Noble a warrant to purchase 133,333 shares of the Company’s common stock for an exercise price of $30.00 per share. The original terms were as follows: the warrant vests in equal installments of 33,333 shares on May 19, 2009, May 19, 2011, May 19, 2013, and May 19, 2015, respectively, and shall remain exercisable for a period of two years from the respective vesting dates. These warrants are accounted for at fair value and remeasured until vested. The fair value, including the resulting change in value as a result of remeasurement is being recognized as research and development expense. The inception to date expense recognized with respect to this warrant totals $624 as of August 31, 2014. At August 31, 2014, 99,999 warrants had vested under this arrangement. The fair value of the warrants not yet vested at August 31, 2014 was $0 using a risk-free rate of 0.94% based on the respective exercise periods of each installment, expected volatility of 69.4%, expected term of 2.72 years based on the respective exercise periods of each installment, which is also the remaining contractual term, and 0% dividend yield.
In June 2011, the Company and Noble agreed to modify the warrants issued to Noble as follows: the warrant vests in equal installments of 33,333 shares on May 19, 2013 and May 19, 2015, respectively and shall remain exercisable until the earliest of a period of five years from the respective vesting dates and May 18, 2017.
| F-26 |
Warrants issued in connection with TAMU Agreement
In August 2007, the Company entered into a sponsored research and intellectual property rights agreement with The Texas A&M University System (TAMU) to establish a research program (see Note (13)). In connection with this collaboration, the Company granted TAMU a warrant to purchase 66,666 shares of the Company’s common stock for an exercise price of $30.00 per share. The warrant vests based on certain research and commercialization milestones being met and shall remain exercisable until August 28, 2017. This warrant is accounted for at fair value and remeasured until the vesting targets are met. The fair value, including the resulting change in value as a result of remeasurement is being recognized as research and development expense. The inception to date expense recognized with respect to this warrant totals $0 as of August 31, 2014. The fair value of the warrants at August 31, 2014 was $0, using a risk-free rate of 0.94%, expected volatility of 69.4%, expected term of 2.99 years and 0% dividend yield. No warrants had vested under this arrangement as of August 31, 2014.
In December 2011, pursuant to an Amended and Restated Intellectual Property Rights Agreement (IP Rights Agreement) (see Note (13)), the Company issued warrants to TAMU to purchase 66,666 shares of common stock at an exercise price of $14.30 per share. The warrants expire on September 24, 2026 and, subject to certain conditions, vest in equal installments on the fifth, tenth and fifteenth anniversary of the IP Rights Agreement. The inception to date expense recognized with respect to this warrant totals $11.0 as of August 31, 2014. The fair value of the warrants at August 31, 2014 was $20.4, using a risk-free rate of 2.35%, expected volatility of 86.3%, expected term of 12.06 years and 0% dividend yield. No warrants had vested under this arrangement as of August 31, 2014.
Warrants issued in connection with March 10, 2014 registered public offering
On March 10, 2014 the Company issued warrants to purchase an aggregate of 480,000 shares of common stock to certain affiliated designees of the underwriter as part of the underwriter’s compensation related to the registered public offering. The warrants are exercisable at any time and from time to time, in whole or in part, beginning on March 4, 2015 and expire on March 4, 2019. The exercise price is $1.50 per share of common stock. The fair value of these warrants upon issuance was $305 using a risk free rate of 1.64%, expected volatility 84.2%, expected term of 5 years and 0% dividend yield and was treated as an issuance cost of the common stock.
| F-27 |
(10) Income Taxes
Deferred tax benefits associated with deferred tax assets are offset by a corresponding valuation allowance. Deferred income taxes reflect the net tax effects of temporary differences between the carrying amounts of assets and liabilities for financial reporting purposes and amounts used for income tax purposes.
Income tax expense attributable to loss before income taxes consisted of the following:
| Current | Deferred | Total | ||||||||||
| Year ended August 31, 2014 | ||||||||||||
| U.S. federal | $ | — | $ | — | $ | — | ||||||
| State and local | 1 | — | 1 | |||||||||
| $ | 1 | $ | — | $ | 1 | |||||||
| Current | Deferred | Total | ||||||||||
| Year ended August 31, 2013 | ||||||||||||
| U.S. federal | $ | — | $ | — | $ | — | ||||||
| State and local | 1 | — | 1 | |||||||||
| $ | 1 | $ | — | $ | 1 | |||||||
| Current | Deferred | Total | ||||||||||
| Year ended August 31, 2012 | ||||||||||||
| U.S. federal | $ | — | $ | — | $ | — | ||||||
| State and local | 3 | — | 3 | |||||||||
| $ | 3 | $ | — | $ | 3 | |||||||
Income tax expense differs from the amount computed by applying the federal corporate income tax rate of 34% to the loss before income taxes due to the following:
| Year Ended | Year Ended | Year Ended | ||||||||||
| August 31, | August 31, | August 31, | ||||||||||
| 2014 | 2013 | 2012 | ||||||||||
| Computed “expected” tax expense | $ | (9,969 | ) | $ | (11,054 | ) | $ | (9,999 | ) | |||
| Increase (reduction) in income taxes resulting from: | ||||||||||||
| Stock-based compensation | 774 | 876 | 636 | |||||||||
| State and local income taxes, net of federal income tax benefit | 1 | 1 | 2 | |||||||||
| Foreign rate differential | — | — | 1,258 | |||||||||
| Warrants modification and changes in fair value | — | — | 29 | |||||||||
| Other | 12 | 17 | 182 | |||||||||
| Change in valuation allowance | 9,183 | 10,161 | 7,895 | |||||||||
| Income tax expense | $ | 1 | $ | 1 | $ | 3 | ||||||
| F-28 |
The following table summarizes the tax effects of temporary differences that give rise to significant portions of the deferred tax assets and liabilities at each period end:
| August 31, | August 31, | |||||||
| 2014 | 2013 | |||||||
| Deferred tax assets: | ||||||||
| Accrued liabilities | $ | 279 | $ | 163 | ||||
| Other assets | 169 | 77 | ||||||
| Inventory capitalization | 446 | 265 | ||||||
| Deferred revenue | 139 | - | ||||||
| Total current deferred tax assets | 1,031 | 505 | ||||||
| Noncurrent assets: | ||||||||
| Depreciation | 2,310 | 2,150 | ||||||
| Inventory reserves | 2,689 | 2,427 | ||||||
| Deferred rent | 29 | 36 | ||||||
| Other assets | 859 | 568 | ||||||
| Net operating loss carryforward | 101,485 | 88,791 | ||||||
| Federal and state tax credit carryforward | 8,919 | 8,919 | ||||||
| Total noncurrent deferred tax assets | 116,291 | 102,891 | ||||||
| Total deferred tax assets | 117,323 | 103,396 | ||||||
| Less valuation allowance | (117,323 | ) | (103,396 | ) | ||||
| Net deferred tax assets | $ | — | $ | — | ||||
As of August 31, 2014, the Company had $247,200 of federal, $174,125 of state and $24,307 of foreign net operating loss (NOL) carryforwards available to offset future taxable income, if any, which expire in varying amounts from 2018 through 2034 for federal tax purposes and from 2015 through 2034 for state tax purposes if unused. The carryforward period for the foreign NOL is indefinite. The excess tax benefits associated with the exercise of non-qualified stock options, restricted stock grants, and disqualifying dispositions of incentive stock option stock, for 2014 and 2013 in the amount of $2,458 and $2,458, respectively, did not reduce the current income taxes payable and, accordingly, are not included in the deferred tax asset relating to NOL carryforwards, but are included with the federal and state NOL carryforwards. In addition, the Company has alternative minimum tax (AMT) for state income tax purposes of approximately $17 and research and development tax carryforwards for federal income tax purposes of approximately $8,907, which are available to offset future tax liabilities, if any, through 2029.
In accordance with Internal Revenue Code (IRC) Sections 382 and 383, the annual utilization of net operating loss carryforwards and credits is limited if a change in control occurs, including a change resulting from an initial public offering. The Company has not completed a Section 382 analysis to determine if a change in ownership has occurred. Until such analysis is completed, there are no assurances that the existing net operating loss carryforwards or credits are not subject to significant limitation.
In assessing the realizability of deferred tax assets, management considers whether it is more likely than not that some portion or all of the deferred tax assets will not be realized. The ultimate realization of deferred tax assets is dependent upon the generation of future taxable income during the periods in which those temporary differences become deductible. Management considers the scheduled reversal of deferred tax liabilities, projected future taxable income, and tax planning strategies in making this assessment. Based upon the historical taxable income (loss) and projections for future taxable income (loss) over the periods in which the deferred tax assets are deductible, management believes it is more likely that the Company will not realize the benefits of these deductible differences. Accordingly, the Company has established a full valuation allowance of $117,323 and $103,396 for the years ended August 31, 2014 and 2013, respectively.
| F-29 |
(11) 401(k) Benefit Plan
The Company has a 401(k) profit sharing plan (the Plan) which covers substantially all employees of the Company. Plan participants may make voluntary contributions of up to 60% of their earnings up to the statutory limit. The Company will match 50% of each employee contribution up to a maximum of 4% of the employee’s salary in matching funds per pay period. The matching contribution vests over a three-year service period; 25% vests immediately and an additional 25% vests for each year of service to the Company thereafter over the next three years. The Company recorded expense of $207, $288 and $297 in 2014, 2013 and 2012, respectively. The Company made no discretionary contributions in any year.
(12) Commitments and Contingencies
The Company leases certain of its facilities and equipment under various noncancelable operating leases expiring through 2023. The leases on the facilities contains provisions for future rent increases. The Company records monthly rent expense equal to the total of the payments due over the lease term, divided by the number of months of the lease term. The difference between rent expense recorded and the amount paid is credited or charged to deferred rent, which is reflected as a separate line item in the accompanying consolidated balance sheets as of August 31, 2014 and 2013.
In connection with one of its facilities leases, the Company received a reimbursement for leasehold improvements of $270. This reimbursement is a lease incentive which has been recognized as a liability in deferred rent and is being amortized to rent expense on a straight-line basis over the lease term. Total rental expense recognized during each period was $440, $500 and $519 for 2014, 2013 and 2012, respectively.
Future minimum payments under noncancelable operating leases as of August 31, 2014 are as follows:
| Operating | ||||
| leases | ||||
| 2015 | $ | 689 | ||
| 2016 | 674 | |||
| 2017 | 616 | |||
| 2018 | 560 | |||
| 2019 | 624 | |||
| Total minimum lease payments | $ | 3,163 | ||
(13) Research Collaboration Agreements
The Company has a number of research agreements with academic collaborators, including among others, TAMU, Noble, and the Institute of Crop Sciences of the Chinese Academy of Agricultural Sciences. In connection with these agreements, the Company receives certain exclusive options or licensing rights to technology and intellectual property developed under these agreements. The Company expenses amounts under these agreements to research and development expense in the period in which the services are rendered. The Company also licenses technology from third parties. Initial payments under these license agreements are capitalized and expensed on a straight-line basis over the license term.
Noble Agreement
In May 2006, the Company entered into a collaboration agreement with Noble to establish a research program. Under the Noble Agreement, the Company agreed to fund certain research activities undertaken by Noble in an amount up to $3,800 through July 31, 2012 and granted Noble a warrant to purchase 133,333 shares of the Company’s common stock for an exercise price of $30.00 per share (see Note (9)). Additional projects may be added under the agreement, if agreed to by both parties.
Under the collaboration agreement, in August 2012 the Company agreed to fund certain research activities undertaken by Noble through July 31, 2013 and 2014 of $82.7 and $85.3 per year, respectively.
| F-30 |
TAMU Agreement
In August 2007, the Company entered into a Sponsored Research and Intellectual Property Rights agreement with TAMU to establish a research program. Under the agreement, the Company agreed to fund certain research activities undertaken by TAMU in an amount up to $5,100 through 2012 and granted TAMU a warrant to purchase 66,666 shares of the Company’s common stock for an exercise price of $30.00 per share (see Note (9)).
On September 24, 2011, the Company entered into an Amended and Restated Sponsored Research Agreement and an Amended and Restated Intellectual Property Rights Agreement (the “IP Rights Agreement”) with TAMU which both expire on September 23, 2026. The specific research projects and budgets undertaken pursuant to such agreement will be determined by an Executive Committee comprised of two members from each of TAMU and the Company as set forth in the Amended and Restated Sponsored Research Agreement. In December 2011, pursuant to the IP Rights Agreement, the Company issued warrants to TAMU to purchase 66,666 shares of common stock at an exercise price of $14.30 per share (see Note (9)).
At August 31, 2014, the future minimum payments under the Company’s research collaboration agreements are as follows:
| 2015 | $ | 863 | ||
| 2016 | 694 | |||
| 2017 | 125 | |||
| $ | 1,682 |
(14) Selected Quarterly Financial Information (unaudited)
The following is a summary of the unaudited quarterly results of operations for the years ended August 31, 2014 and 2013
| November 30, | February 29, | May 31, | August 31, | |||||||||||||
| 2013 | 2014 | 2014 | 2014 | |||||||||||||
| 2014: | ||||||||||||||||
| Total revenues | $ | 763 | $ | 495 | $ | 806 | $ | 340 | ||||||||
| Cost of product sales | 1,309 | 556 | 575 | 581 | ||||||||||||
| Loss from operations | (8,220 | ) | (7,216 | ) | (7,715 | ) | (6,106 | ) | ||||||||
| Net loss | (8,205 | ) | (7,225 | ) | (7,727 | ) | (6,164 | ) | ||||||||
| Basic and diluted net loss per share attributable to common stockholders | (0.33 | ) | (0.29 | ) | (0.17 | ) | (0.13 | ) | ||||||||
| November 30, | February 29, | May 31, | August 31, | |||||||||||||
| 2012 | 2013 | 2013 | 2013 | |||||||||||||
| 2013: | ||||||||||||||||
| Total revenues | $ | 1,966 | $ | 1,026 | $ | 1,355 | $ | 898 | ||||||||
| Cost of product sales | 700 | 2,280 | 2,134 | 1,132 | ||||||||||||
| Loss from operations | (6,921 | ) | (9,014 | ) | (9,317 | ) | (7,339 | ) | ||||||||
| Net loss | (6,894 | ) | (8,966 | ) | (9,323 | ) | (7,331 | ) | ||||||||
| Basic and diluted net loss per share attributable to common stockholders | (0.28 | ) | (0.36 | ) | (0.38 | ) | (0.29 | ) | ||||||||
| F-31 |
Quarterly and year-to-date computations of per share amounts are made independently. Therefore, the sum of per share amounts for the quarters may not agree with per share amounts for the year shown elsewhere in the Annual Report on Form 10-K.
| F-32 |
| Where Located | ||||||||||
| Filed | ||||||||||
| Exhibit No. | Description of Exhibit | Form | Exhibit No. | Filing Date | Herewith | |||||
| 1.1 |
Underwriting Agreement, dated March 4, 2014, between Ceres, Inc. and Aegis Capital Corp. (incorporated by reference to Exhibit 1.1 to the Company's Current Report on Form 8-K filed with the SEC on March 10, 2014).
|
8-K | 1.1 | 3/10/2014 | ||||||
| 3.1 | Amended and Restated Certificate of Incorporation of Ceres, Inc. | 10-Q | 3.1 | 4/12/2012 | ||||||
| 3.1.1 | Certificate of Amendment to Amended and Restated Certificate of Incorporation of Ceres, Inc. filed with the Secretary of State of the State of Delaware on March 11, 2014 and effective as of March 11, 2014. | 8-K | 3.1 | 3/11/2014 | ||||||
| 3.2 | Amended and Restated Bylaws of Ceres, Inc. | 10-Q | 3.2 | 4/12/2012 | ||||||
| 4.1 | Form of Ceres, Inc. Common Stock Certificate | S-1/A | 4.1 | 1/17/2012 | ||||||
| 4.2 | Warrant to Purchase Shares of Series E Preferred Stock issued to Silicon Valley Bank, dated August 16, 2004, as amended | S-1/A | 4.2 | 7/25/2011 | ||||||
| 4.2.1 | Amendment No. 2 to Warrant to Purchase Shares of Series E Preferred Stock issued to Silicon Valley Bank, dated August 16, 2004, as amended | 10-K | 4.2.1 | 11/20/2012 | ||||||
| 4.3 | Warrants to Purchase Shares of Series F Preferred Stock issued to Silicon Valley Bank, dated March 1, 2010 | S-1/A | 4.5 | 7/25/2011 | ||||||
| 4.3.1 | Amendment No. 1 to Warrant to Purchase Shares of Series F Preferred Stock issued to Silicon Valley Bank, dated March 1, 2010 (6,153.67 shares) | 10-K | 4.3.1 | 11/20/2012 | ||||||
| 4.3.2 | Amendment No. 1 to Warrant to Purchase Shares of Series F Preferred Stock issued to Silicon Valley Bank, dated March 1, 2010 (8,205 shares) | 10-K | 4.3.2 | 11/20/2012 | ||||||
| 4.4 | Warrant to Purchase Shares of Common Stock issued to The Samuel Roberts Noble Foundation, Inc., dated November 28, 2006, as amended | S-1/A | 4.3 | 9/16/2011 | ||||||
| 4.5 | Warrant to Purchase Shares of Common Stock issued to The Texas A&M University System, dated July 18, 2008, as amended | S-1/A | 4.4 | 7/25/2011 | ||||||
| E-1 |
| Where Located | ||||||||||
| Filed | ||||||||||
| Exhibit No. | Description of Exhibit | Form | Exhibit No. | Filing Date | Herewith | |||||
| 4.6 | Warrant to Purchase Shares of Common Stock issued to The Texas A&M University System, dated December 19, 2011 | S-1/A | 4.10 | 1/17/2012 | ||||||
| 4.7 | Amended and Restated Investors’ Rights Agreement, dated June 25, 2010, by and among Ceres, Inc. and the stockholders named therein | S-1 | 4.6 | 5/23/2011 | ||||||
| 4.8 | Form of Series F Original Warrant | 10-K | 4.8 | 11/20/2012 | ||||||
| 4.8.1 | Form of Series F Original Warrant, as amended | S-1/A | 4.7 | 8/23/2011 | ||||||
| 4.9 | Form of Series G Original Warrant, as amended | S-1/A | 4.8 | 8/23/2011 | ||||||
| 4.10 | Form of Convertible Note | S-1/A | 4.9 | 8/23/2011 | ||||||
| 4.10.1 | Amendment No. 1 to Convertible Notes, dated January 10, 2012 | S-1/A | 4.11 | 1/17/2012 | ||||||
| 4.11 | Common Stock Purchase Warrant Agreement, dated March 10, 2014, between Ceres, Inc. and certain affiliated designees of Aegis Capital Corp. | |||||||||
| 8-K | 4.1 | 3/10/2014 | ||||||||
| 10.1 | Ceres, Inc. 2000 Stock Option/Stock Issuance Plan, as amended | 8-K | 10.1 | 8/20/2012 | ||||||
| 10.2 | Form of Stock Option Agreement under the Ceres, Inc. 2000 Stock Option/Stock Issuance Plan | S-1/A | 10.2 | 7/25/2011 | ||||||
| 10.3 | Form of Stock Purchase Agreement under the Ceres, Inc. 2000 Stock Option/Stock Issuance Plan | S-1/A | 10.3 | 10/14/2011 | ||||||
| 10.4 | Ceres, Inc. 2010 Stock Option/Stock Issuance Plan | S-1/A | 10.4 | 5/23/2011 | ||||||
| 10.5 | Form of Stock Option Agreement under the Ceres, Inc. 2010 Stock Option/Stock Issuance Plan | S-1/A | 10.5 | 7/25/2011 | ||||||
| 10.6 | Form of Stock Purchase Agreement under the Ceres, Inc. 2010 Stock Option/Stock Issuance Plan | S-1/A | 10.6 | 9/16/2011 | ||||||
| 10.7 | Amended and Restated Ceres, Inc. 2011 Equity Incentive Plan | 8-K | 10.1 | 2/13/2013 | ||||||
| 10.8 | Ceres, Inc. Performance Incentive Plan | S-1/A | 10.31 | 10/14/2011 | ||||||
| 10.9 | Form of Stock Option Grant Notice and Option Award Agreement under the Amended and Restated Ceres, Inc. 2011 Equity Incentive Plan | S-1/A | 10.32 | 1/17/2012 |
| E-2 |
| Where Located | ||||||||||
| Filed | ||||||||||
| Exhibit No. | Description of Exhibit | Form | Exhibit No. | Filing Date | Herewith | |||||
| 10.10 | Form of Restricted Stock Grant Notice and Restricted Stock Award Agreement under the Amended and Restated Ceres, Inc. 2011 Equity Incentive Plan | 10-K | 10.10 | 11/20/2012 | ||||||
| 10.10.1 | Form of Stock Payment Grant Notice and Stock Payment Award Agreement under the Amended and Restated Ceres, Inc. 2011 Equity Incentive Plan | 10-K | 10.10.1 | 11/26/2013 | ||||||
| 10.11 | Form of Indemnification Agreement between Ceres, Inc. and its directors and officers | S-1/A | 10.36 | 1/25/2012 | ||||||
| 10.12 | Employment Agreement between Ceres, Inc. and Richard Hamilton, dated September 1, 2011 | S-1/A | 10.23 | 9/16/2011 | ||||||
| 10.13 | Employment Agreement between Ceres, Inc. and Paul Kuc, dated September 1, 2011 | S-1/A | 10.24 | 9/16/2011 | ||||||
| 10.14 | Employment Agreement between Ceres, Inc. and Michael Stephenson, dated September 1, 2011 | S-1/A | 10.25 | 9/16/2011 | ||||||
| 10.15 | Employment Agreement between Ceres, Inc. and Wilfriede van Assche, dated September 1, 2011 | S-1/A | 10.26 | 9/16/2011 | ||||||
| 10.16 | Exclusive Consultancy Agreement between Ceres, Inc. and Richard Flavell, dated October 11, 2011 | 10-K | 10.16 | 11/20/2012 | ||||||
| 10.17 | Exclusive Consulting Agreement between Ceres, Inc. and Robert Goldberg, dated June 19, 2013 | 10-K | 10.1 | 7/11/2013 | ||||||
| 10.18 | Agricultural Lease Agreement between John & Connie Giesenschlag and Ceres, Inc. dated April 1, 2008 | S-1/A | 10.9 | 7/25/2011 | ||||||
| 10.19 | Ground Lease Agreement between John & Connie Giesenschlag and Ceres, Inc. dated April 1, 2008 | S-1 | 10.10 | 5/23/2011 | ||||||
| †10.20 | Exclusive License Agreement between Cambridge University Technical Services, Ltd. and Ceres, Inc., dated November 1, 2001 | S-1/A | 10.11 | 10/14/2011 | ||||||
| †10.21 | Sponsored Research Agreement between The Texas Agricultural Experiment Station of The Texas A&M University System and Ceres, Inc., dated August 29, 2007, as amended | S-1/A | 10.12 | 1/17/2012 |
| E-3 |
| Where Located | ||||||||||
| Filed | ||||||||||
| Exhibit No. | Description of Exhibit | Form | Exhibit No. | Filing Date | Herewith | |||||
| †10.21.1 | Amended and Restated Sponsored Research Agreement between Texas AgriLife Research (f/k/a The Texas Agricultural Experiment Station of The Texas A&M University System) and Ceres, Inc., dated September 24, 2011 | S-1/A | 10.34 | 12/19/2011 | ||||||
| 10.22 | Intellectual Property Rights Agreement between The Texas Agricultural Experiment Station of The Texas A&M University System and Ceres, Inc., dated August 29, 2007 | S-1/A | 10.13 | 12/19/2011 | ||||||
| †10.22.1 | Amended and Restated Intellectual Property Rights Agreement between The Texas Agricultural Experiment Station of The Texas A&M University System and Ceres, Inc., dated September 24, 2011 | S-1/A | 10.35 | 12/29/2011 | ||||||
| †10.23 | Material Transfer and Evaluation Agreements between The Texas A&M University System and Ceres, Inc., dated April 23, 2008, as amended | S-1/A | 10.14 | 8/29/2011 | ||||||
| 10.23.1 | Amendment No. 2 to Material Transfer and Evaluation Agreement between The Texas A&M University System and Ceres, Inc., dated April 23, 2008 (MTA-001018) | 8-K | 10.1 | 1/10/2013 | ||||||
| 10.23.2 | Amendment No. 2 to Material Transfer and Evaluation Agreement between The Texas A&M University System and Ceres, Inc., dated April 23, 2008 (MTA-001019) | 8-K | 10.1 | 1/10/2013 | ||||||
| †10.24 | Line License Agreement between The Texas A&M University System and Ceres, Inc., dated October 16, 2009 | S-1/A | 10.15 | 10/14/2011 | ||||||
| †10.25 | Line License Agreement between Ceres, Inc. and The Texas A&M University System, dated July 12, 2011. | S-1/A | 10.30 | 8/29/2011 | ||||||
| †10.25.1 | Amendment No. 1 to Line License Agreement between Ceres, Inc. and The Texas A&M University System, dated July 12, 2011. | 10-K | 10.25.1 | 11/20/2012 | ||||||
| †10.26 | Master Research Agreement between The Samuel Roberts Noble Foundation, Inc. and Ceres, Inc., dated May 19, 2006 | S-1/A | 10.16 | 1/25/2012 | ||||||
| †10.26.1 | Schedule 7 to Master Research Agreement between The Samuel Roberts Noble Foundation, Inc. and Ceres, Inc., dated May 19, 2006 | 10-K | 10.26.1 | 11/20/2012 |
| E-4 |
| Where Located | ||||||||||
| Filed | ||||||||||
| Exhibit No. | Description of Exhibit | Form | Exhibit No. | Filing Date | Herewith | |||||
| †10.27 | Evaluation, Production and License Agreement between The Samuel Roberts Noble Foundation, Inc. and Ceres, Inc., dated May 19, 2006 | S-1/A | 10.17 | 10/14/2011 | ||||||
| †10.28 | License Agreement for NF/GA992 and NF/GA993 between The Samuel Roberts Noble Foundation, Inc. and Ceres, Inc., dated December 1, 2008 | S-1/A | 10.18 | 10/14/2011 | ||||||
| †10.29 | License Agreement for NF/GA002 between The Samuel Roberts Noble Foundation, Inc. and Ceres, Inc., dated September 1, 2009 | S-1/A | 10.19 | 10/14/2011 | ||||||
| †10.30 | Collaboration Agreement between the Institute of Biological, Environmental and Rural Sciences of Aberystwyth University and Ceres, Inc., dated April 1, 2007, as amended | S-1/A | 10.20 | 1/25/2012 | ||||||
| †10.30.1 | Amendment IV to the Schedule I to the Collaboration Agreement between the Institute of Biological, Environmental, and Rural Sciences of Aberystwyth University in Wales, U.K. and Ceres, Inc., dated April 1, 2007. | 10-Q | 10.1 | 7/12/2012 | ||||||
| †10.30.2 | Amendment V to the Schedule I to the Collaboration Agreement between the Institute of Biological, Environmental, and Rural Sciences of Aberystwyth University in Wales, U.K. and Ceres, Inc., dated April 1, 2007. | 10-K | 10.30.2 | 11/26/2013 | ||||||
| †10.31 | Collaboration Agreement between Institute of Crop Sciences of the Chinese Academy of Agricultural Sciences and Ceres, Inc., dated November 15, 2007, as amended | S-1/A | 10.21 | 12/19/2011 | ||||||
| 10.31.1 | Amendment III to the Collaboration Agreement between Institute of Crop Sciences of the Chinese Academy of Agricultural Sciences and Ceres, Inc., dated November 15, 2007, as amended | 10-Q | 10.1 | 7/12/2012 | ||||||
| 10.31.2 | Amendment IV to the Collaboration Agreement between Institute of Crop Sciences of the Chinese Academy of Agricultural Sciences and Ceres, Inc., dated November 15, 2007, as amended | 10-K | 10.31.2 | 11/20/2012 | ||||||
| †10.32 | Enabling Technology License Agreement between Ceres, Inc. and Monsanto Company, dated April 1, 2002 | S-1/A | 10.29 | 7/5/2011 |
| E-5 |
| Where Located | ||||||||||
| Filed | ||||||||||
| Exhibit No. | Description of Exhibit | Form | Exhibit No. | Filing Date | Herewith | |||||
| 10.33 | Convertible Note Purchase Agreement among Ceres, Inc. and the investors named therein, dated August 1, 2011 | S-1/A | 10.33 | 11/10/2012 | ||||||
| 21.1 | List of Subsidiaries | X | ||||||||
| 23.1 | Consent of KPMG LLP | X | ||||||||
| 24.1 | Power of Attorney (see signature page to this Annual Report on Form 10-K). | X | ||||||||
| *31.1 | Certification of Chief Executive Officer pursuant to Rules 13a-14(a) and 15d-14(a), of the Securities Exchange Act of 1934, as amended. | X | ||||||||
| *31.2 | Certification of Chief Financial Officer pursuant to Rules 13a-14(a) and 15d-14(a), of the Securities Exchange Act of 1934, as amended. | X | ||||||||
| *32.1 | Certification of Principal Executive Officer and Principal Financial Officer pursuant to Rule 13a-14(b) of the Securities Exchange Act of 1934, as amended, and 18 U.S.C. §1350. | X | ||||||||
| 101.INS | XBRL Instance Document | X | ||||||||
| 101.SCH | XBRL Taxonomy Extension Schema Document | X | ||||||||
| 101.CAL | XBRL Taxonomy Extension Calculation Linkbase Document | X | ||||||||
| 101.DEF | XBRL Taxonomy Extension Definition Linkbase Document | X | ||||||||
| 101.LAB | XBRL Taxonomy Extension Label Linkbase Document | X | ||||||||
| 101.PRE | XBRL Taxonomy Extension Presentation Linkbase Document | X |
| † | Certain provisions of this exhibit have been omitted pursuant to a request for confidential treatment. | |
| * | This certification is furnished herewith and shall not be deemed “filed” for purposes of Section 18 of the Securities Exchange Act of 1934, as amended. |
| E-6 |