Attached files
| file | filename |
|---|---|
| 8-K - 8-K - LSB INDUSTRIES INC | d823926d8k.htm |
 LSB Industries, Inc.
November 2014
NYSE: LXU
Exhibit 99.1 |
 2
Safe Harbor Statement
The information contained in the presentation materials contain
certain forward-looking statements. All these statements,
other than statements of historical fact, are forward-looking
statements. Statements that include the words
“expect,” “intend,” “plan,” “believe,” “project,” “anticipate,” “estimate” and similar
statements of the future or of a forward-looking nature identify
forward-looking statements, including but not limited to, all
statements about or in references to the Architectural Building Index,
Dodge Construction Green Outlook, or any McGraw Hill forecast,
any references to future natural gas costs, ammonia costs, grain or corn demand or production, construction
trends and demand, and the outlook for the chemical or climate
control business. The forward-looking statements include
but are not limited to the following statements: major investments to reduce costs
and increase facility reliability; positioned to benefit from strong
agricultural market and economic recovery; product balance
options; production capacity; impact of capital expansion projects;
estimated completion and start up dates for new chemical
facilities and their cost and production capacity; planned capital
spending; outlook for Chemical and Climate Control; turnaround
at Cherokee; future maintenance activities; Pryor facility reliability; Climate Control’s product sales; sales growth
Q4 2014 and 2015; LEAN impact; future outlook.
You should not rely on the forward-looking statements because
actual events or results may differ materially from those
indicated by these forward-looking statements as a result of a
number of important factors. We incorporate the risks and
uncertainties discussed under the headings “Risk Factors”
and “A Special Note Regarding Forward-looking Statements” in
our Form 10-K for the fiscal year ended December 31, 2013 and Form
10-Q’s for the periods ending March 31, 2014, June 30,
2014, and September 30, 2014, which contain a discussion of a variety of factors which could cause the future outcome
to differ materially from the forward-looking statements discussed
in this investor presentation. We undertake no duty to update
the information contained in this investor presentation.
The term EBITDA, as used in this presentation, is net income plus
interest expense, depreciation, amortization, income taxes, and
certain non-cash charges, unless otherwise described. EBITDA is not a measurement of financial performance under
GAAP and should not be considered as an alternative to GAAP
measurement. The reconciliation of GAAP and any EBITDA numbers
discussed in this investor presentation are included in the appendix of this presentation.
|
 3
Company Overview |
 Business Overview
4
Diversified industrial manufacturer of chemicals and
HVAC products sold into a wide range of end
markets
Founded in 1968 and headquartered in Oklahoma
City, OK; publicly traded (NYSE: LXU)
Chemical Business operates 4 production facilities
El Dorado Chemical Company (“EDC”) (Arkansas)
Cherokee Nitrogen LLC (Alabama)
Pryor Chemical Company (Oklahoma)
El Dorado Nitric LLC (“Baytown”) (Texas)
Climate Control Business operates 7 facilities located
in Oklahoma City (over 1 million square feet)
Financial Snapshot:
LTM 9/30/14 Net Sales of $700.3 million
LTM 9/30/14 Consolidated Adjusted EBITDA of
$154.0
million
Note: Excludes unallocated corporate expenses
Note (1): Includes insurance proceeds of $104.2 million
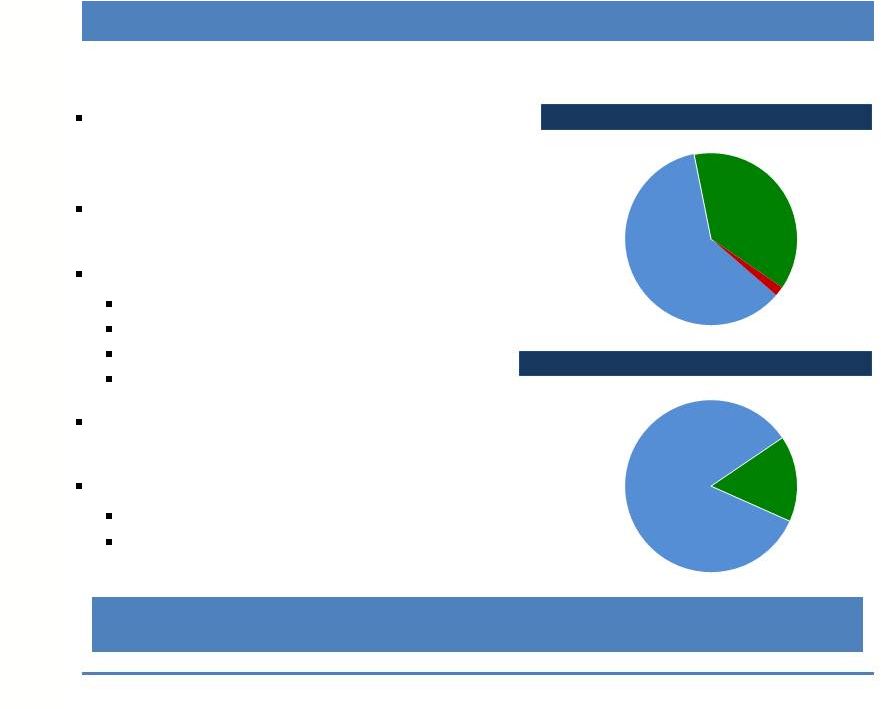
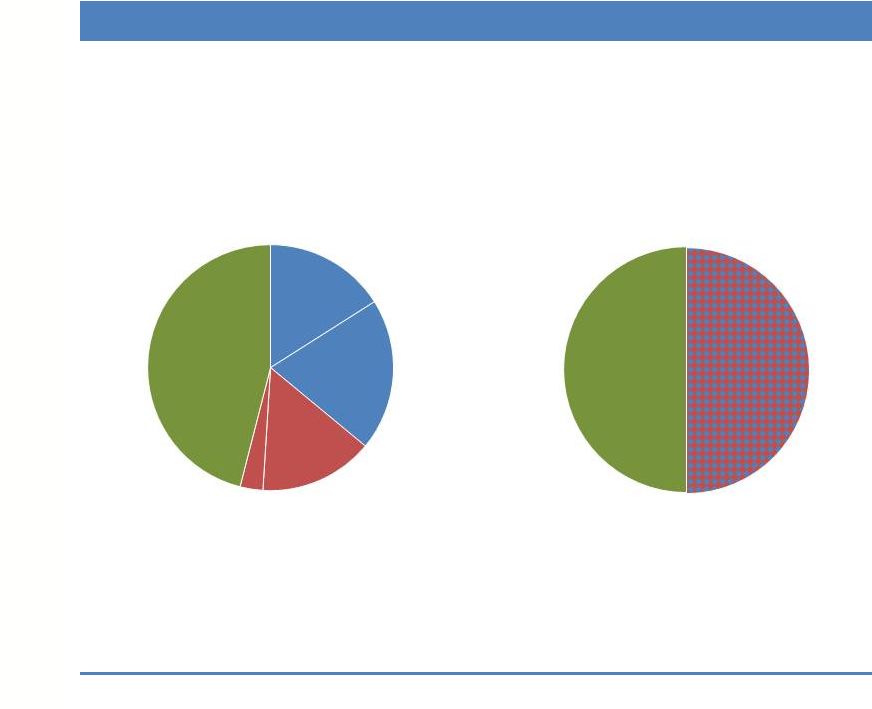
Climate
Control,
38%
Engineering
and other,
2%
Chemical
84%
Climate
Control,
16%
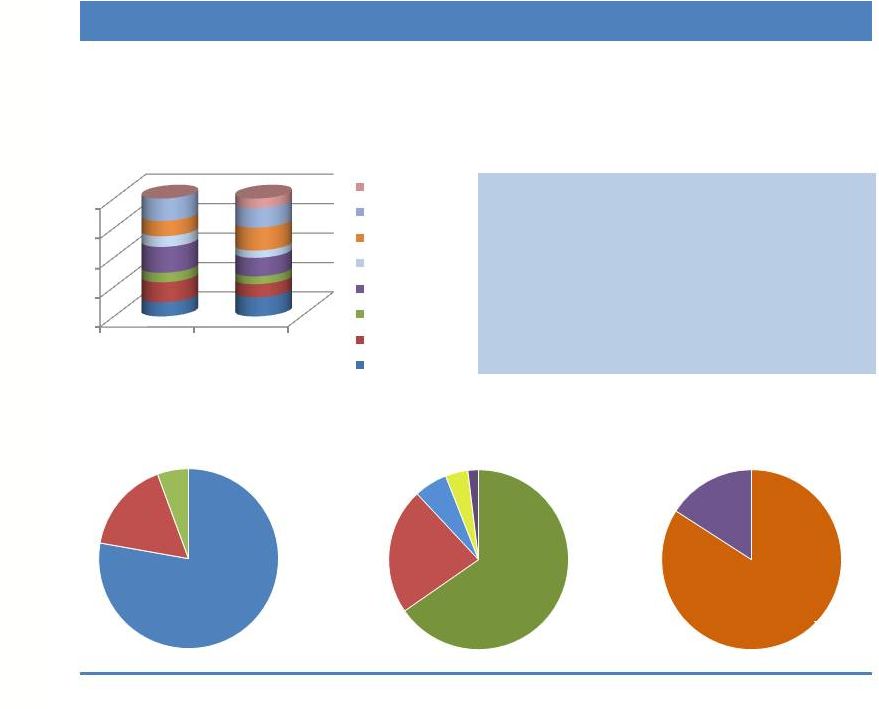
EBITDA by Business Segment – LTM 9/30/14
LSB operates a well-diversified business with differentiated market
positions across two distinct business segments (1)
Net Sales by Business Segment – LTM 9/30/14 Chemical
60% |
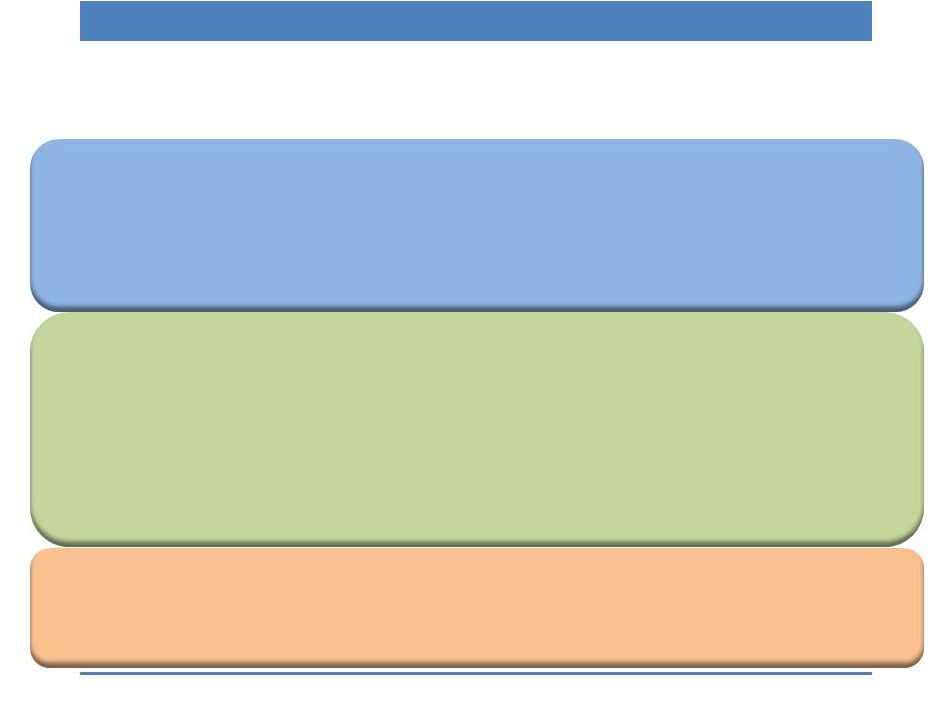
 LSB’s Two Core Businesses
5
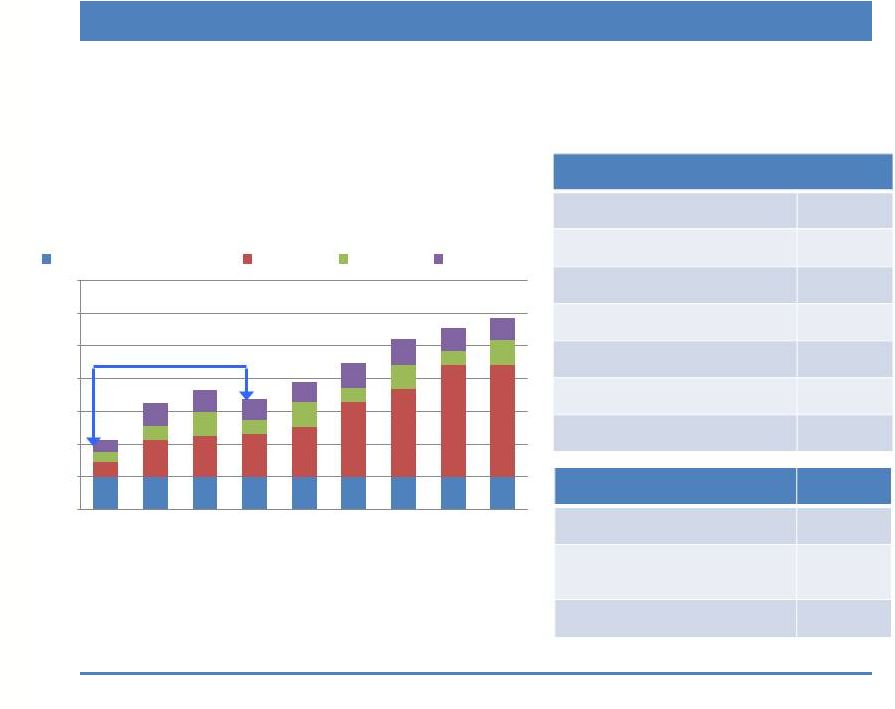
Consolidated Sales History
($’s in millions)
Chemical
Climate Control
Provides specialty HVAC products to
commercial, institutional and residential new
construction, renovation and replacement
markets, emphasis on green products
Market and technology leader for water
source and geothermal heat pumps, and
hydronic fan coils
Poised to benefit from the economic
recovery, long-term trend toward green
construction, and growth of emerging
products
28% Agriculture
22% Industrial
Acids & Ammonia
9%
Mining
2% Natural Gas
6% Single-family
Residential
31% Commercial
& Institutional
Buildings
2% Engineered
Products & Other
LTM 9/30/14 Sales Mix
492
586
749
532
610
805
759
679
700
$0
$300
$600
$900
2006
2007
2008
2009
2010
2011
2012
2013
LTM
9/30/14
Chemical
60%
($423 mil)
Climate
Control
38%
($264 mil)
Positioned to benefit from strong agricultural
market with favorable margins
Major investments underway to reduce costs
and increase facility reliability and capacity
Leading merchant marketer of nitric acid in
the U.S.
Provides nitrogen based agricultural, mining
and industrial chemicals to North American
market |
 6
Business Segment
Overview |
 Agro-
Chemical
(46% of sales)
Nitric Acid
Semi-conductor, nylon, polyurethane
intermediates, ammonium nitrate
CF Industries, PCS
Sulfuric Acid
Pulp and paper, alum, water treatment,
metals and vanadium processing
Cytec, Chemtrade Logistics
Anhydrous Ammonia
Power plant emissions abatement, water
treatment, refrigerants, metals processing
Various
Diesel Exhaust Fluid (DEF)
Exhaust
stream
additive
to
reduce
NO
x
emissions from diesel vehicles
Various
Market
Products Uses
Competitors
Industrial
Acids,
Ammonia &
DEF
(36% of sales)
Urea Ammonium Nitrate
Solutions (UAN)
Fertilizer for corn and other crops
CF Industries, PCS,
Koch Industries, Rentec,
Coffeeville Resources, imports
Ammonium Nitrate
-
high density prills (AN)
Primary nitrogen component in NPK
fertilizer blends
CF Industries, imports
Anhydrous Ammonia
High nitrogen content fertilizer primarily
used for corn
Various
Chemical Markets and Products
7
density prills (AN) and AN
solutions
Specialty emulsions for mining
applications
CF Industries, PCS,
Dyno Nobel America
Specialty E2 Ammonium
Nitrate
Surface mining, quarries, construction
Imports
Mining
Products
(15% of sales)
Ammonium Nitrate – low |
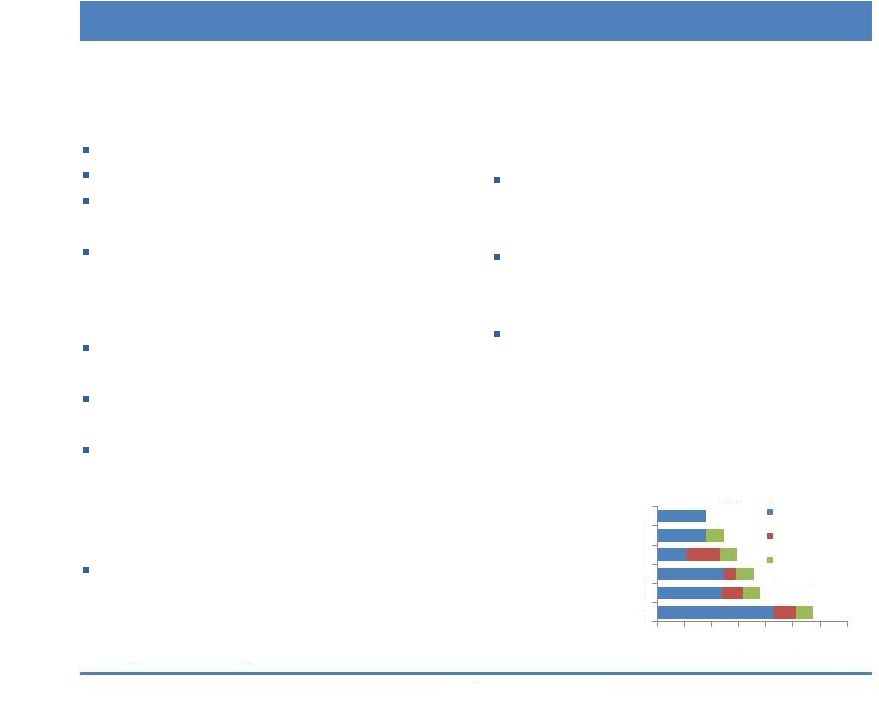 U.S. Midwest Delivered
Ammonia Cost Forecast
Source: Fertecon, Blue Johnson, PotashCorp (2014F)
Attractive Industry Fundamentals –
Agro Chemicals
8
World Situation:
North American Situation:
Result:
North America is Low
Cost Producer of
Nitrogen Fertilizers 0
100
200
300
400
500
600
700
Ukraine Port
Russia -
Yuzhnyy
Trinidad
Middle East
US Gulf Producers
US Midwest Producers
Cash Costs
Freight to US
Freight & Handling to US
Midwest
Natural gas is the primary feedstock for
anhydrous ammonia and all nitrogen
fertilizers.
Due to large shale gas reserves, U.S. has
relatively low natural gas prices vs. most
places worldwide.
Natural gas is expected to average
approximately $4.00 per MMBtu for the
remainder of 2014 and 2015.
Growing populations
Developing economies
Changing dietary habits (from grain to
meat)
Worldwide grain stock-to-use ratios at
10-year highs
World grain shortages positively impact
grain requirements in the U.S.
During last 3 years U.S. consumed more
grain than it produced.
U.S. grain stocks are at 10-year highs
leading to lower current and expected
corn prices.
High demand for grain expected in
2014 and 2015 despite low corn prices;
between 86 to 88 million acres of corn
expected to be planted in 2014/2015.
($US/ton) |
 LSB’s Agricultural Distribution
9
Multiple distribution channels
Diverse geographic coverage
Longstanding customer relationships
Direct rail linkage to corn belt
Southern Plains,
South Central,
Midwest & West
Pryor,
OK
Cherokee,
AL
El Dorado,
AR
UAN
UAN
AN
Koch
Transammonia, The
Andersons, CHS,
Koch, et.al.
Eastern
Corn Belt
Ag Centers -
30%
Distributors &
Dealers -
70%
Southern
Plains &
Corn Belt |
 Operational Dynamics
Diversification Strategy with Product Balance Options
10
Sales by Market
Cost-Plus Agreements vs.
Spot Market Sales
A key strategy is to
OPTIMIZE SALES MIX:
industrial vs. agricultural.
Approximately half our sales
are
NON-SEASONAL
and priced pursuant to
COST-PLUS
agreements.
LTM 9/30/14 Sales Mix
Bayer Nitric
Acid
16%
Industrial
Acids &
Ammonia
20%
Agricultural
46%
Mining
15%
Natural Gas
3%
Cost Plus
50%
Spot
Market
50% |
 Major Chemical Customers
11
Bayer |
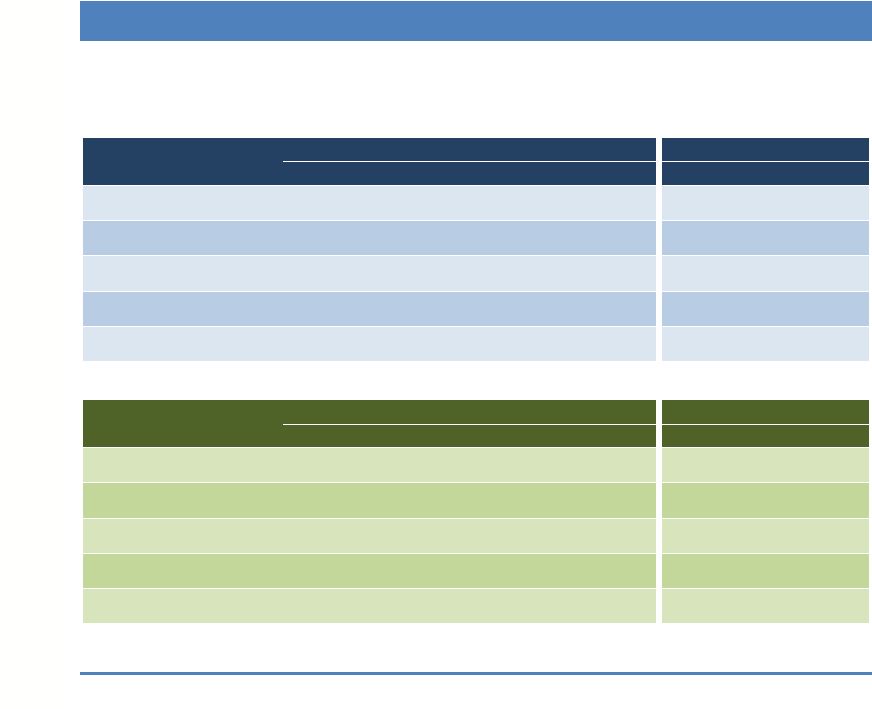
         Chemical Facilities
12
El Dorado Nitric LLC
El Dorado Chemical Co.
Cherokee Nitrogen LLC
Pryor Chemical Co.
El Dorado
Chemical
Company
Cherokee
Nitrogen LLC
Pryor
Chemical
Company
El Dorado
Nitric LLC
El Dorado, AR
Cherokee, AL
Pryor, OK
Baytown, TX
1983
1999
2000
2000
Kellogg
Kellogg
Pritchard
-
150
160
47
2
1,400
1,300
104
Bayer site
ammonia
natural gas
natural gas
ammonia
UAN
x
x
High Density AN
x
Ammonia
x
x
Urea
x
x
Nitric Acid
x
x
x
x
Concentrated
Nitric Acid
x
Sulfuric Acid
x
Mixed Acid
x
Carbon Dioxide
x
x
Ammonia
x
x
DEF
x
Low Density AN
x
AN solutions
x
x
truck, rail
truck, rail,
pipeline,
truck, rail
truck, pipeline
Year Acquired/Built
Ammonia Design
Transportation to Market
Facility
Location
Plant Area (acres)
Site Area (acres)
Feedstock |
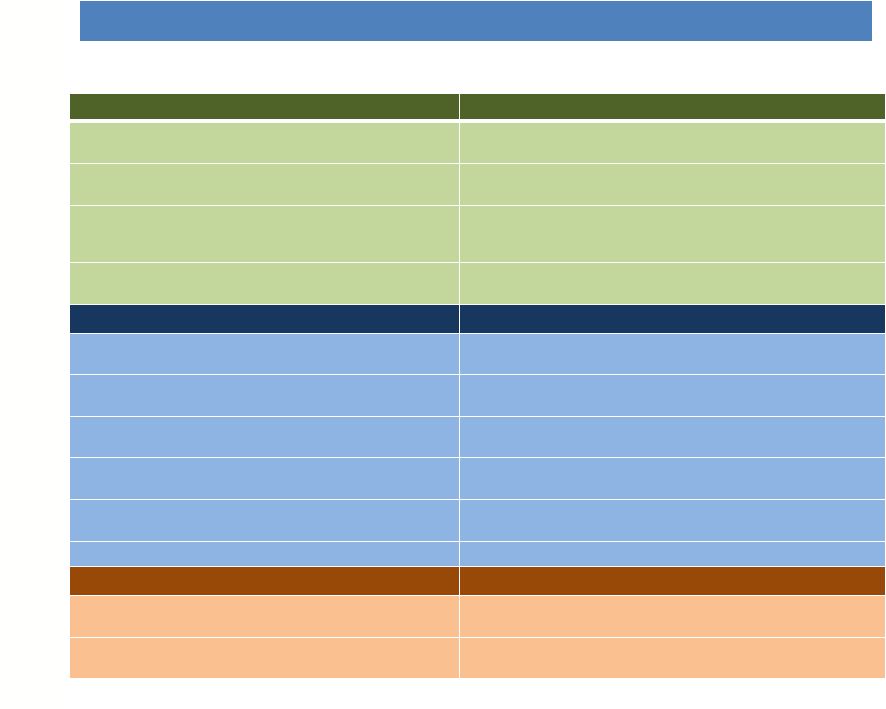
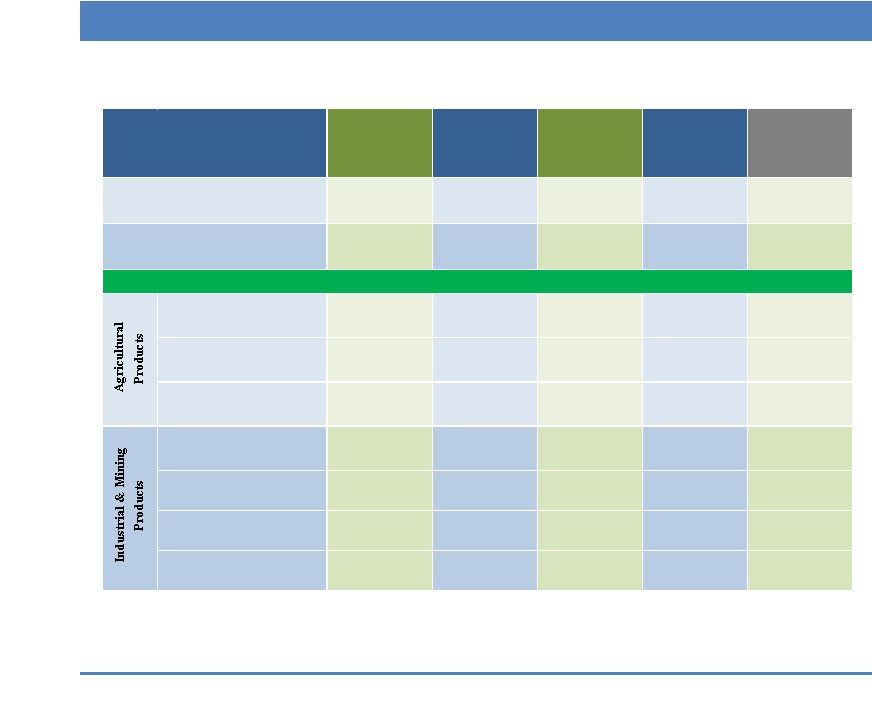 Annual Production Capacity of Products Available for Sale
(1,000’s of tons)
13
Red Font
= production capacities after the completion of the ammonia and
nitric acid expansion projects at El Dorado
Note (1): Represents amount of ammonia currently purchased
Note (2): Combined annual low density and high density AN production
capacity is limited to 330,000/TPY due to the loss in 2012 of 90,000/TPY of nitric acid production capacity
El Dorado
Chemical
Company
Cherokee
Nitrogen LLC
Pryor
Chemical
Company
El Dorado
Nitric LLC
Total
ammonia
natural gas
natural gas
ammonia
220
(1)
/375
175
215
-
610/765
UAN
215
300
515
High Density AN
(2)
110/300
110/300
Ammonia
125
30
85
115/240
Nitric Acid
45/200
30
410
485/640
DEF
15
15
Low Density AN
(2)
220
220
AN solutions
85
85
Feedstock
Ammonia Production Capacity
Products Available for Sale
Facility |
 •
Cost of $275 million -
$300 million
•
Reduces production costs significantly vs.
purchased ammonia
•
Enhanced product balance opportunities
•
Increases plant capacity:
-
Currently use ~220,000 tons per year (TPY)
-
Additional capacity ~155,000 TPY
-
Total capacity ~375,000 TPY
•
Estimated completion Q4
2015/start-up Q1
2016 14
Capital Expansion Projects
El Dorado Ammonia Plant
•
Cost of $125 million -
$130 million
•
Improves operating characteristics
•
Enhanced product balance
•
Replaces lost acid capacity and adds
additional capacity for a total
of
370,000 TPY
•
Estimated completion and start-up
Q2 2015
El Dorado Nitric Acid Plant and Concentrator
•
Engineering, Procurement and
Construction (EPC) contractor secured
•
Installation of above ground structures
underway
•
Inspection and refurbish/rebuild of
equipment in process
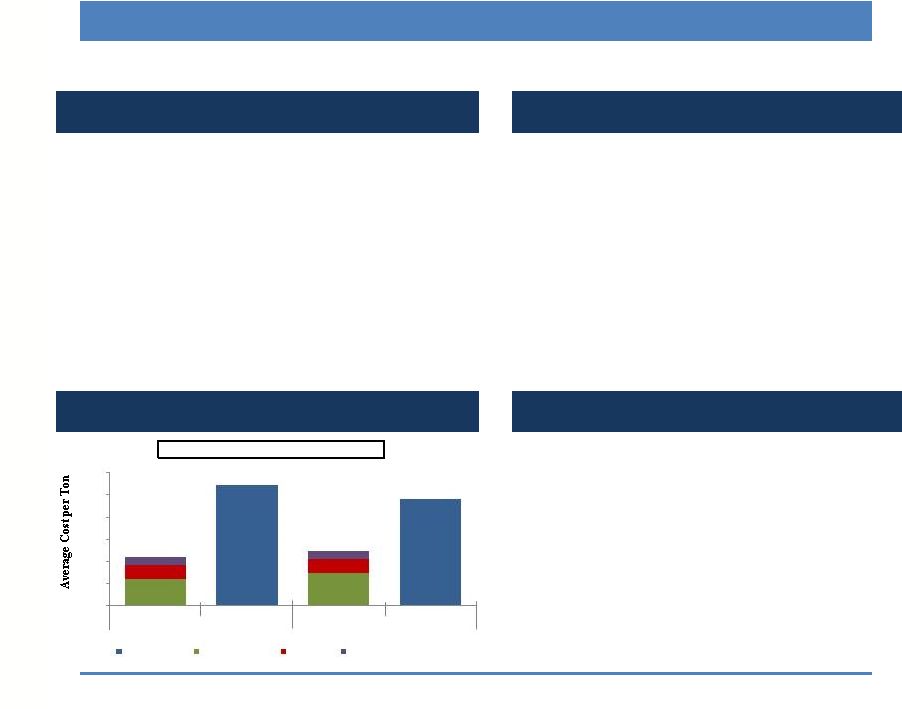
Construction Process Well Underway
$545
$482
$220
$250
0
100
200
300
400
500
600
Approximate Cost to
Produce
Weighted Average Cost to
Purchase
Approximate Cost to
Produce
Weighted Average Cost to
Purchase
Produce vs. Purchase Spread at El Dorado
Delivered Cost
Natural Gas Cost
Fixed Cost
Other Variable Cost
2014 –
9 months Average
2013 Average
Ammonia Production Offers Attractive Economics
|
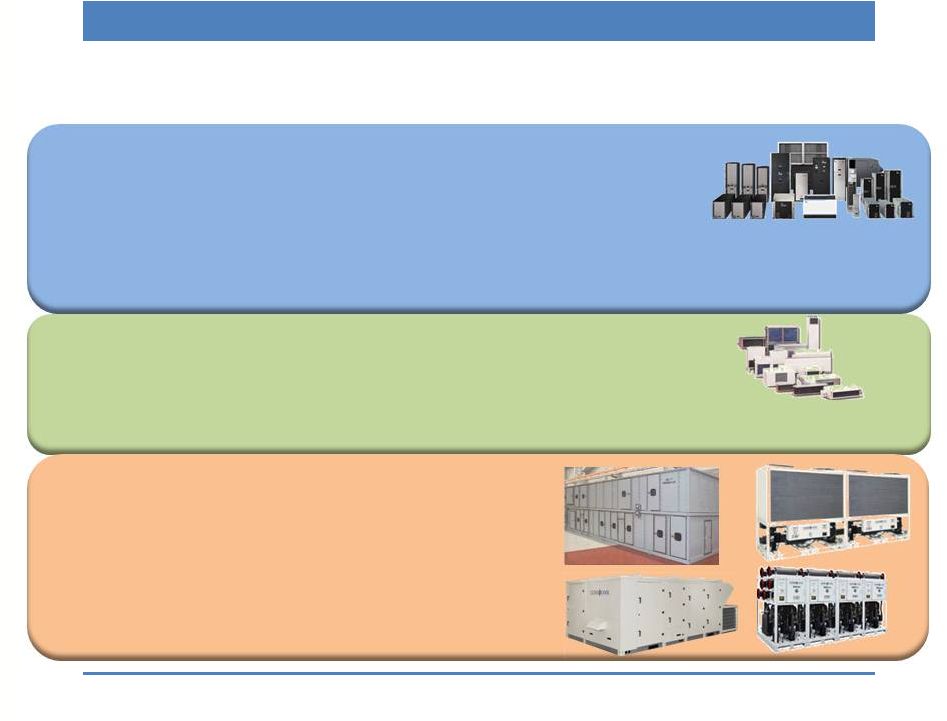 Climate Control Market and Products
Market
Products Uses 15
Geothermal &
Water Source
Heat Pumps
(65% of sales)
Water Source
Heat Pumps
Heating and cooling for commercial/institutional
as
well
as
single
family
residential
-
new
construction, renovation and replacements
Geothermal
Heat Pumps
Heating and cooling for commercial/institutional
as
well
as
single
family
residential
-
new
construction, renovation and replacements
Leading share in water
source and geothermal
heat pumps
Hydronic Fan
Coils
Heating and cooling for commercial/institutional
new construction, renovation and replacements
Leading share in hydronic
fan coils
Hydronic Fan
Coils
(23% of sales)
Large Custom
Air Handlers
Commercial, institutional
and industrial
Modular
Chillers
Commercial, institutional
and industrial
Make-up Air
Units
Commercial, institutional
and industrial
Other HVAC
Products
(12% of sales) |
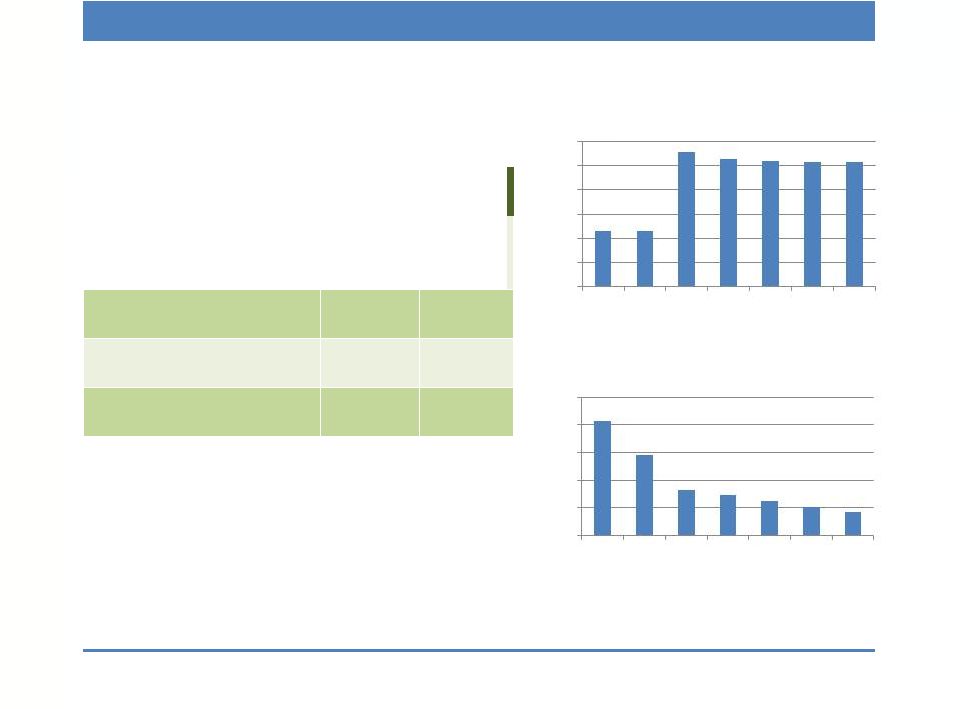
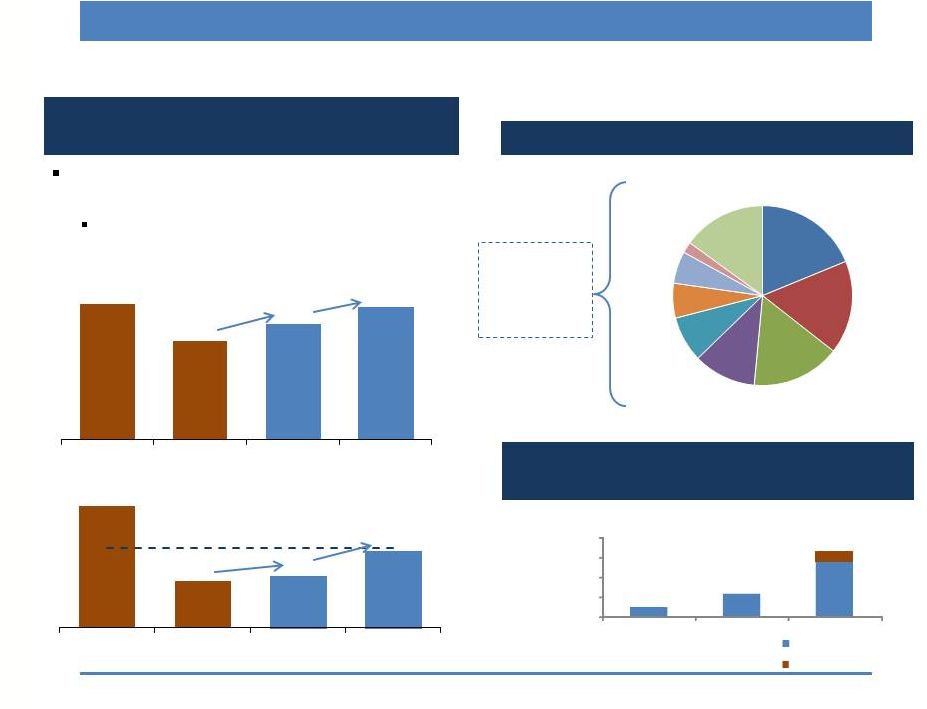 16
Attractive Industry Fundamentals: Climate Control
Significant upside as industry drivers return to
levels at/near historical norms
Driven by high energy efficiency
Climate Control LTM 9/30/14 Market Mix
Total
Commercial,
Institutional and
Multi-Family:
83%
($ in Billions)
$35.0
$85.0
$204.0
$248.0
$0
$75
$150
$225
$300
2008A
2012A
2016P
Low-end
High-end
Source: 2013 Dodge Construction Green Outlook
Construction markets are poised for a
recovery to pre-recession levels
Green building market spending expected
to
grow
~25%+
CAGR
from
‘12
–
‘16E
Commercial / Institutional / Multi-Family Starts
(MM Square Feet)
Single Family Residential Construction
(Starts in 000’s)
1,750
1,278
1,487
1,711
2008
2013
2015E
2017E
16%
15%
1,626
624
700
1,025
2005
2013
2015E
2017E
12%
50-Year Median: 1,070
46%
Education
19%
Single
Family
Residential
17%
Multi-
Family
16%
Lodging
11%
Retail
8%
Healthcare
6%
Office
6%
Industrial
2%
Other
15%
Sources: McGraw-Hill Construction Market Forecasting Service, Q4
2014; 50 Year Median – Census Bureau
|
 Significant Installed Base of Climate Control Products
Millennium Towers, NYC
Bellagio, Las Vegas
Statue of Liberty
MGM Grand, Las Vegas
Trump Tower, NYC
World Financial Center, NYC
Chicago Hilton and Towers
Wynn Resort, Las Vegas
Disney’s Grand Floridian, Orlando
Atlantis, Bahamas
Rowes Wharf, Boston
Alta Condos, Washington DC
Peninsula, Hong Kong
Ritz Carlton, Pasadena, CA
Rockefeller Center, NYC
17
Thousands of premier installations and over 4 million units
|
 18
Financial Overview |
   Summary Statement of Operations
19
2013
2012
2011
2010
2014
2013
Sales
$679.3
$759.0
$805.3
$609.9
$551.2
$530.3
Sales Growth
(11)%
(6)%
32%
15%
4%
(9)%
Operating Income/(Loss)
$105.3
$95.7
$136.4
$55.9
$48.4
$35.1
Net Income/(Loss)
$55.0
$58.6
$83.8
$29.6
$19.0
$17.6
Diluted Earnings/(Loss) per Share
$2.33
$2.49
$3.58
$1.32
$0.80
$0.75
EBITDA
$132.9
$117.3
$155.7
$74.3
$75.4
$54.4
EBITDA Margin
20%
15%
19%
12%
14%
10%
$ in millions except EPS
9 Mos. Ended Sept. 30,
Calendar Year Ended Dec. 31,
*Free cash flow is defined as operating cash plus insurance proceeds
and debt and financing proceeds, less capital expenditures and
debt and financing payments |
 Segment Summary Statement of Operations
20
Chemical Business
$ in millions
2013
2012
2011
2010
2014
2013
Sales
$380.7
$477.8
$511.9
$351.1
$345.7
$303.0
Gross Profit
46.2
97.7
130.7
49.3
57.2
39.1
Gross Profit %
12.1%
20.4%
25.5%
14.0%
16.5%
12.9%
Operating Income
87.8
82.1
116.5
31.9
46.8
20.3
Segment EBITDA
$111.4
$98.5
$131.2
$45.0
$69.6
$36.9
Climate Control Business
$ in millions
2013
2012
2011
2010
2014
2013
Sales
$285.0
$266.2
$281.6
$250.5
$196.6
$217.5
Gross Profit
92.9
81.0
88.2
86.4
61.6
70.6
Gross Profit %
32.6%
30.4%
31.3%
34.5%
31.3%
32.4%
Operating Income
30.4
25.8
32.8
35.3
17.4
24.4
Segment EBITDA
$33.6
$29.0
$35.5
$38.8
$21.0
$26.9
9 Mos. Ended Sept. 30,
Calendar Year Ended Dec. 31,
Calendar Year Ended Dec. 31,
9 Mos. Ended Sept. 30, |
   Solid Financial Position
Strong Balance Sheet
21
Note: As of September 30, 2014, total debt consisted
of $425 million 7.75% Senior Secured Notes due in
2019; a $24.5 million Secured Promissory Note due
in February 2016 and $9.9 million of equipment
loans and capital leases. Our availability under the
$100 million working capital revolver loan was
$74.2 million at September 30, 2014.
Sept. 30,
Dec. 31,
2014
2013
Cash and Investments
(including non-current)
$311.1
$434.7
Total Debt
$459.4
$463.0
Stockholders' Equity
$432.4
$411.7
Total Capitalization
$891.8
$874.7
$ in millions
Debt to
Capital
EBITDA to Interest
Coverage*
* Calculated on a trailing twelve month basis using
total interest, including capitalized interest.
23.0%
22.9%
55.5%
52.9%
52.1%
51.4%
51.5%
0%
10%
20%
30%
40%
50%
60%
Mar.
31
2013
Jun.
30
2013
Sept.
30
2013
Dec.
31
2013
Mar.
31
2014
Jun.
30
2014
Sept.
30
2014
20.8x
14.6x
8.2x
7.4x
6.2x
5.2x
4.3x
0
5
10
15
20
25
Mar.
31
2013
Jun.
30
2013
Sept.
30
2013
Dec.
31
2013
Mar.
31
2014
Jun.
30
2014
Sept.
30
2014 |
 Planned Capital Spending
22
Remainder of
2014
2015
Total
Chemical Business:
El Dorado Facility Expansion Projects
$80 - $93
$200 - $222
$280 - $315
Development of Natural Gas Leaseholds
1 - 3
14 - 18
15 - 21
Environmental Projects
5 - 7
5 - 7
10 - 14
Major Renewal and Improvement Projects
14 - 18
34 - 40
48 - 58
Other
4 - 8
13 - 16
17 - 24
Total Chemical
$104 - $129
$266 - $303
$370 - $432
Climate Control Business:
2 - 3
7 - 10
9 - 13
Corporate and Other:
2 - 3
7 - 10
9 - 13
Total Projects
$108 - $135
$280 - $323
$388 - $458
Expenditures
to Date
Remainder of
2014
2015
Project
Total
Ammonia Plant
$99
$50 - $60
$126 - $141
$275 - $300
Nitric Acid Plant and Concentrator
85
11 - 12
29 - 33
125 - 130
Other Support Infrastructure
21
19 - 21
45 - 48
85 - 90
Total El Dorado Projects
$205
$80 - $93
$200 - $222
$485 - $520
Planned Capital Expenditures
Planned Capital Expenditures
Total Projects
El Dorado
Expansion Projects
Note: The planned spending is presented as a range to provide for
engineering estimates, the status of bidding, variable material costs, unplanned delays in construction and
other contingencies.
(as of September 30, 2014 - $ in millions)
|
 Chemical Business Operating Metrics
23
(1) Gross cost excluding any hedging activity
Nine Months Ended September 30,
Agricultural:
2014
2013
% Change
Product (tons sold)
Urea ammonium nitrate (UAN)
231,153
200,549
15%
Ammonium nitrate (AN)
184,450
124,070
49%
Anhydrous ammonia
65,148
37,332
75%
Other
23,478
21,714
8%
504,229
383,665
31%
Average
Selling
Prices
(price
per
ton)
UAN
$259
$273
(5%)
AN
$332
$377
(12%)
Anhydrous ammonia
$481
$543
(11%)
Input Costs
Average purchased ammonia cost/ton
$482
$568
(15%)
Average natural gas cost/Mmbtu
(1)
$4.91
$3.86
27%
Industrial:
Product (tons sold)
Nitric acid
396,026
366,665
8%
AN and AN solution
126,256
116,827
8% |
 Outlook
24
Chemical:
Favorable indicators for agricultural market
Expected 2014/2015 planting level of ~87 million acres of corn
Current nitrogen fertilizer prices approximately equal to or higher
than a year ago Natural gas feedstock cost relatively low
historically Corn pricing lower than recent past but stabilized
while yields per acre are increasing Continued high cost of
ammonia is unfavorable for our business El Dorado currently
purchases ammonia making the sale of HDAN uneconomical This is
expected to continue until the new ammonia plant is on-line in 2016
Successful turnaround moves Cherokee to a 2-year turnaround
cycle Translates into additional production days of between
10-15 days every 2 years Planned maintenance activity not
expected in Q4 2014 El
Dorado
will
cease
production
for
approximately
one
week
to
facilitate
“tie-ins”
required
for
expansion
projects
Climate Control:
Continued trend for increasing demand in the commercial and
institutional sectors September
ABI
was
positive
for
5
th
consecutive
month,
reaching
2007
levels
Long-stalled projects are re-activating, indicating credit is
easing and an increase in confidence in the economy Commercial and
institutional sectors we serve expected to increase in 2015 per Dodge data
Lodging (+17%), Retail (+11%), Office Buildings (+19%) and Education
(+9%) $75.5
million
backlog
at
10/31/14
highest
since
2008
translating
to
sales
growth
year-over-
year in Q4 2014 and into 2015 |
 Key LSB Value Drivers
Comprehensive upgraded Chemical Business safety and plant reliability
systems
–
intended
to
improve
plant
up-time
and
reduce
risks
of
unplanned
downtime.
Pryor
facility
reliability
improvements
-
including
new
senior
management,
additional
engineering
support,
extensive
monitoring
and
control
equipment,
remanufacture of certain key pieces of equipment, and use of industry
expert consultants –
intended to improve plant up-time and reduce risks of unplanned
downtime.
Expansion
projects
at
El
Dorado
–
intended
to
reduce
costs,
increase
capacity,
and enhance product balance capabilities.
Growth
in
Climate
Control
Business
within
existing
plant
footprints
as
construction
cycle
recovers
to
achieve
increased
profits
through
operating
leverage.
LEAN
/
Operational
Excellence
initiatives
in
our
Climate
Control
Business
to
facilitate improved operational metrics and reduce costs.
25 |
 26
Appendix |
 27
EBITDA Reconciliations (in
millions) Reconciliation
of
Consolidated
Net
Income
and
Segment
Operating
Income
to
Non-GAAP
measurement
EBITDA.
Management
uses
operating
income
by business segment for purposes of making decisions that include
resource allocations and performance evaluations. Operating income by business segment
represents gross profit by business segment less selling, general and
administrative expenses incurred by each business segment plus other income and other
expense earned/incurred by each business segment before general
corporate expenses. The term EBITDA, as used in this
presentation, is net income plus interest expense, depreciation, amortization, income taxes, and certain non-cash charges, unless
otherwise described. EBITDA is not a measurement of financial
performance under GAAP and should not be considered as an alternative to GAAP measurement.
LSB Industries, Inc. Consolidated
2013
2012
2011
2010
2014
2013
Net income (loss)
55.0
$
58.6
$
83.8
$
29.6
$
19.0
$
17.6
$
Plus:
Interest expense
14.0
4.2
6.7
7.4
17.5
6.7
Depreciation and amortization
28.4
20.7
18.8
17.4
26.6
20.1
Provisions for income taxes
35.3
33.6
46.2
19.8
12.3
10.0
Loss from discontinued operations
0.2
0.2
0.2
0.1
-
-
EBITDA per conference call
132.9
$
117.3
$
155.7
$
74.3
$
75.4
$
54.4
$
Climate Control Business
Operating income (loss)
30.4
$
25.8
$
32.8
$
35.3
$
17.4
$
24.4
$
Plus:
Equity in earnings of affiliate
0.4
0.7
0.5
1.0
0.1
0.5
Depreciation and amortization
2.8
2.5
2.2
2.5
3.5
2.0
EBITDA per conference call
33.6
$
29.0
$
35.5
$
38.8
$
21.0
$
26.9
$
Chemical Business
Operating income (loss)
87.8
$
82.1
$
116.5
$
31.9
$
46.8
$
20.3
$
Plus:
Non-operating income
-
-
-
-
0.2
-
Depreciation and amortization
23.6
16.4
14.7
13.1
22.6
16.6
EBITDA per conference call
111.4
$
98.5
$
131.2
$
45.0
$
69.6
$
36.9
$
Nine months ended 9-30
Twelve months ended 12-31 |
 What Our Chemical Products Are Used For:
28
Agrochemical Products
Uses
Urea Ammonium Nitrate Solutions (UAN) 28-32% N
Manufactured nitrogen content fertilizer
High nitrogen content fertilizer for corn and other crops with high
nitrogen demand (wheat, milo, cotton)
E2 Ammonium Nitrate Prill (solid) 34% N
High nitrogen content fertilizer
Nitrogen consuming crops, forage areas and citrus. The primary
nitrogen component in NPK (nitrogen, phosphorus, potassium)
fertilizer blends Fertilizer Blends
Custom blends with purchased phosphates, potassium, sulfur,
micronutrients with produced ammonium nitrate
Special application for agri-business products to supply growers
balanced fertility
Anhydrous Ammonia 82% N
Gas injected application
High
nitrogen
content
fertilizer
with
highest
percentage
use
for
corn.
Industrial Acids, Ammonia, DEF
Uses:
Concentrated Nitric Acid
Aqueous solution up to 99% concentration
Production of specialty fibers, nitrocellulose, gaskets, crop
chemicals, mining products, metal treatment, nitric acid
commercial blends Nitric Acid Commercial Blends
Aqueous solution up to 89% concentration
Semi-conductor industry, manufacture of nylon and polyurethane
intermediates, potassium nitrate compounds, ammonium nitrate
production Anhydrous Ammonia
Commercial grade and high purity refrigeration, metallurgical
grade Air emission abatement in power plants, water treatment,
refrigerants, metals processing, and a wide variety of
industrial uses Mixed Acids
Blends of concentrated nitric acid and sulfuric acid/oleum
Diesel fuel additives, ordnance, herbicides and pharmaceutical grade
nitroglycerine
Sulfuric Acid
98% and 93% concentrations, standard and low-iron grades
Pulp and paper manufacturing, alum, water treatment, metals
processing, vanadium processing, other industrial uses
DEF (diesel exhaust fluid)
Exhaust
stream
additive
to
reduce
NO
X
emissions
from
diesel
vehicles
Industrial Mining Products
Uses:
Ammonium Nitrate Solutions
54% and 83% concentrations
Specialty
emulsions
for
mining
applications,
other
miscellaneous
uses
Low Density Ammonium Nitrate Prills (solids)
Solid pellets with good porosity and flowability
Surface mining, quarries, construction |
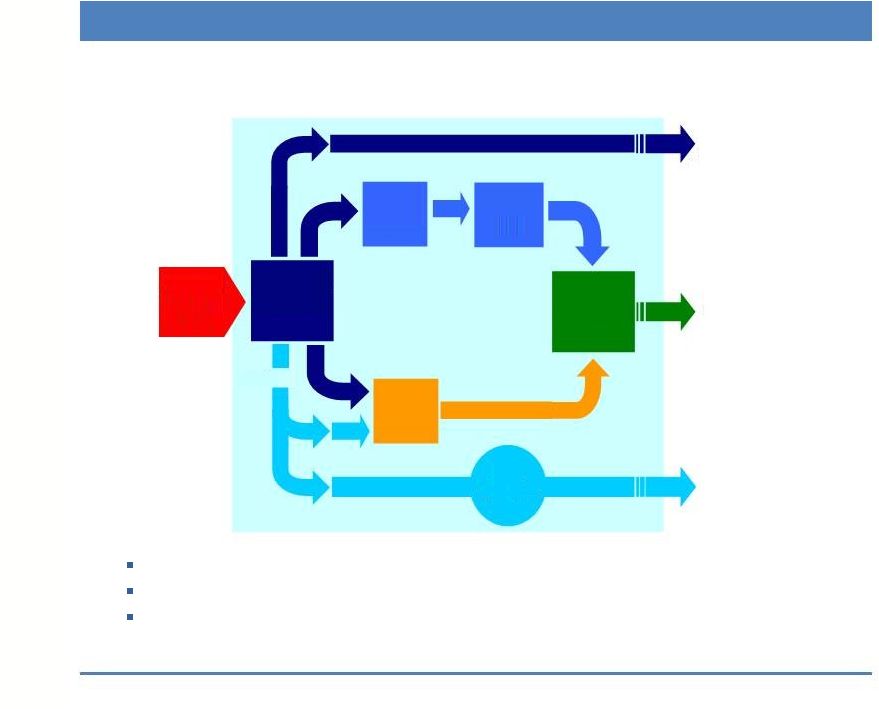 Typical
Facility
Process
Flow
(Pryor)
29
Products
are
marketable
at
every
intermediate
and
final
stage
of
production.
Pryor facility process flow is typical of plants with natural gas
feedstock. Pryor and Cherokee use natural gas feedstock.
El Dorado and Baytown use ammonia feedstock.
AN
Solution
CO
(storage,
trucks)
Nitric
Acid
Ammonia
Plant
UAN
Urea
CO
Liquification
Natural
Gas
(pipeline)
UAN
(storage,
trucks, rail)
NH
(storage,
trucks, rail)
CO
3
2
2
2 |
 Climate Control Sales & Marketing Data
30
Diversified End Markets
Commercial:
•
•
Residential (Geothermal):
•
•
Plus: OEM distribution channels
Distribution Channels
Product
&
Market
Sales
Mix
–
Various
Perspectives
September 30, 2014 LTM Sales Mix Data
238 Commercial representative firms with
438 locations
2,200+ Sales Engineers
600 Residential distributor locations (approx.)
4,000 Residential contractor-dealers (approx.)
0%
25%
50%
75%
100%
2008
LTM
9/30/14
Retail
Single Family
Education
Healthcare
Multi Family
Office
Lodging
Other
Commercial
&
Institutional
78%
Residential
17%
Export
5%
Heat Pumps
65%
Fan Coils
23%
Air
Handlers
6%
Chillers
4%
Contracting
2%
Direct
84%
OEM
16% |
 Focus on Geothermal Heat Pumps
How does a GHP system work?
31
The
Earth
absorbs
approximately
50%
of
all
solar
energy
and
remains at nearly a constant temperature year round (below a few
feet deep).
A
GHP
system
uses
a
sealed
in-ground
heat
exchanger
(loop)
filled
with
fluid
and
a
GHP
unit
to
exchange
energy
between
the
house
or
building and the earth.
In
winter,
fluid
in
the
loop
absorbs
energy
from
the
earth
and
carries
it
to the GHP where it is converted (compressed) to a higher temperature
and sent as warm air into the house or building.
In
summer
the
system
reverses,
transferring
heat
from
the
house
or
building into the earth.
GHP
systems
work
year
round
in
all
climates,
in
both
individual
residence and large commercial buildings, providing both conditioned
air
and
domestic
hot
water
(as
a
“free”
by-product).
Typical
Residential
Geothermal
System
Geothermal Benefits:
Energy Cost Reduction & Positive
Cash Flow
–
the most energy efficient HVAC
technology
available
–
up
to
80%
more
efficient than conventional systems.
Fed
Tax
Credits
-
30%
residential
&
10%
business
+
accelerated depreciation, + state/utility incentives
GHP’s
are
an
Alternative
form
of
Renewable
Energy
Green
Refrigerants
-
non-ozone
depleting
“Free”
Domestic Hot Water
Noise
Free
Operation
–
no noisy condensing unit
Extremely
Long
Lived
vs.
conventional systems (50 year
loops)
Residential Energy Usage
Conventional System Geothermal System
,
, |
 32
Typical GHP Costs and Savings
For a GHP System in a 2,500 sq. ft. new house in St. Louis, MO
(typical middle America) Installed Cost of a 4 ton GHP System =
$6,000 per ton (12,000 Btu/ton). System Operating Cost
Comparison GHP vs. Conventional Systems
Note: System installed costs are different throughout the U.S due to
varying local conditions and labor costs. Savings vary
due to weather conditions, user preferences, and local utility
rates. Costs and savings in St. Louis are estimates and subject
to change.
Payback (GHP vs.
Hi-Eff Gas Furn+AC)
Installed cost of GHP
$24,000
Less: 30% Fed tax credit
(7,200)
GHP cost after credit
16,800
Cost for Hi-Eff Gas + AC
(12,000)
GHP premium cost
4,800
Annual Energy Savings
$1,248
Payback in Years
3.8
Positive Cash Flow
Annual Energy Savings
$1,248
Annual P&I on GHP
Premium
(6%
int.
–
10
yrs.)
(636)
Annual Cash Savings
$612
This analysis
compares these
systems:
$0
$1,000
$2,000
$3,000
$4,000
$5,000
$6,000
$7,000
Geothermal
Heat Pump
16 SEER
Standard
Heat Pump
10 SEER
Standard
Heat Pump
93% Efficient
Natural Gas
Furnace with
16 SEER A/C
80% Efficient 93% Efficient
Natural Gas
Furnace with
10 SEER A/C16 SEER A/C
Propane
Furnace with
80% Efficient 80% Efficient
Propane
Furnace with with 16 SEER with 10 SEER
10 SEER A/C
Oil Furnace
A/C
80% Efficient
Oil Furnace
A/C
Lighting & Appliance
Heating
Cooling
Hot Water |
 Notes:
33
_________________________________________________________________
_________________________________________________________________
_________________________________________________________________
_________________________________________________________________
_________________________________________________________________
_________________________________________________________________
_________________________________________________________________
_________________________________________________________________
_________________________________________________________________
_________________________________________________________________
_________________________________________________________________
_________________________________________________________________
_________________________________________________________________
_________________________________________________________________
_________________________________________________________________
_________________________________________________________________
_________________________________________________________________
_________________________________________________________________
_________________________________________________________________
|
 Notes:
34
_________________________________________________________________
_________________________________________________________________
_________________________________________________________________
_________________________________________________________________
_________________________________________________________________
_________________________________________________________________
_________________________________________________________________
_________________________________________________________________
_________________________________________________________________
_________________________________________________________________
_________________________________________________________________
_________________________________________________________________
_________________________________________________________________
_________________________________________________________________
_________________________________________________________________
_________________________________________________________________
_________________________________________________________________
_________________________________________________________________
_________________________________________________________________
|
 Notes:
35
_________________________________________________________________
_________________________________________________________________
_________________________________________________________________
_________________________________________________________________
_________________________________________________________________
_________________________________________________________________
_________________________________________________________________
_________________________________________________________________
_________________________________________________________________
_________________________________________________________________
_________________________________________________________________
_________________________________________________________________
_________________________________________________________________
_________________________________________________________________
_________________________________________________________________
_________________________________________________________________
_________________________________________________________________
_________________________________________________________________
_________________________________________________________________
|
 36
LSB Industries, Inc. is headquartered in
Oklahoma City and does business through
its subsidiaries, with seven HVAC manufacturing
and distribution facilities in Oklahoma City,
chemical plants in Texas, Arkansas, Alabama
and Oklahoma and an engineered products
distribution center in Oklahoma City.
Approximately 1,900 total employees.
Investor Relations:
Mark Behrman
Phone: 405-235-4546
Email: mbehrman@lsbindustries.com
The Equity Group, Inc.
Fred Buonocore
Phone: 212-836-9607
Email: fbuonocore@equityny.com
Linda Latman
Phone: 212-836-9609
Email: llatman@equityny.com
Fax: 212-421-1278
Corporate Offices:
16 South Pennsylvania Avenue
Oklahoma City, Oklahoma USA
Phone: 405-235-4546
Fax: 405-235-5067
Email: info@lsbindustries.com
Website: www.lsbindustries.com
Common Stock:
NYSE ticker symbol LXU
Auditor:
Ernst & Young LLP
Company Contact
: |