Attached files
| file | filename |
|---|---|
| 8-K - 8-K - EMPIRE RESOURCES INC /NEW/ | v394725_8k.htm |

INVESTOR PRESENTATION NOVEMBER 2014 Empire Resources, Inc. (NASDAQ: ERS) www.empireresources.com Exhibit 99.1
EMPIRE RESOURCES: FORWARD LOOKING STATEMENTS This presentation contains “forward - looking statements.” Such statements may be preceded by the words “intends,” “may,” “will,” “plans,” “expects,” “anticipates,” “projects,” “predicts,” “estimates,” “aims,” “believes,” “hopes,” “potential” or similar words. Forward - looking statements are not guarantees of future performance, are based on certain assumptions and are subject to various known and unknown risks and uncertainties, many of which are beyond the Company’s control, and cannot be predicted or quantified and consequently, actual results may differ materially from those expressed or implied by such forward - looking statements. Such risks and uncertainties include, without limitation, risks and uncertainties associated with (i) the loss or default of one or more suppliers; (ii) the loss or default of one or more significant customers; (iii) a default by counterparties to derivative financial instruments; (iv) changes in general, national or regional economic conditions; (v) an act of war or terrorism that disrupts international shipping; (vi) changes in laws, regulations and tariffs; (vii) the imposition of anti - dumping duties on products the Company imports; (viii) changes in the size and nature of the Company’s competition; (ix) changes in interest rates, foreign currencies or spot prices of aluminum; (x) the loss of one or more key executives; (xi) increased credit risk from customers; (xii) the Company’s failure to grow internally or by acquisition and (xiii) the Company’s failure to improve operating margins and efficiencies. More detailed information about the Company and the risk factors that may affect the realization of forward - looking statements is set forth in the Company’s filings with the Securities and Exchange Commission (SEC), including the Company’s Annual Report on Form 10 - K and its Quarterly Reports on Form 10 - Q. Investors and security holders are urged to read these documents free of charge on the SEC’s web site at http://www.sec.gov. The Company assumes no obligation to publicly update or revise its forward - looking statements as a result of new information, future events or otherwise. 2

EMPIRE RESOURCES: Overview Leading Master Distributor and Importer of Semi - Finished, Value - Added Aluminum and Steel Products 25+ Year Track Record in Specialized Metals Distribution Niche Essential Link between High Quality Rolling Mills Worldwide and Top - Tier Domestic Service Centers and Metal Working Industry Fills Need for Reliable, Lower - Cost Second or Third Supply Source Long - Standing Relationships with Suppliers and Customers Expert Sales Network Proven Management Team with Global Perspective 3

EMPIRE RESOURCES: Growth Driven Strategy Provide Customers with High Level of Service, Quality and Cost Effective Products Expand Product and Geographic Diversity Strengthen and Expand Customer and Supplier Relationships; Provide Additional Value - Added Services Optimize Margins and Cash Flow Maintain Strong Banking Relationships Build Shareholder Value OBJECTIVE: Double Revenues in 5 Years, with Improving Profitability 4

84% 16% Sales by Product - 2011 Aluminum Steel EMPIRE RESOURCES: Initiative – Diversify Products 5 77% 23% Sales by Product - 2013 Aluminum Steel

70% 11% 5% 6% 8% Sales by Geography - 2011 U.S Canada Europe Latin America Australia/New Zealand EMPIRE RESOURCES: Initiative – Diversify by Geography 6 64% 10% 4% 14% 8% Sales by Geography - 2013 U.S Canada Europe Latin America Australia/New Zealand
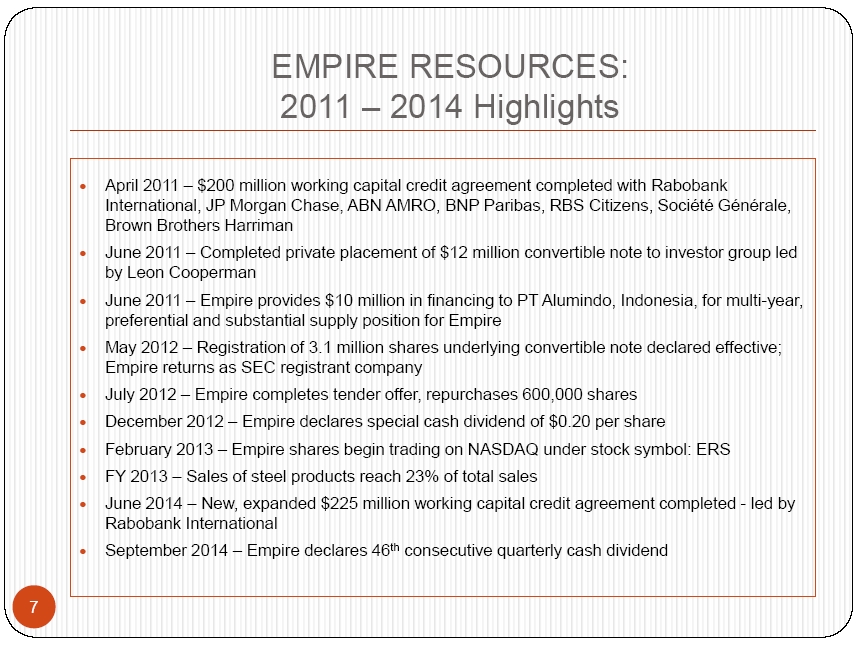
EMPIRE RESOURCES: 2011 – 2014 Highlights April 2011 – $200 million working capital credit agreement completed with Rabobank International, JP Morgan Chase, ABN AMRO, BNP Paribas, RBS Citizens, Société Générale, Brown Brothers Harriman June 2011 – Completed private placement of $12 million convertible note to investor group led by Leon Cooperman June 2011 – Empire provides $10 million in financing to PT Alumindo, Indonesia, for multi - year, preferential and substantial supply position for Empire May 2012 – Registration of 3.1 million shares underlying convertible note declared effective; Empire returns as SEC registrant company July 2012 – Empire completes tender offer, repurchases 600,000 shares December 2012 – Empire declares special cash dividend of $0.20 per share February 2013 – Empire shares begin trading on NASDAQ under stock symbol: ERS FY 2013 – Sales of steel products reach 23% of total sales June 2014 – New, expanded $225 million working capital credit agreement completed - led by Rabobank International September 2014 – Empire declares 46 th consecutive quarterly cash dividend 7
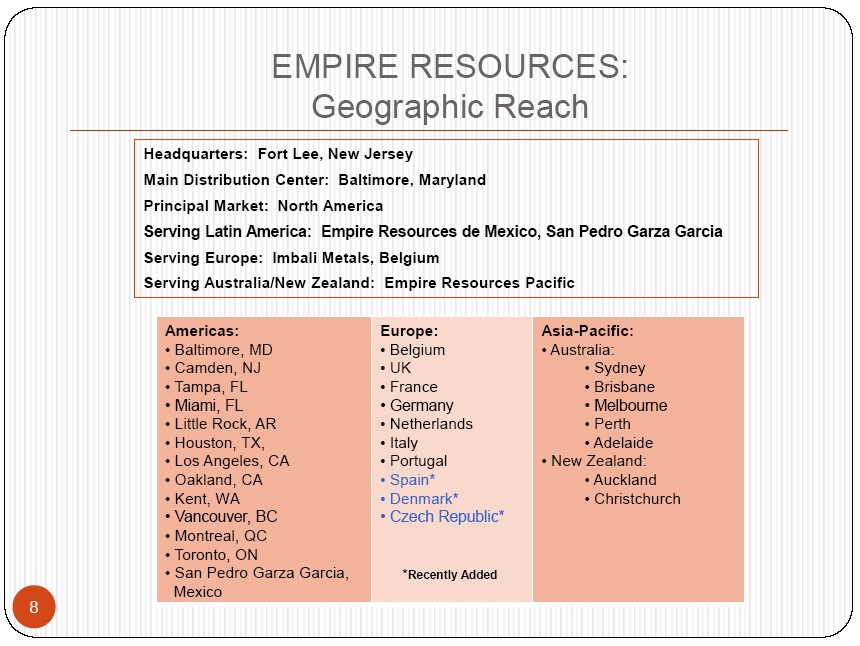
EMPIRE RESOURCES: Geographic Reach Headquarters: Fort Lee, New Jersey Main Distribution Center: Baltimore, Maryland Principal Market: North America Serving Latin America: Empire Resources de Mexico, San Pedro Garza Garcia Serving Europe: Imbali Metals, Belgium Serving Australia/New Zealand: Empire Resources Pacific Americas: • Baltimore, MD • Camden, NJ • Tampa, FL • Miami, FL • Little Rock, AR • Houston, TX, • Los Angeles, CA • Oakland, CA • Kent, WA • Vancouver, BC • Montreal, QC • Toronto, ON • San Pedro Garza Garcia, Mexico Europe: • Belgium • UK • France • Germany • Netherlands • Italy • Portugal • Spain* • Denmark* • Czech Republic* Asia - Pacific: • Australia: • Sydney • Brisbane • Melbourne • Perth • Adelaide • New Zealand: • Auckland • Christchurch 8 * Recently Added

EMPIRE RESOURCES: Range of Semi - Finished Products PRODUCT END MARKET APPLICATION Aluminum Sheet/Coil Transportation, Construction, Food Service Road signs, Trailer gas tanks Aluminum Plate Transportation Shipbuilding, auto and truck bodies Aluminum Treadplate “Treadbright” Industrial, Automotive Toolboxes, auto runners, trimming Aluminum Foil Packaging Candy/gum wrappers, gift wrap Stainless Steel Coil, Sheet, Plate Multi: For aseptic, non - corrosive surfaces Food service, marine - related Carbon Steel Construction, Automotive, Consumer Machinery, Automotive, Pipes, Furniture 9

EMPIRE RESOURCES: Attractive Partner to Our Customers 37% 63% Customers Top 10 Other Top 10 customers accounted for 37% of 2013 sales Service center leaders Ryerson, Samuel Son & Co. and Reliance are among our largest customers We deliver value to our customers through cost - effective, quality products and high service level including: o Warehousing/Just - in - time delivery o Timely market/product intelligence o Arranging for metal processing or finishing services o Shipping from our stock to meet their short - term requirements 10 (For full year ended 12/31/13)

EMPIRE RESOURCES: Attractive Partner to Our Suppliers 62% 38% Suppliers Contractual Other 62% of supply secured through long - term contracts and relationships in 2013 Largest suppliers: o PT. Alumindo Light Metal Industry o Hulamin Ltd. o Elval Hellenic Aluminum We bring value to our suppliers: o We make bulk purchases o We serve as their marketing, distribution and service channel o We assume responsibility for product transportation o We eliminate their currency risk o We provide reliable and timely cash flow 11 (For full year ended 12/31/13)

EMPIRE RESOURCES: Service Center Industry Ranking YEAR RANKING* REVENUES (Millions) 2013 # 24 $ 482.7 2012 # 22 $ 538.5 2011 # 23 $ 514.6 2010 # 24 $ 465.0 2009 # 30 $ 246.1 YEAR TOTAL (Billions) CHANGE 2013 $ 51.1 - 1.2% 2012 $ 51.7 + 0.2% 2011 $ 51.6 + 10.3% 2010 $ 46.8 + 21.9% 2009 $ 38.4 - 36.6% 12 Annual ranking of “Top 50 Service Center Industry Giants” in North America, based on revenues, compiled by Metal Center News – September 2014 EMPIRE RESOURCES, INC. MCN TOP 50 COMBINED*

Empire Resources: Metal Price Neutral 13 Formula Pricing Contractual price is a negotiated fabrication premium over published index Metal pass - through Fixed Pricing Customer agrees to fixed sales price including metal value and fabrication premium Back - to - back hedge Additional information on Empire Resources’ hedging transactions and non - cash mark - to - market gains/losses from underlying metals price changes is available in the Company’s 2013 Annual Report on Form 10 - K.

EMPIRE RESOURCES: Focus on Growth in Stockholders’ Equity* 14 * Stockholders’ Equity in $ Millions before Dividends

EMPIRE RESOURCES: Annual Financial Performance – 2008 - 2013 (in thousands) 2008 2009 2010 2011 2012 2013 Net sales $428,997 $246,062 $465,013 $514,633 $538,527 $482,683 Gross profit 24,133 16,549 30,228 24,531 24,967 21,739 Op income before asset impairment/recovery 13,424 7,779 18,197 11,195 11,709 8,347 Operating income 13,424 4,813 18,543 11,195 11,709 8,347 Other income: Derivative liability change -- -- -- 896 (63) (52) Int. expense incl. debt discount amortization 7,176 5,622 3,997 4,039 5,225 4,514 Pre - tax i ncome/(loss) 6,248 (809) 14,546 8,052 6,421 3,781 Net income/(loss) $3,851 ($511) $9,145 $4,961 $3,964 $2,396 Weighted shares - Diluted 9,874 9,437 9,435 10,987 12,028 8,852 EPS - Diluted $0.39 ($0.05) $0.97 $0.46 $0.42 $0.27 15

EMPIRE RESOURCES: Quarterly Financial Performance (Unaudited, in thousands) 1Q13º 2Q13 3Q13º 4Q13 1Q14º 2Q14 3Q14 Net sales $ 133,430 $ 110,468 $ 126,390 $ 112,395 $ 138,317 $ 146,516 $ 159,366 Cost of goods sold 126,800 105,201 121,082 107,861 131,830 139,501 151,897 Gross profit 6,630 5,267 5,308 4,534 6,487 7,015 7,469 SG&A 3,258 3,501 3,602 3,031 3,299 3,482 3,819 Operating income 3,372 1,766 1,706 1,503 3,188 3,533 3,650 Interest expense , net 1,113 1,134 1,156 1,111 1,091 1,091 1,041 Income before other income/(expense) 2,259 632 550 392 2,097 2,442 2,609 Other income/(expense): Derivative liability change * (2,123) (44) 1,715 400 (429) 249 (2,059) Loss related to convertible debt conversion _ _ _ _ _ _ (164) Income taxes 651 221 194 319 860 1,045 1,080 Net income ($ 515) $ 367 $ 2,071 $ 473 $ 808 $ 1,646 ($ 694) Weighted shares - Diluted 8,852 8,871 11,835 11,855 8,886 11,968 8,814 EPS - Diluted ($ 0.06) $ 0.04 $ 0.06 $ 0.04 $ 0.09 $ 0.15 ($ 0.08) 16 º See Note 20 in 10 - Q dated November 14, 2014 regarding the restatement of the deferred taxation related to the derivative liability. * Non - cash non - operating change in fair market valuation of derivative feature of convertible subordinated note

EMPIRE RESOURCES: Quarterly Non - GAAP Income Statement (Unaudited, in thousands) 1Q13º 2Q13 3Q13º 4Q13 1Q14º 2Q14 3Q14 GAAP pre - tax i ncome 136 588 2,265 792 1,668 2,691 386 Add back: Change in derivative liability value 2,123 44 (1,715) (400) 429 (249) 2,059 Non - GAAP pre - tax income 2,259 632 550 392 2,097 2,442 2,445 Income taxes 847 238 215 158 807 948 954 Non - GAAP net income $ 1,412 $ 394 $ 335 $ 234 $ 1,290 $ 1,494 $ 1,491 Weighted shares - Diluted 8,852 8,871 8,850 8,842 8,886 8,924 8,814 Non - GAAP EPS - Diluted $ 0.16 $ 0.04 $ 0.04 $ 0.03 $ 0.15 $ 0.17 $ 0.17 17 Use of Non - GAAP Financial Measures To supplement the Company’s consolidated financial statements presented on a GAAP basis, the Company discloses non - GAAP net inco me, because management uses this supplemental non - GAAP financial measure to evaluate performance period over period, to analyze the underlying trends in its business, and to establish operational goals. In addition, the Company believes investors already us e t his non - GAAP measure to monitor the Company’s performance. Non - GAAP net income is defined by the Company as net income excluding noncash, non - operating changes in value of derivative liability related to the conversion option on its convertible debt. Generally, a non - GAAP financial measure is a numerical measure of a company’s performance, financial position or cash flow that either excludes or includes amounts that are not normally excluded or included in the most directly comparable measure calculated an d p resented in accordance with GAAP. The non - GAAP measure discussed above, however, should be considered in addition to, and not as a substitut e for or superior to net income or other measures of financial performance prepared in accordance with GAAP. A reconciliation of non - GAAP to GAAP net income is set forth in the table above. The Company believes that providing this information assists investors in understanding the Company’s operating performance a nd the methodology used by management to evaluate and measure such performance. º See Note 20 in 10 - Q dated November 14, 2014 regarding the restatement of the deferred taxation related to the derivative liabil ity.
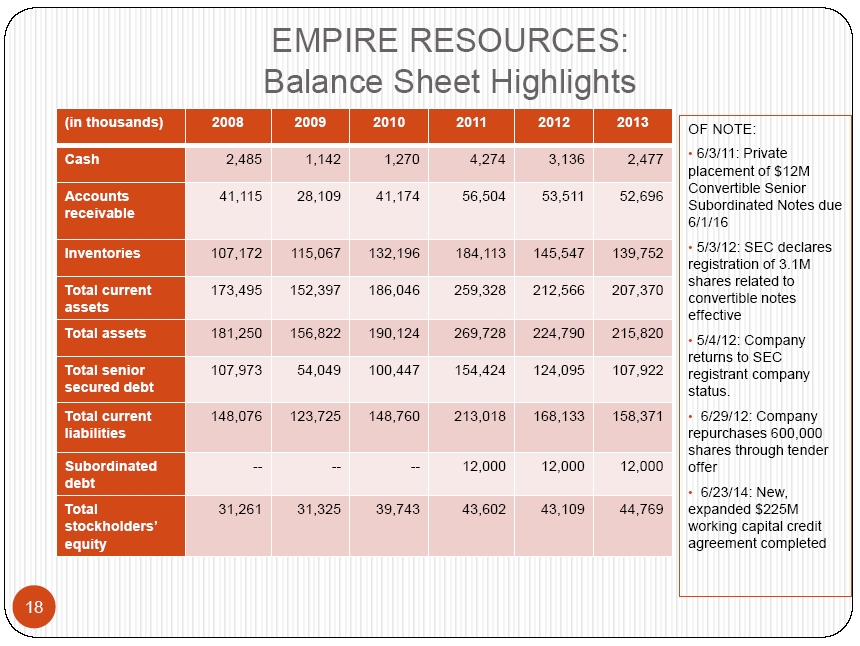
EMPIRE RESOURCES: Balance Sheet Highlights OF NOTE: • 6/3/11: Private placement of $12M Convertible Senior Subordinated Notes due 6/1/16 • 5/3/12: SEC declares registration of 3.1M shares related to convertible notes effective • 5/4/12: Company returns to SEC registrant company status. • 6/29/12: Company repurchases 600,000 shares through tender offer • 6/23/14: New, expanded $225M working capital credit agreement completed (in thousands) 2008 2009 2010 2011 2012 2013 Cash 2,485 1,142 1,270 4,274 3,136 2,477 Accounts receivable 41,115 28,109 41,174 56,504 53,511 52,696 Inventories 107,172 115,067 132,196 184,113 145,547 139,752 Total current assets 173,495 152,397 186,046 259,328 212,566 207,370 Total assets 181,250 156,822 190,124 269,728 224,790 215,820 Total senior secured debt 107,973 54,049 100,447 154,424 124,095 107,922 Total current liabilities 148,076 123,725 148,760 213,018 168,133 158,371 Subordinated debt -- -- -- 12,000 12,000 12,000 Total s tockholders’ equity 31,261 31,325 39,743 43,602 43,109 44,769 18

EMPIRE RESOURCES: Debt Issuance 19 Asset Based Lending Convertible Debt Total facility/issuance $225 million $12 million Lead Rabobank International and BNP Paribas Private Placement Maturity June 19, 2017 June 1, 2016 Accordion $75 million Swingline $10 million Pricing $150M Committed Facility @ 2.35% over Libor; $75M Uncommitted Facility @ 1.85% over Libor 10%

EMPIRE RESOURCES: Valuation Comparisons* Service Center Industry Ranking** Company Market Cap Trailin g P/E Price/ Sales Price/ Book ROE ROA Dividend Yield #1 Reliance Steel & Aluminum (RS) $ 5.0B 14.8 0.49 1.22 8.7% 5.0% 2.7% #5 Russel Metals (RUS.TO) $ 1.9B 16.7 0.52 2.03 12.8% 6.8% 4.6% #12 Olympic Steel (ZEUS) $ 201.3M 32.1 0.14 0.64 2.1% 1.5% 0.5% #15 A.M. Castle (CAS) $ 176.3M N/A 0.18 0.83 - 40.6% - 3.0% N/A #24 Empire Resources (ERS) $ 45.0M 10.2 0.08 0.94 10.2% 2.8% 1.1% 20 * Source: Yahoo Finance, Reported 11/14/14 ** Metal Center News Rankings for 2013, Reported September 2014

EMPIRE RESOURCES: In Summary Leading Master Distributor of Imported Aluminum and Steel Products Essential Link between Rolling Mills and Service Centers/Metal Working Industry Filling Need for Second or Third Supply Source Long - Standing Relationships with Suppliers and Customers Expert Sales Network/Proven Management – with Global Perspective Fully Focused on Growing Sales, Profitability and Shareholder Value 21