Attached files
| file | filename |
|---|---|
| EX-99.4 - EX-99.4 - CBRE GROUP, INC. | a14-24710_2ex99d4.htm |
| EX-99.2 - EX-99.2 - CBRE GROUP, INC. | a14-24710_2ex99d2.htm |
| EX-99.3 - EX-99.3 - CBRE GROUP, INC. | a14-24710_2ex99d3.htm |
| 8-K - 8-K - CBRE GROUP, INC. | a14-24710_28k.htm |
Exhibit 99.1
|
|
FINANCIAL OUTLOOK Jim Groch Chief Financial Officer & Global Director, Corporate Development |
|
|
Positive trends Strong momentum across our business lines Underlying fundamentals continue to improve Market sentiment remains positive Considerations Remain attentive to concerns about slowing economic growth outside the U.S. 2014 Adjusted EPS guidance for 2014 of $1.65 - $1.701 (as announced in connection with reporting Q3 2014 results on October 29, 2014) Challenging earnings comparison for Q4 ($58 million of EBITDA from carried interest in Q4 2013) OUTLOOK See slide 10 for footnotes. |
|
|
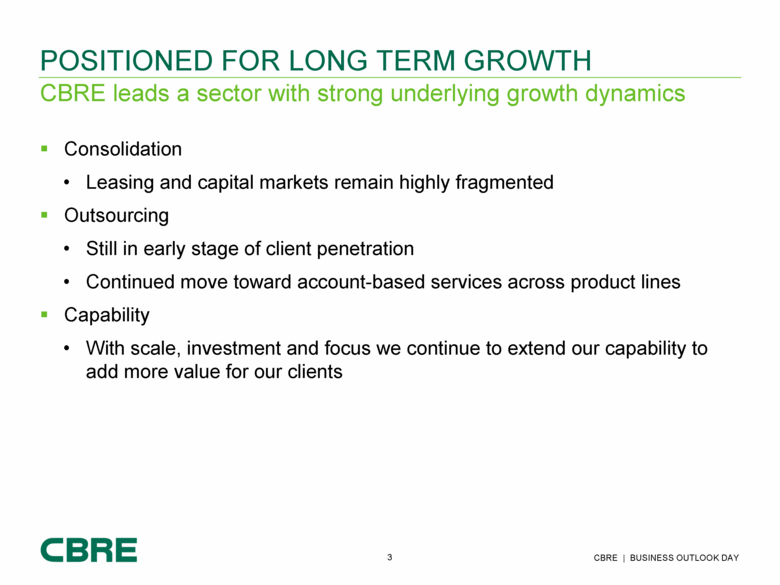
Consolidation Leasing and capital markets remain highly fragmented Outsourcing Still in early stage of client penetration Continued move toward account-based services across product lines Capability With scale, investment and focus we continue to extend our capability to add more value for our clients POSITIONED FOR LONG TERM GROWTH CBRE leads a sector with strong underlying growth dynamics |
|
|
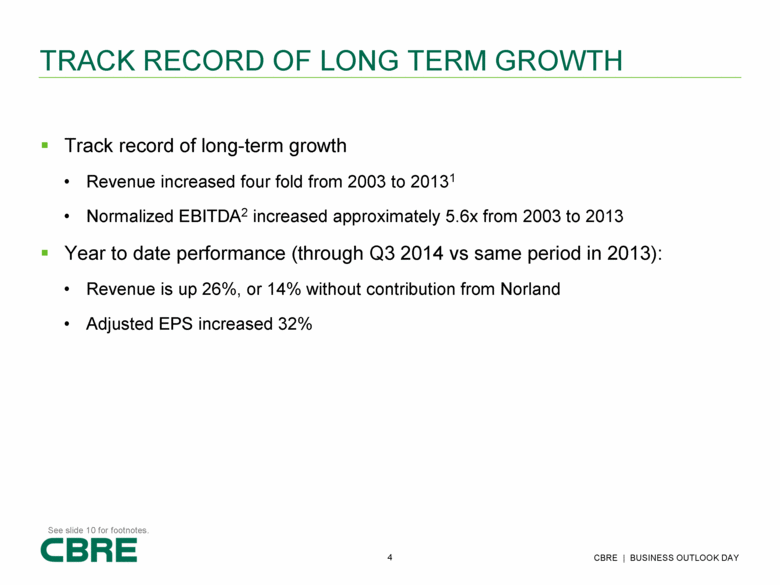
Track record of long-term growth Revenue increased four fold from 2003 to 20131 Normalized EBITDA2 increased approximately 5.6x from 2003 to 2013 Year to date performance (through Q3 2014 vs same period in 2013): Revenue is up 26%, or 14% without contribution from Norland Adjusted EPS increased 32% TRACK RECORD OF LONG TERM GROWTH See slide 10 for footnotes. |
|
|
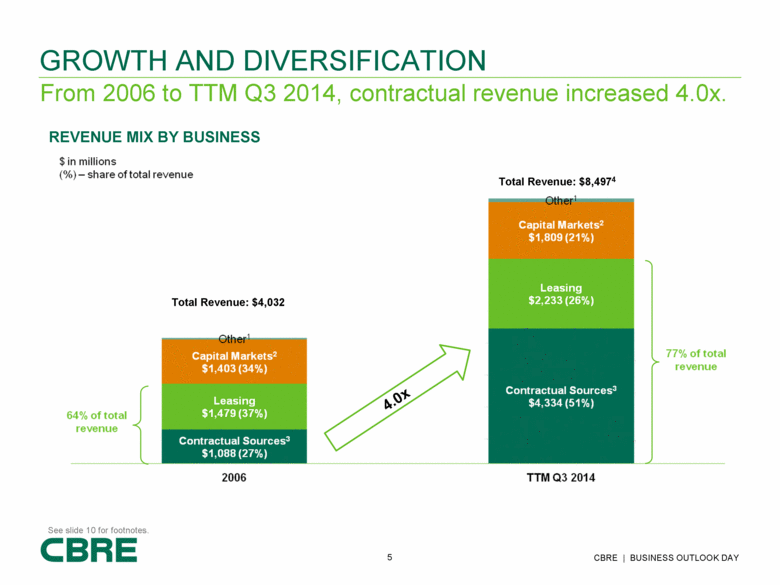
From 2006 to TTM Q3 2014, contractual revenue increased 4.0x. GROWTH AND DIVERSIFICATION Total Revenue: $4,032 Total Revenue: $8,4974 4.0x REVENUE MIX BY BUSINESS See slide 10 for footnotes. |
|
|
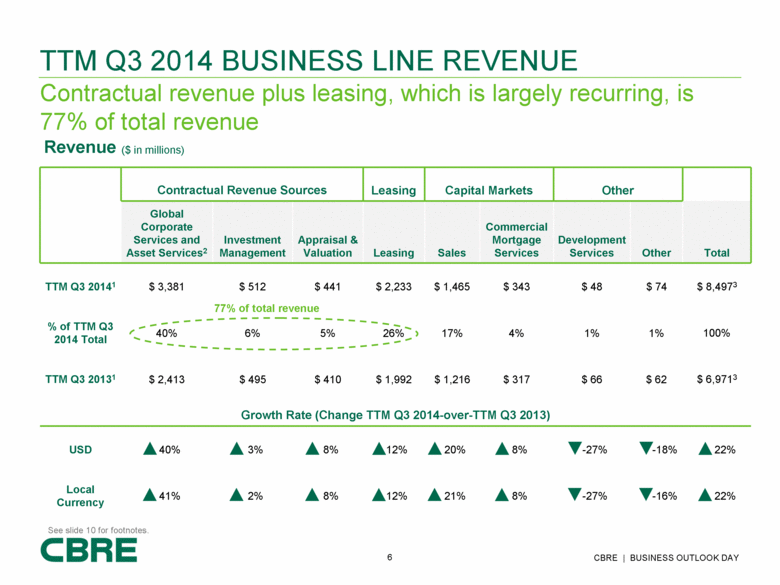
TTM Q3 2014 BUSINESS LINE REVENUE Contractual revenue plus leasing, which is largely recurring, is 77% of total revenue Revenue ($ in millions) Contractual Revenue Sources Leasing Capital Markets Other Global Corporate Services and Asset Services2 Investment Management Appraisal & Valuation Leasing Sales Commercial Mortgage Services Development Services Other Total TTM Q3 20141 $ 3,381 $ 512 $ 441 $ 2,233 $ 1,465 $ 343 $ 48 $ 74 $ 8,4973 % of TTM Q3 2014 Total 40% 6% 5% 26% 17% 4% 1% 1% 100% TTM Q3 20131 $ 2,413 $ 495 $ 410 $ 1,992 $ 1,216 $ 317 $ 66 $ 62 $ 6,9713 Growth Rate (Change TTM Q3 2014-over-TTM Q3 2013) USD 40% 3% 8% 12% 20% 8% -27% -18% 22% Local Currency 41% 2% 8% 12% 21% 8% -27% -16% 22% 77% of total revenue See slide 10 for footnotes. |
|
|
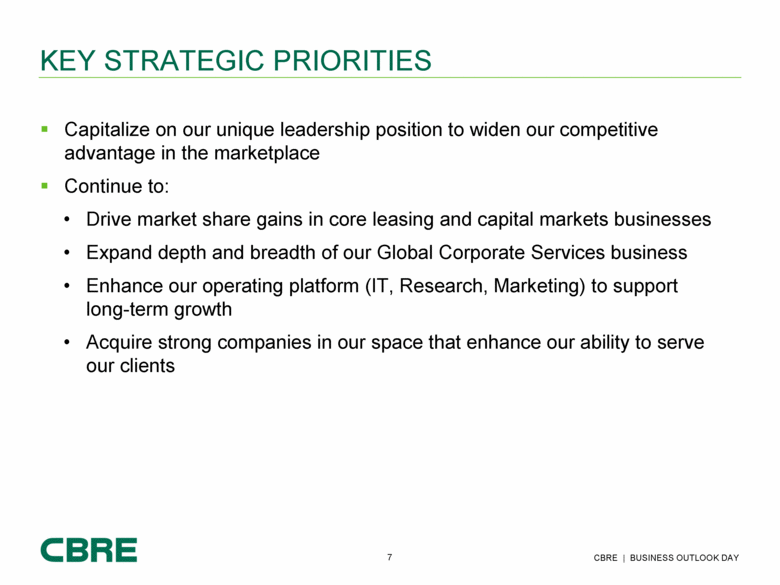
Capitalize on our unique leadership position to widen our competitive advantage in the marketplace Continue to: Drive market share gains in core leasing and capital markets businesses Expand depth and breadth of our Global Corporate Services business Enhance our operating platform (IT, Research, Marketing) to support long-term growth Acquire strong companies in our space that enhance our ability to serve our clients KEY STRATEGIC PRIORITIES |
|
|
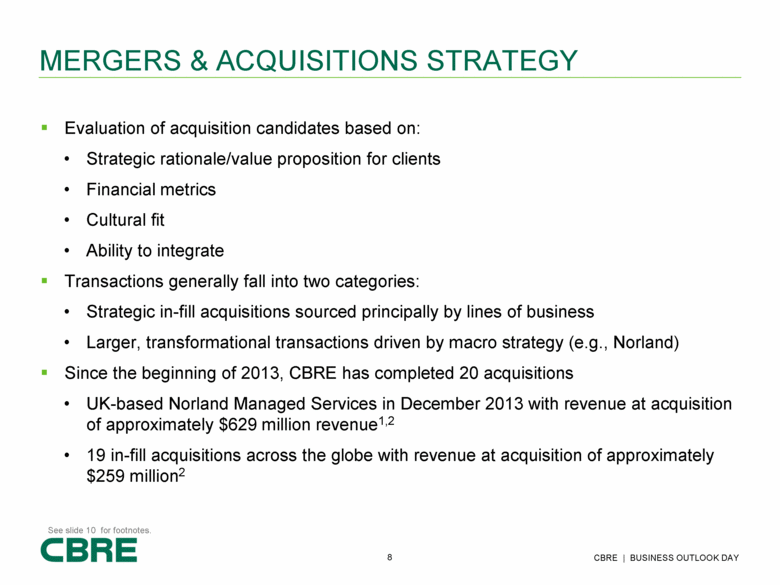
Evaluation of acquisition candidates based on: Strategic rationale/value proposition for clients Financial metrics Cultural fit Ability to integrate Transactions generally fall into two categories: Strategic in-fill acquisitions sourced principally by lines of business Larger, transformational transactions driven by macro strategy (e.g., Norland) Since the beginning of 2013, CBRE has completed 20 acquisitions UK-based Norland Managed Services in December 2013 with revenue at acquisition of approximately $629 million revenue1,2 19 in-fill acquisitions across the globe with revenue at acquisition of approximately $259 million2 MERGERS & ACQUISITIONS STRATEGY See slide 10 for footnotes. |
|
|
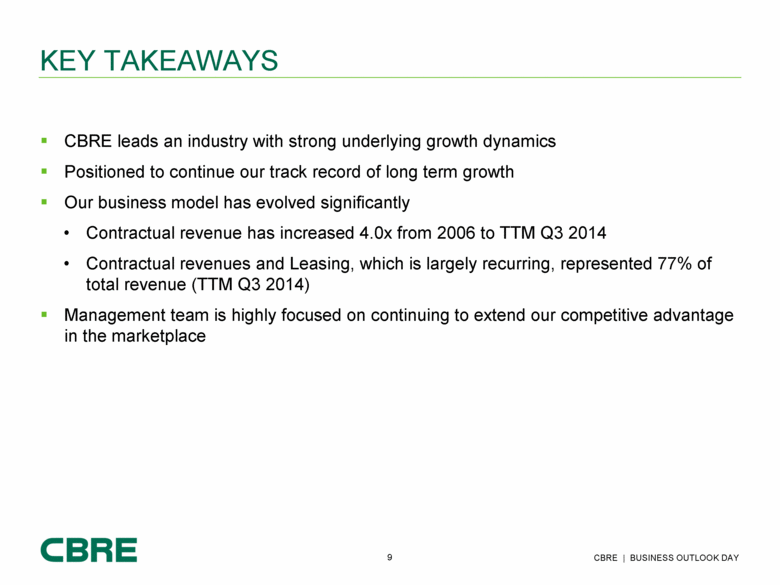
CBRE leads an industry with strong underlying growth dynamics Positioned to continue our track record of long term growth Our business model has evolved significantly Contractual revenue has increased 4.0x from 2006 to TTM Q3 2014 Contractual revenues and Leasing, which is largely recurring, represented 77% of total revenue (TTM Q3 2014) Management team is highly focused on continuing to extend our competitive advantage in the marketplace KEY TAKEAWAYS |
|
|
FOOTNOTES Slide 5 Other includes Development Services (1% in both 2006 and TTM Q3 2014) and Other (1% in both 2006 and TTM Q3 2014). Capital Markets includes Sales (31% in 2006 and 17% in TTM Q3 2014) and Commercial Mortgage Services (3% in 2006 and 4% TTM Q3 2014). Contractual Revenues include Global Corporate Services and Asset Services (14% in 2006 and 40% in TTM Q3 2014; excludes associated sales and lease revenues, most of which are contractual), Global Investment Management (6% in both 2006 and TTM Q3 2014), and Appraisal & Valuation (7% in 2006 and 5% in TTM Q3 2014). Includes revenue and EBITDA from discontinued operations. See below for details. Slide 2 We have not reconciled the non-GAAP EPS guidance to the most directly comparable GAAP measure because this cannot be done without unreasonable effort. Slide 4 Includes revenue from discontinued operations. See below for details. Normalized EBITDA excludes merger-related and other non-recurring charges, gains/losses on trading securities acquired in the Trammell Crow acquisition, cost containment expenses, one-time IPO related compensation expense, integration and other costs related to acquisitions, certain carried interest expense to better match with carried interest revenue realization and the write-down of impaired assets. Discontinued Operations (Slides 4, 5, 6) Under GAAP, the Company has historically classified most of its gains on dispositions of consolidated real estate as income from discontinued operations rather than as revenue and earnings from continuing operations. The Company’s Development Services segment, and occasionally its Global Investment Management segment, are engaged in developing and selling real estate projects in the normal course of business. Management believes that the characterization of these gains as income from discontinued operations may create the inaccurate impression that the Company is exiting this business. Effective January 1, 2014, CBRE adopted new GAAP accounting standards that no longer require it to report dispositions of real estate as income from discontinued operations. Revenue from discontinued operations totaled $9.6 million for the twelve months ended September 30, 2013, $9.4 million for the year ended December 31, 2013 and $0.4 million for the twelve months ended September 30, 2014. EBITDA related to discontinued operations totaled $7.9 million for the year ended December 31, 2013. Slide 6 Includes revenue from discontinued operations. See below for details. Global Corporate Services (GCS) and Asset Services revenue excludes all associated leasing and sales revenue, most of which is contractual. Totals may not tie due to rounding. Slide 8 For fiscal year ended April 5, 2013. Annual revenue approximations are based on revenues at the time of purchase. |


