Attached files
| file | filename |
|---|---|
| 8-K - FORM 8-K - TTM TECHNOLOGIES INC | d822934d8k.htm |
| Exhibit 99.1
|
Lender Presentation November 18, 2014
|
|
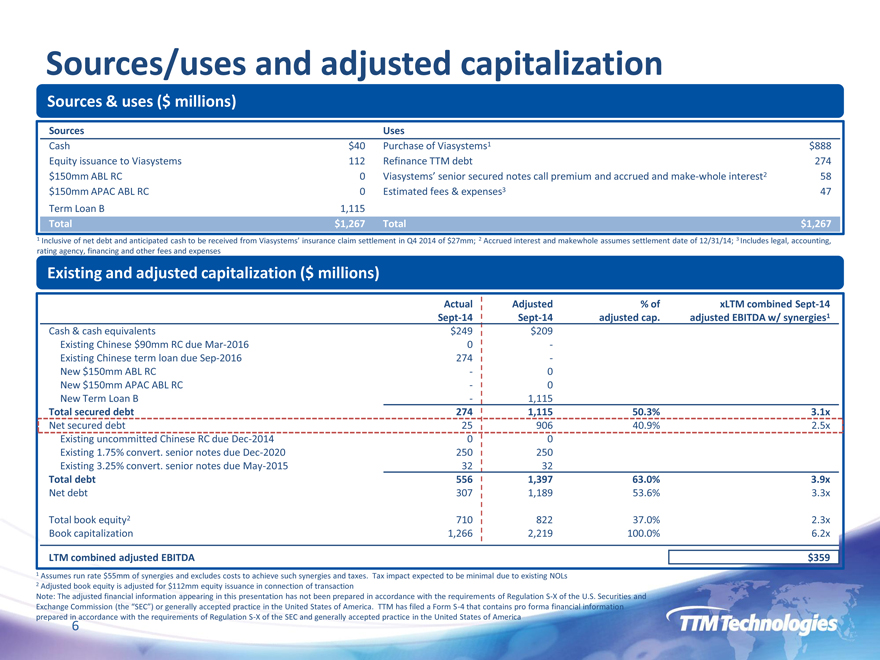
Sources/uses and adjusted capitalization
Sources & uses ($ millions)
Sources Uses
Cash $40 Purchase of Viasystems1 $888
Equity issuance to Viasystems 112 Refinance TTM debt 274
$150mm ABL RC 0 Viasystems’ senior secured notes call premium and accrued and make-whole interest2 58
$150mm APAC ABL RC 0 Estimated fees & expenses3 47
Term Loan B 1,115
Total $1,267 Total $1,267
1 Inclusive of net debt and anticipated cash to be received from Viasystems’ insurance claim settlement in Q4 2014 of $27mm; 2 Accrued interest and makewhole assumes settlement date of 12/31/14; 3 Includes legal, accounting, rating agency, financing and other fees and expenses
Existing and adjusted capitalization ($ millions)
Actual Adjusted% of xLTM combined Sept-14
Sept-14 Sept-14 adjusted cap. adjusted EBITDA w/ synergies1
Cash & cash equivalents $249 $209
Existing Chinese $90mm RC due Mar-2016 0 -
Existing Chinese term loan due Sep-2016 274 -
New $150mm ABL RC—0
New $150mm APAC ABL RC—0
New Term Loan B—1,115
Total secured debt 274 1,115 50.3% 3.1x
Net secured debt 25 906 40.9% 2.5x
Existing uncommitted Chinese RC due Dec-2014 0 0
Existing 1.75% convert. senior notes due Dec-2020 250 250
Existing 3.25% convert. senior notes due May-2015 32 32
Total debt 556 1,397 63.0% 3.9x
Net debt 307 1,189 53.6% 3.3x
Total book equity2 710 822 37.0% 2.3x
Book capitalization 1,266 2,219 100.0% 6.2x
LTM combined adjusted EBITDA $359
1 Assumes run rate $55mm of synergies and excludes costs to achieve such synergies and taxes. Tax impact expected to be minimal due to existing NOLs
2 Adjusted book equity is adjusted for $112mm equity issuance in connection of transaction
Note: The adjusted financial information appearing in this presentation has not been prepared in accordance with the requirements of Regulation S-X of the U.S. Securities and
Exchange Commission (the “SEC”) or generally accepted practice in the United States of America. TTM has filed a Form S-4 that contains pro forma financial information prepared in accordance with the requirements of Regulation S-X of the SEC and generally accepted practice in the United States of America
6
|
|
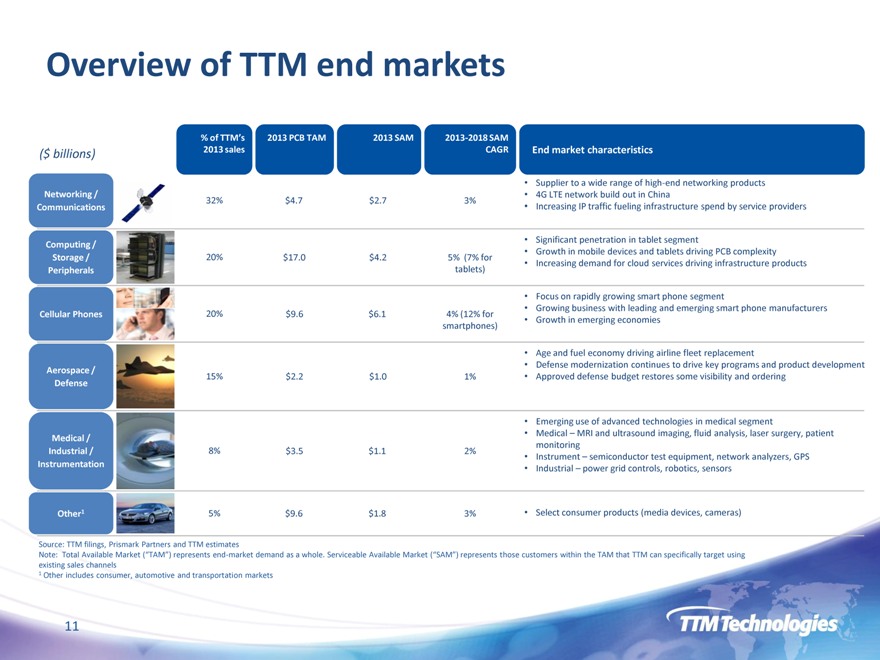
Overview of TTM end markets
% of TTM’s 2013 PCB TAM 2013 SAM 2013-2018 SAM
($ billions) 2013 sales CAGR End market characteristics
Supplier to a wide range of high-end networking products
Networking / 4G LTE network build out in China
32% $4.7 $2.7 3%
Communications Increasing IP traffic fueling infrastructure spend by service providers
Computing / Significant penetration in tablet segment
Growth in mobile devices and tablets driving PCB complexity
Storage / 20% $17.0 $4.2 5% (7% for Increasing demand for cloud services driving infrastructure products
Peripherals tablets)
Focus on rapidly growing smart phone segment
Growing business with leading and emerging smart phone manufacturers
Cellular Phones 20% $9.6 $6.1 4% (12% for Growth in emerging economies
smartphones)
Age and fuel economy driving airline fleet replacement
Defense modernization continues to drive key programs and product development
Aerospace / 15% $2.2 $1.0 1% Approved defense budget restores some visibility and ordering
Defense
Emerging use of advanced technologies in medical segment
Medical / Medical – MRI and ultrasound imaging, fluid analysis, laser surgery, patient
monitoring
Industrial / 8% $3.5 $1.1 2% Instrument – semiconductor test equipment, network analyzers, GPS
Instrumentation Industrial – power grid controls, robotics, sensors
Other1 5% $9.6 $1.8 3% Select consumer products (media devices, cameras)
Source: TTM filings, Prismark Partners and TTM estimates
Note: Total Available Market (“TAM”) represents end-market demand as a whole. Serviceable Available Market (“SAM”) represents those customers within the TAM that TTM can specifically target using
existing sales channels
1 Other includes consumer, automotive and transportation markets
11
|
|
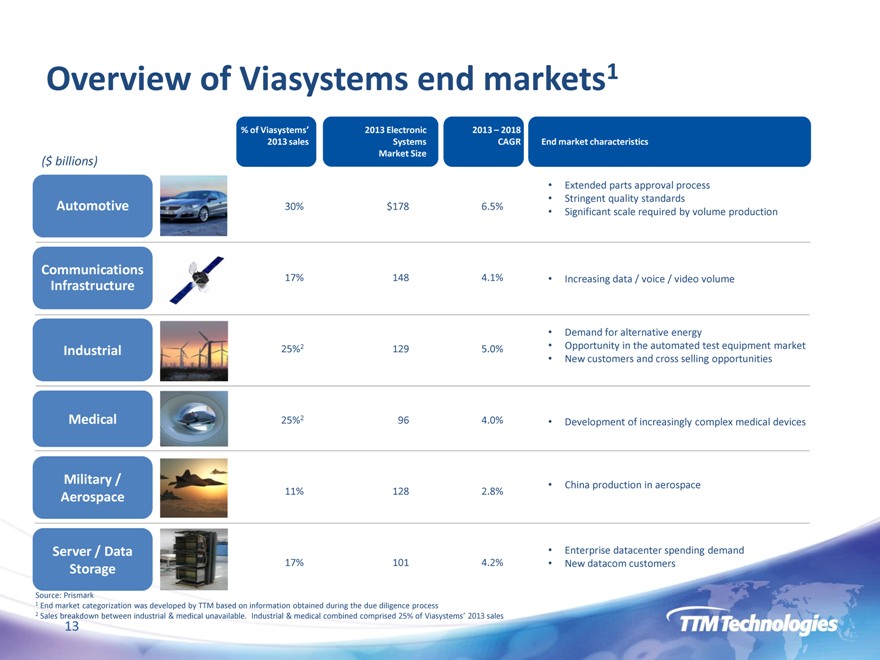
Overview of Viasystems end markets1
% of Viasystems’ 2013 Electronic 2013 – 2018
2013 sales Systems CAGR End market characteristics
Market Size
($ billions)
Extended parts approval process
Stringent quality standards
Automotive 30% $178 6.5% Significant scale required by volume production
Communications
Infrastructure 17% 148 4.1% Increasing data / voice / video volume
Demand for alternative energy
Industrial 25%2 129 5.0% Opportunity in the automated test equipment market
New customers and cross selling opportunities
Medical 25%2 96 4.0% Development of increasingly complex medical devices
Military / China production in aerospace
Aerospace 11% 128 2.8%
Server / Data Enterprise datacenter spending demand
Storage 17% 101 4.2% New datacom customers
Source: Prismark
1 End market categorization was developed by TTM based on information obtained during the due diligence process
2 Sales breakdown between industrial & medical unavailable. Industrial & medical combined comprised 25% of Viasystems’ 2013 sales
13
|
|
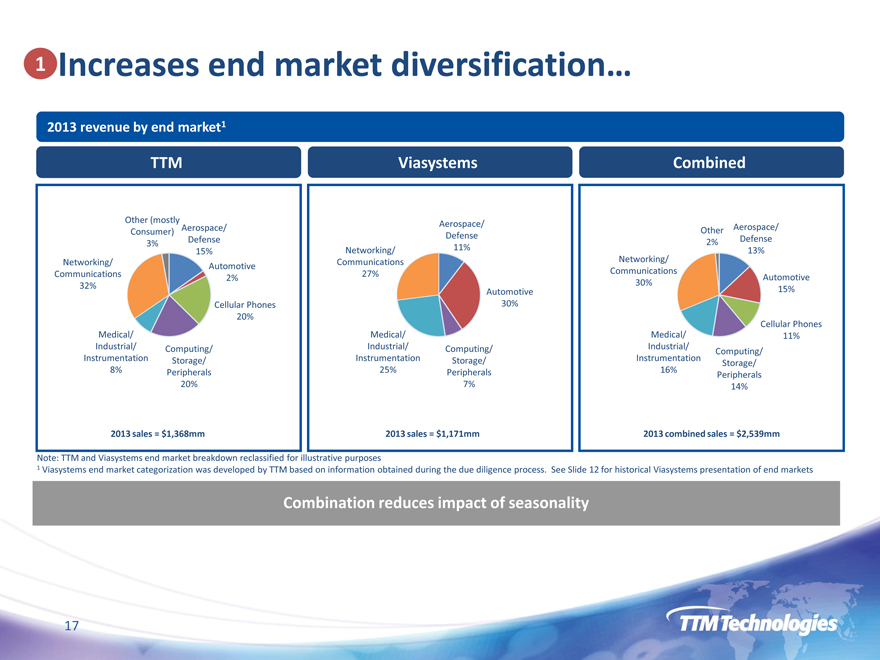
1 Increases end market diversification…
2013 revenue by end market1
TTM Viasystems Combined
Other (mostly
Consumer) Aerospace/
3% Defense
15%
Networking/ Automotive
Communications 2%
32%
Cellular Phones
20%
Medical/
Industrial/ Computing/
Instrumentation Storage/
8% Peripherals
20%
2013 sales = $1,368mm
Aerospace/
Defense
Networking/ 11%
Communications
27%
Automotive
30%
Medical/
Industrial/ Computing/
Instrumentation Storage/
25% Peripherals
7%
2013 sales = $1,171mm
Other Aerospace/
2% Defense
13%
Networking/
Communications
30% Automotive
15%
Cellular Phones
Medical/ 11%
Industrial/ Computing/
Instrumentation Storage/
16% Peripherals
14%
2013 combined sales = $2,539mm
Note: TTM and Viasystems end market breakdown reclassified for illustrative purposes
1 Viasystems end market categorization was developed by TTM based on information obtained during the due diligence process. See Slide 12 for historical Viasystems presentation of end markets
Combination reduces impact of seasonality
17
|
|
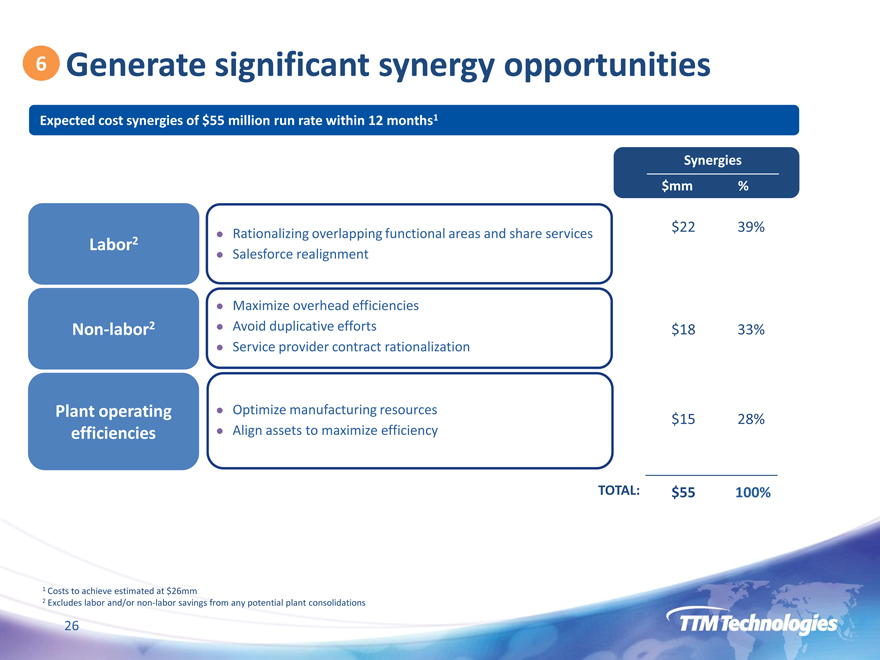
6 Generate significant synergy opportunities
Expected cost synergies of $55 million run rate within 12 months1
Labor2
Non-labor2
Plant operating
efficiencies
Rationalizing overlapping functional areas and share services
Salesforce realignment
Maximize overhead efficiencies
Avoid duplicative efforts
Service provider contract rationalization
Optimize manufacturing resources
Align assets to maximize efficiency
Synergies
$mm%
$22 39%
$18 33%
$15 28%
TOTAL: $55 100%
1 Costs to achieve estimated at $26mm
2 Excludes labor and/or non-labor savings from any potential plant consolidations
26
|
|
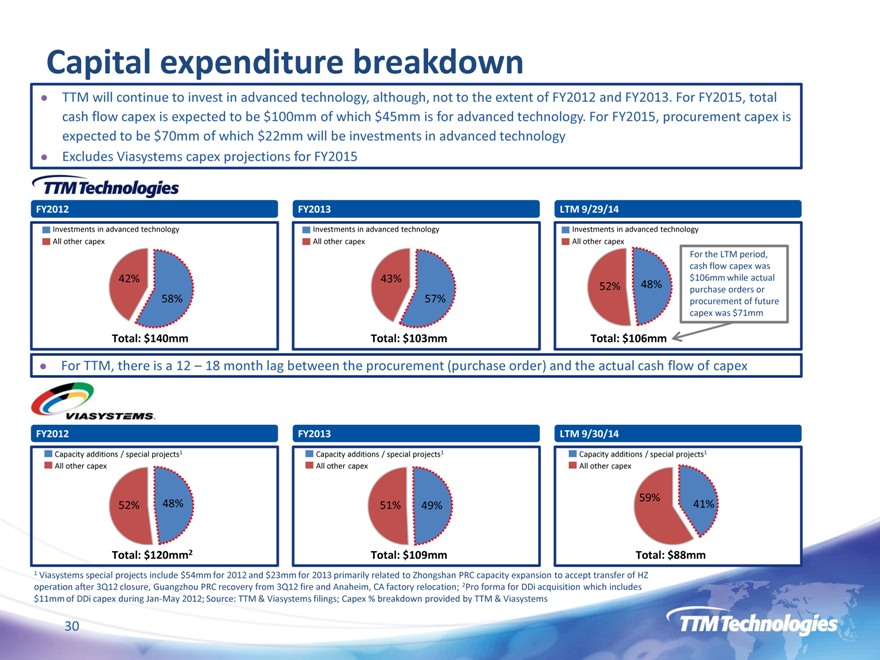
Capital expenditure breakdown
TTM will continue to invest in advanced technology, although, not to the extent of FY2012 and FY2013. For FY2015, total
cash flow capex is expected to be $100mm of which $45mm is for advanced technology. For FY2015, procurement capex is
expected to be $70mm of which $22mm will be investments in advanced technology
Excludes Viasystems capex projections for FY2015
FY2012 FY2013 LTM 9/29/14
Investments in advanced technology Investments in advanced technology Investments in advanced technology
All other capex All other capex All other capex
For the LTM period,
cash flow capex was
42% 43% $106mm while actual
52% 48% purchase orders or
58% 57% procurement of future
capex was $71mm
Total: $140mm Total: $103mm Total: $106mm
For TTM, there is a 12 – 18 month lag between the procurement (purchase order) and the actual cash flow of capex
FY2012 FY2013 LTM 9/30/14
Capacity additions / special projects1 Capacity additions / special projects1 Capacity additions / special projects1
All other capex All other capex All other capex
59%
52% 48% 51% 49% 41%
Total: $120mm2 Total: $109mm Total: $88mm
1 Viasystems special projects include $54mm for 2012 and $23mm for 2013 primarily related to Zhongshan PRC capacity expansion to accept transfer of HZ
operation after 3Q12 closure, Guangzhou PRC recovery from 3Q12 fire and Anaheim, CA factory relocation; 2Pro forma for DDi acquisition which includes
30