Attached files
| file | filename |
|---|---|
| 8-K - 8-K - OGLETHORPE POWER CORP | a2222248z8-k.htm |
Exhibit 99.1
|
|
Third Quarter 2014 Investor Update |
|
|
Notice to Recipients Cautionary Note Regarding Forward Looking Statements Certain of the information contained in this presentation, including certain of the statements made by representatives of Oglethorpe Power Corporation (An Electric Membership Corporation) (“Oglethorpe”), that are not historical facts are forward-looking statements. Although Oglethorpe believes that in making these forward-looking statements its expectations are based on reasonable assumptions, Oglethorpe cautions the reader not to put undue reliance on these forward-looking statements, which are not guarantees of future performance. Forward-looking statements involve uncertainties and there are important factors, many of which are outside management’s control, which could cause actual results to differ materially from those expressed or implied by these forward-looking statements. Some of the risks, uncertainties and assumptions that may cause actual results to differ from these forward-looking statements are described under the headings “CAUTIONARY STATEMENTS REGARDING FORWARD-LOOKING STATEMENTS” in our Quarterly Report on Form 10-Q for the quarter ended September 30, 2014, filed with the Securities and Exchange Commission on November 7, 2014, and “Item 1A – RISK FACTORS” in our Quarterly Report on Form 10-Q for the quarter ended June 30, 2014, filed with the SEC on August 11, 2014, and our Annual Report on Form 10-K for the fiscal year ended December 31, 2013, filed with the SEC on March 27, 2014. This electronic presentation is provided as of November 18, 2014. If you are viewing this presentation after that date, there may have been events that occurred subsequent to such date that would have a material adverse effect on the information that was presented. Oglethorpe undertakes no obligation to publicly update any forward-looking statements. 2 |
|
|
EPA’s Proposed Clean Power Plan Vogtle 3 & 4 Construction Update DOE and RUS Loan Updates Financial and Operational Results Presenters and Agenda Mike Price Executive Vice President and Chief Operating Officer Betsy Higgins Executive Vice President and Chief Financial Officer 3 Mike Smith President and Chief Executive Officer |
|
|
EPA proposed the Clean Power Plan on June 18, 2014 under section 111(d) of the Clean Air Act. Rules to be finalized June 1, 2015. As discussed in the second quarter investor update in August: Nationally, seeks 30% reduction in CO2 emissions from electric generation by 2030 (vs. 2005 baseline), with interim reductions. 4 “Building Blocks”: Coal generation efficiency improvement, switching from coal to natural gas, renewables and energy efficiency. Seeks 44% reduction in Georgia. Zero emission, “under construction” new nuclear is treated unfairly by using it to calculate the state’s reduction goal. The cost of compliance depends heavily on natural gas prices. The proposed rule would lead to significant costs that will be borne by our Members and their consumers. Comment period has been extended to December 1st. Oglethorpe will participate in comments on the proposed rule. Update on EPA’s Proposed Clean Power Plan 4 |
|
|
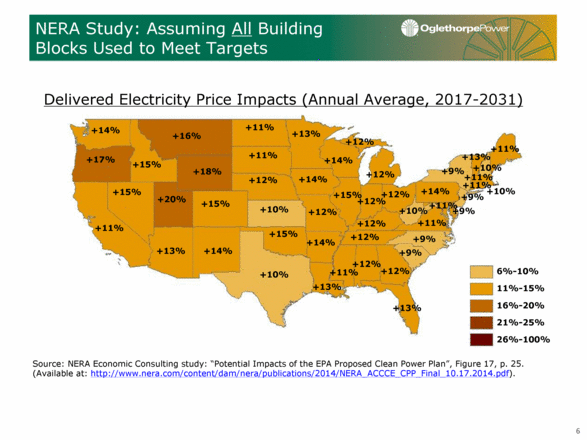
Nationwide Cost Impact – Data Points EPA Up to $8.8 billion per year. NERA Economic Consulting $41 - $73 billion per year. $366 billion to $479 billion over a 15-year period (2017 – 2031). 12% to 17% average increase in electricity prices nationwide. 12% to 13% average increase in electricity prices in Georgia. Bloomberg Article / Brattle Group 1/3 of US utility bills will spike by as much as 25%. 5 |
|
|
NERA Study: Assuming All Building Blocks Used to Meet Targets +14% +17% +11% +15% +20% +16% +18% +13% +15% +15% +14% +11% +11% +12% +10% +15% +10% +13% +14% +12% +14% +13% +12% +14% +15% +11% +12% +12% +12% +12% +12% +14% +11% +10% +11% +9% +9% +9% +9% +9% +11% +10% +13% +11% +11% +10% +12% +12% +13% Delivered Electricity Price Impacts (Annual Average, 2017-2031) Source: NERA Economic Consulting study: “Potential Impacts of the EPA Proposed Clean Power Plan”, Figure 17, p. 25. (Available at: http://www.nera.com/content/dam/nera/publications/2014/NERA_ACCCE_CPP_Final_10.17.2014.pdf). 6%-10% 11%-15% 16%-20% 21%-25% 26%-100% 6 |
|
|
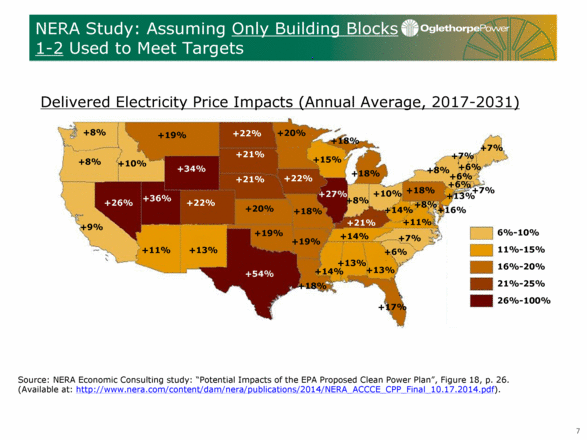
NERA Study: Assuming Only Building Blocks 1-2 Used to Meet Targets Source: NERA Economic Consulting study: “Potential Impacts of the EPA Proposed Clean Power Plan”, Figure 18, p. 26. (Available at: http://www.nera.com/content/dam/nera/publications/2014/NERA_ACCCE_CPP_Final_10.17.2014.pdf). Delivered Electricity Price Impacts (Annual Average, 2017-2031) +8% +8% +8% +9% +10% +36% +19% +34% +11% +26% +22% +13% +22% +21% +21% +20% +19% +54% +20% +22% +18% +19% +18% +18% +15% +27% +14% +8% +18% +13% +14% +21% +18% +8% +14% +11% +7% +6% +8% +13% +16% +7% +6% +7% +6% +6% +7% +10% +13% +17% 6%-10% 11%-15% 16%-20% 21%-25% 26%-100% 7 |
|
|
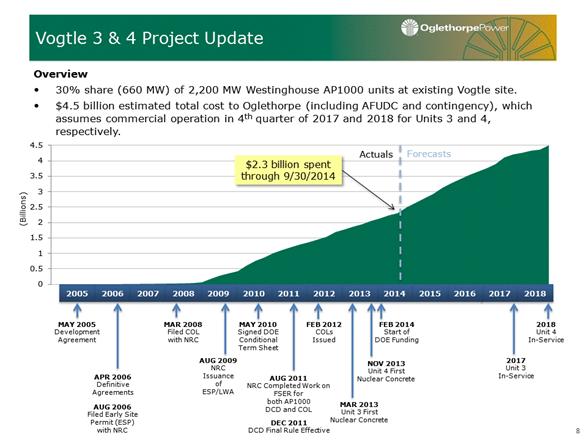
Overview 30% share (660 MW) of 2,200 MW Westinghouse AP1000 units at existing Vogtle site. $4.5 billion estimated total cost to Oglethorpe (including AFUDC and contingency), which assumes commercial operation in 4th quarter of 2017 and 2018 for Units 3 and 4, respectively. Vogtle 3 & 4 Project Update $2.3 billion spent through 9/30/2014 Actuals Forecasts DEC 2011 DCD Final Rule Effective 2005 2017 2016 2015 2014 2013 2012 2011 2010 2009 2006 2007 2008 2018 MAY 2005 Development Agreement MAR 2008 Filed COL with NRC APR 2006 Definitive Agreements MAY 2010 Signed DOE Conditional Term Sheet 2018 Unit 4 In-Service AUG 2006 Filed Early Site Permit (ESP) with NRC AUG 2009 NRC Issuance of ESP/LWA 2017 Unit 3 In-Service AUG 2011 NRC Completed Work on FSER for both AP1000 DCD and COL FEB 2012 COLs Issued MAR 2013 Unit 3 First Nuclear Concrete 8 FEB 2014 Start of DOE Funding NOV 2013 Unit 4 First Nuclear Concrete |
|
|
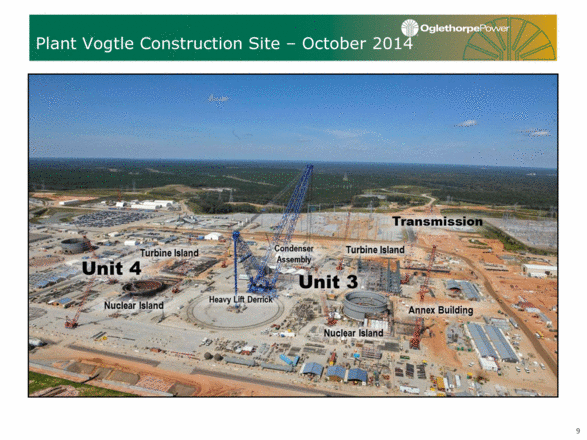
Plant Vogtle Construction Site – October 2014 9 |
|
|
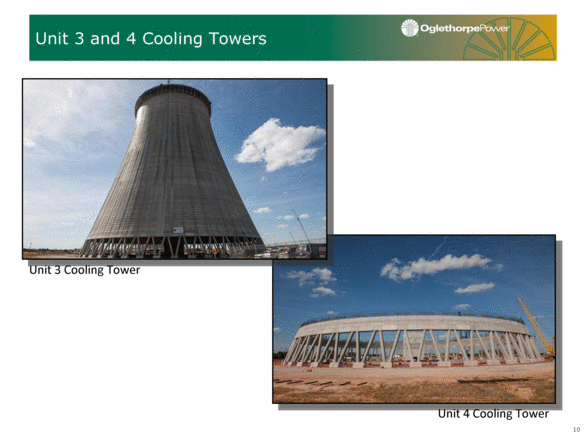
10 Unit 3 and 4 Cooling Towers Unit 4 Cooling Tower Unit 3 Cooling Tower |
|
|
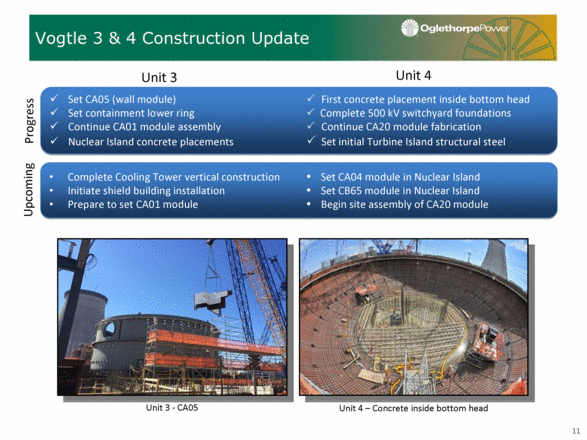
Vogtle 3 & 4 Construction Update Set CA05 (wall module) First concrete placement inside bottom head Set containment lower ring Complete 500 kV switchyard foundations Continue CA01 module assembly Continue CA20 module fabrication Nuclear Island concrete placements Set initial Turbine Island structural steel Complete Cooling Tower vertical construction Set CA04 module in Nuclear Island Initiate shield building installation Set CB65 module in Nuclear Island Prepare to set CA01 module Begin site assembly of CA20 module Unit 3 Unit 4 Upcoming Progress Unit 3 - CA05 Unit 4 – Concrete inside bottom head 11 |
|
|
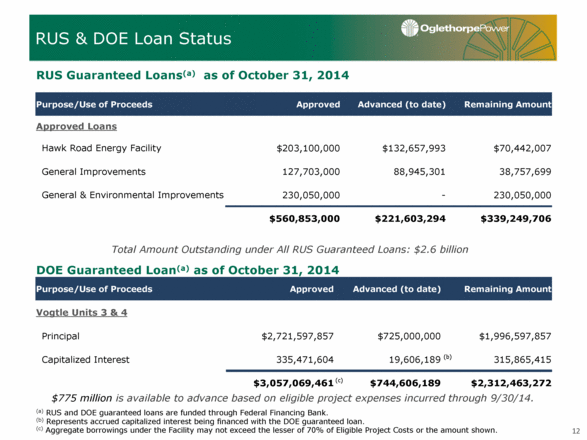
RUS & DOE Loan Status Total Amount Outstanding under All RUS Guaranteed Loans: $2.6 billion Purpose/Use of Proceeds Approved Advanced (to date) Remaining Amount Approved Loans Hawk Road Energy Facility $203,100,000 $132,657,993 $70,442,007 General Improvements 127,703,000 88,945,301 38,757,699 General & Environmental Improvements 230,050,000 - 230,050,000 $560,853,000 $221,603,294 $339,249,706 12 Purpose/Use of Proceeds Approved Advanced (to date) Remaining Amount Vogtle Units 3 & 4 Principal $2,721,597,857 $725,000,000 $1,996,597,857 Capitalized Interest 335,471,604 19,606,189 (b) 315,865,415 $3,057,069,461 (c) $744,606,189 $2,312,463,272 (a) RUS and DOE guaranteed loans are funded through Federal Financing Bank. (b) Represents accrued capitalized interest being financed with the DOE guaranteed loan. (c) Aggregate borrowings under the Facility may not exceed the lesser of 70% of Eligible Project Costs or the amount shown. RUS Guaranteed Loans(a) as of October 31, 2014 DOE Guaranteed Loan(a) as of October 31, 2014 $775 million is available to advance based on eligible project expenses incurred through 9/30/14. |
|
|
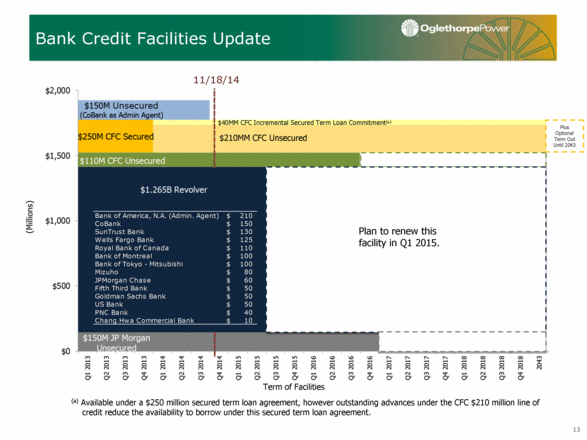
Bank Credit Facilities Update 13 Plus Optional Term Out Until 2043 $210MM CFC Unsecured $40MM CFC Incremental Secured Term Loan Commitment(a) 11/18/14 (a) Available under a $250 million secured term loan agreement, however outstanding advances under the CFC $210 million line of credit reduce the availability to borrow under this secured term loan agreement. Term of Facilities Plan to renew this facility in Q1 2015. Bank of America, N.A. (Admin. Agent) 210 $ CoBank 150 $ SunTrust Bank 130 $ Wells Fargo Bank 125 $ Royal Bank of Canada 110 $ Bank of Montreal 100 $ Bank of Tokyo - Mitsubishi 100 $ Mizuho 80 $ JPMorgan Chase 60 $ Fifth Third Bank 50 $ Goldman Sachs Bank 50 $ US Bank 50 $ PNC Bank 40 $ Chang Hwa Commercial Bank 10 $ |
|
|
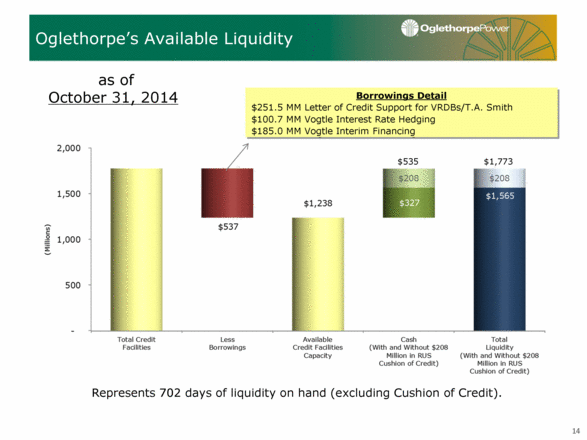
Oglethorpe’s Available Liquidity as of October 31, 2014 Borrowings Detail $251.5 MM Letter of Credit Support for VRDBs/T.A. Smith $100.7 MM Vogtle Interest Rate Hedging $185.0 MM Vogtle Interim Financing Represents 702 days of liquidity on hand (excluding Cushion of Credit). 14 $535 $1,773 |
|
|
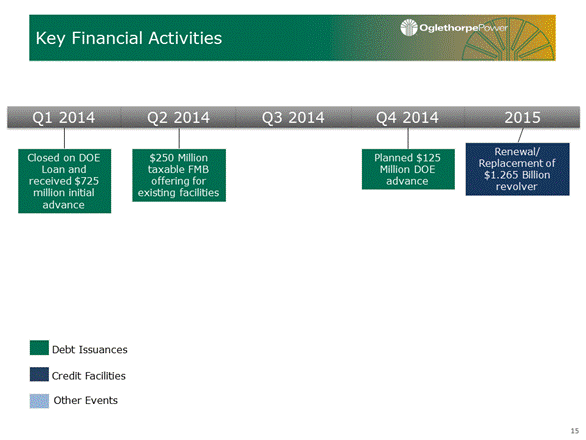
Key Financial Activities Credit Facilities Debt Issuances Other Events Q1 2014 Q4 2014 Q2 2014 Q3 2014 Closed on DOE Loan and received $725 million initial advance 2015 Renewal/ Replacement of $1.265 Billion revolver 15 $250 Million taxable FMB offering for existing facilities Planned $125 Million DOE advance |
|
|
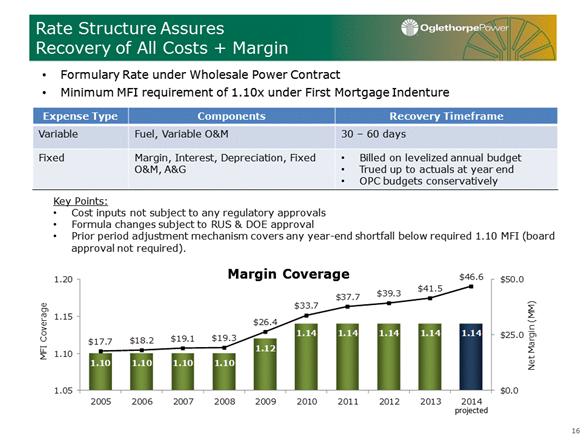
Rate Structure Assures Recovery of All Costs + Margin Formulary Rate under Wholesale Power Contract Minimum MFI requirement of 1.10x under First Mortgage Indenture Expense Type Components Recovery Timeframe Variable Fuel, Variable O&M 30 – 60 days Fixed Margin, Interest, Depreciation, Fixed O&M, A&G Billed on levelized annual budget Trued up to actuals at year end OPC budgets conservatively Key Points: Cost inputs not subject to any regulatory approvals Formula changes subject to RUS & DOE approval Prior period adjustment mechanism covers any year-end shortfall below required 1.10 MFI (board approval not required). Margin Coverage projected 16 1.10 1.10 1.10 1.10 1.12 1.14 1.14 1.14 1.14 1.14 $17.7 $18.2 $19.1 $19.3 $26.4 $33.7 $37.7 $39.3 $41.5 $46.6 $0.0 $25.0 $50.0 1.05 1.10 1.15 1.20 2005 2006 2007 2008 2009 2010 2011 2012 2013 2014 Net Margin (MM) MFI Coverage |
|
|
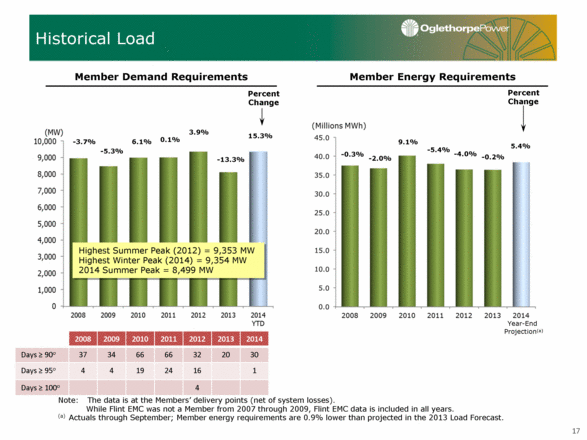
Note: The data is at the Members’ delivery points (net of system losses). While Flint EMC was not a Member from 2007 through 2009, Flint EMC data is included in all years. (a) Actuals through September; Member energy requirements are 0.9% lower than projected in the 2013 Load Forecast. Historical Load Member Demand Requirements Member Energy Requirements Percent Change Percent Change 6.1% -13.3% 15.3% 5.4% -0.2% -0.3% -3.7% -5.3% Highest Summer Peak (2012) = 9,353 MW Highest Winter Peak (2014) = 9,354 MW 2014 Summer Peak = 8,499 MW -2.0% 9.1% 0.1% -5.4% 3.9% -4.0% Year-End Projection(a) 2008 2009 2010 2011 2012 2013 2014 Days > 90o 37 34 66 66 32 20 30 Days > 95o 4 4 19 24 16 1 Days > 100o 4 17 |
|
|
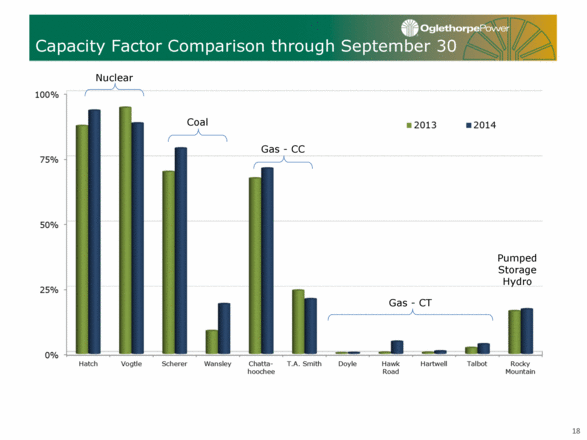
Capacity Factor Comparison through September 30 Nuclear Coal Gas - CC Gas - CT Pumped Storage Hydro 18 |
|
|
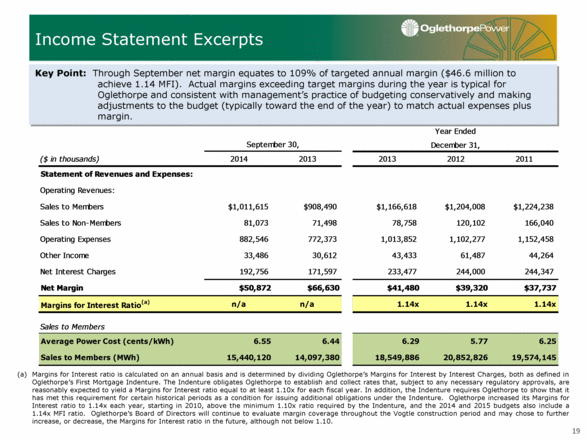
Income Statement Excerpts Margins for Interest ratio is calculated on an annual basis and is determined by dividing Oglethorpe’s Margins for Interest by Interest Charges, both as defined in Oglethorpe’s First Mortgage Indenture. The Indenture obligates Oglethorpe to establish and collect rates that, subject to any necessary regulatory approvals, are reasonably expected to yield a Margins for Interest ratio equal to at least 1.10x for each fiscal year. In addition, the Indenture requires Oglethorpe to show that it has met this requirement for certain historical periods as a condition for issuing additional obligations under the Indenture. Oglethorpe increased its Margins for Interest ratio to 1.14x each year, starting in 2010, above the minimum 1.10x ratio required by the Indenture, and the 2014 and 2015 budgets also include a 1.14x MFI ratio. Oglethorpe’s Board of Directors will continue to evaluate margin coverage throughout the Vogtle construction period and may chose to further increase, or decrease, the Margins for Interest ratio in the future, although not below 1.10. Key Point: Through September net margin equates to 109% of targeted annual margin ($46.6 million to achieve 1.14 MFI). Actual margins exceeding target margins during the year is typical for Oglethorpe and consistent with management’s practice of budgeting conservatively and making adjustments to the budget (typically toward the end of the year) to match actual expenses plus margin. 19 December 31, ($ in thousands) 2014 2013 2013 2012 2011 Statement of Revenues and Expenses: Operating Revenues: Sales to Members $1,011,615 $908,490 $1,166,618 $1,204,008 $1,224,238 Sales to Non-Members 81,073 71,498 78,758 120,102 166,040 Operating Expenses 882,546 772,373 1,013,852 1,102,277 1,152,458 Other Income 33,486 30,612 43,433 61,487 44,264 Net Interest Charges 192,756 171,597 233,477 244,000 244,347 Net Margin $50,872 $66,630 $41,480 $39,320 $37,737 Margins for Interest Ratio (a) n/a n/a 1.14x 1.14x 1.14x Sales to Members Average Power Cost (cents/kWh) 6.55 6.44 6.29 5.77 6.25 Sales to Members (MWh) 15,440,120 14,097,380 18,549,886 20,852,826 19,574,145 Year Ended September 30, |
|
|
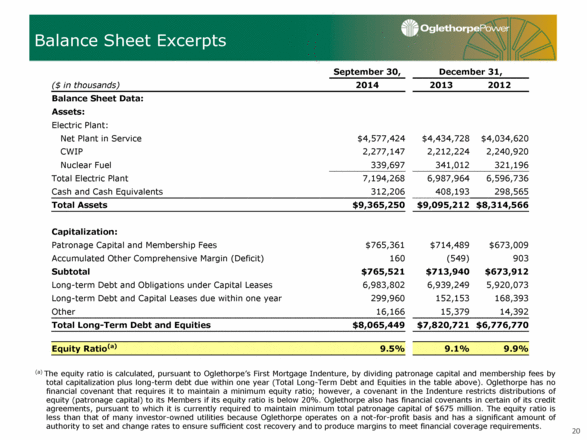
Balance Sheet Excerpts (a) The equity ratio is calculated, pursuant to Oglethorpe’s First Mortgage Indenture, by dividing patronage capital and membership fees by total capitalization plus long-term debt due within one year (Total Long-Term Debt and Equities in the table above). Oglethorpe has no financial covenant that requires it to maintain a minimum equity ratio; however, a covenant in the Indenture restricts distributions of equity (patronage capital) to its Members if its equity ratio is below 20%. Oglethorpe also has financial covenants in certain of its credit agreements, pursuant to which it is currently required to maintain minimum total patronage capital of $675 million. The equity ratio is less than that of many investor-owned utilities because Oglethorpe operates on a not-for-profit basis and has a significant amount of authority to set and change rates to ensure sufficient cost recovery and to produce margins to meet financial coverage requirements. 20 September 30, December 31, ($ in thousands) 2014 2013 2012 Balance Sheet Data: Assets: Electric Plant: Net Plant in Service $4,577,424 $4,434,728 $4,034,620 CWIP 2,277,147 2,212,224 2,240,920 Nuclear Fuel 339,697 341,012 321,196 Total Electric Plant 7,194,268 6,987,964 6,596,736 Cash and Cash Equivalents 312,206 408,193 298,565 Total Assets $9,365,250 $9,095,212 $8,314,566 Capitalization: Patronage Capital and Membership Fees $765,361 $714,489 $673,009 Accumulated Other Comprehensive Margin (Deficit) 160 (549) 903 Subtotal $765,521 $713,940 $673,912 Long-term Debt and Obligations under Capital Leases 6,983,802 6,939,249 5,920,073 Long-term Debt and Capital Leases due within one year 299,960 152,153 168,393 Other 16,166 15,379 14,392 Total Long-Term Debt and Equities $8,065,449 $7,820,721 $6,776,770 Equity Ratio(a) 9.5% 9.1% 9.9% |
|
|
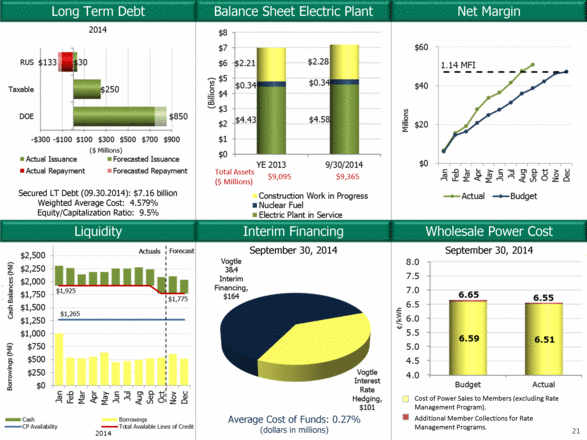
Liquidity Net Margin Wholesale Power Cost Interim Financing Long Term Debt Balance Sheet Electric Plant Average Cost of Funds: 0.27% (dollars in millions) Secured LT Debt (09.30.2014): $7.16 billion Weighted Average Cost: 4.579% Equity/Capitalization Ratio: 9.5% 2014 1.14 MFI September 30, 2014 2014 21 Cost of Power Sales to Members (excluding Rate Management Program). Additional Member Collections for Rate Management Programs. September 30, 2014 |
|
|
A link to this presentation will be posted on Oglethorpe’s website www.opc.com. Oglethorpe’s SEC filings, including its annual reports on Form 10-K, quarterly reports on Form 10-Q, current reports on Form 8-K are made available on its website. (Exhibits to Oglethorpe’s SEC filings are available on EDGAR but not on its website.) Member information is filed as an exhibit to Form 10-Q for the first quarter of each year. For additional information please contact: Additional Information 22 Name Title Email Address Phone Number Betsy Higgins Executive Vice President and Chief Financial Officer betsy.higgins@opc.com 770-270-7168 Tom Brendiar Director, Bank and Investor Relations tom.brendiar@opc.com 770-270-7173 Joe Rick Director, Capital Markets joe.rick@opc.com 770-270-7240 |

