Attached files
| file | filename |
|---|---|
| 8-K - 8-K - MIDDLEFIELD BANC CORP | d822366d8k.htm |
 Thomas G. Caldwell
President and CEO
Donald L. Stacy
Treasurer and CFO
Exhibit 99.1
Middlefield Banc Corp.
Investor Presentation
November 2014 |
 Forward Looking Statements
This presentation contains forward-looking statements within the
meaning of the Securities Exchange Act of 1934 and the Private
Securities Litigation Reform Act of 1995 concerning Middlefield
Banc Corp.’s plans, strategies, objectives, expectations, intentions,
financial condition and results of operations. These
forward-looking statements reflect management’s current
views and intentions and are subject to known and unknown risks,
uncertainties, assumptions and other factors that could cause the
actual results to differ materially from those contemplated by
the statements. The significant risks and uncertainties
related to Middlefield Banc Corp. of which management is aware are
discussed in detail in the periodic reports that Middlefield Banc Corp.
files with the Securities and Exchange Commission (the
“SEC”), including in the “Risk Factors”
section
of its Annual Report on Form 10-K and its Quarterly Report on Form
10-Q. Investors are urged to review Middlefield Banc
Corp.’s periodic reports, which are available at no charge
through the SEC’s website at www.sec.gov
and through Middlefield Banc Corp.’s
website at www.middlefieldbank.com
on the “Investor Relations”
page. Middlefield Banc
Corp. assumes no obligation to update any of these forward-looking
statements to reflect a change in its views or events or
circumstances that occur after the date of this presentation.
2 |
 Middlefield Banc Corp.
For over 100 years, Middlefield Banc
Corp. has supported its communities
by offering customers superior
financial products, exceptional
service, and modern banking
amenities
Company Snapshot
(1)(2)
NASDAQ:
MBCN
Stock Price:
$33.26
Market Cap:
$68.1 million
Dividend (yield):
$1.04 (3.1%)
Headquarters:
Middlefield, Ohio
Established:
Bank 1901/HC 1988
Branches:
10
Total Assets:
$680.3 million
Net Loans
$460.9 million
Total Deposits:
$600.0 million
(1)
Stock price, market cap and dividend yield as of October 31, 2014
(2)
Financial figures for the period ended September 30, 2014
3 |
 Rankings and Awards
4
Sources:
(1)
SNL June 16, 2014
Disproving the naysayers, some banks under $1B thrive
By Kiah Lau Haslett and Marshall Schraibman
(2)
Independent Banker
http://independentbanker.org/2014/05/community-banks-with-assets-of-more-than-500-million-to-1-billion/
(3)
American Banker April 28, 2014
http://www.americanbanker.com/magazine/124_04/rising-tide-our-ranking-of-the-top-200-community-banks-1066820-1.html
SNL Financial
(1)
According to a June 16, 2014 article from SNL Financial, Middlefield
Banc Corp. had the 10
th
highest ROAE out of public community banks
with under $1 billion in assets.
American Banker
(3)
Middlefield Banc Corp. was ranked 63
rd
out of the top 200 community
banks and thrifts by 3-year Avg. ROE according to an April 28,
2014 American Banker article.
Independent Banker
(2)
According to May 30, 2014 study from Independent Banker,
Middlefield Banc Corp. had the 21
st
highest ROE of community banks
with assets of $500 million to $1 billion
|
 Growing Banking Franchise
Profitable throughout the economic cycle and
never reported a quarterly loss
History of quarterly cash dividend payments
and maintained dividend amount during
recession
Excellent asset quality, strong liquidity
profile, and robust core deposit base
Strong Return on Average Equity
Expanded into Central Ohio with the April
2007 acquisition of Emerald Bank
Acquired Westerville branch in November
2008
Consolidated Emerald Bank into The
Middlefield Banking Company on
January 20, 2014
5 |
 Middlefield Overview
6
Middlefield Banc Corp. is a community banking leader with
strong brand recognition in its markets
Favorable distribution network: 10 branches in five counties,
serving two distinct Ohio market areas
Northeastern Ohio market consists principally of:
–
Geauga County
–
Trumbull County
–
Ashtabula County
–
Portage County
Two central Ohio branches are located in Dublin and Westerville
in Franklin County, north of Columbus.
Cleveland MSA and Columbus MSA have a combined population of more than
4.0 million people
Opportunities to “fill in”
gap between two operating geographies
According to FDIC statistics, Ohio insured financial institutions have
declined 25% from 304 institutions in 2003 to 227 at the end of
2013 In
terms
of
deposits,
out
of
249
banks
in
the
State
of
Ohio
Middlefield
was
the
33
rd
largest
bank in the state at June 30, 2014 |
 Middlefield Serves Two Distinct Ohio Markets with Strong Demographics
Northeast Ohio
Northern Columbus
8 banking locations
Geauga County is 3
rd
in median
household income
(1)
out of 88 Ohio
counties
Geauga County is the center of the 4
th
largest Amish population in the world
–
This demographic provides a strong
borrowing and stable deposit base
Marcellus and Utica Shale opportunities
Improvements in manufacturing
2 banking locations
Columbus is the state capital and largest
city in Ohio
Franklin County is 2
nd
in population in
Ohio
Delaware County, immediately north of
Franklin, has the 2
nd
highest median
household income in Ohio
At June 30, 2014, 5 of the 34 banks in
Franklin County controlled 85% of total
deposits.
8 of the bank's 10 offices (and nearly 85% of deposits) are located in
counties that have stronger demographics than the State average
median household income, median value, value of
owner-occupied housing, and employment rates 7
(1) According to:
www.usa.com/rank/ohio-state--median-household-income--county-rank.htm?hl=Geauga&hlst=OH&yr=6000
|
 Corporate Infrastructure and Experienced Management to Support Growth
Middlefield’s success is driven by a strong leadership team
dedicated to creating value for shareholders, while providing the
highest quality financial products and services within the
communities the Company serves
Experienced Management
2014 Investments in Infrastructure
Average tenure of 8 executive officers:
–
At MBCN is over 14 years
–
Within industry is over 25 years
Thomas Caldwell, CEO serves on the
Federal Delegate Board of the
Independent Community Bankers of
America, having been elected in June
2010. Mr. Caldwell previously served as
Chairman of the Community Bankers
Association of Ohio.
Sales-orientation culture
Community focused culture
Focused on expanding technology
–
Launched new website
–
Enhanced on-line banking
–
Developed mobile banking
capabilities
Hired Chief Information Officer and
Chief Credit Officer
Centralized operations center to a new
20,000 sq. foot facility
8 |
 9
Personal Banking
Personal Banking
Products and Services
Strong brand recognition in core markets
–
#1 Market Share in Geauga County
–
#6 Market Share in Portage County
–
#3 overall within the primary
northeastern Ohio market
Focused on growth
–
Improved on-line banking offerings
–
Residential mortgage products
–
De novo expansion and strategic
acquisitions
Customers trust Middlefield Banc Corp. to be there for them in
day-to-day money management as well as for those milestone
events in their financial lives |
 10
Market Share
Ashtabula, Geauga, Portage & Trumbull Counties
June 30, 2014
Rank
Institution
Branches
Deposits in
Market ($000)
Market
Share
1
Huntington National Bank
38
1,532,821
20.60
2
JP Morgan Chase
19
894,279
12.02
3
The Middlefield Banking Co.
8
528,765
7.11
4
KeyBank
15
522,389
7.02
5
PNC Bank
11
506,911
6.81
6
Talmer Bank and Trust
9
464,660
6.24
7
Cortland Savings & Banking
10
385,484
5.18
8
First Merit Bank
12
347,397
4.67
Total for institutions in market
190
7,441,520
Franklin County
June 30, 2014
Rank
Institution
Branches
Deposits in
Market ($000)
Market
Share
1
Huntington National Bank
68
14,035,079
31.14
2
JP Morgan Chase
53
10,503,465
23.30
3
PNC Bank
42
5,130,794
11.38
4
Nationwide Bank
2
4,415,679
9.80
5
Fifth Third Bank
47
4,145,568
9.20
25
The Middlefield Banking Co.
2
61,079
0.14
26
Vinton County National Bank
1
57,354
0.13
27
First City Bank
1
44,764
0.10
Total for institutions in market
344
45,074,325
Strong Market Share in
Northeastern Ohio Market
Opportunities To Increase
Market Share in Central Ohio
Source: FDIC |
 11
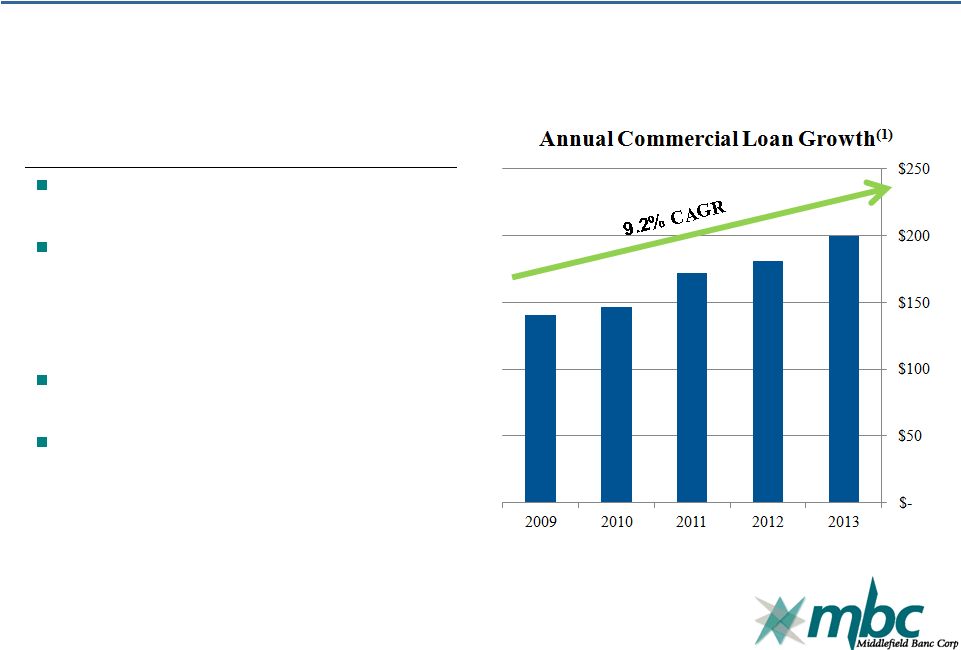
Commercial Banking
Commercial Banking
Products and Services
$208.4 million in commercial loans at
September 30, 2014
Enhanced commercial banking leadership
team in 2014 by adding:
–
Chief Credit Officer
–
SVP –
Commercial Lending
Expertise in niche commercial loan
products
Growth objectives include:
–
Branch expansions
–
Selective acquisitions
–
Increase market share
For over 100 years, Middlefield Banc Corp. has been helping businesses
grow (1) Dollars in millions |
 History of Strong Financial Results
ROAA
0.36%
0.41%
0.65%
0.95%
1.06%
ROAE
4.90%
6.44%
10.24%
11.98%
13.17%
Return on Average Assets
Return on Average Equity
Managed cost of funding to increase net
interest margin
Anticipate continued pressure on margin
levels due to:
–
Higher regulatory costs
–
Continued low rate environment
–
Investments to support growth
Opportunities to offset margin pressures
and increase profitability by improvements
in fee based income
Nine Months Ended
September 30,
2014
2013
ROAA
(1)
1.06%
1.05%
ROAE
(1)
12.74%
12.74%
(1)
Annualized
Annual Return on Average Assets and Equity
12 |
 2014 Third Quarter Highlights
2014 third quarter highlights include:
(on a year-over-year basis unless noted)
Net interest income increased 1.1% to $5.9 million.
Noninterest income grew 22.5% to $1.0 million.
Net income up 2.8% to $1.9 million, or $0.93 per
diluted share.
Tangible stockholders’
equity improved 4.3% from
2014 second quarter, and 16.6% from December 31,
2013.
Total net loans increased 12.1%.
Nonperforming assets declined to $13.1 million from
$16.3 million.
Tier 1 capital ratio strengthened to 9.50% from 8.70%.
Throughout 2014 Middlefield will be making investments in its business by
enhancing the company’s operations, products, and services,
and adding senior managers to assist with
its growth objectives
13
Net Income
Total Noninterest Income
Net Interest Income
(1) Dollars in thousands |
 Stable and Growing Loan Portfolio
Net loans at September 30, 2014 were
$460.9 million, up from $411.2 million in
the same period last year
Loan policy goal is to achieve a
composition mix of:
–
40 –
50% residential real estate loans
–
35 –
45% commercial loans
–
5 –
15% consumer loans
–
5% credit card accounts
Adding secondary mortgage market will
enhance residential product
–
Especially in Columbus market
No national or sub-prime lending
Lending within market area
Participation loans with banks that have
similar credit quality standards and
cultures
Loan Portfolio at September 30, 2014
14
(1) Dollars in millions |
 Excellent Asset Quality
Dollars in thousands
2011
2012
2013
Q314
Q313
Nonperforming Loans
$24,546
$14,224
$12,290
$10,438
$13,608
Real Estate Owned
2,196
1,846
2,698
2,674
2,719
Nonperforming Assets (NPAs)
$26,742
$16,070
$14,988
$13,112
$16,327
NPAs/Total Assets (%)
4.09%
2.40%
2.32%
1.93%
2.48%
Allowance for Loan Losses
$6,819
$7,779
$7,046
$7,288
$7,821
Allowance/Total Loans (%)
1.70%
1.90%
1.62%
1.56%
1.87%
Net Charge-off Ratio –
Annualized (%)
0.65%
0.30%
0.22%
(0.08)%
0.08%
Strong reserve coverage provides flexibility in managing potential losses
with reduced impact on net income
Problem assets peaked in 2011,
primarily driven by non-owner
occupied 1 -
4 family in Central
Ohio market
Net charge-offs returned to
normalized levels in 2012
15 |
 Supplemental Information
16 |
 Strong Capital Levels
Capital Levels at September 30, 2014
Middlefield Banc Corp.
(Dollars in thousands)
Amount
Ratio
Total Capital (to Risk-weighted Assets)
Actual
$
69,449
13.93%
For Capital Adequacy Purposes
39,874
8.00
To Be Well Capitalized
49,843
10.00
Tier I Capital (to Risk-weighted Assets)
Actual
$
63,206
12.68%
For Capital Adequacy Purposes
19,937
4.00
To Be Well Capitalized
29,906
6.00
Tier I Capital (to Average Assets)
Actual
$
63,206
9.50%
For Capital Adequacy Purposes
26,610
4.00
To Be Well Capitalized
33,262
5.00
17 |
 Quarterly and Nine-Month Financial Summary
For the Three Months Ended
September 30,
For the Nine Months Ended
September 30,
Dollars in thousands
2014
2013
2014
2013
Net interest income
5,912
5,846
17,754
17,021
Provision for loan losses
70
153
370
766
Noninterest income
990
808
2,562
2,495
Noninterest expense
4,385
4,115
13,212
12,064
Income before income taxes
2,447
2,386
6,734
6,686
Income taxes
529
521
1,442
1,479
Net income
1,918
1,865
5,292
5,207
Net interest margin
3.99%
4.05%
4.08%
4.03%
Total assets
680,262
658,141
Loans outstanding, net
460,920
411,239
Deposits
600,020
579,222
Equity capital
61,515
52,529
Earnings per share
0.93
0.92
2.59
2.58
Cash dividend (per share)
0.26
0.26
0.78
0.78
Dividend pay-out ratio
27.58%
27.99%
30.01%
30.13%
Return on average assets
1.13%
1.12%
1.06%
1.05%
Return on average equity
13.55%
13.66%
12.74%
12.74%
18 |
 Annual Financial Summary
Dollars in thousands
2009
2010
2011
2012
2013
Net interest income
14,268
18,149
21,075
22,299
22,928
Provision for loan losses
2,578
3,580
3,085
2,168
196
Noninterest income
2,668
2,623
2,237
3,451
3,145
Noninterest expense
12,650
14,763
15,501
15,639
16,870
Income before income taxes
1,708
2,429
4,726
7,943
9,007
Income taxes
(73)
(88)
596
1,662
1,979
Net income
1,781
2,517
4,130
6,281
7,028
Net interest margin
3.30%
3.41%
3.65%
3.74%
3.85%
Total assets
558,658
632,197
654,551
670,288
647,090
Loans outstanding, net
348,660
366,277
395,061
400,654
428,679
Deposits
487,106
565,251
580,962
593,335
568,836
Equity capital
36,707
38,022
47,253
55,437
53,473
Earnings per share
1.15
1.60
2.45
3.29
3.49
Cash dividend (per share)
1.04
1.04
1.04
1.04
1.04
Dividend pay-out ratio
90.28%
65.04%
42.71%
31.87%
29.14%
Return on average assets
0.36%
0.41%
0.65%
0.95%
1.06%
Return on average equity
4.90%
6.44%
10.24%
11.98%
13.17%
19 |