Attached files
| file | filename |
|---|---|
| 8-K - 8-K - VECTREN UTILITY HOLDINGS INC | a8-kxinvestorpresentationx.htm |
| EX-99.2 - EXHIBIT 99.2 - VECTREN UTILITY HOLDINGS INC | exhibit992forwardlookingin.htm |

Vectren Corporation Investor Presentation November 18-19, 2014 Hosted by: U.S. Capital Advisors Boston, MA & New York, NY
2 Forward-Looking Statements All statements other than statements of historical fact are forward-looking statements made in good faith by the company and are intended to qualify for the safe harbor from liability established by the Private Securities Litigation Reform Act of 1995. Such statements are based on management’s beliefs, as well as assumptions made by and information currently available to management and include such words as “believe”, “anticipate”, ”endeavor”, “estimate”, “expect”, “objective”, “projection”, “forecast”, “goal”, “likely”, and similar expressions intended to identify forward-looking statements. Vectren cautions readers that the assumptions forming the basis for forward-looking statements include many factors that are beyond Vectren’s ability to control or estimate precisely and actual results could differ materially from those contained in this document. Forward-looking statements speak only as of the date on which our statement is made, and we assume no duty to update them. More detailed information about these factors is set forth in Vectren’s filings with the Securities and Exchange Commission, including Vectren’s 2013 annual report on Form 10-K filed on February 20, 2014. Robert L. Goocher, Treasurer and VP – Investor Relations rgoocher@vectren.com 812-491-4080
3 Management Representatives Carl Chapman – Chairman, President and CEO Susan Hardwick – Senior VP and CFO Robert Goocher – Treasurer and VP - Investor Relations
4 Agenda Business Review – 2015 and Beyond • Consolidated • Utility • Nonutility • 2015 EPS Guidance Dec. 1, 2014 Dividend Increase & Growth Outlook Q3/YTD 2014 Review
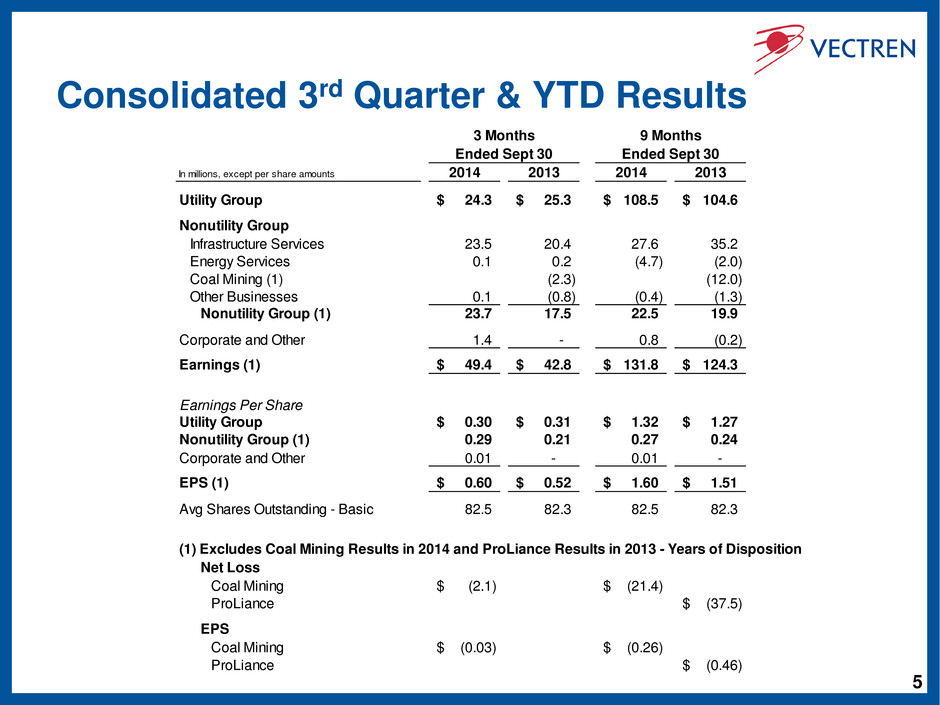
5 Consolidated 3rd Quarter & YTD Results In millions, except per share amounts 2014 2013 2014 2013 Utility Group 24.3$ 25.3$ 108.5$ 104.6$ Nonutility Group Infrastructure Services 23.5 20.4 27.6 35.2 Energy Services 0.1 0.2 (4.7) (2.0) Coal Mining (1) (2.3) (12.0) Other Businesses 0.1 (0.8) (0.4) (1.3) Nonutility Group (1) 23.7 17.5 22.5 19.9 Corporate and Other 1.4 - 0.8 (0.2) Earnings (1) 49.4$ 42.8$ 131.8$ 124.3$ Earnings Per Share Utility Group 0.30$ 0.31$ 1.32$ 1.27$ Nonutility Group (1) 0.29 0.21 0.27 0.24 Corporate and Other 0.01 - 0.01 - EPS (1) 0.60$ 0.52$ 1.60$ 1.51$ Avg Shares Outstanding - Basic 82.5 82.3 82.5 82.3 (1) Excludes Coal Mining Results in 2014 and ProLiance Results in 2013 - Years of Disposition Net Loss Coal Mining (2.1)$ (21.4)$ ProLiance (37.5)$ EPS Coal Mining (0.03)$ (0.26)$ ProLiance (0.46)$ Ended Sept 30 Ended Sept 30 3 Months 9 Months
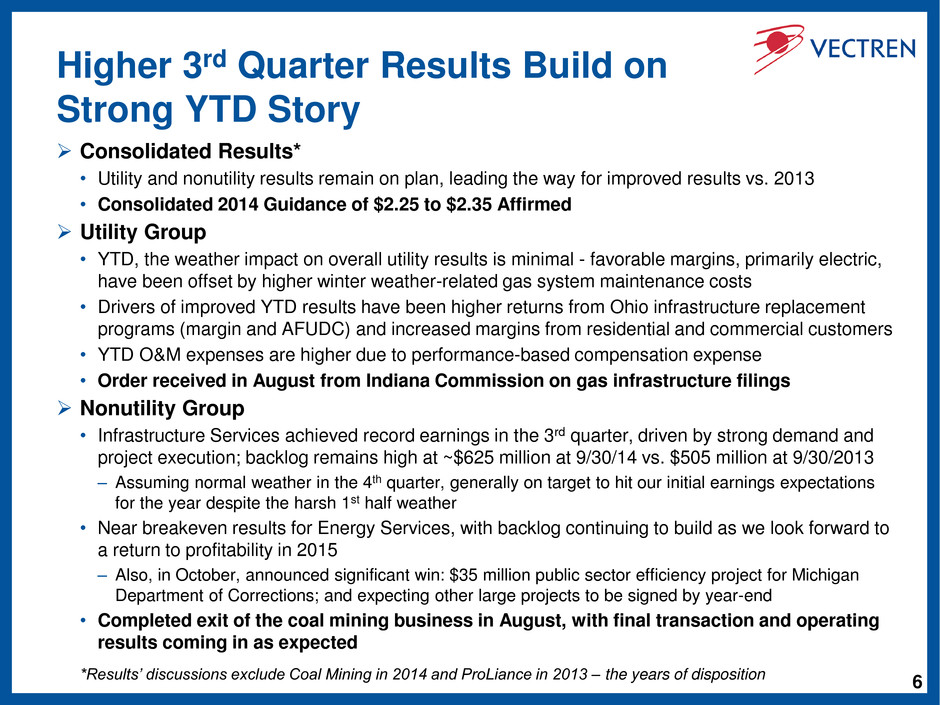
6 Higher 3rd Quarter Results Build on Strong YTD Story Consolidated Results* • Utility and nonutility results remain on plan, leading the way for improved results vs. 2013 • Consolidated 2014 Guidance of $2.25 to $2.35 Affirmed Utility Group • YTD, the weather impact on overall utility results is minimal - favorable margins, primarily electric, have been offset by higher winter weather-related gas system maintenance costs • Drivers of improved YTD results have been higher returns from Ohio infrastructure replacement programs (margin and AFUDC) and increased margins from residential and commercial customers • YTD O&M expenses are higher due to performance-based compensation expense • Order received in August from Indiana Commission on gas infrastructure filings Nonutility Group • Infrastructure Services achieved record earnings in the 3rd quarter, driven by strong demand and project execution; backlog remains high at ~$625 million at 9/30/14 vs. $505 million at 9/30/2013 – Assuming normal weather in the 4th quarter, generally on target to hit our initial earnings expectations for the year despite the harsh 1st half weather • Near breakeven results for Energy Services, with backlog continuing to build as we look forward to a return to profitability in 2015 – Also, in October, announced significant win: $35 million public sector efficiency project for Michigan Department of Corrections; and expecting other large projects to be signed by year-end • Completed exit of the coal mining business in August, with final transaction and operating results coming in as expected *Results’ discussions exclude Coal Mining in 2014 and ProLiance in 2013 – the years of disposition
7 Agenda Business Review – 2015 and Beyond • Consolidated • Utility • Nonutility • 2015 EPS Guidance Dec. 1, 2014 Dividend Increase & Growth Outlook Q3/YTD 2014 Review
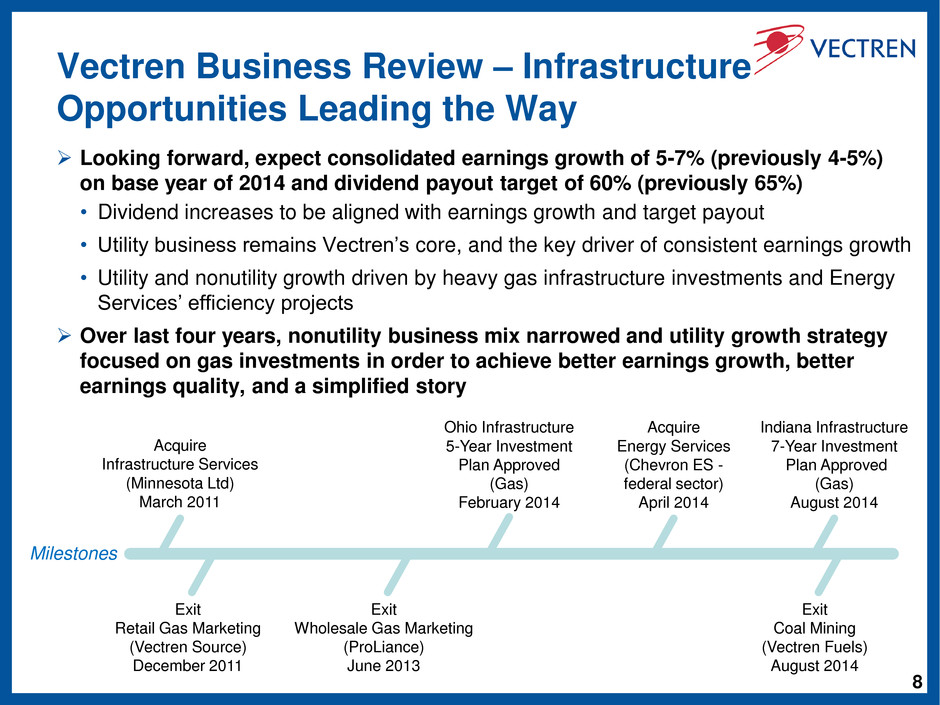
8 Vectren Business Review – Infrastructure Opportunities Leading the Way Looking forward, expect consolidated earnings growth of 5-7% (previously 4-5%) on base year of 2014 and dividend payout target of 60% (previously 65%) • Dividend increases to be aligned with earnings growth and target payout • Utility business remains Vectren’s core, and the key driver of consistent earnings growth • Utility and nonutility growth driven by heavy gas infrastructure investments and Energy Services’ efficiency projects Over last four years, nonutility business mix narrowed and utility growth strategy focused on gas investments in order to achieve better earnings growth, better earnings quality, and a simplified story Acquire Infrastructure Services (Minnesota Ltd) March 2011 Milestones Acquire Energy Services (Chevron ES - federal sector) April 2014 Exit Retail Gas Marketing (Vectren Source) December 2011 Exit Wholesale Gas Marketing (ProLiance) June 2013 Exit Coal Mining (Vectren Fuels) August 2014 Indiana Infrastructure 7-Year Investment Plan Approved (Gas) August 2014 Ohio Infrastructure 5-Year Investment Plan Approved (Gas) February 2014
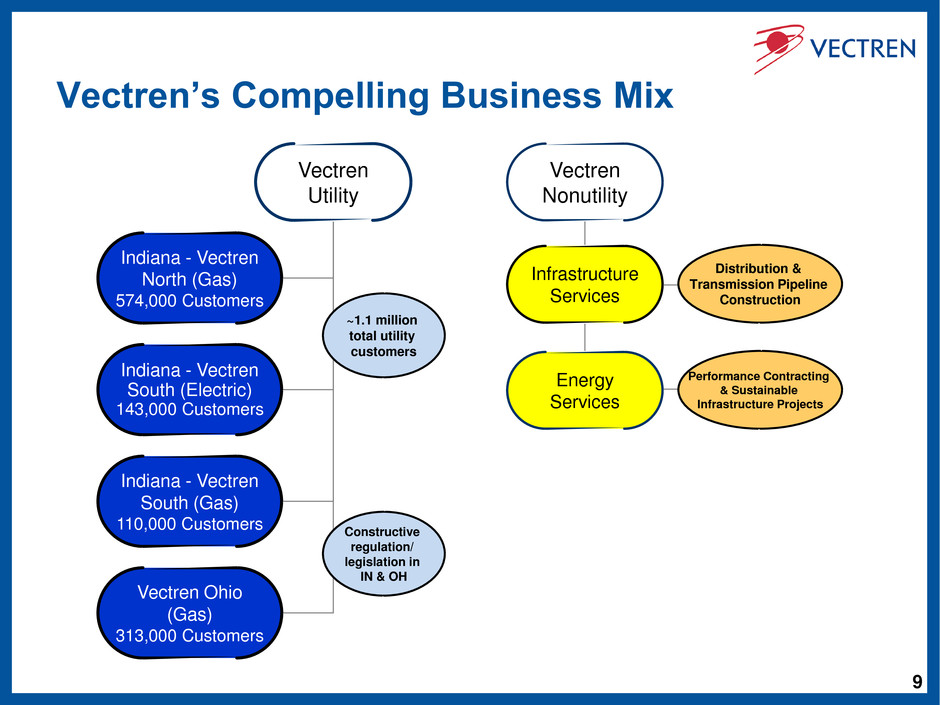
9 Vectren’s Compelling Business Mix Vectren Nonutility Infrastructure Services Energy Services Vectren Utility Indiana - Vectren North (Gas) 574,000 Customers Indiana - Vectren South (Electric) 143,000 Customers Indiana - Vectren South (Gas) 110,000 Customers Vectren Ohio (Gas) 313,000 Customers ~1.1 million total utility customers Constructive regulation/ legislation in IN & OH Distribution & Transmission Pipeline Construction Performance Contracting & Sustainable Infrastructure Projects
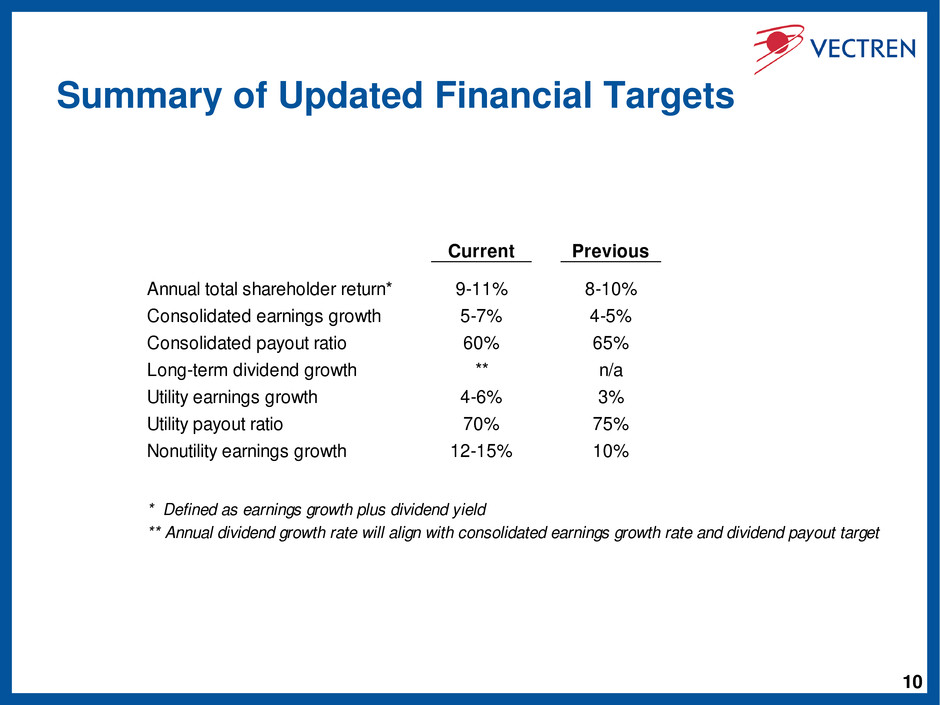
10 Summary of Updated Financial Targets Current Previous Annual total shareholder return* 9-11% 8-10% Consolidated earnings growth 5-7% 4-5% Consolidated payout ratio 60% 65% Long-term dividend growth ** n/a Utility earnings growth 4-6% 3% Utility payout ratio 70% 75% Nonutility earnings growth 12-15% 10% * Defined as earnings growth plus dividend yield ** Annual dividend growth rate will align with consolidated earnings growth rate and dividend payout target
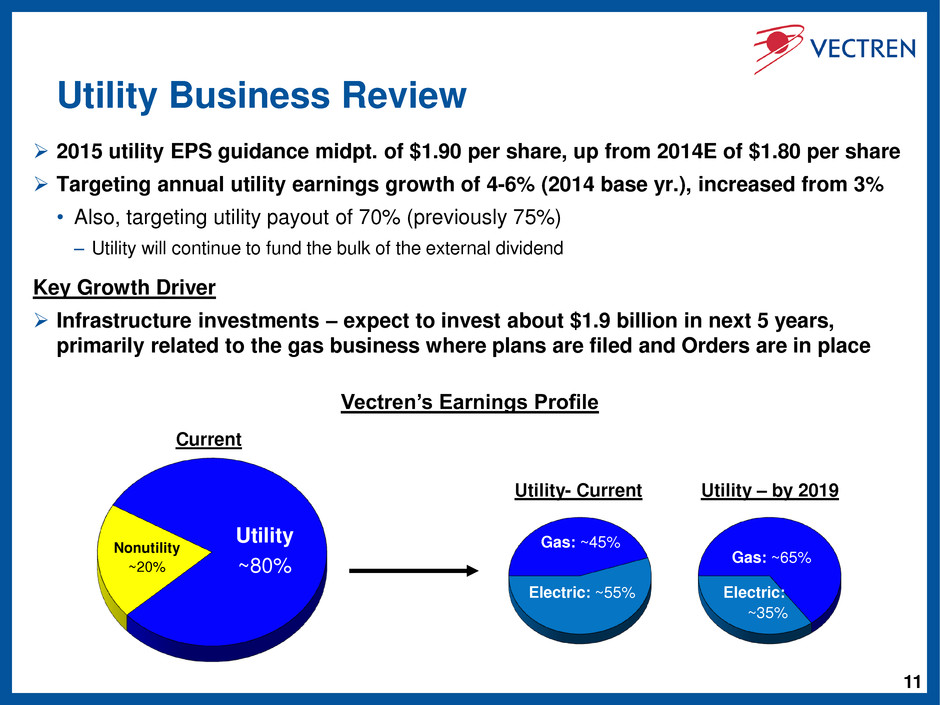
11 Utility Business Review 2015 utility EPS guidance midpt. of $1.90 per share, up from 2014E of $1.80 per share Targeting annual utility earnings growth of 4-6% (2014 base yr.), increased from 3% • Also, targeting utility payout of 70% (previously 75%) – Utility will continue to fund the bulk of the external dividend Key Growth Driver Infrastructure investments – expect to invest about $1.9 billion in next 5 years, primarily related to the gas business where plans are filed and Orders are in place Utility ~80% Nonutility ~20% Electric: ~55% Gas: ~45% Utility- Current Electric: ~35% Gas: ~65% Utility – by 2019 Vectren’s Earnings Profile Current
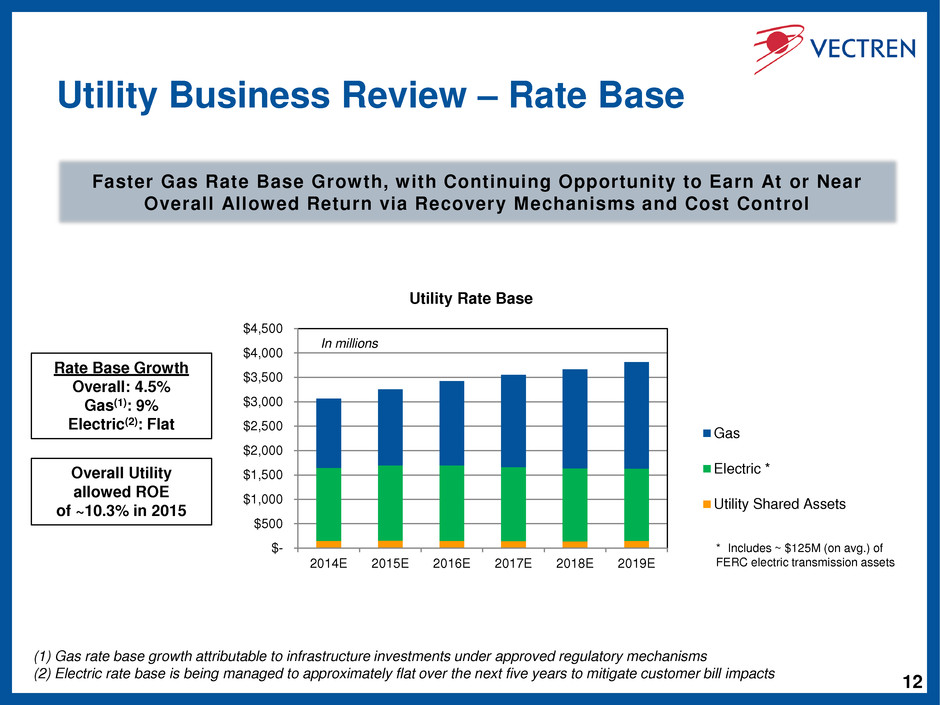
12 Utility Business Review – Rate Base Faster Gas Rate Base Growth, with Continuing Opportunity to Earn At or Near Overall Allowed Return via Recovery Mechanisms and Cost Control Rate Base Growth Overall: 4.5% Gas(1): 9% Electric(2): Flat $- $500 $1,000 $1,500 $2,000 $2,500 $3,000 $3,500 $4,000 $4,500 2014E 2015E 2016E 2017E 2018E 2019E Utility Rate Base Gas Electric * Utility Shared Assets In millions * Includes ~ $125M (on avg.) of FERC electric transmission assets Overall Utility allowed ROE of ~10.3% in 2015 (1) Gas rate base growth attributable to infrastructure investments under approved regulatory mechanisms (2) Electric rate base is being managed to approximately flat over the next five years to mitigate customer bill impacts
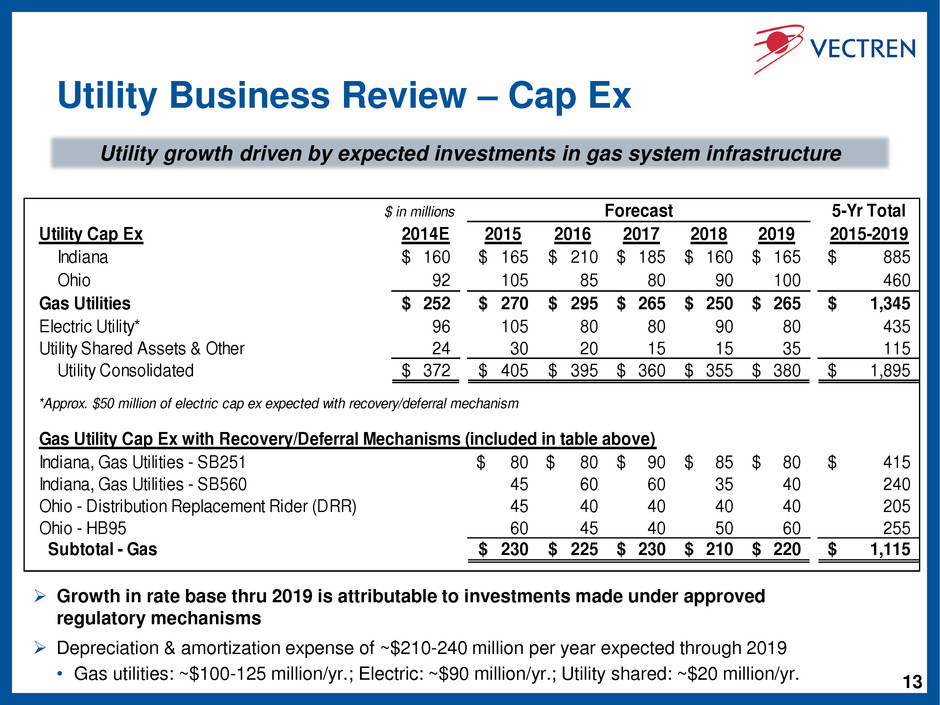
13 Utility Business Review – Cap Ex Growth in rate base thru 2019 is attributable to investments made under approved regulatory mechanisms Depreciation & amortization expense of ~$210-240 million per year expected through 2019 • Gas utilities: ~$100-125 million/yr.; Electric: ~$90 million/yr.; Utility shared: ~$20 million/yr. Utility growth driven by expected investments in gas system infrastructure $ in millions 5-Yr Total Utility Cap Ex 2014E 2015 2016 2017 2018 2019 2015-2019 Indiana 160$ 165$ 210$ 185$ 160$ 165$ 885$ Ohio 92 105 85 80 90 100 460 Gas Utilities 252$ 270$ 295$ 265$ 250$ 265$ 1,345$ Electric Utility* 96 105 80 80 90 80 435 Utility Shared Assets & Other 24 30 20 15 15 35 115 Utility Consolidated 372$ 405$ 395$ 360$ 355$ 380$ 1,895$ *Approx. $50 million of electric cap ex expected with recovery/deferral mechanism Gas Utility Cap Ex with Recovery/Deferral Mechanisms (included in table above) Indiana, Gas Utilities - SB251 80$ 80$ 90$ 85$ 80$ 415$ Indiana, Gas Utilities - SB560 45 60 60 35 40 240 Ohio - Distribution Replacement Rider (DRR) 45 40 40 40 40 205 Ohio - HB95 60 45 40 50 60 255 Subtotal - Gas 230$ 225$ 230$ 210$ 220$ 1,115$ Forecast
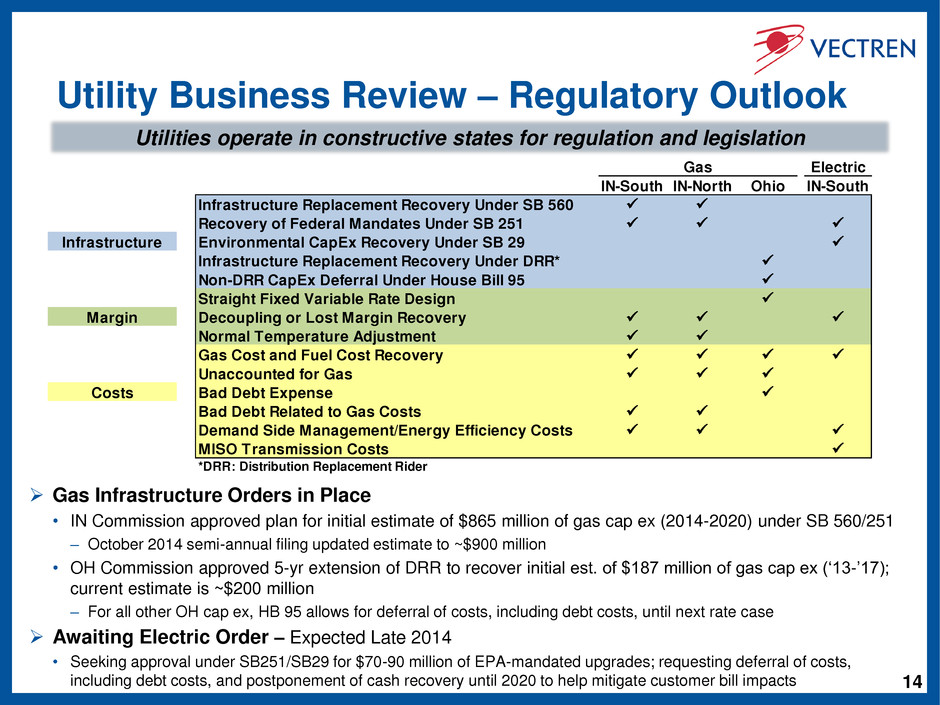
14 Utility Business Review – Regulatory Outlook Gas Infrastructure Orders in Place • IN Commission approved plan for initial estimate of $865 million of gas cap ex (2014-2020) under SB 560/251 – October 2014 semi-annual filing updated estimate to ~$900 million • OH Commission approved 5-yr extension of DRR to recover initial est. of $187 million of gas cap ex (‘13-’17); current estimate is ~$200 million – For all other OH cap ex, HB 95 allows for deferral of costs, including debt costs, until next rate case Awaiting Electric Order – Expected Late 2014 • Seeking approval under SB251/SB29 for $70-90 million of EPA-mandated upgrades; requesting deferral of costs, including debt costs, and postponement of cash recovery until 2020 to help mitigate customer bill impacts Utilities operate in constructive states for regulation and legislation Electric IN-South IN-North Ohio IN-South Infrastructure Replacement Recovery Under SB 560 Recovery of Federal Mandates Under SB 251 Infrastructure Environmental CapEx Recovery Under SB 29 Infrastructure Replacement Recovery Under DRR* Non-DRR CapEx Deferral Under House Bill 95 Straight Fixed Variable Rate Design Margin Decoupling or Lost Margin Recovery Normal Temperature Adjustment Gas Cost and Fuel Cost Recovery Unaccounted for Gas Costs Bad Debt Expense Bad Debt Related to Gas Costs Demand Side Management/Energy Efficiency Costs MISO Transmission Costs *DRR: Distribution Replacement Rider Gas
15 Utility Business Review – Strategies/Goals Execute investment & cost control strategies to achieve utility earnings growth target • Gas system infrastructure replacement to drive consistent earnings growth, while enhancing reliability and public safety – Growth in rate base funded with significant internal cash flow generation; incremental external debt financing and available cash flow from nonutility businesses to cover the remainder of the spend ▪ No planned public equity offerings • Earn allowed return overall (~10.3% in 2015) – Earn current returns on large percentage of new infrastructure investments as provided in IN & OH legislation/regulation – Full gas and partial electric utility lost margin recovery mechanisms in place in all territories – Aggressively manage costs through performance management & strategic sourcing
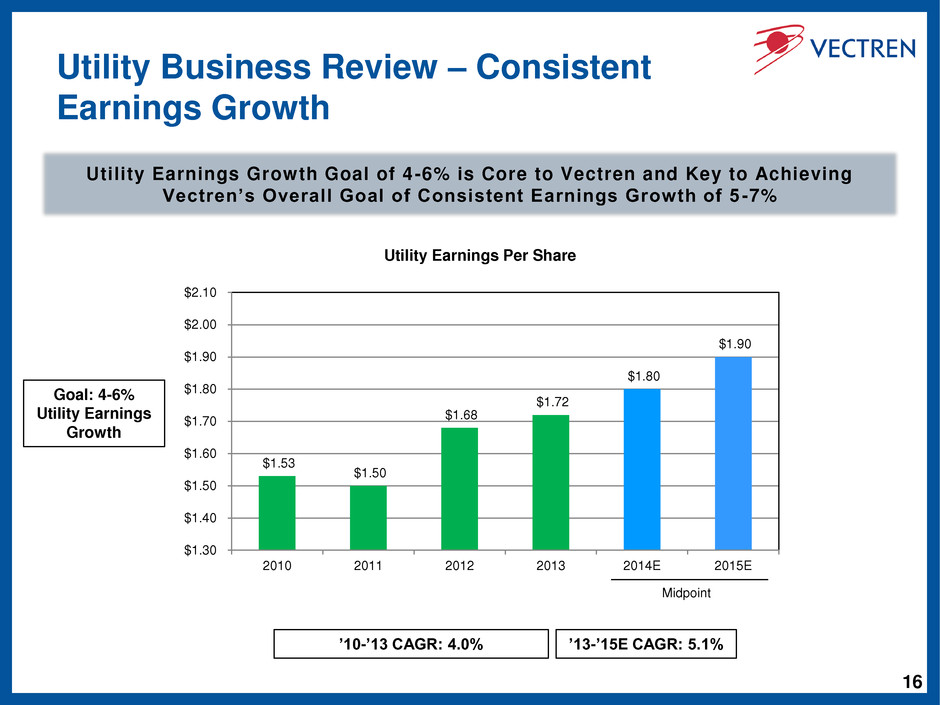
16 Utility Business Review – Consistent Earnings Growth Utility Earnings Growth Goal of 4-6% is Core to Vectren and Key to Achieving Vectren’s Overall Goal of Consistent Earnings Growth of 5 -7% $1.53 $1.50 $1.68 $1.72 $1.80 $1.90 $1.30 $1.40 $1.50 $1.60 $1.70 $1.80 $1.90 $2.00 $2.10 2010 2011 2012 2013 2014E 2015E Utility Earnings Per Share Midpoint ’10-’13 CAGR: 4.0% ’13-’15E CAGR: 5.1% Goal: 4-6% Utility Earnings Growth
17 Nonutility Business Review 2015 EPS Guidance Midpoint of $0.60 per share, up from 2014E of $0.50 per share, excluding Coal Mining results Targeting nonutility earnings growth of 12-15% (2014 base yr.), increased from 10% • Expect Infrastructure Services to contribute EPS of approx. $0.57 per share in 2015 (guidance midpoint) and growing $0.05-0.07 per share thereafter • Expect Energy Services to contribute EPS of approx. $0.03 per share in 2015 (guidance midpoint) and growing $0.03-0.05 per share thereafter Growth Strategy With commodity business divestitures and key acquisitions completed from 2011-2014, organic growth now expected to be the principal driver of overall annual earnings growth
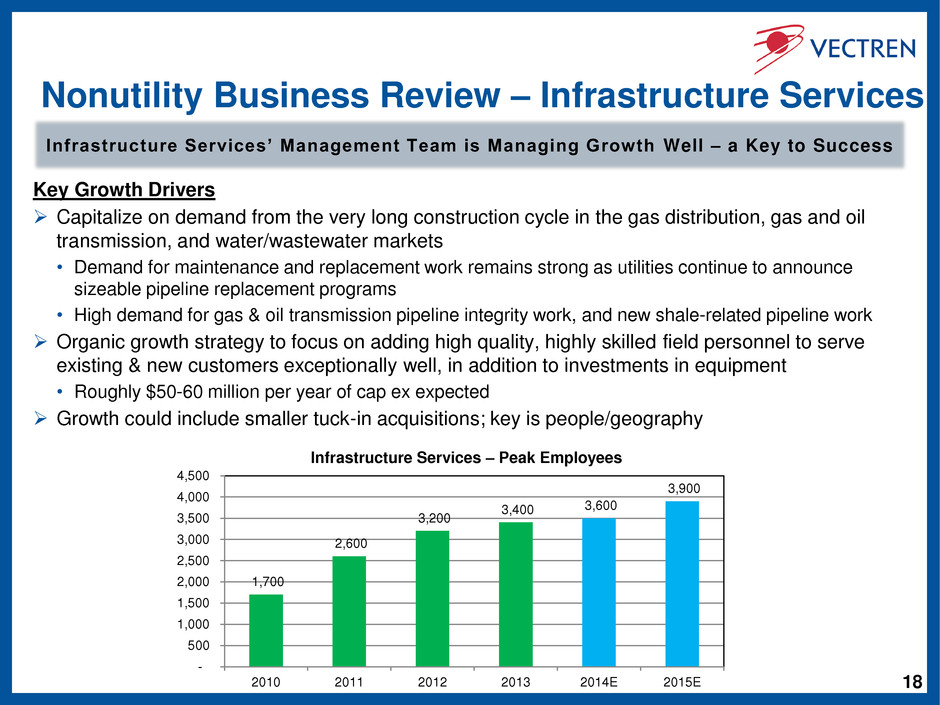
18 Nonutility Business Review – Infrastructure Services Infrastructure Services’ Management Team is Managing Growth Well – a Key to Success 1,700 2,600 3,200 3,400 3,600 3,900 - 500 1,000 1,500 2,000 2,500 3,000 3,500 4,000 4,500 2010 2011 2012 2013 2014E 2015E Infrastructure Services – Peak Employees Key Growth Drivers Capitalize on demand from the very long construction cycle in the gas distribution, gas and oil transmission, and water/wastewater markets • Demand for maintenance and replacement work remains strong as utilities continue to announce sizeable pipeline replacement programs • High demand for gas & oil transmission pipeline integrity work, and new shale-related pipeline work Organic growth strategy to focus on adding high quality, highly skilled field personnel to serve existing & new customers exceptionally well, in addition to investments in equipment • Roughly $50-60 million per year of cap ex expected Growth could include smaller tuck-in acquisitions; key is people/geography
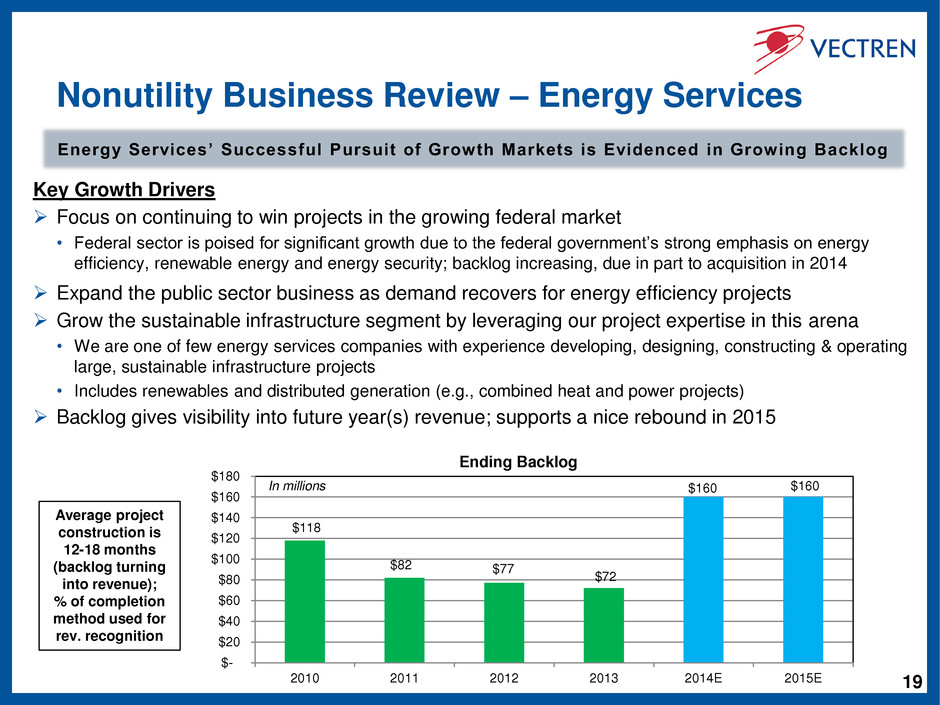
19 Nonutility Business Review – Energy Services Energy Services’ Successful Pursuit of Growth Markets is Evidenced in Growing Backlog $118 $82 $77 $72 $160 $160 $- $20 $40 $60 $80 $100 $120 $140 $160 $180 2010 2011 2012 2013 2014E 2015E Ending Backlog In millions Key Growth Drivers Focus on continuing to win projects in the growing federal market • Federal sector is poised for significant growth due to the federal government’s strong emphasis on energy efficiency, renewable energy and energy security; backlog increasing, due in part to acquisition in 2014 Expand the public sector business as demand recovers for energy efficiency projects Grow the sustainable infrastructure segment by leveraging our project expertise in this arena • We are one of few energy services companies with experience developing, designing, constructing & operating large, sustainable infrastructure projects • Includes renewables and distributed generation (e.g., combined heat and power projects) Backlog gives visibility into future year(s) revenue; supports a nice rebound in 2015 Average project construction is 12-18 months (backlog turning into revenue); % of completion method used for rev. recognition
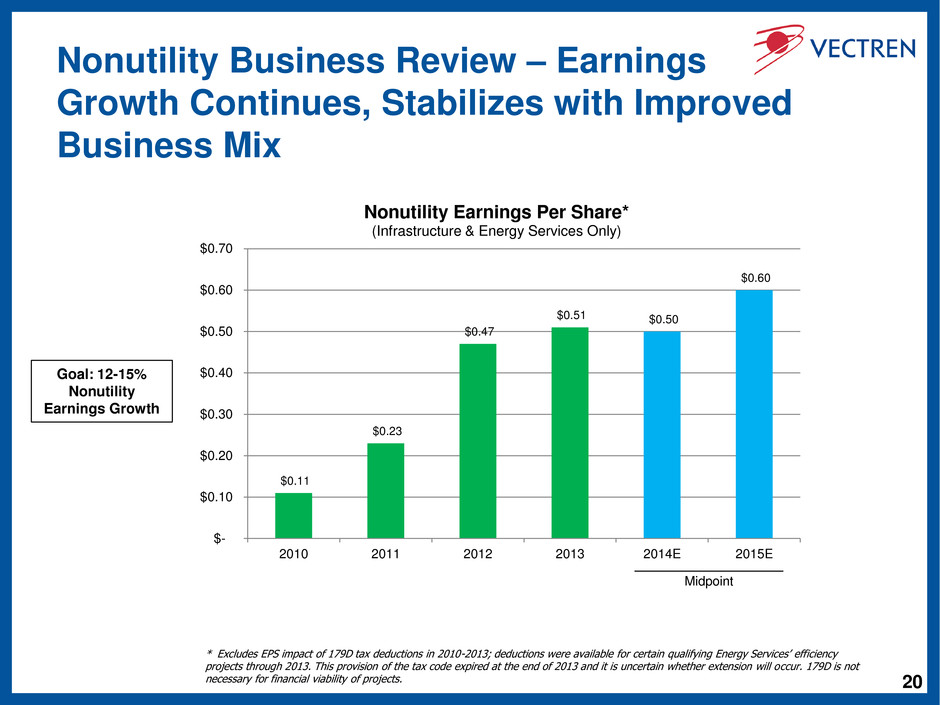
20 Nonutility Business Review – Earnings Growth Continues, Stabilizes with Improved Business Mix Goal: 12-15% Nonutility Earnings Growth $0.11 $0.23 $0.47 $0.51 $0.50 $0.60 $- $0.10 $0.20 $0.30 $0.40 $0.50 $0.60 $0.70 2010 2011 2012 2013 2014E 2015E Nonutility Earnings Per Share* (Infrastructure & Energy Services Only) Midpoint * Excludes EPS impact of 179D tax deductions in 2010-2013; deductions were available for certain qualifying Energy Services’ efficiency projects through 2013. This provision of the tax code expired at the end of 2013 and it is uncertain whether extension will occur. 179D is not necessary for financial viability of projects.
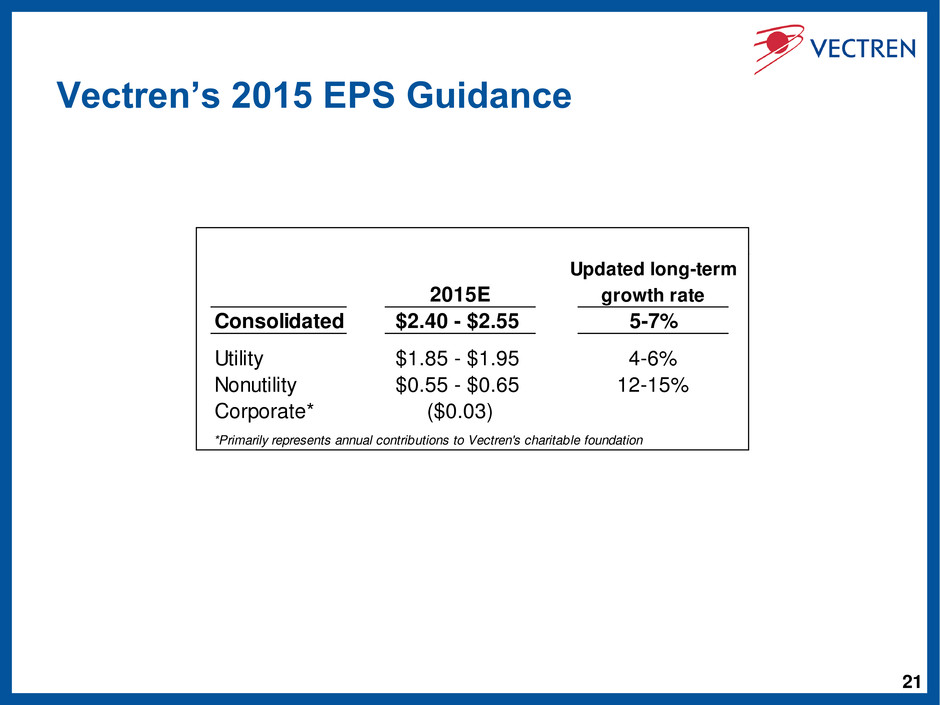
21 Vectren’s 2015 EPS Guidance Updated long-term 2015E growth rate Consolidated $2.40 - $2.55 5-7% Utility $1.85 - $1.95 4-6% Nonutility $0.55 - $0.65 12-15% Corporate* ($0.03) *Primarily represents annual contributions to Vectren's charitable foundation
22 Agenda Business Review – 2015 and Beyond • Consolidated • Utility • Nonutility • 2015 EPS Guidance Dec. 1, 2014 Dividend Increase & Growth Outlook Q3/YTD 2014 Review
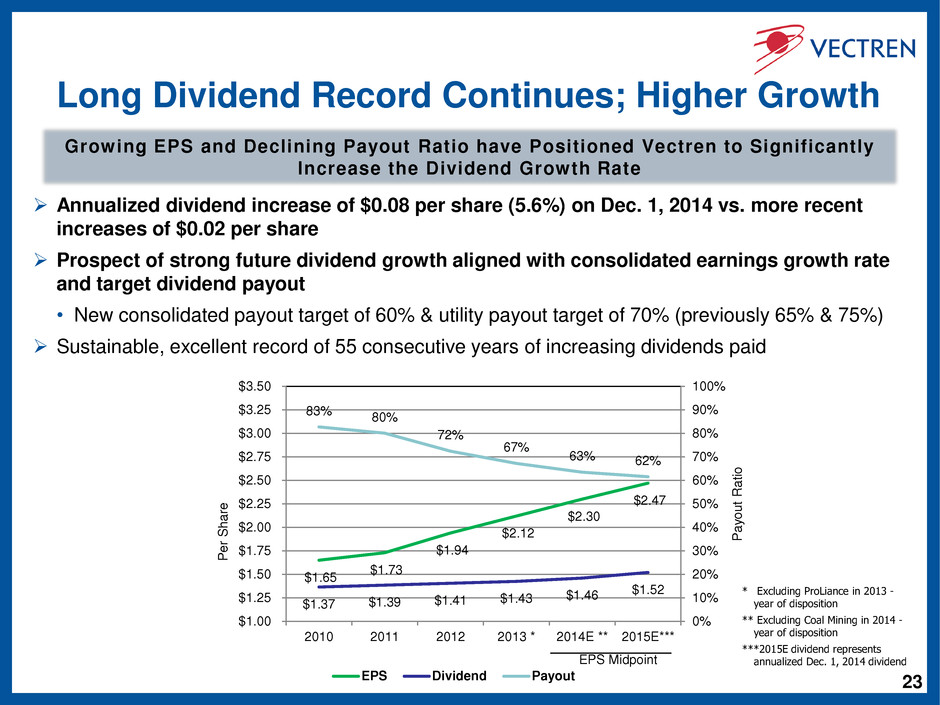
23 Long Dividend Record Continues; Higher Growth Growing EPS and Declining Payout Ratio have Positioned Vectren to Significantly Increase the Dividend Growth Rate * Excluding ProLiance in 2013 - year of disposition ** Excluding Coal Mining in 2014 - year of disposition ***2015E dividend represents annualized Dec. 1, 2014 dividend Annualized dividend increase of $0.08 per share (5.6%) on Dec. 1, 2014 vs. more recent increases of $0.02 per share Prospect of strong future dividend growth aligned with consolidated earnings growth rate and target dividend payout • New consolidated payout target of 60% & utility payout target of 70% (previously 65% & 75%) Sustainable, excellent record of 55 consecutive years of increasing dividends paid $1.65 $1.73 $1.94 $2.12 $2.30 $2.47 $1.37 $1.39 $1.41 $1.43 $1.46 $1.52 83% 80% 72% 67% 63% 62% 0% 10% 20% 30% 40% 50% 60% 70% 80% 90% 100% $1.00 $1.25 $1.50 $1.75 $2.00 $2.25 $2.50 $2.75 $3.00 $3.25 $3.50 2010 2011 2012 2013 * 2014E ** 2015E*** P a yo u t Rat io P er S h a re EPS Dividend Payout EPS Midpoint
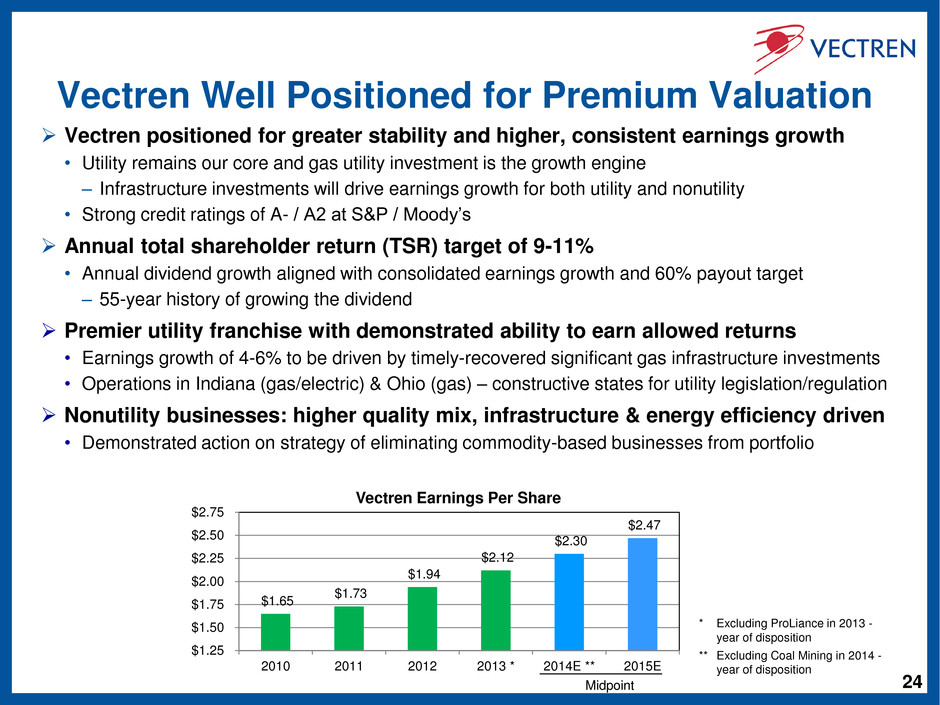
24 Vectren Well Positioned for Premium Valuation Vectren positioned for greater stability and higher, consistent earnings growth • Utility remains our core and gas utility investment is the growth engine – Infrastructure investments will drive earnings growth for both utility and nonutility • Strong credit ratings of A- / A2 at S&P / Moody’s Annual total shareholder return (TSR) target of 9-11% • Annual dividend growth aligned with consolidated earnings growth and 60% payout target – 55-year history of growing the dividend Premier utility franchise with demonstrated ability to earn allowed returns • Earnings growth of 4-6% to be driven by timely-recovered significant gas infrastructure investments • Operations in Indiana (gas/electric) & Ohio (gas) – constructive states for utility legislation/regulation Nonutility businesses: higher quality mix, infrastructure & energy efficiency driven • Demonstrated action on strategy of eliminating commodity-based businesses from portfolio $1.65 $1.73 $1.94 $2.12 $2.30 $2.47 $1.25 $1.50 $1.75 $2.00 $2.25 $2.50 $2.75 2010 2011 2012 2013 * 2014E ** 2015E Vectren Earnings Per Share Midpoint * Excluding ProLiance in 2013 - year of disposition ** Excluding Coal Mining in 2014 - year of disposition
Appendix
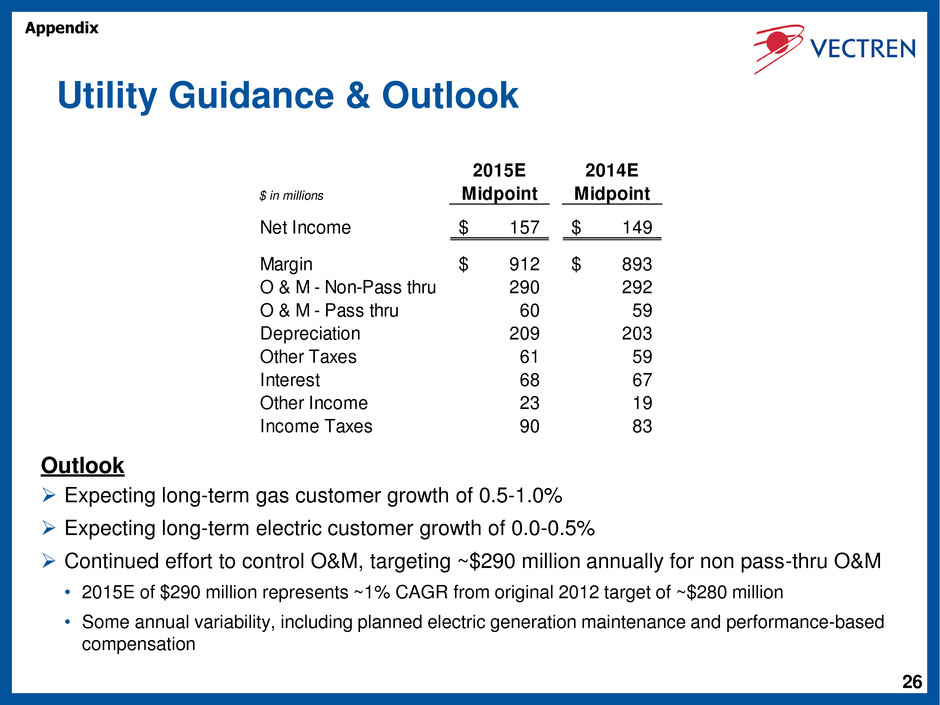
26 Utility Guidance & Outlook Outlook Expecting long-term gas customer growth of 0.5-1.0% Expecting long-term electric customer growth of 0.0-0.5% Continued effort to control O&M, targeting ~$290 million annually for non pass-thru O&M • 2015E of $290 million represents ~1% CAGR from original 2012 target of ~$280 million • Some annual variability, including planned electric generation maintenance and performance-based compensation 2015E 2014E $ in millions Midpoint Midpoint Net Income 157$ 149$ Margin 912$ 893$ O & M - Non-Pass thru 290 292 O & M - Pass thru 60 59 Depreciation 209 203 Other Taxes 61 59 Interest 68 67 Other Income 23 19 Income Taxes 90 83 Appendix
27 Utility – Background on Planned Infrastructure Investments Background • The Pipeline Safety Acts (PSA) of 2002 and 2006 established Transmission Integrity Management Program (TIMP) requirements and Distribution Integrity Management Program (DIMP) requirements – Includes assessment of transmission lines within high consequence areas, for example • Vectren’s current gas infrastructure investment plans are designed to address requirements specified under the PSA’s of 2002 and 2006, which will also allow us to meet the anticipated requirements for these assets under the most recent PSA of 2011 Vectren’s Gas Infrastructure Replacement Plans • Transmission Pipeline Infrastructure Replacement - investments to include hydrostatic testing, in-line inspection modifications (‘smart pigging’), installation of remotely-controlled valves, etc. • Distribution Pipeline Infrastructure Replacement - projects include inside meter move outs, obsolete equipment replacements, vintage and odd pipe replacements, etc. Vectren’s Bare Steel/Cast Iron Acceleration Plans • Filings reflect acceleration to ~135 miles annually – an approx. 10-year replacement plan Future • The federal regulator, PHMSA, has not yet finalized additional requirements specified in the PSA of 2011; Vectren’s infrastructure investment plans will be updated once those requirements are known Appendix
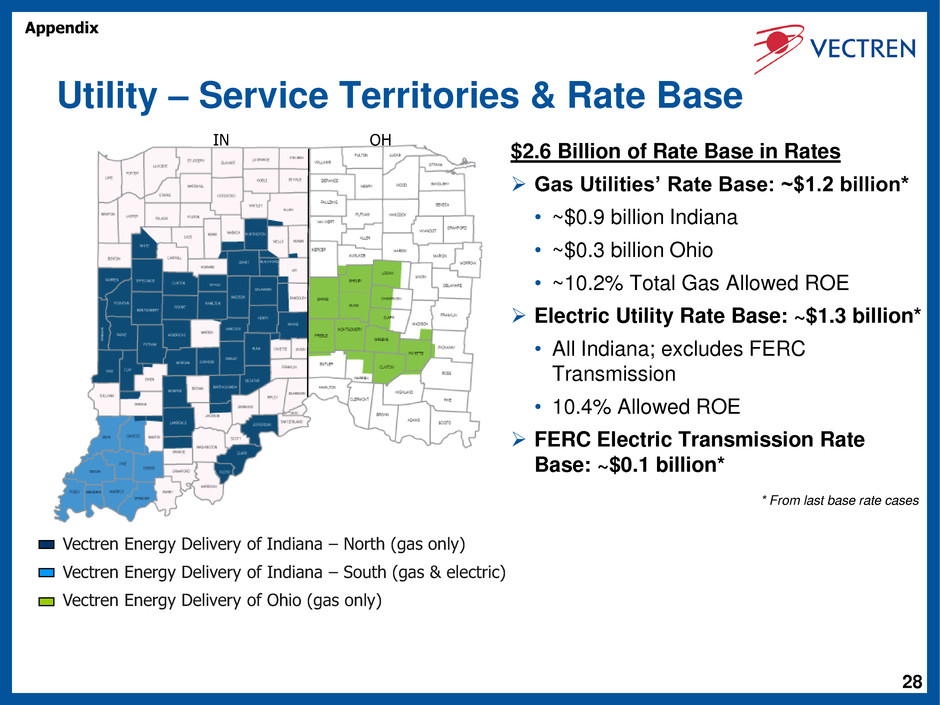
28 Vectren Energy Delivery of Indiana – North (gas only) Vectren Energy Delivery of Indiana – South (gas & electric) Vectren Energy Delivery of Ohio (gas only) Utility – Service Territories & Rate Base $2.6 Billion of Rate Base in Rates Gas Utilities’ Rate Base: ~$1.2 billion* • ~$0.9 billion Indiana • ~$0.3 billion Ohio • ~10.2% Total Gas Allowed ROE Electric Utility Rate Base: ~$1.3 billion* • All Indiana; excludes FERC Transmission • 10.4% Allowed ROE FERC Electric Transmission Rate Base: ~$0.1 billion* * From last base rate cases OH IN Appendix
29 Environmental Generation Portfolio - Profile Utility – Electric Generation Profile Over $410 million invested during last decade in emissions control equipment • Was tracked via Indiana Senate Bill 29 (return on/of CWIP investment) Well positioned to comply with EPA rules with no plant retirements • Per pending filing, expect to spend $70- 90 million related to EPA mandates, including MATS, and expect recovery under Indiana SB 251/SB 29 Voluntary clean energy standard in Indiana of 10% by 2025 • Includes energy efficiency 5 Coal-fired base units – 1,000 MW • 100% scrubbed for SO2 • 90% controlled for NOx • Substantial removal of mercury and particulate matter 6 Gas-fired peak-use turbines – 295 MW Renewable energy ~ 5% • Landfill gas generation facility - 3MW • Wind energy – up to 80 MW via ~20- year purchased power contracts Meeting reserve requirements – no new generation expected in near term Appendix
30 Utility Environmental Update EPA’s Clean Power Plan Issued June 2, 2014 • Vectren is fully engaged on the proposed plan; we are focused on protecting our customers (bill impacts) and on reducing carbon emissions as details of this rule evolve • Each state has been assigned a carbon intensity reduction goal; for Indiana, the goal is 20% • Each state must submit a plan in 2015 for approval in 2016 to meet the reduction goal – Litigation has been filed by the state of Indiana and other parties challenging the rules, which may, at a minimum, delay the timing of approval of the various state plans – However, Vectren is evaluating the reduction goal and our current emissions status ▪ Vectren’s actions over the last several years have helped reduce Vectren’s CO2 emission rate & significantly reduce Vectren’s tons of CO2 emitted (down 23% since 2005 on a tonnage basis) ▪ Vectren represents less than 6% of total annual Indiana emissions ▪ Vectren’s carbon intensity is nearly identical to Indiana average • The four building blocks defined by EPA that support the 20% reduction goal for carbon intensity for Indiana include: continuing to improve generation efficiency levels; dispatching natural-gas units more often; incorporating additional renewable energy; and implementing new state energy efficiency programs • Expect timely recovery under SB251 (federal mandates) or SB29 (clean coal) for any investments required to comply Appendix
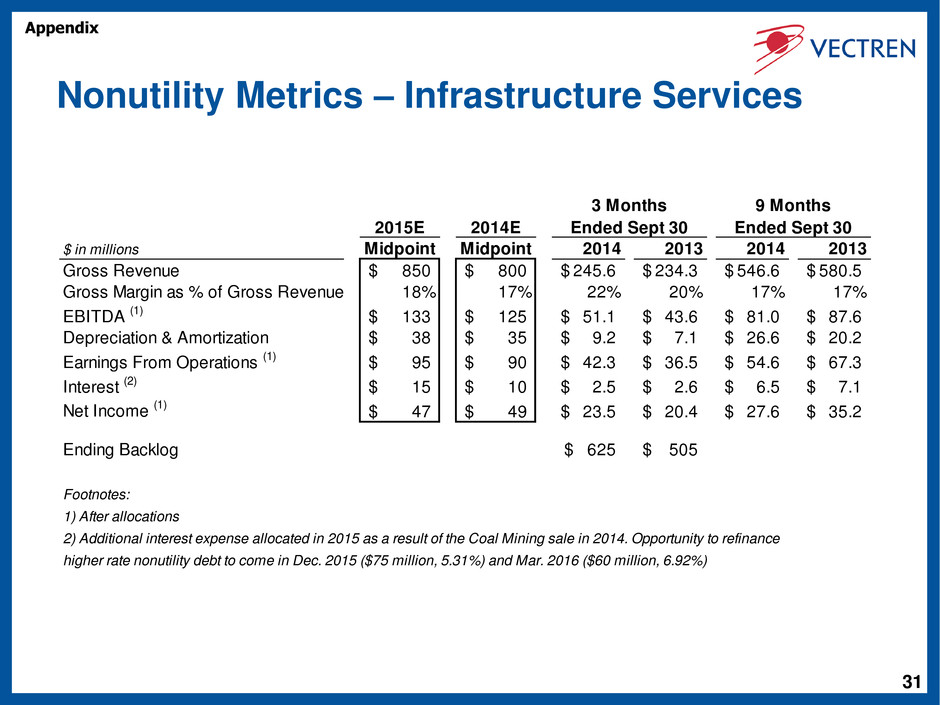
31 Nonutility Metrics – Infrastructure Services 2015E 2014E $ in millions Midpoint Midpoint 2014 2013 2014 2013 Gross Revenue 850$ 800$ 245.6$ 234.3$ 546.6$ 580.5$ Gross Margin as % of Gross Revenue 18% 17% 22% 20% 17% 17% EBITDA (1) 133$ 125$ 51.1$ 43.6$ 81.0$ 87.6$ Depreciation & Amortization 38$ 35$ 9.2$ 7.1$ 26.6$ 20.2$ Earnings From Operations (1) 95$ 90$ 42.3$ 36.5$ 54.6$ 67.3$ Interest (2) 15$ 10$ 2.5$ 2.6$ 6.5$ 7.1$ Net Income (1) 47$ 49$ 23.5$ 20.4$ 27.6$ 35.2$ Ending Backlog 625$ 505$ Footnotes: 1) After allocations 2) Additional interest expense allocated in 2015 as a result of the Coal Mining sale in 2014. Opportunity to refinance higher rate nonutility debt to come in Dec. 2015 ($75 million, 5.31%) and Mar. 2016 ($60 million, 6.92%) 3 Months Ended Sept 30 9 Months Ended Sept 30 Appendix
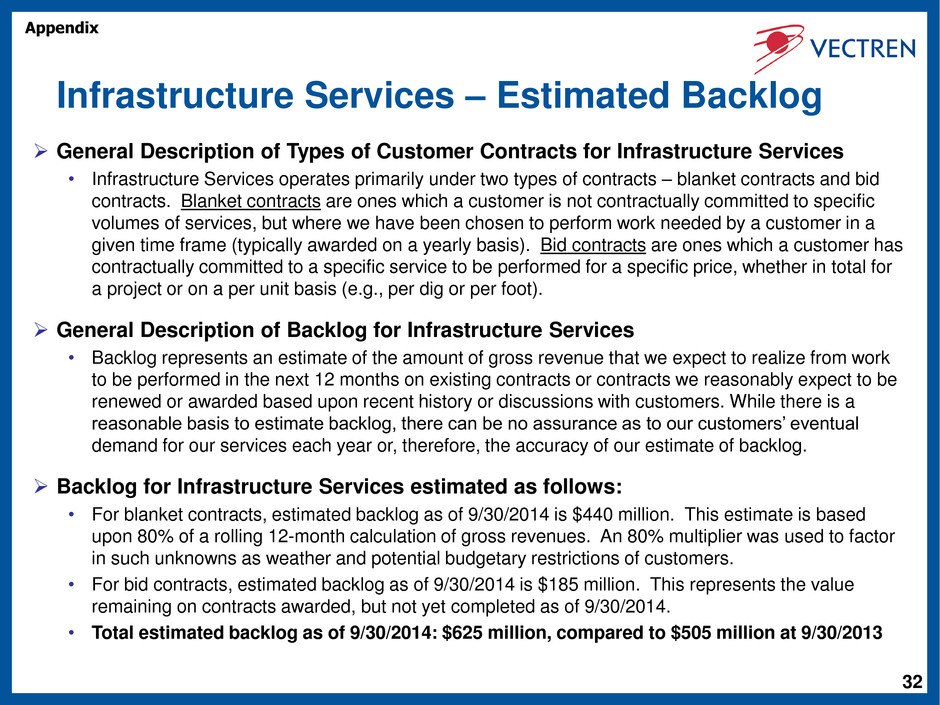
32 Infrastructure Services – Estimated Backlog General Description of Types of Customer Contracts for Infrastructure Services • Infrastructure Services operates primarily under two types of contracts – blanket contracts and bid contracts. Blanket contracts are ones which a customer is not contractually committed to specific volumes of services, but where we have been chosen to perform work needed by a customer in a given time frame (typically awarded on a yearly basis). Bid contracts are ones which a customer has contractually committed to a specific service to be performed for a specific price, whether in total for a project or on a per unit basis (e.g., per dig or per foot). General Description of Backlog for Infrastructure Services • Backlog represents an estimate of the amount of gross revenue that we expect to realize from work to be performed in the next 12 months on existing contracts or contracts we reasonably expect to be renewed or awarded based upon recent history or discussions with customers. While there is a reasonable basis to estimate backlog, there can be no assurance as to our customers’ eventual demand for our services each year or, therefore, the accuracy of our estimate of backlog. Backlog for Infrastructure Services estimated as follows: • For blanket contracts, estimated backlog as of 9/30/2014 is $440 million. This estimate is based upon 80% of a rolling 12-month calculation of gross revenues. An 80% multiplier was used to factor in such unknowns as weather and potential budgetary restrictions of customers. • For bid contracts, estimated backlog as of 9/30/2014 is $185 million. This represents the value remaining on contracts awarded, but not yet completed as of 9/30/2014. • Total estimated backlog as of 9/30/2014: $625 million, compared to $505 million at 9/30/2013 Appendix
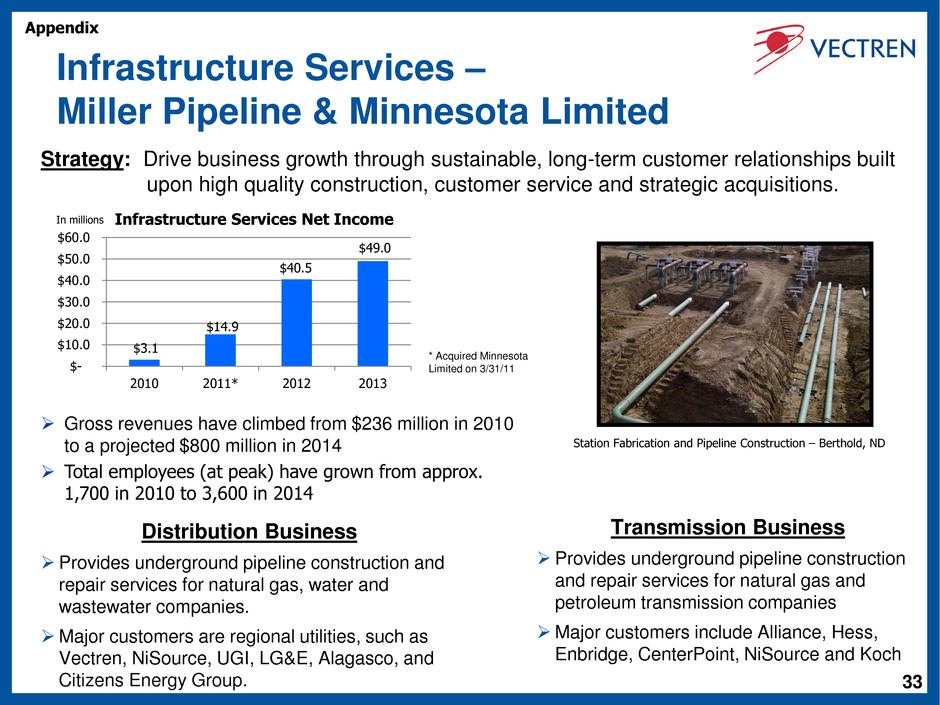
33 Infrastructure Services – Miller Pipeline & Minnesota Limited Distribution Business Provides underground pipeline construction and repair services for natural gas, water and wastewater companies. Major customers are regional utilities, such as Vectren, NiSource, UGI, LG&E, Alagasco, and Citizens Energy Group. Transmission Business Provides underground pipeline construction and repair services for natural gas and petroleum transmission companies Major customers include Alliance, Hess, Enbridge, CenterPoint, NiSource and Koch Strategy: Drive business growth through sustainable, long-term customer relationships built upon high quality construction, customer service and strategic acquisitions. * Acquired Minnesota Limited on 3/31/11 $3.1 $14.9 $40.5 $49.0 $- $10.0 $20.0 $30.0 $40.0 $50.0 $60.0 2010 2011* 2012 2013 Infrastructure Services Net Income In millions Gross revenues have climbed from $236 million in 2010 to a projected $800 million in 2014 Total employees (at peak) have grown from approx. 1,700 in 2010 to 3,600 in 2014 Appendix Station Fabrication and Pipeline Construction – Berthold, ND
34 Infrastructure Services – Partial Customer List Long-term customer relationships are key • Relationship with top 10 distribution customers averages ~25 years Reputation for high quality construction work and customer service • First customer is still a very large customer (~60 years) Shared culture of commitment to safety with our customers Building on our history and reputation, added several significant new customers over the past few years Appendix
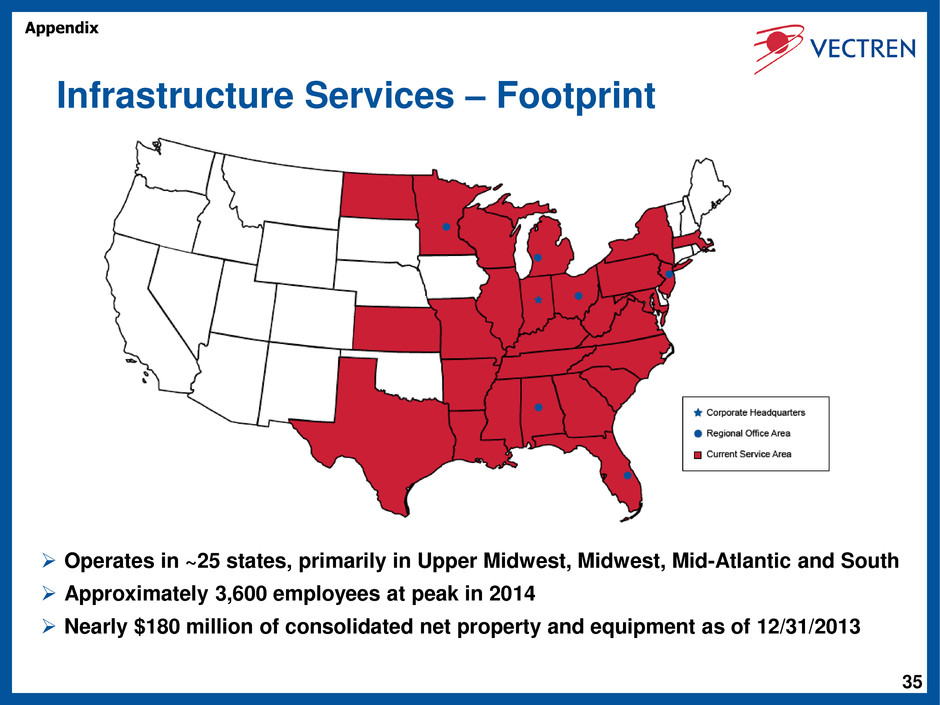
35 Infrastructure Services – Footprint Operates in ~25 states, primarily in Upper Midwest, Midwest, Mid-Atlantic and South Approximately 3,600 employees at peak in 2014 Nearly $180 million of consolidated net property and equipment as of 12/31/2013 Appendix
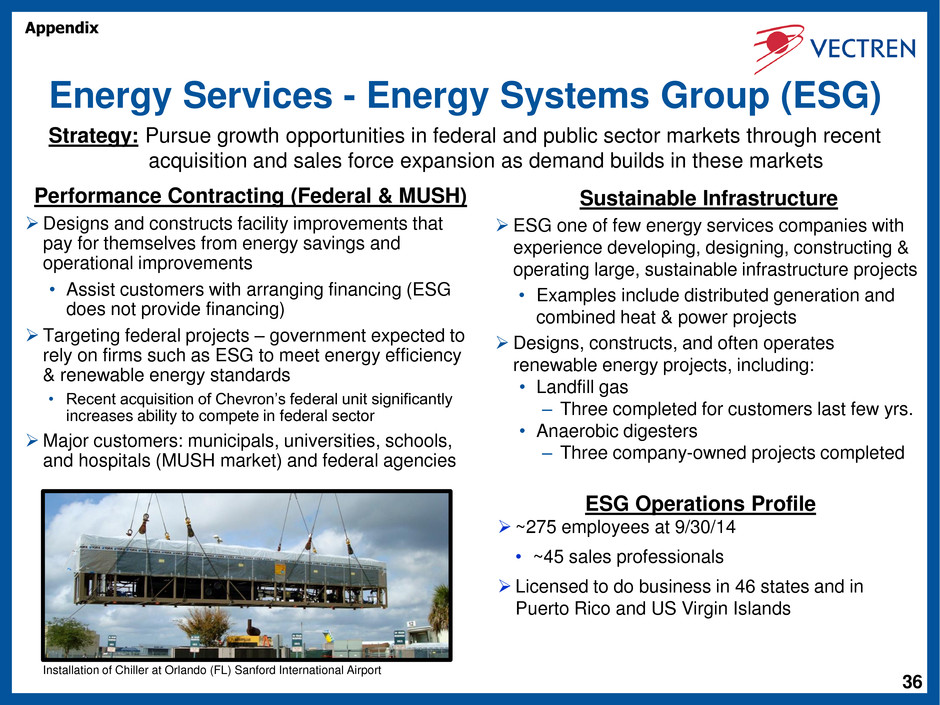
36 Energy Services - Energy Systems Group (ESG) Performance Contracting (Federal & MUSH) Designs and constructs facility improvements that pay for themselves from energy savings and operational improvements • Assist customers with arranging financing (ESG does not provide financing) Targeting federal projects – government expected to rely on firms such as ESG to meet energy efficiency & renewable energy standards • Recent acquisition of Chevron’s federal unit significantly increases ability to compete in federal sector Major customers: municipals, universities, schools, and hospitals (MUSH market) and federal agencies Sustainable Infrastructure ESG one of few energy services companies with experience developing, designing, constructing & operating large, sustainable infrastructure projects • Examples include distributed generation and combined heat & power projects Designs, constructs, and often operates renewable energy projects, including: • Landfill gas – Three completed for customers last few yrs. • Anaerobic digesters – Three company-owned projects completed ESG Operations Profile ~275 employees at 9/30/14 • ~45 sales professionals Licensed to do business in 46 states and in Puerto Rico and US Virgin Islands Strategy: Pursue growth opportunities in federal and public sector markets through recent acquisition and sales force expansion as demand builds in these markets Installation of Chiller at Orlando (FL) Sanford International Airport Appendix
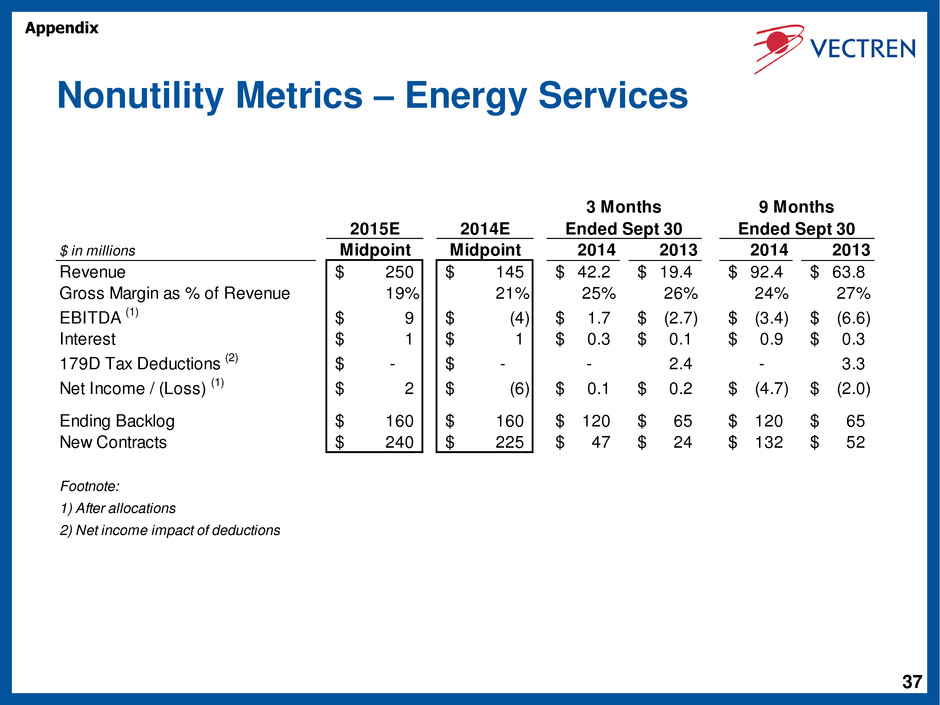
37 Nonutility Metrics – Energy Services 2015E 2014E $ in millions Midpoint Midpoint 2014 2013 2014 2013 Revenue 250$ 145$ 42.2$ 19.4$ 92.4$ 63.8$ Gross Margin as % of Revenue 19% 21% 25% 26% 24% 27% EBITDA (1) 9$ (4)$ 1.7$ (2.7)$ (3.4)$ (6.6)$ Interest 1$ 1$ 0.3$ 0.1$ 0.9$ 0.3$ 179D Tax Deductions (2) -$ -$ - 2.4 - 3.3 Net Income / (Loss) (1) 2$ (6)$ 0.1$ 0.2$ (4.7)$ (2.0)$ Ending Backlog 160$ 160$ 120$ 65$ 120$ 65$ ew Contracts 240$ 225$ 47$ 24$ 132$ 52$ Footnote: 1) After allocations 2) Net income impact of deductions Ended Sept 30 3 Months 9 Months Ended Sept 30 Appendix
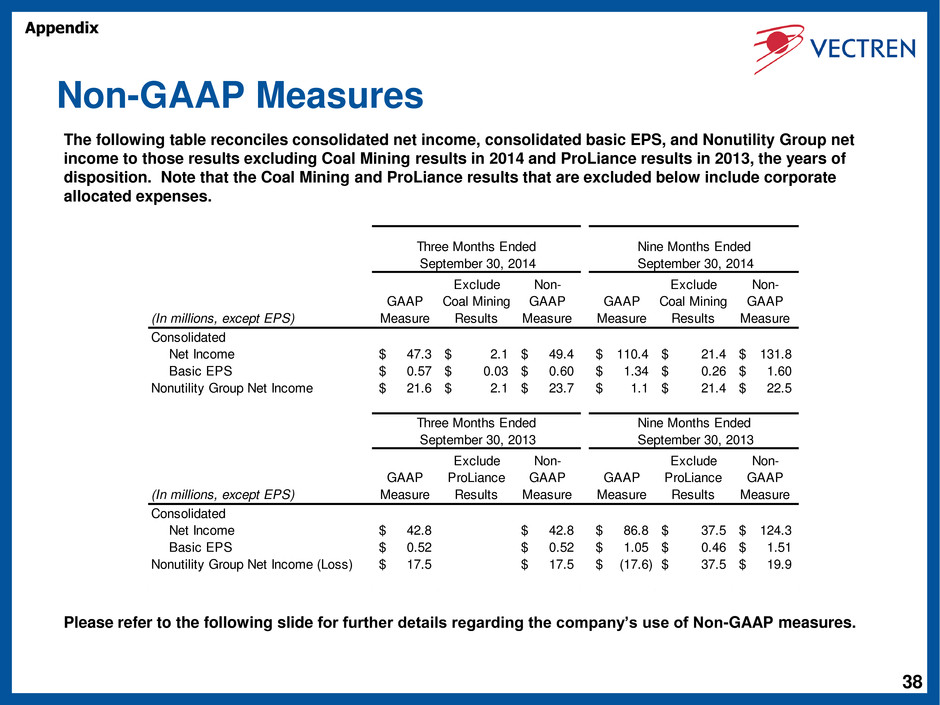
38 Non-GAAP Measures The following table reconciles consolidated net income, consolidated basic EPS, and Nonutility Group net income to those results excluding Coal Mining results in 2014 and ProLiance results in 2013, the years of disposition. Note that the Coal Mining and ProLiance results that are excluded below include corporate allocated expenses. Please refer to the following slide for further details regarding the company’s use of Non-GAAP measures. Appendix (In millions, except EPS) GAAP Measure Exclude Coal Mining Results Non- GAAP Measure GAAP Measure Exclude Coal Mining Results Non- GAAP Measure Consolidated Net Income 47.3$ 2.1$ 49.4$ 110.4$ 21.4$ 131.8$ Basic EPS 0.57$ 0.03$ 0.60$ 1.34$ 0.26$ 1.60$ Nonutility Group Net Income 21.6$ 2.1$ 23.7$ 1.1$ 21.4$ 22.5$ (In millions, except EPS) GAAP Measure Exclude ProLiance Results Non- GAAP Measure GAAP Measure Exclude ProLiance Results Non- GAAP Measure Consolidated Net Income 42.8$ 42.8$ 86.8$ 37.5$ 124.3$ Basic EPS 0.52$ 0.52$ 1.05$ 0.46$ 1.51$ Nonutility Group Net Income (Loss) 17.5$ 17.5$ (17.6)$ 37.5$ 19.9$ Three Months Ended September 30, 2014 Nine Months Ended September 30, 2014 Three Months Ended September 30, 2013 Nine Months Ended September 30, 2013
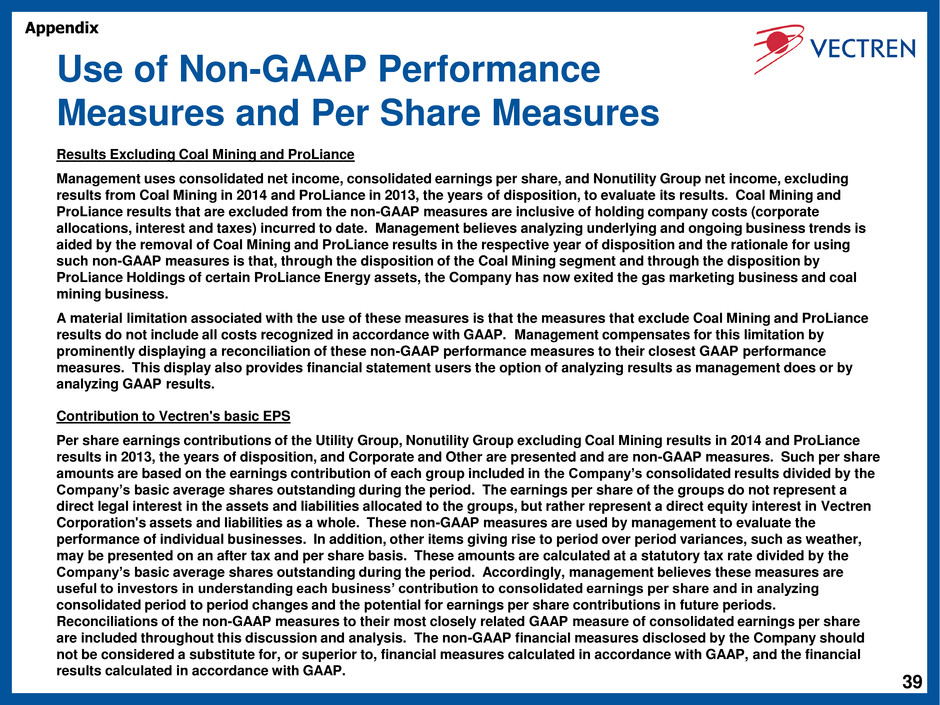
39 Use of Non-GAAP Performance Measures and Per Share Measures Results Excluding Coal Mining and ProLiance Management uses consolidated net income, consolidated earnings per share, and Nonutility Group net income, excluding results from Coal Mining in 2014 and ProLiance in 2013, the years of disposition, to evaluate its results. Coal Mining and ProLiance results that are excluded from the non-GAAP measures are inclusive of holding company costs (corporate allocations, interest and taxes) incurred to date. Management believes analyzing underlying and ongoing business trends is aided by the removal of Coal Mining and ProLiance results in the respective year of disposition and the rationale for using such non-GAAP measures is that, through the disposition of the Coal Mining segment and through the disposition by ProLiance Holdings of certain ProLiance Energy assets, the Company has now exited the gas marketing business and coal mining business. A material limitation associated with the use of these measures is that the measures that exclude Coal Mining and ProLiance results do not include all costs recognized in accordance with GAAP. Management compensates for this limitation by prominently displaying a reconciliation of these non-GAAP performance measures to their closest GAAP performance measures. This display also provides financial statement users the option of analyzing results as management does or by analyzing GAAP results. Contribution to Vectren's basic EPS Per share earnings contributions of the Utility Group, Nonutility Group excluding Coal Mining results in 2014 and ProLiance results in 2013, the years of disposition, and Corporate and Other are presented and are non-GAAP measures. Such per share amounts are based on the earnings contribution of each group included in the Company’s consolidated results divided by the Company’s basic average shares outstanding during the period. The earnings per share of the groups do not represent a direct legal interest in the assets and liabilities allocated to the groups, but rather represent a direct equity interest in Vectren Corporation's assets and liabilities as a whole. These non-GAAP measures are used by management to evaluate the performance of individual businesses. In addition, other items giving rise to period over period variances, such as weather, may be presented on an after tax and per share basis. These amounts are calculated at a statutory tax rate divided by the Company’s basic average shares outstanding during the period. Accordingly, management believes these measures are useful to investors in understanding each business’ contribution to consolidated earnings per share and in analyzing consolidated period to period changes and the potential for earnings per share contributions in future periods. Reconciliations of the non-GAAP measures to their most closely related GAAP measure of consolidated earnings per share are included throughout this discussion and analysis. The non-GAAP financial measures disclosed by the Company should not be considered a substitute for, or superior to, financial measures calculated in accordance with GAAP, and the financial results calculated in accordance with GAAP. Appendix
