Attached files
| file | filename |
|---|---|
| EXCEL - IDEA: XBRL DOCUMENT - DBUB GROUP, INC | Financial_Report.xls |
| EX-31.2 - EXHIBIT 31.2 - DBUB GROUP, INC | yosn93014form10qex31_2.htm |
| EX-31.1 - EXHIBIT 31.1 - DBUB GROUP, INC | yosn93014form10qex31_1.htm |
| EX-32.1 - EXHIBIT 32.1 - DBUB GROUP, INC | yosn93014form10qex32_1.htm |
UNITED STATES
SECURITIES AND EXCHANGE COMMISSION
WASHINGTON, D.C. 20549
FORM 10-Q
☒ QUARTERLY REPORT PURSUANT TO SECTION 13 OR 15(d) OF THE SECURITIES EXCHANGE ACT OF 1934
For the quarterly period ended September 30, 2014
or
☐ TRANSITION REPORT PURSUANT TO SECTION 13 OR 15(d) OF THE SECURITIES EXCHANGE ACT OF 1934
For the transition period from ____ to _____
Commission File Number: 000-28767
YOSEN GROUP, INC.
(Exact name of registrant as specified in its charter)
| Nevada | 88-0403070 |
(State or other jurisdiction of incorporation or organization) |
(I.R.S. Employer Identification No.) |
368 HuShu Nan Road
HangZhou City, Zhejiang Province, China 310014
(Address of Principal Executive Offices) (Zip Code)
086-0571-88381700
(Registrant’s telephone number, including area code)
(Former name, former address and former fiscal year, if changed since last report)
Indicate by check whether the issuer (1) has filed all reports required to be filed by Section 13 or 15(d) of the Securities Exchange Act of 1934 during the preceding 12 months (or for such shorter period that the registrant was required to file such reports), and (2) has been subject to such filing requirements for the past 90 days:
Yes ☒ No ☐
Indicate by check mark whether the registrant has submitted electronically and posted on its corporate Web site, if any, every Interactive Data File required to be submitted and posted pursuant to Rule 405 of Regulation S-T (§232.405 of this chapter) during the preceding 12 months (or for such shorter period that the registrant was required to submit and post such files).
Yes ☐ No ☐
Indicate by check mark whether the registrant is a large accelerated filer, an accelerated filer, a non-accelerated filer, or a smaller reporting company. See the definitions of “large accelerated filer,” “accelerated filer” and “smaller reporting company” in Rule 12b-2 of the Exchange Act.
Large accelerated filer ☐ |
Accelerated filer ☐ | Non-accelerated filer ☐ (Do not check if a smaller reporting company) |
Smaller reporting company ☒ |
Indicate by check mark whether the registrant is a shell company (as defined in Rule No 12b-2 of the Exchange Act).
Yes ☐ No ☒
As of November 14, 2014, the registrant had 23,692,356 shares of common stock outstanding.
TABLE OF CONTENTS
YOSEN GROUP, INC. AND SUBSIDIARIES
CONSOLIDATED BALANCE SHEETS
| September 30, | December 31, | |||||||
| 2014 | 2013 | |||||||
| (Unaudited) | ||||||||
| ASSETS | ||||||||
| Current assets: | ||||||||
| Cash and equivalents | $ | 1,523,345 | $ | 1,426,018 | ||||
| Accounts receivable, net | 557,576 | 214,260 | ||||||
| Inventories, net | 1,485,281 | 1,490,415 | ||||||
| Advances to suppliers | 1,013,218 | 756,779 | ||||||
| Advances to related party | 152,974 | - | ||||||
| Prepaid expenses and other current assets | 62,178 | 40,334 | ||||||
| Total current assets | 4,794,572 | 3,927,806 | ||||||
| Property and equipment, net | 39,758 | 41,575 | ||||||
| Total assets | $ | 4,834,330 | $ | 3,969,381 | ||||
| LIABILITIES AND STOCKHOLDERS' DEFICIT | ||||||||
| Current liabilities: | ||||||||
| Short-term loans | $ | 958,820 | $ | 2,618,487 | ||||
| Notes payable | 3,006,468 | 1,391,071 | ||||||
| Accounts payable | 336,263 | 217,670 | ||||||
| Accrued expenses and other payable | 572,752 | 197,893 | ||||||
| Advances from customers | 33,668 | - | ||||||
| Advance from stock subscription | 368,000 | - | ||||||
| Income tax payable | 939,274 | 839,757 | ||||||
| Total current liabilities | 6,215,245 | 5,264,878 | ||||||
| Long-term loan | 487,535 | 490,966 | ||||||
| Total liabilities | 6,702,780 | 5,755,844 | ||||||
| Commitments and contingencies | ||||||||
| Stockholders' deficit: | ||||||||
Common stock, $0.001 par value, 50,000,000 shares authorized, 23,692,356 and 23,542,527 issued and outstanding as of September 30, 2014 and December 31, 2013 |
23,692 | 23,542 | ||||||
| Additional paid-in capital | 26,229,653 | 25,918,351 | ||||||
| Subscription receivable | (50,000 | ) | (50,000 | ) | ||||
| Statutory reserve | 11,543,063 | 11,542,623 | ||||||
| Other comprehensive income | 7,914,222 | 7,903,271 | ||||||
| Accumulated deficit | (47,529,080 | ) | (47,124,250 | ) | ||||
| Total stockholders' deficit | (1,868,450 | ) | (1,786,463 | ) | ||||
| Total liabilities and stockholders' deficit | $ | 4,834,330 | $ | 3,969,381 | ||||
The accompanying notes are an integral part of these consolidated financial statements.
| 1 |
YOSEN GROUP, INC. AND SUBSIDIARIES
CONSOLIDATED STATEMENTS OF OPERATIONS AND COMPREHENSIVE LOSS
NINE MONTHS ENDED SEPTEMBER 30, 2014 AND 2013 (UNAUDITED)
|
2014 | 2013 | |||||||
| Net sales | $ | 9,751,693 | $ | 8,195,022 | |||||
| Cost of sales | 8,979,577 | 7,764,426 | |||||||
| Gross profit | 772,116 | 430,596 | |||||||
| Selling, general and administrative expenses | 890,106 | 1,677,373 | |||||||
| Loss from continuing operations | (117,990 | ) | (1,246,777 | ) | |||||
| Other (income) expense: | |||||||||
| Interest income | (174 | ) | (5,143 | ) | |||||
| Other income | (313,355 | ) | (51,065 | ) | |||||
| Other expense | 304,288 | 26,708 | |||||||
| Total other income | (9,241 | ) | (29,500 | ) | |||||
| Loss from continuing operations before income taxes | (108,749 | ) | (1,217,277 | ) | |||||
| Provision for income taxes | 45,223 | - | |||||||
| Loss from continuing operations | (153,972 | ) | (1,217,277 | ) | |||||
| Net loss from discontinued operations, net of income taxes | (250,857 | ) | (217,978 | ) | |||||
| Net loss | (404,829 | ) | (1,435,255 | ) | |||||
| Foreign currency translation adjustments | 10,951 | 21,677 | |||||||
| Comprehensive loss | $ | (393,878) | $ | (1,413,578 | ) | ||||
| Basic and diluted loss per share: | |||||||||
| Continuing operations | (0.01 | ) | (0.06 | ) | |||||
| Discontinued operations | (0.01 | ) | (0.01 | ) | |||||
| Net loss per share | $ | (0.02 | ) | $ | (0.07 | ) | |||
| Weighted average shares outstanding: | |||||||||
| Basic | 23,611,587 | 19,031,440 | |||||||
| Diluted | 25,611,587 | 19,280,524 | |||||||
The accompanying notes are an integral part of these consolidated financial statements.
| 2 |
YOSEN GROUP, INC. AND SUBSIDIARIES
CONSOLIDATED STATEMENTS OF OPERATIONS AND COMPREHENSIVE LOSS
THREE MONTHS ENDED SEPTEMBER 30, 2014 AND 2013 (UNAUDITED)
|
2014 | 2013 | ||||||
| Net sales | $ | 2,435,533 | $ | 2,197,149 | ||||
| Cost of sales | 2,283,739 | 2,077,661 | ||||||
| Gross profit | 151,794 | 119,488 | ||||||
| Selling, general and administrative expenses | 313,745 | 449,832 | ||||||
| Loss from continuing operations | (161,951) | (330,344) | ||||||
| Other (income) expense: | ||||||||
| Interest income | (45) | (134) | ||||||
| Other income | (98,916) | (14,847) | ||||||
| Other expense | 263,313 | 16,867 | ||||||
| Total other expense | 164,352 | 1,886 | ||||||
| Loss from continuing operations before income taxes | (326,303) | (332,230) | ||||||
| Provision for income taxes | 6,270 | - | ||||||
| Net loss from continuing operations | (332,573) | (332,230) | ||||||
| Net loss from discontinued operations, net of income taxes | (103,882) | (49,329) | ||||||
| Net loss | (436,455) | (381,559) | ||||||
| Foreign currency translation adjustments | (776) | (1,534) | ||||||
| Comprehensive loss | $ | (437,231) | $ | (383,093) | ||||
| Basic and diluted loss per share: | ||||||||
| Continuing operations | (0.01) | (0.02) | ||||||
| Discontinued operations | - | - | ||||||
| Net loss per share | $ | (0.01) | $ | (0.02) | ||||
| Weighted average shares outstanding: | ||||||||
| Basic | 23,692,356 | 19,031,440 | ||||||
| Diluted | 25,692,356 | 19,280,524 | ||||||
The accompanying notes are an integral part of these consolidated financial statements.
| 3 |
YOSEN GROUP, INC. AND SUBSIDIARIES
CONSOLIDATED STATEMENTS OF CASH FLOWS
NINE MONTHS ENDED SEPTEMBER 30, 2014 and 2013 (UNAUDITED)
| 2014 | 2013 | ||||||||
| CASH FLOWS FROM OPERATING ACTIVITIES: | |||||||||
| Net loss | $ | (404,829 | ) | $ | (1,435,255) | ||||
| Adjustments to reconcile net loss to net cash used in operating activities: | |||||||||
| Depreciation | 32,421 | 5,215 | |||||||
| Stock based compensation | 273,952 | 310,000 | |||||||
| (Increase) decrease in assets: | |||||||||
| Accounts receivable | (344,978 | ) | 807,878 | ||||||
| Inventories | (5,277 | ) | 317,639 | ||||||
| Prepaid expenses and other current assets | (22,206 | ) | 122,565 | ||||||
| Advance to suppliers | (261,658 | ) | (1,790,913) | ||||||
| Advance to related party | (152,870 | ) | - | ||||||
| Increase (decrease) in current liabilities: | |||||||||
| Accounts payable | 120,143 | 46,729 | |||||||
| Accrued expenses and other payable | 392,604 | 43,382 | |||||||
| Advance from customers | 33,668 | - | |||||||
| Income tax payable | 105,344 | 94,521 | |||||||
| Net cash used in operating activities | (233,686 | ) | (1,478,239) | ||||||
| CASH FLOWS FROM FINANCING ACTIVITIES: | |||||||||
| Advance from stock subscription | 368,000 | - | |||||||
| Proceeds from short-term loans | (1,640,249) | - | |||||||
| Proceeds from notes payable | 1,624,009 | 1,368,055 | |||||||
| Proceeds from long-term loans | - | 482,843 | |||||||
| Repayment of advance to related party | - | 470,063 | |||||||
| Net cash provided by financing activities | 351,760 | 2,320,961 | |||||||
| Effect of exchange rate changes on cash and equivalents | (20,747) | 113,156 | |||||||
| Net increase in cash | 97,327 | 955,878 | |||||||
| Cash and equivalents, beginning of period | 1,426,018 | 456,495 | |||||||
| Cash and equivalents, end of period | $ | 1,523,345 | $ | 1,412,373 | |||||
| Supplemental disclosure of cash flow information: | |||||||||
| Interest paid | $ | 245,671 | $ | 1,066,783 | |||||
| Income taxes paid | $ | - | $ | - | |||||
The accompanying notes are an integral part of these consolidated financial statements.
| 4 |
YOSEN GROUP, INC. AND SUBSIDIARIES
NOTES TO CONSOLIDATED FINANCIAL STATEMENTS
SEPTEMBER 30, 2014 AND 2013 (UNAUDITED)
Yosen Group, Inc. (the “Company” or “Yosen”) was incorporated on August 20, 1998 under the laws of the State of Nevada. Capital Future Developments Limited - BVI (“Capital”) was incorporated on July 22, 2004 under the laws of the British Virgin Islands (“BVI”). Zhejiang YongXin Digital Technology Company Limited (“Zhejiang”), Yiwu YongXin Communication Limited (“Yiwu”), Hangzhou Wang Da Electronics Company Limited (“Wang Da”), Hangzhou Sanhe Electronic Technology Limited (“Sanhe”), Shanghai Joy & Harmony Electronics Company Limited (“Joy & Harmony”), and Jinhua Baofa Logistic Ltd (“Jinhua”) were incorporated under the laws of Peoples Republic of China (“PRC”) on July 11, 2005, July 18, 1997, March, 30, 1998, April 12, 2004, August 20, 2003 and December 27, 2001, respectively. All dollar amounts are in thousands, unless otherwise indicated.
On December 21, 2005, Capital became a wholly owned subsidiary of Yosen through a reverse merger (“Merger Transaction”). Yosen acquired all of the issued and outstanding capital stock of Capital pursuant to a Merger Agreement dated December 21, 2005 by and among Yosen, XY Acquisition Corporation, Capital and the shareholders of Capital (the “Merger Agreement”). Pursuant to the Merger Agreement, Capital became a wholly owned subsidiary of Yosen and, in exchange for the Capital shares, Yosen issued 7,000,000 shares of its common stock to the shareholders of Capital, representing 93% of the issued and outstanding capital stock of Yosen at that time and cash of $500.
On August 3, 2006, Capital completed the acquisition of a 100% interest in Sanhe for a cash and stock transaction valued at $8,750. The consideration consisted of 183,150 newly issued shares of the Company’s common stock and $5,000 in cash.
On November 28, 2006, Capital completed the acquisition of a 100% interest in Joy & Harmony for a cash and stock transaction valued at $18,500. The consideration consisted of 544,622 shares of the Company’s common stock and $7,500 in cash.
On August 15, 2007, we executed a series of contractual agreements between Capital and Zhejiang. The contractual agreements give Capital and its equity owners an obligation, and having ability to absorb, any losses, and rights to receive returns; however, these contractual agreements did not change the equity ownership of Zhejiang. We did not dispose Capital’s actual equity ownership of Zhejiang when we executed the contractual agreements. Capital entered into share-holding entrustment agreements with five individuals - Zhenggang Wang, Yimin Zhang, Huiyi Lv, Xiaochun Wang and Zhongsheng Bao to hold 35%, 20%, 20%, 15% and 10%, respectively, of the equity interest of Zhejiang on behalf of Capital on November 21, 2005. The entrustment agreements confirm that Capital is the actual owner of Zhejiang. Capital enjoys the actual shareholder’s rights and has the right to obtain any benefits received by the nominal holders. Zhenggang Wang is the CEO and shareholder of Yosen. Yimin Zhang, Huiyi Lv, Xiaochun Wang and Zhongsheng Bao have no other relationship with Yosen. No consideration was given to these individuals who held the equity of Zhejiang on behalf of Capital.
On July 6, 2009, Yosen and its subsidiary Zhejiang and Yiwu purchased 100% of Jinhua for RMB 120 million ($17,500) in cash. Zhejiang acquired 90% and Yiwu acquired 10% of the equity interests in Jinhua.
On January 6, 2014 the Company established Yosen Trading Inc. (“Yosen Trading”), its wholly owned US based subsidiary in New York. Yosen Trading is engaged primarily in international trade and wholesale business, primarily selling tile, kitchen cabinet, granite and marble products in the New York Market.
| 5 |
ORGANIZATIONAL CHART
Our corporate structure as of September 30, 2014 is as follows:
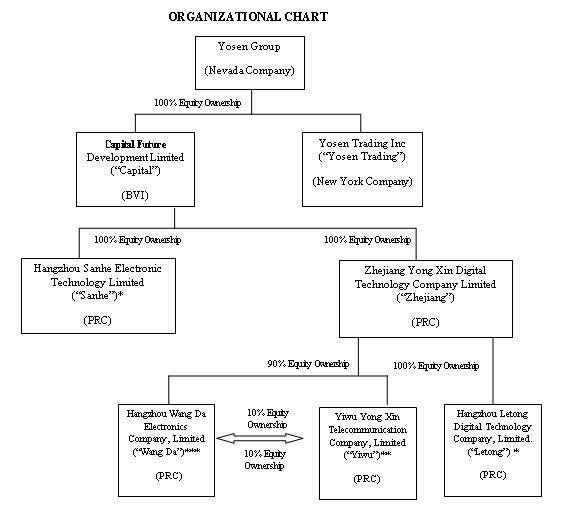
* These entities ceased operation as of December 31, 2011.
** These entities ceased operation as of December 31, 2012.
*** This entity ceased operation as of June 30, 2014.
Note 2 - SUMMARY OF SIGNIFICANT ACCOUNTING POLICIES
Basis of Presentation
The accompanying consolidated financial statements were prepared in conformity with accounting principles generally accepted in the United States of America (“US GAAP”). The Company’s subsidiaries – Wang Da, Yiwu, Joy & Harmony, Sanhe, Jinhua and Zhejiang’s functional currency is the Chinese Renminbi (“RMB”), however, the accompanying consolidated financial statements were translated and presented in United States Dollars (“$”, or “USD”). Yosen is the parent company incorporated on August 20, 1998 under the laws of the State of Nevada. The parent company does not have operations. Its main activities were incurring public company expenses. Yosen pays all its expenses in USD, its functional currency. Capital was incorporated on July 22, 2004 under the laws of the BVI. Capital is a holding company and does not have operations. As a result, we determined its functional currency is USD.
| 6 |
Going Concern
The accompanying consolidated financial statements have been prepared on a going concern basis which contemplates the realization of assets and the satisfaction of liabilities in the normal course of business. The Company realized net loss of $3,626,688 and $15,866,999 for 2013 and 2012, respectively. The Company had accumulated deficit of $47,529,080 as of September 30, 2014. In addition, the Company’s cash position substantially deteriorated since 2010. There can be no assurance the Company will become profitable or that it will survive as a public company. These issues raise substantial doubt regarding the Company’s ability to continue as a going concern.
Starting 2011, we closed most of our stores in stores locations and laid off most of our employees. We retained highly qualified personnel and a small number of stores with stable revenues. As a result, we significantly cut our operating expenses and our losses are decreasing over time. We are now concentrating on improving our product mix, upgrading the stores that are currently open and strengthening cooperation with China Telecom, China Unicom and other large state-owned operators to develop new businesses.
Principles of Consolidation
The consolidated financial statements include the accounts of Yosen and its wholly owned subsidiaries Capital, Wang Da, Yiwu, Sanhe, Jinhua, Yosen Trading and variable interest entity Zhejiang, collectively referred to as the Company. All material intercompany accounts, transactions and profits were eliminated in consolidation.
Currency Translation
The accounts of Zhejiang, Wang Da, Yiwu, Sanhe and Jinhua were maintained, and its financial statements were expressed in RMB. Such financial statements were translated into USD in accordance with FASB ASC Sub-topic 830-10, “Translation of Financial Statements,” with the RMB as the functional currency. According to FASB ASC Sub-topic 830-10, assets and liabilities were translated at the ending exchange rate, stockholders’ equity is translated at the historical rates and income statement items are translated at the average exchange rate for the year. The resulting translation adjustments are reported as other comprehensive income in accordance with FASB ASC Topic 220, “Comprehensive Income,” as a component of shareholders’ equity. Transaction gains and losses are reflected in the consolidated statements of operations and comprehensive loss.
Use of Estimates
The preparation of financial statements in conformity with US GAAP requires management to make estimates and assumptions that affect the reported amounts of assets and liabilities and disclosure of contingent assets and liabilities at the date of the financial statements and the reported amounts of revenues and expenses during the reporting period. Actual results could differ from those estimates.
Risks and Uncertainties
The Company is subject to risks from, among other things, intense competition associated with the industry in general, other risks associated with financing, liquidity requirements, rapidly changing customer requirements, limited operating history, foreign currency exchange rates and the volatility of public markets.
Contingencies
Certain conditions may exist as of the date the financial statements are issued, which could result in a loss to the Company but which will only be resolved when one or more future events occur or fail to occur. The Company’s management assesses such contingent liabilities, and such assessment inherently involves an exercise of judgment. In assessing loss contingencies related to legal proceedings that are pending against the Company or unasserted claims that may result in such proceedings, the Company’s management evaluates the perceived merits of any legal proceedings or unasserted claims as well as the perceived merits of the amount of relief sought or expected to be sought.
If the assessment of a contingency indicates that it is probable that a material loss has been incurred and the amount of the liability can be estimated, then the estimated liability is accrued in the Company’s financial statements. If the assessment indicates that a potential material loss contingency is not probable but is reasonably possible, or is probable but cannot be estimated, then the nature of the contingent liability, together with an estimate of the range of possible loss if determinable and material would be disclosed.
Loss contingencies considered to be remote by management are generally not disclosed unless they involve guarantees, in which case the guarantee would be disclosed.
| 7 |
Accounts Receivable, net
The Company maintains reserves for potential credit losses on accounts receivable. Management reviews the composition of accounts receivable and analyzes historical bad debts, customer concentrations, customer credit worthiness, current economic trends and changes in customer payment patterns to evaluate the adequacy of these reserves. Terms of the sales vary. Reserves are recorded primarily on a specific identification basis. Allowance for doubtful accounts was $787,243 (unaudited) and $745,714 as of September 30, 2014 and December 31, 2013, respectively.
Inventories, net
Inventories are valued at the lower of cost (determined on a weighted average basis) or market. Management compares the cost of inventories with the market value and allowance is made for writing down their inventories to market value, if lower. As of September 30, 2014 and December 31, 2013, inventory consisted entirely of finished goods.
Advances to Suppliers
Advances to suppliers represent advance payments to suppliers for the purchase of inventory.
Property and Equipment, net
Property and equipment are stated at cost. Expenditures for maintenance and repairs are charged to earnings as incurred; additions, renewals and betterments are capitalized. When property and equipment are retired or otherwise disposed of, the related cost and accumulated depreciation are removed from the respective accounts, and any gain or loss is included in operations. Depreciation of property and equipment is provided using the straight-line method for substantially all assets with estimated lives of:
| Automotive | 5 years |
| Office Equipment | 5 years |
As of September 30, 2014 and December 31, 2013, property and equipment consisted of the following:
| 2014 | 2013 | |||||||
| (Unaudited) | ||||||||
| Automotive | $ | 64,476 | $ | 63,254 | ||||
| Office equipment | 184,850 | 184,007 | ||||||
| Subtotal | 249,326 | 247,261 | ||||||
| Less: accumulated depreciation | (209,568 | ) | (205,686 | ) | ||||
| Total | $ | 39,758 | $ | 41,575 | ||||
Long-Lived Assets
The Company periodically evaluates the carrying value of long-lived assets to be held and used in accordance with FASB ASC 360 “Property, Plant and Equipment”, which requires impairment losses to be recorded on long-lived assets used in operations when indicators of impairment are present and the undiscounted cash flows estimated to be generated by those assets are less than the assets’ carrying amounts. In that event, a loss is recognized based on the amount by which the carrying amount exceeds the fair market value of the long-lived assets. Losses on long-lived assets to be disposed of are determined in a similar manner, except that fair market values are reduced for the cost of disposal. Based on its review, the Company believes that, as of September 30, 2014 (unaudited) and December 31, 2013, there were no significant impairments of its long-lived assets.
Fair Value of Financial Instruments
FASB ASC Topic 825, “Financial Instruments,” requires the Company disclose estimated fair values (“FVs”) of financial instruments. The carrying amounts reported in the statements of financial position for current assets and current liabilities qualifying as financial instruments are a reasonable estimate of FV.
| 8 |
Revenue Recognition
In accordance with FASB ASC Topic 605, “Revenue Recognition,” the Company recognizes revenues when there is persuasive evidence of an arrangement, product delivery and acceptance have occurred, the sales price is fixed and determinable, and collectability of the resulting receivable is reasonably assured, net of returns and allowances.
(a) Zhejiang
Zhejiang records revenues when title and the risk of loss pass to the customer. Generally, these conditions occur on the date the customer takes delivery of the product. Revenue is generated from sales of Yosen products through two main revenue streams:
| 1. | Retail. 97.9%, 98.0% 97.9% and 98.0% of the Company's revenue came from sales to customers at outlets installed inside department stores (i.e., store in store model) during the three and nine months ended September 30, 2014 and 2013, respectively and is mainly achieved through point of sale transfer of ownership. Under this method, the Company’s products are placed in third party stores and sold by the Company’s sales people. Upon purchase of the item by the customer, the Company relieves its inventory and recognizes revenue related to that item. |
| 2. | Wholesale. 2.1%, 2.0%, 2.1% and 2.0% of the Company's revenue came from wholesale during the three and nine months ended September 30, 2014 and 2013, respectively. All wholesale payments were made at the point of sale. Upon purchase of the item by the customer, the Company relieves its inventory and recognizes revenue related to that item. |
Return policies
Our return policy complies with China’s laws and regulations on consumer’s rights and product quality. In accordance with Chinese law, consumers can return or exchange used products within seven days only if the goods do not meet safety and health requirements, endanger a person’s property, or do not meet the advertised performance. If the conditions and requirements as set out in the relevant laws and regulations are met, the retail stores are entitled to accept a return of the goods from the consumer. In such cases, the Company shall accept the returns unconditionally. Goods returned will be redirected to the production factory or supplier who shall bear all losses on the returns in accordance the laws and regulations. Consumer returns or exchanges of products that have not been used, where the packaging has not been damaged, are honored if such return or exchange is within seven days. If a consumer returns a product, the Company must refund the invoice price to the consumer. The Company will then be responsible for returning the goods to the production factory or supplier. At that time the Company can recover the price based on the purchase and sale contract with the producer or supplier. However, when goods are returned, the Company loses the profit margin that it records when revenue is recognized, regardless of whether the production factory or supplier takes the product back or not.
The return rights granted to wholesale customers are similar to the rights granted to retail customers. Once wholesale customers purchase the products, they follow the same return policy as retail customers. We do not honor any return from wholesale customers other than if the products don’t meet laws and regulations or quality requirements. If the wholesale customers have a high inventory level or product obsolescence caused by lower market demands or other operational issues, the wholesale customers bear their own losses. When a wholesale customer returns products, the Company will return the products to the suppliers or manufacturers. A sales return and allowance is recorded at the sales price. Meanwhile, a purchase return and allowance entry is recorded at the invoice price because the suppliers or manufacturers bear the losses. The net effect is that the Company derecognizes the gross profit when a return takes place, but does not record any loss on the cost of the returned item back to the supplier or manufacturer.
In light of the aforesaid PRC laws and regulations and the Company's arrangements with suppliers, we do not provide an accrual for any estimated losses on subsequent sale of the return of products. As a result we do not engage in assessing levels of inventory in the distribution channel, product obsolescence and/or introductions of new products, as none of those factors have any impact on us with respect to estimating losses on subsequent sale of returned goods. Goods return policy strictly complies with the laws and regulations in China on consumer rights and product quality requirements. If the conditions and requirements as set out in the relevant laws and regulations are met, customers are able to return the goods unconditionally. In such cases, the Company shall accept the returns unconditionally. Goods returned will be redirected back to the manufacturers or suppliers who shall meet all losses on returns in accordance the laws and regulations. The Company will only be responsible for assisting the process of execution of goods return. The Company shall not bear any loss from goods returned. As a result, we do not provide any accrual on subsequent return of goods sold.
Unlike the US retail market, sellers do not accept returns caused by any change in the sales market or change in customers’ preferences in China. Therefore, the Company generally does not honor any return except for a product defect. As such, situations relating to return of goods from overstock in distribution channels, product obsolescence and over-budgeted goods from launching of new products will not exist.
The reported sales do not include estimate of returns due to defects for the period presented because we do not offer customers the right to return in China. We do not allow the customers to return the products for cash refunds, credit, or exchange for other products through general rights of return. If the products are defective, manufacturers are directly responsible for the defects. Yosen Group, as a distributor, only assists customers in returning the defective products to manufacturers. The manufacturers send replacement products to customers directly.
| 9 |
(b) Yosen Trading
Yosen Trading records revenue when merchandise is delivered to the customers. During the three and nine months ended September 30, 2014, Yosen trading had 22.9% and 23.4% of revenue from retail and 77.1% and 76.6% from wholesale.
Return policies
We accept returns on most materials, in original condition, within 7 days of purchase. Original customer receipt is required for all returns. A restocking fee may apply. Special Order items are not eligible for return or exchange.
Cost of Sales
Cost of sales (“COS”) consists of actual product cost, which is the purchase price of the product less any discounts. COS excludes freight charges, purchase and delivery costs, internal transfer, freight charges and the other costs of the Company’s distribution network, which are identified in general and administrative expenses.
General and Administrative Expenses
General and administrative (“G&A”) expenses are comprised principally of payroll and benefits costs for retail and corporate employees, occupancy costs of corporate facilities, lease expenses, management fees, traveling expenses and other operating and administrative expenses, including freight charges, purchase and delivery costs, internal transfer freight charges and other distribution costs.
Shipping and Handling Fees
The Company follows FASB ASC Sub-topic 605-45, “Handling Costs, Shipping Costs.” The Company does not charge its customers for shipping and handling. The Company classifies shipping and handling fees as part of general and administrative expenses which were $6,651, $7,192, $1,115 and $6,154 for the three and nine months ended September 30, 2014 and 2013, respectively.
Vendor Discounts
The Company has negotiated preferred pricing arrangements with certain vendors on certain products. These arrangements are not contingent on any levels of volume and are considered vendor discounts as opposed to rebates. The Company records these discounts along with the purchase of the discounted items, resulting in lower inventory cost and a corresponding lower COS as the products are sold.
Management Fees Paid to the Department Stores Under “Store in Store” Model
Under the “store in store” business operation model, the Company may pay management fees to the department stores, which are in the form of service charges. The management fees are reflected in general and administrative expenses. Such management fees were $40,616 and $66,343 in general and administrative expenses for the three and nine months ended September 30, 2014 and zero for the three and nine months ended September 30, 2013, respectively.
Share Based Payment
The Company follows FASB ASC Sub-topic 718-10, “Compensation-Stock Compensation,” which addresses the accounting for transactions in which an entity exchanges its equity instruments for goods or services, with a primary focus on transactions in which an entity obtains employee services in share-based payment transactions. FASB ASC Sub-topic 718-10 requires measurement of the cost of employee services received in exchange for an award of equity instruments based on the grant-date FV of the award (with limited exceptions). Incremental compensation costs arising from subsequent modifications of awards after the grant date must be recognized.
Advertising
Advertising expenses consist primarily of costs of promotion for corporate image and product marketing and costs of direct advertising. The Company expenses all advertising costs as incurred. Advertising expense was $0 and $6,382, respectively for three and nine months ended September 30, 2013. There was no advertising expense for the three and nine months ended September 30, 2014.
Other Income
Other income for the nine months ended September 30, 2014 and 2013 consist of the following:
| 2014 | 2013 | |||||||
| Commission income from China Unicom | $ | 313,355 | $ | 37,827 | ||||
| Miscellaneous | - | 13,238 | ||||||
| Total other income | $ | 313,355 | $ | 51,065 | ||||
| 10 |
Other income for the three months ended September 30, 2014 and 2013 consist of the following:
| 2014 | 2013 | |||||||
| Commission income from China Unicom | $ | 98,916 | $ | 8,159 | ||||
| Miscellaneous | - | 6,688 | ||||||
| Total other income | $ | 98,916 | $ | 14,847 | ||||
Commission income from China Unicom is related to the sales of China Unicom’s wireless service and products (i.e., rechargeable mobile phone cards).
Income Taxes
The Company utilizes FASB ASC Topic 740, “Income Taxes.” ASC Topic 740 requires a company to use the asset and liability method of accounting for income taxes, whereby deferred income taxes are recognized for the tax consequences in future years of differences between the tax bases of assets and liabilities and their financial reporting amounts at each period end based on enacted tax laws and statutory tax rates applicable to the periods in which the differences are expected to affect taxable income. Valuation allowances are established, when necessary, to reduce deferred tax assets to the amount expected to be realized.
Under FASB Sub-topic ASC 740-10-25, evaluation of a tax position is a two-step process. The first step is to determine whether it is more-likely-than-not that a tax position will be sustained upon examination, including the resolution of any related appeals or litigation based on the technical merits of that position. The second step is to measure a tax position that meets the more-likely-than-not threshold to determine the amount of benefit to be recognized in the financial statements.
Basic and Diluted Earnings (Loss) per Share
Loss per share is calculated in accordance with FASB ASC Topic 260, “Earnings per Share.” Basic earnings (loss) per share is based upon the weighted average number of common shares outstanding. Diluted earnings (losses) per share is based on the assumption that all dilutive convertible shares and stock options were converted or exercised. Dilution is computed by applying the treasury stock method. Under this method, options and warrants are assumed to be exercised at the beginning of the period (or at the time of issuance, if later), and as if funds obtained thereby were used to purchase common stock at the average market price during the period. If convertible shares and stock options are anti-dilutive, the impact of conversion is not included in the diluted net income (loss) per share. Excluded from the calculation of diluted earnings (loss) per share for the three months ended September 30, 2014 and 2013 were 10,000 options, as they were not dilutive.
Statement of Cash Flows
In accordance with FASB ASC Topic 230, “Statement of Cash Flows,” cash flows from the Company’s operations are calculated based upon the functional currency, in our case the RMB. As a result, amounts related to changes in assets and liabilities reported on the statement of cash flows will not necessarily agree with the changes in the corresponding balances on the balance sheet.
Concentration of Credit Risk
Financial instruments that potentially subject the Company to concentrations of credit risk are cash, accounts receivable, advances to suppliers and other receivables arising from its normal business activities. The Company places its cash in what it believes to be credit-worthy financial institutions. The Company has a diversified customer base. The Company controls credit risk related to accounts receivable through credit approvals, credit limits and monitoring procedures. The Company routinely assesses the financial strength of its customers and, based upon factors surrounding the credit risk, establishes an allowance, if required, for uncollectible accounts and, as a consequence, believes that its accounts receivable credit risk exposure beyond such allowance is limited.
Segment Reporting
FASB ASC Topic 280, “Segment Reporting,” requires use of the “management approach” model for segment reporting. The management approach model is based on the way a company’s management organizes segments within the company for making operating decisions and assessing performance. Reportable segments are based on products and services, geography, legal structure, management structure, or any other manner in which management disaggregates a company. The Company operated in one segment (i.e., mobile phones) in 2014 through Zhejiang. On January 6, 2014 the Company established Yosen Trading which is engaged in international trade and wholesale business. As a result, starting in 2014, the Company operated in two segments: mobile phones and international trade (see Note 15).
Recent Accounting Pronouncements
In July 2012, FASB issued ASU No. 2012-02, Intangibles—Goodwill and Other (Topic 350), “Testing Indefinite-Lived Intangible Assets for Impairment.” ASU 2012-02 simplifies the guidance for testing the decline in the realizable value (impairment) of indefinite-lived intangible assets other than goodwill. ASU 2012-02 allows an entity the option of first performing a qualitative assessment to determine whether it is more likely than not that an indefinite-lived intangible asset is impaired. The adoption of ASU 2012-02 did not have a material impact on the Company’s consolidated financial statements.
| 11 |
The FASB has issued ASU No. 2013-04, Liabilities (Topic 405), “Obligations Resulting from Joint and Several Liability Arrangements for Which the Total Amount of the Obligation Is Fixed at the Reporting Date .” ASU 2013-04 provides guidance for the recognition, measurement, and disclosure of obligations resulting from joint and several liability arrangements for which the total amount of the obligation within the scope of this ASU is fixed at the reporting date, except for obligations addressed within existing guidance in US GAAP. The guidance requires an entity to measure those obligations as the sum of the amount the reporting entity agreed to pay on the basis of its arrangement among its co-obligors and any additional amount the reporting entity expects to pay on behalf of its co-obligors. The amendments in this ASU are effective for fiscal years, and interim periods within those years, beginning after December 15, 2013. The adoption of ASU 2013-04 did not have a material impact on the Company’s consolidated financial statements.
In July 2013, the FASB issued ASU 2013-11, Income Taxes (Topic 740): “Presentation of Unrecognized Tax Benefit When a Net Operating Loss Carryforward, A Similar Tax Loss, or a Tax Credit Carryforward Exists (A Consensus the FASB Emerging Issues Task Force)”. ASU 2013-11 provides guidance on financial statement presentation of unrecognized tax benefit when a net operating loss carryforward, a similar tax loss, or a tax credit carryforward exists. The FASB’s objective in issuing this ASU is to eliminate diversity in practice resulting from a lack of guidance on this topic in current US GAAP. This ASU applies to all entities with unrecognized tax benefits that also have tax loss or tax credit carryforwards in the same tax jurisdiction as of the reporting date. This amendment is effective for public entities for fiscal years beginning after December 15, 2013 and interim periods within those years. The adoption of ASU 2013-11 did not have a material impact on the Company’s consolidated financial statements.
Other recent accounting pronouncements issued by the FASB (including its Emerging Issues Task Force), the AICPA, and the Securities Exchange Commission (the “SEC”) did not or are not believed by management to have a material impact on the Company’s present or future consolidated financial statements.
Note 3 – SHORT-TERM LOANS
As of September 30, 2014 and December 31, 2013, short-term loans consisted of the following:
| 2014 | 2013 | |||||||
| (Unaudited) | ||||||||
| Bank loan from Bank of Chouzhou, dated July 16, 2014, due on July 15, 2015, with an annual interest rate of 6.9% payable monthly, personally guaranteed by the CEO | $ | 812,559 | $ | - | ||||
| Bank loan from Bank of Hangzhou, dated September 26, 2014, due on March 24, 2015, with an annual interest rate of 10.0% payable monthly | 146,261 | - | ||||||
| Bank loan from Bank of Chouzhou, dated July 16, 2013, due on July 15, 2014, with an annual interest rate of 6.6% payable monthly, personally guaranteed by the CEO | - | 818,277 | ||||||
| Bank loan from Bank of Chouzhou, dated July 17, 2013, due on July 16, 2014, with an annual interest rate of 6.6% payable monthly, personally guaranteed by the CEO | - | 1,636,554 | ||||||
| Bank loan from Bank of Hangzhou, dated September 24, 2013, due on March 21, 2014, with an annual interest rate of 12.0% payable monthly | - | 163,656 | ||||||
| $ | 958,820 | $ | 2,618,487 | |||||
Note 4 - NOTES PAYABLE
As of September 30, 2014 and December 31, 2013, the terms of promissory notes are as follows:
| 2014 | 2013 | |||||||
| (Unaudited) | ||||||||
Promissory note issued by Bank of Chouzhou, dated July 16, 2014, due on January 15, 2015, bearing zero interest |
$ | 3,006,468 | $ | - | ||||
| Promissory note issued by Bank of Chouzhou, dated July 17, 2013, due on January 17, 2014, bearing zero interest | - | 736,448 | ||||||
| Promissory note issued by Bank of Chouzhou, dated July 18, 2013, due on January 17, 2014, bearing zero interest | - | 654,623 | ||||||
| $ | 3,006,468 | $ | 1,391,071 | |||||
| 12 |
Note 5 – ACCRUED EXPENSES AND OTHER PAYABLE
As of September 30, 2014 and December 31, 2013, accrued expenses and other payable consisted of the following:
| 2014 | 2013 | |||||||
| (Unaudited) | ||||||||
| Accrued expenses | $ | 217,171 | $ | 197,893 | ||||
| Other payable | 355,581 | - | ||||||
| $ | 572,752 | $ | 197,893 | |||||
Accrued expenses primarily represent accruals for general and administrative expenses. Other payable is a loan from an unrelated party which is likely to convert to equity in the future. It is currently presented as a current liability on the accompanying balance sheets.
Note 6 – LONG-TERM LOAN
As of September 30, 2014 and December 31, 2013, long-term loan consisted of the following:
| 2014 | 2013 | |||||||
| (Unaudited) | ||||||||
| Bank loan from Bank of Hangzhou, dated July 11, 2013, due on July 8, 2016, with an annual interest rate of 7.38% payable monthly | $ | 487,535 | $ | 490,966 | ||||
| $ | 487,535 | $ | 490,966 | |||||
Note 7 - COMMON STOCK
On August 23, 2013, the Company consummated the sale of 2,000,000 Units to two investors with each Unit consisting of: (i) one share of common stock, $0.001 par value per share (the "Common Stock"), of the Company and (ii) a three-year warrant (“Warrant”) to purchase one share of Common Stock of the Company at an exercise price of US$0.25 per share, for an aggregate total purchase price of $500,000. Pursuant to the agreement, 2,000,000 shares of Common Stock and 2,000,000 Warrant were issued in 2013. The Common Stock was valued at $320,000 using the market price of $0.16 per share at the grant date. The Warrant was valued using Black-Scholes option pricing model at the grant date with a FV of $320,000, see Note 6 for the assumptions used in valuing the Warrant. The FV of Warrant was credited to the additional paid in capital as these are equity instruments. On May 28, 2014, warrants to purchase 150,000 shares of common stock were exercised. As a result, 150,000 shares of common stock were issued accordingly.
On December 30, 2013, the Company issued 2,760,000 shares of common stock, under the 2012 Plan to two consultants. The common stock was valued at grant date with a FV of $828,000, which was recognized as stock based compensation expensed in 2013.
Note 8 - STOCK WARRANTS, OPTIONS, AND COMPENSATION
Stock options - Options issued have a ten-year life and were fully vested upon issuance. The option holder has no voting or dividend rights. The grant price was the market price at the date of grant. The Company records the expense of the stock options over the related vesting period. The options were valued using the Black-Scholes option-pricing model at the date of grant stock option pricing.
| 13 |
Outstanding options and warrants by exercise price consisted of the following as of September 30, 2014:
| Outstanding | Exercisable | |||||||||||||||||||||
| Exercise Price | Number of Shares |
Weighted Average Remaining Life (Years) |
Weighted Average Exercise Price |
Number of Shares |
Weighted Average Exercise Price |
|||||||||||||||||
| Options: | ||||||||||||||||||||||
| $ | 20.80 | 10,000 (1) | 2.25 | $ | 20.80 | 10,000 | $ | 20.80 | ||||||||||||||
| Warrants: | ||||||||||||||||||||||
| $ | 0.25 | 1,850,000 (2) | 1.90 | $ | 0.25 | 1,850,000 | $ | 0.25 | ||||||||||||||
(1) During the three and nine months ended 2014 and 2013, the Company did not issue any stock options. The 10,000 stock options outstanding as of September 30, 2014 were issued in 2007 to our former director Mr. Kenneth Berents, have a 10 year term and vested immediately upon issuance.
(2) In August 2013, the Company issued stock warrants to purchase 2,000,000 shares of common stock at an exercise price of $0.25 in conjunction with the common stock offering. The stock warrants expire on August 23, 2016. On May 28, 2014, warrants to purchase 150,000 shares of common stock were exercised.
Note 9 - INCOME TAXES
The US entities, Yosen Group and Yosen Trading, will file consolidated tax returns. The consolidated US entities are subject to the US federal income tax rate of 34%. Yosen Group does not conduct any operations and only incurs public company expenses, such as legal fees, accounting fees, investor relations expenses and filing fees. Yosen Trading conducts international trade and wholesale business. Prior to establishing Yosen Trading in January 2014, we determined it is more likely than not that all of Yosen Group’s deferred tax assets, arising from net operating losses, will not be realized. As a result, $556,942 of deferred tax assets and valuation allowance was recorded in 2013. Starting in January 2014, Yosen Group’s deferred tax assets will be carried forward and realized in future years.
The PRC subsidiaries, Sanhe, Wang Da, Yiwu and Zhejiang are subject to the PRC income tax at a rate of 25%. Jinhua is subject to PRC income tax using simplified tax system. In 2013, the PRC operating subsidiaries incurred a net operating loss of $1,988,624. Management believes these subsidiaries will continue to incur losses in the near future due to high market competition, slowing market demand, and rising labor and fuel costs. We believe it is more likely than not that the subsidiaries will not be able to benefit from the deferred tax assets in association with the operating losses. As a result, $450,971 of deferred tax assets and valuation allowance was recorded in 2013 for the PRC subsidiaries.
The components of deferred tax assets and liabilities as of September 30, 2014 (unaudited) and December 31, 2013 were as follows:
| 2014 | 2013 | |||||||
| Deferred tax assets: | (Unaudited) | |||||||
| US net operating losses | $ | - | $ | 556,942 | ||||
| PRC net operating losses | 134,473 | 450,971 | ||||||
| Total deferred tax assets | 134,473 | 1,007,913 | ||||||
| Less valuation allowance | (134,473 | ) | (1,007,913 | ) | ||||
| $ | - | $ | - | |||||
Reconciliation of the differences between the statutory US Federal income tax rate and the effective rate for the three months ended September 30, 2014 and 2013 is as follows:
| 2014 | 2013 | |||||||
| Tax (Credit) at US Statutory Rate | (34.0) | % | (34.0) | % | ||||
| Tax rate difference | 8.6 | % | 4.5 | % | ||||
| State, net of federal | (1.6) | % | - | % | ||||
| Valuation allowance | 23.9 | % | 29.5 | % | ||||
| Utilization of NOL | 1.0 | % | - | % | ||||
| Other | 0.6 | % | - | % | ||||
| Effective rate | (1.5) | % | - | % | ||||
| 14 |
Reconciliation of the differences between the statutory US Federal income tax rate and the effective rate for the nine months ended September 30, 2014 and 2013 is as follows:
| 2014 | 2013 | |||||||
| Tax (Credit) at US Statutory Rate | (34.0 | )% | (34.0 | )% | ||||
| Tax rate difference | 8.9 | % | 4.6 | % | ||||
| State, net of federal | (8.3 | )% | - | % | ||||
| Valuation allowance | 24.6 | % | 29.4 | % | ||||
| Utilization of NOL | - | % | - | % | ||||
| Other | (3.8) | % | - | % | ||||
| Effective rate | (12.6) | % | - | % | ||||
Note 10 - COMMITMENTS
The Company leases office facilities and warehouse under operating leases that terminate through 2014. Rent expense for the three and nine months ended September 30, 2014 was zero. Rent expense for the three and nine months ended September 30, 2013 was $4,867 and $39,593. The future minimum obligation under these agreements is $386,814 as of September 30, 2014.
Note 11 - STATUTORY RESERVE
In accordance with the laws and regulations of the PRC, a wholly-owned Foreign Invested Enterprise’s income, after the payment of the PRC income taxes, shall be allocated to the statutory surplus reserves and statutory public welfare fund. Prior to January 1, 2006, the proportion of allocation for reserve was 10% of the profit after tax to the surplus reserve fund and additional 5-10% to the public affair fund. The public welfare fund reserve was limited to 50% of the registered capital. Effective January 1, 2006, there is now only one fund requirement. The reserve is 10% of income after tax, not to exceed 50% of registered capital.
Statutory reserve funds are restricted to offset against losses, expansion of production and operation or increase in register capital of the respective company. Statutory public welfare fund is restricted to the capital expenditures for the collective welfare of employees. These reserves are not transferable to the Company in the form of cash dividends, loans or advances. These reserves are therefore not available for distribution except in liquidation. As of September 30, 2014, the Company had allocated $11,543,063 to these non-distributable reserve funds.
Note 12 – DISCONTINUED OPERATIONS
In 2011, Sanhe closed all its 210 stores in stores, Joy & Harmony closed all its 196 stores in stores, and Letong closed its direct retail and franchise operation. All three entities ceased operation as of December 31, 2011. In 2012, Yiwu closed all its 178 stores in stores, and Jinhua ceased its logistics operation. In the second quarter 2014, Wang Da closed all its stores in stores. As such, all with the exception of Joy & Harmony which dissolved in 2013, met the conditions to be reported as discontinued operations in the financial statements, and accordingly, the results of operations have been reclassified for all periods to conform to the current period's presentation.
The following table summarizes the assets and liabilities of the discontinued operations as of September 30, 2014 (unaudited) and December 31, 2013 included in the Consolidated Balance Sheets:
| 2014 | 2013 | |||||||
| Cash | 1,390,703 | 1,398,576 | ||||||
| Inventories | 129,177 | 44,717 | ||||||
| Prepaid expenses and other assets | 9,307 | - | ||||||
| Advance to suppliers | 194,198 | 51,952 | ||||||
| Advance to related parties | - | - | ||||||
| Property, plant and equipment | 25,426 | 26,328 | ||||||
| Total assets | 1,748,811 | 1,521,573 | ||||||
| Short-term loans | 812,559 | 2,454,831 | ||||||
| Notes payable | 3,006,468 | 1,391,071 | ||||||
| Income tax payable | - | 808,460 | ||||||
| Accounts payable | - | 19,263 | ||||||
| Other payable | 22,337 | 157,580 | ||||||
| Total liabilities | 3,841,364 | 4,831,205 | ||||||
| Net assets | $ | (2,092,553) | $ | (3,309,632) | ||||
| 15 |
The following table summarizes the operating results of the discontinued operations for the three and nine months ended September 30, 2014 and 2013 included in the Consolidated Statements of Operations and Comprehensive Loss (unaudited):
| Three Months Ended September 30, | ||||||||
| 2014 | 2013 | |||||||
| Sales, net | $ | 952 | $ | 356,442 | ||||
| Cost of sales | 997 | 349,691 | ||||||
| Gross profit | (45) | 6,751 | ||||||
| General and administrative expenses | (6,746) | 9,931 | ||||||
| Income (Loss) from discontinued operations | (6,791) | 16,682 | ||||||
| Other expense | (97,091) | (66,011) | ||||||
| Loss before income taxes | (103,882) | (49,329) | ||||||
| Provision for income taxes | - | - | ||||||
| Net loss from discontinued operations, net of income tax | $ | (103,882) | $ | (49,329) | ||||
| Nine Months Ended September 30, | |||||||
| 2014 | 2013 | ||||||
| Sales, net | $ | 342,103 | $ | 1,105,182 | |||
| Cost of sales | 335,671 | 1,091,072 | |||||
| Gross profit | 6,432 | 14,110 | |||||
| General and administrative expenses | 49,811 | 89,271 | |||||
| Loss from discontinued operations | (43,379) | (75,161) | |||||
| Other expense | (207,478) | (142,817) | |||||
| Loss before income taxes | (250,857) | (217,978) | |||||
| Provision for income taxes | - | - | |||||
| Net loss from discontinued operations, net of income tax | $ | (250,857) | $ | (217,978) | |||
Note 13 - OTHER COMPREHENSIVE INCOME
Other comprehensive income as included in stockholders’ deficit for the three months ended September 30, 2014 and 2013, represents foreign currency translation adjustment.
Note 14 - CURRENT VULNERABILITY DUE TO CERTAIN RISK FACTORS
The Company’s operations are in the PRC. Accordingly, the Company’s business, financial condition and results of operations may be influenced by the political, economic and legal environments in the PRC, by the general state of the PRC’s economy. The Company’s business may be influenced by changes in governmental policies with respect to laws and regulations, anti-inflationary measures, currency conversion and remittance abroad, and rates and methods of taxation, among other things.
Note 15 - MAJOR CUSTOMERS, VENDORS AND CREDIT RISK
During the three months ended September 30, 2013, three customers accounted for more than 10% of the Company’s sales, which represented 29.4%, 16.9% and 13.6%, respectively of the Company’s sales. During the nine months ended September 30, 2013, three customers accounted for more than 10% of the Company’s sales, which represented 28.7%, 14.4% and 11.7%, respectively of the Company’s sales. As of September 30, 2013, three customers comprised more than 10% of the Company’s accounts receivable, which represented 35.0%, 18.5% and 17.5%, respectively. No vendor comprised more than 10% of the Company’s accounts payable.
During the three months ended September 30, 2014, four customers accounted for more than 10% of the Company’s sales, representing 18.5%, 14.8%, 13.2% and 11.5%, respectively of the Company’s sales. During the nine months ended September 30, 2014, four customers accounted for more than 10% of the Company’s sales, representing 23.0%, 14.3%, 13.2% and 12.2%, respectively of the Company’s sales. As of September 30, 2014, no customer comprised more than 10% of the Company’s accounts receivable. Two vendors comprised more than 10% of the Company’s accounts payable, representing 36.6% and 10.5% of the Company’s accounts payable.
| 16 |
Note 16 - SEGMENT INFORMATION
In 2013, we only had one segment – mobile phones operated by Zhejiang. Zhejiang focuses on distributing Samsung and Apple brand products. Zhejiang’s operation was reported in “Mobile Phones” segment in 2013, as disclosed in the Consolidated Statements of Operations and Comprehensive Loss.
In January 2014, we established Yosen Trading which focuses on international trade and wholesale business. As a result, we have two reportable segments - mobile phones and international trade, disclosed as required by FASB ASC Topic 280, “Segment Reporting.”
The following table presents summarized information by segment:
| Three Months Ended September 30, 2014 (Unaudited) | ||||||||||||
| Mobile | International | |||||||||||
| Phones | Trade | Other | Total | |||||||||
| Sales, net | $ | 1,999,727 | $ | 435,806 | $ | - | $ | 2,435,533 | ||||
| Cost of sales | 1,944,505 | 339,234 | - | 2,283,739 | ||||||||
| Gross profit | 55,222 | 96,572 | - | 151,794 | ||||||||
| Selling, general and administrative expenses | (199,324) | (26,920) | (87,500) | (313,744) | ||||||||
| Income (Loss) from continuing operations | (144,102) | 69,652 | (87,500) | (161,950) | ||||||||
| Other expenses | (163,753) | (255) | (345) | (164,353) | ||||||||
| Benefit from (provision) for income taxes | - | (10,652) | 4,382 | (6,270) | ||||||||
| Net income (loss) from continuing operations | (307,855) | 58,745 | (83,463) | (332,573) | ||||||||
| Net loss from discontinued operations | - | - | (103,882) | (103,882) | ||||||||
| Net income (loss) | $ | (307,855) | $ | 58,745 | $ | (187,345) | $ | (436,455) | ||||
| Nine Months Ended September 30, 2014 (Unaudited) | ||||||||||||
| Mobile | International | |||||||||||
| Phones | Trade | Other | Total | |||||||||
| Sales, net | $ | 8,119,264 | $ | 1,632,429 | $ | - | $ | 9,751,693 | ||||
| Cost of sales | 7,672,650 | 1,306,927 | - | 8,979,577 | ||||||||
| Gross profit | 446,614 | 325,502 | - | 772,116 | ||||||||
| Selling, general and administrative expenses | (560,211) | (30,282) | (299,612) | (890,105) | ||||||||
| Income (Loss) from continuing operations | (113,597) | 295,220 | (299,612) | (117,989) | ||||||||
| Other Income (expense) | 10,409 | (605) | (564) | 9,240 | ||||||||
| Provision for income taxes | - | (45,223) | - | (45,223) | ||||||||
| Net income (loss) from continuing operations | (103,188) | 249,392 | (300,176) | (153,972) | ||||||||
| Net loss from discontinued operations | - | - | (250,857) | (250,857) | ||||||||
| Net income (loss) | $ | (103,188) | $ | 249,392 | $ | (551,033) | $ | (404,829) | ||||
| Total Assets | September 30, 2014 | December 31, 2013 | |||||||||
| (Unaudited) | |||||||||||
| Mobile Phones | $ | 2,295,741 | $ | 2,064,892 | |||||||
| International Trade | 857,217 | - | |||||||||
| Other | 1,681,372 | 1,904,489 | |||||||||
| $ | 4,834,330 | $ | 3,969,381 | ||||||||
| 17 |
Item 2. Management’s Discussion and Analysis of Financial Condition and Results of Operations.
Forward Looking Statements
We have included and from time to time may make in our public filings, press releases or other public statements, certain statements, including, without limitation, those under “Management’s Discussion and Analysis of Financial Condition and Results of Operations” in Part II, Item 7. In some cases these statements are identifiable through the use of words such as “anticipate,” “believe,” “estimate,” “expect,” “intend,” “plan,” “project,” “target,” “can,” “could,” “may,” “should,” “will,” “would” and similar expressions. You are cautioned not to place undue reliance on these forward-looking statements. In addition, our management may make forward-looking statements to analysts, investors, representatives of the media and others. These forward-looking statements are not historical facts and represent only our beliefs regarding future events, many of which, by their nature, are inherently uncertain and beyond our control.
The following discussion should be read in conjunction with the Consolidated Financial Statements and Notes thereto appearing elsewhere in this Quarterly Report on Form 10-Q. The following discussion contains forward-looking statements. Our actual results may differ significantly from those projected in the forward-looking statements. Factors that may cause future results to differ materially from those projected in the forward-looking statements include, but are not limited to, those discussed in “Risk Factors” and elsewhere in this Quarterly Report on Form 10-Q.
| 18 |
Overview
Yosen owns 100% of Capital and Capital owns 100% of Joy & Harmony and Sanhe. Until August 14, 2007, when it made the change to its ownership structure described in the next paragraph to comply with certain requirements of the PRC law, Capital owned 100% of the capital stock of Zhejiang. Zhejiang owns 90% and Yiwu owns 10% of Wang Da. Zhejiang owns 90% and Wang Da owns 10% of Yiwu. On March 10, 2009 Zhejiang set up a new operating entity, Hangzhou Letong Digital Technology Co., Ltd. (“Letong”) to establish an electronic retail franchise operation for Yosen. On July 6, 2009, Zhejiang and Yiwu completed the acquisition of Jinhua Baofa Logistic Ltd (“Jinhua”). Jinhua was incorporated under the laws of PRC on December 27, 2001.
On December 21, 2005, Capital became a wholly owned subsidiary of Yosen through a merger with a wholly owned subsidiary of the Company (the “Merger Transaction”). Yosen acquired all of the issued and outstanding capital stock of Capital pursuant to a the Merger Agreement dated at December 21, 2005 by and among Yosen, XY Acquisition Corporation, Capital and the shareholders of Capital (the “Merger Agreement”). Pursuant to the Merger Agreement, Capital became a wholly owned subsidiary of Yosen and, for the Capital shares, Yosen issued 7,000,000 shares of its common stock to the shareholders of Capital, representing 93% of the issued and outstanding capital stock of Yosen at that time and cash of $500,000. On August 15, 2007, we executed a series of contractual agreements between Capital and Zhejiang. The contractual agreements gave Capital and its equity owners an obligation, and having ability to absorb, any losses, and rights to receive returns; however, these contractual agreements did not change the equity ownership of Zhejiang. We did not dispose Capital’s equity ownership of Zhejiang when we executed the contractual agreements. Capital entered into share-holding entrustment agreements with five individuals: Zhenggang Wang, Yimin Zhang, Huiyi Lv, Xiaochun Wang and Zhongsheng Bao to hold 35%, 20%, 20%, 15% and 10%, respectively, of the equity interest of Zhejiang on behalf of Capital on November 21, 2005. The entrustment agreements confirm that Capital is the actual owner of Zhejiang. Capital enjoys the actual shareholder’s rights and has the right to obtain any benefits received by the nominal holders. Zhenggang Wang is the CEO and shareholder of Yosen. Yimin Zhang, Huiyi Lv, Xiaochun Wang and Zhongsheng Bao have no other relationship with Yosen. No consideration was given to these individuals who held the equity of Zhejiang on behalf of Capital.
As a result of the Merger Agreement, the reorganization was treated as an acquisition by the accounting acquiree, accounted for as a recapitalization and reverse merger by the legal acquirer for accounting purposes. Pursuant to the recapitalization, all capital stock shares and amounts and per share data were retroactively restated. Accordingly, the financial statements include the following:
(1) The balance sheet consists of the net assets of the accounting acquirer at historical cost and the net assets of the legal acquirer at historical cost.
(2) The statements of operations include the operations of the accounting acquirer for the period presented and the operations of the legal acquirer from the date of the merger.
Pursuant to a share exchange agreement, dated August 3, 2006, we issued 183,150 shares of restricted common stock to the former shareholders of Sanhe, valued at $3,750,000, which was the fair value (“FV”) of the shares at the date of the share exchange agreement. This amount is included in the cost of net assets and goodwill purchased.
Pursuant to a share exchange agreement, dated November 28, 2006, we issued 544,622 newly issued shares of common stock to the former shareholders of Joy & Harmony, valued at $11,000,000, which was the FV of the shares at the date of exchange agreement. This amount is included in the cost of net assets and goodwill purchased.
On July 6, 2009, Yosen’s subsidiaries, Zhejiang and Yiwu completed acquisition of Jinhua, a company organized under the laws of the PRC. Zhejiang acquired 90% and Yiwu acquired 10% of the equity interests in Jinhua from the shareholders of Jinhua for RMB120,000,000 ($17,500,000) in cash.
Sanhe and Letong ceased operations in 2011. Joy & Harmony ceased operation in 2011 and dissolved in 2013. Yiwu closed all its stores in stores locations in 2012. Jinhua ceased operation in October 2012
On December 21, 2012, we received confirmation from the Secretary of State of the State of Nevada that the Certificate of Change Pursuant to NRS 78.209 (the “Certificate of Change”) to our Amended and Restated Articles of Incorporation to effect a reverse split of our common stock, $0.001, par value per share (the “Common Stock”), at a ratio of 1-for-5 with all fractional shares rounded up to the next whole share (the “Reverse Stock Split”) was duly filed on December 21, 2012. Immediately prior to the Reverse Stock Split, we had 93,911,327 shares of Common Stock outstanding. After the Reverse Stock Split, we had 18,782,356 shares outstanding. Pursuant to the Reverse Stock Split, the number of authorized shares of our Common Stock was reduced from 100,000,000 to 20,000,000 shares of Common Stock. Each shareholder's percentage ownership interest in the Company and proportional voting power remained unchanged after the Reverse Stock Split except for minor changes and adjustments resulting from rounding up the fractional shares.
| 19 |
Immediately, following the consummation of the Reverse Stock Split, on December 21, 2012, we filed a Certificate of Amendment to our Amended and Restated Articles of Incorporation pursuant to NRS 78.385 and 78.390 (the “Certificate of Amendment”) to increase our number of authorized shares of Common Stock from 20,000,000 to 50,000,000 shares (the “Capital Increase Amendment”) and to approve the amendment of our Articles of Incorporation to change our name to “Yosen Group, Inc.” (the “Name Change Amendment)”. The Reverse Stock Split, Capital Increase Amendment and the Name Change Amendment were approved by the board of directors (“BOD” or “Board”) of the Company on October 10, 2012. In addition, the actions taken by the BOD with respect to the Capital Increase Amendment and the Name Change Amendment were subsequently adopted by the written consent dated as of October 10, 2012 of our stockholders entitled to vote a majority of the shares of Common Stock then outstanding. The Reverse Stock Split was also ratified by these stockholders.
Following the filing of the Name Change Amendment, we changed our stock symbol to “YOSN” effective as of the opening of trading on January 30, 2013 on the OTCBB.
On January 6, 2014 the Company established a US based wholly-owned subsidiary, Yosen Trading, for the purpose of engaging primarily in international trade and wholesale business, initially with tile, kitchen cabinet, granite and marble products.
Results of Operations for the Three and Nine Months Ended September 30, 2014 and 2013
Reportable Operating Segments
In 2011, Sanhe closed all its 210 stores in stores, Joy & Harmony closed all its 196 stores in stores, and Letong closed its direct retail and franchise operation. In 2012, Yiwu closed all its 178 stores in stores, and Jinhua closed its logistics operations. In 2014, Wang Da closed all its store in stores. As such, Sanhe, Letong, Yiwu, Jinhua and Wang Da were reported as discontinued operations in the financial statements.
The Company reports financial and operating information in continuing operations through two segments, mobile phones segment by Zhejiang and international trade by Yosen Trading:
| a) | Mobile phones | |
| b) | International trade |
| a) | Mobile phones |
Zhejiang focuses on distribution of Samsung and Apple brand products.
| Three Months Ended September 30, | Percentage | ||||||||||
| Mobile phones | 2014 | 2013 | Change | ||||||||
| Revenue | $ | 1,999,727 | $ | 2,197,149 | (9.0) | % | |||||
| Gross Profit | $ | 55,222 | $ | 119,488 | (53.8) | % | |||||
| Profit Margin | 2.8 | % | 5.4 | % | (2.6) | % | |||||
| Operating Loss | $ | (144,103) | $ | (164,650 | ) | (12.5) | % | ||||
| Nine Months Ended September 30, | Percentage | ||||||||||
| Mobile phones | 2014 | 2013 | Change | ||||||||
| Revenue | $ | 8,119,264 | $ | 8,195,022 | (9.0) | % | |||||
| Gross Profit | $ | 446,614 | $ | 430,596 | 3.7 | % | |||||
| Profit Margin | 5.5 | % | 5.3 | % | 0.2 | % | |||||
| Operating Income (Loss) | $ | (113,597) | $ | (653,635 | ) | (82.6) | % | ||||
For the three months ended September 30, 2014, Mobile phones generated revenue of $1,999,727, a decrease of $197,422 or 9.0% compared to $2,197,149 for the three months ended September 30, 2013. The decrease in revenue was primarily due to lack of new products introduced by Apple and Samsung in China in the third quarter of 2014. For the nine months ended September 30, 2014, Mobile phones generated revenue of $8,119,264, a decrease of $75,758 or 0.9% compared to $8,195,022 for the nine months ended September 30, 2013.
Gross profit decreased $64,266 or 53.8% from $119,488 for the three months ended September 30, 2013 to $55,222 for the three months ended September 30, 2014. Profit margin decreased from 5.4% in the three months ended September 30, 2013 to 2.8% in the three months ended September 30, 2014, a decrease of 2.6%. Gross profit increased $16,018 or 3.7% from $430,596 for the nine months ended September 30, 2013 to $446,614 for the nine months ended September 30, 2014. Profit margin increased 0.2% from 5.3 % in the nine months ended September 30, 2013 to 5.5% in the nine months ended September 30, 2014.
Operating loss was $144,103 for the three months ended September 30, 2014, a decrease of $20,547 or 12.5% compared to $164,650 for the three months ended September 30, 2013. Operating loss was $653,635 for the nine months ended September 30, 2013, compared to operating loss of $113,597 for the nine months ended September 30, 2014. Operating loss decreased primarily due to control on general and administrative expenses to cut losses.
| 20 |
| b) | International Trade |
Starting first quarter 2014, Yosen Trading is engaged in international trade and wholesale business, primarily selling tile, kitchen cabinet, granite and marble products in the New York Market.
| Three Months Ended September 30, 2014 | ||||
| Revenue | $ | 435,806 | ||
| Gross Profit | $ | 96,572 | ||
| Profit Margin | 22.2 | % | ||
| Operating Income | $ | 69,651 | ||
| Nine Months Ended September 30, 2014 | ||||
| Revenue | $ | 1,632,429 | ||
| Gross Profit | $ | 325,502 | ||
| Profit Margin | 19.9 | % | ||
| Operating Income | $ | 295,220 | ||
Total Company
Net Sales
Net sales for the three months ended September 30, 2014 increased by 10.8%, to $2,435,533 compared to $2,197,149 for the three months ended September 30, 2013. Net sales for the nine months ended September 30, 2014 increased by 19.0%, to $9,751,693 compared to $8,195,022 for the nine months ended September 30, 2013. The increase was primarily attributable to the new revenue generated from the international trade business.
Percentage of Sales
Percentage of sales from retail and wholesale operations for each segment is as follows in the three months ended September 30, 2014:
| Mobile Phones | International Trade | Total | ||||||||||
| Retail | 90.2 | % | 22.9 | % | 56.6 | % | ||||||
| Wholesale | 9.8 | % | 77.1 | % | 43.4 | % | ||||||
Percentage of sales from retail and wholesale operations for each segment is as follows in the nine months ended September 30, 2014:
| Mobile Phones | International Trade | Total | ||||||||||
| Retail | 90.2 | % | 23.4 | % | 59.8 | % | ||||||
| Wholesale | 9.8 | % | 76.6 | % | 40.2 | % | ||||||
Percentage of sales from retail and wholesale operations for each segment is as follows in the three months ended September 30, 2013:
| Mobile Phones | International Trade | Total | ||||||||||
| Retail | 97.9 | % | - | % | 97.9 | % | ||||||
| Wholesale | 2.1 | % | - | % | 2.1 | % | ||||||
Percentage of sales from retail and wholesale operations for each segment is as follows in the nine months ended September 30, 2013:
| Mobile Phones | International Trade | Total | ||||||||||
| Retail | 98.0 | % | - | % | 98.0 | % | ||||||
| Wholesale | 2.0 | % | - | % | 2.0 | % | ||||||
| 21 |
Cost of Sales
Cost of sales (“COS”) for the three months ended September 30, 2014 was $2,283,739 compared to $2,077,661 for the three months ended September 30, 2013, an increase of 9.9%. COS for the nine months ended September 30, 2014 was $8,979,577 compared to $7,764,426 for the nine months ended September 30, 2013, an increase of 15.7%. The increased COS for the three and nine months was a result of the increase in sales from the comparable periods.
Gross Profit
Gross profit for the three months ended September 30, 2014 was $151,794 compared to gross profit of $119,488 for the three months ended September 30, 2013, an increase of 27.0%. Gross profit for the nine months ended September 30, 2014 was $772,116 compared to gross profit of $430,556 for the nine months ended September 30, 2013, an increase of 79.3%. The increased gross profit for the three and nine months ended September 30, 2014 was due to gross profit generated from the international trade business.
Profit Margin
Profit margin for the three months ended September 30, 2014 was 6.2% compared to 5.4% for the three months ended September 30, 2013. Profit margin for the nine months ended September 30, 2014 was 7.9% compared to 5.3% for the nine months ended September 30, 2013. The profit margin increase was mainly attributed to newly established international trade business having a higher profit margin.
Selling, General and Administrative Expenses
Selling, general and administrative expenses for the three months ended September 30, 2014 were $313,745 or 12.9% of net sales, compared to $449,832 or 20.5% of net sales for the three months ended September 30, 2013, a decrease of 7.6% of sales. Selling, general and administrative expenses for the nine months ended September 30, 2014 were $890,106 or 9.1% of net sales, compared to $1,677,373 or 20.5% of net sales for the nine months ended September 30, 2013, a decrease of 11.4% of sales. The decrease in selling, general and administrative expenses was primarily due to decrease in staff related cost and store management fees.
Operating Loss from Continuing Operations
Operating loss for the three months ended September 30, 2014 was $161,951 or (6.6)% of net sales compared to $330,344 or (15.0)% of net sales for the three months ended September 30, 2013. Operating loss for the nine months ended September 30, 2014 was $117,990 or (1.2)% of net sales compared to $1,246,777 or (15.2)% of net sales for the nine months ended September 30, 2013. Higher gross profit and lower operating expense was the key factors for the decrease in operating loss from continuing operations during the three and nine months ended September 30, 2014 compared to 2013.
Other (Income) Expense
Other income for the three and nine months ended September 30, 2014 were $98,916 and $313,355 compared to $14,847 and $51,065 for the same periods in 2013. Other income consists primarily of commission income from China Unicom related to sales of China Unicom’s wireless service and products. Other expense for the three and nine months ended September 30, 2014 were $263,313 and $313,745 compared to $16,867 and $26,708 for the same periods in 2013. Other expense consisted primarily of interest expense associated with Zhejiang’s bank loans.
Provision for Income Taxes
The provision for income taxes for the three and nine months ended September 30, 2013 were $0 due to losses incurred by Zhejiang. The provision for income taxes the three and nine months ended September 30, 2014 were $6,270 and $45,223 attributed to Yosen Trading.
Net Loss from Continuing Operations
Net loss from continuing operations was $332,573 or (13.7)% of net sales for the three months ended September 30, 2014 compared to $332,230 or (15.1)% of net sales for the three months ended September 30, 2013. Net loss from continuing operations was $153,972 or (1.6)% of net sales for the nine months ended September 30, 2014 compared to net loss of $1,217,277 or (14.9)% of net sales for the nine months ended September 30, 2013. Higher gross profit and lower operating expenses was the key factors for the decrease in net loss from continuing operations during the three and nine months ended September 30, 2014 compared to 2013.
Net Loss from Discontinued Operations
Net loss from discontinued operations for the three months ended September 30, 2014 was $103,882 compared to $49,329 for 2013, an increase of $54,553. Net loss from discontinued operations for the nine months ended September 30, 2014 was $250,857 compared to $217,978 for 2013, an increase of $32,879. Net Loss from discontinued operations increased primarily due to increased interest expenses incurred by Yiwu.
| 22 |
Net Loss
Net loss was $436,455 for the three months ended September 30, 2014 compared to $381,559 for the three months ended September 30, 2013.Net loss for the three months ended September 30, 2014 increased due to the increased loss from discontinued operations. Net loss was $404,829 for the nine months ended September 30, 2014 compared to $1,435,255 for the nine months ended September 30, 2013. The decrease in net loss was primarily due to higher gross profit and decreased G&A expenses.
Foreign Currency Translation Adjustments
The impact of foreign translation from our accounts in RMB to US dollar on Yosen’s operating results was not material. During the translation process, the assets and liabilities of all PRC subsidiaries are translated into US dollars at period-end exchange rates. The revenues and expenses are translated into US dollars at average exchange rates of the periods. Resulting translation adjustments are recorded as a component of accumulated other comprehensive income within stockholders’ equity.
| Nine
Months Ended September 30, |
||||||||
| 2014 | 2013 | |||||||
| RMB/$ exchange rate at period end | 0.1625 | 0.1630 | ||||||
| Average RMB/$ exchange rate for the periods | 0.1624 | 0.1609 | ||||||
Transaction gains or losses arising from exchange rate fluctuation on transactions denominated in a currency other than the functional currency were included in the consolidated results of operations. As a result of the translation, Yosen recorded a foreign currency loss of $71,053 in the three months ended September 30, 2014 and $1,534 in the comparable period in 2013. Yosen recorded a foreign currency loss of $59,326 in the nine months ended September 30, 2014 and a foreign currency gain of $21,677 in 2013, which is a separate line item on the Statements of Operations and Comprehensive Loss.
Liquidity and Capital Resources
During the nine months ended September 30, 2014, cash has been mostly generated from financing activities. Operations and liquidity needs are funded primarily through cash flows from bank loans. Cash and equivalents were $1,523,345 at September 30, 2014, compared to $1,426,018 at December 31, 2013.
Our cash flows for the nine month periods are summarized as follows:
| Nine Months Ended September 30, | ||||||||
| 2014 | 2013 | |||||||
| Net cash used in operating activities | $ | (233,686 | ) | $ | (1,478,239 | ) | ||
| Net cash provided by financing activities | 351,760 | 2,320,961 | ||||||
| Effect of exchange rate change on cash and equivalents | (20,747 | ) | 113,156 | |||||
| Net increase in cash and equivalents | 97,327 | 955,878 | ||||||
| Cash and equivalents at beginning of period | 1,426,018 | 456,495 | ||||||
| Cash and equivalents at end of period | $ | 1,523,345 | $ | 1,412,373 | ||||
Operating Activities
Net cash used in operating activities was $233,686 for the nine months ended September 30, 2014 compared to $1,478,239 used in operating activities for the nine months ended September 30, 2013. Net cash used in operating activities was mainly attributable to several factors, including (i) decrease in net loss of $1,030,706, (ii) increase in accounts receivable of $344,978, (iii) increase in advance to suppliers of $261,658, (iv) increase in advanced to related party of $152,870, offset by the increase in accounts payable of $392,604, add back of stock compensation of $273,952.
| Nine Months Ended September 30, | ||||||||||||
| 2014 | 2013 | Percentage Change |
||||||||||
| Sales, Net | $ | 9,751,693 | $ | 8,195,022 | 19.0 | % | ||||||
| Accounts receivable | $ | 557,576 | $ | 66,799 | 734.7 | % | ||||||
| 23 |
Accounts receivable increased 734.7% in the first nine months of 2014 while sales increased 19.0%. Accounts receivable as a percentage of sales increased primarily due to the increase of accounts receivable in international trade business. Management monitors and periodically assesses the collectability of accounts receivable to ensure the allowance for bad debts account is reasonably estimated. Collection of accounts receivable is based on the terms of legally binding documents. Our accounts receivable department has periodically reviewed the allowance for doubtful accounts. The bad debts allowance is based on the aging of receivables, credit history and credit quality of the customers, the term of the contracts as well as the balance outstanding. If an account receivable item is considered probable to be uncollectible, it will be charged to bad debts accordingly.
Cash and equivalents as of September 30, 2014 and December 31, 2013 were solely bank accounts in US and China. Specifically, cash and equivalents for each subsidiary as of September 30, 2014 and December 31, 2013 included:
| Name of Entities | Region | Currency | September 30, 2014 | December 31, 2013 | ||||||||
| Yosen | US entity | USD | 13,087 | 135 | ||||||||
| Yosen Trading | US entity | USD | 60,842 | - | ||||||||
| Zhejiang | Chinese entity | RMB | 361,285 | 167,678 | ||||||||
| Yiwu | Chinese entity | RMB | 8,533,599 | 8,526,143 | ||||||||
| Wang Da | Chinese entity | RMB | 23,368 | 17,694 | ||||||||
| Jinhua | Chinese entity | RMB | - | 458 | ||||||||
| Sanhe | Chinese entity | RMB | 586 | 743 | ||||||||
Cash equivalents held in the PRC subsidiaries are not freely transferrable outside the country. The amounts not freely transferable as of September 30, 2014 and December 31, 2013 were RMB 8,918,838 ($1,449,416) (unaudited) and RMB 8,712,716 ($1,425,883).
Capital Expenditures
We did not have any capital expenditures for the first nine months of 2014 and 2013.
Working Capital Requirements
Historically operations and short term financing have been sufficient to meet our cash needs. We believe we will be able to generate revenues from sales and raise capital through private placement offerings of our equity securities to provide the necessary cash flow to meet anticipated working capital requirements. However, our actual working capital needs for the long and short term will depend upon numerous factors, including operating results, competition, and the availability of credit facilities, none of which can be predicted with certainty. Future expansion will be limited by the availability of financing products and raising capital.
Off-Balance Sheet Arrangements
We have never entered into any off-balance sheet arrangements and have never established any special purpose entities. We have not guaranteed any debt or commitments of other entities or entered into any options on non-financial assets.
Critical Accounting Policies
Our discussion and analysis of our financial condition and results of operations is based upon our consolidated financial statements, which have been prepared in accordance with accounting principles generally accepted in the United States. The preparation of these consolidated financial statements requires us to make estimates, judgments and assumptions that affect the reported amounts of assets, liabilities, revenues and expenses, and the related disclosure of contingent assets and liabilities. We base our estimates on historical experience and on various other assumptions that we believe are reasonable under the circumstances, the results of which form the basis for making judgments about the carrying values of assets and liabilities that are not readily apparent from other sources. Actual results may differ from these estimates.
An accounting policy is considered to be critical if it requires an accounting estimate to be made based on assumptions about matters that are highly uncertain at the time the estimates are made, and if different estimates that reasonably could have been used, or changes in the accounting estimates that are reasonably likely to occur, could materially impact the consolidated financial statements. We believe the following critical accounting policies reflect the more significant estimates and assumptions used in the preparation of the consolidated financial statements.
Revenue Recognition
Our revenues are generated from sales of electronics products. All of our revenue transactions contain standard business terms and conditions. We determine the appropriate accounting for these transactions after considering (1) whether a contract exists; (2) when to recognize revenue on the deliverables; and (3) whether all elements of the contract have been fulfilled and delivered. In addition, our revenue recognition policy requires an assessment as to whether collection is reasonably assured, which inherently requires us to evaluate the creditworthiness of our customers. Changes in judgments on these assumptions and estimates could materially impact the timing or amount of revenue recognition.
Please refer to Note 2 in the footnotes to the financial statements for detailed description of our revenue recognition policy.
| 24 |
Inflation
Neither inflation nor changing prices has had a material impact on the Company’s net sales, revenues or continuing operations during the past three fiscal years.
After Sales Service
The after-sales services we provide to our customers are primarily repair and maintenance. If a customer buys a product from us and needs repairs, we can usually arrange to have the manufacturer repair the product. In certain cases, clerks in our stores are able to make the repairs directly.
Tabular Disclosure of Contractual Obligations
Not applicable.
Item 3. Quantitative and Qualitative Disclosures About Market Risk.
Not applicable.
Item 4. Controls and Procedures.
Evaluation of Disclosure Controls and Procedures
Under the supervision and with the participation of our management, including our principal executive officer and principal financial officer, our management conducted an evaluation of our disclosure controls and procedures as of September 30, 2014, as such term is defined in Rules 13a-15(e) and 15d-15(e) under the Exchange Act. Based on this evaluation, our principal executive officer and principal financial officer concluded that, as of such date, the Company’s disclosure controls and procedures were not effective due to the material weakness in our internal controls identified in our Annual Report on Form 10-K for the year ended December 31, 2013.
Disclosure controls and procedures are designed to ensure that information required to be disclosed by us in our Exchange Act reports is recorded, processed, summarized, and reported within the time periods specified in the SEC’s rules and forms, and that such information is accumulated and communicated to our management, including our principal executive officer and principal financial officer, or persons performing similar functions, as appropriate, to allow timely decisions regarding required disclosures.
Changes in Internal Control Over Financial Reporting
There was no change in our internal control over financial reporting that occurred during the first nine months of 2014 covered by this Quarterly Report on Form 10-Q that has materially affected, or is reasonably likely to materially affect, our internal control over financial reporting.
| 25 |
We are not currently a party to any material legal proceedings. From time to time, however, we may become involved in various lawsuits and legal proceedings which arise in the ordinary course of business.
There have been no material changes from the Risk Factors previously disclosed in the Company’s Annual Report on Form 10-K for its year ended December 31, 2013.
Item 2. Unregistered Sales of Equity Securities and Use of Proceeds.
None.
Item 3. Defaults Upon Senior Securities.
None.
Item 4. Mine Safety Disclosures.
Not applicable.
None.
Exhibit No. |
Document Description | |
| 31.1 | Certification of the Chief Executive Officer pursuant to Rule 13A-14(A)/15D-14(A) of the Securities Exchange Act of 1934, as adopted pursuant to Section 302 of the Sarbanes-Oxley Act of 2002. | |
| 31.2 | Certification of the Chief Financial Officer pursuant to Rule 13A-14(A)/15D-14(A) of the Securities Exchange Act of 1934, as adopted pursuant to Section 302 of the Sarbanes-Oxley Act of 2002. | |
| 32.1 | Certification of the Chief Executive Officer and Chief Financial Officer pursuant to 18 U.S.C. 1350 (Section 906 of the Sarbanes-Oxley Act of 2002). | |
| 101 | The following financial statements from China 3C Group’s Quarterly Report on Form 10-Q for the quarterly period ended September 30, 2013 formatted in XBRL (eXtensible Business Reporting Language): (i) the Consolidated Balance Sheets (unaudited); (ii) the Consolidated Statements of Operations and Comprehensive Loss (unaudited); (iii) the Consolidated Statements of Cash Flows (unaudited); and, (iv) the Notes to Consolidated Financial Statements, tagged as blocks of text. |
| 26 |
Pursuant to the requirements of the Securities Exchange Act of 1934, the registrant has duly caused this report to be signed on its behalf by the undersigned thereunto duly authorized.
| YOSEN GROUP, INC. | ||
| Date: November 14, 2014 | By: | /s/ Zhenggang Wang |
| Name: Zhenggang Wang | ||
| Title: Chief Executive Officer and Chairman | ||
| (Principal Executive Officer) | ||
| Date: November 14, 2014 | By: | /s/ Weiping Wang |
| Name: Weiping Wang | ||
Title: Chief Financial Officer (Principal Accounting and Financial Officer) | ||
EXHIBIT INDEX
Exhibit No. |
Document Description | |
| 31.1 | Certification of the Chief Executive Officer pursuant to Rule 13A-14(A)/15D-14(A) of the Securities Exchange Act of 1934, as adopted pursuant to Section 302 of the Sarbanes-Oxley Act of 2002. | |
| 31.2 | Certification of the Chief Financial Officer pursuant to Rule 13A-14(A)/15D-14(A) of the Securities Exchange Act of 1934, as adopted pursuant to Section 302 of the Sarbanes-Oxley Act of 2002. | |
| 32.1 | Certification of the Chief Executive Officer and Chief Financial Officer pursuant to 18 U.S.C. 1350 (Section 906 of the Sarbanes-Oxley Act of 2002). |
101 The following financial statements from China 3C Group’s Quarterly Report on Form 10-Q for the quarterly period ended September 30, 2013 formatted in XBRL (eXtensible Business Reporting Language): (i) the Consolidated Balance Sheets (unaudited); (ii) the Consolidated Statements of Operations and Comprehensive Loss (unaudited); (iii) the Consolidated Statements of Cash Flows (unaudited); and, (iv) the Notes to Consolidated Financial Statements, tagged as blocks of text.
| 27 |