Attached files
| file | filename |
|---|---|
| 8-K - FORM 8-K - Premier, Inc. | d818966d8k.htm |
| EX-99.2 - EX-99.2 - Premier, Inc. | d818966dex992.htm |
| EX-99.1 - EX-99.1 - Premier, Inc. | d818966dex991.htm |
 First Quarter Fiscal 2015
Financial Results and Update
November 10, 2014
Exhibit 99.3 |
 1
Forward-looking statements and Non-GAAP financial
measures
Forward-looking
statements—
presentation, including, but not limited to, those related to our financial and
business outlook, strategy and growth drivers, acquisition activities and
pipeline, revenue available under contract, and financial guidance and
related
assumptions,
are
“forward-looking
statements.”
Forward-looking
statements
may
involve
known
and unknown risks, uncertainties and other factors that may cause the actual
results of Premier to be materially different from historical results or
from any future results or projections expressed or implied by such
forward-looking statements. Accordingly, readers should not place undue reliance on any forward
looking statements. Readers are urged to consider statements in the conditional or
future tenses or that include
terms
such
as
“believes,”
“belief,”
“expects,”
“estimates,”
“intends,”
“anticipates”
or
“plans”
to
be
uncertain and forward-looking.
Forward-looking statements may include comments as to Premier’s beliefs
and expectations as to future events and trends affecting its business and
are necessarily subject to uncertainties,
many
of
which
are
outside
Premier’s
control.
More
information
on
potential
risks
and
other
factors
that
could
affect
Premier’s
financial
results
is
included,
and
updated,
from
time
to
time,
in
Premier’s
periodic and current filings with the SEC and available on Premier’s website,
including Premier’s most recent
Form
10-K
for
the
year
ended
June
30,
2014.
Forward-looking
statements
speak
only
as
of
the
date
they are made. Premier undertakes no obligation to publicly update or revise any
forward-looking statements.
Certain
statements
made
during
this
conference
call
and
included
in this
Non-GAAP
financial
measures—
defined in Regulation G under the Securities Exchange Act of 1934. Schedules are
attached that reconcile the non-GAAP financial measures included in the
following presentation to the most directly comparable financial measures
calculated and presented in accordance with Generally Accepted Accounting Principles
in the United States. The press release attached as an Exhibit to our Form 8-K
filed with the SEC in connection with our earnings call, as well as our Form
10-Q for the quarter ended September 30, 2014 to be filed shortly
hereafter, provides further explanation and disclosure regarding our use of non-GAAP
financial measures and should be read in conjunction with these supplemental
slides. This
presentation
includes
certain
“non-GAAP
financial
measures”
as |
 Susan DeVore, President & CEO
Overview and Business Update |
 3
First-quarter highlights
1
(1) Comparisons are with year-ago pro forma information that reflects the
impact of the company’s reorganization and initial public offering. See Adjusted EBITDA,
Segment Adjusted EBITDA and Adjusted Fully Distributed Net Income reconciliations
to GAAP equivalents in Appendix. Acquired assets providing value and
growth Adjusted fully distributed net income per diluted
share of $0.33, increased 6% from prior year
Adjusted EBITDA rose 9% from prior year
SCS revenue exceeded and PS revenue in line with
company expectations
Net revenue up 15% from prior year, driven by double-
digit growth in both business segments
Strong start to fiscal 2015; affirming full-year guidance
|
 4
Supply Chain Services revenue growth drivers
Solid GPO net administrative fees
revenue growth, up 4.1% year-over-year
on a pro forma basis
Products revenue up 45% year-over year |
 5
Performance Services revenue growth drivers
11% revenue growth consistent with
first-quarter expectations, driven by:
•
SaaS-based subscription growth, particularly
from PremierConnect
®
Enterprise and
Population Health Management
•
Advisory services and performance
improvement collaborative growth
•
One month of revenue from TheraDoc and
Aperek acquisitions |
 6
Member and
industry needs
Scale
Co-innovation
Intelligence to transform from the inside
Leadership in population health
Shared infrastructure
Premier strategic
differentiation
•
Total cost reduction
•
Quality improvement
across the continuum
•
Evolving delivery and
payment models
•
Actionable data and
information
Unique business model addresses industry challenges
Helping health systems manage challenges, optimize
the transition, and build for the future….
…all at the same time |
 7
Delivering practical insights to facilitate and inform future
healthcare decision making
Premier establishes Ebola rapid response
center
Premier and CDC research reveals potential
safety and cost implications of unnecessary
and duplicative antibiotic use in hospitals
Premier blood utilization analysis reveals
significant cost and quality improvement
opportunities for hospitals
Premier and eHealth Initiative survey shows
threat to ACOs from poor interoperability
across technology systems |
 8
Population health management initiatives
Building and piloting the first perioperative
surgical home collaborative with 43 hospitals
across the country
Co-developing a system-wide population
health collaborative, including up to 20
Medicare Shared Savings Program sites
Constructing new models to create greater
physician alignment
Major Catholic
integrated delivery
network
Large midwest
health system
Florida Medicare
Shared Savings
program
Building a care management platform to
manage high-risk patients |
 Michael Alkire, Chief Operating Officer
Operations Update |
 10
Integrated solutions to complex challenges
Unified
sales/field
SUPPLY CHAIN SERVICES
PERFORMANCE SERVICES
Group purchasing, serving both
acute and alternate site
•
Physician preference
•
Capital equipment
Direct sourcing
Specialty pharmacy
Real-time demand aggregation
and purchasing
SaaS-based analytic products
in cost, quality, safety &
population health
Enterprise data analytics
platform
Collaboratives
Advisory services
Change the game in supply chain,
uncover unmatched savings and value,
and lead the disruption in this industry
Become the data analytics “backbone”
with wrap-around services for cost and
quality improvement over the short-term,
and for population health management
over the long-term |
 11
Select first-quarter healthcare system new business
•
GPO
•
PremierConnect Quality, Operations & Supply Chain
•
Provider of Choice
•
QUEST & PACT collaboratives
•
GPO
•
Yankee Alliance Supply Chain Solutions
•
PremierConnect Quality & Supply Chain
•
GPO
•
PremierConnect
•
ASCEND collaborative |
 12
Strategic acquisition integration
Clinical & Physician
Preference Solution
Data Management
Expanded Cost
Reduction
Supply Chain
Technology
Enablement
Total Quality
Management
Physician preference contract management and data services
•
Closed July 2013
•
14 new customers signed in fiscal first quarter
•
72 current customers representing 284% growth over 14 months
•
Product continues to deliver double digit cost savings
Strategic Need
Company
Data acquisition and integration as-a-service
•
Closed October 2013
•
Delivering revenue and decreasing operating expenses while improving
integration capabilities across all products
•
Instrumental to implementation of real-time analytics for PremierConnect
Quality
Capital equipment planning, sourcing, analytics
•
Closed April 2014
•
Added 11 engagements since acquisition, including 3 in FYQ1
•
Member savings from 10%-18% off of best member negotiated price
Supply chain workflow and analytics
•
Closed August 2014
•
Key asset in current recruiting efforts
•
Full retention of customers
•
Key asset for evolution of Supply Chain model
Clinical surveillance software
•
Closed September 2014
•
Significant impact to market share with ~600 installs, ~400 new customers
•
Penetration of academic health system market
•
Instrumental in planned migration to next-generation safety surveillance
solution
•
Full retention of existing accounts and achieving additional sales since
acquisition
Details and Progress |
 13
Expanding and deploying Premier capabilities
PremierConnect
®
Enterprise &
Data Alliance Collaborative
Leading developer of cloud-based
predictive analytics platform
Innovation in ambulatory data integration
Data integration project with major health
system underway, using Meddius technology
PremierConnect integrating ambulatory data
across diverse EMR systems
Health system will have actionable data across
both acute care locations and network clinics |
 Craig McKasson, Chief Financial Officer
Financial Review |
 15
First-quarter consolidated and segment highlights
1
Consolidated
Net revenue (millions)
Supply Chain Services
Net revenue (millions)
Performance Services
Net revenue (millions)
(1) See Adjusted EBITDA and Segment Adjusted EBITDA reconciliations to GAAP
equivalents in Appendix; financial information for the fiscal 2014 first quarter is
pro forma and has been adjusted to reflect the impact of the company’s
reorganization and IPO. Consolidated |
 16
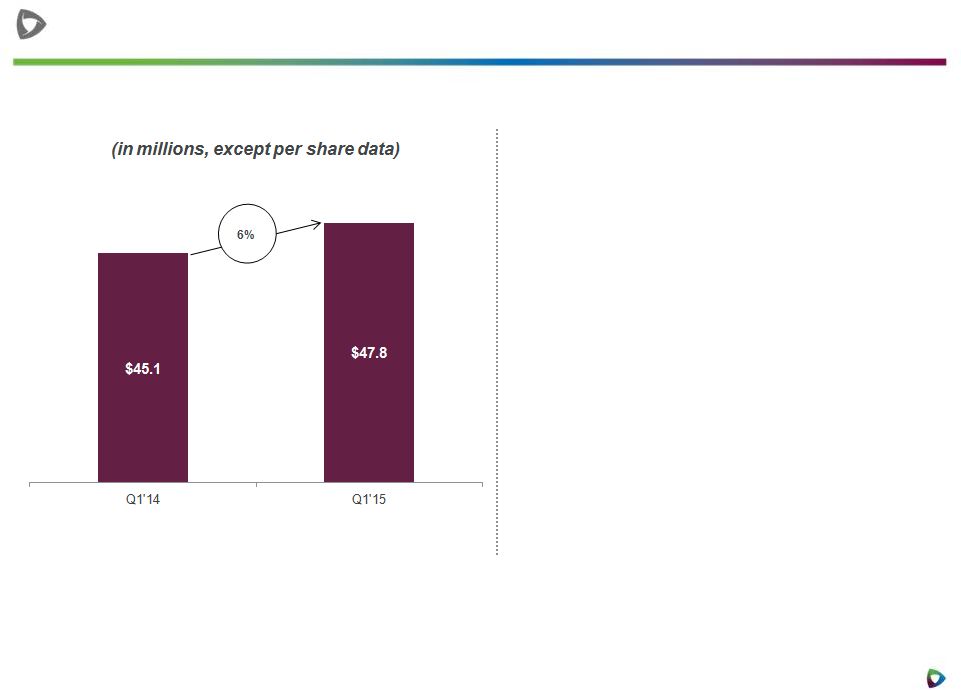
First-quarter non-GAAP adjusted fully distributed net
income
•
Calculates income taxes at 40%
on pre-tax income, assuming
taxable C corporate structure
•
Calculates adjusted fully
distributed earnings per share,
assuming total Class A and B
common shares held by public
$0.31
$0.33
Non-GAAP earnings per share on fully distributed
net income
(1) See non-GAAP adjusted fully distributed net income and non-GAAP
earnings per share on fully distributed net income reconciliations to GAAP equivalents in
Appendix; financial information for the fiscal 2014 first quarter is pro forma and
has been adjusted to reflect the impact of the company’s reorganization and IPO.
1 |
 17
Cash flow and capital structure at September 30, 2014
Cash, cash equivalents and marketable
securities of $398.2 million
No outstanding borrowings on $750 million
five-year unsecured revolving credit facility
Cash flow from operations of $45.9 million |
 18
Fiscal 2015 annual guidance
1
Premier, Inc. affirms full-year fiscal 2015 financial guidance:
(in millions, except per share data)
Pro Forma
FY 2015
YoY Change
Net Revenue:
Supply Chain Services segment
$688 -
$707
8% -
11%
Performance Services segment
$281 -
$288
21% -
24%
Total Net Revenue
$969 -
$995
11% -
14%
Non-GAAP adjusted EBITDA
$379 -
$390
8% -
11%
Non-GAAP adjusted fully
distributed EPS
$1.39 -
$1.44
7% -
11%
(1) As of fiscal 2015 first-quarter conference call, 11/10/2014. Guidance measures are
“forward-looking statements.” For information regarding the use and
limitations of non-GAAP financial measures and forward-looking statements, see
“Forward-looking statements and Non-GAAP financial measures” at the
front of this presentation. Guidance is based on comparisons with prior-year non-GAAP pro
forma results, which have been adjusted to reflect the impact of the company’s
reorganization and IPO. |
 19
Fiscal 2015 guidance assumptions
Supply Chain Services growth driven by:
•
Low to mid-single-digit growth in net
administrative fee revenue
•
Continuation of high GPO retention rates
•
15% -
20% product revenue growth
Performance Services growth driven by:
•
Demand for integrated offerings of SaaS-based products,
advisory services and collaboratives
•
Continuation of high SaaS institutional renewal rates
•
TheraDoc and Aperek full revenue contributions in
second, third and fourth quarters |
 20
Exchange update
Approximately 4.7 million Class B shares
exchanged for Class A shares on 1-for-1 basis
on Oct. 31, 2014
•
~16 million shares eligible for exchange
•
Outcome provides additional liquidity and float for
public markets
Premier will conduct underwritten company
directed offering
•
Approximately 3.8 million shares in the offering
•
Approximately 900,000 exchanged shares not
participating in the offering and cannot be sold until 60
days following the completion of the offering |
 Questions
21 |
 Contact Investor Relations
Jim Storey
Vice President, Investor Relations
jim_storey@premierinc.com
Thank you
22 |
 Appendix
23 |
 24
Premier, Inc. supplemental financial information
(Unaudited, in thousands)
2014*
2013
Reconciliation of Non-GAAP Pro Forma Net Revenue to Net
Revenue: Non-GAAP Pro Forma Net Revenue
229,308
$
199,313
$
Non-GAAP pro forma adjustment for revenue share post-IPO
—
41,263
Net Revenue
229,308
$
240,576
$
Net income
64,887
$
112,528
$
Non-GAAP pro forma adjustment for revenue share post-IPO
—
(41,263)
Interest and investment income, net
(191)
(220)
Income tax expense
5,811
764
Depreciation and amortization
10,308
8,356
Amortization of purchased intangible assets
903
601
EBITDA
81,718
80,766
Stock-based compensation
6,439
325
Acquisition related expenses
1,278
142
Strategic and financial restructuring expenses
96
1,842
Adjustment to tax receivable agreement liability
(1,073)
—
Acquisition related adjustment - deferred revenue
2,065
—
Other (income) expense, net
(5)
(4)
Adjusted EBITDA
90,518
$
83,071
$
Segment Adjusted EBITDA:
Supply Chain Services
91,268
$
125,480
$
Non-GAAP pro forma adjustment for revenue share post-IPO
—
(41,263)
Supply Chain Services
(including non-GAAP pro forma adjustment)
91,268
$
84,217
$
Performance Services
18,362
16,329
Corporate
(19,112)
(17,475)
Adjusted EBITDA
90,518
$
83,071
$
Depreciation and amortization
(10,308)
(8,356)
Amortization of purchased intangible assets
(903)
(601)
Stock-based compensation
(6,439)
(325)
Acquisition related expenses
(1,278)
(142)
Strategic and financial restructuring expenses
(96)
(1,842)
Adjustment to tax receivable agreement liability
1,073
—
Acquisition related adjustment - deferred revenue
(2,065)
—
Equity in net income of unconsolidated affiliates
(4,866)
(4,114)
Deferred compensation plan expense
509
—
66,145
67,691
Non-GAAP pro forma adjustment for revenue share post-IPO
—
41,263
Operating income
66,145
$
108,954
$
Equity in net income of unconsolidated affiliates
4,866
4,114
Interest and investment income, net
191
220
Other (expense) income, net
(504)
4
Income before income taxes
70,698
$
113,292
$
* Note that no pro forma adjustments were made for the three months
ended September 30, 2014; as such, actual results are presented for the three months ended September 30, 2014.
Three Months Ended
September 30,
Supplemental Financial Information - Reporting of Non-GAAP Pro
Forma Adjusted EBITDA and Non-GAAP Adjusted Fully Distributed Net Income
Reconciliation of Selected Non-GAAP Measures to GAAP Measures
Reconciliation of Net Income to Adjusted EBITDA and Reconciliation of
Segment Adjusted EBITDA to Income Before Income Taxes: |
 25
Premier, Inc. supplemental financial information
(Unaudited, in thousands)
2014*
2013
Reconciliation of Non-GAAP Pro Forma Adjusted Fully Distributed Net
Income: Net income (loss) attributable to shareholders
9,273
$
(476)
$
Non-GAAP pro forma adjustment for revenue share
post-IPO —
(41,263)
Income tax expense
5,811
764
Stock-based compensation
6,439
325
Acquisition related expenses
1,278
142
Strategic and financial restructuring expenses
96
1,842
Adjustment to tax receivable agreement liability
(1,073)
—
Acquisition related adjustment - deferred revenue
2,065
—
Amortization of purchased intangible assets
903
601
Net income attributable to noncontrolling interest in Premier LP
54,816
113,214
Non-GAAP pro forma adjusted fully distributed income before income
taxes 79,608
75,149
Income tax expense on fully distributed income before income
taxes 31,843
30,060
Non-GAAP Pro Forma Adjusted Fully Distributed Net Income
47,765
$
45,089
$
* Note that no pro forma adjustments were made for the three months
ended September 30, 2014; as such, actual results are presented for the three months ended September 30, 2014.
Three Months Ended
September 30,
Supplemental Financial Information - Reporting of Non-GAAP Pro
Forma Adjusted EBITDA and Non-GAAP Adjusted Fully Distributed Net Income
Reconciliation of Selected Non-GAAP Measures to GAAP Measures
|
 26
Premier, Inc. supplemental financial information
(Unaudited, in thousands, except per share data)
2014*
2013
Reconciliation of numerator for GAAP EPS to Non-GAAP EPS on Adjusted
Fully Distributed Net Income Net loss attributable to
shareholders after adjustment of redeemable limited partners' capital to redemption amount
(373,384)
$
(476)
$
Adjustment of redeemable limited partners' capital to
redemption amount 382,657
—
Net income (loss) attributable to shareholders
9,273
(476) Non-GAAP pro forma adjustment for
revenue share post-IPO —
(41,263)
Income tax expense
5,811
764
Stock-based compensation
6,439
325
Acquisition related expenses
1,278
142
Strategic and financial restructuring expenses
96
1,842
Adjustment to tax receivable agreement liability
(1,073)
—
Acquisition related adjustment - deferred revenue
2,065
—
Amortization of purchased intangible assets
903
601
Net income attributable to noncontrolling interest in Premier LP
54,816
113,214
Non-GAAP pro forma adjusted fully distributed income before income
taxes 79,608
75,149
Income tax expense on fully distributed income before income
taxes 31,843
30,060
Non-GAAP pro forma adjusted fully distributed net income
47,765
$
45,089
$
Reconciliation of denominator for GAAP EPS to Non-GAAP Adjusted Fully
Distributed Net Income Weighted Average:
Common shares used for basic and diluted earnings per share
32,376
5,627 Potentially dilutive shares
253
25 Class A common shares
outstanding
-
26,749 Conversion of Class B common units
112,083
112,608
Weighted average fully distributed shares outstanding - diluted
144,712
145,009
Reconciliation of GAAP EPS to Adjusted Fully Distributed EPS
GAAP loss per share
$ (11.53)
$
(0.08) Impact of adjustment of redeemable limited partners'
capital to redemption amount
$ 11.82
$ -
Impact of additions:
Non-GAAP pro forma adjustment for revenue share post-IPO
$ -
$
(7.33) Income tax expense
$ 0.18
$ 0.14
Stock-based compensation
$ 0.20
$ 0.06
Acquisition related expenses
$ 0.04
$ 0.03
Strategic and financial restructuring expenses
$ 0.00
$ 0.33
Adjustment to tax receivable agreement liability
$
(0.03)
$ -
Acquisition related adjustment - deferred revenue
$ 0.06
$ -
Amortization of purchased intangible assets
$ 0.03
$ 0.11
Net income attributable to noncontrolling interest in Premier LP
$ 1.69
$ 20.12
Impact of corporation taxes
$
(0.98)
$ (5.34)
Impact of increased share count
$
(1.15)
$ (7.70)
Non-GAAP earnings per share on adjusted fully distributed net income
- diluted
$ 0.33
$ 0.31
* Note that no pro forma adjustments were made for the three
months ended September 30, 2014; as such, actual results are presented for the three months ended September 30, 2014.
Three Months Ended
September 30,
Supplemental Financial Information - Reporting of Net Income and
Earnings Per Share Reconciliation of Selected Non-GAAP Measures
to GAAP Measures |