Attached files
| file | filename |
|---|---|
| 8-K - 8-K - Independent Bank Group, Inc. | form8-kibgpressreleasesand.htm |

NASDAQ: IBTX Sandler O’Neill East Coast Financial Services Conference November 2014 David Brooks, Chairman and CEO Michelle Hickox, EVP and CFO Exhibit 99.1

Safe Harbor Statement 2 From time to time, our comments and releases may contain “forward-looking statements” within the meaning of the Private Securities Litigation Reform Act of 1995 (the “Act”). Forward-looking statements can be identified by words such as “believes,” “anticipates,” “expects,” “forecast,” “guidance,” “intends,” “targeted,” “continue,” “remain,” “should,” “may,” “plans,” “estimates,” “will,” “will continue,” “will remain,” variations on such words or phrases, or similar references to future occurrences or events in future periods; however, such words are not the exclusive means of identifying such statements. Examples of forward-looking statements include, but are not limited to: (i) projections of revenues, expenses, income or loss, earnings or loss per share, and other financial items; (ii) statements of plans, objectives, and expectations of Independent Bank Group or its management or Board of Directors; (iii) statements of future economic performance; and (iv) statements of assumptions underlying such statements. Our estimates of earnings and earnings per share accretion, book value earn-back and tangible book value dilution are forward-looking statements. Forward-looking statements are based on Independent Bank Group’s current expectations and assumptions regarding its business, the economy, and other future conditions. Because forward-looking statements relate to the future, they are subject to inherent uncertainties, risks, and changes in circumstances that are difficult to predict. Independent Bank Group’s actual results may differ materially from those contemplated by the forward-looking statements, which are neither statements of historical fact nor guarantees or assurances of future performance. Factors that could cause actual results to differ from those discussed in the forward-looking statements include, but are not limited to: (1) local, regional, national, and international economic conditions and the impact they may have on us and our customers and our assessment of that impact; (2) volatility and disruption in national and international financial markets; (3) government intervention in the U.S. financial system, whether through changes in the discount rate or money supply or otherwise; (4) changes in the level of non-performing assets and charge-offs; (5) changes in estimates of future reserve requirements based upon the periodic review thereof under relevant regulatory and accounting requirements; (6) adverse conditions in the securities markets that lead to impairment in the value of securities in our investment portfolio; (7) inflation, deflation, changes in market interest rates, developments in the securities market, and monetary fluctuations; (8) the timely development and acceptance of new products and services and perceived overall value of these products and services by customers; (9) changes in consumer spending, borrowings, and savings habits; (10) technological changes; (11) the ability to increase market share and control expenses; (12) changes in the competitive environment among banks, bank holding companies, and other financial service providers; (13) the effect of changes in laws and regulations (including laws and regulations concerning taxes, banking, securities, and insurance) with which we and our subsidiaries must comply; (14) the effect of changes in accounting policies and practices, as may be adopted by the regulatory agencies, as well as the Public Company Accounting Oversight Board, the Financial Accounting Standards Board, and other accounting standard setters; (15) the costs and effects of legal and regulatory developments including the resolution of legal proceedings; and (16) our success at managing the risks involved in the foregoing items and (17) the other factors that are described in the Company’s Form 10-K for the year ended December 31, 2013 and the Form 10-Q’s for the quarters ended March 31, June 30 and September 30, 2014, under the heading “Risk Factors.” Any forward-looking statement made by the Company in this release speaks only as of the date on which it is made. Factors or events that could cause the Company’s actual results to differ may emerge from time to time, and it is not possible for the Company to predict all of them. The Company undertakes no obligation to publicly update any forward-looking statement, whether as a result of new information, future developments or otherwise, except as may be required by law.

Company Snapshot 3 Overview Branch Map Financial Highlights as of September 30, 2014 (1) • Headquartered in McKinney, Texas • 100+ years of operating history • 39 banking offices in 27 communities • Dallas-Fort Worth metropolitan area • Greater Austin area • Houston metropolitan area • Acquired Bank of Houston and its six locations April 15, 2014 • Acquired Houston City Bancshares on October 1, 2014 Note: Financial data as of and for the quarter ended September 30, 2014. (1) Does not include Houston City acquisition. (2) Non-GAAP financial measure. See Appendix for reconciliation. Balance Sheet ($ in millions) Total Assets $3,747 Total Loans 2,893 Total Deposits 2,814 Equity 500 Equity / Assets 13.35% Asset Quality NPAs / Assets 0.33% NPLs / L ans 0.29 Allowance / NPLs 200.83 Allowance / Loans 0.58 NCO Ratio (annualized) 0.05 Profitability Net Interest Margin 4.04% Core Efficiency Ratio (2) 56.9
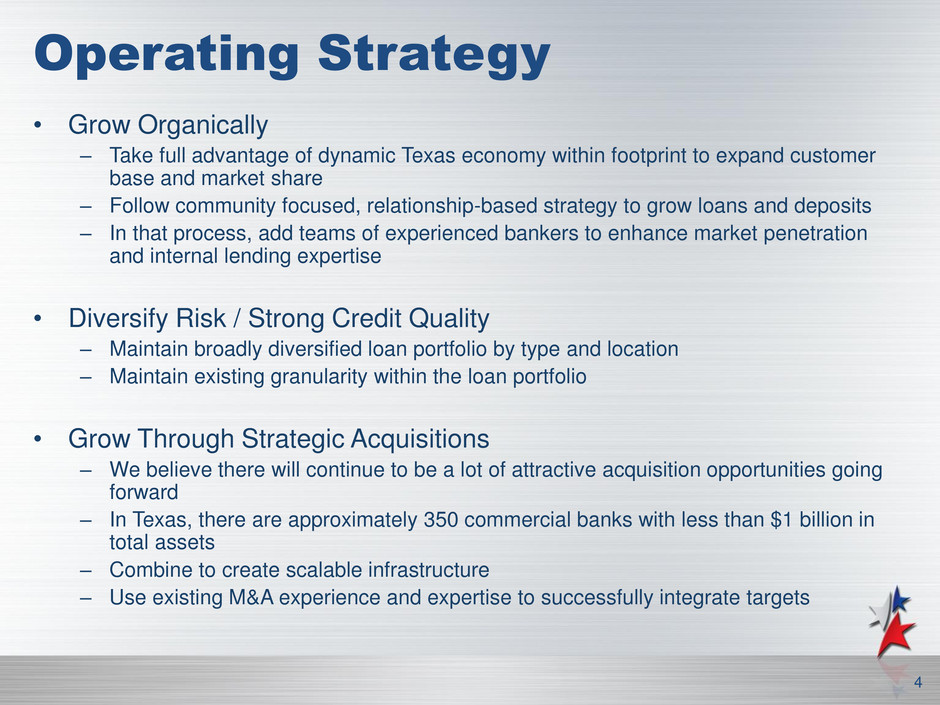
Operating Strategy 4 • Grow Organically – Take full advantage of dynamic Texas economy within footprint to expand customer base and market share – Follow community focused, relationship-based strategy to grow loans and deposits – In that process, add teams of experienced bankers to enhance market penetration and internal lending expertise • Diversify Risk / Strong Credit Quality – Maintain broadly diversified loan portfolio by type and location – Maintain existing granularity within the loan portfolio • Grow Through Strategic Acquisitions – We believe there will continue to be a lot of attractive acquisition opportunities going forward – In Texas, there are approximately 350 commercial banks with less than $1 billion in total assets – Combine to create scalable infrastructure – Use existing M&A experience and expertise to successfully integrate targets

Third Quarter 2014 Highlights 5 • Core earnings were $9.5 million, or $0.58 per diluted share, for the quarter ended September 30, 2014 compared to $9.0 million, or $0.57 per diluted share, for the quarter ended June 30, 2014 and to $4.6 million, or $0.38 per diluted share, for the quarter ended September 30, 2013. • Loans held for investment grew organically at an annual rate of 6.5% in the third quarter and 24.2% for the first nine months of 2014. • Continued strong asset quality, as reflected by a nonperforming assets to total assets ratio of 0.33% and a nonperforming loans to total loans ratio of 0.29% at September 30, 2014. Net charge offs were 0.05% annualized for the third quarter. • Core efficiency ratio continued to improve to 56.87% for the quarter ended September 30, 2014. • Completed $65 million subordinated debt offering.

Proven Successful Acquirer 6 • Experienced and disciplined acquisition and integration approach • Eight completed transactions since 2010 Bank / Market Date of Acquisition Total Assets Town Center Bank Dallas/North Texas July 31, 2010 $37.5 million Farmersville Bancshares, Inc. Dallas/North Texas September 30, 2010 $99.4 million I Bank Holding Company, Inc. Austin/Central Texas March 30, 2012 $173 million The Community Group, Inc. Dallas/North Texas October 1, 2012 $111 million Collin Bank Dallas/North Texas November 29, 2013 $168 million Live Oak Financial Corp. Dallas/North Texas January 1, 2014 $131 million BOH Holdings, Inc. Houston/Southeast Texas April 15, 2014 $1.04 billion Houston City Bancshares, Inc. Houston/Southeast Texas October 1, 2014 $351 million

Pro Forma IBTX/Houston City ($ in millions) September 30, 2014 Total Assets $4,092 Total Gross Loans $3,087 Total Deposits $3,139 Capital Ratios Tier 1 Leverage Ratio 8.04% Tier 1 Risk-Based Capital Ratio 10.00 Total Risk-Based Capital Ratio 12.83 Tangible Capital to Tangible Assets Ratio 7.10 7

$1,955 $3,747 Q3 2013 Q3 2014 Organic Growth Impact of Acquisitions (In Year Acquired) IBTX Continued Demonstrated Growth 8 Total Assets Prior Years Total Assets Q3 2014 v. Q3 2013 Note: Dollars in millions. Pre Houston City acquisition. $1,254 $1,740 $2,164 2011 2012 2013

$7,618 $15,266 Q3 2013 Q3 2014 $14,989 $21,828 $29,466 2011 2012 2013 IBTX Expanded Profitability 9 Core Pre-Tax Pre-Provision Earnings Income (1) Note: Dollars in thousands. Pre Houston City acquisition. (1) See Appendix for non-GAAP Reconciliation.

Select Metrics 10 Core Net Interest Margin (1) (1) Excluding recognition of income from the repayment of acquired loans and write-off of unamortized debt origination costs. (2) See Appendix for GAAP Reconciliation. Core Efficiency Ratio (2) 71.5% 67.3% 64.6% 58.7% 40.0% 50.0% 60.0% 70.0% 80.0% 2011 2012 2013 3Q2014 4.42% 4.40% 4.30% 4.11% 3.90% 4.00% 4.10% 4.20% 4.30% 4.40% 4.50% 2011 2012 2013 3Q2014

Continued Improvement in Deposit Pricing 11 Deposit Composition at 9/30/14 Deposit Growth versus Average Rate (1) 2014 YTD Rate on Interest-Bearing Deposits: 0.49% (1) Annual average rate for total deposits. Note: Dollars in millions. Financial data through 2013 as of and for years ended December 31, 2013; and as of and for the nine months ended September 30, 2014 (annualized). Does not include Houston City acquisition. Noninterest- bearing 26% Interest-bearing Checking 32% Interest-bearing Public Funds 9% Savings Accounts 4% MMAs 4% IRAs 1% CDs <$100k 9% CDs >$100k 15% $928 $1,030 $1,391 $1,710 $2,814 1.35% 1.00% 0.69% 0.47% 0.38% $200 $700 $1,200 $1,700 $2,200 $2,700 2010 2011 2012 2013 YTD 2014 0.00% 0.20% 0.40% 0.60% 0.80% 1.00% 1.20% 1.40% 1.60% Deposits Avg. Rate
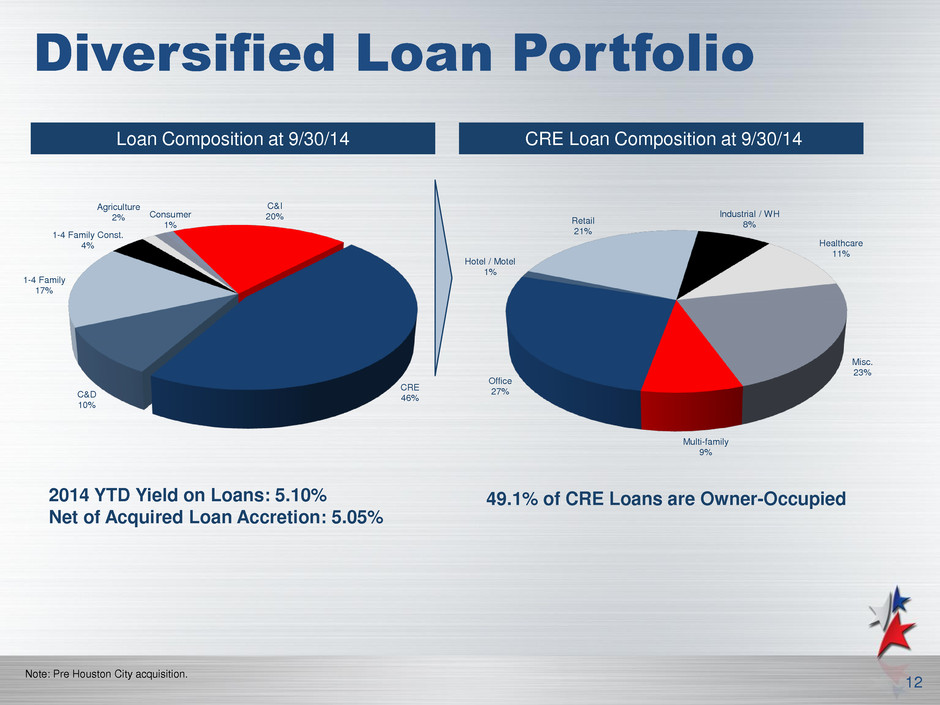
Multi-family 9% Office 27% Hotel / Motel 1% Retail 21% Industrial / WH 8% Healthcare 11% Misc. 23% Diversified Loan Portfolio 12 Loan Composition at 9/30/14 CRE Loan Composition at 9/30/14 2014 YTD Yield on Loans: 5.10% Net of Acquired Loan Accretion: 5.05% 49.1% of CRE Loans are Owner-Occupied Note: Pre Houston City acquisition. C&I 20% CRE 46% C&D 10% 1-4 Family 17% 1-4 Family Const. 4% Agriculture 2% Consumer 1%
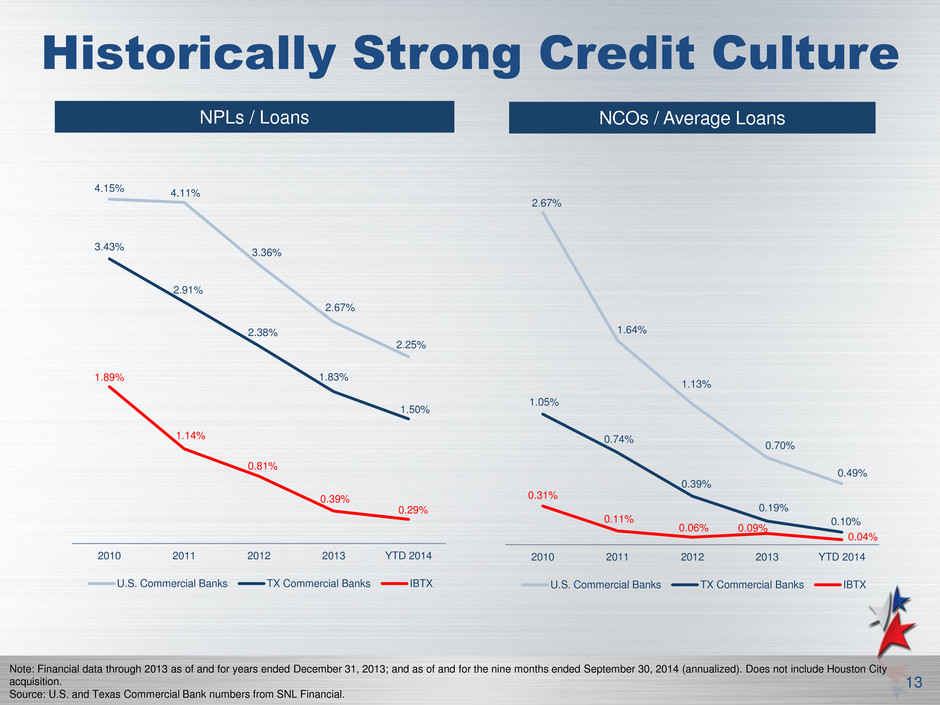
Historically Strong Credit Culture 13 NPLs / Loans Note: Financial data through 2013 as of and for years ended December 31, 2013; and as of and for the nine months ended September 30, 2014 (annualized). Does not include Houston City acquisition. Source: U.S. and Texas Commercial Bank numbers from SNL Financial. NCOs / Average Loans 2.67% 1.64% 1.13% 0.70% 0.49% 1.05% 0.74% 0.39% 0.19% 0.10% 0.31% 0.11% 0.06% 0.09% 0.04% 2010 2011 2012 2013 YTD 2014 U.S. Commercial Banks TX Commercial Banks IBTX 4.15% 4.11% 3.36% 2.67% 2.25% 3.43% 2.91% 2.38% 1.83% 1.50% 1.89% 1.14% 0.81% 0.39% 0.29% 2010 2011 2012 2013 YTD 2014 U.S. Commercial Banks TX Commercial Banks IBTX
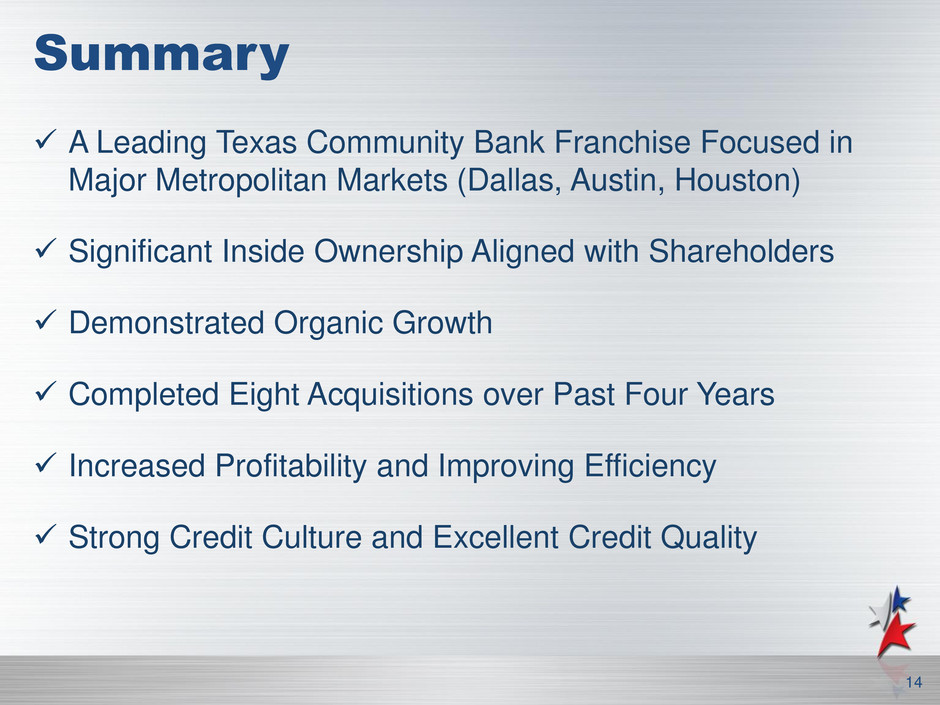
Summary 14 A Leading Texas Community Bank Franchise Focused in Major Metropolitan Markets (Dallas, Austin, Houston) Significant Inside Ownership Aligned with Shareholders Demonstrated Organic Growth Completed Eight Acquisitions over Past Four Years Increased Profitability and Improving Efficiency Strong Credit Culture and Excellent Credit Quality

APPENDIX 15

Experienced Management Team 16 Name / Title Background David R. Brooks Chairman of the Board, CEO, Director • 35 years in the financial services industry; 27 years at Independent Bank • Active in community banking since the early 1980s - led the investor group that acquired the Company in 1988 • Previously served as the Chief Financial Officer at Baylor University from 2000 to 2004 • Serves on the Board of Managers of Noel-Levitz, LLC, and on the Board of Trustees of Houston Baptist University Torry Berntsen President, COO, Director • 34 years in the financial services industry; 5 years at Independent Bank • Served as Vice Chairman of Corporate Development from 2009 to 2013 • Vice Chairman of Virtu Management, LLC • 25 years in various senior management roles at The Bank of New York Mellon Daniel W. Brooks Vice Chairman, Chief Risk Officer, Director • 31 years in the financial services industry; 25 years at Independent Bank • Previously served as President and a Director of the Company from 2002 to 2009 • Active in community banking since the late 1980s • Chairman of the Board for Medical Center of McKinney and on the Boards of Directors of McKinney Christian Academy and the McKinney Education Foundation James D. Stein Vice Chairman, CEO – Houston, Director • 30 years in the financial services industry; 9 years at Bank of Houston/Independent Bank • Founding President and CEO of Bank of Houston • Served as President of Columbus State Bank and on the Board of the Texas Bankers Association • Active in various Houston based non-profit organizations Brian E. Hobart Vice Chairman, Chief Lending Officer • 21 years in the financial services industry; 10 years at Independent Bank • Since 2009 he has functioned as Chief Lending Officer as well as serving as President and director at the Company • One of the founders of IBG Central Texas - served as its President from 2004 until 2009 Michelle S. Hickox EVP, Chief Financial Officer • 24 years in the financial services industry; 2 years at the Company • Previously a Financial Services Audit Partner at McGladrey LLP • Licensed certified public accountant, member of the AICPA, the Texas Society of Certified Public Accountants and the Dallas CPA Society

Reconciliation of Non-GAAP and Adjusted Measures 17 ($ in thousands) 2011 2012 2013 2013 2014 Net Interest Income - Reported $46,281 $58,553 $74,933 $18,915 $32,431 (a) Write off of debt origination warrants 0 0 223 0 0 (b) Income recognized on acquired loans (477) (233) (1,399) (187) (172) (b) Adjusted net interest income $45,804 $58,320 $73,757 $18,728 $32,259 (a + b = c) Provision Expense - Reported $1,650 $3,184 $3,822 $830 $976 (d) Noninterest Income - Reported $7,708 $9,168 $11,021 $2,451 $4,210 (e) Loss / (Gain) on Sale of Loans 0 0 0 0 (1,078) Loss / (Gain) on Sale of Branch 0 (38) 0 0 0 Loss / (Gain) on Sale of OREO (918) (1,135) (1,507) 0 (20) Loss / (Gain) on Sale of Securities 0 3 0 0 0 Loss / (Gain) on Sale of PP&E (21) 343 18 (5) 22#REF! Adjusted Noninterest Income $6,769 $8,341 $9,532 $2,446 $3,134 (f) Noninterest Expense - Reported $38,639 $47,160 $57,671 $14,650 $22,162 (g) Adriatica Expenses ($871) ($832) ($806) ($228) $0 OREO Impairment (184) (94) (642) (12) (22) FDIC refund 0 0 504 0 0 IPO related stock grant and bonus expense 0 0 (948) (380) (156) Registration statements 0 0 0 0 (456) Acquisition Expense 0 (1,401) (1,956) (474) (1,401) Adjusted Noninterest Expense $37,584 $44,833 $53,823 $13,556 $20,127 (h) Pre-Tax Pre-Provision Earnings $15,350 $20,561 $28,283 $6,716 $14,479 (a) + (e) - (g) Core Pre-Tax Pre-Provision Earnings $14,989 $21,828 $29,466 $7,618 $15,266 (c) + (f) - (h) Reported Efficiency Ratio 71.6% 69.6% 67.1% 68.6% 60.5% (g) / (a + e) Adjusted Efficiency Ratio 71.5% 67.3% 64.6% 64.0% 56.9% (h) / (c + f) Year Ended December 31, Quarter Ended September 30,

18 Reconciliation of Non-GAAP and Adjusted Measures ($ in thousands, except per share data) As of 9/30/2014 Total Common Stockholders' Equity $476,373 Goodwill (207,607) Core Deposit Intangibles (10,418) Tangible Common Equity $258,348 Common Shares Outstanding 16,370,313 Book Value per Share $29.10 Tangible Book Value per Share $15.78 As of 9/30/2014 Total Stockholders' Equity $500,311 Unrealized Loss on AFS Securities (2,116) Goodwill (207,607) Other Intangibles (10,418) Qualifying Restricted Core Capital 17,600 Tier 1 Capital $297,770 Risk-Weighted Assets On Balance Sheet $2,774,425 Off Balance Sheet 105,030 Total Risk-Weighted Assets $2,879,455 Tier 1 Capital to Risk-Weighted Assets Ratio 10.34%

Contact Information 19 Corporate Headquarters Analysts/Investors: Independent Bank Group, Inc. Torry Berntsen 1600 Redbud Blvd President and Chief Operating Officer Suite 400 (972) 562-9004 McKinney, TX 75069 tberntsen@ibtx.com 972-562-9004 Telephone Michelle Hickox 972-562-7734 Fax Executive Vice President and Chief Financial Officer www.ibtx.com (972) 562-9004 mhickox@ibtx.com Media: Eileen Ponce Marketing Director (469) 301-2706 eponce@ibtx.com
