Attached files
| file | filename |
|---|---|
| 8-K - 8-K - COMFORT SYSTEMS USA INC | a14-24392_18k.htm |
Exhibit 99.1
|
|
(NYSE: FIX) November 13, 2014 Comfort Systems USA |
|
|
Disclosures Safe Harbor Certain statements and information in this presentation may constitute forward-looking statements within the meaning of the Private Securities Litigation Reform Act of 1995. The words “believe,” “expect,” “anticipate,” “plan,” “intend,” “foresee,” “should,” “would,” “could,” or other similar expressions are intended to identify forward-looking statements, which are generally not historic in nature. These forward-looking statements are based on the current expectations and beliefs of Comfort Systems USA, Inc. and its subsidiaries (collectively, the “Company”) concerning future developments and their effect on the Company. While the Company’s management believes that these forward-looking statements are reasonable as and when made, there can be no assurance that future developments affecting the Company will be those that it anticipates. All comments concerning the Company’s expectations for future revenues and operating results are based on the Company’s forecasts for its existing operations and do not include the potential impact of any future acquisitions. The Company’s forward-looking statements involve significant risks and uncertainties (some of which are beyond the Company’s control) and assumptions that could cause actual future results to differ materially from the Company’s historical experience and its present expectations or projections. Important factors that could cause actual results to differ materially from those in the forward-looking statements include, but are not limited to: the use of incorrect estimates for bidding a fixed-price contract; undertaking contractual commitments that exceed the Company’s labor resources; failing to perform contractual obligations efficiently enough to maintain profitability; national or regional weakness in construction activity and economic conditions; financial difficulties affecting projects, vendors, customers, or subcontractors; the Company’s backlog failing to translate into actual revenue or profits; failure of third party subcontractors and suppliers to complete work as anticipated; difficulty in obtaining or increased costs associated with bonding and insurance; impairment to goodwill; errors in the Company’s percentage-of-completion method of accounting; the result of competition in the Company’s markets; the Company’s decentralized management structure; material failure to comply with varying state and local laws, regulations or requirements; debarment from bidding on or performing government contracts; shortages of labor and specialty building materials; retention of key management; seasonal fluctuations in the demand for HVAC systems; the imposition of past and future liability from environmental, safety, and health regulations including the inherent risk associated with self-insurance; adverse litigation results; an increase in our effective tax rate; a cyber security breach; and other risks detailed in our reports filed with the Securities and Exchange Commission. For additional information regarding known material factors that could cause the Company’s results to differ from its projected results, please see its filings with the SEC, including its Annual Report on Form 10-K, Quarterly Reports on Form 10-Q, and Current Reports on Form 8-K. Readers are cautioned not to place undue reliance on forward-looking statements, which speak only as of the date hereof. The Company undertakes no obligation to publicly update or revise any forward-looking statements after the date they are made, whether as a result of new information, future events, or otherwise. Non-GAAP Measures Certain measures in this presentation are not measures calculated in accordance with generally accepted accounting principles (GAAP). They should not be considered a replacement for GAAP results. Non-GAAP financial measures appearing in these slides are identified in the footnote. See the Appendices for a reconciliation of these non-GAAP measures to the most comparable GAAP financial measures. 2 |
|
|
Comfort Systems USA Overview Leading mid-market HVAC and mechanical systems installation and service provider Focused on commercial, industrial, and institutional HVAC markets $1.4B yearly revenue 7,000+ employees 37 operating companies Balanced construction & service portfolio 3 |
|
|
Broad Nationwide Footprint 4 37 companies | 92 locations in 83 cities | 7,000+ employees New location |
|
|
Areas of Strength Long-term local relationships Collaboration Safety excellence Purchasing economics National service capability Bonding and insurance Balance sheet strength 5 |
|
|
Our Customers 6 Omni Orlando Resort at ChampionsGate Orlando, Florida University Hospital Little Rock, Arkansas Navy Federal Credit Union Pensacola, Florida MedImmune FMC Expansion Frederick, Maryland |

|
|
Revenue/Stock Price History 7 Revenue ($ in millions) Acquisition Phase and Industry Growth Sale of Assets New Acquisitions Stock Price at 12/31 |
|
|
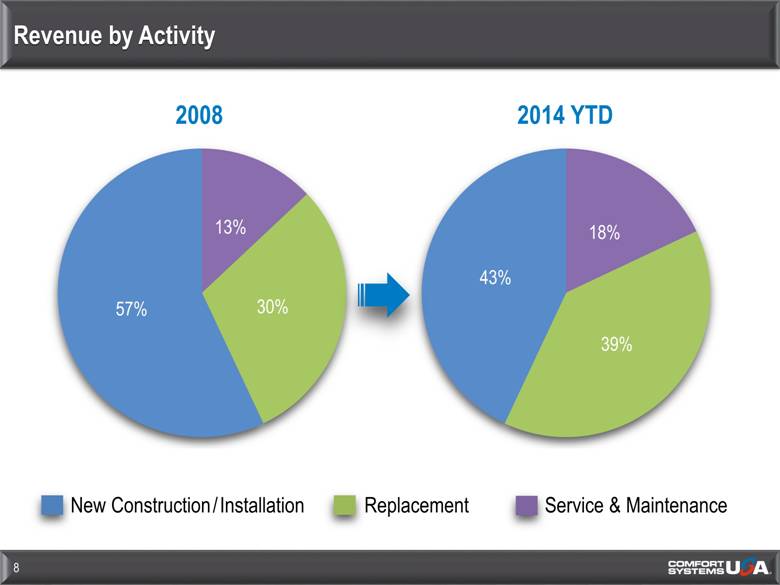
Revenue by Activity 8 New Construction/Installation Replacement Service & Maintenance 2008 2014 YTD |
|
|
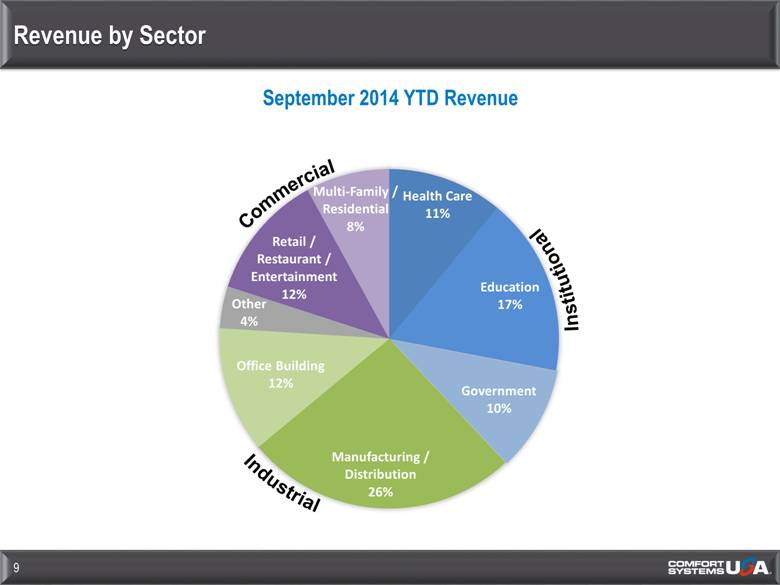
Revenue by Sector 9 September 2014 YTD Revenue |
|
|
Book of Business 10 ($ in millions) |
|
|
Historical Financial Summary ($ in millions, except per share information) 11 (1) Adjusted EPS is a non-GAAP financial measure. Adjusted EPS excludes goodwill impairments, changes in the fair value of contingent earn-out obligations and tax valuation allowances. See Appendix V for a GAAP reconciliation to Adjusted EPS. (2) Adjusted EBITDA is a non-GAAP financial measure. See Appendix III for a GAAP reconciliation to Adjusted EBITDA. |
|
|
Historical Financial Summary 12 (1) Operating income for 2011 excludes goodwill impairment of $57.4M. (2) Adjusted EBITDA is a non-GAAP financial measure. See Appendix III for a GAAP reconciliation to Adjusted EBITDA. (1) |
|
|
QTD Financial Performance 13 Three Months Ended ($ in millions, except per share information) 9/30/14 9/30/13 Revenue $ 370.1 $ 350.0 Net Income from Continuing Operations Attributable to Comfort Systems USA, Inc. $ 7.6 $ 11.4 Diluted EPS from Continuing Operations Attributable to Comfort Systems USA, Inc. $ 0.20 $ 0.30 Adjusted EBITDA (1) $ 20.0 $ 22.2 Operating Cash Flow $ 23.9 $ 27.4 (1)Adjusted EBITDA is a non-GAAP financial measure. See Appendix III for a GAAP reconciliation to Adjusted EBITDA. |

|
|
YTD Financial Performance 14 Nine Months Ended ($ in millions, except per share information) 9/30/14 9/30/13 Revenue $ 1,054.3 $ 1,026.9 Net Income from Continuing Operations Attributable to Comfort Systems USA, Inc. $ 12.4 $ 21.7 Diluted EPS from Continuing Operations Attributable to Comfort Systems USA, Inc. $ 0.33 $ 0.58 Adjusted EBITDA (1) $ 42.7 $ 50.7 Operating Cash Flow $ 37.5 $ 23.8 (1)Adjusted EBITDA is a non-GAAP financial measure. See Appendix III for a GAAP reconciliation to Adjusted EBITDA. |
|
|
Key Financial Statistics 15 As of ($ in millions) 9/30/14 12/31/13 Cash $ 43.9 $ 52.1 Working Capital $ 131.0 $ 127.6 Goodwill and Intangible Assets $ 184.3 $ 152.0 Total Debt $ 42.9 $ 2.0 Equity $ 316.8 $ 314.0 |
|
|
Balance Sheet Strength $43.9M cash at September 30, 2014 Positive free cash flow for 15 consecutive years Debt capacity $42M debt at 9/30/2014 $250M revolving credit facility 2019 maturity 16 |
|
|
Long Term Industry Growth 17 Commercial, Industrial, Institutional HVAC–A $40B+ Industry Source: McGraw Hill Construction 3Q 2014 CMFS Data Building solutions A “necessity” HVAC accounts for 30%–50% of electricity usage. Mechanical equipment Requires service Repair Replacement Increasing technical content Building automation |

|
|
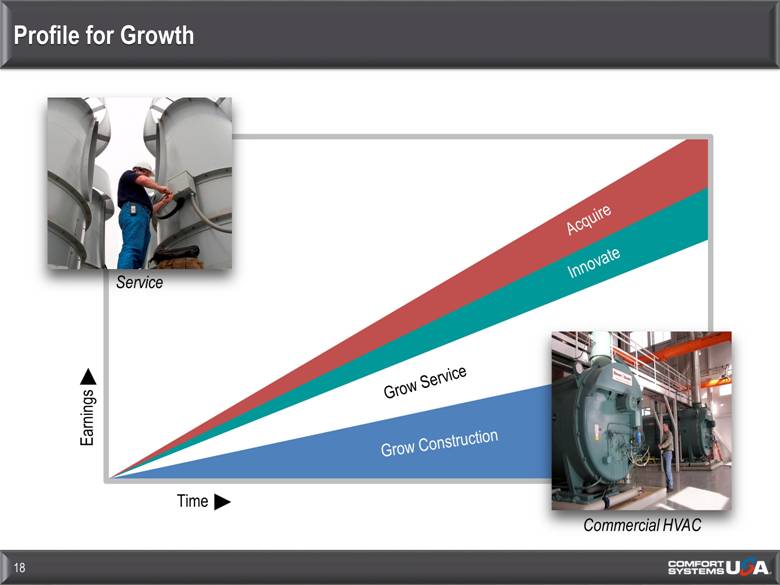
Profile for Growth 18 Time Earnings Grow Service Innovate Acquire Service Commercial HVAC Grow Construction |
|
|
Appendices |
|
|
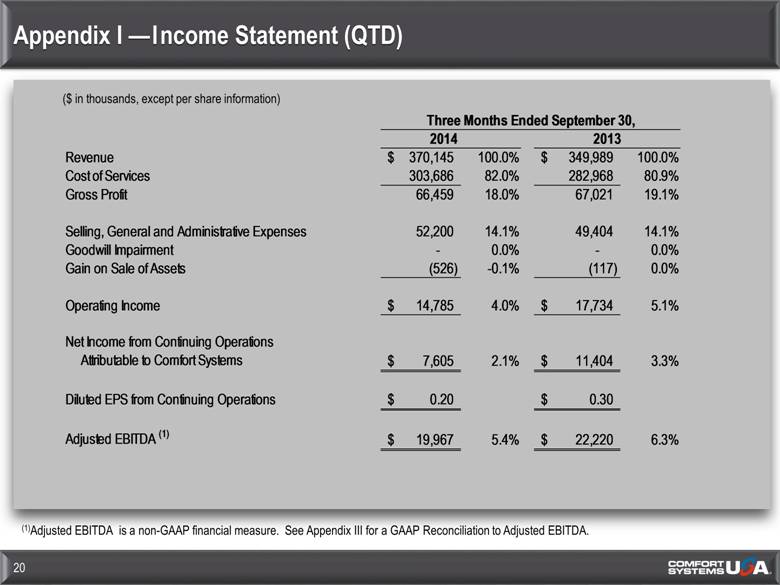
Appendix I —Income Statement (QTD) 20 ($ in thousands, except per share information) (1)Adjusted EBITDA is a non-GAAP financial measure. See Appendix III for a GAAP Reconciliation to Adjusted EBITDA. 2014 Revenue 370,145 $ 100.0% 349,989 $ 100.0% Cost of Services 303,686 82.0% 282,968 80.9% Gross Profit 66,459 18.0% 67,021 19.1% Selling, General and Administrative Expenses 52,200 14.1% 49,404 14.1% Goodwill Impairment - 0.0% - 0.0% Gain on Sale of Assets (526) -0.1% (117) 0.0% Operating Income 14,785 $ 4.0% 17,734 $ 5.1% Net Income from Continuing Operations Attributable to Comfort Systems 7,605 $ 2.1% 11,404 $ 3.3% Diluted EPS from Continuing Operations 0.20 $ 0.30 $ Adjusted EBITDA (1) 19,967 $ 5.4% 22,220 $ 6.3% 2013 Three Months Ended September 30, |
|
|
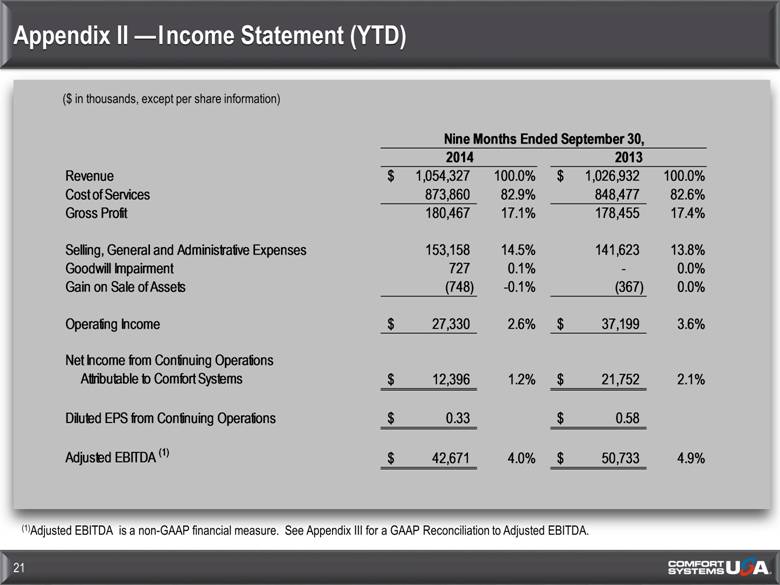
Appendix II —Income Statement (YTD) 21 ($ in thousands, except per share information) (1)Adjusted EBITDA is a non-GAAP financial measure. See Appendix III for a GAAP Reconciliation to Adjusted EBITDA. 2014 Revenue 1,054,327 $ 100.0% 1,026,932 $ 100.0% Cost of Services 873,860 82.9% 848,477 82.6% Gross Profit 180,467 17.1% 178,455 17.4% Selling, General and Administrative Expenses 153,158 14.5% 141,623 13.8% Goodwill Impairment 727 0.1% - 0.0% Gain on Sale of Assets (748) -0.1% (367) 0.0% Operating Income 27,330 $ 2.6% 37,199 $ 3.6% Net Income from Continuing Operations Attributable to Comfort Systems 12,396 $ 1.2% 21,752 $ 2.1% Diluted EPS from Continuing Operations 0.33 $ 0.58 $ Adjusted EBITDA (1) 42,671 $ 4.0% 50,733 $ 4.9% 2013 Nine Months Ended September 30, |
|
|
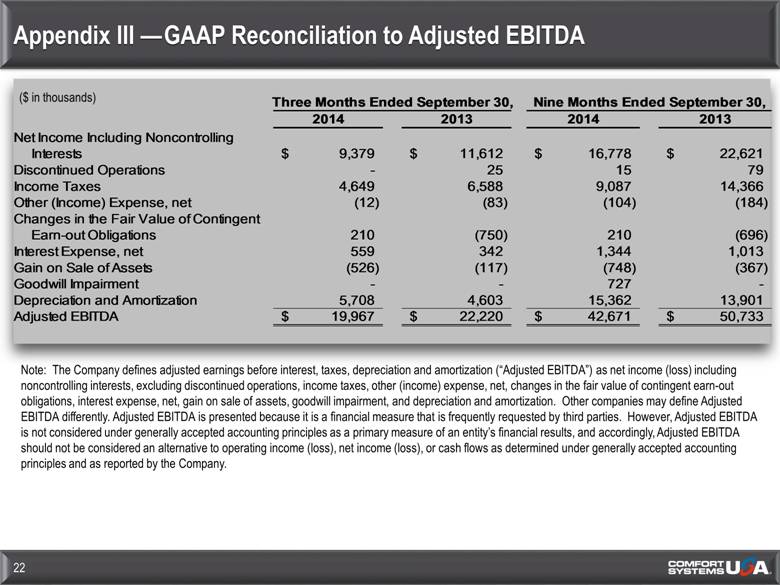
Appendix III —GAAP Reconciliation to Adjusted EBITDA 22 ($ in thousands) Note: The Company defines adjusted earnings before interest, taxes, depreciation and amortization (“Adjusted EBITDA”) as net income (loss) including noncontrolling interests, excluding discontinued operations, income taxes, other (income) expense, net, changes in the fair value of contingent earn-out obligations, interest expense, net, gain on sale of assets, goodwill impairment, and depreciation and amortization. Other companies may define Adjusted EBITDA differently. Adjusted EBITDA is presented because it is a financial measure that is frequently requested by third parties. However, Adjusted EBITDA is not considered under generally accepted accounting principles as a primary measure of an entity’s financial results, and accordingly, Adjusted EBITDA should not be considered an alternative to operating income (loss), net income (loss), or cash flows as determined under generally accepted accounting principles and as reported by the Company. Three Months Ended September 30, 2014 2013 2014 2013 Net Income Including Noncontrolling Interests 9,379 $ 11,612 $ 16,778 $ 22,621 $ Discontinued Operations - 25 15 79 Income Taxes 4,649 6,588 9,087 14,366 Other (Income) Expense, net (12) (83) (104) (184) Changes in the Fair Value of Contingent Earn-out Obligations 210 (750) 210 (696) Interest Expense, net 559 342 1,344 1,013 Gain on Sale of Assets (526) (117) (748) (367) Goodwill Impairment - - 727 - Depreciation and Amortization 5,708 4,603 15,362 13,901 Adjusted EBITDA 19,967 $ 22,220 $ 42,671 $ 50,733 $ Nine Months Ended September 30, |
|
|
($ in thousands) Appendix IV —GAAP Reconciliation to Adjusted EBITDA (Historical) 23 Note: The Company defines adjusted earnings before interest, taxes, depreciation and amortization (“Adjusted EBITDA”) as net income (loss) including noncontrolling interests, excluding discontinued operations, income taxes, other (income) expense, net, changes in the fair value of contingent earn-out obligations, interest (income) expense, net, loss (gain) on sale of assets, goodwill impairment and depreciation and amortization. Other companies may define Adjusted EBITDA differently. Adjusted EBITDA is presented because it is a financial measure that is frequently requested by third parties. However, Adjusted EBITDA is not considered under generally accepted accounting principles as a primary measure of an entity’s financial results, and accordingly, Adjusted EBITDA should not be considered an alternative to operating income (loss), net income (loss), or cash flows as determined under generally accepted accounting principles and as reported by the Company. 2007 2008 2009 2010 2011 2012 2013 Net Income (Loss) Including Noncontrolling Interests 32,466 $ 49,690 $ 34,182 $ 14,740 $ ($36,492) $11,849 $28,556 Discontinued Operations (266) 107 (1,282) 5,824 4,018 (355) 76 Income Taxes 19,894 30,855 20,307 11,193 (5,463) 10,045 18,148 Other (Income) Expense, net (5) (68) (17) (247) (934) (145) (204) Changes in the Fair Value of Contingent Earn-out Obligations - - - (1,574) (5,528) (662) (1,646) Interest (Income) Expense, net (2,670) (1,154) 622 1,506 1,758 1,571 1,328 Loss (Gain) on Sale of Assets 31 (290) (106) (527) (236) (491) (589) Goodwill Impairment - - - - 57,354 - - Depreciation and Amortization 6,787 12,325 12,635 16,718 18,982 20,569 18,554 Adjusted EBITDA 56,237 $ 91,465 $ 66,341 $ 47,633 $ 33,459 $ 42,381 $ 64,223 $ Year Ended December 31, |

|
|
($ in thousands) Appendix V —Supplemental Non-GAAP Information (Historical) 24 Note 1: Operating results from continuing operations attributable to Comfort Systems USA, Inc., excluding goodwill impairment, changes in the fair value of contingent earn-out obligations, tax valuation allowances and out of period adjustment are presented because the Company believes it reflects the results of the core ongoing operations of the Company, and because we believe it is responsive to frequent questions we receive from third parties. However, this measure is not considered a primary measure of an entity’s financial results under generally accepted accounting principles, and accordingly, this amount should not be considered an alternative to operating results as determined under generally accepted accounting principles and as reported by the Company. Note 2: Net income (loss) from continuing operations attributable to Comfort Systems USA, Inc. is income (loss) from continuing operations less net income attributable to noncontrolling interests. Note 3: The tax rate on these items was computed using the pro forma effective tax rate of the Company exclusive of these charges. Note 4: Correction of prior period accounting errors in 2013 resulted in net after-tax income of approximately $1.3 million, or $0.03 per diluted share. 2008 2009 2010 2011 2012 2013 Net income (loss) from continuing operations attributable to Comfort Systems USA, Inc. 49,797 $ 32,900 $ 20,564 $ ($32,812) $13,108 $27,345 Goodwill impairment (after tax) - - - 44,805 - - Changes in the fair value of contingent earn-out obligations (after tax) - - (934) (5,276) (597) (1,486) Tax valuation allowances (after tax) - - - 2,056 - - Out of period adjustment (after tax) - - - - - (1,268) Net income from continuing operations attributable to Comfort Systems USA, Inc. excluding goodwill impairment, changes in the fair value of contingent earn-out obligations, tax valuation allowances and out of period adjustment 49,797 $ 32,900 $ 19,630 $ 8,773 $ 12,511 $ 24,591 $ |

|
|
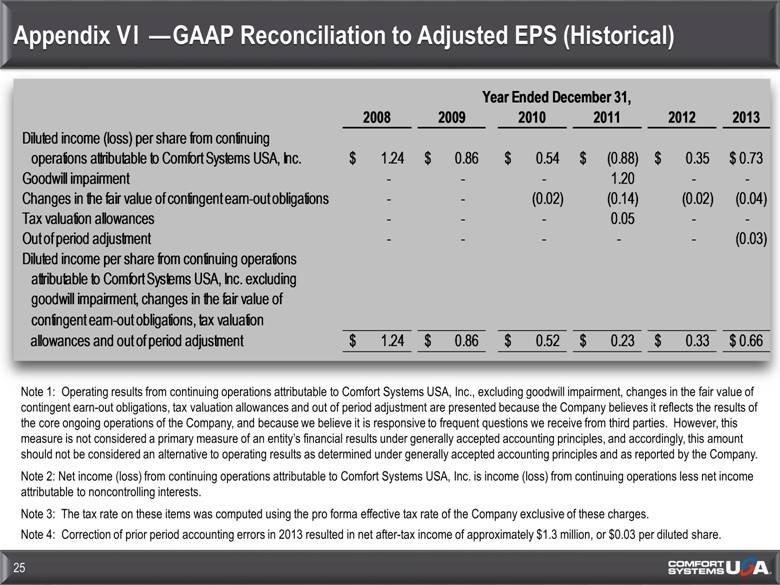
Appendix VI —GAAP Reconciliation to Adjusted EPS (Historical) 25 Note 1: Operating results from continuing operations attributable to Comfort Systems USA, Inc., excluding goodwill impairment, changes in the fair value of contingent earn-out obligations, tax valuation allowances and out of period adjustment are presented because the Company believes it reflects the results of the core ongoing operations of the Company, and because we believe it is responsive to frequent questions we receive from third parties. However, this measure is not considered a primary measure of an entity’s financial results under generally accepted accounting principles, and accordingly, this amount should not be considered an alternative to operating results as determined under generally accepted accounting principles and as reported by the Company. Note 2: Net income (loss) from continuing operations attributable to Comfort Systems USA, Inc. is income (loss) from continuing operations less net income attributable to noncontrolling interests. Note 3: The tax rate on these items was computed using the pro forma effective tax rate of the Company exclusive of these charges. Note 4: Correction of prior period accounting errors in 2013 resulted in net after-tax income of approximately $1.3 million, or $0.03 per diluted share. 2008 2009 2010 2011 2012 2013 Diluted income (loss) per share from continuing operations attributable to Comfort Systems USA, Inc. 1.24 $ 0.86 $ 0.54 $ (0.88) $ 0.35 $ 0.73 $ Goodwill impairment - - - 1.20 - - Changes in the fair value of contingent earn-out obligations - - (0.02) (0.14) (0.02) (0.04) Tax valuation allowances - - - 0.05 - - Out of period adjustment - - - - - (0.03) Diluted income per share from continuing operations attributable to Comfort Systems USA, Inc. excluding goodwill impairment, changes in the fair value of contingent earn-out obligations, tax valuation allowances and out of period adjustment 1.24 $ 0.86 $ 0.52 $ 0.23 $ 0.33 $ 0.66 $ Year Ended December 31, |
|
|
Contact 26 Bill George Executive Vice President and CFO 1-800-723-8431 bill.george@comfortsystemsusa.com www.comfortsystemsusa.com |
