Attached files
| file | filename |
|---|---|
| 8-K - 8-K - WashingtonFirst Bankshares, Inc. | a8knov2014investorpresenta.htm |

NASDAQ: WFBI www.wfbi.com Investor Presentation November 2014

Disclaimer WashingtonFirst Bankshares, Inc. and Subsidiary (the “Company”) make forward-looking statements in this presentation that are subject to risks and uncertainties. These forward- looking statements include: statements of goals, intentions, earnings expectations, and other expectations; estimates of risks and of future costs and benefits; assessments of probable loan losses; assessments of market risks; and statements of the ability to achieve financial and other goals. These forward-looking statements are subject to significant uncertainties because they are based upon or are affected by: management’s estimates and projections of future interest rates, market behavior, and other economic conditions; future laws and regulations; and a variety of other matters which, by their nature, are subject to significant uncertainties. Because of these uncertainties, the Company’s actual future results may differ materially from those indicated. In addition, the Company’s past results of operations do not necessarily indicate its future results. Please also see the discussion of “RISK FACTORS” in the Company’s 10-K dated March 19, 2014 which is available online at www.sec.gov. For further information on the company please contact: Matthew R. Johnson Executive Vice President / Chief Financial Offer (703) 840-2422 mjohnson@wfbi.com 1

Corporate Overview 2 WashingtonFirst Corporate Office WashingtonFirst Branch Began operations in 2004 Full service commercial bank headquartered in Reston, Virginia $1.3 billion in assets 17 branches located in Northern Virginia, Maryland and the District of Columbia

Recent Developments 3 Closed on the acquisition of Millennium Bank, NA (FDIC assisted transaction) Record quarterly earnings in 3Q 2014 of $0.33 fully diluted per share • NIM: 3.88% in 3Q 2014 vs. 3.84% in 3Q 2013 • ROAE: 9.93% in Q3 2014 vs. 8.06% in Q3 2013 Reduced NPAs by 48% or $10.6 million in first nine months of 2014, resulting in NPAs of $11.7 million (0.87% of total assets) $133 million in organic loan growth YTD (+21% annualized) • Existing lending team with proven ability to generate quality loan growth • Key hires of senior lenders with demonstrated following and pipelines • No change in fundamental strategy, underwriting standards, or loan mix Launched the mortgage division, including hiring 6 experienced lenders Three new branches – Rockville, Herndon and McLean Commenced paying quarterly cash dividends - $0.04 per share Repaid $4.4 million (25%) of the SBLF funding in 3Q2014 Declared 5% stock dividend in 3Q2014

Board of Directors Physicians Attorneys Consulting/Government Relations Professionals Real Estate Professionals Entrepreneurs Joseph S. Bracewell * Chairman of the Board William C. Oldaker * Oldaker Law Group, LLP Honorable Joe R. Reeder Greenberg Traurig Josephine S. Cooper Josephine Cooper, LLC Honorable John H. Dalton The Financial Services Roundtable Juan A. Mencia * CubeCorp/ByteTech Mark C. Michael Occasions Caterers, Inc. Larry D. Meyers Meyers & Associates Madhu K. Mohan, MD * Riverside Medical Group Randall S. Peyton, MD Arthritis & Sports Orthopaedics & Physical Therapy James P. Muldoon METCOR, Ltd. Gail R. Steckler Infrastructure Management Group, Inc. General (Ret.) Johnnie E. Wilson JWIL, LLC John J. Mahoney Regional Title Incorporated William G. Reilly Champion Title & Settlements, Inc. Kenneth Morrissette * Interstate Worldwide Relocation Services Diverse experience with strong ties to the Washington, DC metropolitan area Richard D. Horn General Counsel Bankers George W. Connors, IV Bank President & Chief Credit Officer D. Mark Lowers Lowers Risk Group C.E. Andrews * MorganFranklin Consulting Shaza L. Andersen * President & Chief Executive Officer Donald W. Fisher, PhD American Medical Group Association 4 Jon M. Peterson The Peterson Companies * Executive Committee

Senior Management Overview Longevity amongst experienced, diverse management team Significant experience and impressive track record in community banking, acquisitions, and creation of franchise value Well connected in the metropolitan Washington DC business/professional community Excellent regulatory relationships 5 Name Age Title Joseph S. Bracewell 67 Chairman of the Board Shaza L. Andersen 48 President/CEO George W. Connors, IV 55 Bank President/CCO Matthew R. Johnson 50 EVP/CFO Richard D. Horn 52 General Counsel

Senior Management Team Joseph S. Bracewell – Chairman of the Board Chairman of the Board of Directors of the Bank and the Company Over 40 years of experience in the banking and legal industries Principal organizer or founding director of six newly-chartered banks, five of which have been profitably sold Previously a member of the Board of Directors of the Independent Community Bankers of America as well as a director and vice chairman of the Federal Home Loan Bank of Atlanta Shaza L. Andersen –President/CEO Founder and Chief Executive Officer of WashingtonFirst Over 24 years of experience in banking including serving as the EVP and COO of Century National Bank from 1994 to 2001 until Century was acquired by United Bank in 2001 Extensive M&A experience Previously served on the Board of Directors of the Federal Home Loan Bank of Atlanta (Vice Chair of the Corporate Governance Committee and a member of the Housing Committee) 6 Matthew R. Johnson – EVP / CFO Executive Vice President and Chief Financial Officer of WashingtonFirst Has been with WashingtonFirst since its inception in 2004 Extensive financial institution planning and development as well as acquisition experience Prior to WashingtonFirst served as the Chief Financial Officer of Capital Bank, NA in Rockville, and also held management positions with Olson Research Associates, Caledonian Venture Partners and Chesapeake Ventures
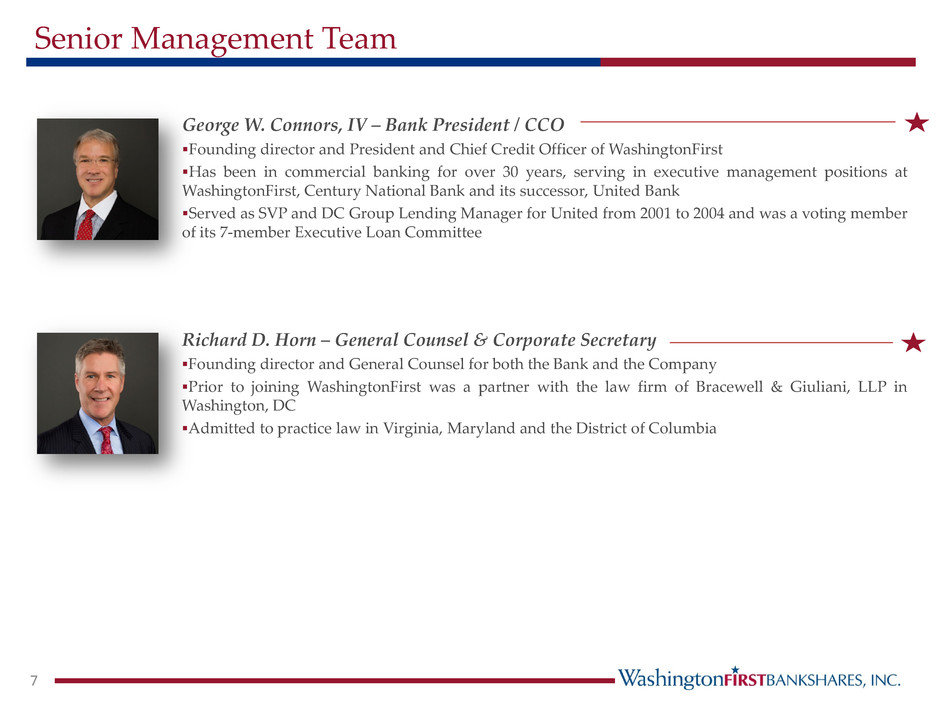
Senior Management Team Richard D. Horn – General Counsel & Corporate Secretary Founding director and General Counsel for both the Bank and the Company Prior to joining WashingtonFirst was a partner with the law firm of Bracewell & Giuliani, LLP in Washington, DC Admitted to practice law in Virginia, Maryland and the District of Columbia 7 George W. Connors, IV – Bank President / CCO Founding director and President and Chief Credit Officer of WashingtonFirst Has been in commercial banking for over 30 years, serving in executive management positions at WashingtonFirst, Century National Bank and its successor, United Bank Served as SVP and DC Group Lending Manager for United from 2001 to 2004 and was a voting member of its 7-member Executive Loan Committee
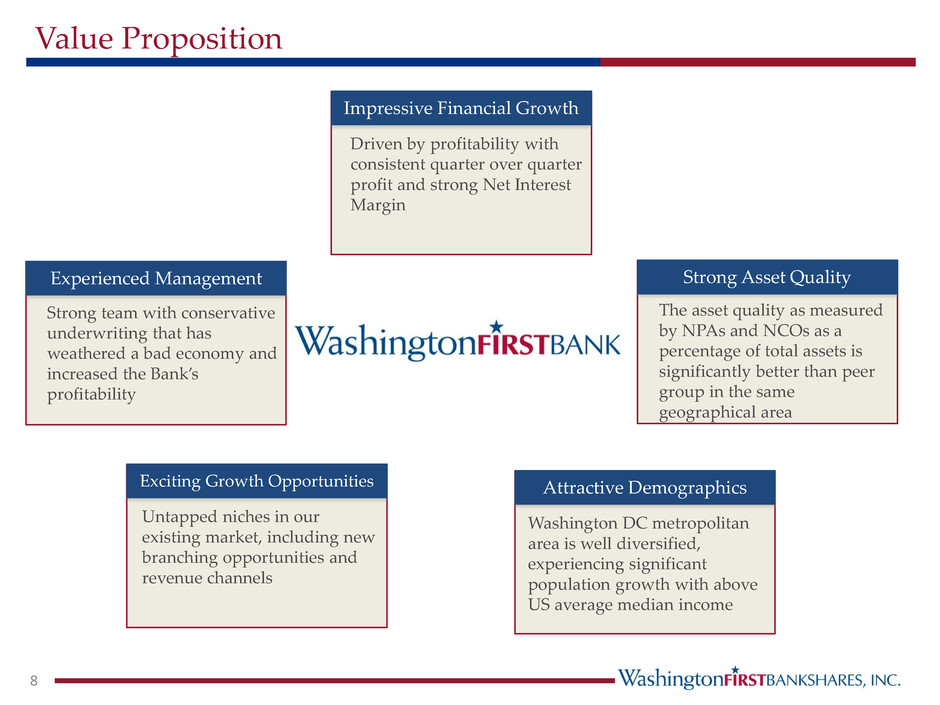
Value Proposition 8 Attractive Demographics Washington DC metropolitan area is well diversified, experiencing significant population growth with above US average median income Strong Asset Quality The asset quality as measured by NPAs and NCOs as a percentage of total assets is significantly better than peer group in the same geographical area Exciting Growth Opportunities Untapped niches in our existing market, including new branching opportunities and revenue channels Experienced Management Strong team with conservative underwriting that has weathered a bad economy and increased the Bank’s profitability Impressive Financial Growth Driven by profitability with consistent quarter over quarter profit and strong Net Interest Margin

Our Strategy WashingtonFirst seeks to capitalize on market opportunities while maintaining disciplined and conservative credit underwriting that has been the cornerstone of our past profitability. Opportunity Organic Growth Focus on relationships Enhance existing footprint Hire seasoned lenders Blueprint for Success Profitability Continued emphasis on Net Interest Margin Enhance fee income Continued diligence to minimize overhead Opportunistic Growth Explore potential acquisitions Cultivate relationships with institutional investors Maintain Credit Quality Continued diligence on credit quality Conservative credit culture Disciplined underwriting 9
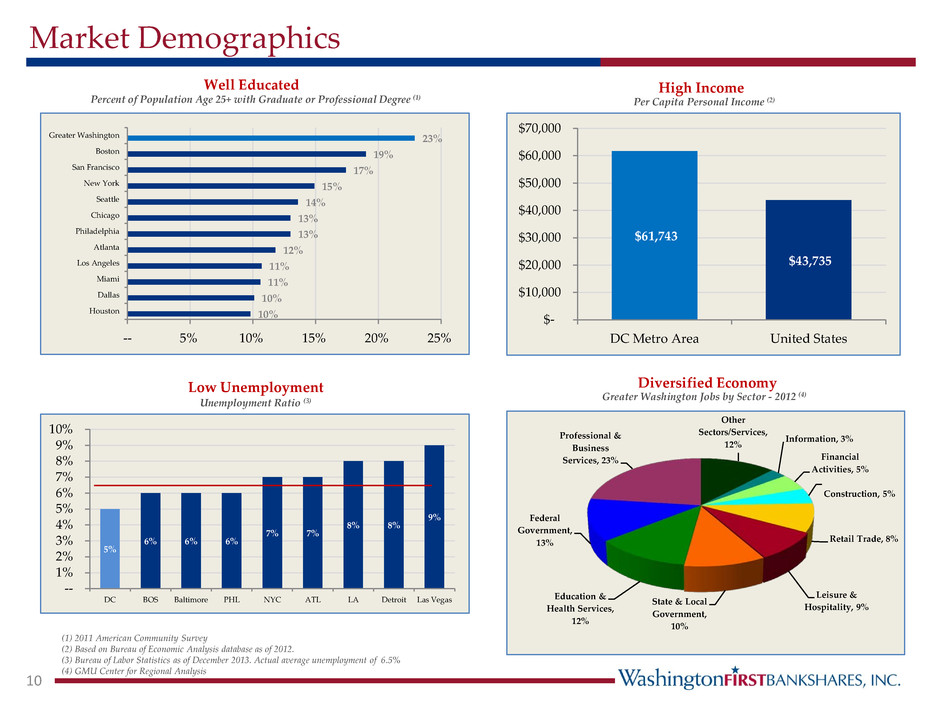
Other Sectors/Services, 12% Information, 3% Financial Activities, 5% Construction, 5% Retail Trade, 8% Leisure & Hospitality, 9% State & Local Government, 10% Education & Health Services, 12% Federal Government, 13% Professional & Business Services, 23% 10 (1) 2011 American Community Survey (2) Based on Bureau of Economic Analysis database as of 2012. (3) Bureau of Labor Statistics as of December 2013. Actual average unemployment of 6.5% (4) GMU Center for Regional Analysis Greater Washington Jobs by Sector - 2012 (4) Percent of Population Age 25+ with Graduate or Professional Degree (1) Unemployment Ratio (3) Per Capita Personal Income (2) Market Demographics Well Educated High Income Diversified Economy Low Unemployment 5% 6% 6% 6% 7% 7% 8% 8% 9% -- 1% 2% 3% 4% 5% 6% 7% 8% 9% 10% DC BOS Baltimore PHL NYC ATL LA Detroit Las Vegas $61,743 $43,735 $- $10,000 $20,000 $30,000 $40,000 $50,000 $60,000 $70,000 DC Metro Area United States 10% 10% 11% 11% 12% 13% 13% 14% 15% 17% 19% 23% -- 5% 10% 15% 20% 25% Houston Dallas Miami Los Angeles Atlanta Philadelphia Chicago Seattle New York San Francisco Boston Greater Washington
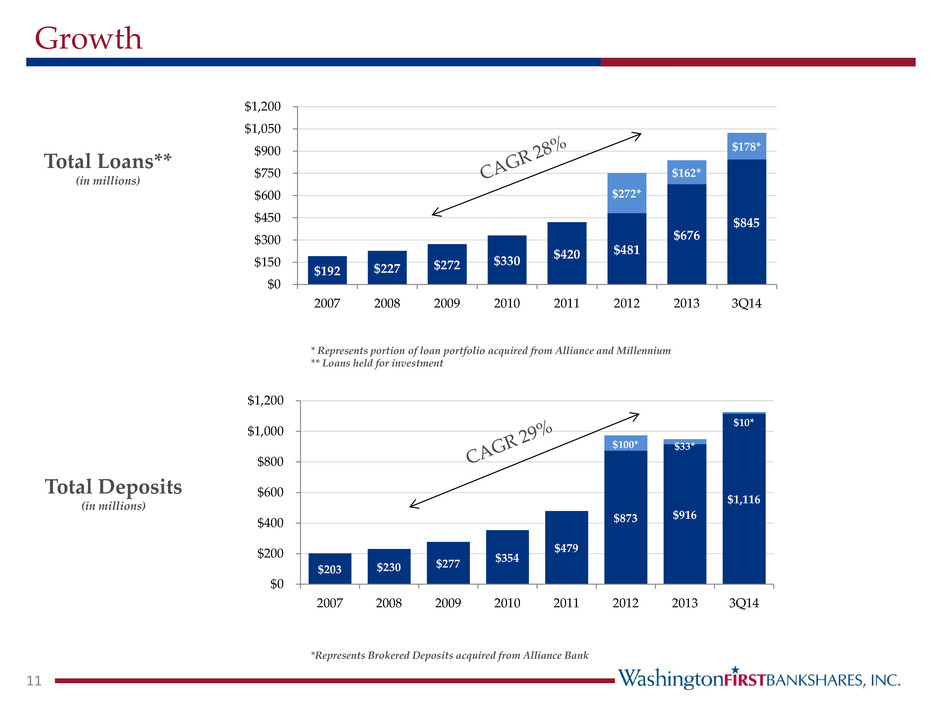
Growth 11 Total Deposits (in millions) Total Loans** (in millions) * Represents portion of loan portfolio acquired from Alliance and Millennium ** Loans held for investment *Represents Brokered Deposits acquired from Alliance Bank $192 $227 $272 $330 $420 $481 $676 $845 $272* $162* $178* $0 $150 $300 $450 $600 $750 $900 $1,050 $1,200 2007 2008 2009 2010 2011 2012 2013 3Q14 $203 $230 $277 $354 $479 $873 $916 $1,116 $100* $33* $10* $0 $200 $400 $600 $800 $1,000 $1,200 2007 2008 2009 2010 2011 2012 2013 3Q14

Loans Held for Investment As of September 30, 2014 12 Diversified loan portfolio with a strong credit culture Amount Number (in thousands) of Loans Yield Construction and Development 150,408$ 164 5.40% Commercial Real Estate (Owner Occupied) 197,400 242 4.96% Commercial Real Estate (Investment Property) 407,189 515 4.96% Residential Real Estate 121,734 988 4.90% Commercial and Industrial 137,120 620 5.40% Consumer 9,086 250 4.68% Total 1,022,937$ 2,779 5.10% Construction and Development 15% Commercial Real Estate (Owner Occupied) 38% Commercial Real Estate (Investment Property) 21% Residential Real Estate 12% Commercial and Industrial 13% Consumer 1%

1.29% 1.11% 1.23% 1.25% 1.92% 1.97% 0.87% 1.87% 2.52% 2.80% 2.98% 2.48% 2.33% 1.71% 0.00% 0.50% 1.00% 1.50% 2.00% 2.50% 3.00% 3.50% 4.00% 2008 2009 2010 2011 2012 2013 3Q14 NPAs + 90 Days PD / Assets 13 Source: SNL Financial * 2008-2012 peer group defined as banks between $300-$600M, 2013-2014 peer group defined as banks between $750M-$1.5B in VA, MD and DC. WFBI Peers*
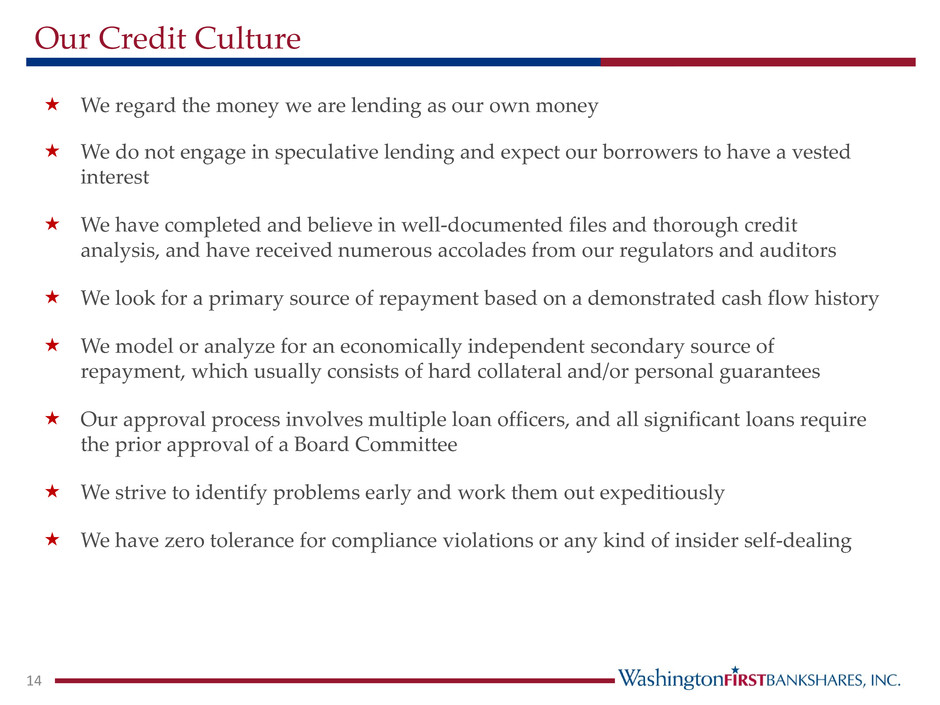
Our Credit Culture We regard the money we are lending as our own money We do not engage in speculative lending and expect our borrowers to have a vested interest We have completed and believe in well-documented files and thorough credit analysis, and have received numerous accolades from our regulators and auditors We look for a primary source of repayment based on a demonstrated cash flow history We model or analyze for an economically independent secondary source of repayment, which usually consists of hard collateral and/or personal guarantees Our approval process involves multiple loan officers, and all significant loans require the prior approval of a Board Committee We strive to identify problems early and work them out expeditiously We have zero tolerance for compliance violations or any kind of insider self-dealing 14
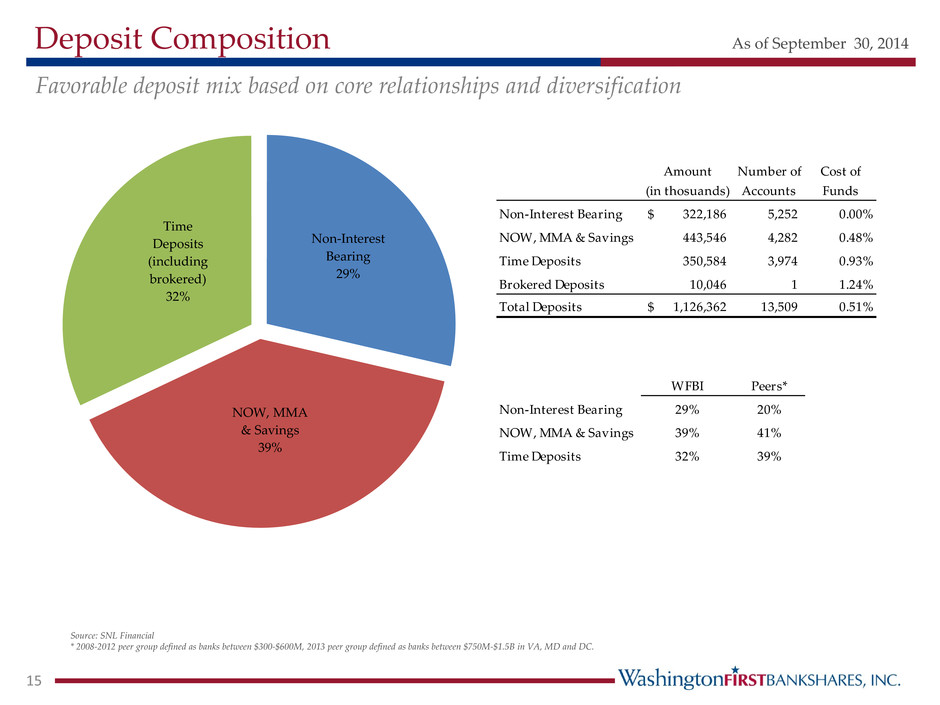
Deposit Composition As of September 30, 2014 15 Favorable deposit mix based on core relationships and diversification Source: SNL Financial * 2008-2012 peer group defined as banks between $300-$600M, 2013 peer group defined as banks between $750M-$1.5B in VA, MD and DC. Amount Number of Cost of (in thosuands) Accounts Funds Non-Interest Bearing 322,186$ 5,252 0.00% NOW, MMA & Savings 443,546 4,282 0.48% Time Deposits 350,584 3,974 0.93% Brokered Deposits 10,046 1 1.24% Total Deposits 1,126,362$ 13,509 0.51% WFBI Peers* Non-Interest Bearing 29% 20% NOW, MMA & Savings 39% 41% Time Deposits 32% 39% Non-Interest Bearing 29% NOW, MMA & Savings 39% Time Deposits (including brokered) 32%

$0.7 $1.9 $2.1 $6.2 $5.0 $6.7 -- $1.0 $2.0 $3.0 $4.0 $5.0 $6.0 $7.0 2010 2011 2012 2013 YTD Q3 2013 YTD Q3 2014 $4.2 $6.7 $6.6 $13.7 $11.4 $12.0 $2.4 -- $2.0 $4.0 $6.0 $8.0 $10.0 $12.0 $14.0 2010 2011 2012 2013 YTD Q3 2013 YTD Q3 2014 Earnings Growth 16 Pre-Tax Pre-Provision Earnings (in millions) * Net of M&A and non-recurring items Net Income-Common (in millions) *

Earnings Trend 17 * Retroactively adjusted to reflect the effect of all stock dividends, including the 5% stock dividend declared on July 21, 2014 ** Excludes merger expenses, one-time gain on acquisition and gain (loss) on sale of investment securities 2010 2011 2012 2013 Q3 2014 Fully diluted earnings per share* 0.23$ 0.60$ 0.56$ 0.76$ 0.62$ Net income available to common shareholders 705$ 1,930$ 2,057$ 6,161$ 5,010$ Return on average assets 0.37% 0.53% 0.39% 0.60% 0.74% Return on average equity 3.34% 5.24% 3.92% 6.01% 8.02% Net interest margin 3.69% 4.02% 4.08% 3.90% 3.84% Efficiency ratio** 72.3% 67.4% 63.0% 66.2% 67.0% (dollars in thosands, except per share data)
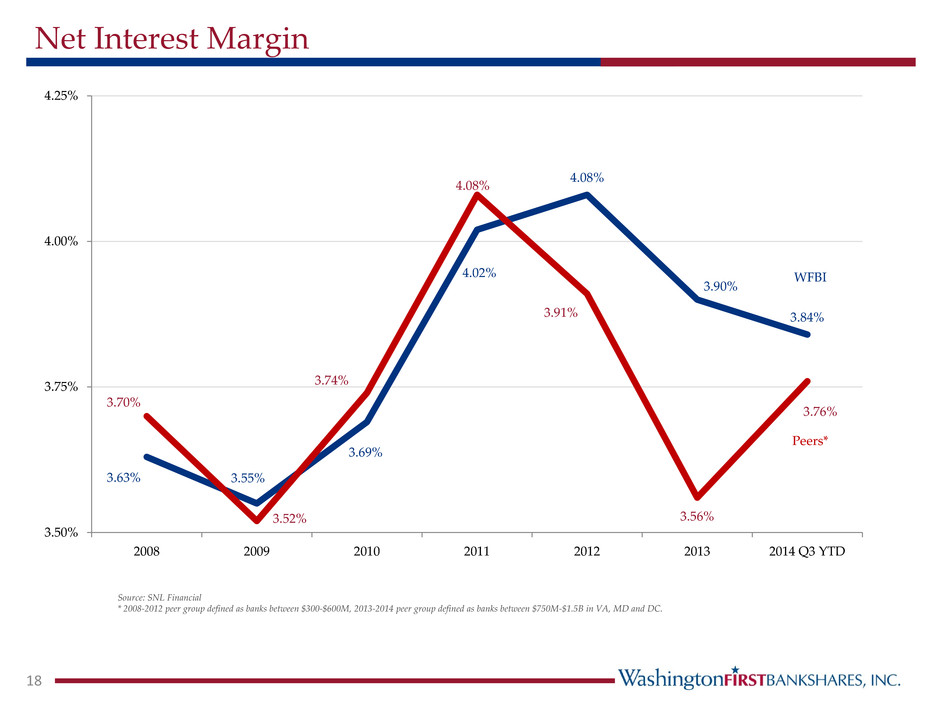
Net Interest Margin 18 Source: SNL Financial * 2008-2012 peer group defined as banks between $300-$600M, 2013-2014 peer group defined as banks between $750M-$1.5B in VA, MD and DC. 3.63% 3.55% 3.69% 4.02% 4.08% 3.90% 3.84% 3.70% 3.52% 3.74% 4.08% 3.91% 3.56% 3.76% 3.50% 3.75% 4.00% 4.25% 2008 2009 2010 2011 2012 2013 2014 Q3 YTD WFBI Peers*

89.9% 78.7% 72.3% 67.4% 63.0% 66.2% 67.0% 72.9% 76.4% 74.5% 70.6% 71.5% 70.2% 67.9% 55.0% 60.0% 65.0% 70.0% 75.0% 80.0% 85.0% 90.0% 95.0% 2008 2009 2010 2011 2012 2013 2014 Q3 YTD Efficiency Ratio 19 Source: SNL Financial * Peer data for 2008-2012 defined as banks between $300-$600M; 2013-2014 peer group defined as banks between $750M-$1.5B in VA, MD and DC. ** Excludes merger expenses, one-time gain on acquisition, and gains/(losses) on sale of investment securities and loans. WFBI** Peers*

Capital Strength 20 (dollars in thousands) 2010 2011 2012 2013 Q3 2014 Total Assets 434,526$ 559,462$ 1,147,818$ 1,127,559$ 1,335,536$ Total Shareholders' Equity 46,121 53,477 101,520 107,604 111,125 Tangible common equity to tangible assets 6.92% 5.78% 6.97% 7.64% 6.84% Total risk based capital ratio 12.46% 11.84% 13.77% 14.05% 11.37% Tier 1 risk based capital ratio 11.50% 10.73% 12.71% 12.80% 10.31% Tier 1 leverage ratio 9.62% 9.06% 9.97% 10.53% 8.73%

M&A Track Record 21 Proven track record of completing acquisitions Century National Bank (CNB) acquisition of DC branch from RTC in 1994 CNB acquisition of McLean branch in 1997 (including capital raising contingency) CNB acquisition of Reston branch in 1998 CNB acquisition of GrandBank in 2000 CNB sale to United Bankshares in 2001 WashingtonFirst (WFBI) acquisition of DC branch in 2004 WFBI acquisition of Sterling branch in 2005 WFBI acquisition of First Liberty Bancorp in 2006 (cash and stock) WFBI acquisition of Alliance Bankshares in 2012 (cash and stock) WFBI assumption of Millennium Bank, NA in 2014 (FDIC assisted)
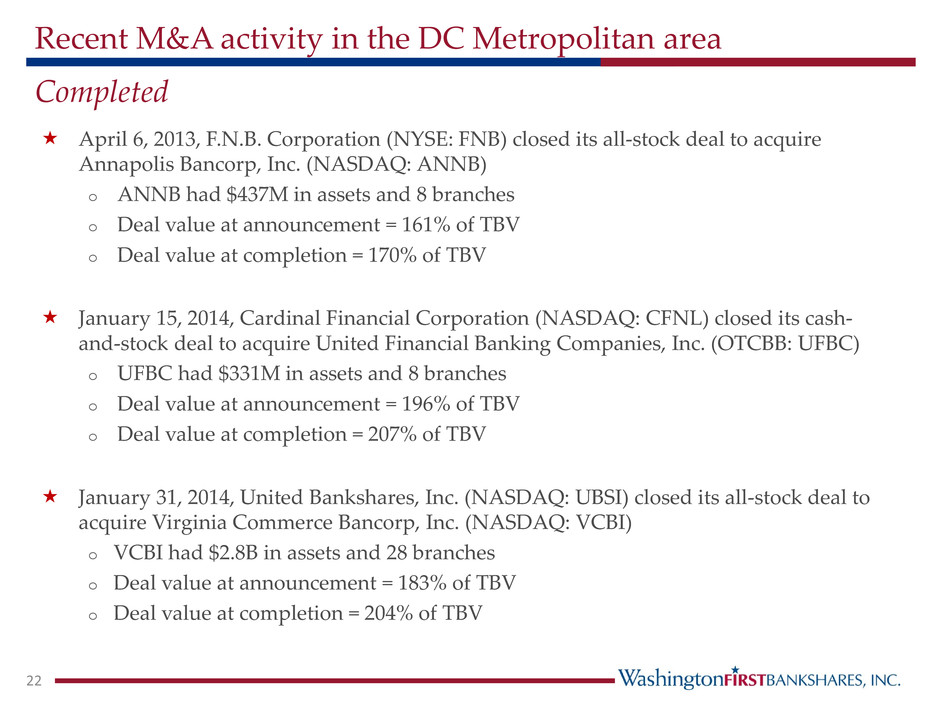
Recent M&A activity in the DC Metropolitan area Completed April 6, 2013, F.N.B. Corporation (NYSE: FNB) closed its all-stock deal to acquire Annapolis Bancorp, Inc. (NASDAQ: ANNB) o ANNB had $437M in assets and 8 branches o Deal value at announcement = 161% of TBV o Deal value at completion = 170% of TBV January 15, 2014, Cardinal Financial Corporation (NASDAQ: CFNL) closed its cash- and-stock deal to acquire United Financial Banking Companies, Inc. (OTCBB: UFBC) o UFBC had $331M in assets and 8 branches o Deal value at announcement = 196% of TBV o Deal value at completion = 207% of TBV January 31, 2014, United Bankshares, Inc. (NASDAQ: UBSI) closed its all-stock deal to acquire Virginia Commerce Bancorp, Inc. (NASDAQ: VCBI) o VCBI had $2.8B in assets and 28 branches o Deal value at announcement = 183% of TBV o Deal value at completion = 204% of TBV 22

Recent M&A activity in the DC Metropolitan area Completed September 22, 2014, F.N.B. Corporation (NYSE: FNB) closed its all-stock deal to acquire OBA Financial Services, Inc. (NASDAQ: OBAF) o OBAF has $402M in assets and 7 branches o Deal value at announcement = 133% of TBV November 3, 2014, Eagle Bancorp, Inc. (NASDAQ: EGBN) closed its cash-and-stock deal to acquire Virginia Heritage Bank (NASDAQ: VGBK) o VGBK has $956M in assets and 6 branches o Deal value at announcement = 206% of TBV 23

NASDAQ Listing 24

Facts About Our Common Stock As of November 6, 2014 25 Exchange NASDAQ Stock Market Ticker symbol WFBI Current Market Price $15.10 Common shares outstanding 6,971,365 voting; 8,122,541 total Market capitalization $122 million Insider ownership 27% of voting; 23% of total Institutional ownership 19% of voting; 31% of total Stock dividends 5% in 2012, 2013 and 2014 Cash dividend $0.04 quarterly; 1.06% yield Average volume (3 months) 4,277 Fully Diluted EPS (09/30/2014, annualized) $1.08 Tangible book value (09/30/2014) $11.18

WFBI Stock Performance (LTM) As of November 6, 2014 26 Source – SNL Financial

Appendix 27

Historical Balance Sheet 28 * Retroactively adjusted to reflect the effect of all stock dividends. (dollars in thousands) 2010 2011 2012 2013 Q3 2014 Cash and cash equivalents 46,249$ 72,321$ 224,207$ 109,164$ 100,762$ Investment securities and other investments 48,216 59,477 138,221 148,897 175,296 Loans held for sale - - - - 1,957 Loans held investment, net of allowance 326,312 415,005 747,095 829,586 1,013,963 Other real estate owned 845 615 3,294 1,463 1,161 Intangibles 3,601 3,601 4,029 3,943 6,937 Other assets 9,303 8,443 30,972 34,506 35,460 Total Assets 434,526$ 559,462$ 1,147,818$ 1,127,559$ 1,335,536$ Deposits 353,818$ 479,001$ 972,660$ 948,903$ 1,126,362$ Borrowings 32,850 24,350 64,923 63,489 90,792 Other liabilities 1,737 2,634 8,715 7,563 7,257 Total Liabilities 388,405 505,985 1,046,298 1,019,955 1,224,411 Preferred stock 13,603 17,796 17,796 17,796 13,347 Common equity 33,439 35,757 83,757 91,317 97,983 Accumulated OCI (921) (76) (33) (1,509) (205) Total Shareholders' Equity 46,121 53,477 101,520 107,604 111,125 Total Liabilities and Shareholders' equity 434,526$ 559,462$ 1,147,818$ 1,127,559$ 1,335,536$ Summary ratios: Tangible book value per share* 9.12$ 10.07$ 10.14$ 10.69$ 11.18$ Tangible common equity to tangible assets 6.92% 5.78% 6.97% 7.64% 6.84% Total risk based capital ratio 12.46% 11.84% 13.77% 14.05% 11.37% Tier 1 risk based capital ratio 11.50% 10.73% 12.71% 12.80% 10.31% Tier 1 leverage ratio 9.62% 9.06% 9.97% 10.53% 8.73%

Historical Income Statement 29 * Retroactively adjusted to reflect the effect of all stock dividends. (dollars in thousands) 2010 2011 2012 2013 YTD Q3 2014 Interest income 19,958$ 24,387 27,876 46,100 40,247 Interest expense 5,516 5,009 4,949 6,130 5,257 Net interest income 14,442 19,378 22,927 39,970 34,990 Provision for loan losses 1,747 2,301 3,225 4,755 2,205 Net interest income after provision for loan losses 12,695 17,077 19,702 35,215 32,785 Non-interest income 938 1,159 3,884 1,868 1,519 Non-interest expense 11,222 13,835 20,178 28,117 24,477 Income before provision for income taxes 2,411 4,401 3,408 8,966 9,827 Provision for income taxes 926 1,794 1,173 2,627 2,958 Net income 1,485 2,607 2,235 6,339 6,869 Preferred stock dividends and accretion 780 677 178 178 128 Net income available to common shareholders 705$ 1,930$ 2,057$ 6,161$ 6,741$ Fully diluted earnings per share* 0.22$ 0.59$ 0.56$ 0.76$ 0.81$
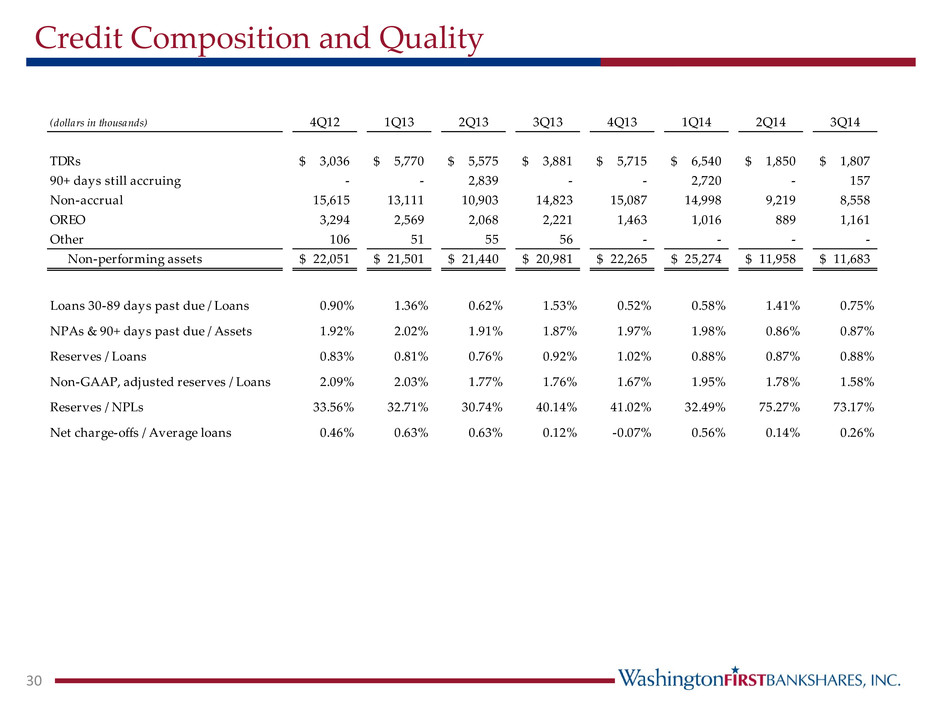
Credit Composition and Quality 30 (dollars in thousands) 4Q12 1Q13 2Q13 3Q13 4Q13 1Q14 2Q14 3Q14 TDRs 3,036$ 5,770$ 5,575$ 3,881$ 5,715$ 6,540$ 1,850$ 1,807$ 90+ days still accruing - - 2,839 - - 2,720 - 157 Non-accrual 15,615 13,111 10,903 14,823 15,087 14,998 9,219 8,558 OREO 3,294 2,569 2,068 2,221 1,463 1,016 889 1,161 Other 106 51 55 56 - - - - Non-performing assets 22,051$ 21,501$ 21,440$ 20,981$ 22,265$ 25,274$ 11,958$ 11,683$ Loans 30-89 days past due / Loans 0.90% 1.36% 0.62% 1.53% 0.52% 0.58% 1.41% 0.75% NPAs & 90+ days past due / Assets 1.92% 2.02% 1.91% 1.87% 1.97% 1.98% 0.86% 0.87% Reserves / Loans 0.83% 0.81% 0.76% 0.92% 1.02% 0.88% 0.87% 0.88% Non-GAAP, adjusted reserves / Loans 2.09% 2.03% 1.77% 1.76% 1.67% 1.95% 1.78% 1.58% Reserves / NPLs 33.56% 32.71% 30.74% 40.14% 41.02% 32.49% 75.27% 73.17% Net charge-offs / Average loans 0.46% 0.63% 0.63% 0.12% -0.07% 0.56% 0.14% 0.26%
