Attached files
| file | filename |
|---|---|
| 8-K - FORM 8-K - Starwood Waypoint Homes | d818832d8k.htm |
| EX-99.1 - EX-99.1 - Starwood Waypoint Homes | d818832dex991.htm |
Exhibit 99.2

STARWOOD WAYPOINT RESIDENTIAL TRUST TM
THIRD QUARTER 2014
Supplemental Operating & Financial Data
Starwood Waypoint Residential Trust (“SWAY”) acquires, renovates, leases, maintains and manages single family homes.
We also invest in non-performing loans to supplement growth and seek optimal resolutions for each loan.
Our mission is to reinvent the home rental experience by providing quality homes, great service and rewarding lease programs that offer valuable benefits to our residents while
generating attractive returns for our investors.
Table of Contents
STARWOOD WAYPOINT RESIDENTIAL TRUST TM
Pages
ABOUT SWAY 1-7
FINANCIAL INFORMATION
Selected Financial & Other Information 8
Consolidated Balance Sheets 9
Consolidated Statements of Operations 10
FFO & Core FFO 11
NOI 12
CAPITAL MARKETS 13
PORTFOLIO INFORMATION
Total Rental Homes Portfolio 14-15
Leasing Statistics 16
NPL Portfolio 17
TRANSACTION ACTIVITY 18
DEFINITIONS AND RECONCILIATIONS 19-21
ABOUT SWAY
Q3 Highlights
and Recent Developments
STARWOOD WAYPOINT RESIDENTIAL TRUST TM
Strong
Financials
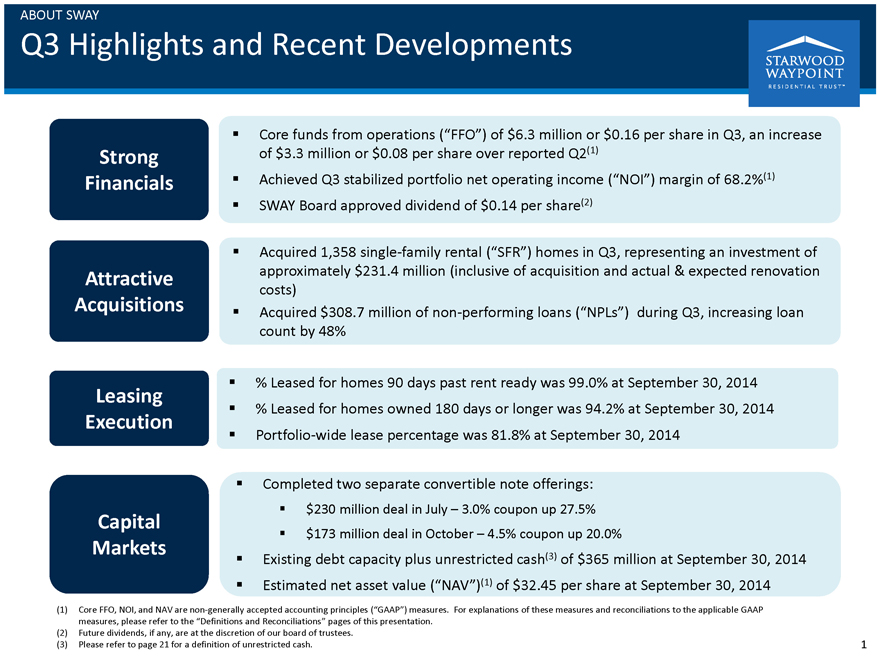
Core funds from operations (“FFO”) of $6.3 million or $0.16 per share in Q3, an increase of $3.3 million or $0.08 per share over reported
Q2(1)
Achieved Q3 stabilized portfolio net operating income (“NOI”) margin of 68.2%(1)
SWAY Board approved dividend of $0.14 per share(2)
Attractive Acquisitions
Acquired 1,358 single-family rental (“SFR”) homes in Q3, representing an investment of approximately $231.4 million (inclusive of acquisition and actual & expected
renovation costs)
Acquired $308.7 million of non-performing loans (“NPLs”) during Q3, increasing loan count by 48%
Leasing Execution
% Leased for homes 90 days past rent ready was 99.0% at September 30, 2014
% Leased for homes owned 180 days or longer was 94.2% at September 30, 2014
Portfolio-wide lease percentage was 81.8% at September 30, 2014
Capital
Markets
Completed two separate convertible note offerings:
$230 million deal
in July - 3.0% coupon up 27.5%
$173 million deal in October - 4.5% coupon up 20.0%
Existing debt capacity plus unrestricted cash(3) of $365 million at September 30,
2014
Estimated net asset value (“NAV”)(1) of $32.45 per share at September 30, 2014
(1) Core FFO, NOI, and NAV are non-generally accepted accounting principles (“GAAP”) measures. For explanations of these measures and reconciliations to the applicable
GAAP measures, please refer to the “Definitions and Reconciliations” pages of this presentation.
(2) Future dividends, if any, are at the discretion of
our board of trustees.
(3) Please refer to page 21 for a definition of unrestricted cash.
1
ABOUT SWAY
Operations
Focus Drives Results
STARWOOD WAYPOINT RESIDENTIAL TRUST TM
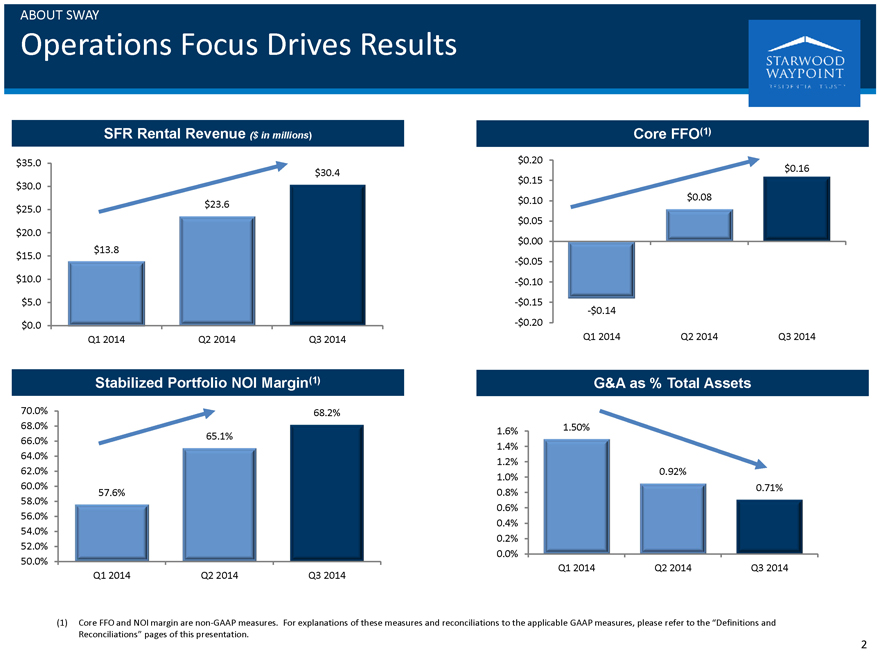
SFR Rental
Revenue ($ in millions)
$35.0 $30.4
$30.0
$25.0 $23.6
$20.0
$15.0 $13.8
$10.0
$5.0
$0.0
Q1 2014 Q2 2014 Q3 2014
Stabilized Portfolio NOI Margin(1)
70.0% 68.2%
68.0%
66.0% 65.1%
64.0%
62.0%
60.0% 57.6%
58.0%
56.0%
54.0%
52.0%
50.0%
Q1 2014 Q2 2014 Q3 2014
Core FFO(1)
$0.20 $0.16
$0.15
$0.10 $0.08
$0.05
$0.00
-$0.05
-$0.10
-$0.15 -$0.14
-$0.20
Q1 2014 Q2 2014 Q3 2014
G&A as % Total Assets
1.6% 1.50%
1.4%
1.2%
1.0% 0.92%
0.8% 0.71%
0.6%
0.4%
0.2%
0.0%
Q1 2014 Q2 2014 Q3 2014
(1) Core FFO and NOI margin are non-GAAP measures. For explanations of these measures and reconciliations to the applicable GAAP measures, please refer to the “Definitions and
Reconciliations” pages of this presentation.
2
ABOUT SWAY
Strong Leasing
Supports Portfolio Growth
STARWOOD WAYPOINT
RESIDENTIAL TRUST TM
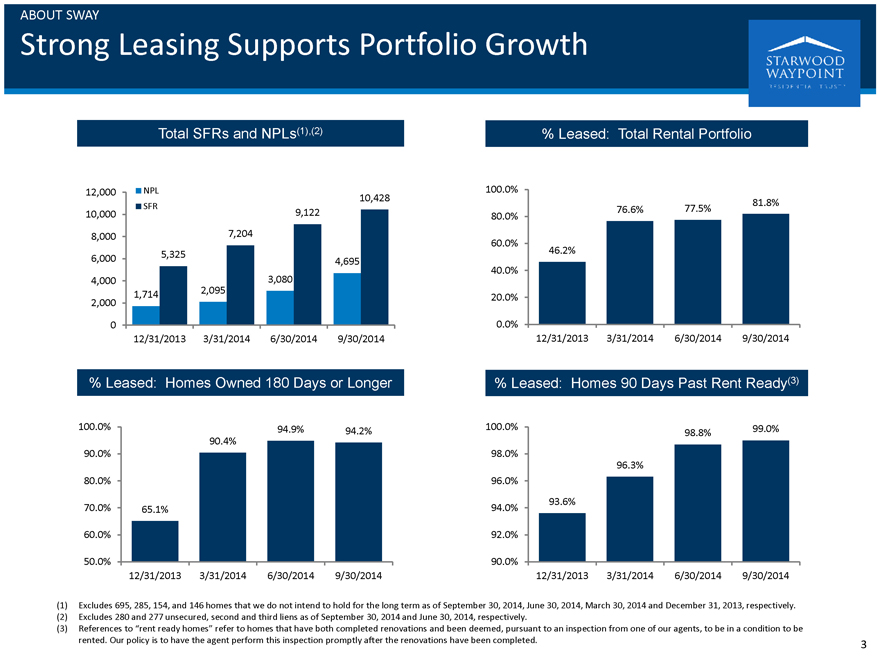
Total SFRs and NPLs(1),(2)
NPL SFR
12,000 10,000 8,000 6,000 4,000 2,000 0
10,428 9,122 7,204 5,325
4,695 3,080 1,714 2,095
12/31/2013 3/31/2014 6/30/2014 9/30/2014
% Leased: Homes Owned 180 Days or Longer
100.0% 90.0% 80.0% 70.0% 60.0% 50.0%
94.9% 94.2% 90.4% 65.1%
12/31/2013 3/31/2014 6/30/2014 9/30/2014
% Leased: Total Rental Portfolio
100.0% 80.0% 60.0% 40.0% 20.0% 0.0%
81.8% 77.5% 76.6% 46.2%
12/31/2013 3/31/2014 6/30/2014 9/30/2014
% Leased: Homes 90 Days Past Rent Ready(3)
100.0% 98.8% 99.0%
98.0%
96.3%
96.0%
94.0% 93.6%
92.0%
90.0%
12/31/2013 3/31/2014 6/30/2014 9/30/2014
(1) Excludes 695, 285, 154, and 146 homes that we do
not intend to hold for the long term as of September 30, 2014, June 30, 2014, March 30, 2014 and December 31, 2013, respectively.
(2) Excludes 280 and 277
unsecured, second and third liens as of September 30, 2014 and June 30, 2014, respectively.
(3) References to “rent ready homes” refer to homes that have
both completed renovations and been deemed, pursuant to an inspection from one of our agents, to be in a condition to be rented. Our policy is to have the agent perform this inspection promptly after the renovations have been completed.
3
ABOUT SWAY
Growing Number
of NPL Resolutions
STARWOOD WAYPOINT
RESIDENTIAL TRUST TM
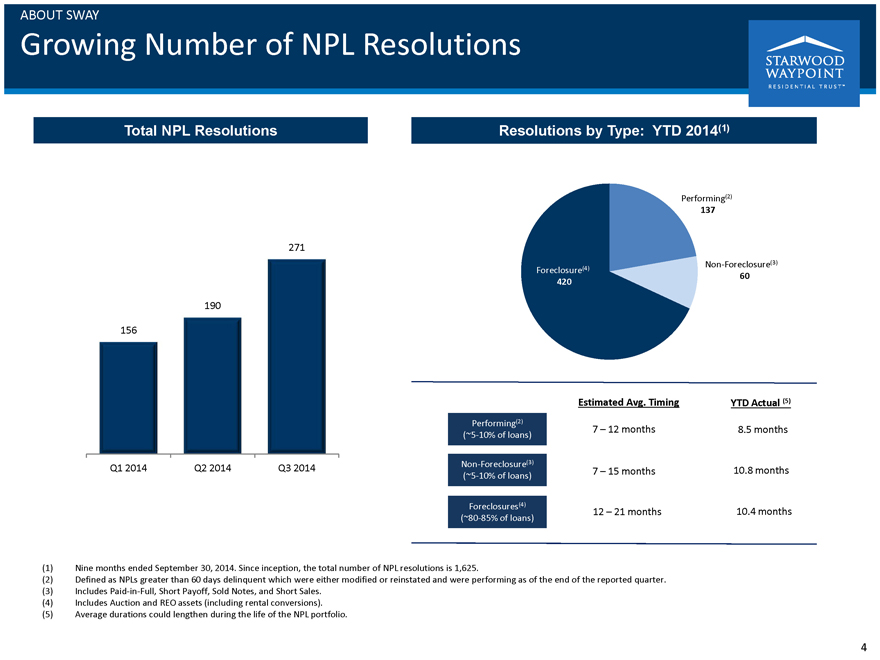
Total NPL Resolutions
271 190 156
Q1 2014 Q2 2014 Q3 2014
Resolutions by Type: YTD 2014(1)
Performing(2) 137
Foreclosure(4) 420
Non-Foreclosure(3) 60
Estimated Avg. Timing YTD Actual (5)
Performing(2)
(~5-10% of loans) 7 – 12 months 8.5 months
Non-Foreclosure(3)
(~5-10% of loans) 7 – 15 months 10.8 months
Foreclosures(4) 12 – 21 months 10.4 months
(~80-85% of loans)
(1) Nine months ended September 30, 2014. Since inception, the total number of NPL resolutions is 1,625.
(2) Defined as NPLs greater than 60 days delinquent which were either modified or reinstated and were performing as of the end of the reported quarter.
(3) Includes Paid-in-Full, Short Payoff, Sold Notes, and Short Sales.
(4) Includes Auction and
REO assets (including rental conversions).
(5) Average durations could lengthen during the life of the NPL portfolio.
4
ABOUT SWAY
NPL Strategy
Generating Strong Returns
STARWOOD WAYPOINT
RESIDENTIAL TRUST TM
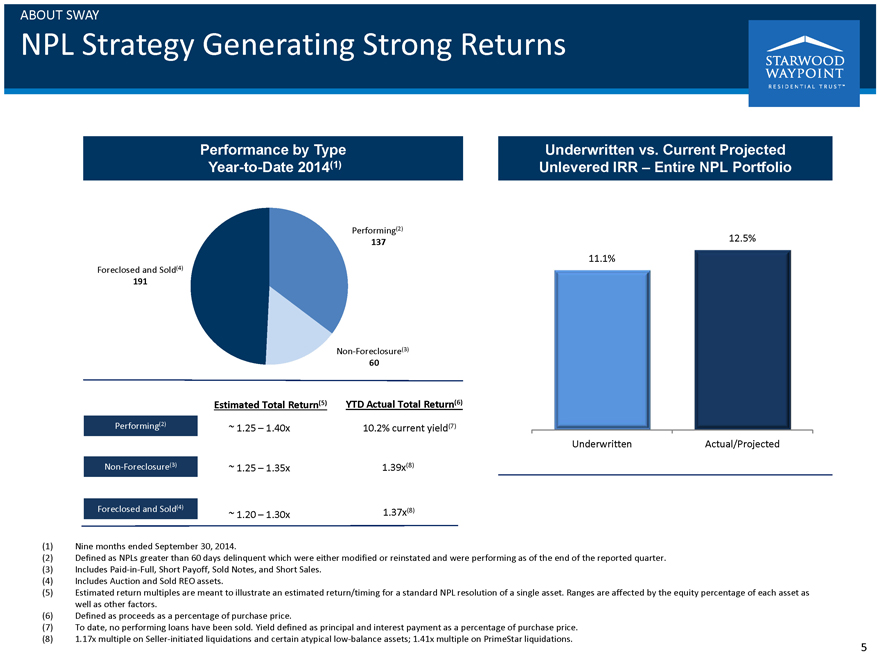
Performance by Type Year-to-Date 2014(1)
Performing(2) 137
Foreclosed and Sold(4) 191
Non-Foreclosure(3) 60
Estimated Total Return(5) YTD Actual Total Return(6)
Performing(2) ~ 1.25 – 1.40x 10.2%
current yield(7)
Non-Foreclosure(3) ~ 1.25 – 1.35x 1.39x(8)
Foreclosed
and Sold(4) ~ 1.20 – 1.30x 1.37x(8)
Underwritten vs. Current Projected
Unlevered IRR – Entire NPL Portfolio
12.5%
11.1%
Underwritten Actual/Projected
(1) Nine months ended September 30, 2014.
(2) Defined as NPLs greater than 60 days delinquent
which were either modified or reinstated and were performing as of the end of the reported quarter.
(3) Includes Paid-in-Full, Short Payoff, Sold Notes, and Short
Sales.
(4) Includes Auction and Sold REO assets.
(5) Estimated return
multiples are meant to illustrate an estimated return/timing for a standard NPL resolution of a single asset. Ranges are affected by the equity percentage of each asset as well as other factors.
(6) Defined as proceeds as a percentage of purchase price.
(7) To date, no performing loans
have been sold. Yield defined as principal and interest payment as a percentage of purchase price.
(8) 1.17x multiple on Seller-initiated liquidations and certain
atypical low-balance assets; 1.41x multiple on PrimeStar liquidations.
5
ABOUT SWAY
Portfolio
Overview
STARWOOD WAYPOINT
RESIDENTIAL TRUST TM
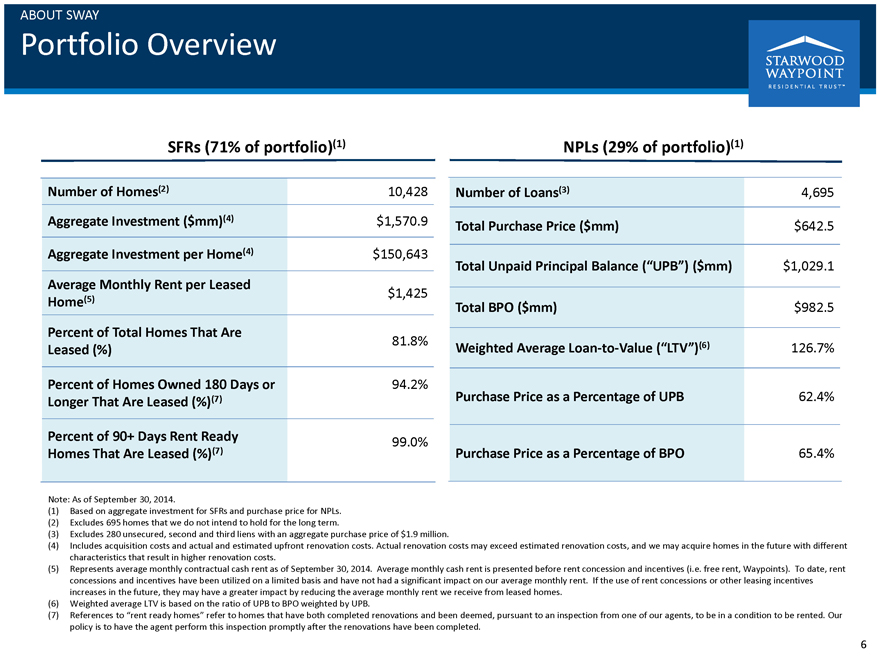
SFRs (71% of portfolio)(1)
Number of Homes(2) 10,428
Aggregate Investment ($mm)(4) $1,570.9
Aggregate Investment per Home(4) $150,643
Average Monthly Rent per Leased Home(5) $1,425
Percent of Total Homes That Are Leased (%)
81.8%
Percent of Homes Owned 180 Days or 94.2%
Longer That Are Leased (%)(7)
Percent of 90+ Days Rent Ready 99.0%
Homes That Are Leased (%)(7)
NPLs (29% of portfolio)(1)
Number of Loans(3) 4,695
Total Purchase Price ($mm) $642.5
Total Unpaid Principal Balance (“UPB”) ($mm)
$1,029.1
Total BPO ($mm) $982.5
Weighted Average Loan-to-Value
(“LTV”)(6) 126.7%
Purchase Price as a Percentage of UPB 62.4%
Purchase Price as a Percentage of BPO 65.4%
Note: As of September 30, 2014.
(1) Based on aggregate investment for SFRs and purchase price for NPLs.
(2)
Excludes 695 homes that we do not intend to hold for the long term.
(3) Excludes 280 unsecured, second and third liens with an aggregate purchase price of $1.9
million.
(4) Includes acquisition costs and actual and estimated upfront renovation costs. Actual renovation costs may exceed estimated renovation costs, and we
may acquire homes in the future with different characteristics that result in higher renovation costs.
(5) Represents average monthly contractual cash rent as of
September 30, 2014. Average monthly cash rent is presented before rent concession and incentives (i.e. free rent, Waypoints). To date, rent concessions and incentives have been utilized on a limited basis and have not had a significant impact on our
average monthly rent. If the use of rent concessions or other leasing incentives increases in the future, they may have a greater impact by reducing the average monthly rent we receive from leased homes.
(6) Weighted average LTV is based on the ratio of UPB to BPO weighted by UPB.
(7) References
to “rent ready homes” refer to homes that have both completed renovations and been deemed, pursuant to an inspection from one of our agents, to be in a condition to be rented. Our policy is to have the agent perform this inspection
promptly after the renovations have been completed.
6
ABOUT SWAY
Financing
Overview
STARWOOD
WAYPOINT
RESIDENTIAL TRUST ™
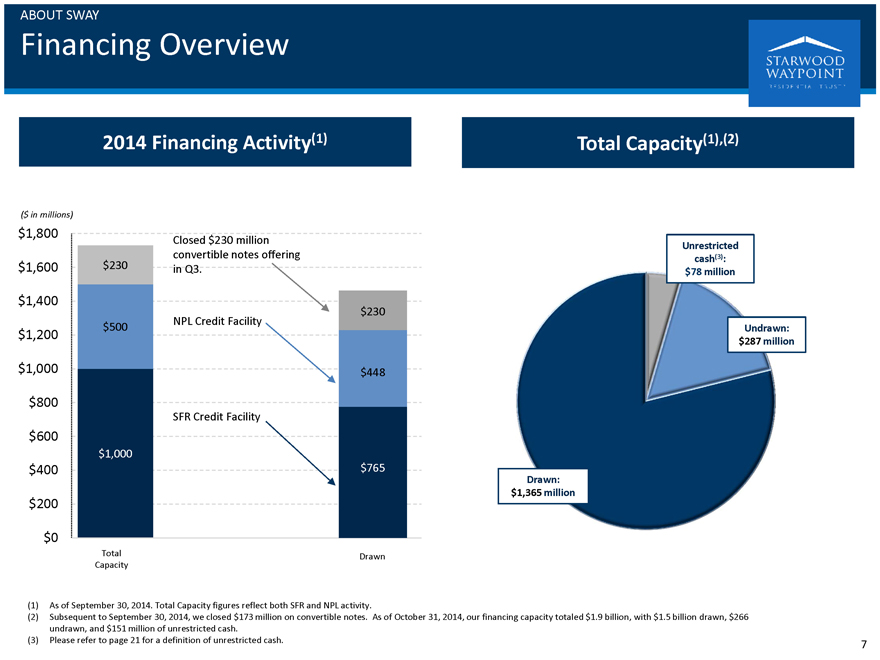
2014 Financing Activity(1)
($ in millions)
$1,800
$1,600
$1,400
$1,200
$1,000
$800
$600
$400
$200
$0
$230
$500
$1,000
Total
Capacity
Closed $230 million convertible notes offering in Q3.
NPL Credit Facility
SFR Credit Facility
$230
$448
$765
Drawn
Total Capacity(1),(2)
Drawn: $1,365 million
Unrestricted cash(3): $78 million
Undrawn: $287 million
(1) As of September 30, 2014. Total Capacity figures reflect both SFR and NPL activity.
(2)
Subsequent to September 30, 2014, we closed $173 million on convertible notes. As of October 31, 2014, our financing capacity totaled $1.9 billion, with $1.5 billion drawn, $266 undrawn, and $151 million of unrestricted cash.
(3) Please refer to page 21 for a definition of unrestricted cash.
7
FINANCIAL INFORMATION
Selected Financial & Other Information
STARWOOD
WAYPOINT
RESIDENTIAL TRUST ™
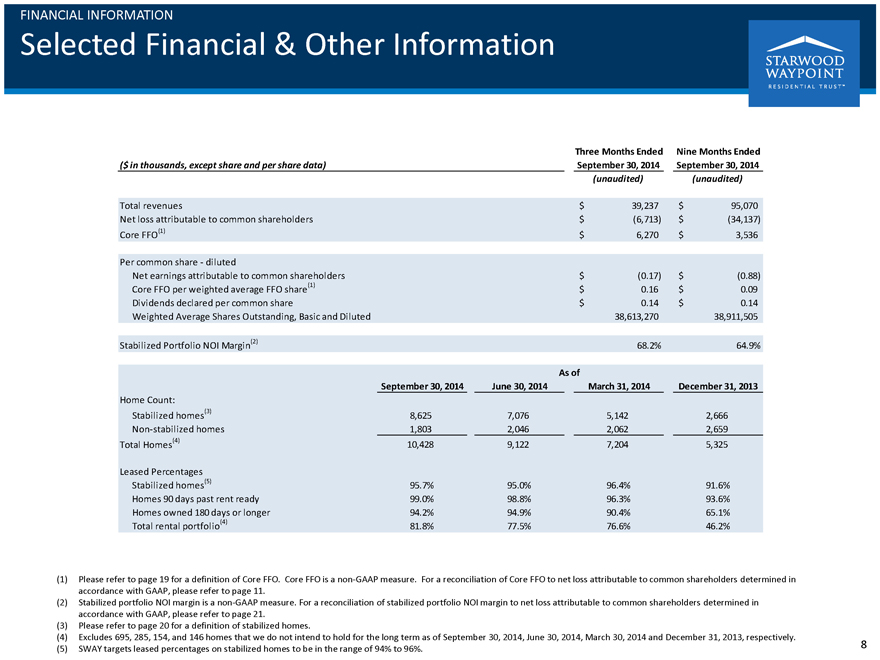
($ in thousands, except share and per share data)
Total revenues
Net loss attributable to common shareholders
Core FFO(1)
Per common share - diluted
Net earnings attributable to common shareholders
Core FFO per weighted average FFO share(1)
Dividends declared per common share
Weighted Average Shares Outstanding, Basic and Diluted
Stabilized Portfolio NOI Margin(2)
Three Months Ended September 30, 2014
(unaudited)
$ 39,237
$ (6,713)
$ 6,270
$ (0.17)
$ 0.16
$ 0.14
38,613,270
68.2%
Nine Months Ended September 30, 2014
(unaudited)
$ 95,070
$ (34,137)
$ 3,536
$ (0.88)
$ 0.09
$ 0.14
38,911,505
64.9%
As of
September 30, 2014
June 30, 2014
March 31, 2014
December 31, 2013
Home Count:
Stabilized homes(3)
Non-stabilized homes
Total Homes(4)
Leased Percentages
Stabilized homes(5)
Homes 90 days past rent ready
Homes owned 180 days or longer
Total rental portfolio(4)
8,625
1,803
10,428
95.7%
99.0%
94.2%
81.8%
7,076
2,046
9,122
95.0%
98.8%
94.9%
77.5%
5,142
2,062
7,204
96.4%
96.3%
90.4%
76.6%
2,666
2,659
5,325
91.6%
93.6%
65.1%
46.2%
(1) Please refer to page 19 for a definition of Core FFO. Core FFO is a non-GAAP measure. For a reconciliation of Core FFO to net loss attributable to common shareholders
determined in accordance with GAAP, please refer to page 11.
(2) Stabilized portfolio NOI margin is a non-GAAP measure. For a reconciliation of stabilized
portfolio NOI margin to net loss attributable to common shareholders determined in accordance with GAAP, please refer to page 21.
(3) Please refer to page 20
for a definition of stabilized homes.
(4) Excludes 695, 285, 154, and 146 homes that we do not intend to hold for the long term as of September 30, 2014, June 30,
2014, March 30, 2014 and December 31, 2013, respectively.
(5) SWAY targets leased percentages on stabilized homes to be in the range of 94% to 96%.
8
FINANCIAL INFORMATION
Consolidated Balance Sheets
STARWOOD
WAYPOINT
RESIDENTIAL TRUST ™
As of
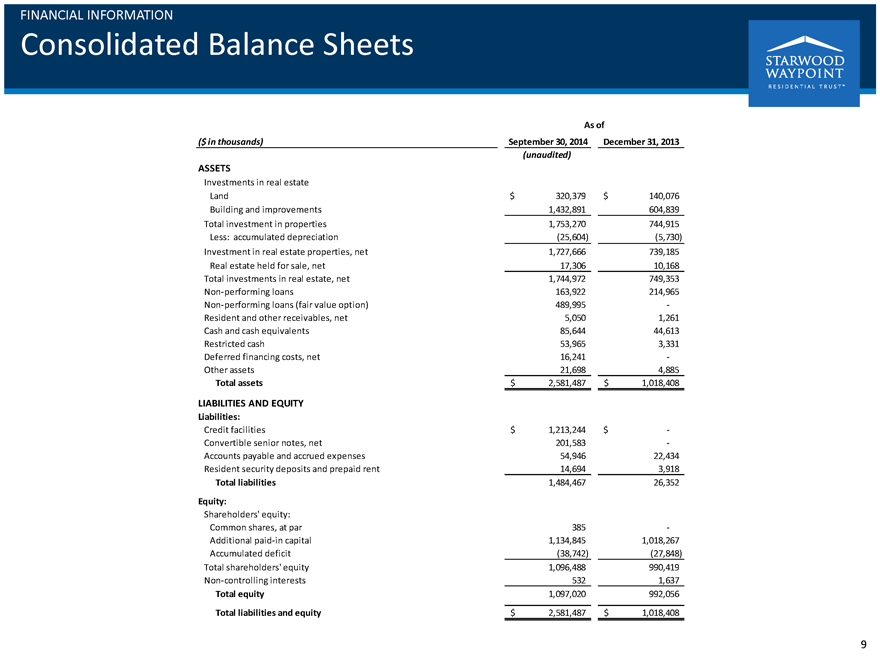
($ in thousands)
September 30, 2014
December 31, 2013
(unaudited)
ASSETS
Investments in real estate Land $ 320,379 $ 140,076
Building and improvements 1,432,891
604,839
Total investment in properties 1,753,270 744,915
Less: accumulated
depreciation (25,604) (5,730)
Investment in real estate properties, net 1,727,666 739,185
Real estate held for sale, net 17,306 10,168
Total investments in real estate, net 1,744,972
749,353
Non-performing loans 163,922 214,965
Non-performing loans (fair value
option) 489,995 -
Resident and other receivables, net 5,050 1,261
Cash and cash
equivalents 85,644 44,613
Restricted cash 53,965 3,331
Deferred financing
costs, net 16,241 -
Other assets 21,698 4,885
Total assets $ 2,581,487 $
1,018,408
LIABILITIES AND EQUITY
Liabilities:
Credit facilities
$ 1,213,244 $ -
Convertible senior notes, net 201,583 -
Accounts payable and accrued expenses 54,946
22,434
Resident security deposits and prepaid rent 14,694 3,918
Total
liabilities 1,484,467 26,352
Equity:
Shareholders’ equity:
Common shares, at par 385 -
Additional paid-in capital 1,134,845 1,018,267
Accumulated deficit (38,742) (27,848)
Total shareholders’ equity 1,096,488
990,419
Non-controlling interests 532 1,637
Total equity 1,097,020
992,056
Total liabilities and equity $ 2,581,487 $ 1,018,408
9
FINANCIAL INFORMATION
Consolidated Statements of Operations
STARWOOD
WAYPOINT
RESIDENTIAL TRUST ™
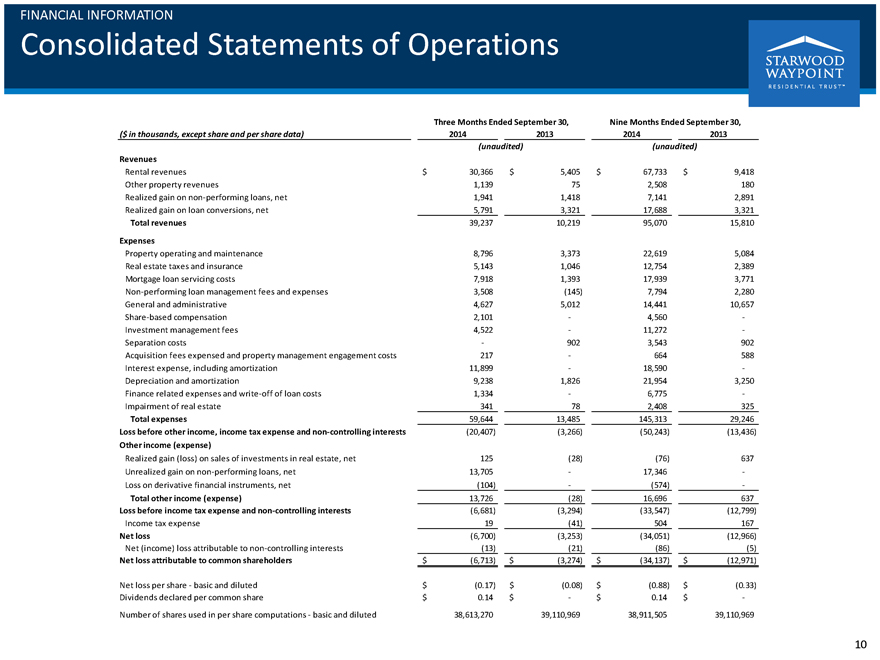
($ in thousands, except share and per share data)
Three Months Ended September 30,
2014
2013
Nine Months Ended September 30,
2014
2013
(unaudited)
(unaudited)
Revenues
Rental revenues $ 30,366 $ 5,405 $ 67,733 $ 9,418
Other property revenues 1,139 75 2,508
180
Realized gain on non-performing loans, net 1,941 1,418 7,141 2,891
Realized
gain on loan conversions, net 5,791 3,321 17,688 3,321
Total revenues 39,237 10,219 95,070 15,810
Expenses
Property operating and maintenance 8,796 3,373 22,619 5,084
Real estate taxes and insurance 5,143 1,046 12,754 2,389
Mortgage loan servicing costs 7,918
1,393 17,939 3,771
Non-performing loan management fees and expenses 3,508 (145) 7,794 2,280
General and administrative 4,627 5,012 14,441 10,657
Share-based compensation 2,101 - 4,560
-
Investment management fees 4,522 - 11,272 -
Separation costs - 902 3,543
902
Acquisition fees expensed and property management engagement costs 217 - 664 588
Interest expense, including amortization 11,899 - 18,590 -
Depreciation and amortization 9,238
1,826 21,954 3,250
Finance related expenses and write-off of loan costs 1,334 - 6,775 -
Impairment of real estate 341 78 2,408 325
Total expenses 59,644 13,485 145,313
29,246
Loss before other income, income tax expense and non-controlling interests (20,407) (3,266) (50,243) (13,436)
Other income (expense)
Realized gain (loss) on sales of investments in real estate, net 125
(28) (76) 637
Unrealized gain on non-performing loans, net 13,705 - 17,346
-
Loss on derivative financial instruments, net (104) - (574) -
Total other
income (expense) 13,726 (28) 16,696 637
Loss before income tax expense and non-controlling interests (6,681) (3,294) (33,547) (12,799)
Income tax expense 19 (41) 504 167
Net loss (6,700) (3,253) (34,051) (12,966)
Net (income) loss attributable to non-controlling interests (13) (21) (86) (5)
Net loss
attributable to common shareholders $ (6,713) $ (3,274) $ (34,137) $ (12,971)
Net loss per share - basic and diluted $ (0.17) $ (0.08) $ (0.88) $ (0.33)
Dividends declared per common share $ 0.14 $ - $ 0.14 $ -
Number of shares
used in per share computations - basic and diluted 38,613,270 39,110,969 38,911,505 39,110,969
10
FINANCIAL INFORMATION
FFO
& Core FFO(1)
STARWOOD WAYPOINT RESIDENTIAL TRUST TM
Three Months Ended September 30, Nine Months Ended September 30,
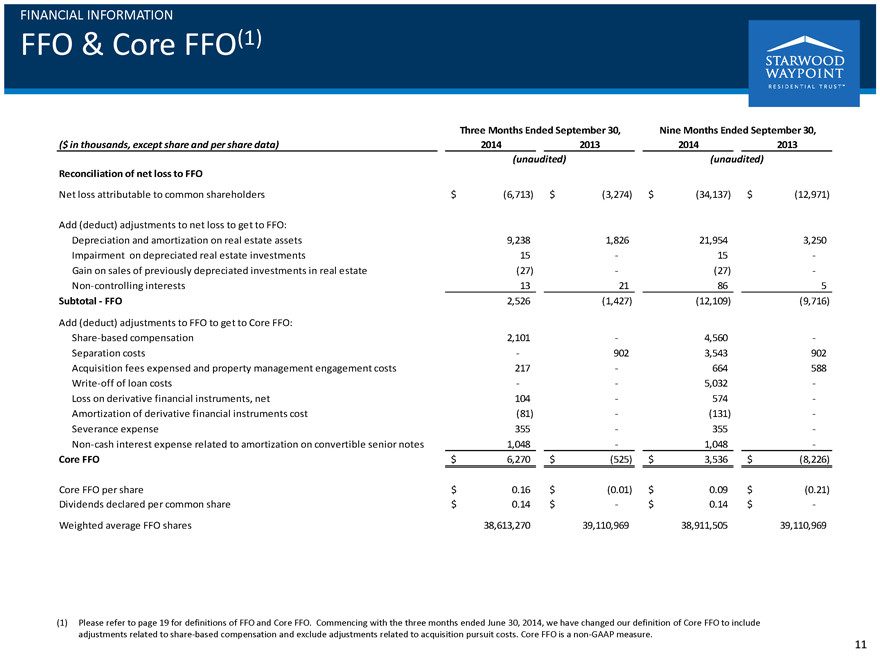
($ in thousands, except share and per share data) 2014 2013 2014 2013
(unaudited) (unaudited)
Reconciliation of net loss to FFO
Net loss attributable to common shareholders $ (6,713) $ (3,274) $ (34,137) $ (12,971)
Add (deduct) adjustments to net loss to get to FFO:
Depreciation and amortization on real estate assets 9,238 1,826 21,954 3,250
Impairment on depreciated real estate investments 15 - 15 -
Gain on sales of previously depreciated investments in real estate (27) - (27) -
Non-controlling interests 13 21 86 5
Subtotal - FFO 2,526 (1,427) (12,109)
(9,716)
Add (deduct) adjustments to FFO to get to Core FFO:
Share-based compensation 2,101 - 4,560 -
Separation costs - 902 3,543 902
Acquisition fees expensed and property management engagement costs 217 - 664 588
Write-off of loan costs - - 5,032 -
Loss on derivative financial instruments, net 104 - 574 -
Amortization of derivative financial instruments cost (81) - (131) -
Severance expense 355 - 355 -
Non-cash interest expense related to amortization on convertible senior notes 1,048 - 1,048 -
Core FFO $ 6,270 $ (525) $ 3,536 $ (8,226)
Core FFO per share $ 0.16 $
(0.01) $ 0.09 $ (0.21)
Dividends declared per common share $ 0.14 $ - $ 0.14 $ -
Weighted average FFO shares 38,613,270 39,110,969 38,911,505 39,110,969
(1)
Please refer to page 19 for definitions of FFO and Core FFO. Commencing with the three months ended June 30, 2014, we have changed our definition of Core FFO to include adjustments related to share-based compensation and exclude adjustments related
to acquisition pursuit costs. Core FFO is a non-GAAP measure.
11
FINANCIAL INFORMATION
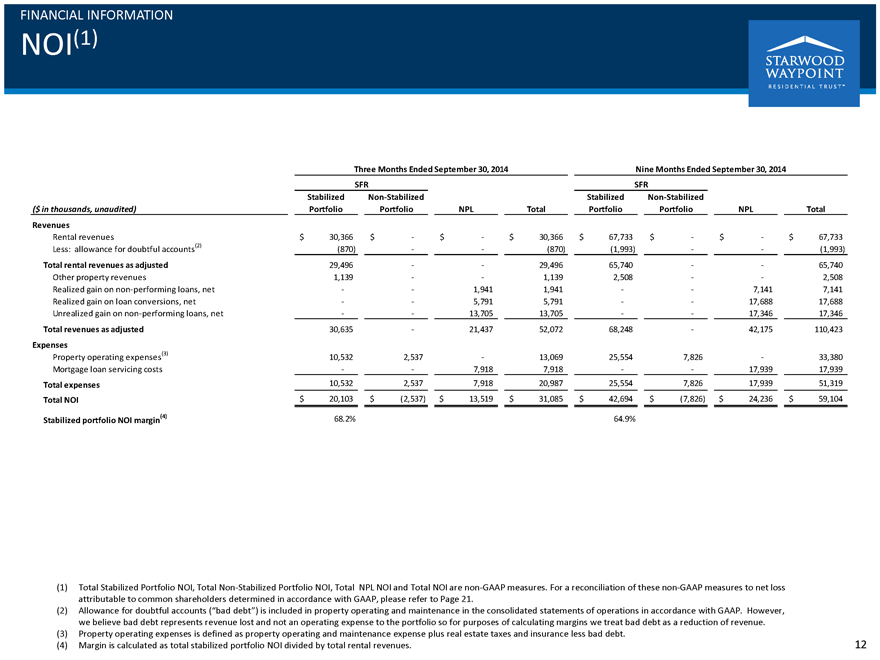
NOI(1)
STARWOOD WAYPOINT RESIDENTIAL TRUST TM
Three Months Ended September 30, 2014 Nine Months Ended September 30, 2014
SFR SFR
Stabilized Non-Stabilized Stabilized Non-Stabilized
($ in thousands, unaudited) Portfolio Portfolio NPL Total Portfolio Portfolio NPL Total
Revenues
Rental revenues $ 30,366 $ - $ - $ 30,366 $ 67,733 $ - $ - $ 67,733
Less: allowance for doubtful accounts(2) (870) - - (870) (1,993) - - (1,993)
Total rental revenues as adjusted 29,496 - - 29,496 65,740 - - 65,740
Other property revenues 1,139 - - 1,139 2,508 - - 2,508
Realized gain on non-performing loans, net - - 1,941 1,941 - - 7,141 7,141
Realized gain on loan conversions, net - - 5,791 5,791 - - 17,688 17,688
Unrealized gain on non-performing loans, net - - 13,705 13,705 - - 17,346 17,346
Total revenues as adjusted 30,635 - 21,437 52,072 68,248 - 42,175 110,423
Expenses
Property operating expenses(3) 10,532 2,537 - 13,069
25,554 7,826 - 33,380
Mortgage loan servicing costs - - 7,918 7,918 - - 17,939 17,939
Total expenses 10,532 2,537 7,918 20,987 25,554 7,826 17,939 51,319
Total NOI $
20,103 $ (2,537) $ 13,519 $ 31,085 $ 42,694 $ (7,826) $ 24,236 $ 59,104
Stabilized portfolio NOI margin(4) 68.2% 64.9%
(1) Total Stabilized Portfolio NOI, Total Non-Stabilized Portfolio NOI, Total NPL NOI and Total NOI are non-GAAP measures. For a reconciliation of these non-GAAP measures to net
loss attributable to common shareholders determined in accordance with GAAP, please refer to Page 21.
(2) Allowance for doubtful accounts (“bad debt”) is
included in property operating and maintenance in the consolidated statements of operations in accordance with GAAP. However, we believe bad debt represents revenue lost and not an operating expense to the portfolio so for purposes of calculating
margins we treat bad debt as a reduction of revenue.
(3) Property operating expenses is defined as property operating and maintenance expense plus real estate
taxes and insurance less bad debt.
(4) Margin is calculated as total stabilized portfolio NOI divided by total rental revenues.
12
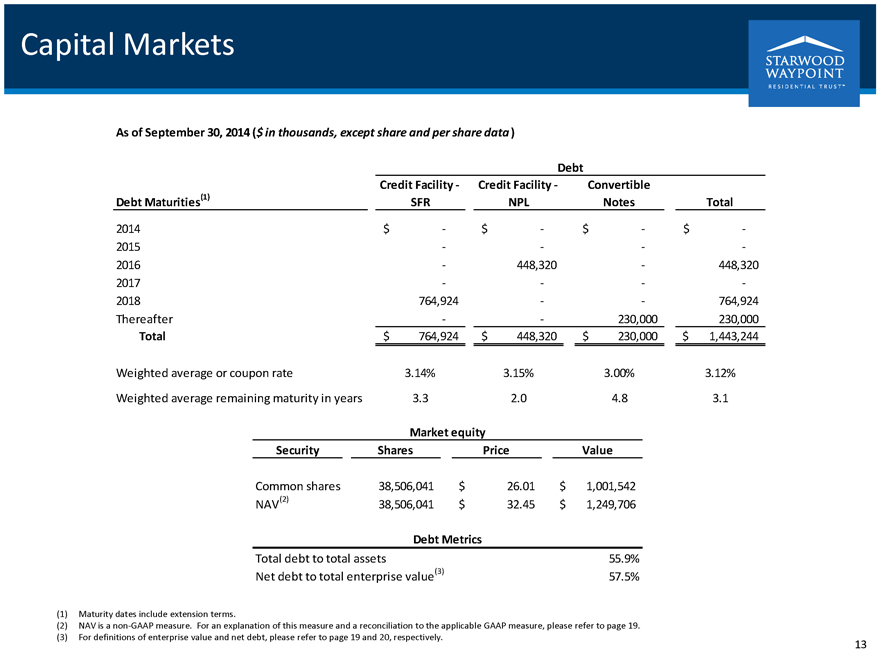
Capital Markets
STARWOOD WAYPOINT RESIDENTIAL TRUST TM
As of September 30, 2014 ($ in thousands, except share and per share data )
Debt
Credit Facility - Credit Facility - Convertible
Debt Maturities(1) SFR NPL Notes Total
2014 $ - $ - $ - $ -
2015 - - - -
2016 - 448,320 - 448,320
2017 - - - -
2018 764,924 - - 764,924
Thereafter - - 230,000 230,000
Total $ 764,924 $ 448,320 $ 230,000 $ 1,443,244
Weighted average or coupon rate 3.14% 3.15% 3.00% 3.12%
Weighted average remaining maturity in years 3.3 2.0 4.8 3.1
Market equity
Security Shares Price Value
Common shares 38,506,041 $ 26.01 $ 1,001,542
NAV(2) 38,506,041 $ 32.45 $ 1,249,706
Debt Metrics
Total debt to total assets 55.9%
Net debt to total enterprise value(3) 57.5%
(1)
Maturity dates include extension terms.
(2) NAV is a non-GAAP measure. For an explanation of this measure and a reconciliation to the
applicable GAAP measure, please refer to page 19.
(3) For definitions of enterprise value and net debt, please refer to page 19 and 20, respectively.
13
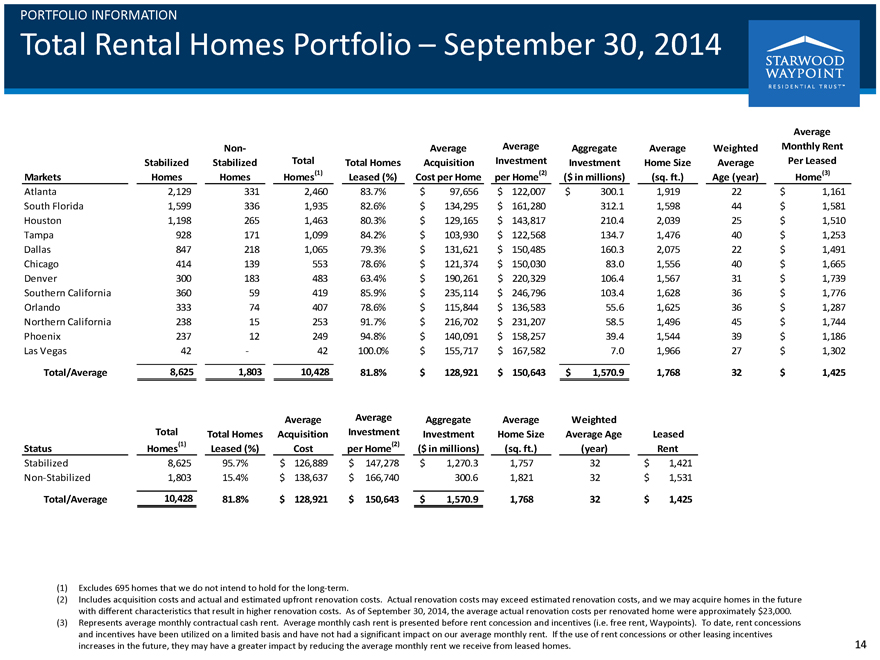
PORTFOLIO INFORMATION
Total Rental Homes Portfolio – September 30, 2014
STARWOOD WAYPOINT RESIDENTIAL TRUST TM
Markets Stabilized Homes Non-Stabilized Homes
Total Homes(1) Total Homes Leased (%) Average Acquisition Cost per Home Average Investment per Home(2) Aggregate Investment ($ in millions) Average Home Size (sq. ft.)
Weighted Average Age (year) Average Monthly Rent Per Leased Home(3)
Atlanta 2,129 331 2,460 83.7% $ 97,656 $
122,007 $ 300.1 1,919 22 $ 1,161
South Florida 1,599 336 1,935 82.6% $ 134,295 $ 161,280 312.1 1,598 44 $ 1,581
Houston 1,198 265 1,463 80.3% $ 129,165 $ 143,817 210.4 2,039 25 $ 1,510
Tampa
928 171 1,099 84.2% $ 103,930 $ 122,568 134.7 1,476 40 $ 1,253
Dallas 847 218 1,065 79.3% $ 131,621 $ 150,485 160.3 2,075 22 $ 1,491
Chicago 414 139 553 78.6% $ 121,374 $ 150,030 83.0 1,556 40 $ 1,665
Denver 300 183 483 63.4% $ 190,261 $ 220,329 106.4 1,567 31 $ 1,739
Southern California 360 59 419 85.9% $ 235,114 $ 246,796 103.4 1,628 36 $ 1,776
Orlando 333 74 407 78.6% $ 115,844 $ 136,583 55.6 1,625 36 $ 1,287
Northern California 238 15 253 91.7% $ 216,702 $ 231,207 58.5 1,496 45 $ 1,744
Phoenix 237 12 249 94.8% $ 140,091 $ 158,257 39.4 1,544 39 $ 1,186
Las Vegas 42 - 42 100.0% $ 155,717 $ 167,582 7.0 1,966 27 $ 1,302
Total/Average 8,625 1,803 10,428 81.8% $ 128,921 $ 150,643 $ 1,570.9 1,768 32 $ 1,425
Status Total Homes(1) Total Homes Leased (%) Average Acquisition Cost Average Investment per Home(2) Aggregate Investment ($
in millions) Average Home Size (sq. ft.) Weighted Average Age (year) Leased Rent
Stabilized 8,625 95.7% $ 126,889 $ 147,278
$ 1,270.3 1,757 32 $ 1,421
Non-Stabilized 1,803 15.4% $ 138,637 $ 166,740 300.6 1,821 32 $ 1,531
Total/Average 10,428 81.8% $ 128,921 $ 150,643 $ 1,570.9 1,768 32 $ 1,425
(1)
Excludes 695 homes that we do not intend to hold for the long-term.
(2) Includes acquisition costs and
actual and estimated upfront renovation costs. Actual renovation costs may exceed estimated renovation costs, and we may acquire homes in the future with different characteristics that result in higher renovation costs. As of September 30, 2014, the
average actual renovation costs per renovated home were approximately $23,000.
(3) Represents average monthly contractual cash rent. Average monthly cash rent is
presented before rent concession and incentives (i.e. free rent, Waypoints). To date, rent concessions and incentives have been utilized on a limited basis and have not had a significant impact on our average monthly rent. If the use of rent
concessions or other leasing incentives increases in the future, they may have a greater impact by reducing the average monthly rent we receive from leased homes.
14
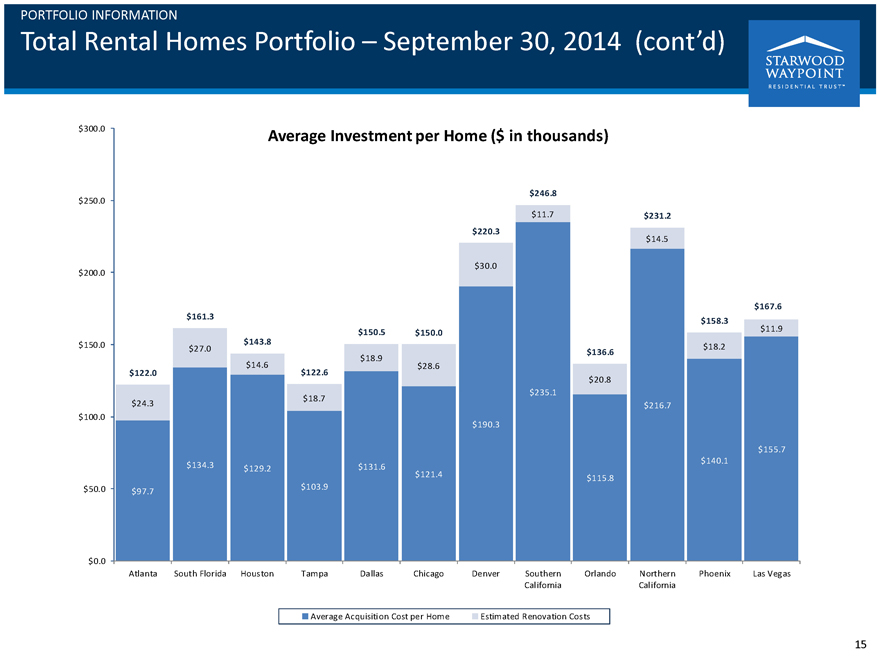
PORTFOLIO INFORMATION
Total Rental Homes Portfolio – September 30, 2014 (cont’d)
STARWOOD
WAYPOINT RESIDENTIAL TRUST ™
$300.0
Average Investment per Home ($ in thousands)
$250.0
$200.0
$150.0
$100.0
$50.0
$0.0
$122.0
$24.3
$97.7
Atlanta
$161.3
$27.0
$134.3
South Florida
$143.8
$14.6
$129.2
Houston
$122.6
$18.7
$103.9
Tampa
$150.5
$18.9
$131.6
Dallas
$150.0
$28.6
$121.4
Chicago
$220.3
$30.0
$190.3
Denver
$246.8
$11.7
$235.1
Southern California
$136.6
$20.8
$115.8
Orlando
$231.2
$14.5
$216.7
Northern California
$158.3
$18.2
$140.1
Phoenix
$167.6
$11.9
$155.7
Las Vegas
Average Acquisition Cost per Home Estimated Renovation Costs
15
PORTFOLIO INFORMATION
Leasing Statistics – September 30, 2014
STARWOOD WAYPOINT RESIDENTIAL
TRUST ™
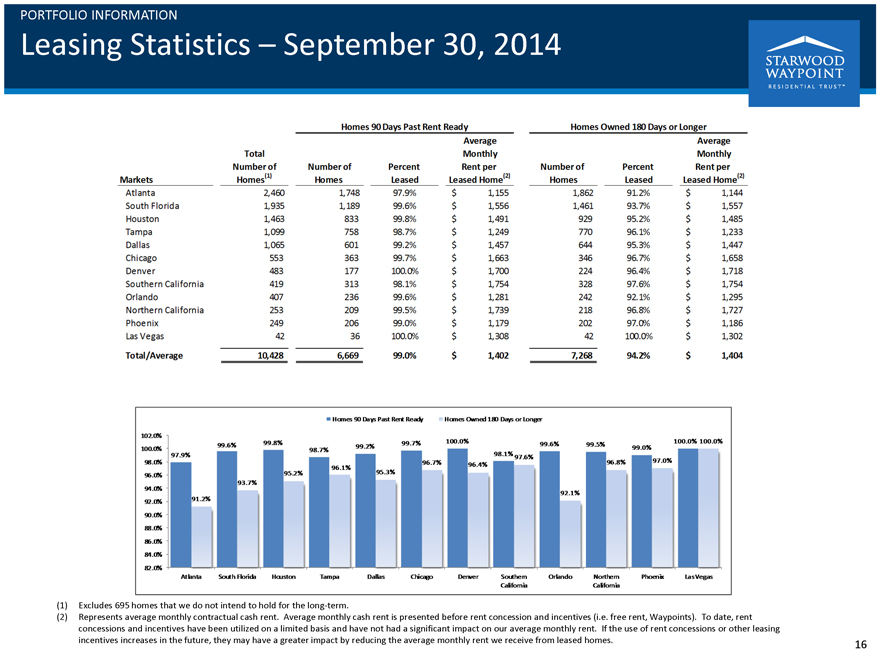
Homes 90 Days Past Rent Ready Homes Owned 180 Days or Longer
Markets
Atlanta
South Florida
Houston
Tampa
Dallas
Chicago
Denver
Southern California
Orlando
Northern California
Phoenix
Las Vegas
Total/Average
Total Number of Homes(1)
2,460 1,935 1,463 1,099 1,065 553 483 419 407 253 249 42 10,428
Number of Homes
1,748 1,189 833 758 601 363 177 313 236 209 206 36 6,669
Percent Leased
97.9% 99.6% 99.8% 98.7% 99.2% 99.7% 100.0% 98.1% 99.6% 99.5%
99.0% 100.0% 99.0%
Average Monthly Rent per Leased Home(2)
$1,155 $1,556
$1,491 $1,249 $1,457 $1,663 $1,700 $1,754 $1,281 $1,739 $1,179 $1,308 $1,402
Number of Homes
1,862 1,461 929 770 644 346 224 328 242 218 202 42 7,268
Percent Leased
91.2% 93.7% 95.2% 96.1% 95.3% 96.7% 96.4% 97.6% 92.1% 96.8% 97.0% 100.0% 94.2%
Average Monthly
Rent per Leased Home(2)
$1,144 $1,557 $1,485 $1,233 $1,447 $1,658 $1,718 $1,754 $1,295 $1,727 $1,186 $1,302 $1,404
Homes 90 Days Past Rent Ready Homes Owned 180 Days or longer
102.0%
100.0%
98.0%
96.0%
94.0%
92.0%
90.0%
88.0%
86.0%
84.0%
82.0%
97.9% 91.2% 99.6% 93.7% 99.8% 95.2% 98.7% 96.1% 99.2% 95.3% 99.7% 96.7% 100.0% 96.4% 98.1% 97.6% 99.6% 92.1% 99.5% 96.8% 99.0% 97.0% 100.0% 100.0%
Atlanta South Florida Houston Tampa Dallas Chicago Denver Southern California Orlando Northern California Phoenix Las Vegas
(1) Excludes 695 homes that we do not intend to hold for the long-term.
(2) Represents average
monthly contractual cash rent. Average monthly cash rent is presented before rent concession and incentives (i.e. free rent, Waypoints). To date, rent concessions and incentives have been utilized on a limited basis and have not had a significant
impact on our average monthly rent. If the use of rent concessions or other leasing incentives increases in the future, they may have a greater impact by
reducing the average monthly rent we receive from leased homes.
16
PORTFOLIO INFORMATION
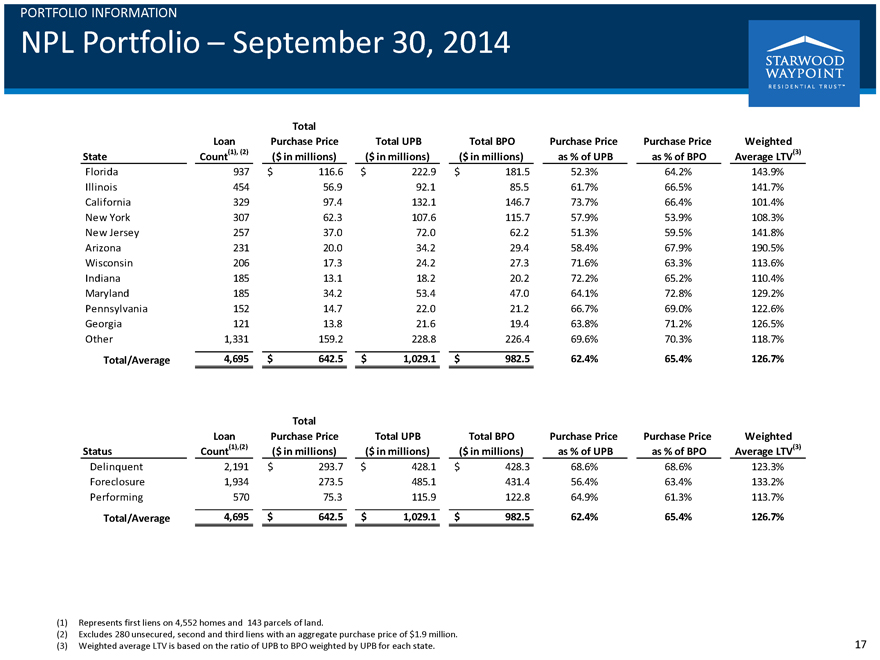
NPL
Portfolio – September 30, 2014
STARWOOD WAYPOINT RESIDENTIAL TRUST ™
State
Loan Count(1), (2)
Total Purchase Price ($ in millions)
Total UPB ($ in millions)
Total BPO ($ in millions)
Purchase Price as % of UPB
Purchase Price as % of BPO
Weighted Average LTV(3)
Florida 937 $ 116.6 $ 222.9 $ 181.5 52.3% 64.2% 143.9%
Illinois 454 56.9 92.1 85.5 61.7% 66.5%
141.7%
California 329 97.4 132.1 146.7 73.7% 66.4% 101.4%
New York 307 62.3
107.6 115.7 57.9% 53.9% 108.3%
New Jersey 257 37.0 72.0 62.2 51.3% 59.5% 141.8%
Arizona 231 20.0 34.2 29.4 58.4% 67.9% 190.5%
Wisconsin 206 17.3 24.2 27.3
71.6% 63.3% 113.6%
Indiana 185 13.1 18.2 20.2 72.2% 65.2% 110.4%
Maryland 185
34.2 53.4 47.0 64.1% 72.8% 129.2%
Pennsylvania 152 14.7 22.0 21.2 66.7% 69.0% 122.6%
Georgia 121 13.8 21.6 19.4 63.8% 71.2% 126.5%
Other 1,331 159.2 228.8 226.4 69.6% 70.3% 118.7%
Total/Average 4,695 $ 642.5 $ 1,029.1 $ 982.5 62.4% 65.4% 126.7%
Status
Loan Count(1),(2)
Total Purchase Price ($ in millions)
Total UPB ($ in millions)
Total BPO ($ in millions)
Purchase Price as % of UPB
Purchase Price as % of BPO
Weighted Average LTV(3)
Delinquent 2,191 $ 293.7 $ 428.1 $ 428.3 68.6% 68.6% 123.3%
Foreclosure 1,934 273.5 485.1 431.4 56.4% 63.4% 133.2%
Performing 570 75.3
115.9 122.8 64.9% 61.3% 113.7%
Total/Average 4,695 $ 642.5 $ 1,029.1 $ 982.5 62.4% 65.4% 126.7%
(1) Represents first liens on 4,552 homes and 143 parcels of land.
(2) Excludes 280 unsecured,
second and third liens with an aggregate purchase price of $1.9 million.
(3) Weighted average LTV is based on the ratio of UPB to BPO weighted by UPB for each
state.
17
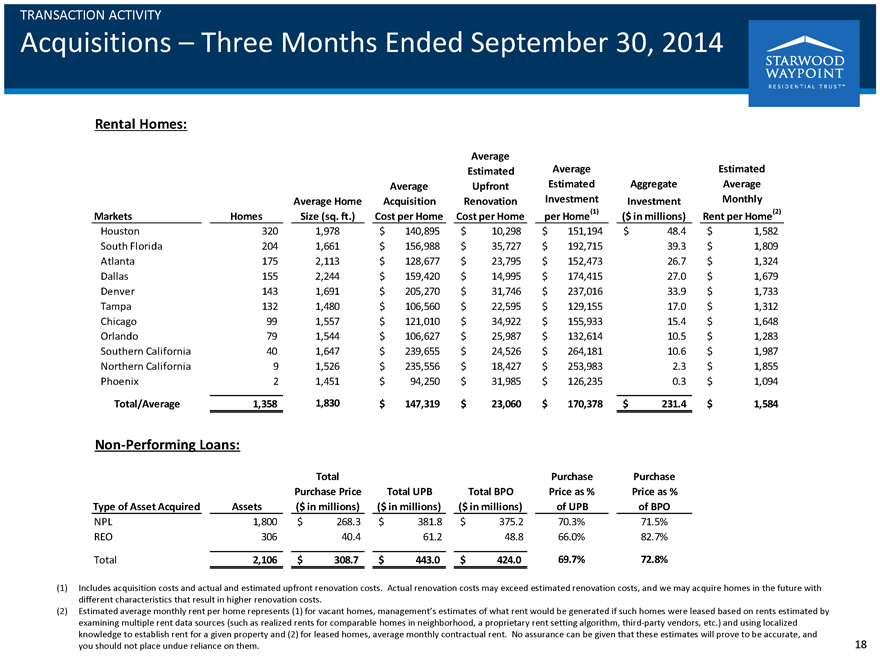
TRANSACTION ACTIVITY
Acquisitions – Three Months Ended September 30, 2014
STARWOOD WAYPOINT
RESIDENTIAL TRUST ™
Rental Homes:
Markets
Homes
Average Home Size (sq. ft.)
Average Acquisition Cost per Home
Average Estimated Upfront Renovation Cost per Home
Average Estimated Investment per Home(1)
Aggregate Investment ($ in millions)
Estimated Average Monthly Rent per Home(2)
Houston 320 1,978 $ 140,895 $
10,298 $ 151,194 $ 48.4 $ 1,582
South Florida 204 1,661 $ 156,988 $ 35,727 $ 192,715 39.3 $ 1,809
Atlanta 175 2,113 $ 128,677 $ 23,795 $ 152,473 26.7 $ 1,324
Dallas 155 2,244 $ 159,420 $
14,995 $ 174,415 27.0 $ 1,679
Denver 143 1,691 $ 205,270 $ 31,746 $ 237,016 33.9 $ 1,733
Tampa 132 1,480 $ 106,560 $ 22,595 $ 129,155 17.0 $ 1,312
Chicago 99 1,557 $ 121,010 $ 34,922
$ 155,933 15.4 $ 1,648
Orlando 79 1,544 $ 106,627 $ 25,987 $ 132,614 10.5 $ 1,283
Southern California 40 1,647 $ 239,655 $ 24,526 $ 264,181 10.6 $ 1,987
Northern California 9
1,526 $ 235,556 $ 18,427 $ 253,983 2.3 $ 1,855
Phoenix 2 1,451 $ 94,250 $ 31,985 $ 126,235 0.3 $ 1,094
Total/Average 1,358 1,830 $ 147,319 $ 23,060 $ 170,378 $ 231.4 $ 1,584
Non-Performing Loans:
Type of Asset Acquired
Assets
Total Purchase Price ($ in millions)
Total UPB ($ in millions)
Total BPO ($ in millions)
Purchase Price as % of UPB
Purchase
Price as % of BPO
NPL 1,800 $ 268.3 $ 381.8 $ 375.2 70.3% 71.5%
REO 306 40.4 61.2 48.8 66.0% 82.7%
Total 2,106 $ 308.7 $ 443.0 $ 424.0 69.7% 72.8%
(1) Includes acquisition costs and actual and
estimated upfront renovation costs. Actual renovation costs may exceed estimated renovation costs, and we may acquire homes in the future with different characteristics that result in higher renovation costs.
(2) Estimated average monthly rent per home represents (1) for vacant homes, management’s estimates of what rent would be generated if such homes were leased based on rents
estimated by examining multiple rent data sources (such as realized rents for comparable homes in neighborhood, a proprietary rent setting algorithm, third-party vendors, etc.) and using localized
knowledge to establish rent for a given property and (2) for leased homes, average monthly contractual rent. No assurance can be given that these estimates will prove to be
accurate, and
you should not place undue reliance on them.
18
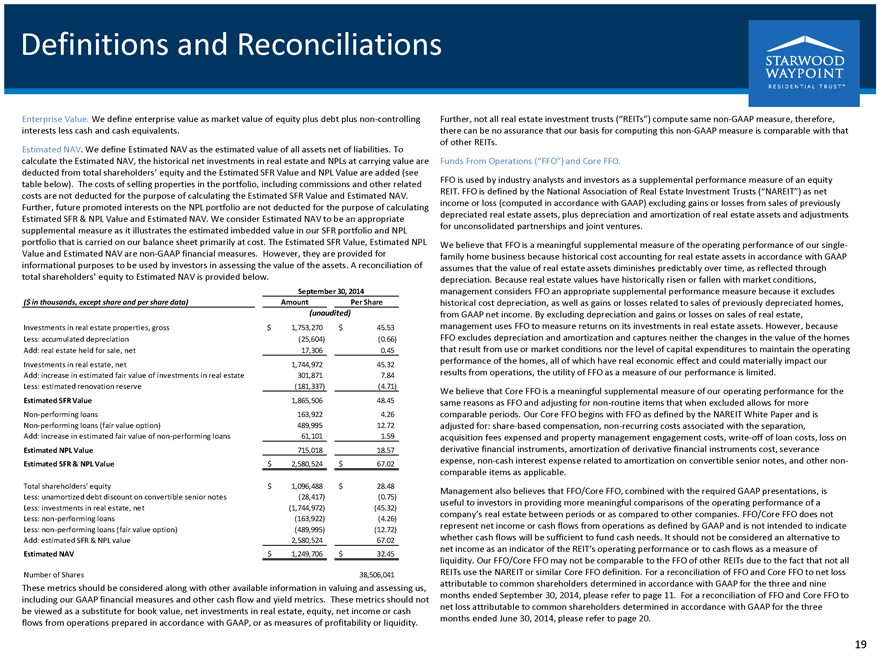
Definitions and Reconciliations
STARWOOD WAYPOINT RESIDENTIAL TRUST ™
Enterprise Value. We define enterprise value as
market value of equity plus debt plus non-controlling interests less cash and cash equivalents.
Estimated NAV. We define Estimated NAV as the estimated value of
all assets net of liabilities. To calculate the Estimated NAV, the historical net investments in real estate and NPLs at carrying value are deducted from total shareholders’ equity and the Estimated SFR Value and NPL Value are added (see table
below). The costs of selling properties in the portfolio, including commissions and other related costs are not deducted for the purpose of calculating the Estimated SFR Value and Estimated NAV. Further, future promoted interests on the NPL
portfolio are not deducted for the purpose of calculating Estimated SFR & NPL Value and Estimated NAV. We consider Estimated NAV to be an appropriate supplemental measure as it illustrates the estimated imbedded value in our SFR portfolio and
NPL portfolio that is carried on our balance sheet primarily at cost. The Estimated SFR Value, Estimated NPL Value and Estimated NAV are non-GAAP financial measures. However, they are provided for informational purposes to be used by investors in
assessing the value of the assets. A reconciliation of total shareholders’ equity to Estimated NAV is provided below.
September 30, 2014
($ in thousands, except share and per share data) Amount Per Share
(unaudited)
Investments in real estate properties, gross $ 1,753,270 $ 45.53
Less: accumulated
depreciation (25,604) (0.66)
Add: real estate held for sale, net 17,306 0.45
Investments in real estate, net 1,744,972 45.32
Add: increase in estimated
fair value of investments in real estate 301,871 7.84
Less: estimated renovation reserve (181,337) (4.71)
Estimated SFR Value 1,865,506 48.45
Non-performing loans 163,922 4.26
Non-performing loans (fair value option) 489,995 12.72
Add: increase in estimated fair value
of non-performing loans 61,101 1.59
Estimated NPL Value 715,018 18.57
Estimated SFR & NPL Value $ 2,580,524 $ 67.02
Total shareholders’
equity $ 1,096,488 $ 28.48
Less: unamortized debt discount on convertible senior notes (28,417) (0.75)
Less: investments in real estate, net (1,744,972) (45.32)
Less: non-performing loans (163,922)
(4.26)
Less: non-performing loans (fair value option) (489,995) (12.72)
Add:
estimated SFR & NPL value 2,580,524 67.02
Estimated NAV $ 1,249,706 $ 32.45
Number of Shares 38,506,041
These metrics should be considered along with
other available information in valuing and assessing us, including our GAAP financial measures and other cash flow and yield metrics. These metrics should not be viewed as a substitute for book value, net investments in real estate, equity, net
income or cash flows from operations prepared in accordance with GAAP, or as measures of profitability or liquidity.
Further, not all real estate investment trusts
(“REITs”) compute same non-GAAP measure, therefore, there can be no assurance that our basis for computing this non-GAAP measure is comparable with that of other REITs.
Funds From Operations (“FFO”) and Core FFO.
FFO is used by industry analysts and
investors as a supplemental performance measure of an equity REIT. FFO is defined by the National Association of Real Estate Investment Trusts (“NAREIT”) as net income or loss (computed in accordance with GAAP) excluding gains or losses
from sales of previously depreciated real estate assets, plus depreciation and amortization of real estate assets and adjustments for unconsolidated partnerships and joint ventures.
We believe that FFO is a meaningful supplemental measure of the operating performance of our single-family home business because historical cost accounting for real estate assets
in accordance with GAAP assumes that the value of real estate assets diminishes predictably over time, as reflected through depreciation. Because real estate values have historically risen or fallen with market conditions, management considers FFO
an appropriate supplemental performance measure because it excludes historical cost depreciation, as well as gains or losses related to sales of previously depreciated homes, from GAAP net income. By excluding depreciation and gains or losses on
sales of real estate, management uses FFO to measure returns on its investments in real estate assets. However, because FFO excludes depreciation and amortization and captures neither the changes in the value of the homes that result from use or
market conditions nor the level of capital expenditures to maintain the operating performance of the homes, all of which have real economic effect and could materially impact our results from operations, the utility of FFO as a measure of our
performance is limited.
We believe that Core FFO is a meaningful supplemental measure of our operating performance for the same reasons as FFO and adjusting for
non-routine items that when excluded allows for more comparable periods. Our Core FFO begins with FFO as defined by the NAREIT White Paper and is adjusted for: share-based compensation, non-recurring costs associated with the separation, acquisition
fees expensed and property management engagement costs, write-off of loan costs, loss on derivative financial instruments, amortization of derivative financial instruments cost, severance expense, non-cash interest expense related to amortization on
convertible senior notes, and other non-comparable items as applicable.
Management also believes that FFO/Core FFO, combined with the required GAAP presentations,
is useful to investors in providing more meaningful comparisons of the operating performance of a company’s real estate between periods or as compared to other companies. FFO/Core FFO does not represent net income or cash flows from operations
as defined by GAAP and is not intended to indicate whether cash flows will be sufficient to fund cash needs. It should not be considered an alternative to net income as an indicator of the REIT’s operating performance or to cash flows as a
measure of liquidity. Our FFO/Core FFO may not be comparable to the FFO of other REITs due to the fact that not all REITs use the NAREIT or similar Core FFO definition. For a reconciliation of FFO and Core FFO to net loss attributable to common
shareholders determined in accordance with GAAP for the three and nine months ended September 30, 2014, please refer to page 11. For a reconciliation of FFO and Core FFO to net loss attributable to common shareholders determined in accordance with
GAAP for the three months ended June 30, 2014, please refer to page 20.
19
Definitions and Reconciliations (cont’d)
STARWOOD WAYPOINT RESIDENTIAL TRUST ™
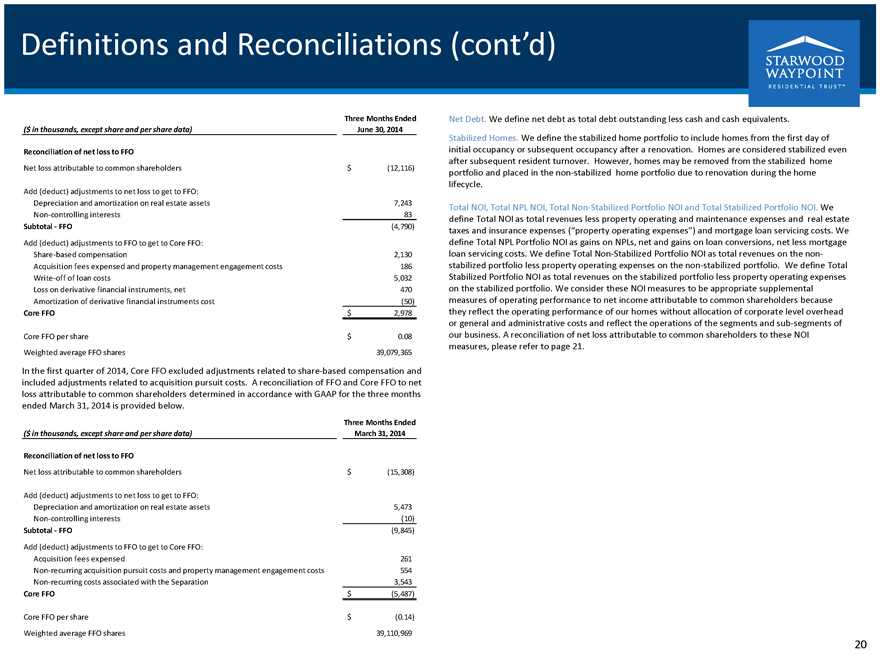
Three Months Ended June 30, 2014
($ in thousands, except share and per share data)
Reconciliation of net loss to FFO
Net loss attributable to common shareholders $ (12,116)
Add (deduct)
adjustments to net loss to get to FFO:
Depreciation and amortization on real estate assets 7,243
Non-controlling interests 83
Subtotal - FFO (4,790)
Add (deduct) adjustments to FFO to get to Core FFO:
Share-based compensation 2,130
Acquisition fees expensed and property management engagement costs 186
Write-off of loan costs
5,032
Loss on derivative financial instruments, net 470
Amortization of
derivative financial instruments cost (50)
Core FFO $ 2,978
Core FFO per
share $ 0.08
Weighted average FFO shares 39,079,365
In the first quarter of
2014, Core FFO excluded adjustments related to share-based compensation and included adjustments related to acquisition pursuit costs. A reconciliation of FFO and Core FFO to net loss attributable to common shareholders determined in accordance with
GAAP for the three months ended March 31, 2014 is provided below.
Three Months Ended March 31, 2014
($ in thousands, except share and per share data)
Reconciliation of net loss to FFO
Net loss attributable to common shareholders $ (15,308)
Add (deduct)
adjustments to net loss to get to FFO:
Depreciation and amortization on real estate assets 5,473
Non-controlling interests (10)
Subtotal - FFO (9,845)
Add (deduct) adjustments to FFO to get to Core FFO:
Acquisition fees expensed 261
Non-recurring acquisition pursuit costs and property management engagement costs 554
Non-recurring costs associated with the Separation 3,543
Core FFO $ (5,487)
Core FFO per share $ (0.14)
Weighted average FFO shares 39,110,969
Net Debt. We define net debt as total debt outstanding less cash and cash equivalents.
Stabilized Homes. We define the stabilized home portfolio to include homes from the first day of initial occupancy or subsequent occupancy after a renovation. Homes are considered
stabilized even after subsequent resident turnover. However, homes may be removed from the stabilized home portfolio and placed in the non-stabilized home portfolio due to renovation during the home lifecycle.
Total NOI, Total NPL NOI, Total Non-Stabilized Portfolio NOI and Total Stabilized Portfolio NOI. We define Total NOI as total revenues less property operating and maintenance
expenses and real estate taxes and insurance expenses (“property operating expenses”) and mortgage loan servicing costs. We define Total NPL Portfolio NOI as gains on NPLs, net and gains on loan conversions, net less mortgage loan
servicing costs. We define Total Non-Stabilized Portfolio NOI as total revenues on the non-stabilized portfolio less property operating expenses on the non-stabilized portfolio. We define Total Stabilized Portfolio NOI as total revenues on the
stabilized portfolio less property operating expenses on the stabilized portfolio. We consider these NOI measures to be appropriate supplemental measures of operating performance to net income attributable to common shareholders because they reflect
the operating performance of our homes without allocation of corporate level overhead or general and administrative costs and reflect the operations of the segments and sub-segments of our business. A reconciliation of net loss attributable to
common shareholders to these NOI measures, please refer to page 21.
20
Definitions and Reconciliations (cont’d)
STARWOOD WAYPOINT RESIDENTIAL TRUST ™
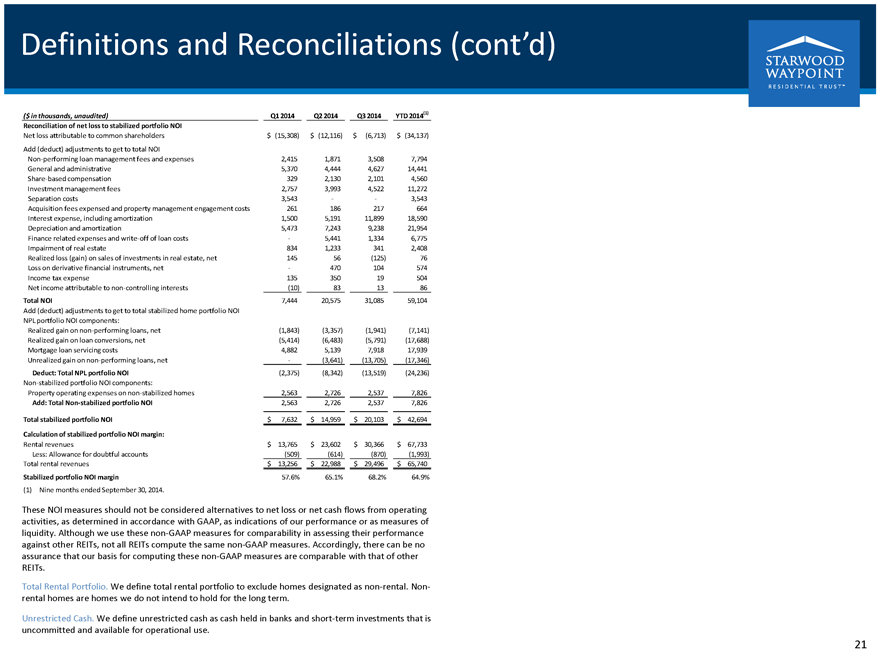
($ in thousands, unaudited) Q1 2014 Q2 2014 Q3 2014
YTD 2014(1)
Reconciliation of net loss to stabilized portfolio NOI
Net loss
attributable to common shareholders $ (15,308) $ (12,116) $ (6,713) $ (34,137)
Add (deduct) adjustments to get to total NOI
Non-performing loan management fees and expenses 2,415 1,871 3,508 7,794
General and
administrative 5,370 4,444 4,627 14,441
Share-based compensation 329 2,130 2,101 4,560
Investment management fees 2,757 3,993 4,522 11,272
Separation costs 3,543 - - 3,543
Acquisition fees expensed and property management engagement costs 261 186 217 664
Interest expense, including amortization 1,500 5,191 11,899 18,590
Depreciation and
amortization 5,473 7,243 9,238 21,954
Finance related expenses and write-off of loan costs - 5,441 1,334 6,775
Impairment of real estate 834 1,233 341 2,408
Realized loss (gain) on sales of investments in
real estate, net 145 56 (125) 76
Loss on derivative financial instruments, net - 470 104 574
Income tax expense 135 350 19 504
Net income attributable to non-controlling interests (10) 83
13 86
Total NOI 7,444 20,575 31,085 59,104
Add (deduct) adjustments to get to
total stabilized home portfolio NOI
NPL portfolio NOI components:
Realized
gain on non-performing loans, net (1,843) (3,357) (1,941) (7,141)
Realized gain on loan conversions, net (5,414) (6,483) (5,791) (17,688)
Mortgage loan servicing costs 4,882 5,139 7,918 17,939
Unrealized gain on non-performing
loans, net - (3,641) (13,705) (17,346)
Deduct: Total NPL portfolio NOI (2,375) (8,342) (13,519) (24,236)
Non-stabilized portfolio NOI components:
Property operating expenses on non-stabilized homes
2,563 2,726 2,537 7,826
Add: Total Non-stabilized portfolio NOI 2,563 2,726 2,537 7,826
Total stabilized portfolio NOI $ 7,632 $ 14,959 $ 20,103 $ 42,694
Calculation of stabilized
portfolio NOI margin:
Rental revenues $ 13,765 $ 23,602 $ 30,366 $ 67,733
Less: Allowance for doubtful accounts (509) (614) (870) (1,993)
Total rental
revenues $ 13,256 $ 22,988 $ 29,496 $ 65,740
Stabilized portfolio NOI margin 57.6% 65.1% 68.2% 64.9%
(1) Nine months ended September 30, 2014.
These NOI measures should not be considered
alternatives to net loss or net cash flows from operating activities, as determined in accordance with GAAP, as indications of our performance or as measures of liquidity. Although we use these non-GAAP measures for comparability in assessing their
performance against other REITs, not all REITs compute the same non-GAAP measures. Accordingly, there can be no assurance that our basis for computing these non-GAAP measures are comparable with that of other REITs.
Total Rental Portfolio. We define total rental portfolio to exclude homes designated as non-rental. Non-rental homes are homes we do not intend to hold for the long term.
Unrestricted Cash. We define unrestricted cash as cash held in banks and short-term investments that is uncommitted and available for operational use.
21
Forward-Looking Statements
STARWOOD WAYPOINT RESIDENTIAL TRUST ™
The statements herein that are not
historical facts are forward-looking statements within the meaning of Section 27A of the Securities Act of 1933, as amended, and Section 21E of the Securities Exchange Act of 1934, as amended. These forward-looking statements involve significant
risks and uncertainties, which are difficult to predict, and are not guarantees of future performance. Such statements can generally be identified by words such as “anticipates,” “expects,” “intends,” “will,”
“could,” “believes,” “estimates,” “continue,” and similar expressions. Forward-looking statements are based on certain assumptions, discuss future expectations, describe future plans and strategies, contain
financial and operating projections or state other forward-looking information. Our ability to predict results or the actual effect of future events, actions, plans or strategies is inherently uncertain. Although we believe that the expectations
reflected in such forward-looking statements are based on reasonable assumptions, our actual results and performance could differ materially from those set forth in, or implied by, the forward-looking statements. Factors that could materially and
adversely affect our business, financial condition, liquidity, results of operations and prospects, as well as our ability to make distributions to our shareholders, include, but are not limited to: expectations regarding the timing of generating
revenues; changes in our business and growth strategies; volatility in the real estate industry, interest rates and spreads, the debt or equity markets, the economy generally or the rental home market specifically; events or circumstances that
undermine confidence in the financial markets or otherwise have a broad impact on financial markets; declines in the value of homes, and macroeconomic shifts in demand for, and competition in the supply of, rental homes; the availability of
attractive investment opportunities in homes that satisfy our investment objective and business and growth strategies; the impact of changes to the supply of, value of and the returns on distressed and non-performing residential mortgage loans; our
ability to convert the homes and distressed and non-performing residential mortgage loans we acquire into rental homes generating attractive returns; our ability to successfully modify or otherwise resolve distressed and non-performing residential
mortgage loans; our ability to lease or re-lease our rental homes to qualified residents on attractive terms or at all; the failure of residents to pay rent when due or otherwise perform their lease obligations; our ability to manage our portfolio
of rental homes; the concentration of credit risks to which we are exposed; the availability, terms and deployment of short-term and long-term capital; the adequacy of our cash reserves and working capital; our relationships with Starwood Capital
Group and our manager and their ability to retain qualified personnel; potential conflicts of interest; unanticipated increases in financing and other costs; our expected leverage; changes in governmental regulations, tax laws and rates and similar
matters; limitations imposed on our business and our ability to satisfy complex rules in order for us to qualify as a REIT for U.S. federal income tax purposes; and estimates relating to our ability to make distributions to our shareholders in the
future. You should not place undue reliance on any forward-looking statement and should consider all of the uncertainties and risks described above, as well as those more fully discussed in reports and other documents filed by us with the Securities
and Exchange Commission from time to time. Furthermore, except as required by law, we are under no duty to, and we do not intend to, update any of our forward-looking statements appearing herein, whether as a result of new information, future events
or otherwise.