Attached files
| file | filename |
|---|---|
| 8-K - SYNERGETICS USA, INC 8-K 11-12-2014 - SYNERGETICS USA INC | form8k.htm |
Exhibit 99.1

Investor Presentation November 2014

Certain statements made in this presentation are forward-looking within the meaning of the Private Securities Litigation Reform Act of 1995. This presentation may include statements concerning management’s expectations of future financial results, potential business, potential acquisitions, government agency approvals, additional indications and therapeutic applications for medical devices, as well as their outcomes, clinical efficacy and potential markets and similar statements, all of which are forward looking. Forward-looking statements involve risks and uncertainties that could cause actual results to differ materially from predicted results. For a discussion of such risks and uncertainties, please refer to the information set forth under “Risk Factors” included in Synergetics USA, Inc.’s Annual Report on Form 10-K for the year ended July 31, 2014, and information contained in subsequent filings with the Securities and Exchange Commission. These forward looking statements are made based upon our current expectations and we undertake no duty to update information provided in this presentation. Safe Harbor Statement 2

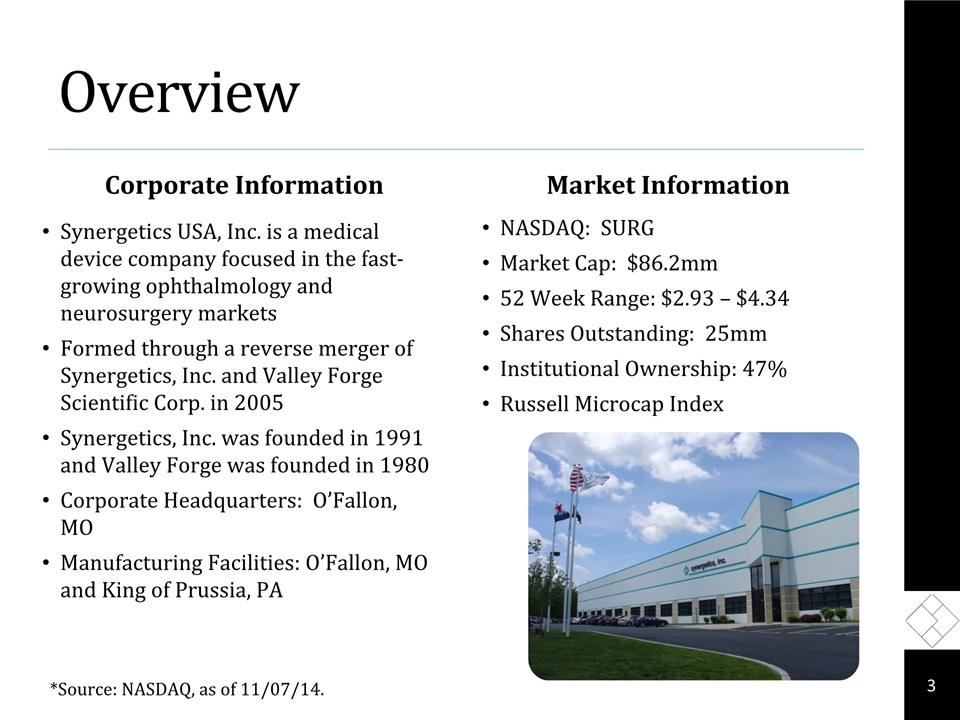
Overview Corporate Information Market Information NASDAQ: SURGMarket Cap: $86.2mm52 Week Range: $2.93 – $4.34Shares Outstanding: 25mmInstitutional Ownership: 47%Russell Microcap Index 3 Synergetics USA, Inc. is a medical device company focused in the fast-growing ophthalmology and neurosurgery marketsFormed through a reverse merger of Synergetics, Inc. and Valley Forge Scientific Corp. in 2005Synergetics, Inc. was founded in 1991 and Valley Forge was founded in 1980Corporate Headquarters: O’Fallon, MOManufacturing Facilities: O’Fallon, MO and King of Prussia, PA *Source: NASDAQ, as of 11/07/14.

Track Record of Growth 4 *Fiscal Year 2013 gross and operating margins are displayed on a non-GAAP basis to exclude inventory write-down. See Non-GAAP reconciliation table at the end of this presentation for additional details.

FY 2014 Revenue Mix Ophthalmic sales represent our largest and highest margin businessIn the U.S., we sell ophthalmic surgical products directly to end-users at hospitals, ambulatory surgery centers and surgeon offices throughout the country Internationally, we sell and distribute ophthalmic surgical products in over 50 countries, including four emerging marketsMarketing partner and key OEM relationships with J&J’s Codman division and Stryker for neurosurgery products 5

Overall Strategy Drive accelerating growth in our Ophthalmology business with the launch of new products, foremost of which is VersaVIT 2.0™Deliver improved profitability through enterprise-wide continuous improvement initiativesManage neurosurgery OEM and businesses for stable growth and strong cash flowsDemonstrate consistent, solid financial performanceContinued growth through strategic acquisitions 6

Recent Developments Continued progress on VersaVIT™ commercialization including the launch of the next generation system, the VersaVIT 2.0™, in the second half of June Challenging competitive environment has pressured revenue growth in base ophthalmic business in recent quartersBase business should benefit from launch of next generation Directional™ II Laser Probe in May 2014OEM partnerships remain strong – sales increased 8.3% year-over-year during fiscal 2014. Internal focus on improving operational excellence and enterprise-wide continuous improvement initiativesKing of Prussia plant closureAnnounced cooperative agreement with Cleveland Clinic to develop next generation intraoperative devices 7

Ophthalmic Surgical Market 8

Ophthalmic Surgical Market 9 *Source: Synergetics USA annual report on Form 10-K for period ended July 31, 2012.

2011 Global Retinal Surgery Device Market 10 *Source: Synergetics USA quarterly report on Form 10-Q for period ended April 30, 2013. Market Size = $935 million*Synergetics products compete in ~22% of the retinal device market (shaded in black)

2014 Global Retinal Surgery Device Market 11 Estimated Market Size = $1.22 Billion*Implied Annual Growth = ~7%Synergetics products compete in ~69% of the retinal device market (shaded in black) *Source: Synergetics USA quarterly report on Form 10-Q for period ended April 30, 2013. Market Scope data estimates that the vitreoretinal market will grow approximately 7 percent to $1.2 billion in 2014, as compared to 2013.

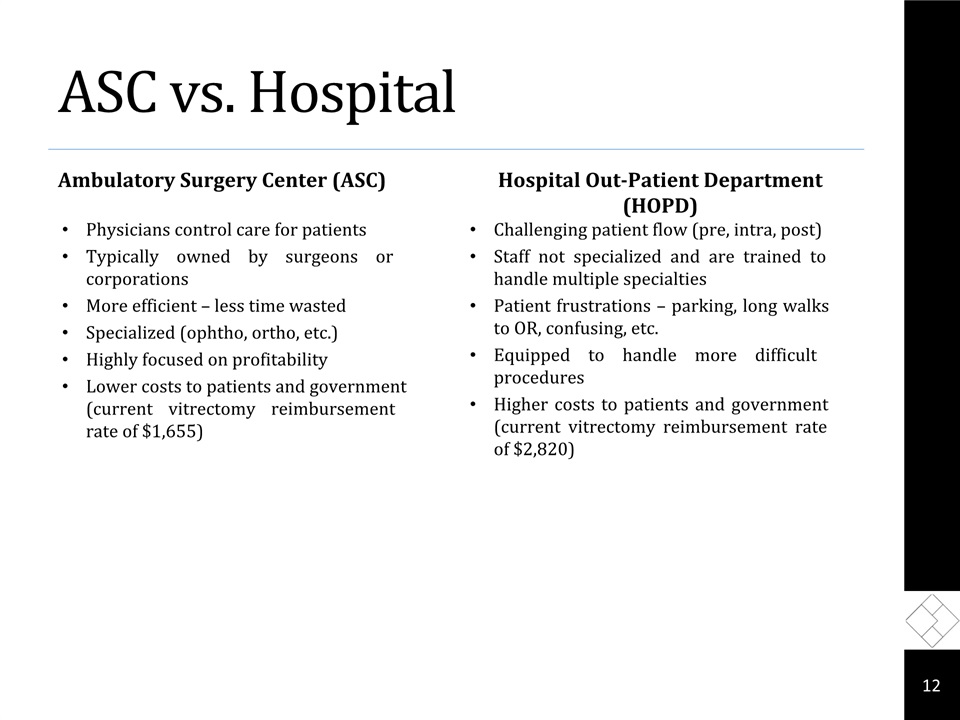
ASC vs. Hospital Ambulatory Surgery Center (ASC) Physicians control care for patientsTypically owned by surgeons or corporationsMore efficient – less time wastedSpecialized (ophtho, ortho, etc.)Highly focused on profitabilityLower costs to patients and government (current vitrectomy reimbursement rate of $1,655) Hospital Out-Patient Department (HOPD) Challenging patient flow (pre, intra, post)Staff not specialized and are trained to handle multiple specialtiesPatient frustrations – parking, long walks to OR, confusing, etc.Equipped to handle more difficult proceduresHigher costs to patients and government (current vitrectomy reimbursement rate of $2,820) 12

Ophthalmic Products Core VersaPACK™ VersaVIT 2.0™ Directional Laser Probes DDMS-Diamond Dusted Membrane Scraper Endoilluminator Awh Chandelier Photon II New 13 Directional Laser Probe

VersaVIT 2.0™: Next Generation Vitrectomy System VersaVIT 2.0™ is our second product for the lucrative vitrectomy machine market valued at $235 million (machines only)A new concept in retinal surgery Highly portableModerately priced Easy to useComparable clinical performanceCompact, lightweight and portableSmall footprint< 25 pounds Capable of running on battery power and gas cartridgesIdeally suited for ASCs, as a traveling unit for satellite offices and potentially for in-office proceduresDemonstrably lower total cost of ownership and operation 14 Performed over 10,000 retinal procedures with VersaVIT™ to date, up more than 20% sequentially in Q4’14, and more than 170% year over year.

VersaVIT 2.0™ vs. the Competition 15 VersaVIT™ vs. ACCURUS® (25lbs vs. 90lbs) CONSTELLATION® Vision System CONSTELLATION® Vision System and ACCURUS® are registered trademarks of Alcon® Laboratories, a division of Novartis

VersaVIT 2.0™: Strategic Growth Plan & Progress Update Introduced on June 4, 2014Commercial launch in the second half of June targeting two primary segments: high volume ASC facilities that perform the majority of vitrectomy proceduresselect teaching institutions U.S. Market: 22 direct sales reps; International markets: hybrid distribution of direct and dealers Anticipate progress towards broader market adoption of our next generation vitrectomy technology in fiscal 2015 16

VersaPACK™: Compelling Value Proposition VersaPACK™ is our first product for the $348 million vitrectomy pack marketCompelling value proposition to retinal surgeonsCompetitively priced vs. other packsCompatible with existing competitive vitrectomy machines Enables continued use of 1st generation machines, avoiding large capital expenditureEstimated 324,000 vitrectomies performed yearly (U.S.)46 VersaVIT™ customers placed orders for our VersaVIT™ packs in Q4‘14 17

Ophthalmology Product Video 18

Neurosurgery Market 19

Neurosurgery Overview Best-in-class neurosurgical technologiesUltrasonic aspirators Disposable tips and tubingElectrosurgical generators Disposable bipolar forceps Strong OEM partnershipsJ&J’s Codman division distributes our electrosurgical generators and bipolar forcepsStryker distributes our ultrasonic aspirator disposablesMulti-year OEM contracts with Codman and Stryker provide stable annual growth, attractive operating margins and high barriers to entry 20

OEM (Neurosurgery) Products 21 Codman Stryker Lesion Generator SONOPET OMNI Ultrasonic Aspirator Disposable Tips Codman Synergy Disposable Bipolar Forceps CMC V

Neurosurgery Product Video 22

Financials 23

Financial Comparison – Quarterly Fiscal Year Ends July 31(in thousands, except per share data) Q4 FY 13 Q4 FY 14 Y/Y Change Sales: Ophthalmic $9,434 $9,512 0.8% OEM (1) 8,154 8,316 2.0% Other (2) 269 180 (33.1%) Total $17,857 $18,008 0.8% Reported Gross Margin 54.2% 55.5% 130 bps Reported Operating Margin 12.4% 12.0% (40 bps) Net Income $1,439 $1,410 (2.0%) Reported EPS $0.06 $0.06 0.0% Cash $12,470 $15,443 23.8% Debt $0 $0 -- 24 Revenues from OEM represent sales and royalties to Codman, Stryker and other.Revenues from Other represent direct neurosurgery revenues and other miscellaneous revenues.

Financial Comparison – Annual Fiscal Year Ends July 31(in thousands) FY 2013 Y/Y Change FY 2014 Y/Y Change Sales: Ophthalmic $35,446 0.6% $35,242 (0.6%) OEM (1) 26,469 10.4% 28,671 8.3% Other (2) 881 10.0% 856 (2.8%) Total: $62,796 4.6% $64,769 3.1% Adjusted Gross Margin(3) 54.9% (320 bps) 55.9% 100 bps Adjusted Operating Margin(3) 9.3% (550 bps) 8.1% (120 bps) Adjusted Net Income from Operations(3) $4,011 (35.6%) $3,521 (12.2%) Cash $12,470 (1.7%) $15,443 23.8% Debt $0 -- $0 -- 25 Revenues from OEM represent sales and royalties to Codman, Stryker and other.Revenues from Other represent direct neurosurgery revenues and other miscellaneous revenues. Adjusted Operating Margin for FY 2014 excludes impact of exit costs ($682,000 pre-tax, $458,000 after tax). Adjusted Gross Margin, Adjusted Operating Margin and Adjusted Net Income from Operations for FY 2013 exclude impact of inventory write-downs ($2.1 million pre-tax, $1.5 million after-tax for FY 2013). See Non-GAAP reconciliation slides at the end of this presentation for additional details.

Investment Rationale Key medical device manufacturer supplying ophthalmic and neurosurgery markets with leading technologiesRetinal surgery a compelling segment of ophthalmologyNew product introductions – foremost of which is the VersaVIT 2.0™ vitrectomy machine – drives total Company revenue growth over long termBusiness model fueled by the combination of high margin disposables and innovative capital equipment Long-term profit margin opportunities driven by improving operational efficiency and lean initiatives 26

Management Team David M. Hable – President, CEOOver 30 years of progressive responsibility in sales, marketing, new business development and general management in the medical device industry. Over 20 years with J&J/Codman. Pamela Boone – Executive Vice President, CFOPreviously served as CFO, VP and Corporate Controller for Maverick Tube Corporation. Over 25 years of financial expertise.Michael Fanning – Vice President, SalesOver 20 years in sales and management roles, working in service, medical device and manufacturing sectors.Jason Stroisch – Vice President, Marketing & TechnologyOver 15 years in the medical device industry covering engineering, international sales and marketing management roles.Joan Kraus – Vice President, Regulatory Affairs / Quality AssurancePreviously served as Senior Director Global Compliance for Teleflex Medical. Over 25 years in quality systems and process improvement roles working in medical devices, manufacturing, and distribution sectors. 27

Non-GAAP Reconciliations(1) 28 Fiscal Year Ends July 31(in thousands, except share and per share data) FY 2013 FY 2014 Net Sales $62,796 $64,769 GAAP Gross Profit 32,371 36,229 Non-Operating Adjustments(2) 2,092 -- Adjusted Gross Profit $34,463 $36,229 Adjusted Gross Margin 54.9% 55.9% GAAP Operating Income $3,702 $4,581 Non-Operating Adjustments(2) 2,092 682 Adjusted Operating Margin $5,794 $5,263 Adjusted Operating Income 9.2% 8.1% Effective Tax Rate 30.6% 32.8% Tax Effect from Adjustments $640 $458 Adjusted Net Income from Continuing Operations(2) $4,011 $3,521 Diluted Shares Outstanding(3) 25,337,525 25,393,264 GAAP Diluted Earnings Per Share from Continuing Operations $0.10 $0.12 Adjusted Non-GAAP Diluted EPS $0.16 $0.14 See slide 29 for full description of the use of non-GAAP financial information.Non-operating adjustments include: exit costs ($682,000 pre-tax, $458 after-tax, or $0.02 per diluted shares, for FY 2014) and inventory write-downs ($2.1 million pre-tax, $1.5 million after-tax, or $0.06 per diluted share, for FY 2013).Represents diluted weighted average common shares outstanding.

(1)Use of Non-GAAP Financial Information We measure our performance primarily through our operating profit. In addition to our consolidated financial statements presented in accordance with GAAP, management uses certain non-GAAP measures, including adjusted gross margin, adjusted operating margin and adjusted net income from operations, to measure our operating performance. We provide a definition of the components of these measurements and reconciliation to the most directly comparable GAAP financial measure. These non-GAAP measures are presented to enhance an understanding of our operating results and are not intended to represent cash flow or results of operations. The use of these non-GAAP measures provides an indication of our ability to service debt and measure operating performance. We believe these non-GAAP measures are useful in evaluating our operating performance compared to other companies in our industry, and are beneficial to investors, potential investors and other key stakeholders, including creditors who use this measure in their evaluation of performance. These non-GAAP measures are not in accordance with, or an alternative to, measures prepared in accordance with GAAP and may be different from non-GAAP measures used by other companies. In addition, these non-GAAP measures are not based on any comprehensive set of accounting rules or principles. Non-GAAP measures have limitations in that they do not reflect all of the amounts associated with the Company’s results of operations as determined in accordance with GAAP. These measures should only be used to evaluate our results of operations in conjunction with the corresponding GAAP measures. 29

Investor Presentation November 2014 3845 Corporate Centre DriveO’Fallon, MO 63368(636) 939-5100www.synergeticsusa.com
