Attached files
| file | filename |
|---|---|
| 8-K - 8-K - LOCAL Corp | d820172d8k.htm |
| EX-99.1 - EX-99.1 - LOCAL Corp | d820172dex991.htm |
 Quarterly Earnings Summary
Exhibit 99.2 |
 2
Quarterly earnings summary: Q3 2014
statements. Those risks and uncertainties are detailed in the
company’s filings from time to time with the Securities and
Exchange Commission. The information contained in the
forward looking statements is provided as of the date first set
forth above and the company disclaims any obligation to
update such statements.
This document includes the non-GAAP financial measures of
“Adjusted EBITDA”
and “free cash flow”
.
See page 12 for a
note regarding the Company’s use of Non-GAAP financial
measures and slide 9 and 10 for a reconciliation of GAAP to
non-GAAP.
This Q3-2014 Quarterly Earnings Summary contains forward
looking statements which are made pursuant to the Safe Harbor
provisions of section 21-E of the Securities Exchange Act of
1934. Investors are cautioned that statements which are not
strictly historical statements, including statements concerning
future expected financial performance.
The forward looking statements include, but are not limited to,
any statements containing the words “expect”, “anticipate”,
“estimates”, “believes”, “should”,
“could”, “may”, “possibly”, and similar
expressions and the negatives thereof. These forward looking statements
involve a number of risks and uncertainties that could cause actual results
to differ materially from the forward looking |
 3
Quarterly earnings summary: Q3 2014
Highlights
•
Q3 revenue of $18.1M
•
Q3 Adjusted EBITDA $407K, positive for
the seventh consecutive quarter
•
Q3 O&O revenue up 31 percent
from the prior year period
•
Q3 RKV of $201, compared to $180 in prior
year period
Financials
•
Ended Q3 with $4.3M in total cash
•
Reduced debt by $4.5M
•
Positive free cash flow $2.2M
•
Announced annual cost savings actions of
approximately $2.6M
•
Updated 2014 guidance: Revenue between
$87M and $90M, and Adjusted EBITDA
between $2M and $2.4M
Innovation
•
Expanding reach with the expected
launch of nQuery
TM
solution with a top
five global carrier
•
Launched our advanced traffic quality
solution nTegrity
TM
•
Building and monetizing our Local
audience with proprietary traffic quality
tools
Note: Since we cannot predict the valuation of the warrant liability and the
conversion option liability, we cannot reasonably project our GAAP net income (loss).
We, therefore, cannot provide GAAP guidance, but we do report GAAP results. An
explanation of the Company’s use of Non-GAAP measures is set forth on Slide 12 |
 4
Quarterly earnings summary: Q3 2014
$ in Millions2
Q3-14
Q2-14
Q3-13
GAAP Revenue
$ 18.1
$ 22.5
$ 23.5
Adjusted EBITDA
$ 0.4
$ 1.0
$ 1.3
Net Loss
$ (1.3)
$ (1.3)
$ (1.7)
Diluted Adjusted EBITDA per share
$ 0.02
$ 0.04
$ 0.06
Diluted GAAP net loss per share
$ (0.06)
$ (0.06)
$ (0.08)
Diluted weighted avg shares used for Adj EBITDA per share
23,304
23,306
23,191
Diluted weighted avg shares used for GAAP net loss per share
23,230
23,228
22,962
Cash
$ 4.31
$ 6.68
$ 4.85
Ending Employees
84
87
89
Note: An explanation of the Company’s use of Non-GAAP measures is set forth on Slide
12 |
 5
Quarterly earnings summary: Q3 2014
101.0
100.0
106.2
$276
$230
$215
93.4
$199.5
80.0
$180.3
80.4
$178
$189.3
71.6
$203.8
72.6
Local.com
$201.1
65.5 |
 6
Quarterly earnings summary: Q3 2014
24.5
24%
25.4
31.9
33.7
32.0
31.0
23.1
20.6
16.6
25%
30%
36%
40%
39%
32%
28%
25% |
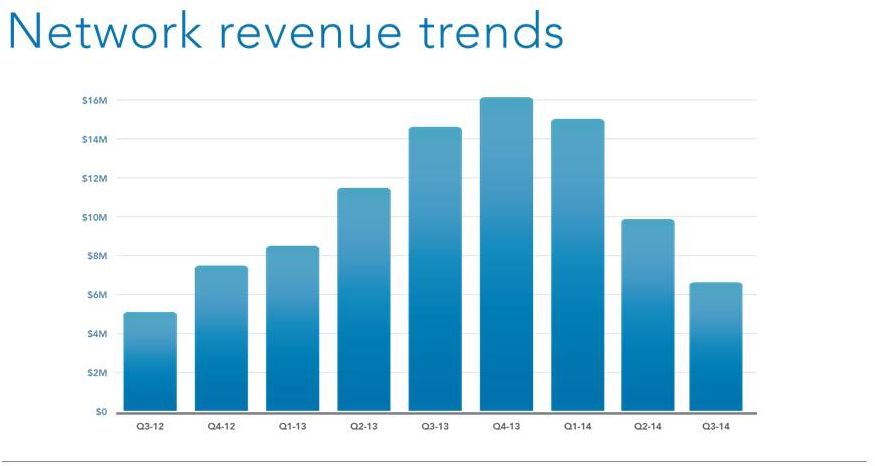 7
Quarterly earnings summary: Q3 2014
8.3
11.6
14.5
16.1
14.8
9.9
6.4
7.6
5.0 |
 8
Quarterly earnings summary: Q3 2014
% of Total Revenue by Business Unit
20%
80%
37%
63%
39%
61%
51%
49%
Quarterly Revenues by Business Unit
$5.0
$19.4
$7.6
$12.9
$8.3
$13.2
$11.6
$11.1
$ in Millions
Q3-12
Q4-12
Q1-13
Q2-13
Q3-13
Q4-13
Q1-14
Q2-14
Q3-14
Network
$ 5.0
$ 7.6
$ 8.3
$ 11.6
$ 14.5
$ 16.1
$ 14.8
$ 9.9
$ 6.4
O&O
$ 19.4
$ 12.9
$ 13.2
$ 11.1
$ 8.9
$ 10.7
$ 11.4
$ 12.6
$ 11.7
Consolidated Revenue
$ 24.4
$ 20.6
$ 21.5
$ 22.7
$ 23.5
$ 26.8
$ 26.2
$ 22.5
$ 18.1
$14.5
$8.9
62%
38%
60%
40%
$16.1
$10.7
$24.4
$20.6
$21.5
$22.7
$23.5
$26.8
$14.8
$11.4
$26.2
56%
44%
$22.5
$9.9
$12.6
44%
56%
$18.1
$6.4
$11.7
36%
64% |
 9
Quarterly earnings summary: Q3 2014
Description
FY-09
FY-10
FY-11
FY-12
FY-13
FY-14*
Adjusted EBITDA
$3,041
$13,775
$3,247
$777
$4,533
$2,200
Less interest and other income (expense), net
(27)
(275)
(413)
(425)
(2,321)
(2,100)
Less provision for income taxes
(158)
(102)
(178)
(111)
(139)
(100)
Less amortization of intangibles
(2,524)
(5,734)
(4,864)
(3,611)
(912)
(700)
Less depreciation
(734)
(1,418)
(3,182)
(3,658)
(3,896)
(4,000)
Less stock-based compensation
(2,364)
(2,911)
(3,442)
(2,533)
(1,619)
(800)
Less LEC receivable reserve
-
-
-
(1,407)
-
-
Less net loss from discontinued operations
-
-
(6,899)
(14,250)
(3,740)
-
Plus gain on sale of Rovion
-
-
-
1,458
-
-
Plus revaluation of warrants
(2,981)
887
2,633
202
1,100
-
Less Geo-Tag settlement
-
-
-
-
(550)
-
Less non-recurring charges
(520)
-
(1,461)
(684)
(2,829)
(1,800)
GAAP Net income (loss)
$(6,267)
$4,222
$(14,559)
$(24,242)
$(10,373)
$(7,300)
Note: Since we cannot predict the valuation of the warrant liability and the
conversion option liability, we cannot reasonably project our GAAP net income (loss).
We, therefore, cannot provide GAAP guidance, but we do report GAAP results. An
explanation of the Company’s use of Non-GAAP measures is set forth on Slide 12
*As of November 2014 |
 10
Quarterly earnings summary: Q3 2014
Description
Q3-14
Net cash provided by operating activities
$3,012
Less capital expenditures
(830)
Free cash flow
$2,182
Net cash used in investing activities
$(830)
Net cash used in financing activities
$ (4,547)
Note: Since we cannot predict the valuation of the warrant liability and the
conversion option liability, we cannot reasonably project our GAAP net income (loss).
We, therefore, cannot provide GAAP guidance, but we do report GAAP results. An
explanation of the Company’s use of Non-GAAP measures is set forth on Slide 12 |
 11
Quarterly earnings summary: Q3 2014
$ in Millions
Q3-13
Q4-13
Q1-14
Q2-14
Q3-14
Assets
Cash & marketable debt securities
$ 4.8
$ 5.1
$ 3.7
$ 6.7
$ 4.3
Accounts receivable, net
14.9
17.3
18.2
12.8
8.1
Total Assets
51.4
51.6
50.7
47.7
40.1
Liabilities and Equity
Total Debt
13.1
13.2
14.0
13.6
9.2
Total Liabilities
29.7
31.3
33.1
31.2
24.7
Total Liabilities & Equity
$ 51.4
$ 51.6
$ 50.7
$ 47.7
$ 40.1 |
 12
Quarterly earnings summary: Q3 2014
$ in Millions
FY-2014
Total Revenue
$87M –
90M
Adjusted EBITDA
$2.0M –
2.4M
Per Diluted Share
$0.09-$0.10
Diluted Weighted Avg. Shares
23,500
Projected as of November 12, 2014
Note: Since we cannot predict the valuation of the warrant liability and the
conversion option liability, we cannot reasonably project our GAAP net income (loss).
We, therefore, cannot provide GAAP guidance, but we do report GAAP results. An
explanation of the Company’s use of Non-GAAP measures is set forth on Slide 12 |
 13
Quarterly earnings summary: Q3 2014
A
limitation
of
non-GAAP
Adjusted
EBITDA
is
that
it
excludes
items
that
often
have
a
material
effect on the company’s net income (loss) and earnings per common share
calculated in accordance
with
GAAP.
Therefore,
management
compensates
for
this
limitation
by
using
Adjusted EBITDA in conjunction with net income (loss) and net income (loss) per
share measures. The company believes that Adjusted EBITDA provides investors
with an additional tool for evaluating the company’s core performance,
which management uses in its own evaluation of overall performance, and as a
base-line for assessing the future earnings potential of the company.
A limitation of using free cash flow versus the GAAP measure of net cash
provided by operating activities as a means for evaluating the company is
that free cash flow does not represent the total increase or decrease in the
cash balance from operations for the period because it excludes cash used
for capital expenditures during the period. The company believes that free
cash flow provides investors with an additional tool in evaluating the
company’s liquidity. While
the
GAAP
results
are
more
complete,
the
company
prefers
to
allow
investors
to
have
this
supplemental metric since, with reconciliation to GAAP, it may provide greater
insight into the company’s financial results. The non-GAAP measures
should be viewed as a supplement to, and not as a substitute for, or
superior to the GAAP measures. This
press
release
includes
the
non-GAAP
financial
measures
of
“Adjusted
EBITDA”
and
“free
cash flow.”
Adjusted EBITDA is defined as net income (loss) excluding: provision for income
taxes; interest and other income (expense), net; depreciation; amortization;
stock based compensation
charges;
gain
or
loss
on
derivatives’
revaluation;
net
income
(loss)
from
discontinued operations; accrued lease liability/asset; and severance charges.
Adjusted EBITDA is reconciled to net income (loss) which we believe is the
most comparable GAAP measure. Free cash flow is defined as net cash provided
by operating activities less capital expenditures. Free cash flow is
reconciled to net cash provided by operating activities which we believe is
the most comparable GAAP measure. Adjusted EBITDA and free cash flow, as
defined
above,
are
not
measurements
under
GAAP.
A
reconciliation
of
net
income
(loss)
to
Adjusted EBITDA and free cash flow to net cash provided by operating activities is
set forth at the end of this press release.
Management believes that Adjusted EBITDA provides useful information to investors
about the company’s performance because it eliminates the effects of
period-to-period changes in income from interest on the
company’s cash, expense from the company’s financing transactions
and the costs associated with income tax expense, capital investments, stock-
based compensation expense, net income (loss) from discontinued operations,
derivatives’ revaluation charges; accrued lease liability/asset;
settlement accrual; and severance charges which are not directly attributable
to the underlying performance of the company’s business operations.
Management uses Adjusted EBITDA in evaluating the overall performance of the
company’s business operations.
Management also believes free cash flow to be a liquidity measure that provides
useful information
to
management
and
investors
about
the
amount
of
cash
generated
by
the
business that, after the acquisition of property and equipment, including
information technology infrastructure and land and buildings, can be used for
strategic opportunities, including investing in our business, making
strategic acquisitions, and strengthening the balance sheet. Analysis of free
cash flow also facilitates management's comparisons of our operating results
to competitors' operating results. |
 Fred
Thiel Chairman & CEO
fred@local.com
Local
Corporation
|
7555
Irvine
Center
Drive
|
Irvine
CA
92618
|
949.784.0800
|
www.localcorporation.com
Ken Cragun
CFO
kcragun@local.com
Quarterly earnings summary: Q3 2014
14 |