Attached files
| file | filename |
|---|---|
| 8-K - 8-K - Monogram Residential Trust, Inc. | a14-24061_18k.htm |
| EX-99.3 - EX-99.3 - Monogram Residential Trust, Inc. | a14-24061_1ex99d3.htm |
| EX-99.1 - EX-99.1 - Monogram Residential Trust, Inc. | a14-24061_1ex99d1.htm |
| EX-99.4 - EX-99.4 - Monogram Residential Trust, Inc. | a14-24061_1ex99d4.htm |
| EX-99.2 - EX-99.2 - Monogram Residential Trust, Inc. | a14-24061_1ex99d2.htm |
Exhibit 99.5
|
|
1 Company Presentation November 2014 1 |
|
|
2 Forward Looking Statements 2 This presentation contains forward-looking statements relating to the business and financial outlook of Monogram Residential Trust, Inc. that are based on our current expectations, estimates, forecasts and projections and are not guarantees of future performance. Statements regarding the following subjects may be impacted by a number of risks and uncertainties such as our business strategy; our ability to obtain future financing arrangements; our ability to make future distributions and our expected objectives with regard to our distribution policy; our understanding of our competition; market trends, projected capital expenditures, our ability to complete and stabilize developments within our projected timeframe, our ability to achieve projected NOI yields. Actual results may differ materially from those expressed in these forward-looking statements, and you should not place undue reliance on any such statements. A number of important factors could cause actual results to differ materially from the forward-looking statements contained in this document, including our ability to complete the listing of our common shares on the NYSE in a timely manner or at all; our ability to complete the tender offer in a timely manner or at all; the price at which shares of our common stock may trade on the NYSE, which may be higher or lower than the purchase price in the tender offer; our actual or estimated FFO or AFFO and other factors described in the Risk Factors section of Monogram Residential Trust, Inc.’s Annual Report on Form 10-K for the year ended December 31, 2013 and in subsequent Quarterly Reports on Form 10-Q. Forward-looking statements in this document speak only as of the date on which such statements were made, and we undertake no obligation to update any such statements that may become untrue because of subsequent events. MONOGRAM R E S IDENT IAL T R U S T |
|
|
3 Important Information 3 This presentation is for informational purposes only and is not an offer to buy or the solicitation of an offer to sell any securities of Monogram. Any tender offer will be made only pursuant to an offer to purchase, letter of transmittal and related materials that Monogram intends to distribute to its shareholders and file with the Securities and Exchange Commission (the “SEC”). The full details of the tender offer, including complete instructions on how to tender shares, will be included in the offer to purchase, the letter of transmittal and other related materials, which Monogram will distribute to shareholders and file with the SEC upon commencement of the tender offer. Shareholders are urged to read the offer to purchase, the letter of transmittal and other related materials when they become available because they will contain important information, including the terms and conditions of the tender offer. Shareholders may obtain free copies of the offer to purchase, the letter of transmittal and other related materials that Monogram files with the SEC at the SEC’s website at www.sec.gov or by calling the information agent for the contemplated tender offer, who will be identified in the materials filed with the SEC at the commencement of the tender offer. In addition, shareholders may obtain free copies of Monogram’s filings with the SEC from its website at www.monogramres.com. Additional Information For additional information, including reconciliations of any non-GAAP financial measures found herein, please reference the supplemental report furnished by us on a Current Report on Form 8-K filed November 10, 2014 and made available on our website at www.monogramres.com, or distributed with this presentation. MONOGRAM R E S IDENT IAL T R U S T |
|
|
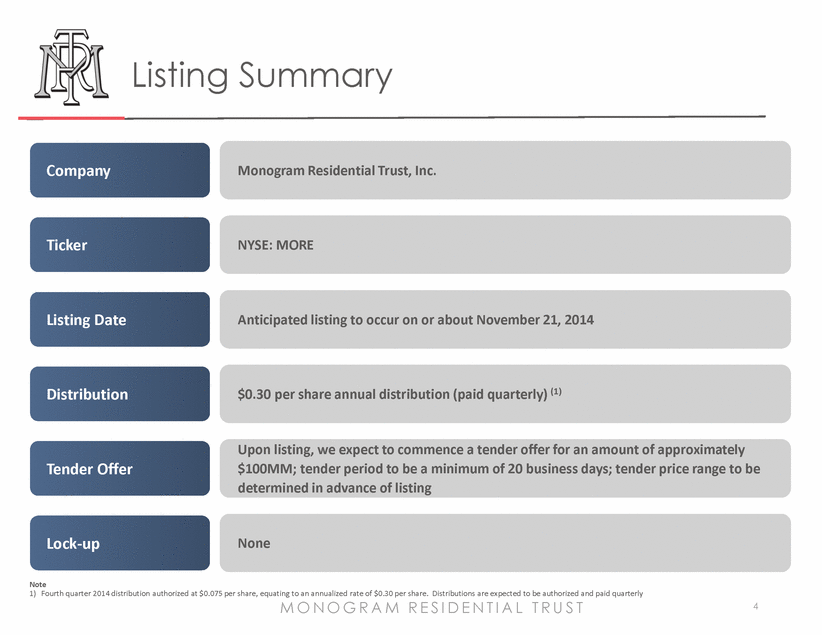
4 Listing Summary MONOGRAM R E S IDENT IAL T R U S T 4 Company Monogram Residential Trust, Inc. Ticker NYSE: MORE Listing Date Anticipated listing to occur on or about November 21, 2014 Distribution $0.30 per share annual distribution (paid quarterly) (1) Tender Offer Upon listing, we expect to commence a tender offer for an amount of approximately $100MM; tender period to be a minimum of 20 business days; tender price range to be determined in advance of listing Lock-up None Note 1) Fourth quarter 2014 distribution authorized at $0.075 per share, equating to an annualized rate of $0.30 per share. Distributions are expected to be authorized and paid quarterly |
|
|
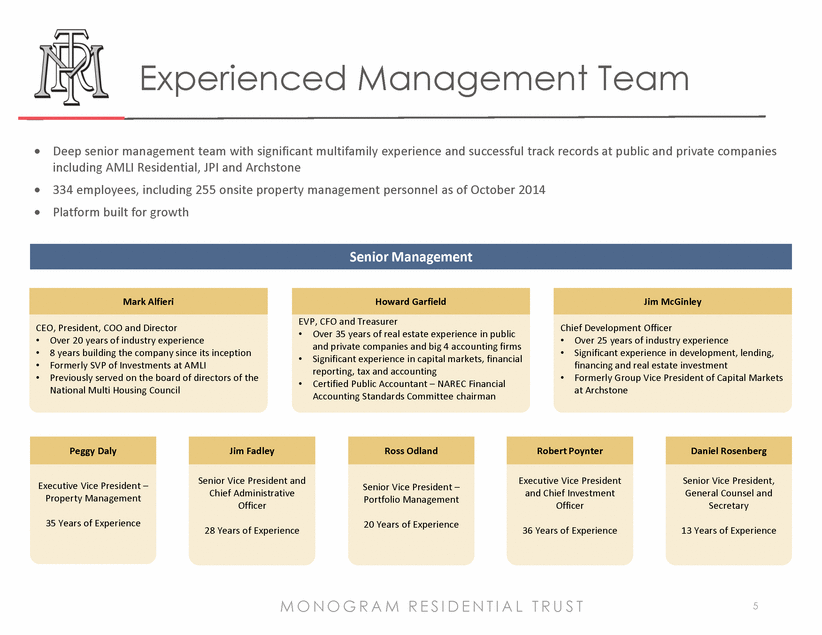
5 Experienced Management Team MONOGRAM R E S IDENT IAL T R U S T 5 · Deep senior management team with significant multifamily experience and successful track records at public and private companies including AMLI Residential, JPI and Archstone · 334 employees, including 255 onsite property management personnel as of October 2014 · Platform built for growth Senior Management CEO, President, COO and Director • Over 20 years of industry experience • 8 years building the company since its inception • Formerly SVP of Investments at AMLI • Previously served on the board of directors of the National Multi Housing Council Mark Alfieri EVP, CFO and Treasurer • Over 35 years of real estate experience in public and private companies and big 4 accounting firms • Significant experience in capital markets, financial reporting, tax and accounting • Certified Public Accountant – NAREC Financial Accounting Standards Committee chairman Howard Garfield Chief Development Officer • Over 25 years of industry experience • Significant experience in development, lending, financing and real estate investment • Formerly Group Vice President of Capital Markets at Archstone Jim McGinley Senior Vice President, General Counsel and Secretary 13 Years of Experience Daniel Rosenberg Senior Vice President and Chief Administrative Officer 28 Years of Experience Jim Fadley Executive Vice President – Property Management 35 Years of Experience Peggy Daly Executive Vice President and Chief Investment Officer 36 Years of Experience Robert Poynter Senior Vice President – Portfolio Management 20 Years of Experience Ross Odland |
|
|
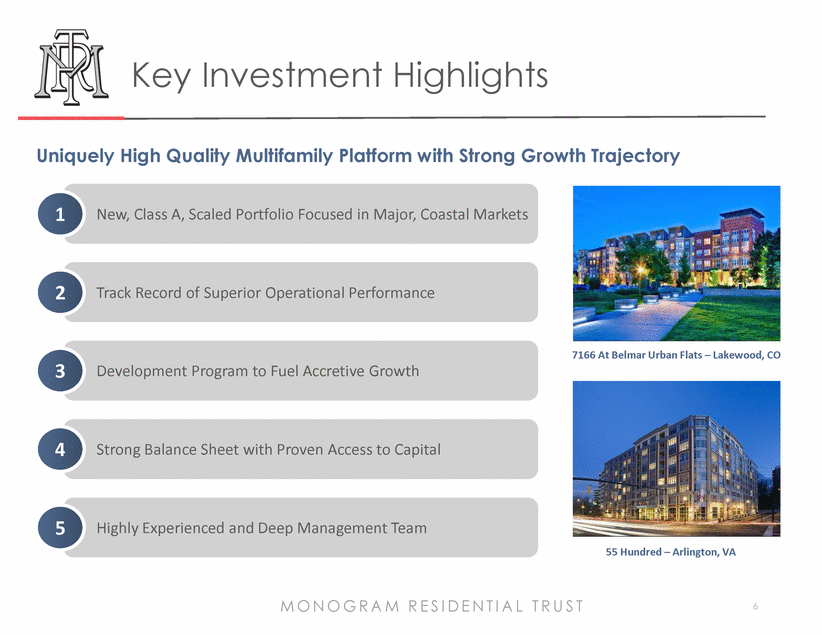
6 Key Investment Highlights Uniquely High Quality Multifamily Platform with Strong Growth Trajectory 7166 At Belmar Urban Flats – Lakewood, CO 55 Hundred – Arlington, VA New, Class A, Scaled Portfolio Focused in Major, Coastal Markets 1 Track Record of Superior Operational Performance 2 Development Program to Fuel Accretive Growth 3 Strong Balance Sheet with Proven Access to Capital 4 Highly Experienced and Deep Management Team 5 MONOGRAM R E S IDENT IAL T R U S T 6 |
|
|
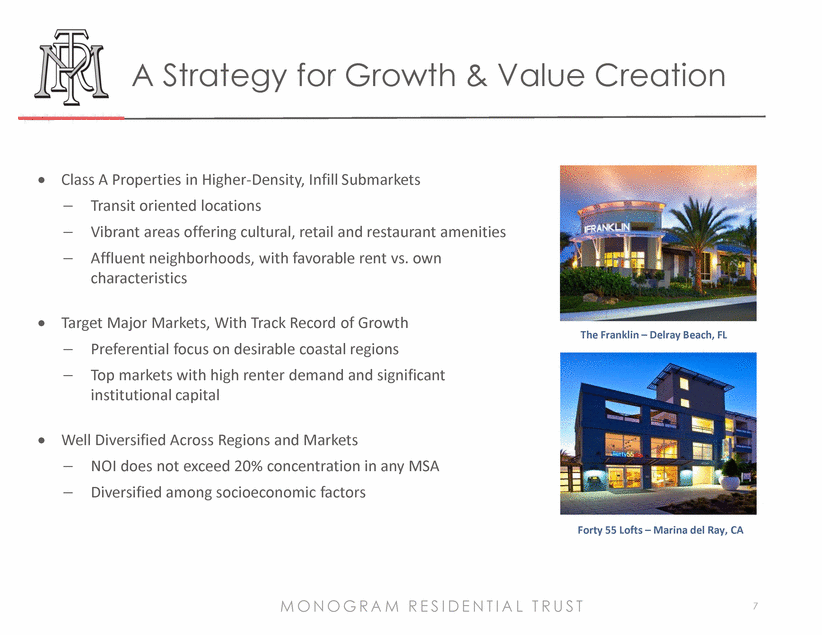
7 A Strategy for Growth & Value Creation The Franklin – Delray Beach, FL Forty 55 Lofts – Marina del Ray, CA 7 · Class A Properties in Higher-Density, Infill Submarkets – Transit oriented locations – Vibrant areas offering cultural, retail and restaurant amenities – Affluent neighborhoods, with favorable rent vs. own characteristics · Target Major Markets, With Track Record of Growth – Preferential focus on desirable coastal regions – Top markets with high renter demand and significant institutional capital · Well Diversified Across Regions and Markets – NOI does not exceed 20% concentration in any MSA – Diversified among socioeconomic factors MONOGRAM R E S IDENT IAL T R U S T |
|
|
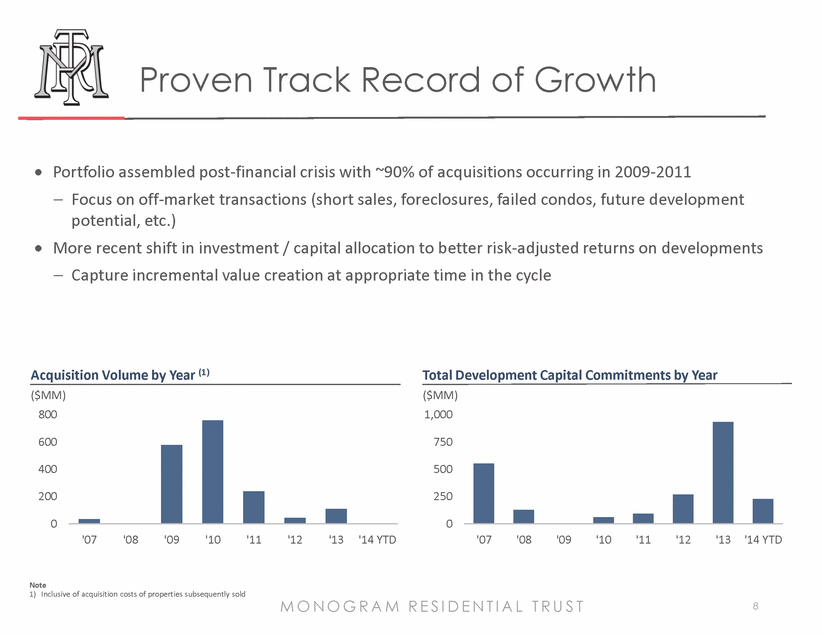
8 MONOGRAM R E S IDENT IAL T R U S T 8 · Portfolio assembled post-financial crisis with ~90% of acquisitions occurring in 2009-2011 – Focus on off-market transactions (short sales, foreclosures, failed condos, future development potential, etc.) · More recent shift in investment / capital allocation to better risk-adjusted returns on developments – Capture incremental value creation at appropriate time in the cycle ($MM) Acquisition Volume by Year (1) 0 200 400 600 800 '07 '08 '09 '10 '11 '12 '13 '14 YTD ($MM) Total Development Capital Commitments by Year 0 250 500 750 1,000 '07 '08 '09 '10 '11 '12 '13 '14 YTD Proven Track Record of Growth Note 1) Inclusive of acquisition costs of properties subsequently sold |
|
|
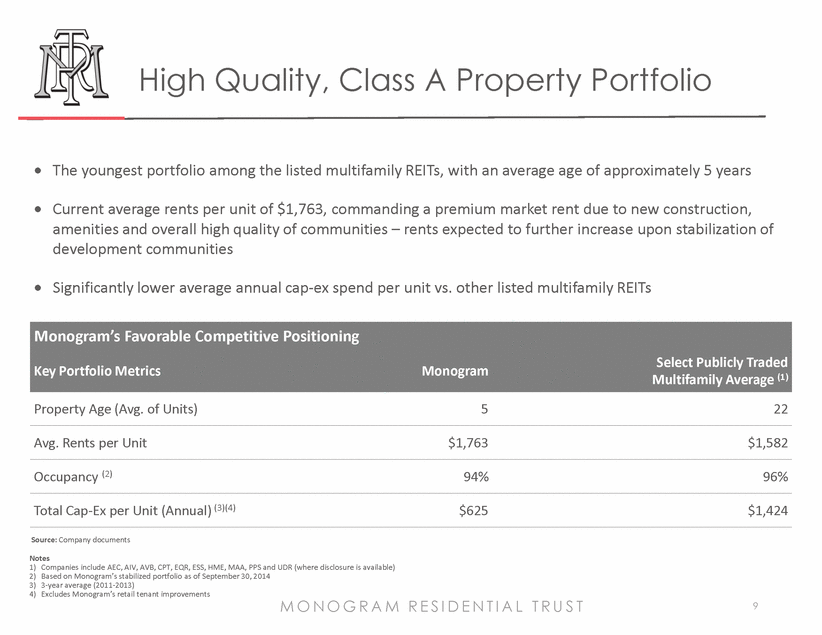
9 High Quality, Class A Property Portfolio MONOGRAM R E S IDENT IAL T R U S T 9 · The youngest portfolio among the listed multifamily REITs, with an average age of approximately 5 years · Current average rents per unit of $1,763, commanding a premium market rent due to new construction, amenities and overall high quality of communities – rents expected to further increase upon stabilization of development communities · Significantly lower average annual cap-ex spend per unit vs. other listed multifamily REITs Monogram’s Favorable Competitive Positioning Key Portfolio Metrics Monogram Select Publicly Traded Multifamily Average (1) Property Age (Avg. of Units) 5 22 Avg. Rents per Unit $1,763 $1,582 Occupancy (2) 94% 96% Total Cap-Ex per Unit (Annual) (3)(4) $625 $1,424 Source: Company documents Notes 1) Companies include AEC, AIV, AVB, CPT, EQR, ESS, HME,MAA, PPS and UDR (where disclosure is available) 2) Based on Monogram’s stabilized portfolio as of September 30, 2014 3) 3-year average (2011-2013) 4) Excludes Monogram’s retail tenant improvements |
|
|
10 Scaled Platform Focused in Major Markets, with Significant Coastal Presence 33 Operating Properties, 6 Lease Ups, 13 Developments 52 Total Properties, ~15k Units $3.7Bn Cost (1)(2) Southern California 10% Total NOI $324MM Development Northern California 18% Total NOI $65MM Development Texas 20% Total NOI $335MM Development Mountain 12% Total NOI $48MM Development Florida 7% Total NOI $139MM Development Mid Atlantic 15% Total NOI $284MM Development New England 8% Total NOI $230MM Development Georgia 4% Total NOI $68MM Development Midwest 7% Total NOI $0 Development Notes 1) Regional percentage of total NOI based on Monogram’s share of YTD net operating income for its stabilized portfolio through Q3 ’14; units include stabilized portfolio and development 2) Cost for stabilized assets reflects GAAP cost as of Q3 ‘14 and includes building improvements as well as intangibles recognized in GAAP acquisition accounting. Amounts are before any depreciation or amortization. Cost for developments are projected economic costs, and represent costs for all on-site development and construction costs recognized for GAAP, but including certain items expensed for GAAP (primarily specific financing and operating expenses incurred during lease up) and excluding certain GAAP costs related to consolidated allocated costs, former sponsor-related fees and other non-cash capitalized cost items MONOGRAM R E S IDENT IAL T R U S T 10 |
|
|
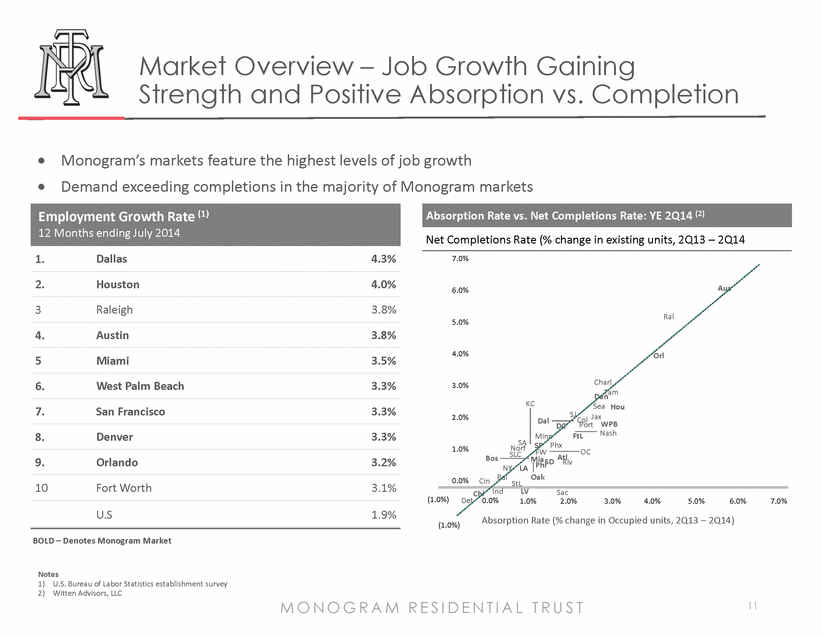
11 Market Overview – Job Growth Gaining Strength and Positive Absorption vs. Completion 11 · Monogram’s markets feature the highest levels of job growth · Demand exceeding completions in the majority of Monogram markets Employment Growth Rate (1) 12 Months ending July 2014 1. Dallas 4.3% 2. Houston 4.0% 3 Raleigh 3.8% 4. Austin 3.8% 5 Miami 3.5% 6. West Palm Beach 3.3% 7. San Francisco 3.3% 8. Denver 3.3% 9. Orlando 3.2% 10 Fort Worth 3.1% U.S 1.9% Net Completions Rate (% change in existing units, 2Q13 – 2Q14 Absorption Rate vs. Net Completions Rate: YE 2Q14 (2) Atl Aus Bal Bos Charl Chi Cin Col Dal Den Det FtL FW Hou Ind Jax KC LV LA Mia Minn Nash NY Norf Oak OC Orl Phi Phx Port Ral Riv Sac SLC SA SD SF SJ Sea StL Tam DC WPB (1.0%) 0.0% 1.0% 2.0% 3.0% 4.0% 5.0% 6.0% 7.0% (1.0%) 0.0% 1.0% 2.0% 3.0% 4.0% 5.0% 6.0% 7.0% Absorption Rate (% change in Occupied units, 2Q13 – 2Q14) Notes 1) U.S. Bureau of Labor Statistics establishment survey 2) Witten Advisors, LLC BOLD – Denotes Monogram Market MONOGRAM R E S IDENT IAL T R U S T |
|
|
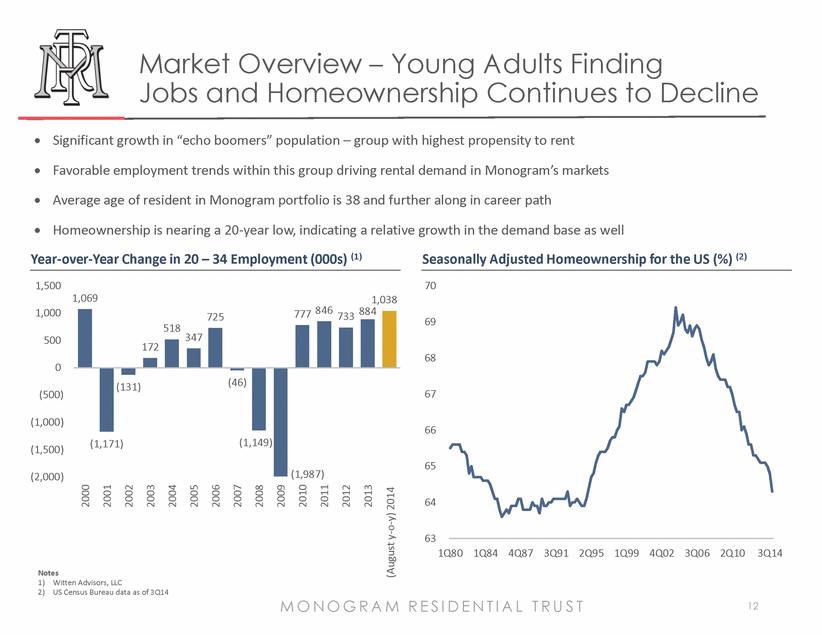
12 Notes 1) Witten Advisors, LLC 2) US Census Bureau data as of 3Q14 Market Overview – Young Adults Finding Jobs and Homeownership Continues to Decline MONOGRAM R E S IDENT IAL T R U S T 12 · Significant growth in “echo boomers” population – group with highest propensity to rent · Favorable employment trends within this group driving rental demand in Monogram’s markets · Average age of resident in Monogram portfolio is 38 and further along in career path · Homeownership is nearing a 20-year low, indicating a relative growth in the demand base as well Year-over-Year Change in 20 – 34 Employment (000s) (1) 1,069 (1,171) (131) 172 518 347 725 (46) (1,149) (1,987) 777 846 733 884 1,038 (2,000) (1,500) (1,000) (500) 0 500 1,000 1,500 2000 2001 2002 2003 2004 2005 2006 2007 2008 2009 2010 2011 2012 2013 Seasonally Adjusted Homeownership for the US (%) (2) 63 64 65 66 67 68 69 70 1Q80 1Q84 4Q87 3Q91 2Q95 1Q99 4Q02 3Q06 2Q10 1Q14 (August y-o-y) 2014 3Q14 |
|
|
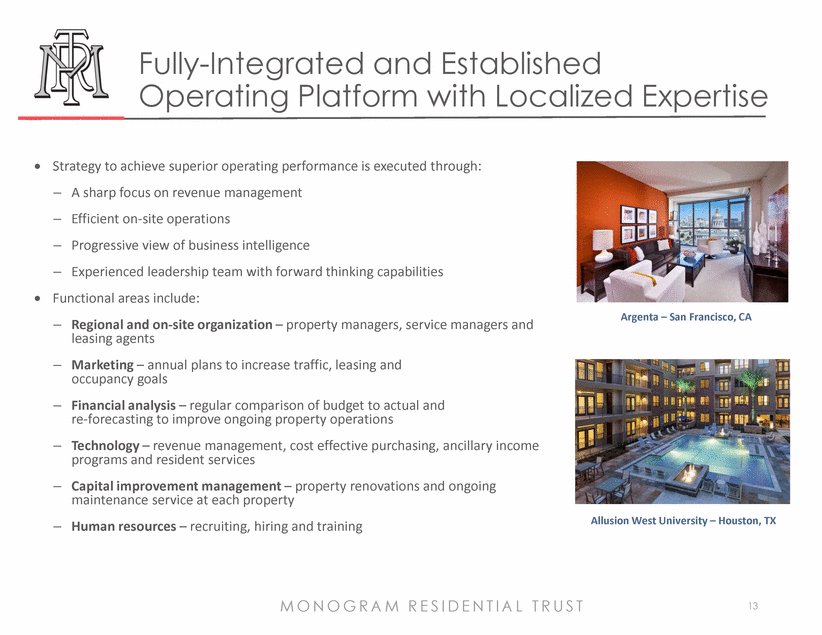
13 Fully-Integrated and Established Operating Platform with Localized Expertise MONOGRAM R E S IDENT IAL T R U S T 13 · Strategy to achieve superior operating performance is executed through: – A sharp focus on revenue management – Efficient on-site operations – Progressive view of business intelligence – Experienced leadership team with forward thinking capabilities · Functional areas include: – Regional and on-site organization – property managers, service managers and leasing agents – Marketing – annual plans to increase traffic, leasing and occupancy goals – Financial analysis – regular comparison of budget to actual and re-forecasting to improve ongoing property operations – Technology – revenue management, cost effective purchasing, ancillary income programs and resident services – Capital improvement management – property renovations and ongoing maintenance service at each property – Human resources – recruiting, hiring and training Argenta – San Francisco, CA Allusion West University – Houston, TX |
|
|
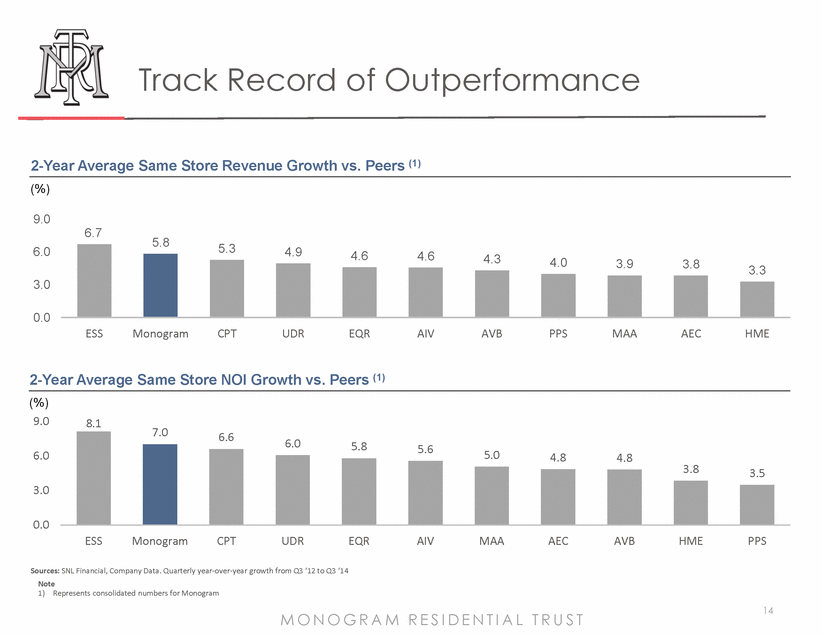
14 Track Record of Outperformance MONOGRAM R E S IDENT IAL T R U S T 14 Sources: SNL Financial, Company Data. Quarterly year-over-year growth from Q3 ‘12 to Q3 ‘14 (%) 6.7 5.8 5.3 4.9 4.6 4.6 4.3 4.0 3.9 3.8 3.3 0.0 3.0 6.0 9.0 ESS Monogram CPT UDR EQR AIV AVB PPS MAA AEC HME 2-Year Average Same Store Revenue Growth vs. Peers (1) 8.1 7.0 6.6 6.0 5.8 5.6 5.0 4.8 4.8 3.8 3.5 0.0 3.0 6.0 9.0 ESS Monogram CPT UDR EQR AIV MAA AEC AVB HME PPS (%) 2-Year Average Same Store NOI Growth vs. Peers (1) Note 1) Represents consolidated numbers for Monogram |
|
|
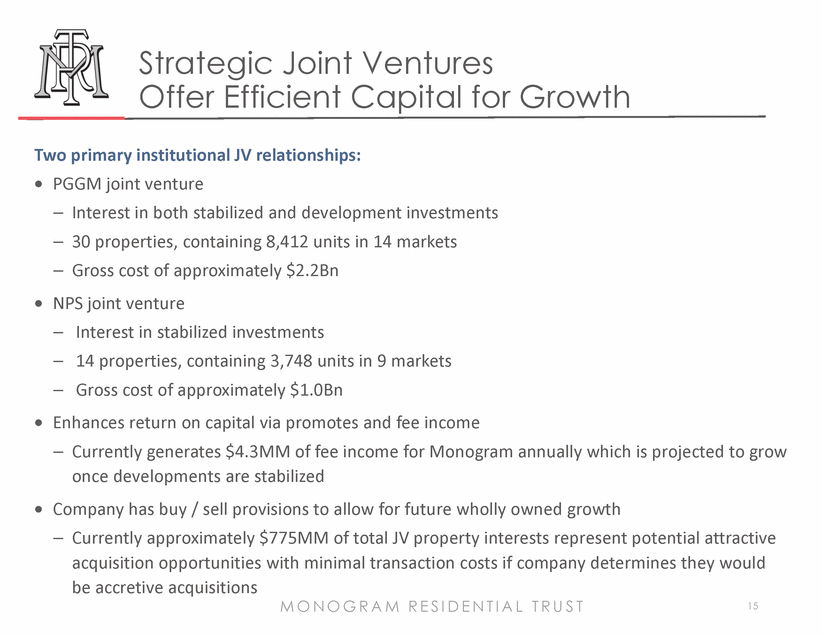
15 Strategic Joint Ventures Offer Efficient Capital for Growth MONOGRAM R E S IDENT IAL T R U S T 15 Two primary institutional JV relationships: · PGGM joint venture – Interest in both stabilized and development investments – 30 properties, containing 8,412 units in 14 markets – Gross cost of approximately $2.2Bn · NPS joint venture – Interest in stabilized investments – 14 properties, containing 3,748 units in 9 markets – Gross cost of approximately $1.0Bn · Enhances return on capital via promotes and fee income – Currently generates $4.3MM of fee income for Monogram annually which is projected to grow once developments are stabilized · Company has buy / sell provisions to allow for future wholly owned growth – Currently approximately $775MM of total JV property interests represent potential attractive acquisition opportunities with minimal transaction costs if company determines they would be accretive acquisitions |
|
|
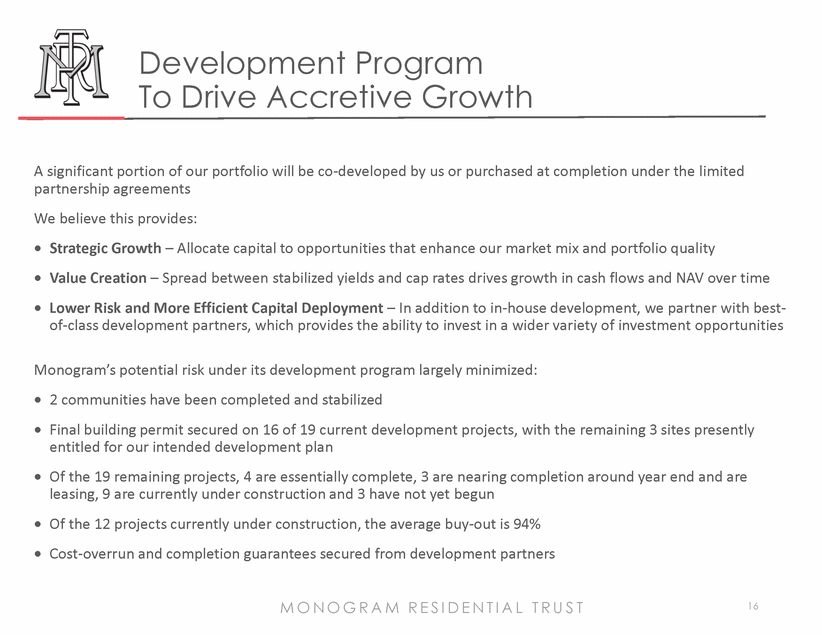
16 Development Program To Drive Accretive Growth 16 A significant portion of our portfolio will be co-developed by us or purchased at completion under the limited partnership agreements We believe this provides: · Strategic Growth – Allocate capital to opportunities that enhance our market mix and portfolio quality · Value Creation – Spread between stabilized yields and cap rates drives growth in cash flows and NAV over time · Lower Risk and More Efficient Capital Deployment – In addition to in-house development, we partner with bestof- class development partners, which provides the ability to invest in a wider variety of investment opportunities Monogram’s potential risk under its development program largely minimized: · 2 communities have been completed and stabilized · Final building permit secured on 16 of 19 current development projects, with the remaining 3 sites presently entitled for our intended development plan · Of the 19 remaining projects, 4 are essentially complete, 3 are nearing completion around year end and are leasing, 9 are currently under construction and 3 have not yet begun · Of the 12 projects currently under construction, the average buy-out is 94% · Cost-overrun and completion guarantees secured from development partners MONOGRAM R E S IDENT IAL T R U S T |
|
|
17 Value Creation Potential Within Existing Developments 17 Development – Estimated Remaining Cost Summary (3Q14 Through 4Q17) Total (Rounded) 100% Total Cost Remaining $832MM JV Contribution ($32MM) Construction Loan Draws ($735MM) Put Options (MORE) $10MM Net MORE Equity Required $75MM 0 500 1,000 1,500 2,000 2,500 2014 2015 2016 2017 2018 Units Delivered (Units) Unit Delivery and Projected Development Yield · $1.5Bn total development program (5,460 est. units) – Circa $900MM Monogram proportionate share of total cost, of which $494MM already incurred (54% complete) – All but one project expected to be completed by end of 2016 with stabilization projected by the end of 2017 – Overall projected NOI yield at stabilization of 6.2% 6.11% 6.18% 6.98% 6.44% Lease Up and Development Communities MONOGRAM R E S IDENT IAL T R U S T |
|
|
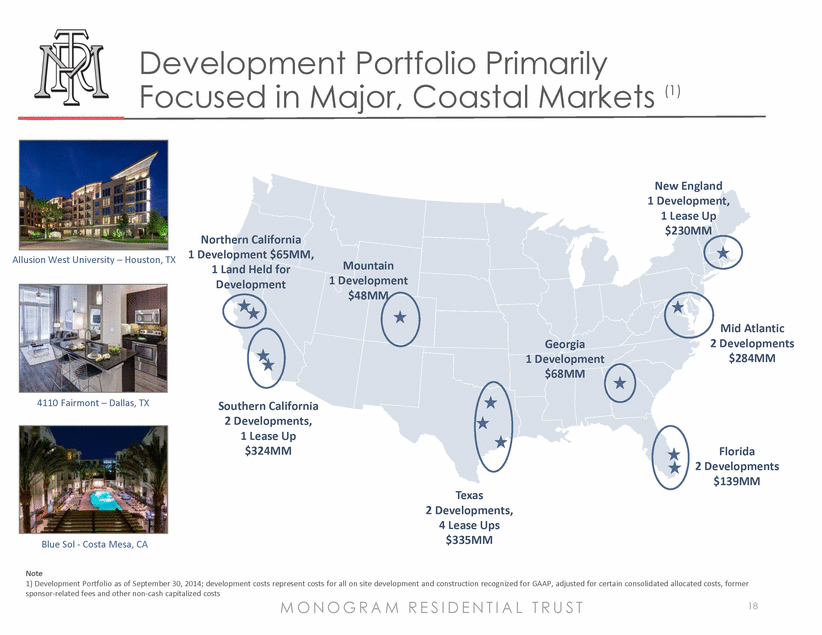
18 Development Portfolio Primarily Focused in Major, Coastal Markets (1) 18 Southern California 2 Developments, 1 Lease Up $324MM Northern California 1 Development $65MM, 1 Land Held for Development Texas 2 Developments, 4 Lease Ups $335MM Mountain 1 Development $48MM Florida 2 Developments $139MM New England 1 Development, 1 Lease Up $230MM Georgia 1 Development $68MM Mid Atlantic 2 Developments $284MM 4110 Fairmont – Dallas, TX Blue Sol - Costa Mesa, CA Allusion West University – Houston, TX Note 1) Development Portfolio as of September 30, 2014; development costs represent costs for all on site development and construction recognized for GAAP, adjusted for certain consolidated allocated costs, former sponsor-related fees and other non-cash capitalized costs MONOGRAM R E S IDENT IAL T R U S T |
|
|
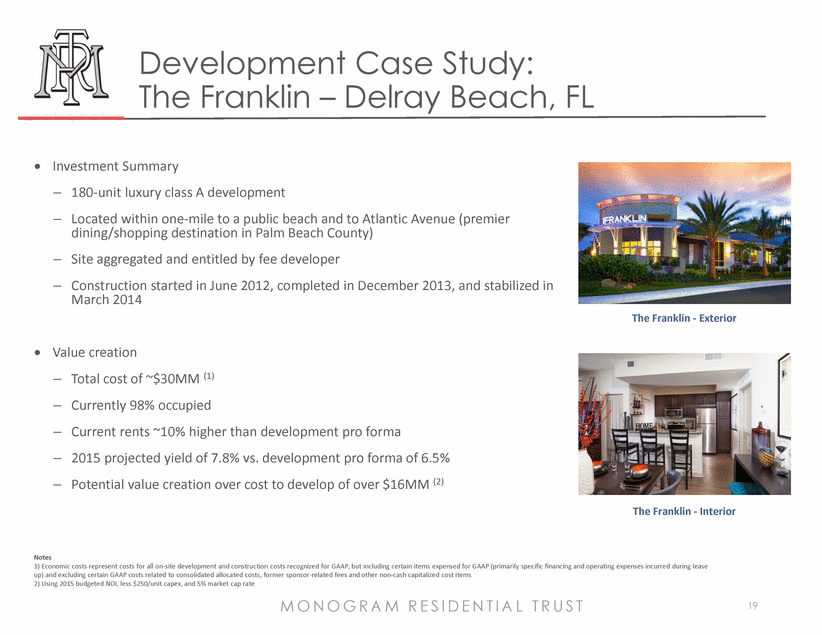
19 Development Case Study: The Franklin – Delray Beach, FL MONOGRAM R E S IDENT IAL T R U S T 19 · Investment Summary – 180-unit luxury class A development – Located within one-mile to a public beach and to Atlantic Avenue (premier dining/shopping destination in Palm Beach County) – Site aggregated and entitled by fee developer – Construction started in June 2012, completed in December 2013, and stabilized in March 2014 · Value creation – Total cost of ~$30MM (1) – Currently 98% occupied – Current rents ~10% higher than development pro forma – 2015 projected yield of 7.8% vs. development pro forma of 6.5% – Potential value creation over cost to develop of over $16MM (2) The Franklin - Exterior The Franklin - Interior Notes 1) Economic costs represent costs for all on-site development and construction costs recognized for GAAP, but including certain items expensed for GAAP (primarily specific financing and operating expenses incurred during lease up) and excluding certain GAAP costs related to consolidated allocated costs, former sponsor-related fees and other non-cash capitalized cost items 2) Using 2015 budgeted NOI, less $250/unit capex, and 5% market cap rate |
|
|
20 Development Case Study: Allusion – Houston, TX MONOGRAM R E S IDENT IAL T R U S T 20 · Investment Summary – 231-unit five story podium luxury class A apartment project – Located in the west university inner loop - one of the few development opportunities in highly desired area – Development JV partner with specialized product expertise – Construction started in September 2012, substantially complete in June 2014, and currently in lease-up with stabilization expected in December 2014 · Value creation – Total estimated economic cost of ~$40MM (1) – Monogram obtained completion and cost overrun guarantees from development partner – Currently 84% occupied – Current rents ~15% higher than development pro forma – 2015 projected yield of 6.7% vs. development pro forma of 6.1% – Potential value creation over cost of development of over $14MM (2) Allusion West University - Exterior Allusion West University - Interior Notes 1) Economic costs represent costs for all on-site development and construction costs recognized for GAAP, but including certain items expensed for GAAP (primarily specific financing and operating expenses incurred during lease up) and excluding certain GAAP costs related to consolidated allocated costs, former sponsor-related fees and other non-cash capitalized cost items 2) Using 2015 budgeted NOI, less $250/unit capex, less development partner put option and 4.75% market cap rate |
|
|
21 Strong Balance Sheet (1) MONOGRAM R E S IDENT IAL T R U S T 21 · ~$280MM of available liquidity – $138MM of cash and $140MM of undrawn capacity on Freddie Mac credit facility – In discussions with lenders to obtain additional / new credit facility · Proven access to capital (mortgages, construction loans, credit facility, JV equity, etc.) · Strong balance sheet / conservative leverage – 34% Debt to Gross Real Estate Assets (2) · Manageable debt maturities and weighted avg. interest rate of 3.6% Capital / Leverage Profile 0.0 100.0 200.0 300.0 400.0 2014 2015 2016 2017 2018 Thereafter Consolidated Proportionate ($) Current Contractual Maturities Debt Maturity Schedule Illustrative Capitalization ($MM) Consol. Proportionate Gross Operating Real Estate $2,369 $1,537 Construction in progress, inc. land $647 $385 Total Real Estate, Gross $3,015 $1,922 Mortgage and Construction Debt $1,092 $645 Credit Facility $10 $10 Total Debt $1,102 $655 Cash $156 $138 Debt / Gross Real Estate Assets 37% 34% Net Debt / Gross Real Estate Assets 31% 27% Notes 1) All information as of September 30, 2014 2) Book value of undepreciated operating real estate and construction in progress, including land, proportionate share |
|
|
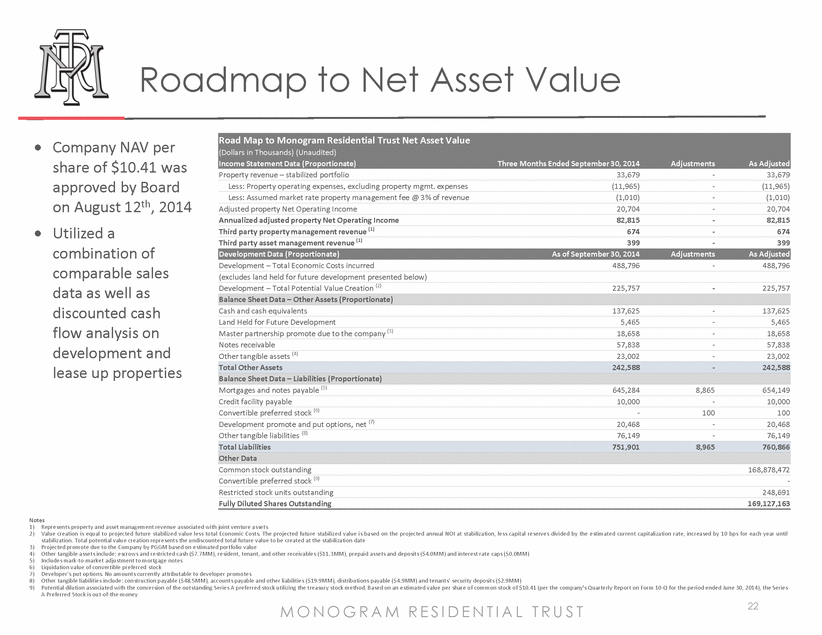
22 Roadmap to Net Asset Value MONOGRAM R E S IDENT IAL T R U S T 22 Road Map to Monogram Residential Trust Net Asset Value (Dollars in Thousands) (Unaudited) Income Statement Data (Proportionate) Three Months Ended September 30, 2014 Adjustments As Adjusted Property revenue – stabilized portfolio 33,679 - 33,679 Less: Property operating expenses, excluding property mgmt. expenses (11,965) - (11,965) Less: Assumed market rate property management fee @ 3% of revenue (1,010) - (1,010) Adjusted property Net Operating Income 20,704 - 20,704 Annualized adjusted property Net Operating Income 82,815 - 82,815 Third party property management revenue (1) 674 - 674 Third party asset management revenue (1) 399 - 399 Development Data (Proportionate) As of September 30, 2014 Adjustments As Adjusted Development – Total Economic Costs incurred 488,796 - 488,796 (excludes land held for future development presented below) Development – Total Potential Value Creation (2) 225,757 - 225,757 Balance Sheet Data – Other Assets (Proportionate) Cash and cash equivalents 137,625 - 137,625 Land Held for Future Development 5,465 - 5,465 Master partnership promote due to the company (3) 18,658 - 18,658 Notes receivable 57,838 - 57,838 Other tangible assets (4) 23,002 - 23,002 Total Other Assets 242,588 - 242,588 Balance Sheet Data – Liabilities (Proportionate) Mortgages and notes payable (5) 645,284 8,865 654,149 Credit facility payable 10,000 - 10,000 Convertible preferred stock (6) - 100 100 Development promote and put options, net (7) 20,468 - 20,468 Other tangible liabilities (8) 76,149 - 76,149 Total Liabilities 751,901 8,965 760,866 Other Data Common stock outstanding 168,878,472 Convertible preferred stock (9) - Restricted stock units outstanding 248,691 Fully Diluted Shares Outstanding 169,127,163 Notes 1) Represents property and asset management revenue associated with joint venture assets 2) Value creation is equal to projected future stabilized value less total Economic Costs. The projected future stabilized value is based on the projected annual NOI at stabilization, less capital reserves divided by the estimated current capitalization rate, increased by 10 bps for each year until stabilization. Total potential value creation represents the undiscounted total future value to be created at the stabilization date 3) Projected promote due to the Company by PGGMbased on estimated portfolio value 4) Other tangible assets include: escrows and restricted cash ($7.7MM), resident, tenant, and other receivables ($11.3MM), prepaid assets and deposits ($4.0MM) and interest rate caps ($0.0MM) 5) Includes mark-to-market adjustment to mortgage notes 6) Liquidation value of convertible preferred stock 7) Developer’s put options. No amounts currently attributable to developer promotes 8) Other tangible liabilities include: construction payable ($48.5MM), accounts payable and other liabilities ($19.9MM), distributions payable ($4.9MM) and tenants’ security deposits ($2.9MM) 9) Potential dilution associated with the conversion of the outstanding Series A preferred stock utilizing the treasury stock method. Based on an estimated value per share of common stock of $10.41 (per the company's Quarterly Report on Form 10-Q for the period ended June 30, 2014), the Series A Preferred Stock is out-of-the-money · Company NAV per share of $10.41 was approved by Board on August 12th, 2014 · Utilized a combination of comparable sales data as well as discounted cash flow analysis on development and lease up properties |
|
|
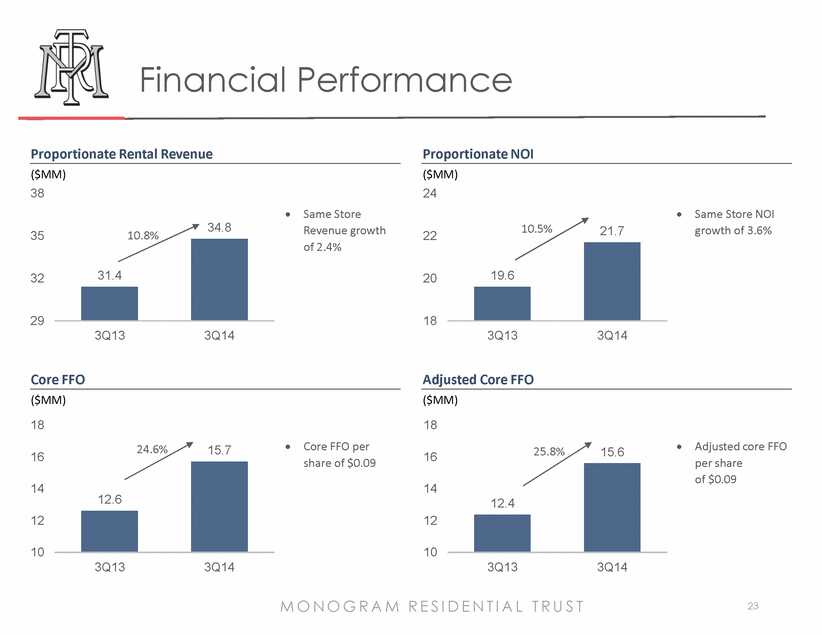
23 31.4 34.8 29 32 35 38 3Q13 3Q14 19.6 21.7 18 20 22 24 3Q13 3Q14 12.6 15.7 10 12 14 16 18 3Q13 3Q14 12.4 15.6 10 12 14 16 18 3Q13 3Q14 Financial Performance MONOGRAM R E S IDENT IAL T R U S T 23 ($MM) Core FFO ($MM) Adjusted Core FFO ($MM) Proportionate Rental Revenue ($MM) Proportionate NOI 24.6% 10.8% 25.8% 10.5% · Same Store Revenue growth of 2.4% · Same Store NOI growth of 3.6% · Core FFO per share of $0.09 · Adjusted core FFO per share of $0.09 |
|
|
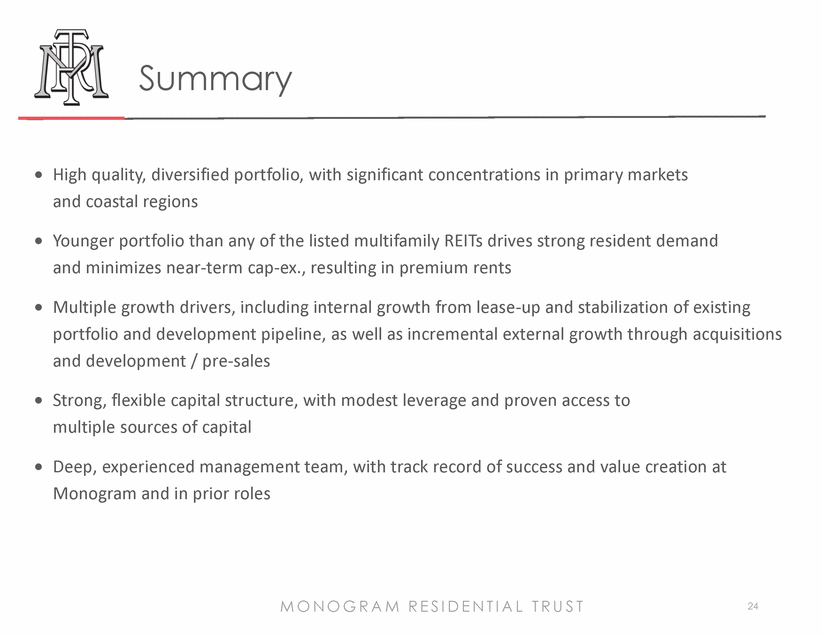
24 Summary MONOGRAM R E S IDENT IAL T R U S T 24 · High quality, diversified portfolio, with significant concentrations in primary markets and coastal regions · Younger portfolio than any of the listed multifamily REITs drives strong resident demand and minimizes near-term cap-ex., resulting in premium rents · Multiple growth drivers, including internal growth from lease-up and stabilization of existing portfolio and development pipeline, as well as incremental external growth through acquisitions and development / pre-sales · Strong, flexible capital structure, with modest leverage and proven access to multiple sources of capital · Deep, experienced management team, with track record of success and value creation at Monogram and in prior roles |
|
|
25 Appendix MONOGRAM R E S IDENT IAL T R U S T 25 |
|
|
26 A History of Value-Creation MONOGRAM R E S IDENT IAL T R U S T 26 · 2006 – Predecessor entity formed by Behringer Harvard; $127MM of equity raised from accredited investors · 2006 – Co-investment program established with PGGM; $100MM initial equity commitment (subsequently raised to $300MM) · 2008 – Registers with the SEC as a non-traded, public REIT, allowing sales of securities to non-accredited individuals through the U.S. broker-dealer network · 2008 – 2011 – Raises $1.5Bn of equity capital. Offering closed September 2011 · 2011 – Established Joint Venture relationship with NPS, advised by Heitman, through the sale of partial interests in both wholly owned properties and joint venture interest that PGGM previously owned · 2013 – Amends advisory and joint venture relationship with PGGM which included an additional $300MM “revolver” commitment · 2014 – Completes transformation to fully-integrated self-managed company and rebrands as Monogram Residential Trust, Inc. |
|
|
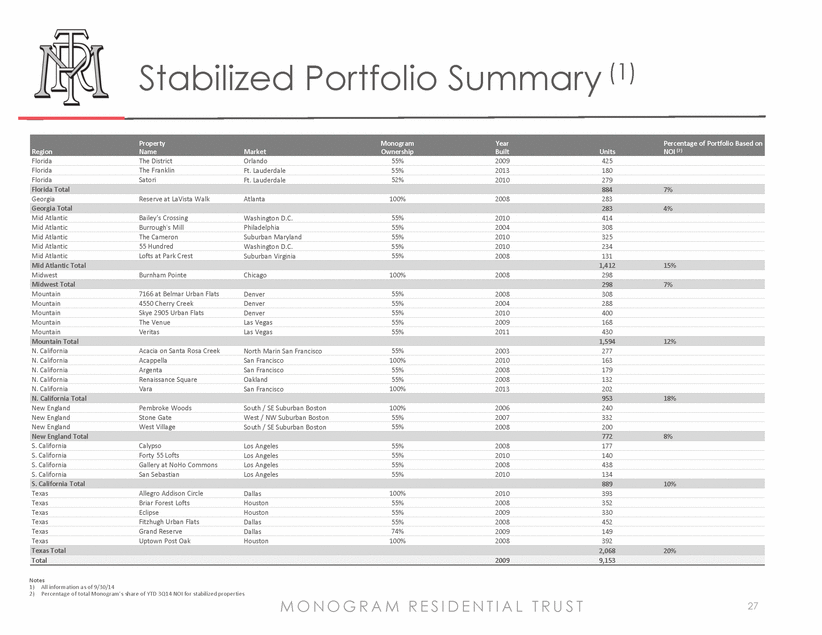
27 Stabilized Portfolio Summary (1) MONOGRAM R E S IDENT IAL T R U S T 27 Notes 1) All information as of 9/30/14 2) Percentage of totalMonogram’s share of YTD 3Q14 NOI for stabilized properties Region Property Name Market Monogram Ownership Year Built Units Percentage of Portfolio Based on NOI (2) Florida The District Orlando 55% 2009 425 Florida The Franklin Ft. Lauderdale 55% 2013 180 Florida Satori Ft. Lauderdale 52% 2010 279 Florida Total 884 7% Georgia Reserve at LaVista Walk Atlanta 100% 2008 283 Georgia Total 283 4% Mid Atlantic Bailey’s Crossing Washington D.C. 55% 2010 414 Mid Atlantic Burrough's Mill Philadelphia 55% 2004 308 Mid Atlantic The Cameron Suburban Maryland 55% 2010 325 Mid Atlantic 55 Hundred Washington D.C. 55% 2010 234 Mid Atlantic Lofts at Park Crest Suburban Virginia 55% 2008 131 Mid Atlantic Total 1,412 15% Midwest Burnham Pointe Chicago 100% 2008 298 Midwest Total 298 7% Mountain 7166 at Belmar Urban Flats Denver 55% 2008 308 Mountain 4550 Cherry Creek Denver 55% 2004 288 Mountain Skye 2905 Urban Flats Denver 55% 2010 400 Mountain The Venue Las Vegas 55% 2009 168 Mountain Veritas Las Vegas 55% 2011 430 Mountain Total 1,594 12% N. California Acacia on Santa Rosa Creek North Marin San Francisco 55% 2003 277 N. California Acappella San Francisco 100% 2010 163 N. California Argenta San Francisco 55% 2008 179 N. California Renaissance Square Oakland 55% 2008 132 N. California Vara San Francisco 100% 2013 202 N. California Total 953 18% New England Pembroke Woods South / SE Suburban Boston 100% 2006 240 New England Stone Gate West / NW Suburban Boston 55% 2007 332 New England West Village South / SE Suburban Boston 55% 2008 200 New England Total 772 8% S. California Calypso Los Angeles 55% 2008 177 S. California Forty 55 Lofts Los Angeles 55% 2010 140 S. California Gallery at NoHo Commons Los Angeles 55% 2008 438 S. California San Sebastian Los Angeles 55% 2010 134 S. California Total 889 10% Texas Allegro Addison Circle Dallas 100% 2010 393 Texas Briar Forest Lofts Houston 55% 2008 352 Texas Eclipse Houston 55% 2009 330 Texas Fitzhugh Urban Flats Dallas 55% 2008 452 Texas Grand Reserve Dallas 74% 2009 149 Texas Uptown Post Oak Houston 100% 2008 392 Texas Total 2,068 20% Total 2009 9,153 |
|
|
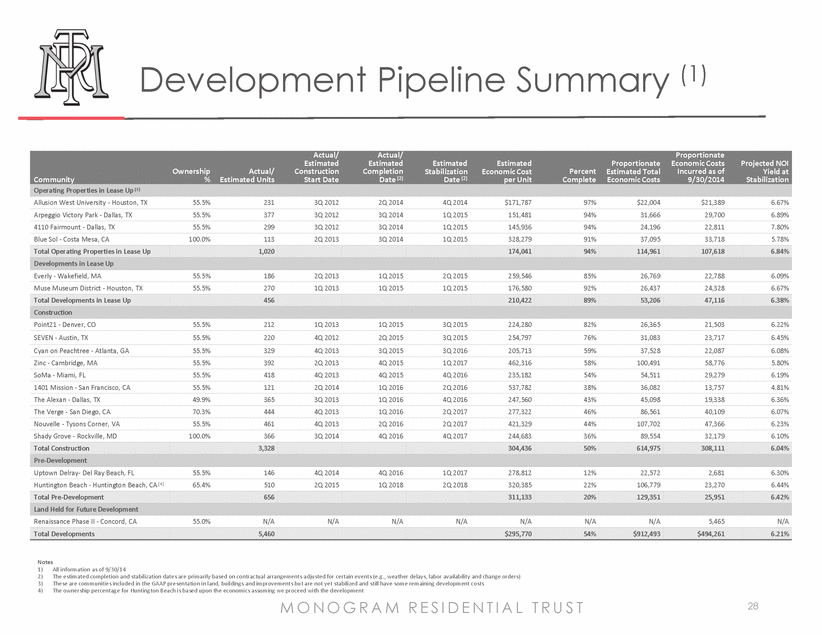
28 Development Pipeline Summary (1) 28 Community Ownership % Actual/ Estimated Units Actual/ Estimated Construction Start Date Actual/ Estimated Completion Date (2) Estimated Stabilization Date (2) Estimated Economic Cost per Unit Percent Complete Proportionate Estimated Total Economic Costs Proportionate Economic Costs Incurred as of 9/30/2014 Projected NOI Yield at Stabilization Operating Properties in Lease Up (3) Allusion West University - Houston, TX 55.5% 231 3Q 2012 2Q 2014 4Q 2014 $171,787 97% $22,004 $21,389 6.67% Arpeggio Victory Park - Dallas, TX 55.5% 377 3Q 2012 3Q 2014 1Q 2015 151,481 94% 31,666 29,700 6.89% 4110 Fairmount - Dallas, TX 55.5% 299 3Q 2012 3Q 2014 1Q 2015 145,936 94% 24,196 22,811 7.80% Blue Sol - Costa Mesa, CA 100.0% 113 2Q 2013 3Q 2014 1Q 2015 328,279 91% 37,095 33,718 5.78% Total Operating Properties in Lease Up 1,020 174,041 94% 114,961 107,618 6.84% Developments in Lease Up Everly - Wakefield, MA 55.5% 186 2Q 2013 1Q 2015 2Q 2015 259,546 85% 26,769 22,788 6.09% Muse Museum District - Houston, TX 55.5% 270 1Q 2013 1Q 2015 1Q 2015 176,580 92% 26,437 24,328 6.67% Total Developments in Lease Up 456 210,422 89% 53,206 47,116 6.38% Construction Point21 - Denver, CO 55.5% 212 1Q 2013 1Q 2015 3Q 2015 224,280 82% 26,365 21,503 6.22% SEVEN - Austin, TX 55.5% 220 4Q 2012 2Q 2015 3Q 2015 254,797 76% 31,083 23,717 6.45% Cyan on Peachtree - Atlanta, GA 55.5% 329 4Q 2013 3Q 2015 3Q 2016 205,713 59% 37,528 22,087 6.08% Zinc - Cambridge, MA 55.5% 392 2Q 2013 4Q 2015 1Q 2017 462,316 58% 100,491 58,776 5.80% SoMa - Miami, FL 55.5% 418 4Q 2013 4Q 2015 4Q 2016 235,182 54% 54,511 29,279 6.19% 1401 Mission - San Francisco, CA 55.5% 121 2Q 2014 1Q 2016 2Q 2016 537,782 38% 36,082 13,757 4.81% The Alexan - Dallas, TX 49.9% 365 3Q 2013 1Q 2016 4Q 2016 247,560 43% 45,098 19,338 6.36% The Verge - San Diego, CA 70.3% 444 4Q 2013 1Q 2016 2Q 2017 277,322 46% 86,561 40,109 6.07% Nouvelle - Tysons Corner, VA 55.5% 461 4Q 2013 2Q 2016 2Q 2017 421,329 44% 107,702 47,366 6.23% Shady Grove - Rockville, MD 100.0% 366 3Q 2014 4Q 2016 4Q 2017 244,683 36% 89,554 32,179 6.10% Total Construction 3,328 304,436 50% 614,975 308,111 6.04% Pre-Development Uptown Delray- Del Ray Beach, FL 55.5% 146 4Q 2014 4Q 2016 1Q 2017 278,812 12% 22,572 2,681 6.30% Huntington Beach - Huntington Beach, CA (4) 65.4% 510 2Q 2015 1Q 2018 2Q 2018 320,385 22% 106,779 23,270 6.44% Total Pre-Development 656 311,133 20% 129,351 25,951 6.42% Land Held for Future Development Renaissance Phase II - Concord, CA 55.0% N/A N/A N/A N/A N/A N/A N/A 5,465 N/A Total Developments 5,460 $295,770 54% $912,493 $494,261 6.21% Notes 1) All information as of 9/30/14 2) The estimated completion and stabilization dates are primarily based on contractual arrangements adjusted for certain events (e.g., weather delays, labor availability and change orders) 3) These are communities included in the GAAP presentation in land, buildings and improvements but are not yet stabilized and still have some remaining development costs 4) The ownership percentage for Huntington Beach is based upon the economics assuming we proceed with the development MONOGRAM R E S IDENT IAL T R U S T |
|
|
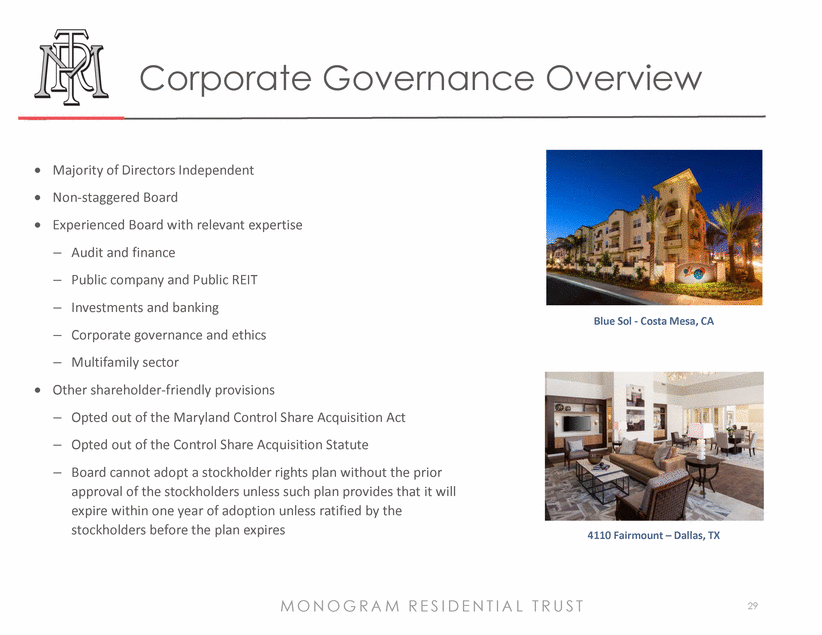
29 Corporate Governance Overview MONOGRAM R E S IDENT IAL T R U S T 29 · Majority of Directors Independent · Non-staggered Board · Experienced Board with relevant expertise – Audit and finance – Public company and Public REIT – Investments and banking – Corporate governance and ethics – Multifamily sector · Other shareholder-friendly provisions – Opted out of the Maryland Control Share Acquisition Act – Opted out of the Control Share Acquisition Statute – Board cannot adopt a stockholder rights plan without the prior approval of the stockholders unless such plan provides that it will expire within one year of adoption unless ratified by the stockholders before the plan expires Blue Sol - Costa Mesa, CA 4110 Fairmount – Dallas, TX |

