Attached files
| file | filename |
|---|---|
| EXCEL - IDEA: XBRL DOCUMENT - Meet Group, Inc. | Financial_Report.xls |
| EX-31 - EXHIBIT 31.2 - Meet Group, Inc. | ex31-2.htm |
| EX-32 - EXHIBIT 32.2 - Meet Group, Inc. | ex32-2.htm |
| EX-31 - EXHIBIT 31.1 - Meet Group, Inc. | ex31-1.htm |
| EX-32 - EXHIBIT 32.1 - Meet Group, Inc. | ex32-1.htm |
UNITED STATES
SECURITIES AND EXCHANGE COMMISSION
WASHINGTON, D.C. 20549
FORM 10-Q
|
☒ |
QUARTERLY REPORT PURSUANT TO SECTION 13 OR 15(d) OF THE |
|
|
|
SECURITIES EXCHANGE ACT OF 1934 |
|
|
|
|
|
|
|
For the quarterly period ended September 30, 2014 |
|
|
|
|
|
|
|
OR |
|
|
|
|
|
|
☐ |
TRANSITION REPORT PURSUANT TO SECTION 13 OR 15(d) OF THE |
|
|
|
SECURITIES EXCHANGE ACT OF 1934 |
|
For the transition period from to
Commission file number: 001-33105
MeetMe, Inc.
(Exact name of registrant as specified in its charter)
|
Delaware |
86-0879433 |
|
(State or other jurisdiction of |
(I.R.S. Employer |
|
incorporation or organization) |
Identification No.) |
|
|
|
|
100 Union Square Drive |
|
|
New Hope, Pennsylvania |
18938 |
|
(Address of principal executive offices) |
(Zip Code) |
Registrants telephone number: (215) 862-1162
Indicate by check mark whether the registrant (1) has filed all reports required to be filed by Section 13 or 15(d) of the Securities Exchange Act of 1934 during the preceding 12 months (or for such shorter period that the registrant was required to file such reports), and (2) has been subject to such filing requirements for the past 90 days.
Yes ☒ No ☐
Indicate by check mark whether the registrant has submitted electronically and posted on its corporate Web site, if any, every Interactive Data File required to be submitted and posted pursuant to Rule 405 of Regulation S-T during the preceding 12 months (or for such shorter period that the registrant was required to submit and post such files).
Yes ☒ No ☐
Indicate by check mark whether the registrant is a large accelerated filer, an accelerated filer, a non-accelerated filer or a smaller reporting company. See the definitions of “large accelerated filer,” “accelerated filer” and “smaller reporting company” in Rule 12b-2 of the Exchange Act.
|
Large accelerated filer ☐ |
|
Accelerated filer ☐ |
|
|
|
|
|
Non-accelerated filer ☐ (Do not check if a smaller reporting company) |
|
Smaller reporting company ☒ |
Indicate by check mark whether the registrant is a shell company (as defined in Rule 12b-2 of the Exchange Act).
Yes ☐ No ☒
|
Class |
|
Outstanding as of November 10, 2014 |
|
Common Stock, $0.001 par value per share |
|
44,879,034 shares |
MEETME, INC. AND SUBSIDIARIES
INDEX
|
|
Page |
|
|
|
|
PART I. FINANCIAL INFORMATION |
3 |
|
Item 1 Financial Statements |
3 |
|
Condensed Consolidated Balance Sheets as of September 30, 2014 (Unaudited) and December 31, 2013 |
3 |
|
Condensed Consolidated Statements of Operations and Comprehensive Loss (Unaudited) for the three months and the nine months ended September 30, 2014 and 2013 |
4 |
|
Condensed Consolidated Statement of Changes in Stockholders’ Equity (Unaudited) for the nine months ended September 30, 2014 |
5 |
|
Condensed Consolidated Statements of Cash Flows (Unaudited) for the nine months ended September 30, 2014 and 2013 |
6 |
|
Notes to Condensed Consolidated Financial Statements |
7 |
|
Item 2 Management’s Discussion and Analysis of Financial Condition and Results of Operations |
22 |
|
Item 3 Quantitative and Qualitative Disclosures about Market Risk |
32 |
|
Item 4 Controls and Procedures |
33 |
|
PART II. OTHER INFORMATION |
33 |
|
Item 1 Legal Proceedings |
33 |
|
Item 1A Risk Factors |
33 |
|
Item 2 Unregistered Sales of Equity Securities and Use of Proceeds |
33 |
|
Item 3 Defaults Upon Senior Securities |
33 |
|
Item 4 Mine Safety Disclosures |
34 |
|
Item 5 Other Information |
34 |
|
Item 6 Exhibits |
35 |
|
SIGNATURES |
36 |
|
CERTIFICATIONS |
|
|
INDEX TO EXHIBITS |
37 |
PART I. FINANCIAL INFORMATION
Item 1. Financial Statements
MEETME, INC. AND SUBSIDIARIES
Condensed Consolidated Balance Sheets
|
(Unaudited) |
||||||||
|
September 30, 2014 |
December 31, 2013 |
|||||||
|
ASSETS |
||||||||
|
CURRENT ASSETS: |
||||||||
|
Cash and cash equivalents |
$ | 15,597,966 | $ | 6,330,532 | ||||
|
Accounts receivable, net of allowance of $611,000 and $495,000, at September 30, 2014 and December 31, 2013, respectively. |
8,013,051 | 10,136,929 | ||||||
|
Prepaid expenses and other current assets |
844,033 | 597,133 | ||||||
|
Total current assets |
24,455,050 | 17,064,594 | ||||||
|
Goodwill |
70,646,036 | 70,646,036 | ||||||
|
Property and equipment, net |
1,798,600 | 2,871,800 | ||||||
|
Intangible assets, net |
3,319,191 | 4,787,941 | ||||||
|
Other assets |
272,793 | 205,869 | ||||||
|
Total assets |
$ | 100,491,670 | $ | 95,576,240 | ||||
|
LIABILITIES AND STOCKHOLDERS' EQUITY |
||||||||
|
CURRENT LIABILITIES: |
||||||||
|
Accounts payable |
$ | 2,166,568 | $ | 3,331,484 | ||||
|
Accrued liabilities |
2,770,973 | 3,262,327 | ||||||
|
Current portion of capital lease obligations |
831,312 | 928,181 | ||||||
|
Current portion of long-term debt |
2,012,313 | 2,333,966 | ||||||
|
Deferred revenue |
213,111 | 275,761 | ||||||
|
Total current liabilities |
7,994,277 | 10,131,719 | ||||||
|
Long-term capital lease obligation, less current portion, net |
275,539 | 713,699 | ||||||
|
Long-term debt, less current portion, net |
1,018,948 | 2,102,842 | ||||||
|
Other liabilities |
562,568 | 819,930 | ||||||
|
Total liabilities |
9,851,332 | 13,768,190 | ||||||
|
COMMITMENTS AND CONTINGENCIES (Note 8) |
||||||||
|
STOCKHOLDERS' EQUITY: |
||||||||
|
Preferred stock, $.001 par value; authorized - 5,000,000 Shares: Convertible Preferred Stock Series A-1, $.001 par value; authorized - 1,000,000 shares; 1,000,000 shares issued and outstanding at September 30, 2014 and December 31, 2013, respectively |
1,000 | 1,000 | ||||||
|
Common stock, $.001 par value; authorized - 100,000,000 Shares; 44,872,867 and 38,477,359 shares issued and outstanding at June 30, 2014 and December 31, 2013, respectively |
44,877 | 38,481 | ||||||
|
Additional paid-in capital |
296,166,091 | 282,496,996 | ||||||
|
Accumulated deficit |
(204,919,163 |
) |
(200,110,075 |
) | ||||
|
Accumulated other comprehensive loss |
(652,467 |
) |
(618,352 |
) | ||||
|
Total stockholders' equity |
90,640,338 | 81,808,050 | ||||||
|
Total liabilities and stockholders' equity |
$ | 100,491,670 | $ | 95,576,240 | ||||
See accompanying notes to condensed consolidated financial statements.
MEETME, INC. AND SUBSIDIARIES
Condensed Consolidated Statements of Operations and Comprehensive Loss (Unaudited)
|
For the Three Months Ended September 30, |
For the Nine Months Ended September 30, |
|||||||||||||||
|
2014 |
2013 |
2014 |
2013 |
|||||||||||||
|
Revenues |
$ | 11,604,724 | $ | 10,073,309 | $ | 31,795,558 | $ | 27,361,901 | ||||||||
|
Operating Costs and Expenses: |
||||||||||||||||
|
Sales and marketing |
1,516,547 | 1,876,240 | 5,611,313 | 5,405,910 | ||||||||||||
|
Product development and content |
7,021,353 | 6,817,591 | 20,734,532 | 19,543,611 | ||||||||||||
|
General and administrative |
1,932,161 | 1,536,939 | 6,055,944 | 5,759,498 | ||||||||||||
|
Depreciation and amortization |
1,135,263 | 1,108,856 | 3,300,654 | 3,280,843 | ||||||||||||
|
Restructuring costs |
- | - | 120,202 | 2,540,896 | ||||||||||||
|
Loss on debt restructure |
- | - | - | 1,174,269 | ||||||||||||
|
Total Operating Costs and Expenses |
11,605,324 | 11,339,626 | 35,822,645 | 37,705,027 | ||||||||||||
|
Loss from Operations |
(600 |
) |
(1,266,317 |
) |
(4,027,087 |
) |
(10,343,126 |
) | ||||||||
|
Other Income (Expense): |
||||||||||||||||
|
Interest income |
2,679 | 2,503 | 4,394 | 7,856 | ||||||||||||
|
Interest expense |
(206,980 |
) |
(222,777 | ) | (868,866 |
) |
(578,345 |
) | ||||||||
|
Change in warrant liability |
256,932 | - | 82,471 | - | ||||||||||||
|
Total Other Income (Expense) |
52,631 | (220,274 | ) | (782,001 |
) |
(570,489 |
) | |||||||||
|
Income (Loss) before Income Taxes |
52,031 | (1,486,591 |
) |
(4,809,088 |
) |
(10,913,615 |
) | |||||||||
|
Income taxes |
- | - | - | - | ||||||||||||
|
Net Income (Loss) |
$ | 52,031 | $ | (1,486,591 |
) |
$ | (4,809,088 |
) |
$ | (10,913,615 |
) | |||||
|
Preferred stock dividends |
- | - | - | - | ||||||||||||
|
Net income (loss) attributable to Common Stockholders |
$ | 52,031 | $ | (1,486,591 |
) |
$ | (4,809,088 |
) |
$ | (10,913,615 |
) | |||||
|
Net income (loss) per share attributable to Common Stockholders |
||||||||||||||||
|
Basic |
$ | 0.00 | $ | (0.04 |
) |
$ | (0.12 |
) |
$ | (0.29 |
) | |||||
|
Diluted |
$ | 0.00 | $ | (0.04 |
) |
$ | (0.12 |
) |
$ | (0.29 |
) | |||||
|
WEIGHTED AVERAGE NUMBER OF SHARES OUTSTANDING |
||||||||||||||||
|
BASIC |
43,092,803 | 38,207,141 | 40,131,955 | 37,903,904 | ||||||||||||
|
DILUTED |
43,092,803 | 38,207,141 | 40,131,955 | 37,903,904 | ||||||||||||
|
Net Income (Loss) |
$ | 52,031 | $ | (1,486,591 |
) |
$ | (4,809,088 |
) |
$ | (10,913,615 |
) | |||||
|
Foreign currency translation adjustment |
(74,389 |
) |
1,473 | (34,115 |
) |
(26,941 |
) | |||||||||
|
Comprehensive Loss |
$ | (22,358 |
) |
$ | (1,485,118 |
) |
$ | (4,843,203 |
) |
$ | (10,940,556 |
) | ||||
See accompanying notes to condensed consolidated financial statements.
MEETME, INC. AND SUBSIDIARIES
Condensed Consolidated Statement of Changes in Stockholders’ Equity (Unaudited)
For the Nine Months Ended September 30, 2014
|
Accumulated |
||||||||||||||||||||||||||||||||
|
Additional |
Other |
Total |
||||||||||||||||||||||||||||||
|
Preferred Stock |
Common Stock |
Paid-in |
Accumulated |
Comprehensive |
Stockholders' |
|||||||||||||||||||||||||||
|
Shares |
Amount |
Shares |
Amount |
Capital |
Deficit |
Loss |
Equity |
|||||||||||||||||||||||||
|
Balance—December 31, 2013 |
1,000,000 | $ | 1,000 | 38,477,359 | $ | 38,481 | $ | 282,496,996 | $ | (200,110,075 |
) |
$ | (618,352 |
) |
$ | 81,808,050 | ||||||||||||||||
|
Vesting of stock options for compensation |
- | - | - | - | 2,930,574 | - | - | 2,930,574 | ||||||||||||||||||||||||
|
Exercise of warrants |
- | - | 89,230 | 89 | 174,802 | - | - | 174,891 | ||||||||||||||||||||||||
|
Issuance of Common Stock |
- | - | 5,750,000 | 5,750 | 10,561,059 | - | - | 10,566,809 | ||||||||||||||||||||||||
|
Issuance of common stock for vested restricted stock awards |
- | - | 556,475 | 557 | (557 |
) |
- | - | - | |||||||||||||||||||||||
|
Exercise of stock options |
- | - | 1,667 | 2 | 3,215 | - | - | 3,217 | ||||||||||||||||||||||||
|
Cancellation of common stock |
- | - | (1,864 |
) |
(2 |
) |
2 | - | - | - | ||||||||||||||||||||||
|
Foreign currency translation adjustment |
- | - | - | - | - | - | (34,115 |
) |
(34,115 |
) | ||||||||||||||||||||||
|
Net loss |
- | - | - | - | - | (4,809,088 |
) |
- | (4,809,088 |
) | ||||||||||||||||||||||
|
Balance—September 30, 2014 |
1,000,000 | $ | 1,000 | 44,872,867 | $ | 44,877 | $ | 296,166,091 | $ | (204,919,163 |
) |
$ | (652,467 |
) |
$ | 90,640,338 | ||||||||||||||||
See notes to condensed consolidated financial statements.
MEETME, INC. AND SUBSIDIARIES
Condensed Consolidated Statements of Cash Flows (Unaudited)
|
For the Nine Months Ended September 30, |
||||||||
|
2014 |
2013 |
|||||||
|
Cash flows from operating activities: |
||||||||
|
Net loss |
$ | (4,809,088 |
) |
$ | (10,913,615 |
) | ||
|
Adjustments to reconcile net loss to net cash provided by operating activities: |
||||||||
|
Depreciation and amortization |
3,300,655 | 3,280,843 | ||||||
|
Stock based compensation |
2,930,575 | 2,761,566 | ||||||
|
Loss on debt restructure |
- | 1,066,765 | ||||||
|
Bad debt expense (recovery) |
116,000 | (90,000 |
) | |||||
|
Amortization of discounts on notes payable and debt issuance costs |
445,867 | 80,332 | ||||||
|
Revaluation of Warrant Liability |
(82,471 |
) |
- | |||||
|
Changes in operating assets and liabilities: |
||||||||
|
Accounts receivable - trade |
2,000,539 | 2,426,771 | ||||||
|
Prepaid expenses, other current assets, and other assets |
(314,278 |
) |
650,190 | |||||
|
Accounts payable and accrued expenses |
(1,657,410 |
) |
958,364 | |||||
|
Deferred revenue |
(62,650 |
) |
491,762 | |||||
|
Net cash provided by operating activities |
1,867,739 | 712,978 | ||||||
|
Cash flows from investing activities: |
||||||||
|
Purchase of property and equipment |
(590,385 |
) |
(128,515 | ) | ||||
|
Loan payments received from BRC |
- | 111,569 | ||||||
|
Net cash used in investing activities |
(590,385 |
) |
(16,946 |
) | ||||
|
Cash flows from financing activities: |
||||||||
|
Proceeds from exercise of stock options and warrants |
- | 122,686 | ||||||
|
Proceeds from issuance of common stock |
10,572,559 | - | ||||||
|
Proceeds from the issuance of debt |
- | 5,000,000 | ||||||
|
Payments of capital leases |
(702,164 |
) |
(566,103 |
) | ||||
|
Payments on long-term debt |
(1,851,413 |
) |
(1,573,906 |
) | ||||
|
Net cash provided by financing activities |
8,018,982 | 2,982,677 | ||||||
|
Effect of foreign currency exchange rate on cash |
(28,902 | ) | (18,475 |
) | ||||
|
Net increase in cash and cash equivalents |
9,267,434 | 3,660,234 | ||||||
|
Cash and cash equivalents at beginning of the period |
6,330,532 | 5,022,007 | ||||||
|
Cash and cash equivalents at end of period |
$ | 15,597,966 | $ | 8,682,241 | ||||
|
Supplemental Disclosure of Cash Flow Information: |
||||||||
|
Cash paid for interest |
$ | 422,661 | $ | 127,486 | ||||
|
Supplemental Disclosure of Non-Cash Investing and Financing Activities: |
||||||||
|
Purchase of property and equipment through capital leases |
$ | 167,354 | $ | 498,659 | ||||
|
Subordinated note payable and accounts receivable offset |
$ | - | $ | 6,025,898 | ||||
|
Warrant exercises and subordinated notes payable cancellations |
$ | - | $ | 2,756,210 | ||||
|
Warrant exercise settlement |
$ | 174,891 | $ | - | ||||
|
Issuance of convertible note payable for settlement loss contingency for trademark dispute |
$ | - | $ | 600,000 | ||||
|
Issuance of warrants and valuation discount on debt |
$ | - | $ | 290,748 | ||||
See accompanying notes to condensed consolidated financial statements.
Notes to the Condensed Consolidated Financial Statements
Note 1—Description of Business, Basis of Presentation and Summary of Significant Accounting Policies
Description of Business
MeetMe, Inc. (the “Company”) is a social network for meeting new people on the web and mobile platforms, including on iPhone, Android, iPad and other tablets, that facilitates interactions among users and encourages users to connect with each other. The Company monetizes through advertising, virtual currency, and paid subscriptions. The Company offers online marketing capabilities, which enable marketers to display their advertisements in different formats and in different locations. The Company works with its advertisers to maximize the effectiveness of their campaigns by optimizing advertisement formats and placement.
Just as Facebook has established itself as the social network of friends and family, and LinkedIn as the social network of colleagues and business professionals, the Company is creating the social network not of the people you know but of the people you want to know. The Company believes meeting new people is a basic human need, especially for users aged 18-30, when so many long-lasting relationships are made. There are more than one billion people aged 18-30 worldwide with more than 50 million such people in the United States.
The Company believes that it has significant growth opportunities as people increasingly use their mobile devices to discover the people around them. Given the importance of establishing connections within a user’s geographic proximity, the Company believes it is critical to establish a high density of users within the geographic regions it serves. As the Company’s network grows the number of users in a location, the Company believes users who are seeking to meet new people will incrementally benefit from the quantity of relevant connections.
Basis of Presentation
The Company’s unaudited condensed consolidated financial statements are prepared in accordance with accounting principles generally accepted in the U.S. (“GAAP”). The consolidated financial statements include the accounts of the Company and its wholly-owned subsidiaries, Quepasa.com de Mexico, Quepasa Serviços em Solucoes de Publicidade E Tecnologia Ltda (inactive) and MeetMe Online S/S Ltda. All intercompany accounts and transactions have been eliminated in consolidation.
Unaudited Interim Financial Information
The unaudited condensed consolidated financial statements have been prepared by the Company and reflect all normal, recurring adjustments that, in the opinion of management, are necessary for a fair presentation of the interim financial information. The results of operations for the interim periods presented are not necessarily indicative of the results to be expected for any subsequent quarter or for the year ending December 31, 2014. Certain information and footnote disclosures normally included in financial statements prepared in accordance with GAAP have been condensed or omitted under the rules and regulations of the Securities and Exchange Commission (“SEC”). These unaudited condensed consolidated financial statements and notes included herein should be read in conjunction with the audited consolidated financial statements and notes included in the Company's Annual Report on Form 10-K for the year ended December 31, 2013, filed with the SEC on March 25, 2014.
Use of Estimates
The preparation of the Company’s consolidated financial statements in conformity with GAAP requires the Company to make estimates and assumptions that affect the reported amounts of assets and liabilities and disclosure of contingent assets and liabilities at the date of the unaudited condensed consolidated financial statements, as well as the reported amounts of revenues and expenses during the reporting period. Significant estimates and assumptions are required in the determination of revenue recognition, the allowance on accounts receivables, the fair value of financial instruments, the valuation of long-lived and indefinite-lived assets, and valuation of deferred tax assets, income taxes, contingencies and stock-based compensation. Some of these judgments can be subjective and complex, and, consequently, actual results may differ from these estimates.
Revenue Recognition
The Company recognizes revenue when persuasive evidence of an arrangement exists, delivery has occurred or services have been rendered, the purchase price is fixed or determinable and collectability is reasonably assured. The Company recognizes revenue in accordance with ASC 605, “Revenue Recognition,” and ASC 605-45, “Principal Agent Considerations.”
During the nine months ended September 30, 2014 and 2013, the Company had transactions with several parties that qualify for principal agent considerations. The Company recognizes revenue net of amounts retained by third party entities, pursuant to revenue sharing agreements with advertising networks for advertising and with other partners for royalties on product sales.
During the nine months ended September 30, 2014 and 2013, the Company’s revenue was generated from two principal sources: sales of advertising and virtual currency products, including subscriptions, on the Company’s website and mobile applications.
Advertising Revenue
Advertising and custom sponsorship revenues consist primarily of advertising fees earned from the display of advertisements and click-throughs on text based links on the Company’s website and mobile applications. Revenue from online advertising is recognized as calls are placed to either Beanstock Media or Pinsight Media, both of which are discussed below. Revenue from the display of click-throughs on text based links is recognized as click-throughs occur. The Company recognizes advertising revenue from customers that are advertising networks on a net basis, while advertising revenues earned directly from advertisers are recognized on a gross basis. Approximately 77% and 70% of the Company’s revenue came from advertising during the nine months ended September 30, 2014 and 2013, respectively.
Virtual Currency Products
Revenue is earned from virtual currency monetization products sold to our website and mobile application users. Users buy Credits to purchase the Company’s virtual products which put them in the spotlight, helping to get more attention from the community and thereby meet more people faster. These virtual products are consumed immediately. Credits can be purchased using PayPal on the website and iTunes and Google checkout via mobile applications. Users do not own the Credits but have a limited right to use the Credits on virtual products offered for sale on the Company’s platform. Credits are non-refundable, the Company may change the purchase price of Credits at any time, and the Company reserves the right to stop issuing Credits in the future. The Company’s virtual currencies are not transferable, cannot be sold, exchanged, or redeemed for any sum of money, and can only be used for virtual products sold on the Company’ platform.
Virtual currency is recorded in deferred revenue when purchased and recognized as revenue when: (i) the Credits are used by the customer; or (ii) the Company determines the likelihood of the Credits being redeemed by the user is remote (breakage) and there is not a legal obligation to remit the unredeemed Credits to the relevant jurisdiction. The determination of the virtual currency breakage rate is based upon Company-specific historical redemption patterns. Virtual currency breakage is recognized in revenue as the Credits are used on a pro rata basis over a three month period (life of the user) beginning at the date of the virtual currency sale and is included in revenue in the consolidated statement of operations and comprehensive loss. Breakage recognized during the nine months ended September 30, 2014 and 2013 was $708,000 and $0, respectively. For “VIP” and other subscription based products, the Company recognizes revenue over the term of the subscription.
The Company also earns revenue from currency engagement actions (i.e. sponsored engagement advertising) by users on the Company’s platforms, including cost-per-action (CPA) currency incented promotions and sales of our proprietary cross-platform currency monetization product, “Social Theater.” The Company recognizes the related revenue on a gross basis when collections are reasonably assured and upon delivery of the virtual currency to the users’ account. When a user performs an action, the user earns virtual currency and the Company earns product revenue from the advertiser.
Social Theater is a product that allows the Company to offer advertisers a way to leverage the Facebook platform through guaranteed actions by Facebook’s user base. Social Theater is also hosted on the Company’s platform. Typical guaranteed actions available to advertisers are video views, fan page growth, quizzes and surveys. Social Theater revenue is recognized when persuasive evidence of an arrangement exists, the sales price is fixed or determinable, collectability is reasonably assured, and the service has been rendered. The Social Theater prices are both fixed and determinable based on the contract with the advertiser. The user completes an action and the electronic record of the transaction triggers the revenue recognition. The collection of the Social Theater revenue is reasonably assured by contractual obligation and historical payment performance. The delivery of virtual currency from the hosting platform to a user evidences the completion of the action required by the customer that the service has been rendered for Social Theater revenue recognition.
Beanstock Media Inc.
On September 25, 2013, the Company entered into a Media Publisher Agreement with Beanstock Media, Inc., (“Beanstock”) (the “Beanstock Agreement”). The Beanstock Agreement is effective from September 23, 2013 through December 31, 2015, unless earlier terminated.
Pursuant to the Beanstock Agreement, Beanstock has the exclusive right and obligation to fill all of the Company’s remnant desktop in-page display advertising inventory on www.meetme.com (the “Site”) excluding (i) any inventory sold to a third party under an insertion order that is campaign or advertiser specific, (ii) any inventory the Company reserves in existing and future agreements with third parties for barter transactions and as additional consideration as part of larger business development transactions, and (iii) any inventory reserved for premium advertising for the Site. The Company may also continue to place inventory outside of the Beanstock Agreement in direct sales.
Beanstock will pay for all advertising requests that the Company delivers, whether or not Beanstock fills the advertising request. For the United States, Beanstock will pay the Company specified CPM rates plus a percentage of revenue in excess of those rates; for the rest of the world, Beanstock will pay the Company 90% of its net ad revenue for the Site.
The Company may terminate the Beanstock Agreement at any time without charge or penalty. Either party may terminate the Beanstock Agreement if the other party is in material breach of its obligations and does not cure such breach, or if the other party files a petition for bankruptcy, becomes insolvent, makes an assignment for the benefit of its creditors, or a receiver is appointed for such party or its business. For the nine months ended September 30, 2014, the Company recognized approximately $7,694,000 in revenue under the terms of the Beanstock Agreement.
Pinsight Media+, Inc.
On October 31, 2013, the Company entered into an Advertising Agreement with Pinsight Media+, Inc. (“Pinsight”), which the parties amended on January 30, 2014 and on May 13, 2014 (the “Pinsight Agreement”). The Pinsight Agreement is effective from October 31, 2013 through December 31, 2014, unless earlier terminated. Pursuant to the Pinsight Agreement, Pinsight has the right and obligation to fill all of the Company’s advertising inventory on its MeetMe mobile app for iOS and Android (the “App”). The Pinsight Agreement does not apply to other mobile apps or virtual currency features on the App, including without limitation offer wall features and the Company’s Social Theater business. The Pinsight Agreement contemplates that the Company will make certain specified changes to its existing ad logic on the App. If the Company wishes to increase the number, type, frequency or scope of impressions on the App (“Additional Inventory”), it must first notify Pinsight and upon Pinsight’s written consent, said Additional Inventory will become subject to the Pinsight Agreement.
Pursuant to the Pinsight Agreement, Pinsight will pay for all ad requests that the Company delivers, whether or not Pinsight fills the ad request. Pinsight will pay specified CPM rates depending on the type of advertising; provided, however, that if more than a stated percentage of all page views on the App originate outside of the United States, then Pinsight will remit to the Company a percentage of gross revenue relating to international advertising impressions in excess of such amount. The stated CPM rates for certain advertising are subject to renegotiation under certain conditions; in such case, if the parties do not agree on a modified rate, then such advertising will be excluded from the Pinsight Agreement.
The Company may terminate the Pinsight Agreement if (i) Pinsight fails to pay any undisputed amount in a timely fashion, or (ii) in the Company’s sole discretion, Pinsight’s software development kit and those of its performance partners and the placement and running of advertising on the App causes a diminution in the App user experience. Either party may terminate the Pinsight Agreement (a) for the other party’s violation of confidentiality provisions, (b) if the other party files a petition for bankruptcy, becomes insolvent, makes an assignment for the benefit of its creditors, or a receiver is appointed for such other party or its business, or (c) for Cause. In the event of a termination for Cause, the terminating party will be entitled to liquidated damages. “Cause” means (i) the other party’s material breach if the breaching party does not cure said breach to the reasonable satisfaction of the non-breaching party within thirty days (or, if the breach cannot reasonably be cured within thirty days, does not commence a cure thereof to the reasonable satisfaction of the non-breaching party), (ii) the other party’s willful failure to perform under the Pinsight Agreement, including without limitation with respect to the payment for advertising, (iii) the other party communicates its intention (verbally or in writing) to discontinue performance thereunder (whether or not said party actually discontinues performance thereunder), unless, after inquiry by the first party, a Vice President (or his designee) of said other party affirms in writing within one business day that said party intends to continue performing thereunder, (iv) the other party attempts to terminate the Pinsight Agreement for convenience or for a reason not specifically set forth in the Pinsight Agreement, or (v) the other party ceases to do business or notifies the other party of its intention to cease doing business prior to the end of the term hereof. For the nine months ended September 30, 2014, the Company recognized approximately $13,285,000 in revenue under the terms of the Pinsight Agreement.
Fair Value Measurements
The fair values of the Company’s financial instruments reflect the amounts that would be received to sell an asset or paid to transfer a liability in an orderly transaction between market participants at the measurement date (exit price).
The Company’s financial instruments not required to be adjusted to fair value on a recurring basis consist principally of cash and cash equivalents, accounts receivable, accounts payable, accrued liabilities and deferred revenue. The carrying amounts approximate fair value due to their short maturities. Amounts recorded for subordinated notes payable, net of discount, and loans payable also approximate fair value because current interest rates available to the Company for debt with similar terms and maturities are substantially the same. Certain common stock warrants are carried at fair value as disclosed below. The Company has evaluated the estimated fair value of financial instruments using available market information and management's estimates. The use of different market assumptions and/or estimation methodologies could have a significant effect on the estimated fair value amounts.
Foreign Currency
The functional currency of our foreign subsidiaries is the local currency. The financial statements of these subsidiaries are translated to U.S. dollars using period-end rates of exchange for assets and liabilities and average quarterly rates of exchange for revenues and expenses. Translation gains (losses) are recorded in accumulated other comprehensive loss as a component of stockholders’ equity. Net gains and losses resulting from foreign exchange transactions are included in other income (expense).
Significant Customers and Concentration of Credit Risk
Financial instruments that potentially subject the Company to significant concentrations of credit risk consist primarily of cash equivalents and accounts receivable. The Company invests its excess cash in high-quality, liquid money market instruments maintained by major U.S. banks and financial institutions. The Company has not experienced any losses on its cash equivalents.
The Company performs ongoing credit evaluations of its customers and generally does not require collateral. The Company has no history of significant losses from uncollectible accounts. During the nine months ended September 30, 2014 and 2013, two customers comprised approximately 66% and 34% of total revenues, respectively. Two customers comprised 65% and 32% of total accounts receivable as of September 30, 2014 and December 31, 2013, respectively.
The Company does not expect its current or future credit risk exposures to have a significant impact on its operations. However, there can be no assurance that the Company’s business will not experience adverse impact from credit risk in the future.
Product Development and Content Costs
Product development and content costs, includes salaries, benefits, and stock-based compensation, utility charges, occupancy and support for our offsite technology infrastructure, bandwidth and content delivery fees, and internet development and maintenance costs, and are charged to expense as incurred.
Stock-Based Compensation
The fair value of share-based payments are estimated on the date of grant using the Black-Scholes option pricing model, based on weighted average assumptions. Expected volatility is based on historical volatility of our common stock. The Company has elected to use the simplified method described in the SEC Staff Accounting Bulletin Topic 14C to estimate the expected term of employee stock options. The risk-free rate is based on the U.S. Treasury yield curve in effect at the time of grant. Compensation expense is recognized on a straight-line basis over the requisite service period of the award.
Comprehensive Loss
Comprehensive loss consists of foreign currency translation adjustments which are added to net loss to compute total comprehensive loss. Comprehensive loss includes all changes in stockholders’ equity during a period from non-owner sources.
Contingencies
The Company accrues for contingent obligations, including legal costs and restructuring costs, when the obligation is probable and the amount can be reasonably estimated. As facts concerning contingencies become known the Company will reassess its position and make appropriate adjustments to the consolidated financial statements. Estimates that are particularly sensitive to future changes include those related to tax, legal, and other regulatory matters that are subject to change as events evolve and additional information becomes available.
Recent Issued Accounting Standards
In May 2014, the Financial Accounting Standards Board (the “FASB”) issued Accounting Standards Update (“ASU”) No. 2014-09, Revenue from Contracts with Customers (“ASU 2014-09”). The objective of ASU 2014-09 is to establish a single comprehensive model for entities to use in accounting for revenue arising from contracts with customers and supersedes most of the existing revenue recognition guidance, including industry-specific guidance. The core principle of ASU 2014-09 is that an entity recognizes revenue to depict the transfer of promised goods or services to customers in an amount that reflects the consideration to which the entity expects to be entitled in exchange for those goods or services. In applying the new guidance, an entity will (1) identify the contract(s) with a customer; (2) identify the performance obligations in the contract; (3) determine the transaction price; (4) allocate the transaction price to the contract’s performance obligations; and (5) recognize revenue when (or as) the entity satisfies a performance obligation. ASU 2014-09 applies to all contracts with customers except those that are within the scope of other topics in the FASB Accounting Standards Codification. The new guidance is effective for annual reporting periods (including interim periods within those periods) beginning after December 15, 2016 for public companies. Early adoption is not permitted. Entities have the option of using either a full retrospective or modified approach to adopt ASU 2014-09. The Company is currently evaluating the new guidance and has not determined the impact this standard may have on its consolidated financial statements nor decided upon the method of adoption.
In June 2014, the FASB issued ASU No. 2014-12, Compensation-Stock Compensation (Topic 718): Accounting for Share-Based Payments When the Terms of an Award Provide That a Performance Target Could Be Achieved after the Requisite Service Period (“ASU 2014-12”). ASU 2014-12 is effective for annual periods and interim periods within those annual periods beginning after December 15, 2015. The Company is currently evaluating the impact that the adoption of this guidance will have on its financial position, results of operations, comprehensive income, cash flows and/or disclosures.
Note 2— Net Income (Loss) per Share
Basic net income (loss) per share is computed using the weighted average number of outstanding shares of common stock. Diluted net income (loss) per share is computed using the weighted average number of outstanding shares of common stock and, when dilutive, shares of common stock issuable upon exercise of options and warrants deemed outstanding using the treasury stock method.
The following table shows the computation of basic and diluted income (loss) per share for the following:
|
For the Three Months Ended September 30, |
For the Nine Months Ended September 30, |
|||||||||||||||
|
2014 |
2013 |
2014 |
2013 |
|||||||||||||
|
Numerator: |
||||||||||||||||
|
Net income (loss) for basic earnings per share |
$ | 52,031 | $ | (1,486,591 |
) |
$ | (4,809,088 |
) |
$ | (10,913,615 |
) | |||||
| Change in fair value of warrant liability | 256,932 | 0 | 0 | 0 | ||||||||||||
| Net loss for diluted earnings per share | $ | (204,901 | ) | $ | (1,486,591 | ) | $ | (4,809,088 | ) | $ | (10,913,615 | ) | ||||
|
Denominator: |
||||||||||||||||
|
Weighted-average shares outstanding |
43,092,803 | 38,207,141 | 40,131,955 | 37,903,904 | ||||||||||||
|
Basic income (loss) per share |
$ | 0.00 | $ | (0.04 |
) |
$ | (0.12 |
) |
$ | (0.29 |
) | |||||
|
Diluted income (loss) per share |
$ | 0.00 | $ | (0.04 |
) |
$ | (0.12 |
) |
$ | (0.29 |
) | |||||
For the three and nine months ended September 30, 2014, and 2013, outstanding stock options and warrants to purchase shares of common stock in an aggregate of 6,876,477 and 13,416,149 shares, respectively, have been excluded from the calculation of diluted net income (loss) per share as all such securities were anti-dilutive.
Note 3 - Fair Value Measurements
ASC Topic 820, Fair Value Measurement (“ASU 820”), establishes a fair value hierarchy for instruments measured at fair value that distinguishes between assumptions based on market data (observable inputs) and the Company's own assumptions (unobservable inputs). Observable inputs are inputs that market participants would use in pricing the asset or liability based on market data obtained from sources independent of the Company. Unobservable inputs are inputs that reflect the Company's assumptions about the inputs that market participants would use in pricing the asset or liability, and are developed based on the best information available in the circumstances.
ASC 820 identifies fair value as the exchange price, or exit price, representing the amount that would be received to sell an asset or paid to transfer a liability in an orderly transaction between market participants. As a basis for considering market participant assumptions in fair value measurements, ASC 820 establishes a three-tier fair value hierarchy that distinguishes among the following:
Level 1—Valuations based on unadjusted quoted prices in active markets for identical assets or liabilities that the Company has the ability to access.
Level 2—Valuations based on quoted prices for similar assets or liabilities in active markets, quoted prices for identical or similar assets or liabilities in markets that are not active and models for which all significant inputs are observable, either directly or indirectly.
Level 3—Valuations based on inputs that are unobservable and significant to the overall fair value measurement.
To the extent that the valuation is based on models or inputs that are less observable or unobservable in the market, the determination of fair value requires more judgment. Accordingly, the degree of judgment exercised by the Company in determining fair value is greatest for instruments categorized in Level 3. A financial instrument's level within the fair value hierarchy is based on the lowest level of any input that is significant to the fair value measurement.
Recurring Fair Value Measurements
Items measured at fair value on a recurring basis include money market mutual funds and warrants to purchase convertible preferred stock. During the periods presented, the Company has not changed the manner in which it values assets and liabilities that are measured at fair value using Level 3 inputs. The following fair value hierarchy table presents information about each major category of the Company's financial assets and liabilities measured at fair value on a recurring basis:
|
Quoted Prices in Active Markets for Identical Items |
Significant Other |
Significant |
Total |
|||||||||||||
|
September 30, 2014 |
||||||||||||||||
|
Assets |
||||||||||||||||
|
Money market |
$ | 10,010,458 | $ | — | $ | — | $ | 10,010,458 | ||||||||
|
Total assets |
$ | 10,010,458 | $ | — | $ | — | $ | 10,010,458 | ||||||||
|
Liabilities |
||||||||||||||||
|
Warrants to purchase common stock |
$ | — | $ | — | $ | 562,568 | $ | 562,568 | ||||||||
|
Total liabilities |
$ | — | $ | — | $ | 562,568 | $ | 562,568 | ||||||||
|
December 31, 2013 |
||||||||||||||||
|
Assets |
||||||||||||||||
|
Money market |
$ | 3,206,079 | $ | — | $ | — | $ | 3,206,079 | ||||||||
|
Total assets |
$ | 3,206,079 | $ | — | $ | — | $ | 3,206,079 | ||||||||
|
Liabilities |
||||||||||||||||
|
Warrants to purchase common stock |
$ | — | $ | — | $ | 819,930 | $ | 819,930 | ||||||||
|
Total liabilities |
$ | — | $ | — | $ | 819,930 | $ | 819,930 | ||||||||
The following table sets forth a summary of changes in the fair value of the Company's Common Stock warrant liability, which represents a recurring measurement that is classified within Level 3 of the fair value hierarchy, wherein fair value is estimated using significant unobservable inputs:
|
Convertible Stock Warrant |
||||
|
Balance as of December 31, 2013 |
$ | 819,930 | ||
|
Settlements |
(174,891 |
) | ||
|
Changes in estimated fair value |
(82,471 |
) | ||
|
Balance as of September 30, 2014 |
$ | 562,568 | ||
The Company recognizes transfers between levels of the fair value hierarchy as of the end of the reporting period. There were no transfers within the hierarchy during the nine months ended September 30, 2014 and the year ended December 31, 2013.
The fair value of the warrants on the date of issuance and on each re-measurement date of those warrants classified as liabilities is estimated using the Black-Scholes option pricing model using the following assumptions: contractual life according to the remaining terms of the warrants, no dividend yield, weighted average risk-free interest rate of 2.52% at September 30, 2014 and weighted average volatility of 86.16%. For this liability, the Company developed its own assumptions that do not have observable inputs or available market data to support the fair value. This method of valuation involves using inputs such as the fair value of the Company's preferred stock, stock price volatility, the contractual term of the warrants, risk free interest rates and dividend yields. Due to the nature of these inputs, the valuation of the warrants is considered a Level 3 measurement. The warrant liability is recorded in other liabilities on the Company's Consolidated Balance Sheets. The warrant liability is marked-to-market each reporting period with the change in fair value recorded as interest expense on the Unaudited Condensed Consolidated Statement of Operations and Comprehensive Loss until the warrants are exercised, expire or other facts and circumstances lead the warrant liability to be reclassified as an equity instrument.
Note 4—Intangible Assets
Intangible assets consist of the following:
|
September 30, 2014 |
December 31, 2013 |
|||||||
|
Trademarks and domains names |
$ | 6,124,994 | $ | 6,124,994 | ||||
|
Advertising customer relationships |
1,165,000 | 1,165,000 | ||||||
|
Mobile applications |
1,725,000 | 1,725,000 | ||||||
| 9,014,994 | 9,014,994 | |||||||
|
Less accumulated amortization |
(5,695,803 |
) |
(4,227,053 |
) | ||||
|
Intangible assets—net |
$ | 3,319,191 | $ | 4,787,941 | ||||
Amortization expense was approximately $489,000 and $1,469,000 for each of the three and nine months ended September 30, 2014 and 2013, respectively.
Annual future amortization expense for the Company’s intangible assets is as follows:
|
Years ending December 31: |
||||
|
Remaining in 2014 |
$ | 424,860 | ||
|
2015 |
1,569,999 | |||
|
2016 |
1,324,332 | |||
|
Total |
$ | 3,319,191 |
Note 5—Property and Equipment
Property and equipment consist of the following:
|
September 30, 2014 |
December 31, 2013 |
|||||||
|
Servers, computer equipment and software |
$ | 7,064,366 | $ | 7,308,536 | ||||
|
Office furniture and equipment |
59,742 | 152,064 | ||||||
|
Leasehold improvements |
378,389 | 373,399 | ||||||
| 7,502,497 | 7,833,999 | |||||||
|
Less accumulated depreciation/amortization |
(5,703,897 |
) |
(4,962,199 |
) | ||||
|
Property and equipment—net |
$ | 1,798,600 | $ | 2,871,800 | ||||
Property and equipment depreciation and amortization expense was approximately $646,000 and $619,000 for the three months ended September 30, 2014 and 2013, respectively. Property and equipment depreciation and amortization expense was approximately $1.8 million for each of the nine months ended September 30, 2014 and 2013.
Note 6—Accrued Liabilities
Accrued liabilities consist of the following:
|
September 30, 2014 |
December 31, 2013 |
|||||||
|
Accrued expenses |
$ | 1,460,670 | $ | 1,539,269 | ||||
|
Accrued bonuses |
680,750 | 1,108,000 | ||||||
|
Accrued employee benefits |
617,788 | 492,496 | ||||||
|
Accrued restructuring costs |
11,765 | 122,562 | ||||||
|
Accrued liabilities |
$ | 2,770,973 | $ | 3,262,327 | ||||
Note 7— Long-term Debt
The components of the Company’s total indebtedness were as follows:
|
September 30, 2014 |
December 31, 2013 |
|||||||
|
Senior Loans Payable: |
||||||||
|
Term Loan |
$ | 3,292,359 | $ | 4,663,018 | ||||
|
LSA2 Loan |
- | 480,753 | ||||||
|
Less: unamortized discount |
(261,098 |
) |
(706,963 |
) | ||||
|
Total long-term debt, net |
3,031,261 | 4,436,808 | ||||||
|
Less current portion |
(2,012,313 |
) |
(2,333,966 |
) | ||||
|
Total long-term debt, less current portion, net |
$ | 1,018,948 | $ | 2,102,842 | ||||
Senior Loans Payable
Term Loan
On April 29, 2013, the Company entered into an $8.0 million loan and security agreement with Venture Lending & Leasing VI, Inc. and Venture Lending & Leasing VII, Inc., at 11% fixed interest rate, maturing in 36 months, and which could have been drawn in three tranches (the “Loan”). On April 29, 2013, the Company drew $5.0 million on the facility. Interest is payable monthly for the first six months of the loan term, and monthly principal and interest payments are due thereafter through the maturity date. The Company issued warrants to each of the lenders in conjunction with the loan facility with an initial aggregate exercise price of $800,000, which increased by $200,000 with the first tranche and would have increased by $300,000 with each of the second and third tranches of the Loan had the Company drawn down on them. The Loan payable is net of the initial value of the warrants (See Note 11). The initial value of warrants has been capitalized within the other assets section of the balance sheet and is being amortized under the interest method over the term of the loan. Amortization expense for the three and nine months ended September 30, 2014 was $88,497 and $445,865, respectively, and is included on the statement of operations and comprehensive loss in interest expense. Amortization expense for the three and nine months ended September 30, 2013 was $19,937 and $33,228, respectively, and is included on the statement of operations and comprehensive loss in interest expense. The lenders have a priority first security lien on substantially all assets of the Company.
Growth and Equipment Term Loans
On November 10, 2011, in conjunction with the acquisition of Insider Guides, the Company assumed loans payable consisting of a growth capital term loan and three equipment term loans. The loans are collateralized by substantially all the assets of the Company. Under the Loan and Security Agreement Number 2 (“LSA2”) growth term and equipment term loans, dated December 13, 2010, principal and interest are payable monthly at a fixed interest rate of 12.50% per annum, and the loans were due in September 2014. On February 13, 2012, the loans payable and security agreements were amended and restated to include additional debt covenants. The amendment includes limitations of additional $6.0 million of bank borrowing and indebtedness for leased office equipment. The amendment requires that the Company’s unrestricted cash and accounts receivable be greater than or equal to 200% of its indebtedness and the Company’s unrestricted cash be greater than or equal to the aggregate amount of interest that will accrue and be payable through the maturity date of loans payable and security agreement.
Note 8—Commitments and Contingencies
Operating Leases
The Company leases its operating facilities in the U.S. and Sao Paulo, Brazil, under certain noncancelable operating leases that expire through 2018. These leases are renewable at the Company’s option.
Capital Leases
During the first quarter 2012, the Company executed two non-cancelable master lease agreements, one with Dell Financial Services and one with HP Financial Services. Both are for the purchase or lease of equipment for the Company’s data centers. Principal and interest are payable monthly at interest rates of ranging from 4.5% to 8.0% per annum, rates varying based on the type of equipment purchased. The capital leases are secured by the leased equipment, and outstanding principal and interest are due respectively through August 2017.
A summary of minimum future rental payments required under capital and operating leases as of September 30, 2014 are as follows:
|
Capital Leases (1) |
Operating Leases |
|||||||
|
Remaining in 2014 |
$ | 268,417 | $ | 537,770 | ||||
|
2015 |
699,329 | 1,189,178 | ||||||
|
2016 |
157,836 | 589,842 | ||||||
|
2017 |
36,156 | 240,681 | ||||||
|
2018 |
- | 42,240 | ||||||
|
Total minimum lease payments |
$ | 1,161,738 | $ | 2,599,711 | ||||
|
Less: Amount representing interest |
(54,887 |
) |
||||||
|
Total present value of minimum payments |
$ | 1,106,851 | ||||||
|
Less: Current portion of such obligations |
(831,312 |
) |
||||||
|
Long-term capital lease obligations |
$ | 275,539 | ||||||
Rent expense under these leases was approximately $1.6 million for each of the nine months ended September 30, 2014 and 2013. Rent expense under these leases was approximately $0.6 million for each of the three months ended September 30, 2014 and 2013.
Litigation
From time to time, we are party to certain legal proceedings that arise in the ordinary course and are incidental to our business. We operate our business online, which is subject to extensive regulation by federal and state governments.
On February 3, 2014, the San Francisco City Attorney filed a complaint against the Company in the Superior Court of the State of California, County of San Francisco, alleging that the Company engages in unfair business practices with respect to its use of information relating to minors, and particularly with respect to location information and the disclosure of such use. The Company believes the City Attorney’s allegations are without merit and intends to defend against them vigorously.
On March 18, 2014, RecruitME, LLC (“RecruitME”) served a complaint on the Company that it had filed on December 27, 2013 in the United States District Court for the Eastern District of Texas accusing the Company of patent infringement. On May 27, 2014, the Company filed its Answer with Counterclaims. On June 30, 2014, the Company and RecruitME entered into a Settlement and License Agreement settling all matters relating to the litigation. Accordingly, on July 10, 2014, the Court entered an order dismissing the suit with prejudice.
On September 8, 2011, Stacey Caplan, the Company's former employee, filed a complaint with the Equal Employment Opportunity Commission (“EEOC”) alleging sexual discrimination by the Company in the period following her voluntary resignation. The Company denied the allegations. On July 6, 2012, the EEOC found the complaint unfounded and closed its file. On January 28, 2013, Ms. Caplan sued the Company and its then Chief Financial Officer, Michael Matte, in the Florida Circuit Court for Palm Beach County for alleged unlawful discrimination on the basis of sex and tortious interference with contractual relations. On April 17, 2013, the Court dismissed the plaintiff’s tortious interference claims against the Company, and on April 19, 2013, the plaintiff withdrew her claims against Mr. Matte. On March 21, 2014, the parties entered into a settlement agreement to dismiss the suit with prejudice and Ms. Caplan agreed to pay the Company $5,000. Accordingly, on March 24, 2014, the suit was dismissed.
Future events or circumstances, currently unknown to management, will determine whether the resolution of pending or threatened litigation or claims will ultimately have a material effect on our consolidated financial position, liquidity or results of operations in any future reporting periods.
Note 9—Income Taxes
At September 30, 2014 and December 31, 2013, the Company had net deferred tax assets that were fully offset by a valuation allowance, as management believes that it is not more likely than not that the Company will realize the benefits of the deductible differences. The deferred tax assets at both September 30, 2014 and December 31, 2013 are principally the result of federal and state net operating loss carryforwards of approximately $140 million. These net operating loss carryforwards will expire at various dates through 2034, if unused.
During the nine months ended September 30, 2014 and 2013, the Company had no material changes in uncertain tax positions.
Note 10 - Stockholder’s Equity
Preferred Stock
The Company's Board of Directors (the “Board”) may, without further action by the stockholders, issue a series of Preferred Stock and fix the rights and preferences of those shares, including the dividend rights, dividend rates, conversion rights, exchange rights, voting rights, terms of redemption, redemption price or prices, liquidation preferences, the number of shares constituting any series and the designation of such series.
In November 2011, the Company sold 1,000,000 shares of Series A-1 Preferred Stock (“Series A-1”) to Mexicans & Americans Trading Together, Inc. (“MATT Inc.”) for $5,000,000. MATT Inc. was an existing stockholder of the Company. The Series A-1 shares are convertible, at MATT Inc.’s option, into 1,479,949 shares of the Company’s common stock, at a purchase price per share of approximately $3.38, and have voting rights on as converted basis. The holders of the Series A-1 do not have any change in control or liquidation preferences.
Common Stock
The total number of shares of common stock, $0.001 par value, that the Company is authorized to issue is 100,000,000.
On July 23, 2014, the Company entered into an Underwriting Agreement (the “Underwriting Agreement”) with JMP Securities LLC, acting as Representative of the several Underwriters named therein (collectively, the “Underwriters”), in connection with the underwritten public offering and sale (the “Offering”) of 5,000,000 shares (the “Shares”) of the Company’s common stock, par value $0.001 per share (the “Common Stock”). All of the Shares were sold by the Company. The price to the public was $2.00 per Share, and the Underwriters purchased the Shares from the Company pursuant to the Underwriting Agreement at a price of $1.88 per Share. The offering closed on July 28, 2014. Pursuant to the Underwriting Agreement, the Company granted the Underwriters a 30-day option to purchase up to an additional 750,000 shares of the Common Stock on the same terms to cover overallotments, if any. This option was exercised and closed on August 1, 2014. The net proceeds from the sale of the Shares, after deducting the Underwriters’ discount and other offering expenses, were approximately $10.5 million.
The Offering is being conducted pursuant to the Company’s shelf registration statement on Form S-3 (File No. 333-190535) filed with the Securities and Exchange Commission under the Securities Act of 1933, as amended (the “Securities Act”) and declared effective on April 18, 2014.
The Company issued 122,685 shares of common stock in connection with the exercises of stock options during the year ended December 31, 2013. There were 1,667 shares of stock options exercised in the nine months ended September 30, 2014. During the nine months ended September 30, 2014, the Company issued 89,230 common shares in connection with the exercise of warrants (see Note 11) and 556,475 shares of restricted common stock to officers and employees of the Company.
Stock-Based Compensation
The fair values of share-based payments are estimated on the date of grant using the Black-Scholes option pricing model, based on weighted average assumptions. Expected volatility is based on historical volatility of our common stock. The risk-free rate is based on the U.S. Treasury yield curve in effect over the expected term at the time of grant. Compensation expense is recognized on a straight-line basis over the requisite service period of the award. During 2014 and 2013, the Company continued to use the simplified method to determine the expected option term since the Company’s stock option exercise experience does not provide a reasonable basis upon which to estimate the expected option term.
The Company began granting restricted stock awards (“RSAs”) to its employees in April 2013. The cost of the RSAs is determined using the fair value of the Company’s common stock on the date of grant. Stock-based compensation expense for RSAs is amortized on a straight-line basis over the requisite service period. RSAs generally vest over a three-year period with 33% vesting at the end of one year and the remaining vesting annually thereafter.
The assumptions used in calculating the fair value of stock-based awards represent the Company’s best estimates, but these estimates involve inherent uncertainties and the application of management judgment. As a result, if factors change and the Company uses different assumptions, the Company’s stock-based compensation expense could be materially different in the future.
Stock-based compensation expense includes incremental stock-based compensation expense as follows:
|
For the Three Months Ended September 30, |
For the Nine Months Ended September 30, |
|||||||||||||||
|
2014 |
2013 |
2014 |
2013 |
|||||||||||||
|
Sales and marketing |
$ | 112,080 | $ | 103,521 | $ | 354,250 | $ | 266,663 | ||||||||
|
Product development and content |
533,137 | 583,523 | 1,640,997 | 1,175,680 | ||||||||||||
|
General and administrative |
397,866 | 163,598 | 1,027,224 | 1,319,223 | ||||||||||||
|
Total stock-based compensation for vesting of options and awards |
$ | 1,043,083 | $ | 850,642 | $ | 3,022,471 | $ | 2,761,566 | ||||||||
As of September 30, 2014, there was approximately $4.9 million of total unrecognized compensation cost, which is expected to be recognized over a period of approximately 2.2 years.
Stock Option Plans
2012 Omnibus Incentive Plan
On August 11, 2014, the stockholders approved the Amended and Restated 2012 Omnibus Incentive Plan (the “2012 Plan”), providing for the issuance of up to 8,700,000 shares of common stock, including approximately 2,100,000 shares previously approved by the Company’s stockholders under the Company’s Amended and Restated 2006 Stock Incentive Plan (the “2006 Stock Plan”), less one share of common stock for every one share of common stock that was subject to an option or other award granted after December 31, 2011 under the 2006 Stock Plan, plus an additional number of shares of common stock equal to the number of shares previously granted under the 2006 Stock Plan that either terminate, expire, or are forfeited after December 31, 2011. As of September 30, 2014, there were approximately 5.4 million shares of common stock available for grant. A summary of stock option activity under the 2012 Plan during the nine months ended September 30, 2014 is as follows:
|
Options |
Number of Stock Options |
Weighted- Average Exercise Price |
Weighted Average Remaining Contractual Life |
Aggregate Intrinsic Value |
||||||||||||
|
Outstanding at December 31, 2013 |
1,280,042 | $ | 1.99 | |||||||||||||
|
Granted |
838,000 | 2.69 | ||||||||||||||
|
Exercised |
(1,667 |
) |
1.93 | |||||||||||||
|
Forfeited or expired |
(85,709 |
) |
2.45 | |||||||||||||
|
Outstanding at September 30, 2014 |
2,030,666 | $ | 2.26 | 9.1 | $ | 219,048 | ||||||||||
|
Exercisable at September 30, 2014 |
671,876 | $ | 2.03 | 8.6 | $ | 131,017 | ||||||||||
The fair value of each stock option is estimated on the date of grant using the Black-Scholes option pricing model with the following weighted-average assumptions for the nine months ended September 30, 2014:
|
Risk-free interest rate: |
1.62 |
% | ||
|
Expected term (in years): |
5.9 | |||
|
Expected dividend yield: |
- | |||
|
Expected volatility: |
82 |
% |
Restricted Stock Awards
The Company granted 882,800 RSAs during the nine months ended September 30, 2014. Generally shares are forfeited if not vested within three years from the date of grant, and vest in three equal annual increments. The Company recorded stock-based compensation expense related to RSAs of approximately $886,000 for the nine months ended September 30, 2014. A summary of RSA activity under the 2012 Plan during the nine months ended September 30, 2014 is as follows:
|
RSAs |
Number of Stock Options |
Weighted- Average Stock Price |
||||||
|
Outstanding at December 31, 2013 |
1,361,750 | $ | 1.79 | |||||
|
Granted |
882,800 | 2.27 | ||||||
|
Exercised |
(556,475 |
) |
1.81 | |||||
|
Forfeited or expired |
(175,649 |
) |
1.86 | |||||
|
Outstanding at September 30, 2014 |
1,512,426 | $ | 2.06 | |||||
|
Unvested at September 30, 2014 |
1,512,426 | $ | 2.06 | |||||
2006 Stock Incentive Plan
On June 27, 2007, the stockholders approved the 2006 Stock Plan, providing for the issuance of up to 3,700,000 shares of common stock plus an additional number of shares of common stock equal to the number of shares previously granted under the 1998 Stock Option Plan that terminated, expired, or lapsed after the date of the Board of Directors’ approval of the 2006 Plan.
In 2008, the Board and stockholders approved an amendment to the 2006 Plan to authorize the issuance of an additional 2,000,000 shares of common stock. In November 2009, the Board approved an amendment to the 2006 Plan to authorize the issuance of an additional 2,000,000 shares of common stock. On June 4, 2010, the Company’s stockholders ratified this amendment to the 2006 Plan. In June 2011 and November 2011, the Board and stockholders approved amendments to the 2006 Plan to authorize the issuances of an aggregate of 4,000,000 additional shares of common stock. Pursuant to the terms of the 2006 Plan, eligible individuals could be granted incentive stock options, non-qualified stock options, stock appreciation rights, restricted stock, or stock grant awards.
A summary of stock option activity under the 2006 Stock Plans during the nine months ended September 30, 2014 is as follows:
|
Options |
Number of Stock Options |
Weighted- Average Exercise Price |
Weighted Average Remaining Contractual Life |
Aggregate Intrinsic Value |
||||||||||||
|
Outstanding at December 31, 2013 |
7,415,051 | $ | 2.36 | |||||||||||||
|
Granted |
- | - | ||||||||||||||
|
Exercised |
- | - | ||||||||||||||
|
Forfeited or expired |
(86,196 |
) |
3.92 | |||||||||||||
|
Outstanding at September 30, 2014 |
7,328,855 | $ | 2.34 | 4.8 | $ | 4,025,914 | ||||||||||
|
Exercisable at September 30, 2014 (1) |
6,705,733 | $ | 2.19 | 4.6 | $ | 4,025,914 | ||||||||||
|
(1) |
Includes 71,352 exercisable options to purchase common stock at a weighted average exercise price of $3.64 per share being held by consultants. |
Non-Plan Options
The Board has approved and our stockholders have ratified the issuance of stock options outside of our stock incentive plans. A summary of Non-Plan option activity during the nine months ended September 30, 2014 is as follows:
|
Options |
Number of Stock Options |
Weighted- Average Exercise Price |
Weighted Average Remaining Contractual Life |
Aggregate Intrinsic Value |
||||||||||||
|
Outstanding at December 31, 2013 |
443,038 | $ | 1.34 | |||||||||||||
|
Granted |
- | - | ||||||||||||||
|
Exercised |
- | - | ||||||||||||||
|
Forfeited or expired |
- | - | ||||||||||||||
|
Outstanding at September 30, 2014 |
443,038 | $ | 1.34 | 5.1 | $ | 279,114 | ||||||||||
|
Exercisable at September 30, 2014 |
443,038 | $ | 1.34 | 5.1 | $ | 279,114 | ||||||||||
Note 11—Warrant Transactions
Below is a summary of the number of shares issuable upon exercise of outstanding warrants and the terms and accounting treatment for the outstanding warrants:
|
|
|
|
|
|
|
|
|
|
|
Weighted-average |
|
|
|
Balance sheet | |||
|
|
|
Warrants as of |
|
|
exercise |
|
|
|
classification | ||||||||
|
|
|
September 30, 2014 |
|
|
December 31, 2013 |
|
|
price per share |
|
Expiration |
|
September 30, 2014 |
|
December 31, 2013 | |||
|
|
|
|
|
|
|
|
|
|
|
|
|
|
|
|
|
|
|
|
Venture Lending & Leasing VI, Inc. |
|
|
170,919 |
|
|
|
255,102 |
|
|
$ |
1.96 |
|
2/28/2024 |
|
Liability |
|
Liability |
|
Venture Lending & Leasing VII, Inc. |
|
|
170,919 |
|
|
|
255,102 |
|
|
|
1.96 |
|
2/28/2024 |
|
Liability |
|
Liability |
|
Allen, F. Stephen Series #2 |
|
|
500,000 |
|
|
|
500,000 |
|
|
|
3.55 |
|
3/21/2016 |
|
Equity |
|
Equity |
|
Allen, F. Stephen Series #3 |
|
|
500,000 |
|
|
|
500,000 |
|
|
|
3.55 |
|
3/21/2016 |
|
Equity |
|
Equity |
|
Stearns, Robert |
|
|
200,000 |
|
|
|
200,000 |
|
|
|
3.55 |
|
3/21/2016 |
|
Equity |
|
Equity |
|
MATT Series #1 |
|
|
270,576 |
|
|
|
401,486 |
|
|
|
2.75 |
|
9/19/2016 |
|
Equity |
|
Equity |
|
MATT Series #2 |
|
|
1,000,000 |
|
|
|
1,000,000 |
|
|
|
2.75 |
|
9/19/2016 |
|
Equity |
|
Equity |
|
All warrants |
|
|
2,812,414 |
|
|
|
3,111,690 |
|
|
|
|
|
|
|
|
|
|
Venture Lending & Leasing VI and VII Inc.
In connection with the Term loan that took place in April 2013, the Company issued warrants to the lender with an initial aggregate exercise value of $800,000, which increased by $200,000 with the first tranche and which would have increased by $300,000 with each of the second and third tranche draw down of the loan had the Company drawn down on them (See Note 7). Each warrant was immediately exercisable and expires ten years from the original date of issuance. The warrants to purchase shares of the Company's common stock have an exercise price equal to the estimated fair value of the underlying instrument as of the initial date such warrants were issued. Each warrant is exercisable on either a physical settlement or net share settlement basis from the date of issuance.
The warrant agreement contains a provision requiring an adjustment to the number of shares in the event the Company issues common stock, or securities convertible into or exercisable for common stock, at a price per share lower than the warrant exercise price. The Company concluded the anti-dilution feature required the warrants to be classified as liabilities under ASC Topic 815, Derivatives and Hedging—Contracts in Entity's Own Equity (“ASC 815”). The warrants are measured at fair value, with changes in fair value recognized as a gain or loss to other income (expense) in the statements of operations and comprehensive loss for each reporting period thereafter. The fair value of the common stock warrants were recorded as a discount to the Term loan.
On March 10, 2014, Venture Lending & Leasing VI and VII exercised 168,366 warrants with an exercise price of $1.96 per share. The warrants were net settled resulting in the Company issuing 89,230 shares of common stock.
On September 30, 2014, the Company remeasured the fair value of the outstanding warrants, using current assumptions, resulting in a decrease in fair value of $256,932, which was recorded in other income (expense) in the accompanying condensed consolidated statements of operations and comprehensive loss. The Company will continue to re-measure the fair value of the liability associated with the warrants at the end of each reporting period until the earlier of the exercise or the expiration of the applicable warrants.
The fair value of the warrants on the date of issuance and on each re-measurement date for those warrants are classified as liabilities, and the fair value is estimated using the Black-Scholes option pricing model. This method of valuation involves using inputs such as the fair value of the Company's common stock, stock price volatility, contractual term of the warrants, risk free interest rates, and dividend yields. Due to the nature of these inputs and the valuation techniques utilized, the valuation of the warrants are considered a Level 3 measurement (Note 3).
The fair value of the warrants was calculated using the Black-Scholes option-pricing model with the following assumptions as of:
|
September 30, 2014 |
||||
|
Risk-free interest rate: |
2.52 |
% | ||
|
Expected term (years): |
9.42 | |||
|
Expected dividend yield: |
- | |||
|
Expected volatility: |
86.16 |
% | ||
A summary of warrant activity for the nine months ended September 30, 2014 is as follows:
|
Warrants |
|
Number of Warrants |
|
|
Weighted- Average Exercise Price |
| ||
|
Outstanding at December 31, 2013 |
|
|
3,111,690 |
|
|
$ |
2.61 |
|
|
Granted |
|
|
- |
|
|
|
- |
|
|
Exercised |
|
|
(168,366 |
) |
|
|
1.96 |
|
|
Forfeited or expired |
|
|
(130,910 |
) |
|
|
2.75 |
|
|
Outstanding at September 30, 2014 |
|
|
2,812,414 |
|
|
$ |
3.00 |
|
|
Exercisable at September 30, 2014 |
|
|
2,812,414 |
|
|
$ |
3.00 |
|
Note 12—Transactions with Affiliates
Prior to August 11, 2014, Alonso Ancira served on the Company’s Board of Directors as a non-employee director. Mr. Ancira also serves on the Board of Directors of Mexicans & Americans Thinking Together Foundation, Inc. (the "Organization"), is the Chairman of the Board of Directors of MATT Inc., a principal stockholder of the Company and is the Chairman of the Board of Directors of Altos Hornos de Mexico, S.A.B. de C.V. (“AHMSA”), which owns MATT Inc. The Company has participated in several significant transactions with MATT Inc., the Organization and AHMSA. See Note 7 – Long-term Debt, Note 10 – Stockholder’s Equity, and Note 11 – Warrants.
John Abbott, the Company's former Chief Executive Officer and Chairman of the Board, has been a financial advisor to AHMSA. In connection with providing these services, AHMSA has been paying Mr. Abbott $30,000 per month.
Item 2. Management’s Discussion and Analysis of Financial Condition and Results of Operations
Cautionary Note Regarding Forward-Looking Statements
Management’s Discussion and Analysis of Financial Condition and Results of Operations is set forth below. Certain statements in this report may be considered to be “forward-looking statements” as that term (“MD&A”) is defined in the U.S. Private Securities Litigation Reform Act of 1995. In particular, these forward-looking statements include, among others, statements about:
|
|
● |
our expectations regarding user engagement patterns; |
|
|
● |
our expectations regarding mobile usage by our users; |
|
|
● |
the impact of increased mobile usage and Social Theater competition on revenues and financial results; |
|
|
● |
our expectations relating to advertising and the effects of advertising and mobile monetization on our revenues; |
|
|
● |
our plans regarding product development, international growth and personnel; |
|
|
● |
our liquidity and expectations regarding uses of cash; |
|
|
● |
our expectations regarding payments relating to cost reduction initiatives; |
|
|
● |
the impact of new accounting policies; and |
|
|
● |
our plans for capital expenditures for the remainder of the year ending December 31, 2014. |
All statements other than statements of historical facts contained in this report, including statements regarding our future financial position, liquidity, business strategy, plans and objectives of management for future operations, are forward-looking statements. The words “believe,” “may,” “estimate,” “continue,” “anticipate,” “intend,” “should,” “plan,” “could,” “target,” “potential,” “is likely,” “expect” and similar expressions, as they relate to us, are intended to identify forward-looking statements. We have based these forward-looking statements largely on our current expectations and projections about future events and financial trends that we believe may affect our financial condition, results of operations, business strategy and financial needs.
Important factors that could cause actual results to differ from those in the forward-looking statements include users’ willingness to try new product offerings, the risk that unanticipated events affect the functionality of our mobile application with popular mobile operating systems, any changes in such operating systems that degrade our mobile application’s functionality and other unexpected issues which could adversely affect usage on mobile devices, the risk that the mobile advertising market will not grow, the ongoing existence of such demand and the willingness of our users to complete mobile offers or pay for virtual currency. Any forward-looking statement made by us in this report speaks only as of the date on which it is made. Factors or events that could cause our actual results to differ may emerge from time to time, and it is not possible for us to predict all of them. We undertake no obligation to publicly update any forward-looking statement, whether as a result of new information, future developments or otherwise, except as may be required by law.
You should read the following discussion in conjunction with our audited historical consolidated financial statements. MD&A contains forward-looking statements that reflect our plans, estimates, and beliefs. Our actual results could differ materially from those discussed in the forward-looking statements. Factors that could cause or contribute to these differences include those discussed elsewhere in “Risk Factors,” located at Part II, Item 1A of this report and in our Form 10-K for the year ended December 31, 2013 and the Prospectus Supplement (Rule 424(b)(5)) filed on July 24, 2014. Additional risks that we do not presently know or that we currently believe are immaterial could materially and adversely affect any of our business, financial position, future results or prospects.
MD&A is provided as a supplement to and should be read in conjunction with our audited consolidated financial statements, and the MD&A included in our Annual Report on Form 10-K for the year ended December 31, 2013 (“Annual Report”), as well as our condensed consolidated financial statements and the accompanying notes included in this report.
Company Overview
MeetMe (“we,” “our” or “us”) is a social network for meeting new people both on the web and on mobile platforms, including on iPhone, Android, iPad and other tablets, that facilitates interactions among users and encourages users to connect with each other. MeetMe monetizes through advertising, virtual currency, and paid subscriptions. MeetMe provides users with access to an expansive, multilingual menu of resources that promote social interaction, information sharing and other topics of interest. The Company offers online marketing capabilities, which enable marketers to display their advertisements in different formats and in different locations. The Company works with its advertisers to maximize the effectiveness of their campaigns by optimizing advertisement formats and placement.
Just as Facebook has established itself as the social network of friends and family, and LinkedIn as the social network of colleagues and business professionals, MeetMe is creating the social network not of the people you know but of the people you want to know. We believe meeting new people is a basic human need, especially for users aged 18-30, when so many long-lasting relationships are made. There are more than one billion people aged 18-30 worldwide with more than 50 million such people in the United States.
We believe that we have significant growth opportunities ahead as people increasingly use their mobile devices to discover the people around them. Given the importance of establishing connections within a user’s geographic proximity, we believe it is critical to establish a high density of users within the geographic regions we serve. As the MeetMe network grows and the number of users in a location increases, we believe users will benefit incrementally from the quantity of relevant connections.
Operating Metrics
We measure site and application activity in terms of monthly active users (MAUs), visits and page views. We define “MAU” as a registered user of one of our platforms who has logged in and visited our websites or mobile applications within the month of measurement. A “visit” represents a distinct user session, and a “page view” is a page that a user views during a visit. For the quarters ended September 30, 2014 and September 30, 2013 the total MeetMe MAUs were approximately 5.0 million and 5.3 million, respectively. MeetMe visits were approximately 1.1 billion and 968 million, respectively, for the quarters ended September 30, 2014 and 2013. MeetMe registered users numbered approximately 145 million and 117 million, respectively, for the quarters ended September 30, 2014 and 2013.
|
For the Three Months Ended September 30, |
||||||||
|
2014 |
2013 |
|||||||
|
MAU- MeetMe |
5,013,344 | 5,340,245 | ||||||
|
Visits - MeetMe |
1,131,028,565 | 968,332,905 | ||||||
|
Pageviews - MeetMe |
12,614,484,319 | 10,829,562,351 | ||||||
Trends in Our Operating Metrics
We measure activity on our sites in terms of MAUs, daily active users (“DAUs”), average revenue per user (“ARPU”), average revenue per daily active user (“ARPDAU”), visits and page views. We define a mobile MAU as a user who accessed one of our sites by a mobile application or by the mobile-optimized version of our website, whether on a mobile phone or tablet, such as the iPad, during the month of measurement. We define a DAU as a registered user of one of our platforms who logged in and visited our website or mobile applications within the day of measurement. We define a mobile DAU as a user who accessed MeetMe by one of our mobile applications or by the mobile-optimized version of our website, whether on a mobile phone or tablet, such as the iPad, during the day of measurement. We define ARPU as the average revenue per monthly active user for web and mobile. We define ARPDAU as the average revenue per daily active web or mobile user. Visits represent the number of times during the measurement period that users came to the site or mobile applications for distinct sessions.
In the quarter ended September 30, 2014, MeetMe averaged 2.91 million mobile MAUs and 5.01 million total MAUs, as compared to 2.66 million mobile MAUs and 5.34 million total MAUs on average for the quarter ended September 30, 2013, a net increase of 0.25 million in mobile MAUs and a net decrease of 0.33 million in total MAUs. Mobile DAUs averaged 888,000 and 790,000 for the quarters ended September 30, 2014 and 2013, respectively. For the quarter ended September 30, 2014, MeetMe averaged 1.09 million total DAUs, as compared to 1.14 million total DAUs on average for the quarter ended September 30, 2013, a net decrease of approximately 49,000.
We believe the shift of our audience from web to mobile is an important driver of our business. As users shift from web to mobile, web page views decreased in every quarter of 2013 and the first three quarters of 2014, from 2.4 billion in the first quarter of 2013 to 1.0 billion in the third quarter of 2014. Our user base generated over 12.6 billion total page views in the third quarter of 2014, and 10.8 billion page views in the same period of 2013. Decreasing web traffic resulted in declining web revenue. We have successfully increased our mobile monetization by 128% and our mobile ARPDAU by 103%, respectively, to $6.7 million and $0.082 for the quarter ended September 30, 2014 from $2.9 million and $0.04 for the quarter ended September 30, 2013. We believe our ability to continue to grow our mobile audience and our mobile monetization at a faster pace than the decline in our web revenue will impact the performance of our business.
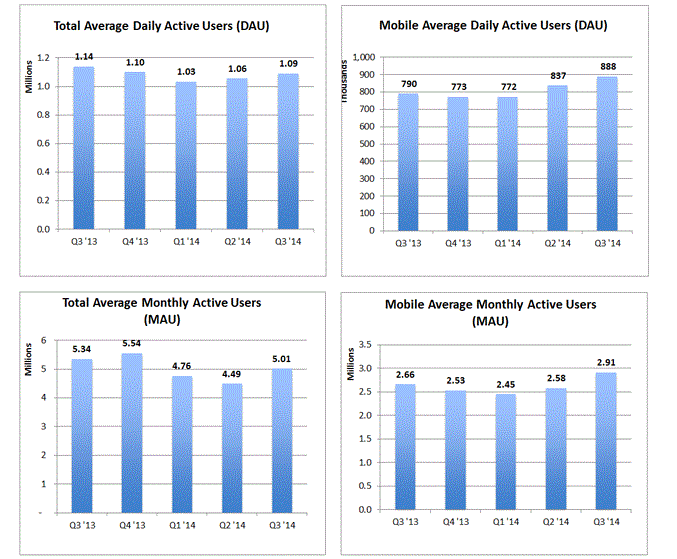
In the quarter ended September 30, 2014, MeetMe earned an average of $1.01 ARPU on the web and $2.29 ARPU in its mobile applications, as compared to $1.44 in web ARPU and $1.10 in mobile ARPU for the quarter ended September 30, 2013. In the quarter ended December 31, 2013, the Company reported mobile ARPU of $2.01, which included a one-time revenue recognition of past deferred revenue for virtual currency sales previously collected but never used by the purchaser. Excluding this one-time adjustment, the mobile ARPU for the quarter ended December 31, 2013 would have been $1.81. In the quarter ended September 30, 2014, MeetMe earned an average of $0.122 ARPDAU on the web and $0.082 ARPDAU in its mobile applications, as compared to $0.130 in web ARPDAU and $0.040 in mobile ARPDAU for the quarter ended September 30, 2013. In the quarter ended December 31, 2013, the Company reported mobile ARPDAU of $0.071, which included a one-time revenue recognition of past deferred revenue for virtual currency sales previously collected but never used by the user. Excluding this one-time adjustment, the mobile ARPDAU for the quarter ended December 31, 2013 would have been $0.064.
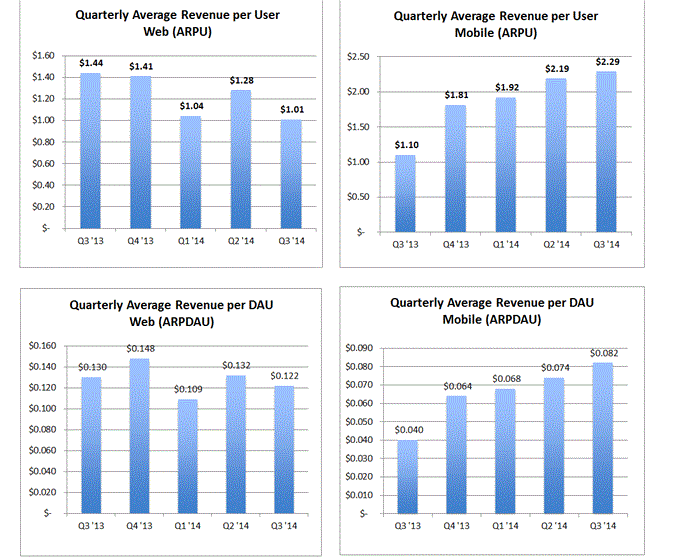
Third Quarter of 2014 Highlights
|
|
● |
Mobile revenue grew 128% from the third quarter of 2013 to $6.7 million. |
|
|
● |
Mobile ARPU of $2.29 in the third quarter of 2014, compared to $1.10 in the third quarter of 2013. |
|
|
● |
Mobile revenue represented 57.6% of total revenue, compared to 29.1% in the third quarter of 2013. |
Factors Affecting Our Performance
|
|
● |
Number of MAUs and DAUs: We believe ability to grow MAUs and DAUs affects our revenue and financial results by influencing the number of advertisements we are able to show, the value of those advertisements, and the volume of virtual currency purchases, as well as our expenses and capital expenditures. |
|
|
● |
User Engagement: Changes in user engagement patterns we believe also affect our revenue and financial performance. Specifically, the number of visits and page views each MAU or DAU generates affects the number of advertisements we are able to display and therefore the rate at which we are able to monetize our active user base. We continue to create new features and enhance existing features to drive additional engagement. |
|
|
● |
Platform Trends: Increasing use of MeetMe on mobile devices may affect our revenue and financial results, as we currently display fewer advertisements-units on average to mobile users compared to users on personal computers, and we earn less revenue per ad impression as a result of the mobile advertising market being less established than the web advertising market. For example, in the first nine months of 2014, over 75% of our DAUs on average accessed MeetMe on mobile devices, yet we generated only 63% of our core platform revenue from our mobile usage. Improving the rate at which we monetize our growing mobile traffic is a key priority, as we expect our users to continue to shift their usage from web to mobile for the foreseeable future. The transition in our user access to mobile may impact revenues negatively in the short-term and medium-term as mobile monetization continues to mature. |
|
|
● |
Advertising Rates: Our revenue and financial results are materially dependent on industry trends, and any changes to the revenue we earn per thousand advertising impressions (CPM) could affect our revenue and financial results. We expect to continue investing in new types of advertising and new placements, especially in our mobile applications. Additionally, we are prioritizing initiatives that generate revenue directly from users, including new virtual currency products and a premium subscription product, in part to reduce our dependency on advertising revenue. |
|
|
● |
User Geography: The geography of our users influences our revenue and financial results because we currently monetize users in distinct geographies at varying average rates. For example, ARPU in the United States and Canada is significantly higher than in Latin America. In 2012 and early 2013, we laid the foundation for future international growth by localizing the core MeetMe service in multiple languages including Spanish, Portuguese, French, Italian, German, Chinese (Traditional and Simplified), Russian, Japanese, Dutch, Turkish and Korean. |
|
|
● |
New User Sources: The percentage of our new users that are acquired through inorganic, paid sources has a material impact on our financial performance, specifically with regard to ARPU for web and mobile. Inorganically acquired users tend to have lower engagement rates, tend to generate fewer visits and ad impressions and to be less likely to buy virtual currency products. When paid marketing campaigns are ongoing, our overall usage and traffic increases due to the influx of inorganically acquired users, but the rate at which we monetize the average active user overall declines as a result. |
|
|
● |
Ad Inventory Management: Our revenue trends are affected by advertisement inventory management changes affecting the number, size, or prominence of advertisements we display. In general, more prominently displayed advertising units will generate more revenue per impression. Our Social Theater campaign expenses are materially dependent on the percentage of Social Theater campaigns that run on the MeetMe platform and the percentage that run on our partners’ cross-platform networks. We work to maximize the share of Social Theater campaigns that run on the MeetMe platform and run campaigns on our partners’ networks only when necessary to increase their reach. |
|
|
● |
Increased Social Theater Competition: A significant portion of the revenue generated by the Social Theater is derived from advertising campaigns, powered by Social Theater technology, that run on our partners’ cross-platform networks and not on the MeetMe platform. Increases in competitors offering similar technology solutions, and in some cases their own cross-platform distribution networks, may make it difficult to compete on price and win business. We expect this downward pressure on price to continue and impact our operating results in the future. |
|
|
● |
Seasonality: Advertising spending is traditionally seasonal with a peak in the fourth quarter of each year. We believe that this seasonality in advertising spending affects our quarterly results, which generally reflect a growth in advertising revenue between the third and fourth quarters and a decline in advertising spending between the fourth and subsequent first and second quarters of each year. |
Growth trends in web and mobile MAUs and DAUs are critical variables that affect our revenue and financial results by influencing the number of advertisements we are able to show, the value of those advertising, the volume of payments transactions, as well as our expenses and capital expenditures.
Changes in user engagement patterns from web to mobile and international diversification also affect our revenue and financial performance. We believe that overall engagement as measured by the percentage of users who create content (such as status posts, chats, or photos) or generate feedback increases as our user base grows. We continue to create new apps and enhance existing apps to lift social sharing and increase monetization. The launch of additional languages to the platform facilitates international user growth.
We believe our revenue trends are also affected by advertisement inventory management changes that affect the number, size, or prominence of advertisements we display and by traditional seasonality. Social Theater growth may be affected by large brand penetration, the ability to grow the advertiser base and advertiser spending budgets.
Critical Accounting Policies and Estimates
Our critical accounting policies and estimates are described in Part II, Item 7, “Management’s Discussion and Analysis of Financial Condition and Results of Operations” of our Annual Report on Form 10-K for the year ended December 31, 2013, filed with the Securities and Exchange Commission on March 25, 2014. We believe there have been no new critical accounting policies or material changes to our existing critical accounting policies and estimates during the three months ended September 30, 2014, compared to those discussed in our Annual Report on Form 10-K for the year ended December 31, 2013.
Recent Accounting Pronouncements
In May 2014, the Financial Accounting Standards Board (the “FASB”) issued Accounting Standards Update (“ASU”) No. 2014-09, Revenue from Contracts with Customers (“ASU 2014-09”). The objective of ASU 2014-09 is to establish a single comprehensive model for entities to use in accounting for revenue arising from contracts with customers and will supersede most of the existing revenue recognition guidance, including industry-specific guidance. The core principle of ASU 2014-09 is that an entity recognizes revenue to depict the transfer of promised goods or services to customers in an amount that reflects the consideration to which the entity expects to be entitled in exchange for those goods or services. In applying the new guidance, an entity will (1) identify the contract(s) with a customer; (2) identify the performance obligations in the contract; (3) determine the transaction price; (4) allocate the transaction price to the contract’s performance obligations; and (5) recognize revenue when (or as) the entity satisfies a performance obligation. ASU 2014-09 applies to all contracts with customers except those that are within the scope of other topics in the FASB Accounting Standards Codification. The new guidance is effective for annual reporting periods (including interim periods within those periods) beginning after December 15, 2016 for public companies. Early adoption is not permitted. Entities have the option of using either a full retrospective or modified approach to adopt ASU 2014-09. We are currently evaluating the new guidance and have not determined the impact this standard may have on our consolidated financial statements nor decided upon the method of adoption.
In June 2014, the FASB issued ASU No. 2014-12, Compensation-Stock Compensation (Topic 718): Accounting for Share-Based Payments When the Terms of an Award Provide That a Performance Target Could Be Achieved after the Requisite Service Period (“ASU 2014-12”). ASU 2014-12 is effective for annual periods and interim periods within those annual periods, beginning after December 15, 2015. We are currently evaluating the impact that the adoption of this guidance will have on our financial position, results of operations, comprehensive income, cash flows and/or disclosures.
The following table sets forth a modified version of our consolidated statements of operations that is used in the following discussions of our results of operation for the three month period:
|
For the Three Months Ended September 30, |
||||||||||||||||
|
2014 |
2013 |
2014 to 2013 Change ($) |
2014 to 2013 Change (%) |
|||||||||||||
|
Revenues |
$ | 11,604,724 | $ | 10,073,309 | $ | 1,531,415 | 15 |
% | ||||||||
|
Operating Costs and Expenses: |
||||||||||||||||
|
Sales and marketing |
1,516,547 | 1,876,240 | (359,693 |
) |
(19 |
)% | ||||||||||
|
Product development and content |
7,021,353 | 6,817,591 | 203,762 | 3 |
% | |||||||||||
|
General and administrative |
1,932,161 | 1,536,939 | 395,222 | 26 |
% | |||||||||||
|
Depreciation and amortization |
1,135,263 | 1,108,856 | 26,407 | 2 |
% | |||||||||||
|
Operating Expenses |
11,605,324 | 11,339,626 | 265,698 | 2 |
% | |||||||||||
|
Loss from Operations |
(600 |
) |
(1,266,317 |
) |
1,265,717 | 100 |
% | |||||||||
|
Other Income (Expense): |
||||||||||||||||
|
Interest income |
2,679 | 2,503 | 176 | 7 |
% | |||||||||||
|
Interest expense |
(206,980 |
) |
(222,777 |
) |
15,797 | (7 |
)% | |||||||||
|
Change in warrant liability |
256,932 | - | 256,932 |
n/a |
||||||||||||
|
Total Other Income (Expense) |
52,631 | (220,274 |
) |
272,905 | 124 |
% | ||||||||||
|
Net Income (Loss) |
$ | 52,031 | $ | (1,486,591 |
) |
$ | 1,538,622 | 104 |
% | |||||||
Comparison of the three months ended September 30, 2014 and 2013
Revenues
Our revenues were approximately $11.6 million, for the three months ended September 30, 2014, an increase of $1.5 million or 15% compared to $10.1 million for the same period in 2013. The increase is attributable to a $3.7 million increase in mobile revenue, partially offset by a $2.2 million decrease in web advertising and virtual currency revenue.
Operating Costs and Expenses
Sales and Marketing: Sales and marketing expenses decreased approximately $360,000, or 19%, to approximately $1.5 million for the three months ended September 30, 2014 from $1.9 million for the same period of 2013. Decreased sales and marketing expenses are primarily attributable to decreased advertising and marketing initiatives.
Product Development and Content: Product development and content expenses increased approximately $204,000, or 3%, to $7.0 million for the three months ended September 30, 2014 from $6.8 million for the same period of 2013. The net increase in product development and content is attributable to increased employee related expenses and stock compensation expenses.
General and Administrative: General and administrative expenses increased $395,000, or 26%, to $1.9 million for the three months ended September 30, 2014 from $1.5 million for the same period of 2013. The aggregate increase in general and administrative costs is primarily attributable to increased employee-related expenses and stock compensation expenses.
Comparison of Stock-Based Compensation and Other Costs and Expenses
Stock-Based Compensation
Stock-based compensation expense, included in the operating expense by category, increased approximately $192,000 to $1.0 million for the three months ended September 30, 2014 from $851,000 for the same period of 2013. Stock-based compensation expense represented 9.0% and 7.5% of operating expenses for the three months ended September 30, 2014 and 2013, respectively.
|
For the Three Months Ended September 30, |
||||||||||||
|
2014 |
2013 |
2014 to 2013 Change ($) |
||||||||||
|
Sales and marketing |
$ | 112,080 | $ | 103,521 | $ | 8,559 | ||||||
|
Product and content development |
533,137 | 583,523 | (50,386 |
) | ||||||||
|
General and administrative |
397,866 | 163,598 | 234,268 | |||||||||
|
Total stock-based compensation |
$ | 1,043,083 | $ | 850,642 | $ | 192,441 | ||||||
Depreciation and amortization expense
Depreciation and amortization expense was $1.1 million for each of the three months ended September 30, 2014 and 2013.
The following table sets forth a modified version of our consolidated statements of operations that is used in the following discussions of our results of operations for the nine month period:
|
For the Nine Months Ended September 30, |
||||||||||||||||
|
2014 |
2013 |
2014 to 2013 Change ($) |
2014 to 2013 Change (%) |
|||||||||||||
|
Revenues |
$ | 31,795,558 | $ | 27,361,901 | $ | 4,433,657 | 16 |
% | ||||||||
|
Operating Costs and Expenses |
||||||||||||||||
|
Sales and marketing |
5,611,313 | 5,405,910 | 205,403 | 4 |
% | |||||||||||
|
Product development and content |
20,734,532 | 19,543,611 | 1,190,921 | 6 |
% | |||||||||||
|
General and administrative |
6,055,944 | 5,759,498 | 296,446 | 5 |
% | |||||||||||
|
Depreciation and amortization |
3,300,654 | 3,280,843 | 19,811 | 1 |
% | |||||||||||
|
Acquisition and restructuring costs |
120,202 | 2,540,896 | (2,420,694 |
) |
(95 |
)% | ||||||||||
|
Loss on debt restructure |
- | 1,174,269 | (1,174,269 |
) |
(100 |
)% | ||||||||||
|
Operating Expenses |
35,822,645 | 37,705,027 | (1,882,382 |
) |
(5 |
)% | ||||||||||
|
Loss from Operations |
(4,027,087 |
) |
(10,343,126 |
) |
6,316,039 | 61 |
% | |||||||||
|
Other Income (Expense): |
||||||||||||||||
|
Interest income |
4,394 | 7,856 | (3,462 |
) |
(44 |
)% | ||||||||||
|
Interest expense |
(868,866 |
) |
(578,345 |
) |
(290,521 |
) |
50 |
% | ||||||||
|
Change in warrant liability |
82,471 | - | 82,471 |
n/a |
||||||||||||
|
Total Other Expense |
(782,001 |
) |
(570,489 |
) |
(211,512 |
) |
37 |
% | ||||||||
|
Net Loss |
$ | (4,809,088 |
) |
$ | (10,913,615 |
) |
$ | 6,104,527 | 56 |
% | ||||||
Comparison of the nine months ended September 30, 2014 and 2013
Revenues
Our revenues were approximately $31.8 million for the nine months ended September 30, 2014, an increase of $4.4 million, or 16%, compared to $27.4 million for the same period in 2013. The increase in revenue is primarily attributable to an increase in mobile advertising and revenues of $9.5 million offset by a decrease of $6.1 million in web advertising revenue.
Operating Costs and Expenses
Sales and Marketing: Sales and marketing expenses increased approximately $205,000, or 4%, to approximately $5.6 million for the nine months ended September 30, 2014 from $5.4 million for the same period of 2013. Increased sales and marketing expenses are primarily attributable to an increase of approximately $200,000 in advertising and marketing initiatives.
Product Development and Content: Product development and content expenses increased approximately $1.2 million, or 6%, to $20.7 million, for the nine months ended September 30, 2014 from $19.5 million for the same period of 2013. The net increase in product development and content expense is attributable to a net increase of $461,000 of third party content costs for cross platform Social Theater affiliate campaigns, as well as an increase in stock compensation costs of $465,000.
General and Administrative: General and administrative expenses increased $296,000, or 5%, to $6.1 million for the nine months ended September 30, 2014 from $5.8 million for the same period of 2013. The aggregate increase in general and administrative costs is primarily due an increase in bad debt write-offs.
Stock Based Compensation
Stock based compensation expense increased approximately $261,000 to $3.0 million for the nine months ended September 30, 2014 from $2.8 million for the same period of 2013. Stock based compensation expense represented 8% and 7% of operating expenses for the nine months ended September 30, 2014, and 2013, respectively. As of September 30, 2014, and 2013, there was approximately $4.9 million and $3.7 million, respectively, of unrecognized compensation cost related to stock options and unvested restricted stock awards, which is expected to be recognized over a period of approximately two to three years.
|
For the Nine Months Ended September 30, |
2014 to 2013 | |||||||||||
|
2014 |
2013 |
Change ($) |
||||||||||
|
Sales and marketing |
$ | 354,250 | $ | 266,663 | $ | 87,587 | ||||||
|
Product and content development |
1,640,997 | 1,175,680 | 465,317 | |||||||||
|
General and administrative |
1,027,224 | 1,319,223 | (291,999 |
) | ||||||||
|
Total stock based compensation |
$ | 3,022,471 | $ | 2,761,566 | $ | 260,905 | ||||||
Depreciation and amortization expense
Depreciation and amortization expense was $3.3 million for each of the nine months ended September 30, 2014 and 2013.
Acquisition and Restructuring Costs
For the nine months ended September 30, 2014 and 2013 restructuring costs were approximately $120,000 and $2,541,000, respectively, including the accrual of office, employee exit, and employee relocation costs. The Company paid approximately $1.8 million of the accrued restructuring expenses in severance and related employee exit costs to its former Chief Executive Officer and Chief Financial Officer during 2013. The Company did not incur any restructuring costs for the three months ended September 30, 2014 and 2013.
Liquidity and Capital Resources
|
For the Nine Months Ended September 30, |
||||||||
|
2014 |
2013 |
|||||||
|
Net cash provided by operating activities |
$ | 1,867,739 | $ | 712,978 | ||||
|
Net cash used in investing activities |
(590,385 |
) |
(16,946 |
) | ||||
|
Net cash provided by financing activities |
8,018,982 | 2,982,677 | ||||||
| $ | 9,296,336 | $ | 3,678,709 | |||||
Net cash provided by operations was approximately $1.9 million for the nine months ended September 30, 2014 compared to cash provided by operations of $713,000 for the same period of 2013. For the nine months ended September 30, 2014, net cash provided by continuing operations consisted primarily of a net loss from continuing operations of approximately $4.8 million offset by non-cash expenses of approximately $3.3 million of depreciation and amortization expense, $2.9 million related to stock based compensation for the vesting of stock options, and $446,000 in amortization of discounts on notes payable and debt issuance costs. Additionally, changes in working capital increased the net cash provided by continuing operations. These changes included decreases in accounts receivable of approximately $2.0 million resulting from collections, offset by a net decrease in accounts payable, accrued expenses, and deferred revenue of $1.7 million.
For the nine months ended September 30, 2013, net cash provided by continuing operations consisted primarily of a net loss from continuing operations of approximately $10.9 million offset by non-cash expenses of approximately $3.3 million from depreciation and amortization expense, $2.8 million related to stock based compensation, $1.1 million of loss on debt restructure, and $80,000 in amortization of discounts on notes payable and debt issuance costs offset by a $90,000 recovery on bad debt allowances. Additionally, changes in working capital increased the net cash provided by continuing operations. These changes included decreases in accounts receivable of approximately $2.4 million resulting from collections, $650,000 in prepaid expenses and other current assets, and included increases in accounts payable and accrued expenses of $958,000, and $492,000 in deferred revenues.
Net cash used in investing activities in the nine months ended September 30, 2014 of approximately $590,000 was due to capital expenditures for computer equipment to increase capacity and improve performance. Net cash used in investing activities for the nine months ended September 30, 2013 of approximately $17,000, was due to capital expenditures of $129,000 for computer equipment to increase capacity and improve performance offset by $112,000 of loan receivable payments received from BRC. Net cash used in investing activities in the nine months ended September 30, 2014 and 2013 exclude approximately $167,000 and $499,000, respectively, of computer equipment purchased using capital leases.
Net cash provided by financing activities in the nine months ended September 30, 2014 of approximately $8.0 million was due to common stock offering proceeds of $10.6 million, offset by approximately $1.9 million of debt payments and $702,000 of capital lease payments. Net cash provided by financing activities in the nine months ended September 30, 2013 of approximately $3.0 million was due to $5.0 million drawn on the growth capital loan, offset by $1.6 million of debt payments, and $566,000 of capital lease payments offset by $123,000 of proceeds from the exercise of stock options. Net cash provided by financing activities in the nine months ended September 30, 2013 excludes the $6 million subordinate note payable with accrued interest and accounts receivable offset and $2.8 million of warrant exercises and cancellation of subordinated note payable with accrued interest that were non-cash transactions.
|
September 30, 2014 |
December 31, 2013 |
|||||||
|
Cash and cash equivalents |
$ | 15,597,966 | $ | 6,330,532 | ||||
|
Total assets |
$ | 100,491,670 | $ | 95,576,240 | ||||
|
Percentage of total assets |
15.5 |
% |
6.6 |
% | ||||
Our cash balances are kept liquid to support our growing infrastructure needs for operational expansion. The majority of our cash is concentrated in two large financial institutions.
As of September 30, 2014, the Company had positive working capital of approximately $16.5 million.
On April 29, 2013, the Company (i) entered into a loan and security agreement with a leading provider of debt financing to technology companies (the “Loan Agreement”) and (ii) issued two warrant agreements (“Warrants”) for the purchase of shares of the Company’s common stock to the lenders under the Loan Agreement. The Loan Agreement has an aggregate commitment of $8 million. The Company borrowed $5 million under the Loan Agreement on April 29, 2013. Had it achieved of certain financial goals, the Company could have borrowed two additional tranches of loans, each in an aggregate principal amount of up to $1.5 million. All loans under the Loan Agreement have a term of 36 months and may not be re-borrowed after repayment. The lender under the Loan Agreement has a security interest in substantially all assets of the Company. The purchase price for the shares of common stock issuable upon exercise of the Warrants is equal to, at each Warrant holder’s option, the lower of (x) $1.96 and (y) the price per share of the stock issued in the next equity placement of the Company’s stock, subject to certain restrictions set forth in the Warrants. The Warrants may be exercised until February 28, 2024. As of November 4, 2014, the Company owed approximately $3.0 million on its loan payable of which $162,000 is due through December 2014, and the remainder of $2.8 million is due through April 2016.
As of September 30, 2014, capital leases that were previously entered into by the Company had $1.1 million in principal amount of capital lease indebtedness, of which approximately $250,000 is due through December 31, 2014.
The Company believes that, with its current available cash, anticipated revenues and collections on its accounts receivables, and its access to capital through various financing options, it will have sufficient funds to meet its anticipated cash needs for the next 12 months.
The Company has budgeted capital expenditures of $2.2 million for the remainder of 2014, funded primarily through capital leases, which it believes will support its growth of domestic and international business through increased capacity, performance improvement, and expanded content.
Off-Balance Sheet Arrangements
There have been no material changes with regard to our off-balance sheet arrangements since our Annual Report on Form 10-K for the year ended December 31, 2013.
Non-GAAP Financial Measures
The following discussion and analysis includes both financial measures in accordance with GAAP as well as non-GAAP financial measures. Generally, a non-GAAP financial measure is a numerical measure of a company’s performance, financial position or cash flows that either excludes or includes amounts that are not normally included or excluded in the most directly comparable measure calculated and presented in accordance with GAAP. Non-GAAP financial measures should be viewed as supplemental to, and should not be considered as alternatives to net income, operating income, and cash flow from operating activities, liquidity or any other financial measures. They may not be indicative of the historical operating results of the Company nor are they intended to be predictive of potential future results. Investors should not consider non-GAAP financial measures in isolation or as substitutes for performance measures calculated in accordance with GAAP.
We believe that both management and shareholders benefit from referring to the following non-GAAP financial measures in planning, forecasting and analyzing future periods. Our management uses this non-GAAP financial measure in evaluating its financial and operational decision making and as a means to evaluate period-to-period comparisons.
The Company defines “Adjusted EBITDA” as earnings (or loss) from continuing operations before interest expense, income taxes, depreciation and amortization, amortization of stock-based compensation, acquisition, restructuring or other expenses and goodwill impairment charges. The Company excludes stock based compensation because it is non-cash in nature. Our management believes Adjusted EBITDA is an important measure of our operating performance because it allows management, investors and analysts to evaluate and assess our operating results from period to period after removing the impact of acquisition related costs, and other items of a non-operational nature that affect comparability. Our management recognizes that Adjusted EBITDA has inherent limitations because of the excluded items.
We have included a reconciliation of our non-GAAP financial measures to the most comparable financial measures calculated in accordance with GAAP. We believe that providing the non-GAAP financial measures, together with the reconciliation to GAAP, helps investors make comparisons between the Company and other companies. In making any comparisons to other companies, investors need to be aware that companies use different non-GAAP measures to evaluate their financial performance. Investors should pay close attention to the specific definition being used and to the reconciliation between such measures and the corresponding GAAP measure provided by each company under applicable SEC rules.
The following table presents a reconciliation of Adjusted EBITDA to Net Loss from continuing operations allocable to common shareholders, a GAAP financial measure:
|
For the Three Months Ended September 30, |
For the Nine Months Ended September 30, |
|||||||||||||||
|
2014 |
2013 |
2014 |
2013 |
|||||||||||||
|
Net Income (Loss) Allocable to Common Shareholders |
$ | 52,031 | $ | (1,486,591 |
) |
$ | (4,809,088 |
) |
$ | (10,913,615 |
) | |||||
|
Interest expense |
206,980 | 222,777 | 868,866 | 578,345 | ||||||||||||
|
Change in warrant liability |
(256,932 |
) |
- | (82,471 |
) |
- | ||||||||||
|
Depreciation and amortization |
1,135,263 | 1,108,856 | 3,300,654 | 3,280,843 | ||||||||||||
|
Stock-based compensation expense |
1,043,083 | 850,642 | 3,022,471 | 2,761,566 | ||||||||||||
|
Restructuring costs |
- | - | 120,202 | 2,540,896 | ||||||||||||
|
Loss on debt restructure |
- | - | - | 1,174,269 | ||||||||||||
|
Adjusted EBITDA (loss) |
$ | 2,180,425 | $ | 695,684 | $ | 2,420,634 | $ | (577,696 |
) | |||||||
Item 3. Quantitative and Qualitative Disclosures about Market Risk
There was no material changes in market risks during the three months ended September 30, 2014. The volatility of exchange rates depends on many factors that we cannot forecast with reliable accuracy.
Item 4. Controls and Procedures
Evaluation of Disclosure Controls and Procedures.
With the participation of our Chief Executive Officer and Chief Financial Officer we have evaluated the effectiveness of our disclosure controls and procedures (as such term is defined in Rules 13a-15(e) and 15d-15(e) under the Securities Exchange Act of 1934), as of the end of the period covered by this report. Based upon such evaluation, our Chief Executive Officer and Chief Financial Officer have concluded that our disclosure controls and procedures are effective as of the end of the period covered by this report.
Changes in Internal Controls Over Financial Reporting
There was no change in our internal control over financial reporting that occurred during the period covered by this report that has materially affected, or is reasonably likely to materially affect, our internal control over financial reporting.
Limitations on the Effectiveness of Controls
A control system, no matter how well designed and operated, can provide only reasonable, not absolute, assurance that the control system’s objectives will be met. The Company’s management, including its Principal Executive Officer and its Principal Financial Officer, do not expect that the Company’s disclosure controls will prevent or detect all errors and all fraud. Further, the design of a control system must reflect the fact that there are resource constraints, and the benefits of controls must be considered relative to their costs. Because of the inherent limitations in all control systems, no evaluation of controls can provide absolute assurance that all control issues and instances of fraud, if any, within the Company have been detected. These inherent limitations include the realities that judgments in decision-making can be faulty, and that breakdowns can occur because of simple error or mistake. Controls can also be circumvented by the individual acts of some persons, by collusion of two or more people, or by management override of the controls. The design of any system of controls is based in part upon certain assumptions about the likelihood of future events, and there can be no assurance that any design will succeed in achieving its stated goals under all potential future conditions. Over time, controls may become inadequate because of changes in conditions or deterioration in the degree of compliance with associated policies or procedures. Because of the inherent limitations in a cost-effective control system, misstatements due to error or fraud may occur and not be detected.
PART II. OTHER INFORMATION
Item 1. Legal Proceedings
From time to time, we are party to certain legal proceedings that arise in the ordinary course and are incidental to our business. There are currently no such pending proceedings to which we are a party that our management believes will have a material adverse effect on the Company’s consolidated financial position or results of operations. However, future events or circumstances currently unknown to management will determine whether the resolution of pending or threatened litigation or claims will ultimately have a material effect on our consolidated financial position, liquidity or results of operations in any future reporting periods. There were no material changes in litigation during the three months ended September 30, 2014. See Note 8 to the unaudited condensed consolidated financial statements contained in this report for information on specific matters.
Item 1A. Risk Factors
There have been no material changes to the risk factors disclosed in the Part I, Item 1A “Risk Factors” in our Annual Report on Form 10-K for the year ended December 31, 2013 filed with the Securities and Exchange Commission on March 25, 2014, and the Prospectus Supplement (Rule 424(b)(5)) filed on July 24, 2014, in evaluating our business, financial position, future results and prospects. The risks described in these filings are not the only risks we face. Additional risks that we do not presently know or that we currently believe are immaterial could also materially and adversely affect any of our business, financial position, future results or prospects.
Item 2. Unregistered Sales of Equity Securities and Use of Proceeds
Not applicable.
Item 3. Defaults upon Senior Securities
Not applicable.
Item 4. Mine Safety Disclosures.
Not applicable.
Item 5. Other Information
Not applicable.
Item 6. Exhibits
|
Exhibit |
|
|
|
Incorporated by Reference |
|
Filed or Furnished | ||||
|
No. |
|
Exhibit Description |
|
Form |
|
Date |
|
Number |
|
Herewith |
|
|
|
|
|
|
|
|
|
|
|
|
|
10.1# |
|
Amendment No. 2 to Advertising Agreement with Pinsight Media+ |
|
8-K |
|
7/23/14 |
|
10.1 |
|
|
|
31.1 |
|
Certification of Principal Executive Officer (Section 302) |
|
|
|
|
|
|
|
Furnished* |
|
31.2 |
|
Certification of Principal Financial Officer (Section 302) |
|
|
|
|
|
|
|
Furnished* |
|
32.1 |
|
Certification of Principal Executive Officer (Section 906) |
|
|
|
|
|
|
|
Furnished* |
|
32.2 |
|
Certification of Principal Financial Officer (Section 906) |
|
|
|
|
|
|
|
Furnished* |
|
101.INS |
|
XBRL Instance Document |
|
|
|
|
|
|
|
** |
|
101.SCH |
|
XBRL Taxonomy Extension Schema Document |
|
|
|
|
|
|
|
** |
|
101.CAL |
|
XBRL Taxonomy Extension Calculation Linkbase Document |
|
|
|
|
|
|
|
** |
|
101.DEF |
|
XBRL Taxonomy Extension Definition Linkbase Document |
|
|
|
|
|
|
|
** |
|
101.LAB |
|
XBRL Taxonomy Extension Label Linkbase Document |
|
|
|
|
|
|
|
** |
|
101.PRE |
|
XBRL Taxonomy Extension Presentation Linkbase Document |
|
|
|
|
|
|
|
** |
* This exhibit is being furnished rather than filed and shall not be deemed incorporated by reference into any filing, in accordance with Item 601 of Regulation S-K.
** Attached as Exhibit 101 to this report are the Company’s financial statements for the quarter ended June 30, 2014 formatted in XBRL (eXtensible Business Reporting Language). The XBRL-related information in Exhibit 101 in this report shall not be deemed “filed” or a part of a registration statement or prospectus for purposes of Sections 11 or 12 of the Securities Act of 1933, and is not filed for purposes of Section 18 of the Securities Exchange Act of 1934, or otherwise subject to the liabilities of those sections.
# Confidential treatment requested under 17 C.P.R. §§200.80(b)(4) and 240.24b-2. The confidential portions of this exhibit have been omitted and are marked accordingly. The confidential portions have been filed separately with the Securities and Exchange Commission.
SIGNATURES
Pursuant to the requirements of the Securities Exchange Act of 1934, the registrant has duly caused this report to be signed on its behalf by the undersigned hereunto duly authorized.
|
|
|
MeetMe, Inc. |
|
|
|
|
|
|
|
|
|
November 10, 2014 |
|
/s/ Geoffrey Cook |
|
|
|
Geoffrey Cook |
|
|
|
Chief Executive Officer (Principal Executive Officer) |
|
|
|
|
|
|
|
|
|
November 10, 2014 |
|
/s/ David Clark |
|
|
|
David Clark Chief Financial Officer (Principal Financial Officer) |
Exhibit Index
|
Exhibit |
|
|
|
Incorporated by Reference |
|
Filed or Furnished | ||||
|
No. |
|
Exhibit Description |
|
Form |
|
Date |
|
Number |
|
Herewith |
|
|
|
|
|
|
|
|
|
|
|
|
|
10.1# |
|
Amendment No. 2 to Advertising Agreement with Pinsight Media+ |
|
8-K |
|
7/23/14 |
|
10.1 |
|
|
|
31.1 |
|
Certification of Principal Executive Officer (Section 302) |
|
|
|
|
|
|
|
Furnished* |
|
31.2 |
|
Certification of Principal Financial Officer (Section 302) |
|
|
|
|
|
|
|
Furnished* |
|
32.1 |
|
Certification of Principal Executive Officer (Section 906) |
|
|
|
|
|
|
|
Furnished* |
|
32.2 |
|
Certification of Principal Financial Officer (Section 906) |
|
|
|
|
|
|
|
Furnished* |
|
101.INS |
|
XBRL Instance Document |
|
|
|
|
|
|
|
** |
|
101.SCH |
|
XBRL Taxonomy Extension Schema Document |
|
|
|
|
|
|
|
** |
|
101.CAL |
|
XBRL Taxonomy Extension Calculation Linkbase Document |
|
|
|
|
|
|
|
** |
|
101.DEF |
|
XBRL Taxonomy Extension Definition Linkbase Document |
|
|
|
|
|
|
|
** |
|
101.LAB |
|
XBRL Taxonomy Extension Label Linkbase Document |
|
|
|
|
|
|
|
** |
|
101.PRE |
|
XBRL Taxonomy Extension Presentation Linkbase Document |
|
|
|
|
|
|
|
** |
* This exhibit is being furnished rather than filed and shall not be deemed incorporated by reference into any filing, in accordance with Item 601 of Regulation S-K.
** Attached as Exhibit 101 to this report are the Company’s financial statements for the quarter ended June 30, 2014 formatted in XBRL (eXtensible Business Reporting Language). The XBRL-related information in Exhibit 101 in this report shall not be deemed “filed” or a part of a registration statement or prospectus for purposes of Sections 11 or 12 of the Securities Act of 1933, and is not filed for purposes of Section 18 of the Securities Exchange Act of 1934, or otherwise subject to the liabilities of those sections.
# Confidential treatment requested under 17 C.P.R. §§200.80(b)(4) and 240.24b-2. The confidential portions of this exhibit have been omitted and are marked accordingly. The confidential portions have been filed separately with the Securities and Exchange Commission.
Page 37