Attached files
| file | filename |
|---|---|
| 8-K - FORM 8-K - MRC GLOBAL INC. | d816466d8k.htm |
 1
November 2014
November 2014
TM
Investor Presentation
Exhibit 99.1 |
 2
November 2014
2
This
presentation
contains
forward-looking
statements
within
the
meaning
of
Section
27A
of
the
Securities
Act
and
Section
21E
of
the
Exchange
Act.
Words
such as “will,”
“expect,”
“expected”, “looking forward”, “guidance”
and similar expressions are intended to identify forward-looking statements.
Statements about the company’s business, including its strategy, its
industry, the company’s future profitability, the company’s guidance on its sales, adjusted EBITDA,
adjusted gross profit, tax rate, capital expenditures and cash flow, growth in the
company’s various markets and the company’s expectations, beliefs, plans,
strategies, objectives, prospects and assumptions are not guarantees of future
performance. These statements are based on management’s expectations
that involve a number of business risks and uncertainties, any of which could cause
actual results to differ materially from those expressed in or implied by
the forward-looking statements. These statements involve known and unknown
risks, uncertainties and other factors, most of which are difficult to predict
and many of which are beyond our control, including the factors described in the
company’s SEC filings that may cause our actual results and performance
to be materially different from any future results or performance expressed or
implied by these forward-looking statements. For a discussion of key risk
factors, please see the risk factors disclosed in the company’s SEC filings, which are available on the SEC’s website at
www.sec.gov
and
on
the
company’s
website,
www.mrcglobal.com.
Our
filings
and
other
important
information
are
also
available
on
the
Investor
Relations
page of our website at www.mrcglobal.com.
Undue reliance should not be placed on the company’s forward-looking
statements. Although forward-looking statements reflect the company’s good faith
beliefs,
reliance
should
not
be
placed
on
forward-looking
statements
because
they
involve
known
and
unknown
risks,
uncertainties
and
other
factors,
which
may
cause
the
company’s
actual
results,
performance
or
achievements
or
future
events
to
differ
materially
from
anticipated
future
results,
performance
or
achievements or future events expressed or implied by such forward-looking
statements. The company undertakes no obligation to publicly update or revise
any forward-looking statement, whether as a result of new information, future
events, changed circumstances or otherwise, except to the extent required by
law.
Statement Regarding Use of Non-GAAP Measures:
The Non-GAAP financial measures contained in this presentation (Adjusted
EBITDA and Adjusted Gross Profit) are not measures of financial
performance
calculated in accordance with U.S. Generally Accepted Accounting
Principles (GAAP) and should not be considered as alternatives to net income or
gross profit. They should be viewed in addition to, and not as a
substitute for, analysis of our results reported in accordance with GAAP. Management believes
that these non-GAAP financial measures provide investors a view to measures
similar to those used in evaluating our compliance with certain financial
covenants under our credit facilities and provide meaningful comparisons between
current and prior year period results. They are also used as a metric to
determine certain components of performance-based compensation. They are not
necessarily indicative of future results of operations that may be obtained
by the Company.
Forward Looking Statements and Non-GAAP Disclaimer |
 3
November 2014
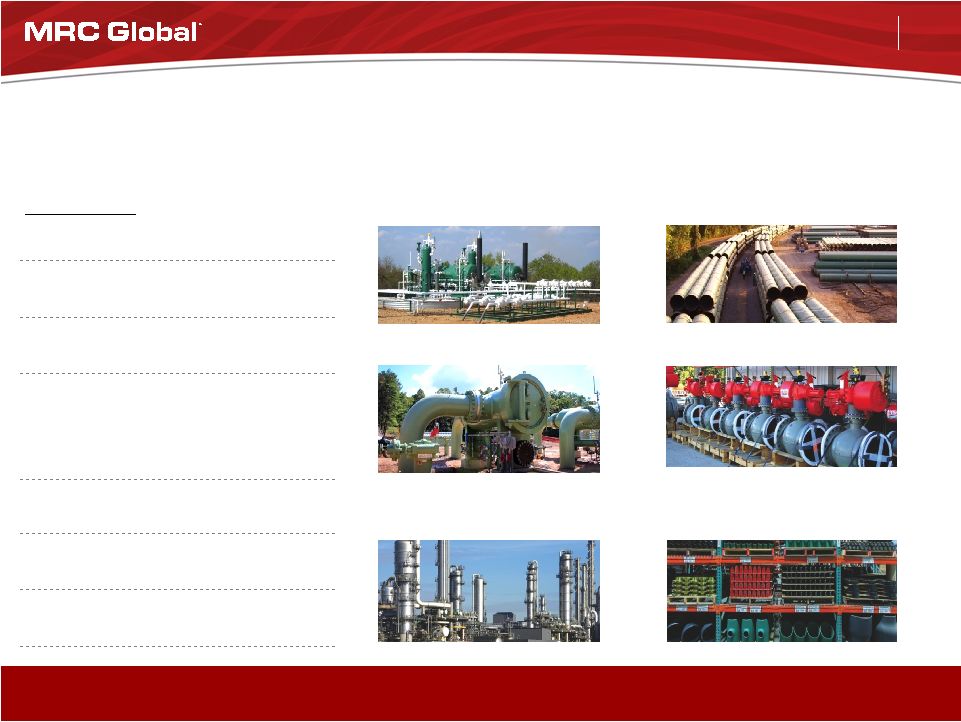
By the Numbers
Industry Sectors
Product Categories
2014 Guidance:
Sales
Adjusted EBITDA
$5.90B -
$5.97B
$430 -
$450M
Upstream
Line Pipe & OCTG
Employees
4,800+
Locations
400+
Midstream
Valves
Countries
•
Operations
•
Direct Sales
(>$100,000)
•
All countries
20
45+
90+
Customers
19,000+
Downstream/
Industrial
Fittings & Flanges
Suppliers
20,000+
SKU’s
230,000+
Company Snapshot
MRC
Global
is
the
largest
global
distributor
of
pipe,
valves
and
fittings
(PVF)
to the energy industry, by sales |
 4
November 2014
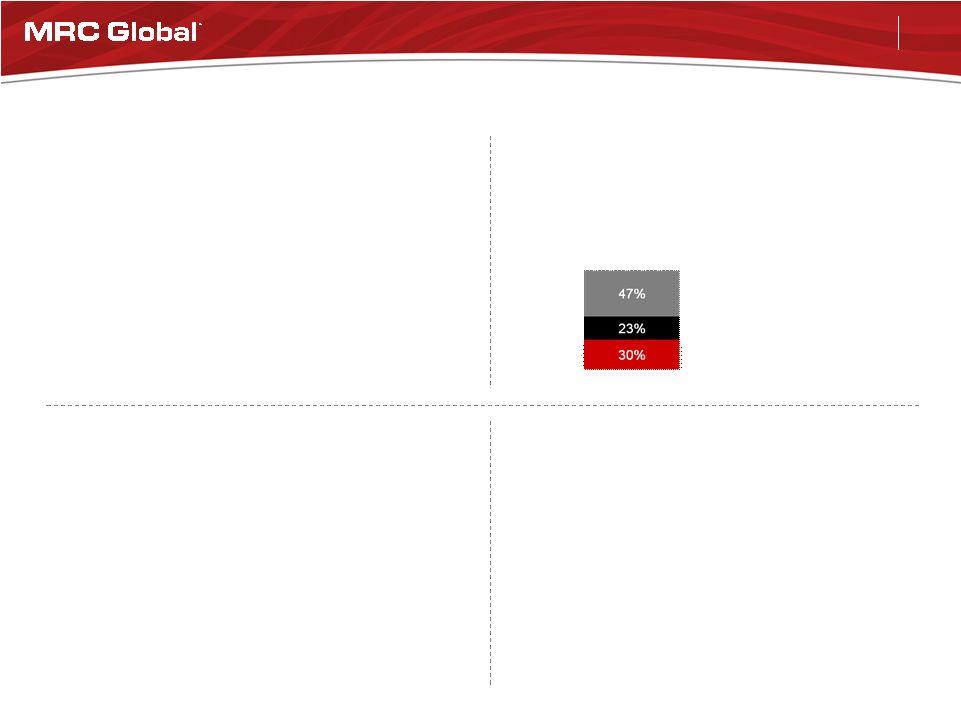
Diversification by Industry Sector -
Revenue
Note: Percentage of sales for the twelve months ended September 30, 2014.
Upstream
47%
Downstream 25%
28% Midstream
Diversified Across All Three Major Energy Sectors |
 5
November 2014
By Product Line
Revenue by Geography and Product Line
Note: Percentage of sales for the twelve months ended September 30, 2014.
By Geography
9%
21%
19%
19%
32%
Houston, TX
Edmonton, AB
Bradford, UK
Singapore
Perth, AU
Stavanger, NO
Diversified Across Multiple Geographies -
Domestically (all shale plays) and Internationally |
 6
November 2014
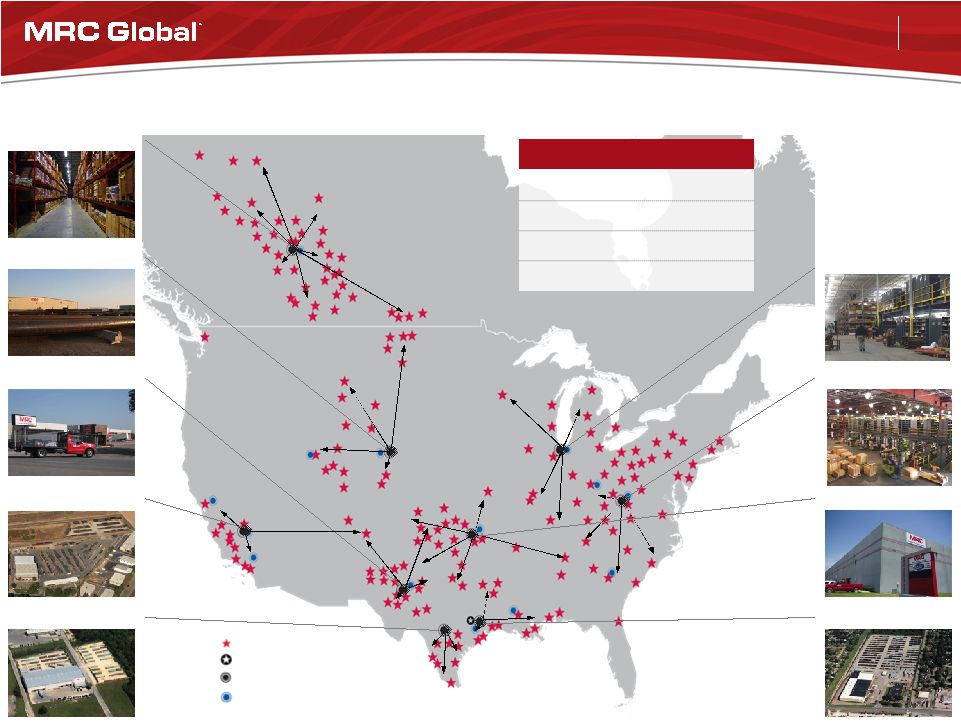
Global Footprint to Serve Customers -
North America
Munster, IN
Nitro, WV
Tulsa, OK
Houston, TX
Nisku, AB
Cheyenne, WY
Odessa, TX
Bakersfield, CA
San Antonio, TX
By the Numbers
As of 9/30/2014
Branches
170+
RDCs
9
VACs
14
Employees
3,400+
Regional Distribution Centers
Corporate Headquarters
Valve Automation Centers
Branch Locations |
 7
November 2014
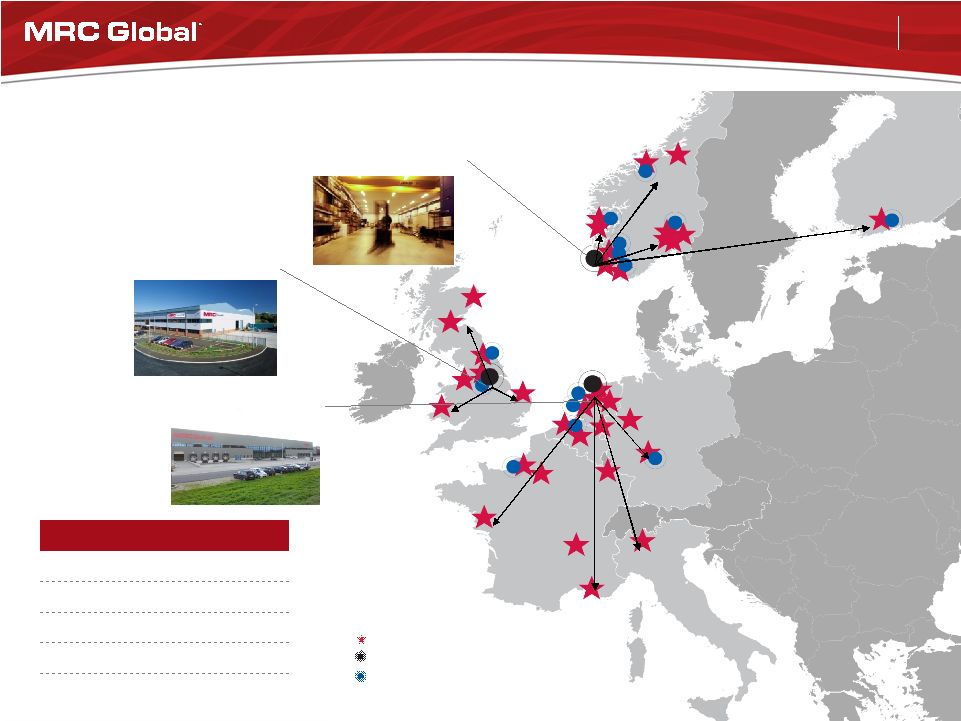
Global Footprint to Serve Customers -
Europe
Stavanger, NO
By the Numbers
As of 9/30/2014
Branches
34
RDCs
3
VACs
15
Countries
8
Employees
900+
Rotterdam, NL
Bradford, UK
Regional Distribution Centers
Valve Automation Centers
Branch Locations |
 8
November 2014
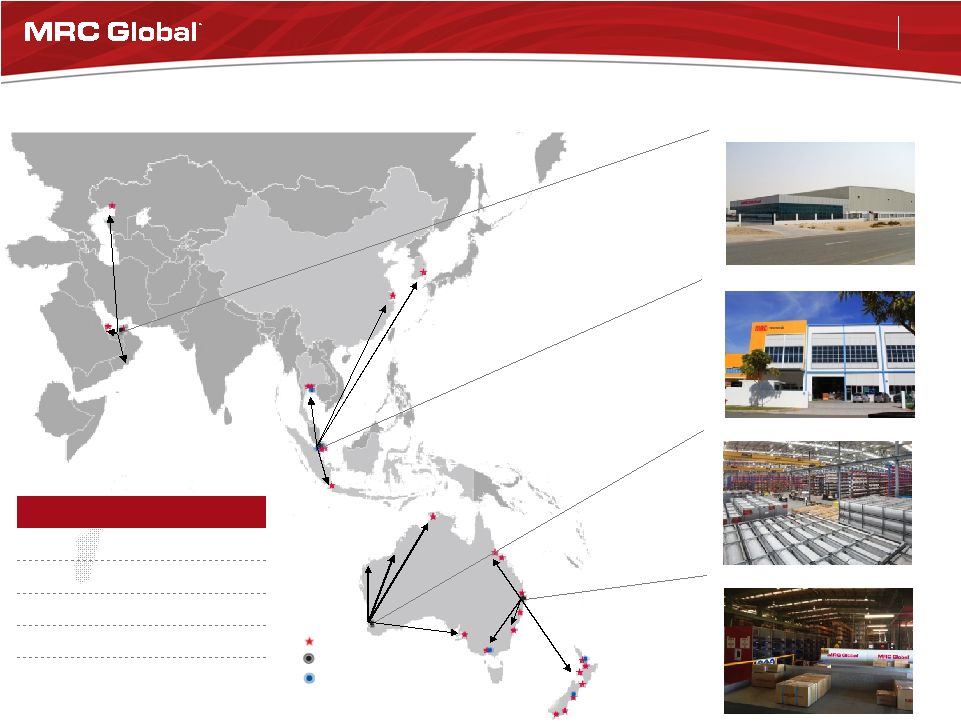
Global Footprint to Serve Customers -
Asia Pacific & Middle East
Singapore
Perth, WA
Brisbane, QLD
Dubai, UAE
By the Numbers
As of 9/30/2014
Branches
29
RDCs
4
VACs
6
Countries
10
Employees
400+
Regional Distribution Centers
Valve Automation Centers
Branch Locations |
 9
November 2014
Benefits of MRC Global
•
Supplier Registration / Preferred Supplier List
•
Global delivery footprint with 1.5 million + sq. ft. of
regional distribution centers
•
Approximately $1.1B in global inventory, net
•
Global sourcing from 45+ countries
Why Customers Choose MRC Global –
Well Positioned
Generating savings and efficiencies for our customers
while enabling them to focus on their core competencies
MRC Global is #7 on Industrial
Distribution magazine’s annual list of
the 50 largest industrial distributors¹,
“The Big 50”
1.
Wolseley
2.
Wurth Group
3.
W.W. Grainger
4.
HD Supply
5.
Wesco
6.
Anixter
7.
MRC Global
1. September/October 2014 edition, based on 2013 revenue.
|
 10
November 2014
Integrated Supply Statistics
•
Supplying Integrated Supply services since
1988 •
Accounts for sales in excess of $800
million and
growing rapidly
•
Employ over 165 personnel at customer
sites •
Providing Integration Services on over 100 customer
sites
•
Managing
over 1.4 million customer part numbers
•
Consignment inventories in excess of $35 million at 700
locations
•
Manage customer-owned point of use materials at
over
800 locations
MRC Global is a leading provider of Integrated Supply
Services to the Energy Industry |
 11
November 2014
Downstream
Midstream
Upstream
MRC Global plays a vital role in the complex, technical, global energy supply
chain Long-Term Supplier & Customer Relationships
CUSTOMERS
SUPPLIERS
IOCs
Phillips 66
Valero
DOW
DuPont
Marathon
Petroleum
Access
Midstream
AGL
Resources
Atmos
NiSource
PG&E
Williams
DCP
Midstream
Chesapeake
Energy
ConocoPhillips
Devon
Apache
Anadarko
CNRL
Hess
Husky
Energy
Marathon
Oil
Statoil
Energy Carbon Steel
Tubular Products
Valves
Fittings, Flanges and General
Use Products
Tenaris
TMK-
IPSCO
U.S.
Steel
CSI Tubular
JMC
Wheatland
Balon
Cameron
Flowserve
Kitz
Neway
Velan
Boltex
Bonney
Forge
Chevron
Phillips
Chemical
Tube
Forgings of
America
WL Plastics
Emerson |
 12
November 2014
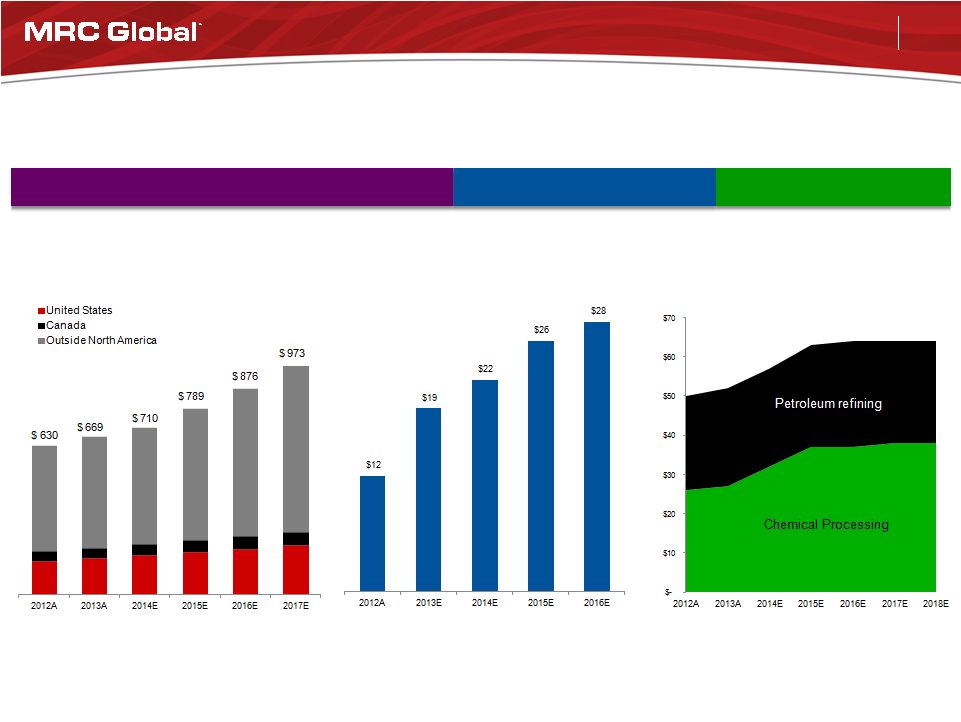
End Market Opportunities
Global E&P Spending²
1.
Percentage of sales for the twelve months ended September 30, 2014.
2.
Source: Barclays June 2014 E&P Spending Outlook.
3.
Source: Stifel “Pipelines: 2015 Spending & Awards Climb; Visibility into
Strength Through 2017”, September 15, 2014. 4.
Source: Industrial Info Resources: August 2014.
Petroleum Refining & Chemical
Processing Spending in North
America
4
$ Billions
Upstream 47%
Midstream 28%
Downstream 25%
MRC Global Revenue Mix by End Market¹
Large Project Pipeline Spending³
$ Billions
$ Billions |
 13
November 2014
Strategic Objectives
Rebalance Product Mix to Higher Margin
Items
•
Focus on valve and valve automation
•
Strengthen offerings in stainless & alloy PFF
Growth from Mergers & Acquisitions
•
Add product lines to complete global PVF offerings
and geographies for scale and expertise
•
Stream AS –
Norway
•
NAWAH/MRC Global/US Steel Tubular
Products consortium –
Iraq
•
MSD Engineering –
Singapore and SE Asia
•
HypTeck
–
Norway
1.
Percentage of sales for the twelve months ended September 30, 2014.
Organic Growth
•
Targeted Growth Accounts: develop the
“next 75”
customers
Customer Mix -
Sales¹
•
Focus
on
multi-year
“Top
25”
MRO
agreements
•
Chevron
•
Kazakhstan, Future Growth Project, PFF
•
Thailand & Australia, MRO, PVF
•
ConocoPhillips
•
Lower 48 states & Canada, MRO, PVF
Execute Global Preferred Supplier Contracts
All Other -
19,000+ customers
Targeted Growth Accounts
Top 1 -
25 |
 14
November 2014
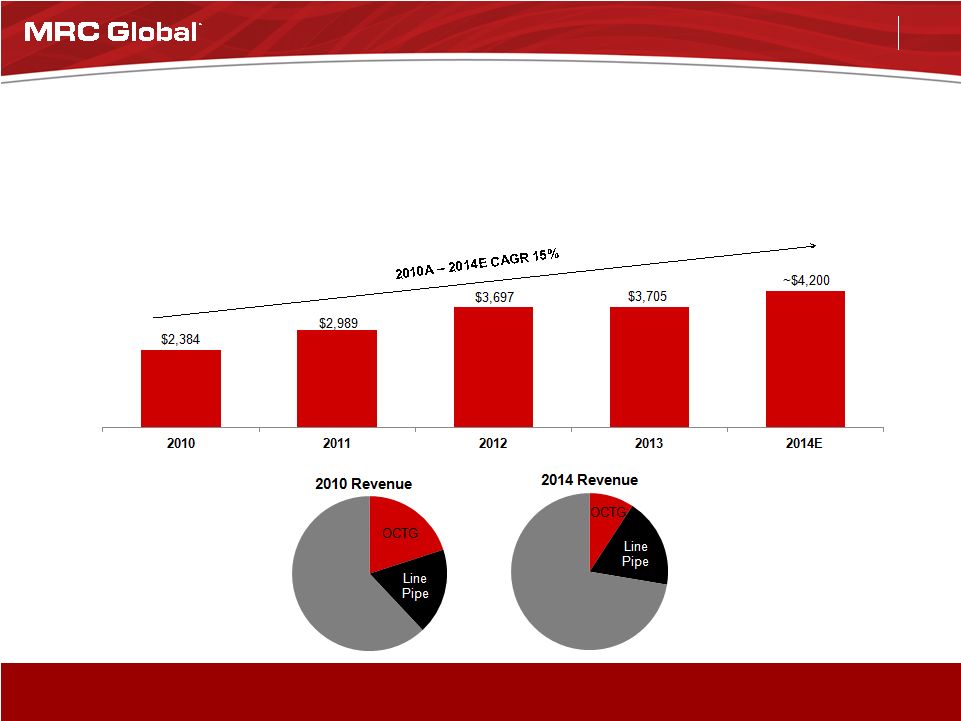
Strategic Shift in Product Mix to Higher Margin Products
($ millions)
Total Revenue less Carbon Energy Tubulars (OCTG & Line Pipe)
15% CAGR Over Past 4 Years
Higher
Margin
Products
Higher
Margin
Products |
 15
November 2014
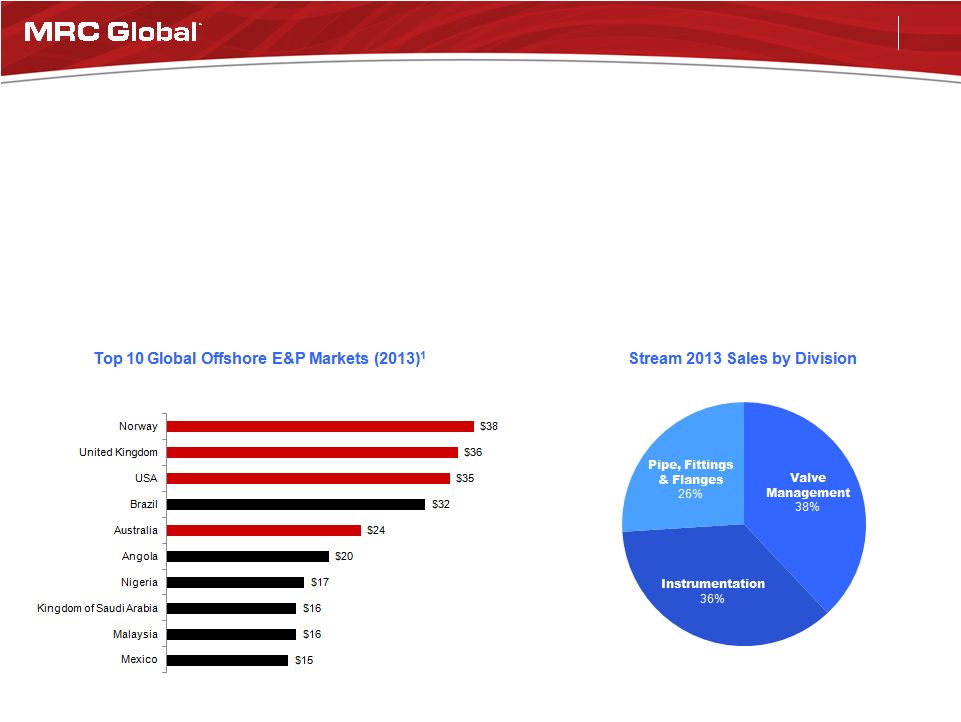
Strategic Expansion into Offshore Production Platform MRO
•
Top 4 largest offshore markets ~$140 billion E&P spend
•
Norway is the largest –
we are now positioned in 4 of the 5 largest offshore markets
•
MRC Global revenue mix
•
Pre Stream
acquisition –
approx. 98% onshore, 2% offshore
•
Pro-forma post Stream
acquisition –
approx. 92% onshore, 8% offshore
1. Source: Rystad Energy, September 2014
($ billions) |
 16
November 2014
1.
Reflects reported revenues for 2013.
Building an International Platform |
 17
November 2014
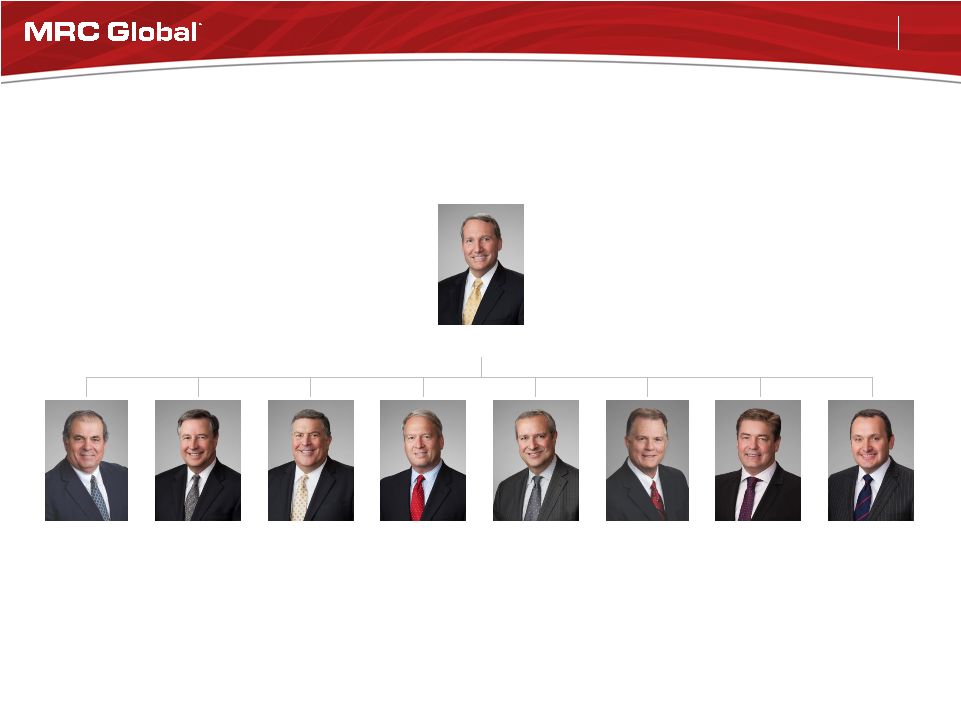
Executive Management –
September 1, 2014
Over 30 years average individual experience
Andy Lane
Chairman, President & CEO
Jim Braun
Executive VP
& CFO
Dan Churay
Executive VP
Corporate Affairs,
General Counsel &
Corporate Secretary
Gary Ittner
Senior VP
SCM –
Valves,
Fittings, Flanges,
Alloys & Oilfield
Supply
Rory Isaac
Senior VP
Business
Development
Scott
Hutchinson
Senior VP
North America
Operations
Jim Dionisio
Senior VP
SCM –
Energy
Tubular Products
Steinar Aasland
Senior VP
Europe Region
John Bowhay
Senior VP
Asia Pacific &
Middle East Region |
 18
November 2014
Financial Overview |
 19
November 2014
3Q 2014 Highlights
•
New quarterly company records
•
Revenue $1.618 billion
•
Backlog $1.254 billion as of 9/30/14
•
Revenue from valves $531 million
•
19.0% Adjusted Gross Profit
•
$132 million Adjusted EBITDA (8.2%)
•
SG&A cost saving initiatives yield ~$17 million in annual savings
beginning in 4Q 2014
•
Early stages -
midstream customers pull-through occurring
•
Carbon energy tubular pricing improved throughout quarter
|
 20
November 2014
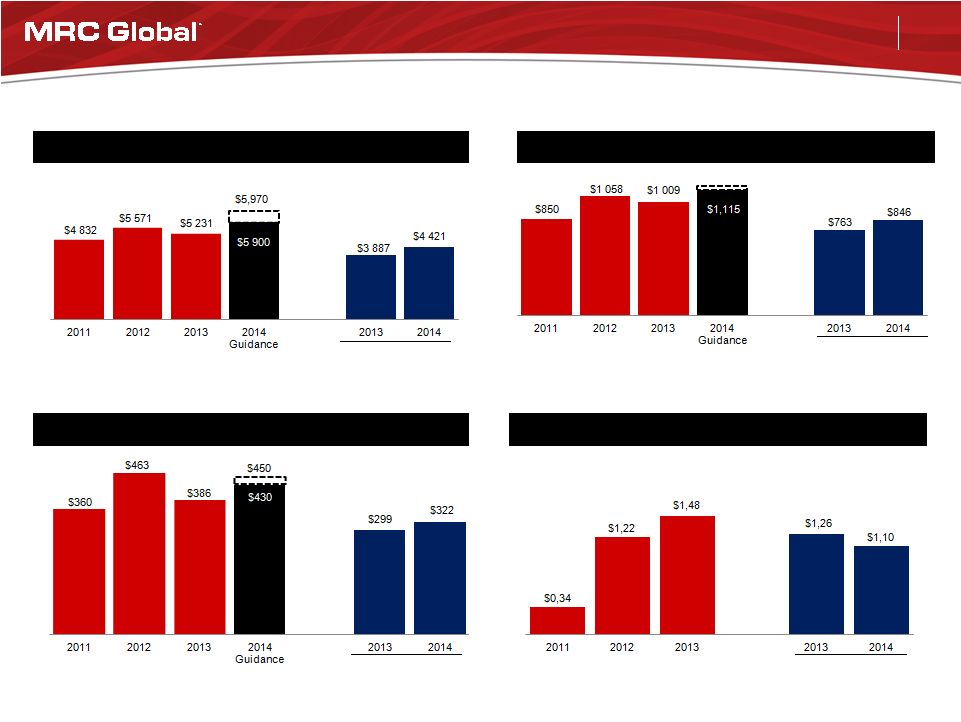
Financial Metrics
Sales
Adjusted Gross Profit and % Margin
Adjusted EBITDA and % Margin
7.0%
8.5%
($ millions, except per share data)
Y-o-Y
Growth
24%
(5%)
12%
Y-o-Y
Growth
29%
(17%)
14%
7.5%
8.3%
7.4%
7.5% -
7.3%
7.7%
7.3%
Y-o-Y
Growth
15%
(6%)
13%
Diluted EPS
Y-o-Y
Growth
259%
21%
17.6%
19.0%
19.3%
19.3% -
18.9%
19.6%
19.1%
$1,150
Nine Months Ended
September 30
Nine Months Ended
September 30
Nine Months Ended
September 30
Nine Months Ended
September 30 |
 21
November 2014
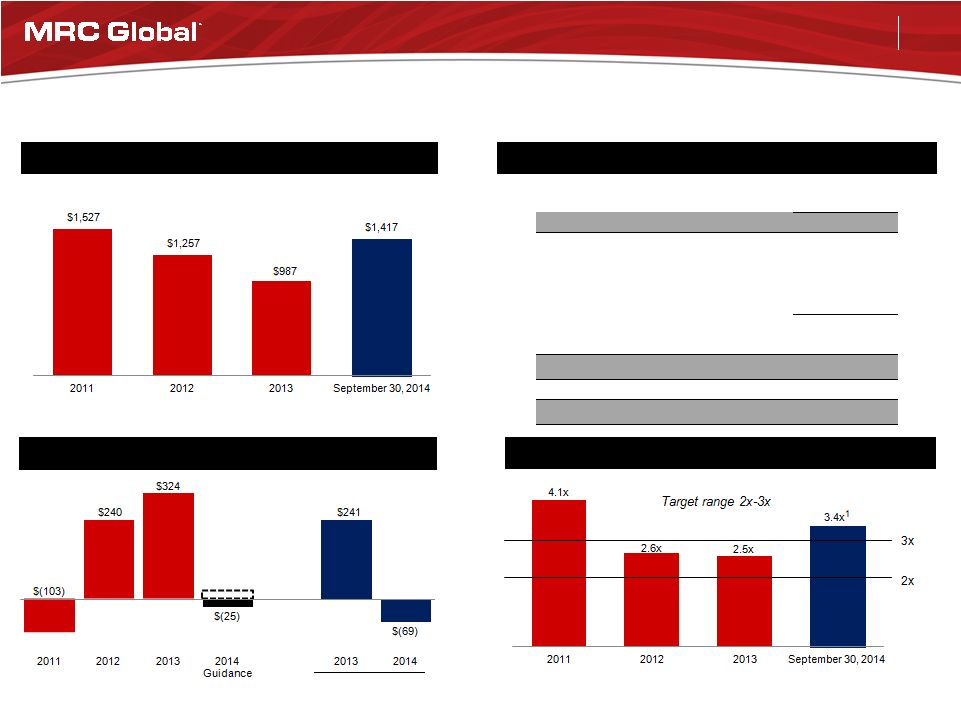
Balance Sheet Metrics
Total Debt
Capital Structure
Cash Flow from Operations
Net Leverage
($ millions)
September 30,
2014
Cash and Cash Equivalents
$ 31
Total Debt (including current portion):
Term Loan B due 2019, net of discount
782
Global ABL Facility due 2019
632
Other
3
Total Debt
$ 1,417
Total Equity
$ 1,425
Total Capitalization
$ 2,842
Liquidity
$ 307
Nine Months Ended
September 30
1.
The
net
leverage
ratio
is
3.25x
pro
forma
for
the
acquisition
of
Stream,
Flangefitt,
MSD and HypTeck.
$25 |
 22
November 2014
Macro drivers
•
Growth in global energy consumption
driving investment
•
Increased global production
•
Need for additional energy infrastructure
•
Expansion of downstream energy
conversion businesses
Investment Thesis Highlights
Leading global PVF distributor to the energy sector
MRC Global attributes
•
Market leader
•
Exposed to all sectors of global energy
•
Long term global customer & supplier
relationships
•
Generates strong cash flow from operations
over the cycle |
 23
November 2014
Appendix |
 24
November 2014
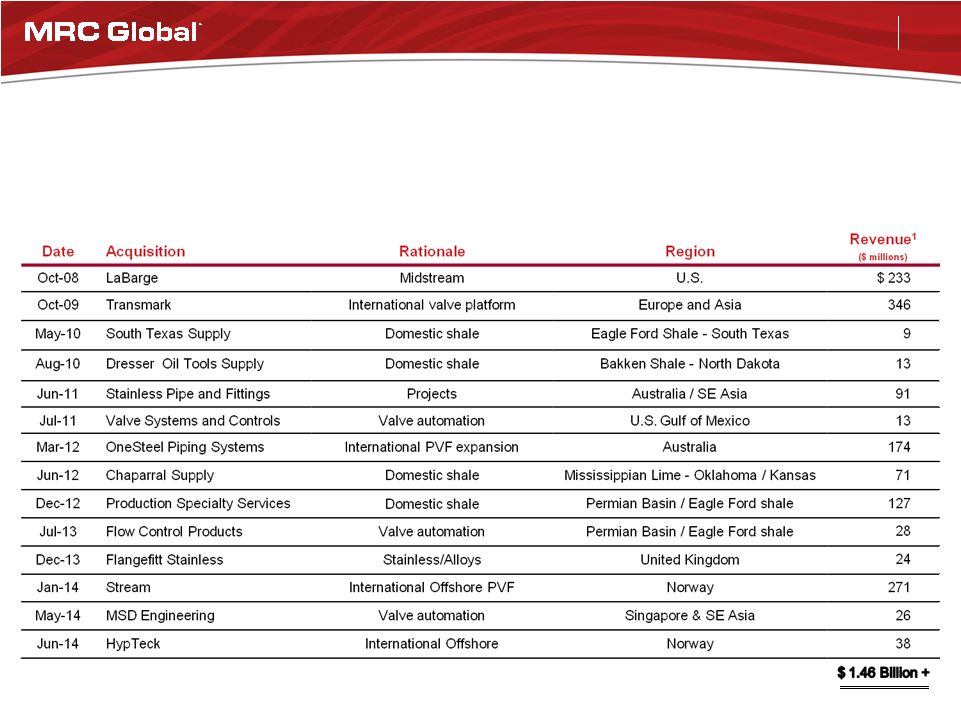
1.
Reflects reported revenues for the year of acquisition or 2013 for Stream, MSD and
HypTeck. M&A -
Track Record of Strategic Acquisitions
•
International branch platform for “super majors”
E&P spend
•
Branch platforms/infrastructure for North American shale plays
•
Global valve and valve automation
•
Global stainless/alloys
Acquisition Priorities |
 25
November 2014
Nine Months Ended
September 30
Year Ended December 31
($ millions)
2014
2013
2013
2012
2011
Net income
$ 113.0
$ 128.8
$ 152.1
$ 118.0
$ 29.0
Income tax expense
60.1
65.5
84.8
63.7
26.8
Interest expense
45.4
46.0
60.7
112.5
136.8
Depreciation and amortization
17.1
16.8
22.3
18.6
17.0
Amortization of intangibles
53.2
39.1
52.1
49.5
50.7
Increase (decrease) in LIFO reserve
5.9
(21.2)
(20.2)
(24.1)
73.7
Expenses associated with refinancing
-
-
5.1
1.7
9.5
Loss on early extinguishment of debt
-
-
-
114.0
-
Change in fair value of derivative instruments
1.7
(0.6)
(4.7)
(2.2)
(7.0)
Equity-based compensation expense
7.4
8.6
15.5
8.5
8.4
Loss on sale of Canadian progressive cavity pump business
6.2
-
-
-
-
Severance & related costs
7.5
0.8
0.8
-
-
Cancellation of executive employment agreement (cash portion)
3.2
-
-
-
-
Insurance charge
-
2.0
2.0
-
-
Foreign currency losses (gains)
1.8
12.0
12.9
(0.8)
(0.6)
Pension settlement
-
-
-
4.4
-
Legal and consulting expenses
-
-
-
-
9.9
Joint venture termination
-
-
-
-
1.7
Other expense (income)
-
1.4
3.0
(0.6)
4.6
Adjusted EBITDA
$ 322.5
$ 299.2
$ 386.4
$ 463.2
$ 360.5
Adjusted EBITDA Reconciliation |
 26
November 2014
Nine Months Ended
September 30
Year Ended December 31
($ millions)
2014
2013
2013
2012
2011
Gross profit
$ 769.6
$ 728.8
$ 954.8
$ 1,013.7
$ 708.2
Depreciation and amortization
17.1
16.8
22.3
18.6
17.0
Amortization of intangibles
53.2
39.1
52.1
49.5
50.7
Increase (decrease) in LIFO reserve
5.9
(21.2)
(20.2)
(24.1)
73.7
Adjusted Gross Profit
$ 845.8
$ 763.5
$1,009.0
$ 1,057.7
$ 849.6
Adjusted Gross Profit Reconciliation |