Attached files
| file | filename |
|---|---|
| EXCEL - IDEA: XBRL DOCUMENT - LIFELOCK, INC. | Financial_Report.xls |
| EX-23.1 - EX-23.1 - LIFELOCK, INC. | lock-ex231_201312319.htm |
| EX-31.2 - EX-31.2 - LIFELOCK, INC. | lock-ex312_2013123110.htm |
| EX-32.2 - EX-32.2 - LIFELOCK, INC. | lock-ex322_201312318.htm |
| EX-31.1 - EX-31.1 - LIFELOCK, INC. | lock-ex311_201312317.htm |
| EX-32.1 - EX-32.1 - LIFELOCK, INC. | lock-ex321_2013123111.htm |
UNITED STATES
SECURITIES AND EXCHANGE COMMISSION
WASHINGTON, D.C. 20549
FORM 10-K/A
Amendment No. 1
|
x |
ANNUAL REPORT PURSUANT TO SECTION 13 OR 15(d) OF THE SECURITIES EXCHANGE ACT OF 1934 |
For the fiscal year ended December 31, 2013
OR
|
¨ |
TRANSITION REPORT PURSUANT TO SECTION 13 OR 15(d) OF THE SECURITIES EXCHANGE ACT OF 1934 |
For the transition period from to
Commission file number: 001-35671
LifeLock, Inc.
(Exact name of registrant as specified in its charter)
|
Delaware |
|
56-2508977 |
|
(State or other jurisdiction of |
|
(I.R.S. Employer |
60 East Rio Salado Parkway, Suite 400
Tempe, Arizona 85281
(Address of principal executive offices and zip code)
(480) 682-5100
(Registrant’s telephone number, including area code)
Securities registered pursuant to Section 12(b) of the Act:
|
|
Title of Each Class |
|
|
|
Name of Each Exchange on Which Registered |
|
|
Common Stock, $0.001 par value |
|
The New York Stock Exchange |
||||
Securities registered pursuant to Section 12(g) of the Act:
None
Indicate by check mark if the registrant is a well-known seasoned issuer, as defined in Rule 405 of the Securities Act. Yes ¨ No x
Indicate by check mark if the registrant is not required to file reports pursuant to Section 13 or Section 15(d) of the Act. Yes ¨ No x
Indicate by check mark whether the registrant (1) has filed all reports required to be filed by Section 13 or 15(d) of the Securities Exchange Act of 1934 during the preceding 12 months (or for such shorter period that the registrant was required to file such reports), and (2) has been subject to such filing requirements for the past 90 days. Yes x No ¨
Indicate by check mark whether the registrant has submitted electronically and posted on its corporate Web site, if any, every Interactive Data File required to be submitted and posted pursuant to Rule 405 of Regulation S-T (§232.405 of this chapter) during the preceding 12 months (or for such shorter period that the registrant was required to submit and post such files). Yes x No ¨
Indicate by check mark if disclosure of delinquent filers pursuant to Item 405 of Regulation S-K (§229.405 of this chapter) is not contained herein, and will not be contained, to the best of registrant’s knowledge, in definitive proxy or information statements incorporated by reference in Part III of this Form 10-K or any amendment to this Form 10-K. ¨
Indicate by check mark whether the registrant is a large accelerated filer, an accelerated filer, a non-accelerated filer, or a smaller reporting company. See the definitions of “large accelerated filer,” “accelerated filer” and “smaller reporting company” in Rule 12b-2 of the Exchange Act. (Check one):
|
Large accelerated filer |
|
x |
|
Accelerated filer |
|
¨ |
|
|
|
|
|
|||
|
Non-accelerated filer |
|
¨ (Do not check if a smaller reporting company) |
|
Smaller reporting company |
|
¨ |
Indicate by check mark whether the registrant is a shell company (as defined in Rule 12b-2 of the Exchange Act). Yes ¨ No x
As of June 30, 2013, the last business day of the registrant’s most recently completed second fiscal quarter, the aggregate market value of the registrant’s voting common stock held by non-affiliates of the registrant was approximately $851.5 million based on the closing price of such stock as reported on The New York Stock Exchange on such date.
As of February 14, 2014, there were outstanding 91,825,308 shares of the registrant’s common stock, $0.001 par value.
DOCUMENTS INCORPORATED BY REFERENCE
Portions of the registrant’s definitive Proxy Statement for its 2014 Annual Meeting of Stockholders are incorporated by reference in Part III of this Annual Report on Form 10-K where indicated. Such Proxy Statement will be filed with the Securities and Exchange Commission within 120 days of the registrant’s fiscal year ended December 31, 2013.
EXPLANATORY NOTE
We are filing this Amendment No. 1 on Form 10-K/A (this “Form 10-K/A”) to amend our Annual Report on Form 10-K for the year ended December 31, 2013, originally filed with the Securities and Exchange Commission (the “SEC”) on February 19, 2014 (“Original Filing”), to restate our audited consolidated financial statements and related disclosures for the year ended December 31, 2013. This Form 10-K/A also includes in Note 19 – “Selected Quarterly Financial Data (unaudited) (Restated)” to the Consolidated Financial Statements included in Part II, Item 8 of this Form 10-K/A restated quarterly financial information for each of the first three quarterly periods in the year ended December 31, 2013, as originally included in our Quarterly Reports on Form 10-Q for those respective periods, as well as for the fourth quarter of 2013. This Form 10-K/A also amends certain other Items in the Original Filing, as listed in “Items Amended in this Form 10-K/A” below, as a result of the restatement. Details are discussed below and in Note 2 – “Summary of Significant Accounting Policies – Restatement of Current Year Financial Statements” and Note 19 – “Selected Quarterly Financial Data (unaudited) (Restated)” to the Consolidated Financial Statements included in Part II, Item 8 of this Form 10-K/A.
Restatement Background
On November 5, 2014, the Audit Committee of our Board of Directors (the “Audit Committee”), after discussion with management and Ernst & Young LLP (“EY”), our independent registered public accounting firm, determined that the following financial statements previously filed with the SEC should no longer be relied upon: (1) the audited consolidated financial statements included in our Annual Report on Form 10-K for the year ended December 31, 2013; (2) the unaudited condensed consolidated financial statements included in our Quarterly Reports on Form 10-Q for the quarters ended March 31, 2013, June 30, 2013, and September 30, 2013; and (3) the unaudited condensed consolidated financial statements included our Quarterly Reports on Form 10-Q for the quarters ended March 31, 2014 and June 30, 2014. Similarly, related press releases, EY’s reports on the consolidated financial statements as of and for the year ended December 31, 2013 and the effectiveness of internal control over financial reporting as of December 31, 2013, management’s report on the effectiveness of internal control over financial reporting as of December 31, 2013, and stockholder communications describing our financial statements for these periods should no longer be relied upon.
In connection with the preparation of our financial statements for the third quarter ended September 30, 2014, we reviewed the calculation of the volatility assumption within the Black-Scholes option pricing model used to compute our share-based compensation expense since our initial public offering in October 2012. Based on this review, we determined that there was an error in the formula used to calculate the annualized volatility, which resulted in a higher volatility and, accordingly, we materially overstated share-based compensation expense for the impacted periods described above.
As a result of this error, we have restated our audited consolidated financial statements for the year ended December 31, 2013 and our unaudited condensed consolidated financial information for the quarters ended March 31, 2013, June 30, 2013, September 30, 2013, and December 31, 2013. The correction of the error resulted in a decrease in our share-based compensation expense for the year ended December 31, 2013 of approximately $3.6 million and, accordingly, our net income available to common stockholders for the year ended December 31, 2013 increased by approximately $2.2 million (including a reduction of income tax benefit of approximately $1.4 million for such period). As share-based compensation expense is a non-cash item, there was no impact to net cash provided by operating activities and there was no impact on our previously reported amounts for adjusted net income, adjusted EBITDA, and free cash flow. As part of the restatement, we also recorded a decrease in income tax benefit and deferred tax assets, net – non-current of approximately $0.2 million to correct an error identified during the finalization of our income tax return for the year ended December 31, 2013.
Restatement of Other Financial Statements
In addition to this Form 10-K/A, we are concurrently filing an amendment to our Quarterly Reports on Form 10-Q for the quarters ended March 31, 2014 and June 30, 2014 (the “Form 10-Q/As”). We are filing the Form 10-Q/As to restate our unaudited condensed consolidated financial statements and related financial information for the periods contained in those reports and to amend certain other Items within those reports.
Internal Control Consideration
Our management has determined that there was a control deficiency in our internal control over financial reporting that constitutes a material weakness, as discussed in Part II, Item 9A of this Form 10-K/A. A material weakness is a deficiency, or combination of control deficiencies, in internal control over financial reporting, such that there is a reasonable possibility that a material misstatement of the annual or interim consolidated financial statements will not be prevented or detected on a timely basis.
For a discussion of management’s consideration of our disclosure controls and procedures and the material weakness identified, see Part II, Item 9A included in this Form 10-K/A.
Items Amended in this Form 10-K/A
For the convenience of the reader, this Form 10-K/A sets forth the Original Filing, in its entirety, as modified and superseded where necessary to reflect the restatement. The following items in the Original Filing have been amended as a result of, and to reflect, the restatement:
|
• |
Part I, Item 1A. Risk Factors |
|
• |
Part II, Item 6. Selected Financial Data |
|
• |
Part II, Item 7. Management’s Discussion and Analysis of Financial Condition and Results of Operations |
|
• |
Part II, Item 8. Financial Statements and Supplementary Data |
|
• |
Part II, Item 9A. Controls and Procedures |
|
• |
Part III, Item 11. Executive Compensation |
In accordance with applicable SEC rules, this Form 10-K/A includes new certifications required by Sections 302 and 906 of the Sarbanes-Oxley Act of 2002, as amended, from our Chief Executive Officer and Chief Financial Officer dated as of the filing date of this Form 10-K/A. This Form 10-K/A also includes a new consent from our independent registered public accounting firm.
The sections of the Original Filing which were not amended are unchanged and continue in full force and effect as originally filed. This Form 10-K/A speaks as of the date of the Original Filing and has not been updated to reflect events occurring subsequent to the Original Filing other than those associated with the restatement of our consolidated financial statements.
TABLE OF CONTENTS
i
SPECIAL NOTE REGARDING FORWARD-LOOKING STATEMENTS
This Form 10-K/A contains “forward-looking statements” that involve substantial risks and uncertainties. The statements contained in this Form 10-K/A that are not purely historical are forward-looking statements within the meaning of Section 27A of the Securities Act of 1933, as amended, or the Securities Act, and Section 21E of the Securities Exchange Act of 1934, as amended, or the Exchange Act, including, but not limited to, statements regarding our expectations, beliefs, intentions, strategies, future operations, future financial position, future revenue, projected expenses, and plans and objectives of management. In some cases, you can identify forward-looking statements by terms such as “anticipate,” “believe,” “estimate,” “expect,” “intend,” “may,” “might,” “plan,” “project,” “will,” “would,” “should,” “could,” “can,” “predict,” “potential,” “continue,” “objective,” or the negative of these terms, and similar expressions intended to identify forward-looking statements. However, not all forward-looking statements contain these identifying words. These forward-looking statements reflect our current views about future events and involve known risks, uncertainties, and other factors that may cause our actual results, levels of activity, performance, or achievement to be materially different from those expressed or implied by the forward-looking statements. Factors that could cause or contribute to such differences include, but are not limited to, those discussed in the section entitled “Risk Factors” included in this Form 10-K/A. Furthermore, such forward-looking statements speak only as of the date on which they are made . Except as required by law, we undertake no obligation to update any forward-looking statements to reflect events or circumstances after the date of such statements. We qualify all of our forward-looking statements by these cautionary statements. In addition, the industry in which we operate is subject to a high degree of uncertainty and risk due to a variety of factors including those described in the section entitled “Risk Factors.” These and other factors could cause our results to differ materially from those expressed in this Form 10-K/A.
Unless otherwise indicated, information contained in this Form 10-K/A concerning our industry and the markets in which we operate, including our general expectations and market position, market opportunity, and market size, is based on information from various sources, on assumptions that we have made that are based on those data and other similar sources, and on our knowledge of the markets for our services. These data involve a number of assumptions and limitations, and you are cautioned not to give undue weight to such estimates. In addition, projections, assumptions, and estimates of our future performance and the future performance of the industry in which we operate are necessarily subject to a high degree of uncertainty and risk due to a variety of factors, including those described in the section entitled “Risk Factors” and elsewhere in this Form 10-K/A. These and other factors could cause results to differ materially from those expressed in the estimates made by third parties and by us.
Unless the context otherwise requires, references in this Form 10-K/A to the “company,” “LifeLock,” “we,” “us,” and “our” refer to LifeLock, Inc. and, where appropriate, its subsidiaries.
“LifeLock,” our logo, and other trade names, trademarks, and service marks of LifeLock appearing in this Form 10-K/A are the property of LifeLock. Other trade names, trademarks, and service marks appearing in this Form 10-K/A are the property of their respective holders.
ii
Overview
We are a leading provider of proactive identity theft protection services for consumers and fraud and risk solutions for enterprises. We protect our members by constantly monitoring identity-related events, such as new account openings and credit-related applications. If we detect that a member’s personally identifiable information is being used, we offer notifications and alerts, including proactive, near real-time, actionable alerts, that provide our members peace of mind that we are monitoring use of their identity and allow our members to confirm valid or unauthorized identity use. If a member confirms that the use of his or her identity is unauthorized, we can proactively take actions designed to protect the member’s identity. We also provide remediation services to our members in the event that an identity theft actually occurs. We protect our enterprise customers by delivering on-demand identity risk and authentication information about consumers. Our enterprise customers utilize this information in real time to make decisions about opening or modifying accounts and providing products, services, or credit to consumers to reduce financial losses from identity fraud.
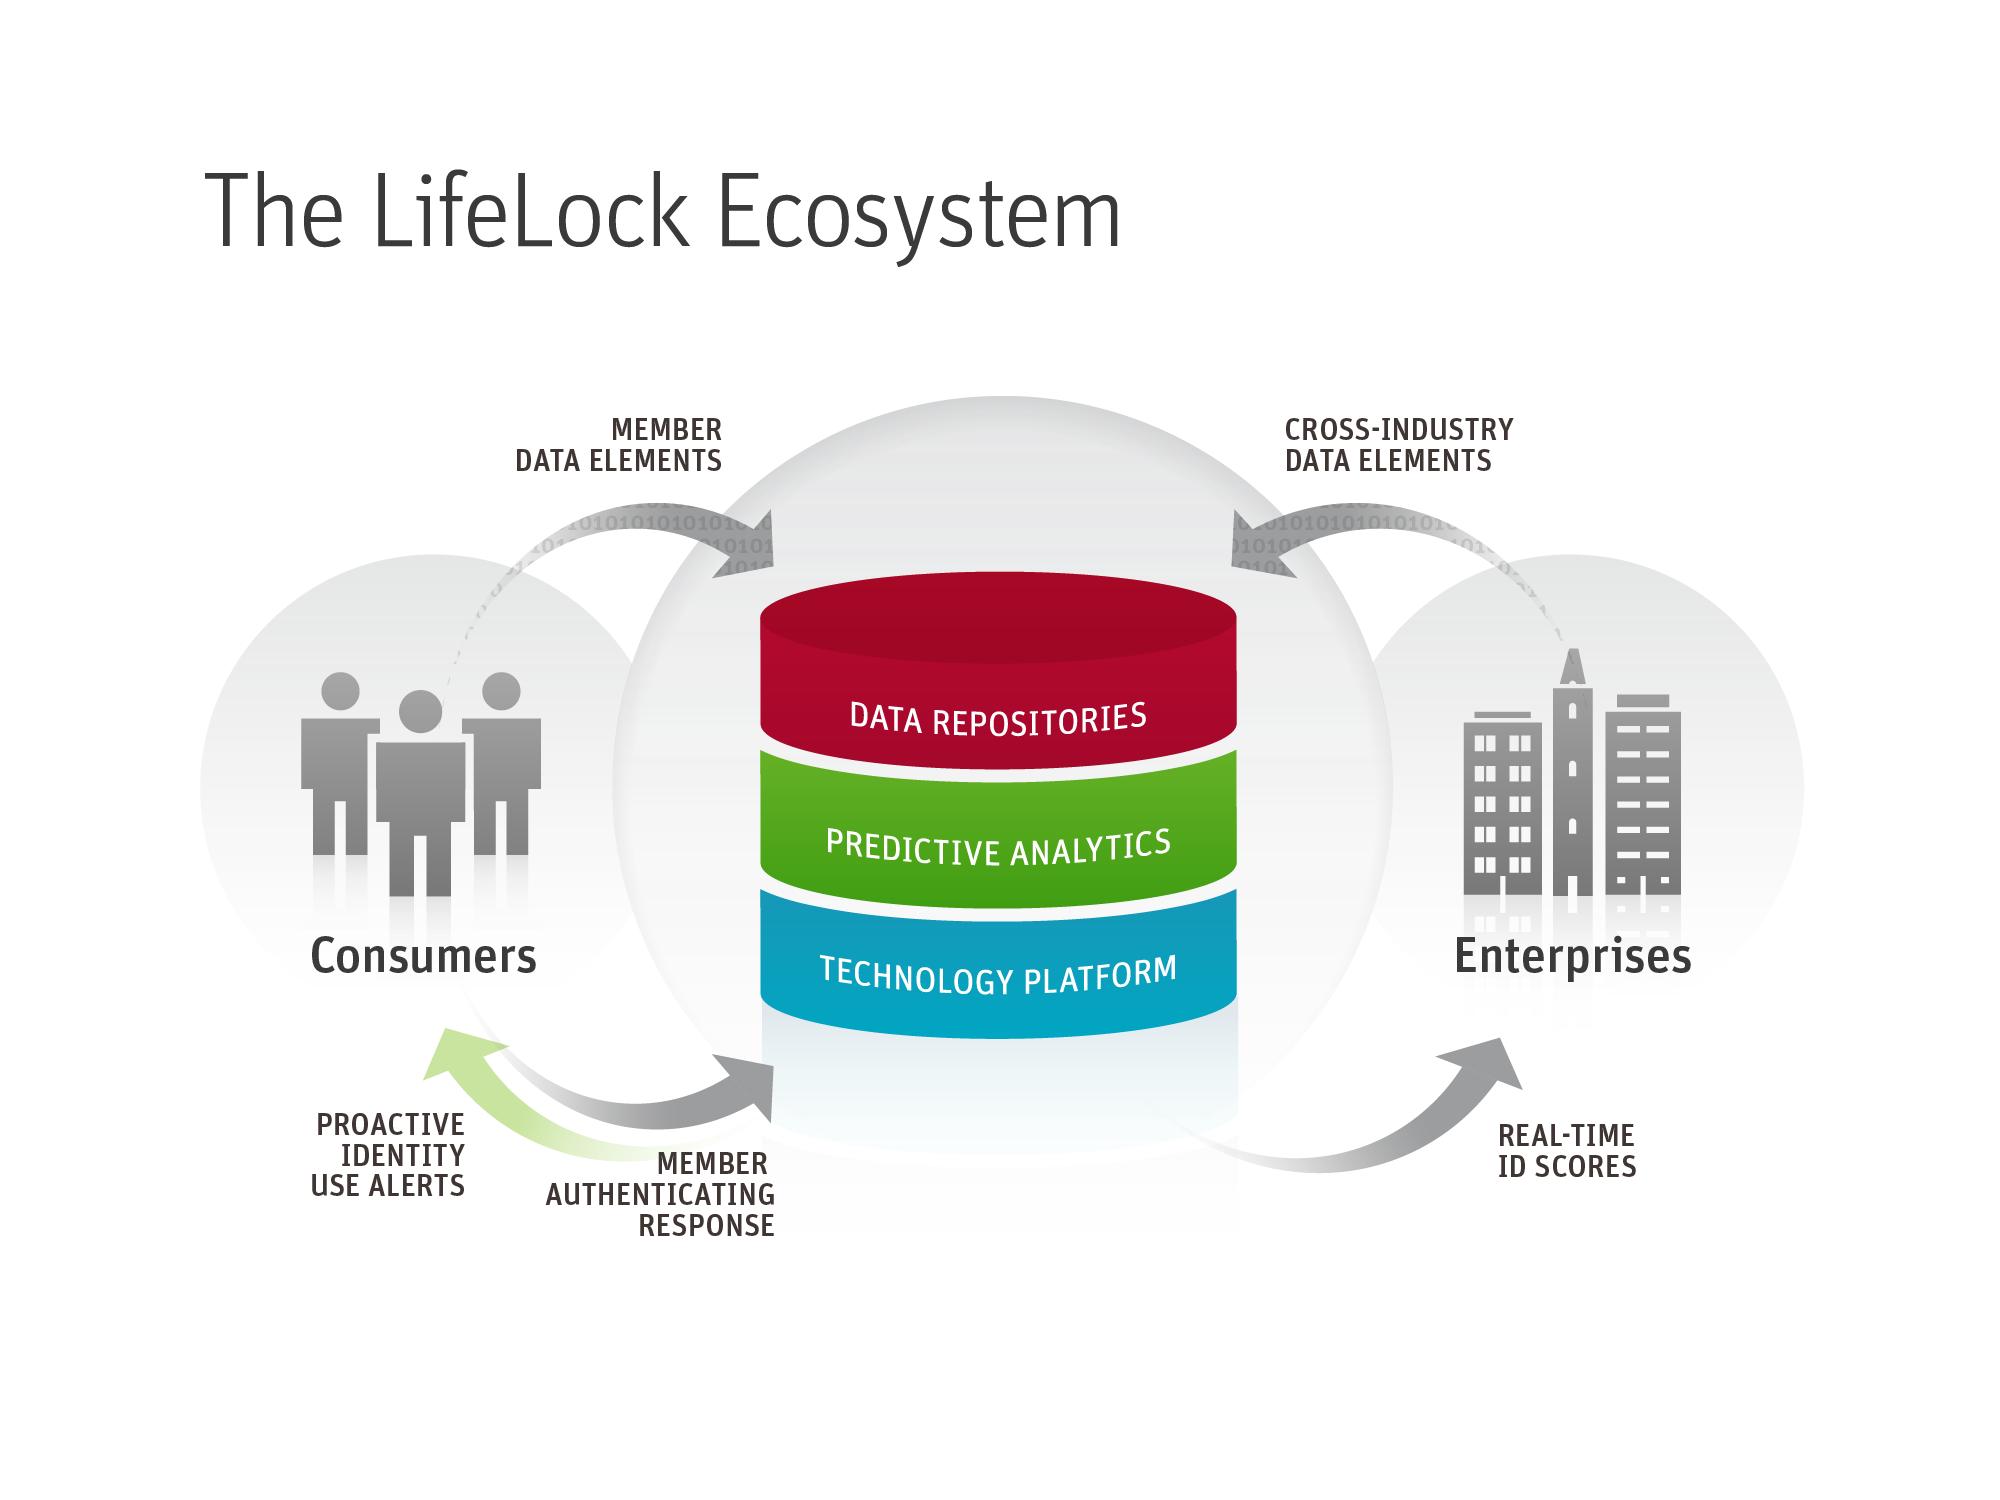
The foundation of our differentiated services is the LifeLock ecosystem. This ecosystem combines large data repositories of personally identifiable information and consumer transactions, proprietary predictive analytics, and a highly scalable technology platform. Our members and enterprise customers enhance our ecosystem by continually contributing to the identity and transaction data in our repositories. We apply predictive analytics to the data in our repositories to provide our members and enterprise customers actionable intelligence that helps protect against identity theft and identity fraud. As a result of our combination of scale, reach, and technology, we believe that we have the most proactive and comprehensive identity theft protection services available, as well as the most recognized brand in the identity theft protection services industry.
We offer our consumer services on a monthly or annual subscription basis. As of December 31, 2013, we served approximately 3.0 million paying members. During 2013, our cumulative ending member base grew 21% and our annual member retention rate increased from 87.1% to 87.8%. Our enterprise customers pay us based on their monthly volume of transactions with us. As of December 31, 2013, we served more than 250 enterprise customers, including six of the top ten U.S. financial institutions, five of the top six U.S. wireless service providers, and eight of the top ten U.S. credit card issuers, as ranked based on assets, subscribers, and purchase volume, respectively.
We generated revenue of $369.7 million in 2013, an increase of $93.3 million from $276.4 million in 2012. The increase was driven by organic growth in our consumer segment of approximately 33.5% and a full year of revenue from our enterprise segment, which we entered in March 2012 with our acquisition of ID Analytics, Inc., or ID Analytics.
On December 11, 2013, we acquired mobile wallet innovator Lemon, Inc., or Lemon, for approximately $42.4 million in cash and launched our new LifeLock Wallet mobile application. The LifeLock Wallet mobile application allows consumers to replicate and store a digital copy of their personal wallet contents on their smart device for records backup, as well as transaction monitoring and mobile use of items such as credit, identification, ATM, insurance, and loyalty cards. The LifeLock Wallet mobile application also offers our members one-touch access to our identity theft protection services.
Industry Overview
Identity theft and identity fraud are significant problems for both consumers and enterprises and are becoming more pervasive as transactions and communications become increasingly digital and mobile. Identity theft typically occurs when an unauthorized party gains access to an individual’s personally identifiable information, such as the individual’s social security number, name, address, phone number, or date of birth. Identity fraud is the actual misuse of the personally identifiable information for financial gain, including purchasing products or services, making withdrawals, modifying existing accounts, or creating false accounts.
As consumers and enterprises become increasingly interconnected and engage in a large number of daily activities that involve personal or financial information, including e-commerce, m-commerce, online banking, social networking, and electronic sharing and storage of records, the risk of identity theft significantly increases. Even seemingly harmless activities, such as sharing personally identifiable information with merchants, employers, doctors, dentists, schools, banks, or insurance companies, can lead to identity theft, as professional thieves now have more sophisticated and creative methods and a broader variety of places from which to steal personal and financial information. Because the most sensitive personally identifiable information, such as a social security number, does not expire, once compromised, it may continue to be at risk of being used for fraud and may be bought and sold repeatedly by criminals.
Identity theft has been the most reported consumer complaint in the United States for the past 13 years, according to the Federal Trade Commission, or the FTC. Forrester Research estimates that 14.9 million adults in the United States, representing 6.2 % of the adult population, were found to be victims of identity fraud in the past 12 months from a LifeLock-commissioned survey fielded in the third quarter of 2013. A commissioned study conducted by Forrester Research on our behalf in the third quarter of 2013 found those who fell victim to identity theft in the past 12 months report the crime cost them, on average, more than $800.
1
A number of trends are contributing to an increased rate of identity theft and identity fraud, including the following:
|
• |
Increasing number of data breaches. Enterprises that act as custodians of personally identifiable information are increasingly subject to hacking, data breaches, and loss of mobile devices with stored personal information, as we saw at the end of 2013 with a series of breaches at a number of large retailers. According to the Data Breach Investigations Report published by Verizon in April 2013, 44.8 million records were compromised by data breaches during 2012, leaving millions of consumers exposed to an increased risk of identity theft. A commissioned study by Forrester Research on our behalf estimates two out of three of those who were notified their personal information may have been compromised in a data breach in the past 12 months reported they experienced identity theft in the past 12 months. |
|
• |
Increase in e-commerce and Internet-based transactions. As more banking, e-commerce transactions, and account openings are conducted over the Internet and through mobile devices, consumers and enterprises are becoming more exposed to an increased risk of identity theft. The increasingly simple nature of online transactions and the ease of e-commerce and online banking allow identity thieves from almost anywhere in the world to conduct numerous fraudulent transactions using the same credit or debit card or other personally identifiable information across a large number of enterprises in a short time span. |
|
• |
Use of social networks. The emergence of social networking has encouraged consumers to share significant amounts of personally identifiable information online, which exposes them to a greater risk of identity theft. Social networking users often share their birthdays, high school names, e-mail addresses, and other information about themselves or their family members that can be accessed easily by identity thieves and used to answer knowledge-based authentication questions, crack passwords, compromise identity security, or gain access to accounts. |
|
• |
Proliferation of mobile devices. The rapid adoption of smartphones, laptops, tablets, and other mobile devices by consumers and enterprises is increasing the risk of identity theft because these devices often contain personally identifiable information, are easy to steal or misplace, and are typically not password protected. |
Challenges in Effectively Protecting Against Identity Theft and Identity Fraud
Consumers and enterprises have historically struggled to protect themselves effectively against identity theft and identity fraud. The most commonly used service by consumers is credit monitoring provided by credit bureaus. Credit monitoring services were originally developed to help consumers monitor their credit ratings by tracking changes to their credit profiles, but as identity theft became a larger problem for consumers, the credit bureaus began marketing these services as identity theft protection. However, the credit bureaus have continued their focus primarily on credit and often sell personal consumer information to third parties. Additionally, some enterprises have attempted to develop their own identity risk assessment capabilities, but these internally developed systems are often based solely on the enterprise’s own records of personal information and customer transactions, sometimes supplemented by credit reports and other third-party information.
We believe that in order to provide the most proactive and comprehensive protection against identity theft and identity fraud, solutions must overcome the following limitations that are common in the market:
|
• |
Reactive response. Credit monitoring services are not proactive and can sometimes take days, weeks, or even a month to alert consumers that their identities have been compromised; however, damage from identity theft may occur either within minutes or hours of the identity theft or sometimes years later. |
|
• |
Credit focus. Traditional solutions that rely on credit monitoring or credit reports do not identify non-credit-related fraud, such as bank fraud, tax fraud, phone or utilities fraud, and employment-related fraud. As a result, credit monitoring and credit reports do not assess a complete spectrum of fraud risk. |
|
• |
Limited visibility. Traditional solutions lack the visibility into transaction data across multiple industries and a direct linkage to consumers in real time. While enterprises closely track their own customer transaction data, they typically have limited access to transaction data from other enterprises, even transactions that could potentially involve the same personally identifiable information. For consumers, traditional credit monitoring services do not have the capability to proactively alert a consumer that his or her personally identifiable information is being used, authenticate whether such use is fraudulent, and provide that feedback to enterprises. |
|
• |
Lack of predictive intelligence. Traditional solutions lack the capability to analyze the connections between consumers, transactions happening across enterprises, and historical fraudulent activities to predict and identify high-risk activities. As a result, traditional solutions cannot accurately predict the likelihood that an identity theft or identity fraud has occurred or may occur. |
|
• |
Ineffective remediation. Traditional solutions often do not offer consumers effective remediation services in the event of an identity theft, leaving consumers on their own during the frustrating remediation process. Because identity theft can result in the creation of multiple fraudulent accounts and transactions, the process of notifying relevant parties and restoring a consumer’s identity can be time consuming and sometimes expensive and require expertise to remediate effectively, as stolen personally identifiable information does not expire and can be reused again by identity thieves in the future. |
2
Market Opportunity
We believe that there is a significant, underpenetrated market opportunity for proactive identity theft protection services for consumers and fraud and risk solutions for enterprises. Based on our research indicating that two-thirds of U.S. adults are concerned about identity theft, we believe the total addressable market for our consumer identity theft protection services is approximately 148 million adults in the United States alone. We focus our efforts on adults with a household income in excess of $50,000 per year and who are concerned about identity theft, of which we estimate there are approximately 78 million in the United States. Additionally, international markets could provide substantial opportunities for us in the future. We believe the total addressable market for our enterprise fraud and risk solutions includes approximately 2.5 billion transactions per year, based on our analysis of industry research, public filings, industry trade publications, and U.S. government studies.
Our Solution
We are a leading provider of proactive identity theft protection services for consumers and fraud and risk solutions for enterprises. The foundation of our differentiated services is the LifeLock ecosystem that combines large and constantly expanding data repositories of personally identifiable information and consumer transactions that we collect from our enterprise customers, members, and third-party fulfillment partners; proprietary predictive analytics; and a highly scalable technology platform that allows us to interact with our customers and to proactively deliver actionable alerts to, and receive feedback from, our members and enterprise customers about potentially suspicious activity. Each day, we collect and analyze millions of data elements impacting personally identifiable information, factor in responses from our customer base to determine risk-based metrics, and enable our customers to proactively protect against identity theft and significantly reduce the risk of identity fraud. The strength of the LifeLock ecosystem, as depicted in the diagram below, and the effectiveness of our services are enhanced with every actionable alert and transaction that we process and every new data element that we acquire.
In our consumer business, we protect our members by proactively monitoring identity-related events, such as new account openings and credit-related applications, that may present a risk of identity theft. If we detect that a member’s personally identifiable information is being used, we send notifications and alerts, including proactive, near real-time, actionable alerts, to the member via text message, phone call, or e-mail through our LifeLock Identity Alert system that allows the member to confirm valid or unauthorized identity use. However, we only issue phone alerts between 9 am and 9 pm in order to be respectful of our members. Phone alerts that would otherwise be sent after 9 pm are sent at 9 am the following morning. If the member confirms that the use of his or her identity is unauthorized, we can proactively take actions designed to protect the member’s identity. Member responses to our alerts provide information that enhance the member’s profile in the LifeLock ecosystem, which helps improve the identity protection we can provide that member in the future. In addition, we notify our members of events or potential threats and exposures related to their personally identifiable information, such as a change of a member’s address or the appearance of a member’s personally identifiable information on a known criminal website or a peer-to-peer network. In the event that an identity theft actually occurs, we utilize our extensive expertise to actively help the member remediate the impact of the identity theft event. This includes our $1 million service guarantee, which is backed by an identity theft insurance policy, under which we will spend up to $1 million to cover certain third-party expenses incurred in connection with the remediation, such as legal and investigatory fees. This insurance
3
also covers certain out-of-pocket expenses to the member, such as loss of income, replacement of fraudulent withdrawals, and costs associated with child and elderly care, travel, and replacement of documents.
In our enterprise business, we deliver on-demand fraud and risk solutions and authentication information about consumers to our enterprise customers in their daily transaction flows. Our enterprise customers utilize this information in real time to authenticate their customers, assess their risk profile, and enhance the enterprise’s decision making process on which to base account opening, lending, credit, and other risk-based decisions. By integrating our services into their business processes, our enterprise customers can reduce potential financial losses from identity fraud. Information generated from the transaction flow at our enterprise customers is transmitted back to our data repositories, which continually enhances the LifeLock ecosystem and helps strengthen the services we can provide to our customers in the future.
Our Competitive Strengths
We believe that the LifeLock ecosystem enables us to provide proactive and comprehensive identity theft protection services for consumers and fraud and risk solutions for enterprises and provides us with numerous competitive strengths that differentiate us and that are critical to our success, including the following:
|
• |
Breadth and depth of our data repositories. The LifeLock ecosystem includes data repositories that contain over one trillion identity elements, including personally identifiable information, transaction data, and fraud instances across multiple industries. In addition, our enterprise customers provide us with an average of over 50 million new identity elements per day. The LifeLock ecosystem is augmented with data from third-party fulfillment partners and by the feedback from actionable alerts sent to our members through our LifeLock Identity Alert system. We believe that the breadth and depth of our proprietary data, which has been generated over more than ten years, would be difficult to replicate and creates a substantial barrier to entry. |
|
• |
Strong network effects. We believe that the LifeLock ecosystem provides strong network effect benefits to our members and enterprise customers. Transactions that flow through our enterprise business generate actionable alerts for our members. Our members are then able to confirm back to us whether or not they are participating in the identified transactions, which creates a bona fide and deterministic check that enhances the identity information in our data repositories. This feedback loop strengthens our data repositories and creates a network effect that improves the precision and sophistication of our algorithms as we continue to add more customers, acquire more data, process more actionable alerts, and analyze more transactions. |
|
• |
Patented and proprietary analytics. The LifeLock ecosystem utilizes our patented and proprietary predictive analytics to evaluate current and past consumer transaction data, analyze connections between personally identifiable information of individuals, and assess the stability and authenticity of an individual’s identity. We leverage our patented analytics to provide our enterprise customers with a sub-second assessment of risks associated with transacting based on identity information presented to them. We believe that our analytical capabilities differentiate the quality and effectiveness of the services we provide and help drive subscriptions by new members and adoption by enterprise customers. |
|
• |
Most comprehensive service offerings. The LifeLock ecosystem has enabled us to develop what we believe to be the most proactive and comprehensive identity theft protection services for consumers and fraud and risk solutions for enterprises. The breadth and depth of our data and our predictive analytics coupled with the confirmatory alert feedback from our members provides our enterprise customers with a more effective risk assessment of their customers. |
|
• |
Leadership position. We believe that we have the leading brand in the identity theft protection services industry. Ongoing surveys commissioned by us since 2010 indicate that our unaided brand awareness is between two and three times higher than our nearest competitor. We have developed our highly recognized brand through our core value proposition, comprehensive service offerings, marketing strategy, and emphasis on customer service. We believe that our brand awareness, technology, and service offerings contribute to our ability to maintain and grow our leadership position in the identity theft protection and fraud and risk solutions markets. |
Our Strategy
Our goal is to be the leading provider of proactive identity theft protection services for consumers and fraud and risk solutions for enterprises. The key elements of our strategy to achieve this goal include the following:
|
• |
Extend our leadership position through continued enhancement of our services. The identity theft protection services industry is large and expanding and provides a significant growth opportunity. We intend to grow our business by introducing new services and expanding the services we offer, such as the LifeLock Wallet mobile application. We believe there are many additional areas in which protection and authentication of personally identifiable information is important, such as password management and protection and tax return fraud protection, and we intend to explore and consider these markets. |
|
• |
Expand our data repositories and analytics. We intend to expand our data repositories with valuable and differentiated data from new and existing enterprise customers and continue to supplement our repositories with data from third-party fulfillment partners. As we grow our membership base, we expect an increase in the number of alerts and responses to such |
4
|
alerts flowing through the LifeLock ecosystem to reinforce the breadth and depth of our data and visibility into consumer behavior. We intend to continue to enhance our algorithms to apply more sophisticated analytics to more types of consumer transactions and to detect potential identity theft attempts more effectively and proactively. |
|
• |
Grow our customer base. We intend to leverage our marketing campaigns and existing and new strategic partners as well as the relationships with our enterprise customers to grow our membership base. We believe that continued investments in these areas will allow us to enhance our premium brand and product superiority message, increase awareness of the need for our consumer services, and enhance our ability to efficiently acquire new members. We also intend to leverage the effectiveness of the LifeLock ecosystem to demonstrate to potential new enterprise customers the benefits of becoming part of our ecosystem with the goal of expanding our enterprise customer base. |
|
• |
Continue our focus on customer retention. We plan to invest in increasing member retention by optimizing and expanding the number of value-added, proactive alerts we send to our members to provide them peace of mind and convenience and to demonstrate the value of our services. For our enterprise customers, we plan to invest in making our services easy to integrate into their business processes and expanding the types of risk assessment services we provide to our enterprise customers. |
|
• |
Increase sales to existing customers. We believe the strong customer satisfaction we maintain with our members provides us with the opportunity to provide new services to them. We also believe a substantial opportunity exists to increase the penetration of our premium- level consumer services. Over time, we plan to add additional service offerings for our members to further drive monetization. In our enterprise business, we believe we have the opportunity to attain deeper penetration of our existing customers’ organizations by expanding across various departments and new lines of business within enterprises that already use our service and by adding new services. |
The LifeLock Ecosystem
The core of our solution is the LifeLock ecosystem, which enables us to offer a proactive and comprehensive approach to identity theft protection and fraud and risk solutions. In addition to our extensive network of members, enterprise customers, and third-party fulfillment partners, the key components of our ecosystem include the following:
Proprietary Data Repositories
Our data repositories contain over one trillion identity elements, including personally identifiable information, transaction data, and fraud instances across multiple industries. This data has been collected over many years and is continually enhanced by new data provided by our enterprise customers. Our enterprise customers provide us with an average of over 50 million new identity elements per day. The LifeLock ecosystem is further enhanced by data we source from third-party fulfillment partners and by the feedback from actionable alerts sent to our members through our LifeLock Identity Alert system. More importantly, our data repositories contain contextual information on how, where, and when these identity elements were used.
Our data repositories include the aggregation of relevant data on consumer transactions and behavior that expands over time as consumers engage in ongoing transactions, which enables us to identify potentially suspicious behavior in real time related to new transactions. For example, the repositories keep track of a consumer’s history of credit card applications, wireless accounts, mortgage applications, and other transactions, and this information can be used to determine customer stability over time and to assess risk. Additionally, the repositories enable analysis of the interconnectedness of individuals. For example, if an individual has the same address as five different individuals, or shares a cell phone with ten other people, the repositories keep track of this information for further risk analysis.
In our enterprise business, the personally identifiable information in our data repositories is not shared with our enterprise customers except under certain circumstances with specific services as permitted under the Fair Credit Reporting Act, or FCRA, and the Gramm-Leach-Bliley Act. We also take extensive measures to prevent the data in our repositories from being comingled with the data and information that we receive from our members and third-party fulfillment partners.
Predictive Analytics
We apply patented and proprietary predictive analytics to the data in our repositories to generate immediate and actionable intelligence that helps protect against identity theft and identity fraud. We leverage these patented analytics and other related processes to provide real-time visibility into personal data topologies, which we define as a collection of unique identity elements and the connectedness of these elements to each other and to other people, and transactions that indicate risk. Analysis of these data topologies reveals patterns that can be used to evaluate stability and authenticity of consumers as well as identify anomalies that suggest identity risk. For example, our analytics will not only reveal information about a consumer’s link to a known fraud or credit loss, but also to potential associations with identity thieves through sharing of an address or phone number or using the same personally identifiable information to attempt to establish new accounts at multiple enterprises at the same time. This information can be used by enterprises to determine the identity risk of customers and potential fraud in real time.
5
Technology Platform
We have built a robust technology platform that allows for seamless connectivity between our internal systems and our members, users of the LifeLock Wallet mobile application, and enterprise customers. Our technology platform enables our enterprise customers to share transaction data with us on an ongoing basis and allows us to deliver on-demand, proprietary risk scores and other identity risk-related metrics and reason codes for each transaction our enterprise customers run through the LifeLock ecosystem. Direct connection to our technology platform allows our enterprise customers to determine risk associated with a particular transaction on a sub-second basis. The technology behind our LifeLock Identity Alert system enables us to deliver alerts to our members and provides them with the ability to confirm back to us whether or not they are participating in a transaction. Based on a member’s response regarding participation in a transaction, we can proactively take actions designed to protect both the member and the enterprise customer from becoming victims to a fraudulent transaction.
Our Services
We are a leading provider of proactive identity theft protection services for consumers and fraud and risk solutions for enterprises.
Consumer Services
We currently offer our identity theft protection services to consumer subscribers under our basic LifeLock, LifeLock Command Center, LifeLock Junior, and premium LifeLock Ultimate services. At the heart of our proactive consumer service offerings is our LifeLock Identity Alert system, which provides our members with notifications and alerts, including proactive, near real-time, actionable alerts, and a response system for identity threats via text message, phone call, or e-mail. We have continued to see success with our LifeLock Ultimate service. In 2013, more than 40% of our gross new members enrolled in the service. During the third fiscal quarter of 2013, we surpassed 20% of our cumulative ending members enrolled in our LifeLock Ultimate service. The following table summarizes the identity theft protection services that we currently offer to our members.
|
Feature |
LifeLock |
LifeLock Command Center |
LifeLock Ultimate |
|
Notification of credit |
ü |
ü |
ü |
|
Monitoring of known criminal websites for illegal trading of personal information |
ü |
ü |
ü |
|
Scans of national databases for new address information |
ü |
ü |
ü |
|
Stolen or lost wallet remediation |
ü |
ü |
ü |
|
Removal from pre-approved credit offers |
ü |
ü |
ü |
|
Access to a dedicated remediation specialist |
ü |
ü |
ü |
|
Service guarantee with benefits provided under a zero deductible identity theft insurance policy |
ü |
ü |
ü |
|
Surveillance of peer-to-peer networks |
|
ü |
ü |
|
Monitoring of public and court records |
|
ü |
ü |
|
Patrol for use of known alternate names |
|
ü |
ü |
|
Monitoring of payday loans nationwide |
|
ü |
ü |
|
Alerts when new checking and savings accounts are opened |
|
|
ü |
|
Scans for changes to contact information on existing checking and savings accounts |
|
|
ü |
|
Online tri-bureau credit reports and scores |
|
|
ü |
|
Alerts when credit inquiries appear on a member’s credit report |
|
|
ü |
|
Monthly tracking of TransUnion credit score |
|
|
ü |
|
Retail list pricing |
$10 per month $110 per year |
$15 per month $165 per year |
$25 per month $275 per year |
Once enrolled in our services, a member may also purchase our LifeLock Junior service, which provides identity theft protection services for minors. In addition, the LifeLock Wallet mobile application allows consumers to replicate and store a digital copy of their personal wallet contents on their smart device for records backup, as well as transaction monitoring and mobile use of items such as credit, identification, ATM, insurance, and loyalty cards. The LifeLock Wallet mobile application also offers our members one-touch access to our identity theft protection services. As part of our consumer services, we offer 24x7x365 member service support. If a member’s identity has been compromised, our member service team and remediation specialists will assist the member until the issue has been resolved. This includes our $1 million service guarantee, which is backed by an identity theft insurance policy, under which we will spend up to $1 million to cover certain third-party costs and expenses incurred in connection with the remediation, such as legal and investigatory fees. This insurance also covers certain out-of-pocket expenses, such as loss of income, replacement of fraudulent withdrawals, and costs associated with child and elderly care, travel, and replacement of documents.
Our consumer services are enhanced by services provided by our third-party fulfillment partners. In January 2014, we entered into a Technology Services Agreement with CSIdentity Corporation, or CSI, which replaced and superseded in its entirety the
6
Amended and Restated Reseller Agreement with CSI dated November 12, 2008, as amended. Pursuant to this Technology Services Agreement, we purchase certain CSI services. These services comprise a part of our identity theft protection services for consumers and include, among others, non-credit related reports, certain credit reports and scores, and monitoring services. Our agreement with CSI expires February 15, 2018 and will renew automatically for consecutive 12-month periods, unless we notify CSI of our intent not to renew at least 90 days prior to the expiration of either the initial term or a renewal term or CSI notifies us of its intent not to renew at least 180 days prior to the expiration of either the initial term or a renewal term. In July 2011, we entered into an Identity Protection Service Provider Agreement with Early Warning Services, LLC, pursuant to which we market certain alerts generated from data gathered by Early Warning Services, LLC. These alerts consist of information regarding the checking and savings accounts of our members and the use of our members’ personally identifiable information in connection with checking and savings accounts, a key feature of our consumer service offerings. Our agreement with Early Warning Services, LLC expires in July 2014 and is subject to automatic renewal for one-year terms unless either party provides prior written notice of non-renewal.
Enterprise Services
Our fraud and risk solutions provide real-time visibility into consumer behavior that enables our enterprise customers to better assess the risk of identity fraud. Our flagship identity risk service, ID Score, delivers an accurate, on-demand assessment of the risk of an individual at account opening and throughout the customer lifecycle. Our fraud and risk solutions are designed to provide our enterprise customers with visibility into consumer behavior to enable them to better assess the risk of an individual and potential fraud, including the following:
|
• |
Fraud detection and identity verification. Our services proactively separate legitimate and suspicious identities in order to detect fraud and avoid customer friction and abandonment. Enterprises can quickly discern legitimate consumers from potentially risky individuals with our fraud and risk solutions designed to deliver a complete picture of the risk of an individual and potential fraud at any point in the customer lifecycle. This assessment enables enterprises to answer two fundamental questions: is the consumer who the consumer claims to be, and what is the risk of doing business with this consumer? |
|
• |
Identity-related compliance. Our services reduce the regulatory compliance costs normally associated with regulations, such as the Patriot Act and FTC Red Flags regulations, which require the review of identities presented by applicants. Our services address regulatory compliance requirements by utilizing unique data across multiple industries to help clear and remediate identities, ultimately reducing the volume of manual reviews. |
These capabilities help prevent our enterprise customers from providing products or services to an individual misrepresenting the individual’s identity by, among other things, using another individual’s social security number, name, address, phone number, or date of birth.
We also offer credit risk services that are designed to provide real-time visibility into consumer stability and that augment and enhance traditional credit scores. Our credit risk services utilize our proprietary data repositories, which include alternative credit data not reported to the credit bureaus such as wireless customer and payday lending data. This provides our enterprise customers with better information on which to base account opening, lending, and credit decisions throughout the customer lifecycle to maximize revenue opportunities and reduce risk.
We offer our enterprise services through an on-demand platform under multi-year contracts with monthly transaction-based pricing. We believe these services enable our enterprise customers to reduce fraud and credit losses, improve collection performance, increase revenue, reduce decision making time, protect customers, and minimize customer friction.
Sales and Marketing
Consumer Services
We pursue a multi-channel member acquisition and brand marketing program. This program is designed to grow our member base by increasing brand awareness, driving our product superiority message, and maximizing our reach to prospective members.
Consumer marketing. We utilize consumer advertising and direct response marketing to elevate our brand, attract new members, and generate significant demand for our services. We use a variety of marketing programs to target members, including radio, television, and print advertisements; direct mail campaigns; our LifeLock Wallet mobile application; press coverage for our company and our services; online display advertising; paid search and search-engine optimization; third-party endorsements; and education programs. In 2013, we derived just over half of our gross new members from our consumer marketing programs.
Partner distribution channels. We utilize strategic and affiliate partner distribution channels to refer prospective members to us and assist us in selling our consumer services to our partners’ and affiliates’ customer bases. We have developed and implemented a national sales organization that targets new partners to enhance our partner distribution channels. In 2013, we derived just under half of our gross new members from our partner distribution channels. These channels include the following:
|
• |
Co-marketing. In this channel, our co-marketing partners, such as US Airways, send co-branded advertisements through direct mail, e-mail, or other communication means to their customer bases. |
7
|
• |
Embedded product. In this channel, our partners, such as AOL, embed our consumer services into their products and services and pay us on behalf of their customers. |
|
• |
Employee benefit. In this channel, our partners offer our consumer services as an optional employee benefit as part of their employee benefit program. |
|
• |
Online affiliates. In this channel, our online affiliates, at their own cost, create independent websites and marketing materials to drive prospective members to our consumer service offerings. |
|
• |
Data breach. In this channel, enterprises that have experienced a data breach pay us to provide our services free of charge to the victims of the data breach. |
Enterprise Services
We utilize a combination of direct and indirect sales and marketing strategies to market our enterprise services. Our internal sales organization is structured based on strategic accounts and industry verticals and is supported by account management, customer service, and customer implementation support teams. We have and continue to develop strategic partnerships with key industry verticals. As part of our sales strategy, we typically offer our prospective enterprise customers the opportunity to provide us with historical data so that we can demonstrate the return on investment had our services been deployed over a specific period of time.
Customer Service
We focus on retention of our current members and believe our ability to establish and maintain long-term relationships with our members depend, in part, on the strength of our member services organization. We have more than 200 employees in our member services organization. Our Tempe, Arizona member service center is open 24x7x365. Our members can communicate with our member service representatives by e-mail or telephone. We also leverage frequent communication and feedback from our members and enterprise customers to continually improve our services.
Customers
Members. As of December 31, 2013, we had approximately 3.0 million members. Our members range from those looking to minimize the risk of identity theft and identity fraud to those who have experienced the personal traumatic event of an identity theft and want the protection and services and peace of mind we provide. Most of our members are paying subscribers who have enrolled in our consumer services directly with us on a monthly or annual basis. A small percentage of our members receive our consumer services through a third-party enterprise that pays us directly, often as a result of a breach within the enterprise or by embedding our service within a broader third-party offering.
Enterprise Customers. We have approximately 50 direct enterprise customers, which include leading financial institutions, telecommunication and cable services providers, government agencies, and technology companies. Through our direct enterprise customers, we also provide our enterprise services to more than 200 indirect enterprise customers, including large retailers, automobile and mortgage lenders, and e-commerce providers. No single enterprise customer accounted for 10% or more of our total enterprise revenue in 2012 or 2013.
Competition
We operate in a highly competitive and rapidly evolving business environment. We believe that the competitive factors in our market include access to a breadth of identity and consumer transaction data, broad and effective service offerings, brand recognition, technology, effective and cost-efficient customer acquisition, customer satisfaction, price, and quality and reliable customer service. Our primary competitors are the credit bureaus that include Experian, Equifax, and TransUnion, as well as others, such as Affinion, Early Warning Systems, Intersections, and LexisNexis. Some of our competitors have substantially greater financial, technical, marketing, distribution, and other resources than we possess that afford them competitive advantages. As a result, they may be able to devote greater resources to the development, promotion, and sale of services, to deliver competitive services at lower prices or for free, and to introduce new solutions and respond to market developments and customer requirements more quickly than we can.
We believe that the combination of our brand awareness, industry experience, strong retention rate, growing customer base, quality customer service, and extensive data repositories and analytics capabilities provide us with significant competitive advantages. These advantages include our ability to detect and address risk proactively and rapidly; our growing data repositories of personally identifiable information and consumer transactions that would be difficult to replicate; our enhanced capability to assess the probability of identity threats; our enhanced visibility into consumer stability and behavior to detect the recurrence of identity threats; our ability to protect both consumers and enterprises against identity threats; our ability to reach an expanding total addressable market concerned about identity theft; and our ability to offer additional services to protect consumers and enterprises against identity theft and identity fraud.
8
Intellectual Property
We protect our intellectual property rights primarily through a combination of foreign, federal, state, and common law rights, as well as contractual restrictions. We control access to our proprietary technology by entering into confidentiality and invention assignment agreements with our employees and contractors and confidentiality agreements with third parties.
In addition to these contractual arrangements, we also rely on a combination of patents, trademarks, service marks, domain names, copyrights, and trade secrets to protect our intellectual property. As of December 31, 2013, we held five U.S. patents covering various systems and methods for identity based fraud detection, and also had five U.S. patent applications pending. We pursue the registration of our trademarks, service marks, and domain names in the United States and in certain locations abroad. Our registered trademarks in the United States include “LifeLock,” “LifeLock Identity Alert,” our logo, “ID Analytics,” and “ID Score.”
Circumstances outside our control could pose a threat to our intellectual property rights. Effective intellectual property protection may not be available, and the efforts we have taken to protect our proprietary rights may not be sufficient or effective. Any significant impairment of our intellectual property rights could harm our business or our ability to compete. In addition, protecting our intellectual property rights is costly and time consuming. Any unauthorized disclosure or use of our intellectual property could make it more expensive to do business and harm our operating results.
Companies in the Internet and other industries may own a large number of patents, copyrights, and trademarks and may frequently request license agreements, threaten litigation, or file suit against us based on allegations of infringement or other violations of intellectual property rights. From time to time, we face, and we expect to face in the future, allegations that we have infringed the trademarks, copyrights, patents, and other intellectual property rights of third parties, including our competitors. As we face increasing competition and as our business grows, we will likely face more claims of infringement.
Governmental Regulation
Our business and the information we use in our business is subject to a wide variety of federal, state, foreign, and local laws and regulations, including the FCRA, the Gramm-Leach-Bliley Act, the FTC Act and comparable state laws that are patterned after the FTC Act, and similar laws. We also are subject to federal and state laws and regulations relating to the channels in which we sell and market our services. In addition, our business is subject to the FTC Stipulated Final Judgment and Order for Permanent Injunction and Other Equitable Relief, which we refer to as the “FTC Order,” as well as the companion orders with 35 states’ attorneys general that we entered into in March 2010. We incur significant costs to operate our business and monitor our compliance with these laws, regulations, and consent decrees. Any changes to the existing applicable laws or regulations, or any determination that other laws or regulations are applicable to us, could increase our costs or impede our ability to provide our services to our customers, which could have a material adverse effect on our business, operating results, financial condition, and prospects. In addition, any of these laws or regulations is subject to revision, and we cannot predict the impact of such changes on our business. Further, any determination that we have violated any of these laws, regulations, or consent decrees may result in liability for fines, damages, or other penalties, which could have a material adverse effect on our business, operating results, financial condition, and prospects.
We also are subject to federal, state, and foreign laws regarding privacy and protection of data. We post on our website our privacy policy and our terms and conditions, which describe our practices concerning the use, transmission, and disclosure of data. Any failure by us to comply with our posted privacy policy or privacy-related laws and regulations could result in proceedings against us by governmental authorities or others, which could harm our business. In addition, the interpretation of data protection laws, and their application to the Internet, is unclear and in a state of flux. There is a risk that these laws may be interpreted and applied in conflicting ways from state to state, country to country, or region to region, and in a manner that is not consistent with our current data protection practices. Complying with these varying requirements, the evolving nature of all of these laws and regulations, the evolving nature of various governmental bodies’ enforcement efforts, and the possibility of new laws in this area, could increase our costs or impede our ability to provide our services to our customers, which could have a material adverse effect on our business, operating results, financial condition, and prospects. Further, any failure by us to adequately protect our members’ privacy and data could result in a loss of member confidence in our services and ultimately in a loss of members and enterprise customers, which could adversely affect our business.
In March 2010, we and Todd Davis, our Chairman and Chief Executive Officer, entered into the FTC Order. The FTC Order was the result of a settlement of the allegations by the FTC that certain of our advertising and marketing practices constituted deceptive acts or practices in violation of the FTC Act, which settlement made no admission as to the allegations related to such practices. The FTC Order imposes on us and Mr. Davis certain injunctive provisions relating to our advertising and marketing of our identity theft protection services, such as enjoining us from making any misrepresentation of “the means, methods, procedures, effects, effectiveness, coverage, or scope of” our identity theft protection services. However, the bulk of the more specific injunctive provisions have no direct impact on the advertising and marketing of our current services because we have made significant changes in the nature of the services we offer to consumers since the investigation by the FTC in 2007 and 2008, including our adoption of new technology that permits us to provide proactive protection against identity theft and identity fraud. The FTC investigation of our advertising and marketing activities occurred during the time that we relied significantly on the receipt of fraud alerts from the credit reporting agencies for our members. The FTC believed that such alerts had inherent limitations in terms of coverage, scope, and
9
timeliness. Many of the allegations in the FTC complaint, which accompanied the FTC Order, related to the inherent limitations of using credit report fraud alerts as the foundation for identity theft protection. Because the injunctive provisions in the FTC Order are tied to these complaint allegations, these injunctive provisions similarly relate significantly to our previous reliance on credit report fraud alerts as reflected in our advertising and marketing claims. The FTC Order also imposes on us and Mr. Davis certain injunctive provisions relating to our data security for members’ personally identifiable information. At the same time, we also entered into companion orders with 35 states’ attorneys general that impose on us similar injunctive provisions as the FTC Order relating to our advertising and marketing of our identity theft protection services.
Our or Mr. Davis’ failure to comply with these injunctive provisions could subject us to additional injunctive and monetary remedies as provided for by federal and state law. In addition, the FTC Order imposes on us and Mr. Davis certain compliance requirements, including the delivery of an annual compliance report. We and Mr. Davis have timely submitted these annual compliance reports, but the FTC has not accepted or approved them to date. If the FTC were to find that we or Mr. Davis have not complied with the requirements in the FTC Order, we could be subject to additional penalties and our business could be negatively impacted.
The FTC Order provided for a consumer redress payment of $11 million, which we made in 2010 to the FTC for distribution to our members. The FTC Order also provided for an additional consumer redress payment of $24 million, which was suspended based on our then-current financial condition on the basis of financial information we submitted to the FTC. The FTC Order specifies that in the event the FTC were to find that the financial materials submitted by us to the FTC at the time of the FTC Order were not truthful, accurate, and complete, the court order entering the settlement could be re-opened and the suspended judgment in the amount of the additional $24 million would become immediately due in full.
On December 26, 2012, ID Analytics, along with eight other companies, received an information request from the FTC in conjunction with the FTC’s policy study of the operation of the data broker industry. ID Analytics was advised that this request is not an investigation of its business practices but will be the basis of consideration by the FTC whether to recommend to the Congress a legislative extension of FCRA-based consumer safeguards to the use of consumer personal information in the non-FCRA context. Although ID Analytics believes that it is not engaged in data broker activities in any manner, ID Analytics has indicated to the FTC that it will cooperate with the FTC’s study efforts by responding fully to the FTC’s information requests, and has done so to date. On December 17, 2013, we met with FTC Staff, at their request, to discuss the ID Analytics positions with regard to the FTC’s data broker study. At the meeting, we discussed a wide ranging number of matters, including industry conditions, the changing landscape relating to identity theft and fraud, technological developments to address identity theft and fraud, as well as recent security breaches.
With the growing public concern regarding privacy and the collection, distribution, and use of consumer personal information, we believe we are in an environment in which there is an increased regulatory scrutiny concerning data collection and use practices and the provision and marketing of services, like ours, that seek to protect that information. We expect that kind of scrutiny to continue as the marketplace for services like ours continues to develop. In addition, we believe there has been a recent increase in whistleblower claims made to regulatory agencies, including whistleblower claims made by former employees, which we believe will likely continue, in part because of the provisions enacted by the Dodd-Frank Wall Street Reform and Consumer Protection Act, or the Dodd-Frank Act, that may entitle persons who report alleged wrongdoing to the SEC to cash rewards. Often, the allegations underlying such claims to regulatory agencies result in federal and state inquiries and investigations. On January 17, 2014, we met with FTC Staff, at our request, to discuss issues regarding allegations that have been asserted in a whistleblower claim against us relating to our compliance with the FTC Order. Following this meeting, we expect to receive either a formal or informal investigatory request from the FTC for documents and information regarding our policies, procedures, and practices for our services and business activities. Given the heightened public awareness of data breaches and well as attention to identity theft protection services like ours, it is also possible that the FTC, at any time, may commence an unrelated inquiry or investigation of our business practices and our compliance with the FTC Order. We endeavor to comply with all applicable laws and believe we are in compliance with the requirements of the FTC Order. We believe the increased regulatory scrutiny will continue in our industry for the foreseeable future and could lead to additional meetings or inquiries or investigations by the agencies that regulate our business, including the FTC.
Employees
As of December 31, 2013, we employed 675 people. At that date, we had 528 employees in our consumer business, of which 226 were engaged in member service and support, 102 in products and technology, 115 in marketing and strategic partnerships, and 85 in general and administration; and 147 employees in our enterprise business, of which 86 were engaged in information technology, product development, and sales and marketing, 43 in software development and operations, and 18 in general and administration. We consider our relationship with our employees to be good, and none of our employees are represented by a union in collective bargaining with us.
Technology Infrastructure
We employ a range of information technology solutions, controls, procedures, and processes to protect the confidentiality, integrity, and availability of our critical assets, including our data and information technology systems. We have implemented a
10
comprehensive information security program to guide and coordinate the people, processes, and technology that protect our core services. This program has been designed to ensure that oversight efforts, administrative activities, and technical controls are effectively combating the threats to our critical assets.
We design and manage our networks and applications to meet a high standard of security. We use appropriate technologies, such as network firewalls, intrusion prevention systems, application firewalls, and anti-malware, to protect network locations and applications from attacks. We also use industry standard encryption technologies and strategies to ensure protection of our data.
We maintain strictly controlled physical environments. Our information technology systems are housed in a highly secure data center, where access is limited. Our corporate locations are protected with a two-factor badge and biometric reader system. We also put in place additional physical controls to limit visibility to sensitive customer data. We provide our employees with education and training to keep pace with the quickly changing threat landscape.
We regularly assess the effectiveness of our information security practices and technical controls. In addition to regular external audits, we conduct internal security testing to ensure current practices are effective against emerging threats. Additionally, outside penetration tests are conducted on a regular basis. We ensure that our systems are free from critical vulnerabilities by conducting regular vulnerability scans and penetration tests. We also remain aware of publicly disclosed vulnerabilities in commercial and open source products, and remediate issues in a timely manner.
We vigilantly monitor our systems and environments for suspicious or unusual events, including intrusion detection systems and central security event correlation technologies. We have implemented an incident response process to ensure a quick and effective response to any potential issue.
We have received a PCI Level 1 certification in our consumer and enterprise businesses and a SOC I report in our enterprise business for our information security systems.
Financial Information About Segments and Geographic Areas
See Note 17 to the consolidated financial statements in Item 8 of this Form 10-K/A for financial information about our segments and geographic areas.
Available Information
We were incorporated in Delaware in April 2005. Our principal executive offices are located at 60 East Rio Salado Parkway, Suite 400, Tempe, Arizona 85281, and our telephone number is (480) 682-5100. Our website address is www.lifelock.com. The information on our website is not incorporated by reference into this Form 10-K/A or in any other report or document we file with the Securities and Exchange Commission, or the SEC.
We file reports with the SEC, including Annual Reports on Form 10-K, Quarterly Reports on Form 10-Q, Current Reports on Form 8-K, and any other filings required by the SEC. Through our website, we make available free of charge our Annual Reports on Form 10-K, Quarterly Reports on Form 10-Q, Current Reports on Form 8-K, and all amendments to those reports, as soon as reasonably practicable after we electronically file such material with, or furnish it to, the SEC.
The public may read and copy any materials we file with, or furnish to, the SEC at the SEC’s Public Reference Room at 100 F Street, NE, Washington, DC 20549. The public may obtain information on the operation of the Public Reference Room by calling the SEC at 1-800-SEC-0330. The SEC maintains an Internet site (www.sec.gov) that contains reports, proxy and information statements, and other information regarding issuers that file electronically with the SEC.
Certain factors may have a material adverse effect on our business, financial condition, and results of operations. You should consider carefully the risks and uncertainties described below, in addition to other information contained in this Form 10-K/A, including our consolidated financial statements and related notes. The risks and uncertainties described below are not the only ones we face. Additional risks and uncertainties that we are unaware of, or that we currently believe are not material, may also become important factors that adversely affect our business. If any of the following risks actually occurs, our business, financial condition, results of operations, and future prospects could be materially and adversely affected. In that event, the trading price of our common stock could decline, and you could lose part or all of your investment.
Risks Related to Our Business and Industry
We achieved profitability in our last two fiscal years after incurring significant net losses from our inception through fiscal 2011, but we may not be able to maintain profitability on an annual basis in the future.
We achieved profitability in 2013 and 2012 after incurring significant net losses from our inception through 2011, but we cannot predict whether we will be able to maintain profitability on an annual basis in the future. We had net income of $54.5 million (restated) in 2013, including a $37.5 million (restated) income tax benefit resulting from the release of substantially all of our
11
valuation allowance on our deferred tax assets, and net income of $23.5 million in 2012, including a $14.2 million income tax benefit resulting from our acquisition of ID Analytics. We had net losses of $4.3 million and $15.4 million in 2011 and 2010, respectively.
Our recent growth, including our growth in revenue and customer base, may not be sustainable or may decrease, and we may not generate sufficient revenue to maintain annual profitability. Moreover, we expect to continue to make significant expenditures to maintain and expand our business, to operate as a consolidated entity with ID Analytics and Lemon, and to continue our transition to operating as a public company, including costs related to our compliance with Section 404 of the Sarbanes-Oxley Act of 2002, as amended, or the Sarbanes-Oxley Act. These increased expenditures will make it more difficult for us to maintain future annual profitability. Our ability to maintain annual profitability depends on a number of factors, including our ability to attract and service customers on a profitable basis. If we are unable to maintain annual profitability, we may not be able to execute our business plan, our prospects may be harmed, and our stock price could be materially and adversely affected.
If the security of confidential information used in connection with our services is breached or otherwise subject to unauthorized access, our reputation and business may be materially harmed.
Our services require us to collect, store, use, and transmit significant amounts of confidential information, including personally identifiable information, credit card information, and other critical data. We employ a range of information technology solutions, controls, procedures, and processes designed to protect the confidentiality, integrity, and availability of our critical assets, including our data and information technology systems. While we engage in a number of measures aimed to protect against security breaches and to minimize problems if a data breach were to occur, our information technology systems and infrastructure may be vulnerable to damage, compromise, disruption, and shutdown due to attacks or breaches by hackers or due to other circumstances, such as employee error or malfeasance or technology malfunction. The occurrence of any of these events, as well as a failure to promptly remedy these events should they occur, could compromise our systems, and the information stored in our systems could be accessed, publicly disclosed, lost, stolen, or damaged. Any such circumstance could adversely affect our ability to attract and maintain customers as well as strategic partners, cause us to suffer negative publicity, and subject us to legal claims and liabilities or regulatory penalties. In addition, unauthorized parties might alter information in our databases, which would adversely affect both the reliability of that information and our ability to market and perform our services. Techniques used to obtain unauthorized access or to sabotage systems change frequently and generally are difficult to recognize and react to effectively and are constantly evolving. We may be unable to anticipate these techniques or to implement adequate preventive or reactive measures. Several recent, highly publicized data security breaches at other companies have heightened consumer awareness of this issue and may embolden individuals or groups to target our systems or those of our strategic partners or enterprise customers.
Security technologies and information, including encryption and authentication technology licensed from third parties, are a key aspect of our security measures designed to secure our critical assets. While we routinely seek to update these technologies and information, advances in computer capabilities, new discoveries in the field of cryptography, or other developments may result in the technology we use becoming obsolete, breached, or compromised and cause us to incur additional expenses associated with upgrading our security systems. In addition, security information provided to us by third parties may be inaccurate, incomplete, or outdated, which could cause us to make misinformed security decisions and could materially and adversely affect our business.
Under payment card rules and our contracts with our card processors, we could be liable to the payment card issuing banks for their cost of issuing new cards and related expenses if there is a breach of payment card information that we store. In addition, if we fail to follow payment card industry security standards, even if there is no compromise of customer information, we could incur significant fines or lose our ability to give customers the option of using payment cards to fund their payments or pay their fees. If we were unable to accept payment cards, our business would be materially harmed.
Many states have enacted laws requiring companies to notify individuals of data security breaches involving their personal data. In the United States, federal and state laws provide for over 45 laws and notification regimes, all of which we are subject to, and additional requirements may be instituted in the future. In the event of a data security breach, these mandatory disclosures often lead to widespread negative publicity. In addition, complying with such numerous and complex regulations in the event of a data security breach is often expensive, difficult, and time consuming, and the failure to comply with these regulations could subject us to regulatory scrutiny and additional liability and harm our reputation.
Any actual or perceived security breach, whether successful or not and whether or not attributable to the failure of our services or our information technology systems, as well as our failure to promptly and appropriately react to a breach, would likely harm our reputation, adversely affect market perception of our services, and cause the loss of customers and strategic partners. Our property and business interruption insurance may not be adequate to compensate us for losses or failures that may occur. Our third-party insurance coverage will vary from time to time in both type and amount depending on availability, cost, and our decisions with respect to risk retention.
Our business is highly dependent upon our brand recognition and reputation, and the failure to maintain or enhance our brand recognition or reputation would likely have a material adverse effect on our business.
Our brand recognition and reputation are critical aspects of our business. We believe that maintaining and further enhancing our LifeLock and ID Analytics brands as well as our reputation will be critical to retaining existing customers and attracting new customers. We also believe that the importance of our brand recognition and reputation will continue to increase as competition in our
12
markets continues to develop. Our success in this area will be dependent on a wide range of factors, some of which are out of our control, including the following:
|
• |
the efficacy of our marketing efforts; |
|
• |
our ability to retain existing and obtain new customers and strategic partners; |
|
• |
the quality and perceived value of our services; |
|
• |
actions of our competitors, our strategic partners, and other third parties; |
|
• |
positive or negative publicity, including material on the Internet; |
|
• |
regulatory and other governmental related developments; and |
|
• |
litigation related developments. |
Sales and marketing expenses have historically been our largest operating expense, and we anticipate these expenses will continue to increase in the foreseeable future as we continue to seek to grow our business and customer base and enhance our brand. These brand promotion activities may not yield increased revenue and the efficacy of these activities will depend on a number of factors, including our ability to do the following:
|
• |
determine the appropriate creative message and media mix for advertising, marketing, and promotional expenditures; |
|
• |
select the right markets, media, and specific media vehicles in which to advertise; |
|
• |
identify the most effective and efficient level of spending in each market, media, and specific media vehicle; and |
|
• |
effectively manage marketing costs, including creative and media expenses, in order to maintain acceptable customer acquisition costs. |
Increases in the pricing of one or more of our marketing and advertising channels could increase our marketing and advertising expenses or cause us to choose less expensive but possibly less effective marketing and advertising channels. If we implement new marketing and advertising strategies, we may utilize marketing and advertising channels with significantly higher costs than our current channels, which in turn could adversely affect our operating results. Implementing new marketing and advertising strategies also would increase the risk of devoting significant capital and other resources to endeavors that do not prove to be cost effective. Further, we may over time become disproportionately reliant on one channel or strategic partner, which could limit our marketing and advertising flexibility and increase our operating expenses. We also may incur marketing and advertising expenses significantly in advance of the time we anticipate recognizing revenue associated with such expenses, and our marketing and advertising expenditures may not generate sufficient levels of brand awareness or result in increased revenue. Even if our marketing and advertising expenses result in increased revenue, the increase might not offset our related expenditures. If we are unable to maintain our marketing and advertising channels on cost-effective terms or replace or supplement existing marketing and advertising channels with similarly or more effective channels, our marketing and advertising expenses could increase substantially, our customer base could be adversely affected, and our business, operating results, financial condition, and reputation could suffer.
Furthermore, negative publicity, whether or not justified, relating to events or activities attributed to us, our employees, our strategic partners, our affiliates, or others associated with any of these parties, may tarnish our reputation and reduce the value of our brands. Damage to our reputation and loss of brand equity may reduce demand for our services and have an adverse effect on our business, operating results, and financial condition. Moreover, any attempts to rebuild our reputation and restore the value of our brands may be costly and time consuming, and such efforts may not ultimately be successful.
We face intense competition, and we may not be able to compete effectively, which could reduce demand for our services and adversely affect our business, growth, reputation, revenue, and market share.
We operate in a highly competitive business environment. Our primary competitors are the credit bureaus that include Experian, Equifax, and TransUnion, as well as others, such as Affinion, Early Warning Systems, Intersections, and LexisNexis. Some of our competitors have substantially greater financial, technical, marketing, distribution, and other resources than we possess that afford them competitive advantages. As a result, they may be able to devote greater resources to the development, promotion, and sale of services, to deliver competitive services at lower prices or for free, and to introduce new solutions and respond to market developments and customer requirements more quickly than we can. In addition, some of our competitors may have data that we do not have or cannot obtain without difficulty. Any of these factors could reduce our growth, revenue, access to valuable data, or market share.
Our ability to compete successfully in our markets depends on a number of factors, both within and outside our control. Some of these factors include the following:
|
• |
access to a breadth of identity and consumer transaction data; |
|
• |
breadth and effectiveness of service offerings, including designing and introducing new services; |
|
• |
brand recognition; |
|
• |
technology; |
13
|
• |
effectiveness and cost-efficiency of customer acquisition; |
|
• |
customer satisfaction; |
|
• |
price; |
|
• |
quality and reliability of customer service; and |
|
• |
accurate identification of appropriate target markets for our business. |
Any failure by us to compete successfully in any one of these or similar areas may reduce the demand for our services and the robustness of the LifeLock ecosystem, as well as adversely affect our business, growth, reputation, revenue, and market share. Moreover, new competitors, alliances among our competitors, or new service introductions by our competitors may emerge and potentially adversely affect our business and prospects.
We could lose our access to data sources, which could cause us competitive harm and have a material adverse effect on our business, operating results, and financial condition.
Our services depend extensively upon continued access to and receipt of data from external sources, including data received from customers and fulfillment partners. Our data providers could stop providing data, provide untimely data, or increase the costs for their data for a variety of reasons, including a perception that our systems are insecure as a result of a data security breach, budgetary constraints, a desire to generate additional revenue, or for competitive reasons. In addition, upon the termination of the contracts we have with certain of our enterprise customers, we are required to remove from our repositories the data contributed by and through those customers. We could also become subject to legislative, regulatory, or judicial restrictions or mandates on the collection, disclosure, or use of such data, in particular if such data is not collected by our providers in a way that allows us to legally use the data. If we were to lose access to a substantial number of data sources or certain key data sources or certain data already in the LifeLock ecosystem, or if our access or use were restricted or became less economical or desirable, our ability to provide our services and the efficacy and attractiveness of the LifeLock ecosystem could be negatively affected, and this would adversely affect us from a competitive standpoint. This would also adversely affect our business, operating results, and financial condition. We may not be successful in maintaining our relationships with these external data source providers and may not be able to continue to obtain data from them on acceptable terms or at all. Furthermore, we cannot provide assurance that we will be able to obtain data from alternative or additional sources if our current sources become unavailable.
We may lose customers and significant revenue and fail to attract new customers if our existing services become less desirable or obsolete, or if we fail to develop and introduce new services with broad appeal or fail to do so in a timely or cost-effective manner.
The introduction of new services by competitors, the emergence of new industry standards, or the development of new technologies could render our existing or future services less desirable or obsolete. In addition, professional thieves continue to develop more sophisticated and creative methods to steal personal and financial information as consumers and enterprises today become increasingly interconnected and engage in a large number of daily activities that involve personal or financial information. Consequently, our financial performance and growth depends upon our ability to enhance and improve our existing services, develop and successfully introduce new services that generate customer interest, and sell our services in new markets. As our existing services mature, encouraging customers to purchase enhancements or upgrades becomes more challenging unless new service offerings provide features and functionality that have meaningful incremental value. To achieve market acceptance for our services, we must effectively anticipate and offer services that meet changing customer demands in a timely manner. Customers may require features and capabilities that our current services lack. In addition, any new markets in which we attempt to sell our services, including new industries, countries, or regions, may not be receptive to our service offerings. If we fail to enhance our existing services in a timely and cost-effective manner, successfully develop and introduce new services, or sell our services in new markets, our ability to retain our existing or attract new customers and our ability to create or increase demand for our services could be harmed, which would have an adverse effect on our business, operating results, and financial condition.
We will be required to make significant investments in developing new services. We also will be subject to all of the risks inherent in the development of new services, including unanticipated technical or other development problems, which could result in material delays in the launch and acceptance of the services or significantly increased costs. In some cases, we may expend a significant amount of resources and management attention on service offerings that do not ultimately succeed in their markets. Because new service offerings are inherently risky, they may not be successful and may harm our operating results and financial condition.
Our inability to develop and offer services that are attractive to the growing number of consumers who utilize wireless devices other than personal computers to access online services could adversely affect our business.
The number of people who access services through devices other than personal computers, including mobile phones, smart phones, handheld computers, tablets, and other mobile devices, has increased dramatically in recent years and is projected to continue to increase. We have limited experience to date in developing services for users of these alternative devices, and versions of our services developed for these devices may not be attractive to customers. In December 2013, in connection with our acquisition of Lemon, we launched LifeLock Wallet, our mobile wallet application. The success of our mobile wallet application is unproven, and we have prioritized the quality of user experience with our mobile application over short-term monetization. Despite the expected
14
growth in mobile devices, there is no guarantee that we will be able to effectively monetize our mobile application and generate meaningful revenue in the future. If our mobile application is not widely adopted or sufficiently profitable, or if we fail to continue to innovate and introduce enhanced mobile applications and other services for users of these alternative devices, our business could be adversely affected.
As new devices, platforms, and technologies are continually being released, it is difficult to predict the problems we may encounter in developing versions of our services for use with those devices, platforms, and technologies, and we may need to devote significant resources to the creation, support, and maintenance of such offerings. We are dependent on the interoperability of our mobile application with popular mobile operating systems that we do not control, such as Android and iOS, and any changes in such systems that degrade our application’s functionality or give preferential treatment to competitive products could adversely affect usage of our mobile application. Additionally, if we are slow to develop new services and technologies that are compatible with these devices, platforms, and technologies, or if our competitors are able to achieve those results more quickly than us, we will fail to capture a significant share of an increasingly important portion of the market for online services, which could adversely affect our business.
Our revenue and operating results depend significantly on our ability to retain our existing customers, and any decline in our retention rates will harm our future revenue and operating results.
Our revenue and operating results depend significantly on our ability to retain our existing customers. In our consumer business from which we derive a significant majority of our revenue, we sell our services to our members on a monthly or annual subscription basis. Our members may cancel their membership with us at any time without penalty. In our enterprise business, our customers have no obligation to renew their agreements with us after the contractual term expires, and approximately half of our direct enterprise customers do not have monthly transaction minimums and, accordingly, may reduce their utilization of our services during the contractual term. We therefore may be unable to retain our existing members and enterprise customers on the same or on more profitable terms, if at all, and may generate lower revenue as a result of less utilization of our services by our enterprise customers. In addition, we may not be able to predict or anticipate accurately future trends in customer retention or enterprise customer utilization or effectively respond to such trends. Our customer retention rates and enterprise customer utilization may decline or fluctuate due to a variety of factors, including the following:
|
• |
our customers’ levels of satisfaction or dissatisfaction with our services; |
|
• |
the quality, breadth, and prices of our services; |
|
• |
our general reputation and events impacting that reputation; |
|
• |
the services and related pricing offered by our competitors; |
|
• |
our customer service and responsiveness to any customer complaints; |
|
• |
customer dissatisfaction if they do not receive the full benefit of our services due to their failure to provide all relevant data; |
|
• |
customer dissatisfaction with the methods or extent of our remediation services; |
|
• |
our guarantee may not meet our customers’ expectations; and |
|
• |
changes in our target customers’ spending levels as a result of general economic conditions or other factors. |
If we do not retain our existing customers, our revenue may grow more slowly than expected or decline, and our operating results and gross margins will be harmed. In addition, our business and operating results may be harmed if we are unable to increase our retention rates.
We also must continually add new customers both to replace customers who cancel or elect not to renew their agreements with us and to grow our business beyond our current customer base. If we are unable to attract new customers in numbers greater than the percentage of customers who cancel or elect not to renew their agreements with us, which we call “churn,” our customer base will decrease, and our business, operating results, and financial condition will be adversely affected. Churn negatively impacts the predictability of our subscription revenue model and the efficacy and attractiveness of the LifeLock ecosystem by decreasing the amount of data being added to our data repositories.
We depend on strategic partners in our consumer business, and our inability to maintain our existing and secure new relationships with strategic partners could harm our revenue and operating results.
We have derived, and intend to continue to derive, a significant portion of our revenue from members who subscribe to our consumer services through one of our strategic partners. In 2013, we derived just under half of our gross new members from our strategic partner distribution channels. These distribution channels involve various risks, including the following:
|
• |
we may be unable to maintain or secure favorable relationships with strategic partners; |
|
• |
our strategic partners may not be successful in expanding our membership base; |
|
• |
our strategic partners may seek to renegotiate the economic terms of our relationships; |
|
• |
our strategic partners may terminate their relationships with us; |
15
|
• |
bad publicity and other issues faced by our strategic partners could negatively impact us; and |
|
• |
our strategic partners, some of which already compete with us, may present increased competition for us in the future. |
Our inability to maintain our existing and secure new relationships with strategic partners could harm our revenue and operating results.
Many of our key strategic partnerships are governed by agreements that may be terminated without cause and without penalty by our strategic partners upon notice of as few as 30 days. Under many of our agreements with strategic partners, our partners may cease or reduce their marketing of our services at their discretion, which may cause us to lose access to prospective members and significantly reduce our revenue and operating results.
Some of our strategic partners possess significant resources and advanced technical abilities. Some offer services that are competitive with our services and more may do so in the future, either alone or in collaboration with other competitors. Those strategic partners could give a higher priority to competing services or decide not to continue to offer our services at all. If any of our strategic partners discontinue or reduce the sale or marketing of our services, promote competitive services, or, either independently or jointly with others, develop and market services that compete with our services, our business and operating results may be harmed. In addition, some of our strategic partners may experience financial or other difficulties, causing our revenue through those strategic partners to decline, which would adversely affect our operating results.
In order for us to implement our business strategy and grow our revenue, we must effectively manage and expand our relationships with qualified strategic partners. We expend significant time and resources in attracting qualified strategic partners, training those partners in our technology and service offerings, and then maintaining relationships with those partners. In order to continue to develop and expand our distribution channels, we must continue to scale and improve our processes and procedures that support our strategic partnerships. Those processes and procedures could become increasingly complex and difficult to manage. Our competitors also use arrangements with strategic partners, and it could be more difficult for us to maintain and expand our distribution channels if they are more successful in attracting strategic partners or enter into exclusive relationships with strategic partners. If we fail to maintain our existing or secure new relationships with strategic partners, our business will be harmed.
A limited number of enterprise customers provide a significant portion of our enterprise revenue, and our inability to retain these customers or attract new customers could harm our revenue and operating results and the efficacy and attractiveness of the LifeLock ecosystem.
ID Analytics has historically derived, and continues to derive, a significant portion of its revenue from a limited number of enterprise customers. For example, in 2013, 2012, and 2011, sales derived through ID Analytics’ top ten customers accounted for approximately 65%, 70%, and 65%, respectively, of ID Analytics’ revenue for those periods. Some of these customers also provide services that compete with our consumer services and, accordingly, may seek alternative identity risk and credit worthiness assessment services in the future. The loss of several of our enterprise customers, or of any of our large enterprise customers, could have a material adverse effect on our revenue and results of operations, as well as the efficacy and attractiveness of the LifeLock ecosystem.
In addition, new customer acquisition in our enterprise business is often a lengthy process requiring significant up-front investment. Accordingly, we may devote substantial resources in an effort to attract new enterprise customers that may not result in customer engagements or lead to an increase in revenue, which could have a material adverse effect on our business.
If we experience system failures or interruptions in our telecommunications or information technology infrastructure, it may impair the availability of our services, our revenue could decrease, and our reputation could be harmed.
Our operations depend upon our ability to protect the telecommunications and information technology systems utilized in our services against damage or system interruptions from natural disasters, technical failures, human error, and other events. We send and receive credit and other data, as well as key communications to and from our members, electronically, and this delivery method is susceptible to damage, delay, or inaccuracy. A portion of our business involves telephonic customer service and online enrollments, which depends upon the data generated from our computer systems. Unanticipated problems with our telecommunications and information technology systems may result in data loss, which could interrupt our operations. Our telecommunications or information technology infrastructure upon which we rely also may be vulnerable to computer viruses, hackers, or other disruptions.
We rely on our network and data center infrastructure and internal technology systems for many of our development, operational, support, sales, accounting, and financial reporting activities, the failure of which could disrupt our business operations and result in a loss of revenue and damage to our reputation.
We rely on our network and data center infrastructure and internal technology systems for many of our development, operational, support, sales, accounting, and financial reporting activities. We routinely invest resources to update and improve these systems and environments with the goal of better meeting the existing, as well as the growing and changing requirements of our customers. If we experience prolonged delays or unforeseen difficulties in updating and upgrading our systems and architecture, we may experience outages and may not be able to deliver certain service offerings and develop new service offerings and enhancements that we need to remain competitive. Such improvements and upgrades often are complex, costly, and time consuming. In addition, such improvements can be challenging to integrate with our existing technology systems or may result in problems with our existing
16
technology systems. Unsuccessful implementation of hardware or software updates and improvements could result in outages, disruption in our business operations, loss of revenue, or damage to our reputation. Our systems and data are hosted by a third-party data center. If the third-party data center experiences any disruptions, outages, or catastrophes, it could disrupt our business and result in a loss of customers, loss of revenue, or damage to our reputation.
Natural or man-made disasters and other similar events may significantly disrupt our and our strategic partners’ or service providers’ businesses, and negatively impact our results of operations and financial condition.
Our enterprise business headquarters and the back-up data center for our enterprise business are located in Southern California, which is situated on or near earthquake fault lines. Our primary data center for our enterprise business is located in Nevada. In our consumer business, we have data centers in Northern California and Arizona. Any of our or our strategic partners’ or service providers’ facilities may be harmed or rendered inoperable by natural or man-made disasters, including earthquakes, tornadoes, hurricanes, wildfires, floods, nuclear disasters, acts of terrorism or other criminal activities, infectious disease outbreaks, and power outages, which may render it difficult or impossible for us or our strategic partners or service providers to operate our respective businesses for some period of time. Our and our strategic partners’ or service providers’ facilities would likely be costly to repair or replace, and any such efforts would likely require substantial time. Any disruptions in our or our strategic partners’ or service providers’ operations could negatively impact our business and results of operations and harm our reputation. In addition, we and our strategic partners or service providers may not carry business insurance or may not carry sufficient business insurance to compensate for losses that may occur. Any such losses or damages could have a material adverse effect on our business, results of operations, and financial condition.
Changes in the economy may significantly affect our business, operating results, and financial condition.
Our business may be affected by changes in the economic environment. Our services, particularly our consumer services, are discretionary purchases, and members may reduce or eliminate their discretionary spending on our services during a difficult economic environment, such as currently exists. Although we have not yet experienced a material increase in membership cancellations or a material reduction in our member retention rate, we may experience such an increase or reduction in the future, especially in the event of a prolonged recessionary period or a worsening of current conditions. In addition, during an economic downturn consumers may experience a decline in their credit, which may result in less demand for our services. Conversely, consumers may spend more time using the Internet during an economic downturn and may have less time for our services in a period of economic growth. In addition, media prices may increase in a period of economic growth, which could significantly increase our marketing and advertising expenses. As a result, our business, operating results, and financial condition may be significantly affected by changes in the economic environment.
Our rapid development and growth in an evolving industry make evaluating our business and future prospects difficult and may increase the risk of an investment in our company.
Our business, prospects, and growth potential must be considered in light of the risks, expenses, delays, difficulties, uncertainties, and other challenges encountered by companies that are rapidly developing and are experiencing rapid growth in evolving industries. We may be unsuccessful in addressing the various challenges we may encounter. Our failure to do so could have a material adverse effect on our business, prospects, reputation, and growth potential as well as the value of an investment in our company.
Despite our historic predictable subscription revenue model, as a result of our rapid development and growth in an evolving industry, it is difficult to accurately forecast our revenue and plan our operating expenses, and we have limited insight into trends that may emerge and affect our business. In the event that our actual results differ from our forecasts or we adjust our forecasts in future periods, our operating results and financial position could be materially and adversely affected and our stock price could decline.
These risks are increased by our acquisitions of ID Analytics and Lemon and will be further increased by any acquisitions we may make in the future.
We are restating certain prior consolidated financial statements, which may lead to additional risks and uncertainties, including shareholder litigation, loss of investor confidence, and negative impacts on our stock price.
As discussed in the Explanatory Note to this Form 10-K/A and Note 2 to the Consolidated Financial Statements included in Part II, Item 8 of this Form 10-K/A, we are restating our audited consolidated financial statements for the year ended December 31, 2013, our unaudited condensed consolidated financial statements for the quarters ended March 31, 2013, June 30, 2013, and September 30, 2013, and our unaudited condensed consolidated financial statements for the quarters ended March 31, 2014 and June 30, 2014. The determination to restate these financial statements was made by our Audit Committee, after discussion with management and EY, following the identification of an error related to our calculation of the volatility assumption within the Black-Scholes option pricing model used to compute our share-based compensation expense. As a result of these events, we have become subject to a number of additional risks and uncertainties, including substantial unanticipated costs for accounting and legal fees in connection with or related to the restatement and potential shareholder litigation. If litigation did occur, we would incur additional substantial defense costs regardless of the outcome of such litigation. Likewise, such events may cause a diversion of our
17
management’s time and attention. If we do not prevail in any such litigation, we could be required to pay substantial damages or settlement costs. In addition, the fact that we have completed a restatement may lead to a loss of investor confidence and have negative impacts on the trading price of our common stock.
If we are unable to maintain effective internal control over financial reporting in the future, the accuracy and timeliness of our financial reporting may be adversely affected.
Maintaining effective internal control over financial reporting is necessary for us to produce reliable financial statements. In connection with the restatement of our consolidated financial statements in this Form 10-K/A, management, including our Chief Executive Officer and Chief Financial Officer, reassessed the effectiveness of our internal control over financial reporting as of December 31, 2013. Based on this reassessment using the criteria set forth by the Committee of Sponsoring Organizations of the Treadway Commission (COSO) in Internal Control – Integrated Framework (1992 framework), management has concluded that we did not maintain effective internal control over financial reporting as of December 31, 2013 because of a deficiency in the control over the calculation of the volatility assumption within the Black-Scholes option pricing model used to compute our share-based compensation expense that management concluded was a material weakness. This control deficiency resulted in the misstatement of share-based compensation expense and net income available to common stockholders and the related financial disclosures for the year ended December 31, 2013 (and the restatement of the unaudited quarterly condensed consolidated financial information for the quarters ended March 31, 2013, June 30, 2013, September 30, 2013, and December 31, 2013), as discussed in further detail in the Explanatory Note to this Form 10-K/A and Note 2 and Note 19 to the Consolidated Financial Statements included in Part II, Item 8 of this Form 10-K/A. We are actively engaged in developing a remediation plan designed to address this material weakness. If we are unable to effectively remediate this material weakness or we are otherwise unable to maintain effective internal control over financial reporting, or if our independent registered public accounting firm is unable to express an opinion as to the effectiveness of our internal control over financial reporting as required pursuant to the Sarbanes-Oxley Act, it could result in another material misstatement of our financial statements that would require a restatement, investor confidence in the accuracy and timeliness of our financial reports may be impacted, and the market price of our common stock could be negatively impacted.
We no longer qualify as an “emerging growth company,” and as a result, we have to comply with increased disclosure and governance requirements.
We no longer qualify as an “emerging growth company.” As an “emerging growth company,” we were previously able to take advantage of certain exemptions from various reporting requirements that are applicable to other public companies that are not emerging growth companies, including not being required to comply with the auditor attestation requirements of Section 404 of the Sarbanes-Oxley Act, reduced disclosure obligations regarding executive compensation in our periodic reports and proxy statements, and exemptions from the requirements of holding a nonbinding advisory vote on executive compensation and stockholder approval of any golden parachute payments not previously approved. As a result of no longer qualifying as an “emerging growth company,” we are subject to increased disclosure and governance requirements, including the foregoing, which will subject us to additional legal, accounting, and other expenses.
The failure to manage our growth may damage our brand recognition and reputation and harm our business and operating results.
We have experienced rapid growth in a relatively short period of time. Our revenue grew from $18.9 million in 2007 to $369.7 million in 2013, and our members increased from approximately 30,000 on December 31, 2006 to approximately 3.0 million on December 31, 2013. In addition, our acquisitions of ID Analytics in March 2012 and Lemon in December 2013 increased our revenue, facilities, and number of employees, and we will likely hire additional employees in the future. We must successfully manage our growth to achieve our objectives. Our ability to effectively manage any significant growth of our business will depend on a number of factors, including our ability to do the following:
|
• |
introduce new service offerings that are attractive to our customers and enhance our gross margins; |
|
• |
develop and pursue cost-effective marketing and advertising campaigns that attract new customers; |
|
• |
satisfy existing and attract new customers; |
|
• |
hire, train, retain, and motivate additional employees; |
|
• |
enhance our operational, financial, and management systems; |
|
• |
enhance our intellectual property rights; |
|
• |
effectively manage and maintain our corporate culture; and |
|
• |
make sound business decisions in light of the scrutiny associated with operating as a public company. |
These enhancements and improvements will require significant expenditures and allocation of valuable management and employee resources, and our growth will continue to place a strain on our operational, financial, and management infrastructure. Our future financial performance and our ability to execute on our business plan will depend, in part, on our ability to effectively manage
18
any future growth. There are no guarantees we will be able to do so in an efficient or timely manner, or at all. Our failure to effectively manage growth could have a material adverse effect on our business, reputation, operating results, financial condition, and prospects.
Any future acquisitions that we undertake could disrupt our business, harm our operating results, and dilute stockholder value.
From time to time, we may review opportunities to acquire other businesses or other assets that would expand the breadth of services that we offer, strengthen our distribution channels, enhance our intellectual property and technological know-how, augment the LifeLock ecosystem and our data repositories, or otherwise offer potential growth opportunities. For example, in March 2012, we completed our acquisition of ID Analytics, and in December 2013, we completed our acquisition of Lemon. We may in the future be unable to identify suitable acquisition candidates or to complete the acquisition of candidates that we identify. Increased competition for acquisition candidates or increased asking prices by acquisition candidates may increase purchase prices for acquisitions to levels beyond our financial capability or to levels that would not result in the returns required by our acquisition criteria. Acquisitions also may become more difficult in the future as we or others, including our competitors, acquire the most attractive candidates. Unforeseen expenses, difficulties, and delays that we may encounter in connection with rapid expansion through acquisitions could inhibit our growth and negatively impact our operating results.
Our ability to grow through acquisitions will depend upon various factors, including the following:
|
• |
the availability of suitable acquisition candidates at attractive purchase prices; |
|
• |
the ability to compete effectively for available acquisition opportunities; |
|
• |
the availability of cash resources, borrowing capacity, or stock at favorable price levels to provide required purchase prices in acquisitions; |
|
• |
diversion of management’s attention to acquisition efforts; and |
|
• |
the ability to obtain any requisite governmental or other approvals. |
As a part of our acquisition strategy, we frequently engage in acquisition discussions. In connection with these discussions, we and potential acquisition candidates often exchange confidential operational and financial information, conduct due diligence inquiries, and consider the structure, terms, and conditions of the potential acquisition. Potential acquisition discussions frequently take place over a long period of time and involve difficult business integration and other issues, including, in some cases, management succession and related matters. As a result of these and other factors, a number of potential acquisitions that from time to time appear likely to occur do not result in binding legal agreements and are not consummated, despite the expenditure of time and resources, which affect our results.
Any borrowings made to finance future acquisitions could make us more vulnerable to a downturn in our operating results, a downturn in economic conditions, or increases in interest rates on borrowings. If our cash flow from operating activities is insufficient to meet our debt service requirements, we could be required to sell additional equity securities, refinance our obligations, or dispose of assets in order to meet our debt service requirements. Adequate financing may not be available if and when we need it or may not be available on terms acceptable to us. The failure to obtain sufficient financing on favorable terms and conditions could have a material adverse effect on our growth prospects and our business, financial condition, and operating results.
If we finance any future acquisitions in whole or in part through the issuance of common stock or securities convertible into or exercisable for common stock, existing stockholders will experience dilution in the voting power of their common stock and earnings per share could be negatively impacted. The extent to which we will be able or willing to use our common stock for acquisitions will depend on the market price of our common stock from time to time and the willingness of potential sellers to accept our common stock as full or partial consideration for the sale of their businesses. Our inability to use our common stock as consideration, to generate cash from operations, or to obtain additional funding through debt or equity financings in order to pursue an acquisition program could materially limit our growth.
Any acquisitions that we undertake could be difficult to integrate, which could disrupt and harm our business.
In order to pursue a successful acquisition strategy, we will need to integrate the operations of any acquired businesses into our operations, including centralizing certain functions and pursuing programs and processes aimed at leveraging our revenue and growth opportunities. The integration of the management, operations, and facilities of acquired businesses with our own could involve difficulties, which could adversely affect our growth rate and operating results.
19
Our experience in acquiring other businesses is limited. Our only acquisitions to date have been the acquisition of ID Analytics in March 2012 and the acquisition of Lemon in December 2013. We may not realize all of the benefits anticipated with such acquisitions and may experience unanticipated detriments as a result of such acquisitions. Although we have finalized our integration with ID Analytics, we are in the process of integrating with Lemon. As with any acquisition, we may be unable to complete effectively an integration of the management, operations, facilities, and accounting and information systems of the acquired business with our own; to manage efficiently the combined operations of the acquired business with our operations; to achieve our operating, growth, and performance goals for the acquired business; to achieve additional revenue as a result of our expanded operations; or to achieve operating efficiencies or otherwise realize cost savings as a result of anticipated acquisition synergies. The integration of acquired businesses, including our acquisitions of ID Analytics and Lemon, involves numerous risks, including the following:
|
• |
integrating the different businesses, operations, locations, and technologies; |
|
• |
communicating to customers our perceived benefits of the acquisition and addressing any related concerns they might have; |
|
• |
the potential disruption of our core businesses; |
|
• |
risks associated with entering markets and businesses in which we have little or no prior experience; |
|
• |
diversion of management’s attention from our core businesses; |
|
• |
adverse effects on existing business relationships with suppliers and customers; |
|
• |
failure to retain key customers, suppliers, or personnel of acquired businesses; |
|
• |
adjusting to changes in key personnel post-combination; |
|
• |
adjusting to increased governmental regulations; |
|
• |
in connection with the acquisition of companies with foreign operations, integrating operations across different cultures and languages and addressing the particular economic, currency, political, and regulatory risks associated with specific countries; |
|
• |
managing the varying intellectual property protection strategies and other activities of the acquired company; |
|
• |
the potential strain on our financial and managerial controls and reporting systems and procedures; |
|
• |
greater than anticipated costs and expenses related to the integration of the acquired business with our business; |
|
• |
potential unknown liabilities associated with the acquired company; |
|
• |
challenges inherent in effectively managing an increased number of employees in diverse locations; |
|
• |
failure of acquired businesses to achieve expected results; |
|
• |
the risk of impairment charges related to potential write-downs of acquired assets in future acquisitions; and |
|
• |
difficulty of establishing uniform standards, controls, procedures, policies, and information systems. |
We may not succeed in addressing these or other risks or any other problems encountered in connection with the integration of any acquired business. The inability to integrate successfully the operations, technology, and personnel of any acquired business, or any significant delay in achieving integration, could have a material adverse effect on our business, results of operations, reputation, and prospects, and on the market price of our common stock.
Our foreign operations expose us to additional challenges and risks that could harm our business, operating results, and financial condition.
In December 2013, we completed our acquisition of Lemon, which conducts its software development operations in Argentina. We have limited experience with international operations, and our ability to manage our business and conduct our operations internationally requires management attention and resources and is subject to the particular challenges of supporting a rapidly growing business in an environment of multiple languages, cultures, customs, legal systems, alternative dispute systems, regulatory systems, and commercial infrastructures. Operating internationally may subject us to additional risks and may increase our exposure to risks that we currently face, including risks associated with the following:
|
· |
political, economic, and social instability; |
|
· |
restrictions on foreign ownership and investments, and stringent foreign exchange controls that might prevent us from repatriating cash earned in countries outside the United States. or from easily funding our international operations; |
|
· |
import and export requirements that may prevent us from efficiently operating our international subsidiary; |
|
· |
currency exchange rate fluctuations; |
|
· |
uncertainty regarding liability for services and content, including uncertainty as a result of local laws and lack of legal precedent; |
|
· |
different employee/employer relationships, workers’ councils and labor unions, and other challenges caused by distance, language, and cultural differences, which may make it difficult to conduct our international operations; |
|
· |
the enforceability of our intellectual property rights; |
20
|
· |
potentially adverse tax consequences due to changes in the tax laws of the United States or the foreign jurisdictions in which we operate; and |
|
· |
higher costs of doing business internationally. |
In addition, compliance with complex foreign and U.S. laws and regulations that apply to our international operations increases our cost of doing business in international jurisdictions. These numerous and sometimes conflicting laws and regulations include internal control and disclosure rules, data privacy and filtering requirements, anti-corruption laws, such as the Foreign Corrupt Practices Act and other local laws prohibiting corrupt payments to governmental officials, and anti-competition regulations, among others. Violations of these laws and regulations could result in fines and penalties, criminal sanctions against us, our officers, or our employees, prohibitions on the conduct of our business, and could also materially affect our brand, our ability to attract and retain employees, our business, and our operating results. Although we have implemented policies and procedures designed to ensure compliance with these laws and regulations, there can be no assurance that our employees, contractors, or agents will not violate our policies.
Furthermore, since we conduct an aspect of our operations in currencies other than U.S. dollars but report our financial results in U.S. dollars, we face exposure to fluctuations in currency exchange rates.
We are subject to extensive government regulation, which could impede our ability to market and provide our services and have a material adverse effect on our business.
Our business and the information we use in our business is subject to a wide variety of federal, state, and local laws and regulations, including the FCRA, the Gramm-Leach-Bliley Act, the FTC Act and comparable state laws that are patterned after the FTC Act, and other laws governing credit information, consumer privacy and marketing, and servicing of consumer products and services. In addition, our business is subject to the FTC Order, as well as the companion orders with 35 states’ attorneys general that we entered into in March 2010. These laws, regulations, and consent decrees cover, among other things, advertising, automatic subscription renewal, broadband residential Internet access, consumer protection, content, copyrights, credit card processing procedures, data protection, distribution, electronic contracts, member privacy, pricing, sales and other procedures, tariffs, and taxation. In addition, it is unclear how existing laws and regulations governing issues such as property ownership, sales and other taxes, and personal privacy apply to the Internet. We incur significant costs to operate our business and monitor our compliance with these laws, regulations, and consent decrees. Any of these laws and regulations is subject to revision, and we cannot predict the impact of such changes on our business. Complying with these varying requirements, the evolving nature of all of these laws and regulations, the evolving nature of various governmental bodies’ enforcement efforts, and the possibility of new laws in this area, could increase our costs or impede our ability to provide our services to our customers, which could have a material adverse effect on our business, operating results, financial condition, and prospects.
In addition, various governmental agencies have the authority to commence investigations and enforcement actions under these laws, regulations, and consent decrees, and private citizens also may bring actions, including class action litigation and whistleblower claims, under some of these laws and regulations. Responding to such investigations and actions may cause us to incur significant expenses and could divert our management and key personnel from our business operations. Any determination that we have violated any of these laws, regulations, or consent decrees may result in liability for fines, damages, or other penalties or require us to make changes to our services and business practices, and cause us to lose customers, any of which could have a material adverse impact on our business, operating results, financial condition, and prospects. In addition, the media recently is increasingly covering perceived noncompliance with consumer protection regulations and violations of notions of fair dealing with customers, and our industry is susceptible to peremptory charges by the media and others of regulatory noncompliance and unfair dealing.
On December 26, 2012, ID Analytics, along with eight other companies, received an information request from the FTC in conjunction with the FTC’s policy study of the operation of the data broker industry. ID Analytics was advised that this request is not an investigation of its business practices but will be the basis of consideration by the FTC whether to recommend to the Congress a legislative extension of FCRA-based consumer safeguards and protections to the use of consumer personal information in the non-FCRA context. Although ID Analytics believes that it is not engaged in data broker activities in any manner, ID Analytics has indicated to the FTC that it will cooperate with the FTC’s study efforts by responding fully to the FTC’s information requests, and has done so to date. On December 17, 2013, we met with FTC Staff, at their request, to discuss the ID Analytics positions with regard to the FTC’s data broker study. At the meeting, we discussed a wide ranging number of matters, including industry conditions, the changing landscape relating to identity theft and fraud, technological developments to address identity theft and fraud, as well as recent security breaches. Responding to these information requests may cause us to incur significant expenses and could divert our management and key personnel from our business operations. In addition, any determination that ID Analytics is engaged in data broker activities, or any future legislation or additional regulation that is enacted as a result of the FTC’s study on data brokers, may result in increased compliance costs or require us to make changes to our services and business practices, any of which could have a material adverse impact on our business, operating results, financial condition, and prospects.
With the growing public concern regarding privacy and the collection, distribution, and use of consumer personal information, we believe we are in an environment in which there is an increased regulatory scrutiny concerning data collection and use practices and the provision and marketing of services, like ours, that seek to protect that information. We expect that kind of scrutiny to
21
continue as the marketplace for services like ours continues to develop. In addition, we believe there has been a recent increase in whistleblower claims made to regulatory agencies, including whistleblower claims made by former employees, which we believe will likely continue, in part because of the provisions enacted by the Dodd-Frank Act that may entitle persons who report alleged wrongdoing to the SEC to cash rewards. Often, the allegations underlying such claims to regulatory agencies result in federal and state inquiries and investigations. On January 17, 2014, we met with FTC Staff, at our request, to discuss issues regarding allegations that have been asserted in a whistleblower claim against us relating to our compliance with the FTC Order. Following this meeting, we expect to receive either a formal or informal investigatory request from the FTC for documents and information regarding our policies, procedures, and practices for our services and business activities. Given the heightened public awareness of data breaches and well as attention to identity theft protection services like ours, it is also possible that the FTC, at any time, may commence an unrelated inquiry or investigation of our business practices and our compliance with the FTC Order. We endeavor to comply with all applicable laws and believe we are in compliance with the requirements of the FTC Order. We believe the increased regulatory scrutiny will continue in our industry for the foreseeable future and could lead to additional meetings or inquiries or investigations by the agencies that regulate our business, including the FTC.
Marketing laws and regulations may materially limit our ability to offer our services to members.
We market our consumer services through a variety of marketing channels, including mass media, direct mail campaigns, online display advertising, paid search and search-engine optimization, and inbound customer service and account activation calls. These channels are subject to both federal and state laws and regulations. Over the past several years, there has been proposed legislation in several states that may interfere with our marketing practices. For example, over the past several years many states have proposed legislation that would allow customers to limit the amount of unsolicited direct mail they receive. Additionally, several bills have been proposed in Congress that could restrict the collection and dissemination of personal information for marketing purposes. If such legislation is passed in one or more states or by Congress, it could limit our ability to market to new members or offer additional services to existing members, which may have a material adverse effect on our ability to sell our services.
The Dodd-Frank Wall Street Reform and Consumer Protection Act authorizes the newly created Bureau of Consumer Financial Protection to adopt rules and take actions that could have a material adverse effect on our business.
In 2010, the Dodd-Frank Act was enacted to reform the practices in the financial services industry. Title X of the Dodd-Frank Act established the Bureau of Consumer Financial Protection. or the CFPB, to protect consumers from abusive financial services practices. Among other things, the CFPB has broad authority to write rules affecting the business of credit reporting companies as well as to supervise, conduct examinations of, and enforce compliance as to federal consumer financial protection laws and regulations with respect to certain “non-depository covered persons” determined by the CFPB to be “larger participants” that offer consumer financial products and services.
The CFPB has broad regulatory, supervisory, and enforcement powers and may exercise authority with respect to our services, or the marketing and servicing of those services, by overseeing our financial institution or credit reporting agency customers and suppliers, or by otherwise exercising its supervisory, regulatory, or enforcement authority over consumer financial products and services. On July 20, 2012, the CFPB issued a final rule that became effective on September 30, 2012, that includes certain of our credit reporting agency customers and suppliers that meet the definition of a “larger participant” under the CFPB nonbank supervision program. The CFPB also created a section of its consumer complaint database for credit reporting complaints that became effective on October 22, 2012. Further, we believe that the CFPB has commenced review of certain of our financial institution customers, including their offering of some or all fee-based products. These or other actions by the CFPB could cause our credit agency customers and suppliers and financial institution customers to limit or change their business activities, which could have a material adverse effect on our operating results. It is not certain whether the CFPB has, or will seek to exercise, supervisory or other authority directly over us or our services. Supervision and regulation of us or our enterprise customers by the CFPB could have a material adverse impact on our business and operating results, including the costs to make changes that may be required by us, our enterprise customers, or our strategic partners, and the costs of responding to examinations by the CFPB. In addition, the costs of responding to or defending against any enforcement action that may be brought by the CFPB, and any liability that we may incur, may have a material adverse impact on our business, results of operations, and financial condition. In the future, the CFPB may choose to enact new rules or amend currently existing rules which could further extend the scope of its jurisdiction with respect to our business activities or those of our customers and suppliers.
Changes in legislation or regulations governing consumer privacy may affect our ability to collect, distribute, and use personally identifiable information.
There has been increasing public concern about the use of personally identifiable information. As a result, many federal, state, and foreign government bodies and agencies have adopted or are considering adopting laws and regulations regarding the collection, disclosure, and use of personally identifiable information. In addition to government regulation, privacy advocates and industry groups may propose new and different self-regulatory standards that apply to us. Because the interpretation and application of privacy and data protection laws are still uncertain, it is possible that these laws may be interpreted and applied in a manner that is inconsistent with our existing data management practices or the features of our services. If this is the case, in addition to the possibility of fines, lawsuits, and other claims, we could be required to fundamentally change our business activities and practices or modify our service
22
offerings, which could have a material adverse effect on our business. Any inability to adequately address privacy concerns, even if unfounded, or comply with applicable privacy or data protection laws, regulations, and policies, could result in additional cost and liability to us, damage our reputation, affect our ability to attract new customers and maintain relationships with our existing customers, and adversely affect our business. Furthermore, the costs of compliance with, and other burdens imposed by, the laws, regulations, and policies that are applicable to the businesses of our enterprise customers and strategic partners may limit the use and adoption of, and reduce the overall demand for, our services. Privacy concerns, whether valid or not, may inhibit market adoption of our services.
Laws requiring the free issuance of credit reports by credit reporting agencies, and other services that must be provided by credit reporting agencies, could impede our ability to obtain new members or retain existing members and could have a material adverse effect on our business.
The Fair Credit Reporting Act provides consumers the ability to receive one free consumer credit report per year from each major consumer credit reporting agency and requires each major consumer credit reporting agency to provide the consumer a credit score along with the consumer’s credit report for a reasonable fee as determined by the FTC. In addition, the Fair Credit Reporting Act and state laws give consumers other rights with respect to the protection of their credit files at the credit reporting agencies. For example, the Fair Credit Reporting Act gives consumers the right to place “fraud alerts” at the credit reporting agencies, and the laws in approximately 40 states give consumers the right to place “freezes” to block access to their credit files. The rights of consumers to obtain free annual credit reports and credit scores from consumer reporting agencies, and to place fraud alerts and credit freezes directly with them, could cause consumers to perceive that the value of our services is reduced or replaced by those benefits, which could have a material adverse effect on our business.
The FTC Order, as well as the companion orders with 35 states’ attorneys general, imposes on us injunctive provisions that could subject us to additional injunctive and monetary remedies.
In March 2010, we and Todd Davis, our Chairman and Chief Executive Officer, entered into the FTC Order. The FTC Order was the result of a settlement of the allegations by the FTC that certain of our advertising and marketing practices constituted deceptive acts or practices in violation of the FTC Act, which settlement made no admission as to the allegations related to such practices. The FTC Order imposes on us and Mr. Davis certain injunctive provisions relating to our advertising and marketing of our identity theft protection services, such as enjoining us from making any misrepresentation of “the means, methods, procedures, effects, effectiveness, coverage, or scope of” our identity theft protection services. However, the bulk of the more specific injunctive provisions have no direct impact on the advertising and marketing of our current services because we have made significant changes in the nature of the services we offer to consumers since the investigation by the FTC in 2007 and 2008, including our adoption of new technology that permits us to provide proactive protection against identity theft and identity fraud. The FTC investigation of our advertising and marketing activities occurred during the time that we relied significantly on the receipt of fraud alerts from the credit reporting agencies for our members. The FTC believed that such alerts had inherent limitations in terms of coverage, scope, and timeliness. Many of the allegations in the FTC complaint, which accompanied the FTC Order, related to the inherent limitations of using credit report fraud alerts as the foundation for identity theft protection. Because the injunctive provisions in the FTC Order are tied to these complaint allegations, these injunctive provisions similarly relate significantly to our previous reliance on credit report fraud alerts as reflected in our advertising and marketing claims. The FTC Order also imposes on us and Mr. Davis certain injunctive provisions relating to our data security for members’ personally identifiable information. At the same time, we also entered into companion orders with 35 states’ attorneys general that impose on us similar injunctive provisions as the FTC Order relating to our advertising and marketing of our identity theft protection services.
Our or Mr. Davis’ failure to comply with these injunctive provisions could subject us to additional injunctive and monetary remedies as provided for by federal and state law. In addition, the FTC Order imposes on us and Mr. Davis certain compliance requirements, including the delivery of an annual compliance report. We and Mr. Davis have timely submitted these annual compliance reports, but the FTC has not accepted or approved them to date. If the FTC were to find that we or Mr. Davis have not complied with the requirements in the FTC Order, we could be subject to additional penalties and our business could be negatively impacted.
The FTC Order provided for a consumer redress payment of $11 million, which we made in 2010 to the FTC for distribution to our members. The FTC Order also provided for an additional consumer redress payment of $24 million, which was suspended based on our then-current financial condition on the basis of financial information we submitted to the FTC. The FTC Order specifies that in the event the FTC were to find that the financial materials submitted by us to the FTC at the time of the FTC Order were not truthful, accurate, and complete, the court order entering the settlement could be re-opened and the suspended judgment in the amount of the additional $24 million would become immediately due in full.
The outcome of litigation or regulatory proceedings could subject us to significant monetary damages, restrict our ability to conduct our business, harm our reputation, and otherwise negatively impact our business.
From time to time, we have been, and in the future may become, subject to litigation, claims, and regulatory proceedings, including class action litigation and litigation arising from contract disputes with vendors, partners, and customers. We cannot predict the outcome of any actions or proceedings, and the cost of defending such actions or proceedings could be material. Furthermore, defending such actions or proceedings could divert our management and key personnel from our business operations. If we are found
23
liable in any actions or proceedings, we may have to pay substantial damages or change the way we conduct our business, either of which may have a material adverse effect on our business, operating results, financial condition, and prospects. There may also be negative publicity associated with litigation or regulatory proceedings that could harm our reputation or decrease acceptance of our services. Moreover, we utilize contractors and third parties for various services, including certain advertising, which may increase these risks. A former service provider claimed that she was misclassified as an independent contractor, and we may be subject to other claims of this nature from time to time. These claims may be costly to defend and may result in imposition of damages, adverse tax consequences, and harm to our reputation.
We believe there has been a recent increase in whistleblower claims across our industry, including whistleblower claims arising after employee terminations, which will likely continue, in part because of the provisions enacted by the Dodd-Frank Act that may entitle persons who report alleged wrongdoing to the SEC to cash rewards. We anticipate that these provisions will result in a significant increase in whistleblower claims, and dealing with such claims could generate significant expenses and take up significant management and board time, even for frivolous and non-meritorious claims. Any investigations of whistleblower claims may impose additional expense on us, may require the attention of senior management and members of our board of directors, and may result in fines and/or reputational damage whether or not we are deemed to have violated any regulations. We believe there also has been a recent increase in claims made to regulatory agencies by former employees. Often the allegations underlying such claims to regulatory agencies lead to meetings, inquiries, or investigations by the regulatory agencies about such claims.
On January 17, 2014, we met with FTC Staff, at our request, to discuss issues regarding allegations that have been asserted in a whistleblower claim against us relating to our compliance with the FTC Order. Following this meeting, we expect to receive either a formal or informal investigatory request from the FTC for documents and information regarding our policies, procedures, and practices for our services and business activities. Given the heightened public awareness of data breaches and well as attention to identity theft protection services like ours, it is also possible that the FTC, at any time, may commence an unrelated inquiry or investigation of our business practices and our compliance with the FTC Order. We endeavor to comply with all applicable laws and believe we are in compliance with the requirements of the FTC Order. We believe the increased regulatory scrutiny will continue in our industry for the foreseeable future and could lead to additional meetings or inquiries or investigations by the agencies that regulate our business, including the FTC. Inquiries or investigations by regulatory agencies about such claims could generate significant expenses and take up significant management and board time.
We do not believe the nature of any pending legal proceeding will have a material adverse effect on our business, operating results, and financial condition. However, our assessment may change at any time based upon the discovery of facts or circumstances that are presently not known to us. Therefore, there can be no assurance that any pending or future litigation will not have a material adverse effect on our business, reputation, operating results, and financial condition.
We depend on key personnel, and if we fail to retain and attract skilled management and other key personnel, our business may be harmed.
Our success depends to a significant extent upon the continued services of our current management team, including Todd Davis, our Chairman and Chief Executive Officer. The loss of Mr. Davis or one or more of our other key executives or employees could have a material adverse effect on our business. Other than Mr. Davis and the Chief Analytics and Science Officer at ID Analytics, we do not maintain “key person” insurance policies on the lives of our executive officers or any of our other employees. We employ all of our executive officers and key employees on an at-will basis, and their employment can be terminated by us or them at any time, for any reason and without notice, subject, in certain cases, to severance payment rights. In order to retain valuable employees, in addition to salary and cash incentives, we provide stock options or other share-based compensation that vest over time. The value to employees of share-based compensation that vest over time will be significantly affected by movements in our stock price that are beyond our control and may at any time be insufficient to counteract offers from other companies.
Our success also depends on our ability to attract, retain, and motivate additional skilled management personnel. We plan to continue to expand our work force to continue to enhance our business and operating results. We believe that there is significant competition for qualified personnel with the skills and knowledge that we require. Many of the other companies with which we compete for qualified personnel have greater financial and other resources than we do. They also may provide more diverse opportunities and better chances for career advancement. Some of these characteristics may be more appealing to high-quality candidates than those which we have to offer. If we are not able to attract and retain the necessary qualified personnel to accomplish our business objectives, we may experience constraints that will impede significantly the achievement of our business objectives and our ability to pursue our business strategy. New hires require significant training and, in most cases, take significant time before they achieve full productivity. New employees may not become as productive as we expect, and we may be unable to hire or retain sufficient numbers of qualified individuals. If our recruiting, training, and retention efforts are not successful or do not generate a corresponding increase in revenue, our business will be harmed.
A failure of the insurance companies that underwrite the identity theft insurance provided as part of our consumer services, or refusal by those insurance companies to provide the expected insurance, could harm our business.
Our consumer services include identity theft insurance for our members that provides coverage for certain out-of-pocket expenses to our members, such as loss of income, replacement of fraudulent withdrawals, and costs associated with child and elderly care, travel, and replacement of documents. This identity theft insurance also backs our $1 million service guarantee. Any failure or
24
refusal of our insurance providers to provide the expected insurance benefits could damage our reputation, cause us to lose members, expose us to liability claims by our members, negatively impact our sales and marketing efforts, and have a material adverse effect on our business, operating results, and financial condition.
Events such as a security breach at a large organization that compromise a significant number of our members’ personally identifiable information could result in a large number of identity-related events that in turn could severely strain our operations and have a negative impact on our business.
Events such as a security breach at a large organization (including major financial institutions, retailers, and Internet service providers) could compromise the personally identifiable information of a significant number of our members. Any such event could in turn result in a large number of identity-related events that we must address, placing severe strain on our operations. Any failure in our ability to appropriately and timely process and address a large number of identity-related events taking place at the same time could result in a loss of members, harm to our reputation, and other damage to our business. Moreover, any related remediation services we provide may not meet member expectations and further exacerbate these risks. Furthermore, if these events result in significant claims made under our identity theft insurance, this could negatively impact our insurance premiums and our ability to continue to provide what we refer to as our guarantee on a cost-effective basis, or at all.
We may require significant capital to fund our business, and our inability to generate and obtain such capital could harm our business, operating results, financial condition, and prospects.
To fund our expanding business, we must have sufficient working capital to continue to make significant investments in our service offerings, advertising, technology, and other activities. As a result, in addition to the revenue we generate from our business, we may need additional equity or debt financing to provide the funds required for these endeavors. If such financing is not available on satisfactory terms or at all, we may be unable to operate or expand our business in the manner and at the rate desired. Debt financing increases expenses, may contain covenants that restrict the operation of our business, and must be repaid regardless of operating results. Equity financing, or debt financing that is convertible into equity, could result in additional dilution to our existing stockholders, and any new securities we issue could have rights, preferences, and privileges superior to those associated with our common stock.
In addition, the current economic environment may make it difficult for us to raise additional capital or obtain additional credit, when needed, on acceptable terms or at all.
Our inability to generate or obtain the financial resources needed to fund our business and growth strategies may require us to delay, scale back, or eliminate some or all of our operations or the expansion of our business, which may have a material adverse effect on our business, operating results, financial condition, and prospects.
If we are unable to protect our intellectual property, including our LifeLock brand, the value of our brand and other intangible assets may be diminished, and our business may be adversely affected.
The success of our business depends in part on our ability to protect our intellectual property and the LifeLock brand. We rely on a combination of federal, state, and common law trademark, patent, and trade secret laws, confidentiality procedures, and contractual provisions to protect our intellectual property. However, these measures afford only limited protection and might be challenged, invalidated, or circumvented by third parties. The measures we take to protect our intellectual property may not be sufficient or effective, and in some instances we have not undertaken comprehensive searches with respect to certain of our intellectual property. We have limited protections in countries outside the United States, such as registrations for key trademarks. Moreover, our competitors may independently develop similar intellectual property.
While we generally obtain non-disclosure agreements from each of our employees and independent contractors, there are former independent contractors from whom we have not obtained these agreements. Therefore, these former independent contractors may inappropriately disclose our confidential information or use that confidential information illegally, which could subject us to liability to third parties.
We currently have a number of issued and pending patents and trademarks, many of which were procured in connection with our acquisition of ID Analytics. We cannot assure you that any patents will issue from our currently pending patent applications in a manner that gives us the protection that we seek, if at all, or that any future patents issued to us will not be challenged, invalidated, or circumvented. Any patents that may issue in the future from pending or future patent applications may not provide sufficiently broad protection or may not prove to be enforceable in actions against alleged infringers. We also cannot assure you that any future trademark or service mark registrations will be issued from pending or future applications or that any registered trademarks or service marks will be enforceable or provide adequate protection of our proprietary rights.
We may find it necessary to take legal action in the future to enforce or protect our intellectual property rights, and such action may be expensive and time consuming. In addition, we may be unable to obtain a favorable outcome in any such intellectual property litigation.
25
Our services may infringe the intellectual property rights of others, which may cause us to pay unexpected litigation costs or damages or prevent us from selling our services.
From time to time, third parties may claim that our services infringe or otherwise violate their intellectual property rights. We may be subject to legal proceedings and claims, including claims of alleged infringement by us of the intellectual property rights of third parties. Any dispute or litigation regarding intellectual property could be expensive and time consuming, regardless of the merits of any claim, and could divert our management and key personnel from our business operations.
If we were to discover or be notified that our services potentially infringe or otherwise violate the intellectual property rights of others, we may need to obtain licenses from these parties in order to avoid infringement. We may not be able to obtain the necessary licenses on acceptable terms, or at all, and any such license may substantially restrict our use of the intellectual property. Moreover, if we are sued for infringement and lose the lawsuit, we could be required to pay substantial damages or be enjoined from offering the infringing services. Our intellectual property portfolio may not be useful in asserting a counterclaim, or negotiating a license, in response to a claim of intellectual property infringement. Any of the foregoing could cause us to incur significant costs and prevent us from selling our services.
Our business depends on our ability to utilize intellectual property, technology, and content owned by third parties, the loss of which would harm our business.
Our services utilize intellectual property, technology, and content owned by third parties. From time to time, we may be required to renegotiate with these third parties or negotiate with other third parties to include or continue using their intellectual property, technology, or content in our existing service offerings, in new versions of our service offerings, or in new services that we offer. We may not be able to obtain the necessary rights from these third parties on commercially reasonable terms, or at all, and the third-party intellectual property, technology, and content we use or desire to use may not be appropriately supported, maintained, or enhanced by the third parties. If we are unable to obtain the rights necessary to use or continue to use third-party intellectual property, technology, and content in our services, or if those third parties are unable to support, maintain, and enhance their intellectual property, technology, and content, we could experience increased costs or delays or reductions in our service offerings, which in turn may harm our financial condition, damage our brand, and result in the loss of customers.
We are building our intellectual property portfolio internally and through acquisitions, such as our acquisitions of ID Analytics. We may be required to incur substantial expenses to do so, and our efforts may not be successful.
Our use of “open source” software could negatively affect our ability to sell our services and subject us to possible litigation.
Software code that is freely shared in the software development community is referred to as open source software. A portion of the technologies licensed by us incorporates such open source software, and we may incorporate open source software in the future. Such open source software is generally licensed by its authors under open source licenses. Use and distribution of open source software may entail greater risks than use of third-party commercial software, as open source licensors generally do not provide warranties or other contractual protections regarding infringement claims or the quality of the code. Some open source licenses, such as the GNU General Public License, require that source code subject to the license be disclosed to third parties, grant such third parties the right to modify and redistribute that source code and a requirement that the source code for any software derived from it be disclosed. If we combine our proprietary software with open source software in a certain manner, we could, under certain open source licenses, be required to release the source code of our proprietary software to the public. This would allow our competitors to create similar services and platforms with lower development effort and time and ultimately could reduce or eliminate our ability to commercialize or profit from our services.
Although we have established internal review and approval processes with respect to the use of open source software to avoid subjecting our technologies to conditions we do not intend, we cannot be certain that all open source software is submitted for approval prior to use in our services. The terms of many open source licenses have not been interpreted by the U.S. courts, and there is a risk that these licenses could be construed in a way that imposes unanticipated conditions or restrictions on our ability to commercialize our services. In this event, we could be required to seek licenses from third parties to continue offering our services, to make generally available, in source code form, our proprietary code, or to discontinue the sale of our services, any of which could adversely affect our business, operating results, and financial condition.
Our operating results may vary significantly and be unpredictable, which could cause the trading price of our stock to decline, make period-to-period comparisons less meaningful, and make our future results difficult to predict.
We may experience significant fluctuations in our revenue, expenses, and operating results in future periods. Our operating results may fluctuate in the future as a result of a number of factors, many of which are beyond our control. These fluctuations may result in declines in our stock price. Moreover, these fluctuations may make comparing our operating results on a period-to-period basis less meaningful and make our future results difficult to predict. You should not rely on our past results as an indication of our future performance. In addition, if revenue levels do not meet our expectations, our operating results and ability to execute on our business plan are likely to be harmed. In addition to the other factors listed in this “Risk Factors” section, factors that could affect our operating results include the following:
|
• |
our ability to expand our customer base and the market for our services; |
26
|
• |
our ability to generate revenue from existing customers; |
|
• |
our ability to establish and maintain relationships with strategic partners; |
|
• |
our expense and capital expenditure levels; |
|
• |
service introductions or enhancements and market acceptance of new services by us and our competitors; |
|
• |
pricing and availability of competitive services; |
|
• |
our ability to address competitive factors successfully; |
|
• |
changes in the competitive landscape as a result of mergers, acquisitions, or strategic alliances that could allow our competitors to gain market share, or the emergence of new competitors; |
|
• |
changes or anticipated changes in economic conditions; and |
|
• |
changes in legislation and regulatory requirements related to our business. |
Due to these and other factors, our financial results for any quarterly or annual period may not meet our expectations or the expectations of investors or analysts that follow our stock and may not be meaningful indications of our future performance.
Because we recognize revenue in our consumer business from our members over the term of their subscription periods, fluctuations in sales or retention may not be immediately reflected in our operating results.
We recognize revenue in our consumer business from our members ratably over the term of their subscription periods. As a result, a large portion of the revenue we recognize in any period is deferred revenue from memberships purchased during previous periods. Consequently, a decline in new members or a decrease in member retention in any particular period will not necessarily be fully reflected in the consumer revenue in that period and will negatively affect our revenue in future periods. In addition, we may be unable to adjust our cost structure to reflect this reduced revenue. Accordingly, the effect of significant fluctuations in new members or member retention and market acceptance of our services may not be fully reflected in our operating results until future periods. Our subscription model also makes it difficult for us rapidly to increase our revenue through additional sales in any period, as revenue from new members is recognized ratably over the applicable subscription periods.
We may be subject to assertions that taxes must be collected based on sales and use of our services in various states, which could expose us to liability and cause material harm to our business, financial condition, and results of operations.
Whether sales of our services are subject to state sales and use taxes is uncertain, due in part to the nature of our services and the relationships through which our services are offered, as well as changing state laws and interpretations of those laws. In 2012 we entered into a settlement agreement with the New York State Department of Taxation and Finances regarding our historic and ongoing tax collection obligations. We currently collect and remit sales tax in several states related to the sale of our consumer services. Additional states or one or more countries or other jurisdictions may seek to impose sales or other tax collection obligations on us in the future. A successful assertion by any state, country, or other jurisdiction that we should be collecting sales or other taxes on the sale of our services could, among other things, increase the cost of our services, create significant administrative burdens for us, result in substantial tax liabilities for past sales, discourage current members and other consumers from purchasing our services, or otherwise substantially harm our business and operating results.
Increases in credit card processing fees would increase our operating expenses and adversely affect our operating results, and the termination of our relationship with any major credit card company would have a severe, negative impact on our business.
A substantial majority of our members pay for our services using credit cards. From time to time, the major credit card companies or the issuing banks may increase the fees that they charge for each transaction using their cards. An increase in those fees would require us to either increase the prices we charge for our services or suffer a negative impact on our margins, either of which could adversely affect our business, operating results, and financial condition.
In addition, our credit card fees may be increased by credit card companies if our chargeback rate, or the rate of payment refunds, exceeds certain minimum thresholds. If we are unable to maintain our chargeback rate at acceptable levels, our credit card fees for chargeback transactions, or for all credit card transactions, may be increased, and, if the problem significantly worsens, credit card companies may further increase our fees or terminate their relationship with us. In addition, changes in billing systems in the future could increase the per transaction cost that we pay. Any increases in our credit card fees could adversely affect our operating results, particularly if we elect not to raise the retail list price for our consumer services to offset the increase. The termination of our ability to process payments on any major credit card would significantly impair our business.
Any indebtedness could adversely affect our business and limit our ability to expand our business or respond to changes, and we may be unable to generate sufficient cash flow to satisfy our debt service obligations.
As of December 31, 2013, we had no outstanding debt. We may incur indebtedness in the future, including borrowings available under our $85 million credit facility with Bank of America. Any substantial indebtedness and the fact that a substantial portion of our cash flow from operating activities could be needed to make payments on this indebtedness could have adverse consequences, including the following:
27
|
• |
reducing the availability of our cash flow for our operations, capital expenditures, future business opportunities, and other purposes; |
|
• |
limiting our flexibility in planning for, or reacting to, changes in our business and the industries in which we operate, which would place us at a competitive disadvantage compared to our competitors that may have less debt; |
|
• |
limiting our ability to borrow additional funds; |
|
• |
increasing our vulnerability to general adverse economic and industry conditions; and |
|
• |
failing to comply with the covenants in our debt agreements could result in all of our indebtedness becoming immediately due and payable. |
Our ability to borrow any funds needed to operate and expand our business will depend in part on our ability to generate cash. Our ability to generate cash is subject to the performance of our business as well as general economic, financial, competitive, legislative, regulatory, and other factors that are beyond our control. If our business does not generate sufficient cash flow from operating activities or if future borrowings are not available to us under our senior credit facility or otherwise in amounts sufficient to enable us to fund our liquidity needs, our operating results, financial condition, and ability to expand our business may be adversely affected. Moreover, our inability to make scheduled payments on our debt obligations in the future would require us to refinance all or a portion of our indebtedness on or before maturity, sell assets, delay capital expenditures, or seek additional equity.
Covenants in our senior credit facility impose, and any future debt arrangements may impose, significant operating and financial restrictions that may adversely affect our business and ability to operate our business.
The agreement governing our senior credit facility with Bank of America contains covenants that limit various actions that we may take, including the following:
|
• |
incurring additional indebtedness; |
|
• |
granting additional liens; |
|
• |
making certain investments and distributions; |
|
• |
merging, dissolving, liquidating, consolidating, or disposing of all or substantially all of our assets; |
|
• |
prepaying and modifying debt instruments; and |
|
• |
entering into transactions with affiliates. |
These restrictions could limit our ability to finance our future operations or capital needs, make acquisitions, or pursue available business opportunities. Our senior credit facility also requires us to maintain specified financial ratios and satisfy financial condition tests at the end of each fiscal quarter. Our ability to meet these financial ratios and tests can be affected by events beyond our control, and we may not meet those tests. We may be required to take action to reduce our indebtedness or to act in a manner contrary to our business objectives to meet these ratios and satisfy these covenants. We could also incur additional indebtedness in the future having even more restrictive covenants.
Failure to comply with any of the covenants under our senior credit facility, or any other indebtedness we may incur, could result in a default under such agreements, which could result in an acceleration of the timing of payments on all of our outstanding indebtedness and other negative consequences. In addition, since our senior credit facility with Bank of America is secured by substantially all of our assets, a default under that facility could result in Bank of America exercising its lien on substantially all of our assets. Any of these events could have a material adverse effect on our business, operating results, and financial condition.
The requirements of being a public company may strain our resources, divert management’s attention, and affect our ability to attract and retain qualified board members.
We will incur significant legal, accounting, and other expenses as a public company, including costs resulting from public company reporting obligations under the Exchange Act and the rules and regulations regarding corporate governance practices, including those under the Sarbanes-Oxley Act, the Dodd-Frank Act, and the listing requirements of the stock exchange on which our securities are listed. Compliance with these reporting requirements, rules, and regulations has increased and will continue to increase our legal and financial compliance costs, make some activities more difficult, time-consuming, or costly, and increase demand on our systems and resources. As a result, management’s attention may be diverted from other business concerns, which could harm our business and operating results.
In addition, changing laws, regulations, and standards relating to corporate governance and public disclosure are creating uncertainty for public companies, increasing legal and financial compliance costs and making some activities more time consuming. These laws, regulations, and standards are subject to varying interpretations, in many cases due to their lack of specificity, and, as a result, their application in practice may evolve over time as new guidance is provided by regulatory and governing bodies. This could result in continuing uncertainty regarding compliance matters and higher costs necessitated by ongoing revisions to disclosure and governance practices. We intend to invest resources to comply with evolving laws, regulations, and standards, and this investment may result in increased general and administrative expenses and a diversion of management’s time and attention from revenue-
28
generating activities to compliance activities. If our efforts to comply with new laws, regulations, and standards are unsuccessful, regulatory authorities may initiate legal proceedings against us and our business may be harmed.
We also expect these rules and regulations to make it more difficult and more expensive for us to obtain director and officer liability insurance, and we may be required to accept reduced policy limits and coverage or incur substantially higher costs to obtain the same or similar coverage. These factors could also make it more difficult for us to attract and retain qualified persons to serve on our board of directors, particularly to serve on our audit and compensation committees, or as executive officers.
Our ability to use our net operating loss carry-forwards and certain other tax attributes may be limited, which could potentially result in increased tax liabilities to us in the future.
As of December 31, 2013, we had approximately $199.4 million of federal and approximately $138.0 million (restated) of state net operating loss carry-forwards. Under Section 382 of the Internal Revenue Code of 1986, as amended, or the Internal Revenue Code, if a corporation undergoes an “ownership change” (generally defined as a greater than 50% change (by value) in its equity ownership over a three year period), the corporation’s ability to use its pre-change net operating loss carry-forwards and other pre-change tax attributes (such as research tax credits) to offset its post-change income may be limited. We recently completed an analysis of prior year ownership changes and determined that we experienced an “ownership change” as defined by Section 382 of the Internal Revenue Code. However, we determined that none of our federal and state net operating loss carry-forwards will expire solely as a result of our prior ownership changes. Additionally, with our initial public offering, or IPO, and other transactions that have occurred over the past three years, we may also experience an “ownership change” in the future as a result of subsequent shifts in our stock ownership. As a result, if we earn net taxable income, our ability to use our pre-change net operating loss carry-forwards to offset taxable income may be subject to limitations, which could potentially result in increased future tax liability to us.
Risks Related to Ownership of Our Common Stock
Our stock price has been and will likely continue to be volatile, and the value of an investment in our common stock may decline.
The trading price of our common stock has been, and is likely to continue to be, volatile. In addition to the risk factors described in this section and elsewhere in this Form 10-K/A, factors that may cause the price of our common stock to fluctuate include the following:
|
• |
actual or anticipated fluctuations in our quarterly or annual financial results; |
|
• |
the financial guidance we may provide to the public, any changes in such guidance, or our failure to meet such guidance; |
|
• |
the failure of industry or securities analysts to maintain coverage of our company, changes in financial estimates by any industry or securities analysts that follow our company, or our failure to meet such estimates; |
|
• |
various market factors or perceived market factors, including rumors, whether or not correct, involving us, our customers, our strategic partners, or our competitors; |
|
• |
sales, or anticipated sales, of large blocks of our stock; |
|
• |
short selling of our common stock by investors; |
|
• |
additions or departures of key personnel; |
|
• |
announcements of technological innovations by us or by our competitors; |
|
• |
introductions of new services or new pricing policies by us or by our competitors; |
|
• |
regulatory or political developments; |
|
• |
litigation and governmental or regulatory investigations; |
|
• |
acquisitions or strategic alliances by us or by our competitors; and |
|
• |
general economic, political, and financial market conditions or events. |
Furthermore, the stock markets have experienced extreme price and volume fluctuations that have affected and continue to affect the market prices of equity securities of many companies. These fluctuations often have been unrelated or disproportionate to the operating performance of those companies. These and other factors may cause the market price and demand for our common stock to fluctuate substantially, which may limit or prevent investors from readily selling their shares of common stock and may otherwise negatively affect the price or liquidity of our common stock. In addition, in the past, when the market price of a stock has been volatile, holders of that stock have sometimes instituted securities class action litigation against the company that issued the stock. If any of our stockholders were to bring a lawsuit against us, we could incur substantial costs defending the lawsuit or paying for settlements or damages. Such a lawsuit could also divert the time and attention of our management from our business.
Future sales of our common stock in the public market by our existing stockholders, or the perception that such sales might occur, could depress the market price of our common stock.
The market price of our common stock could decline as a result of sales of a large number of shares of our common stock in the market, and even the perception that these sales could occur may depress the market price. As of December 31, 2013, we had
29
approximately 91.4 million shares of common stock outstanding. These shares may be sold in the public market, subject to prior registration or qualification for an exemption from registration, including, in the case of shares held by affiliates, compliance with the volume restrictions of Rule 144. In addition, shares issued or issuable upon the exercise of options and warrants are also eligible for sale. Sales of stock by these stockholders could have a material adverse effect on the trading price of our common stock.
Former holders of our preferred stock are entitled, under contracts providing for registration rights, to require us to register our securities owned by them for public sale. Registration of these shares under the Securities Act would result in the shares becoming freely tradable without restriction under the Securities Act, except for shares held by our affiliates. Any sales of securities by these stockholders could have a material adverse effect on the trading price of our common stock.
Sales of common stock as restrictions end or pursuant to registration rights may make it more difficult for us to sell equity securities in the future at a time and at a price that we deem appropriate.
Future sales and issuances of our common stock or rights to purchase common stock by us, including pursuant to our equity incentive plans, could result in additional dilution of the percentage ownership of our stockholders and could cause our stock price to fall.
We intend to issue additional securities pursuant to our equity incentive plans and may issue equity or convertible securities in the future. To the extent we do so, our stockholders may experience substantial dilution. We may sell common stock, convertible securities, or other equity securities in one or more transactions at prices and in a manner we determine from time to time. If we sell common stock, convertible securities, or other equity securities in more than one transaction, investors may be materially diluted by subsequent sales and new investors could gain rights superior to our existing stockholders.
Our directors, executive officers, and principal stockholders have substantial control over us and will be able to exert significant control over matters subject to stockholder approval.
Our directors, executive officers, and holders of more than 5% of our common stock, together with their affiliates, beneficially own or control a majority of our outstanding common stock. As a result, these stockholders, acting together, will be able to exercise significant influence over all matters requiring stockholder approval, including the election of directors and the approval of significant corporate transactions, such as a merger or other sale of our company or its assets. This concentration of ownership could limit your ability to influence corporate matters and may have the effect of delaying or preventing a third party from acquiring control over us.
Anti-takeover provisions could impair a takeover attempt and adversely affect existing stockholders.
Certain provisions of our certificate of incorporation and bylaws and applicable provisions of Delaware law may have the effect of rendering more difficult, delaying, or preventing an acquisition of our company, even when this would be in the best interest of our stockholders.
Our certificate of incorporation and bylaws include provisions that provide for the following:
|
• |
authorize our board of directors to issue, without further action by the stockholders, up to 10,000,000 shares of undesignated preferred stock; |
|
• |
require that any action to be taken by our stockholders be effected at a duly called annual or special meeting and not by written consent; |
|
• |
specify that special meetings of our stockholders can be called only by our board of directors, the chairperson of our board of directors, our chief executive officer, or our president (in the absence of a chief executive officer); |
|
• |
establish an advance notice procedure for stockholder proposals to be brought before an annual meeting, including proposed nominations of persons for election to our board of directors; |
|
• |
establish that our board of directors is divided into three classes, Class I, Class II, and Class III, with each class serving three-year staggered terms; |
|
• |
prohibit cumulative voting in the election of directors; |
|
• |
provide that our directors may be removed only for cause; |
|
• |
provide that vacancies on our board of directors may be filled only by a majority of directors then in office, even though less than a quorum; and |
|
• |
require the approval of our board of directors or the holders of a supermajority of our outstanding shares of capital stock to amend our bylaws and certain provisions of our certificate of incorporation. |
In addition, we are subject to Section 203 of the Delaware General Corporation Law, which generally prohibits a Delaware corporation from engaging in any of a broad range of business combinations with an interested stockholder for a period of three years following the date on which the stockholder became an interested stockholder, unless such transactions are approved by our board of directors. This provision could have the effect of delaying or preventing a change of control of our company, whether or not it is desired by or beneficial to our stockholders. In addition, other provisions of Delaware law may also discourage, delay, or prevent someone from acquiring us or merging with us.
30
These provisions, alone or together, could delay or prevent hostile takeovers and changes in control or changes in our management. Any provision of our certificate of incorporation or bylaws or Delaware law that has the effect of delaying or deterring a change in control could limit the opportunity for our stockholders to receive a premium for their shares of our common stock and could also affect the price that some investors are willing to pay for our common stock.
If securities or industry analysts do not publish or cease publishing research or reports about us, our business, or our market, or if they adversely change their recommendations regarding our stock, our stock price and trading volume could decline.
The trading market for our common stock will be influenced by the research and reports that securities or industry analysts may publish about us, our business, our market, or our competitors. If adequate research coverage is not established or maintained on our company or if any of the analysts who may cover us downgrade our stock or publish inaccurate or unfavorable research about our business or provide relatively more favorable recommendations about our competitors, our stock price would likely decline. If any analyst who may cover us were to cease coverage of our company or fail to regularly publish reports on us, we could lose visibility in the financial markets, which in turn could cause our stock price or trading volume to decline.
Since we do not expect to pay any cash dividends for the foreseeable future, our stockholders may be forced to sell their stock in order to obtain a return on their investment.
We have never declared or paid any cash dividends on our capital stock and do not anticipate declaring or paying any cash dividends in the foreseeable future. In addition, our new senior credit facility with Bank of America restricts our ability to pay cash dividends. We plan to retain any future earnings to finance our operations and growth plans discussed elsewhere in this Form 10-K/A. Accordingly, investors must rely on sales of shares of their common stock after price appreciation, which may never occur, as the only way to realize any return on their investment.
None.
Our corporate headquarters is located in Tempe, Arizona, where we lease approximately 85,000 square feet of office space under a lease that expires in 2024. We also lease an aggregate of approximately 50,000 square feet in Tempe, Arizona, Irvine, California, Sunnyvale, California, Mountain View, California, and San Francisco, California. We also have data centers for our consumer business in Arizona and Northern California.
Our enterprise business headquarters is located in San Diego, California, where we lease approximately 39,000 square feet under a lease that expires in 2018. We also have data centers for our enterprise business located in Nevada and Southern California.
We believe that our existing facilities are sufficient for our operational needs for the foreseeable future.
For a description of our material legal proceedings, see Note 18 —“Contingencies” in the Notes to the Consolidated Financial Statements included in Part II, Item 8 of this Form 10-K/A.
Not applicable.
31
|
MARKET FOR REGISTRANT’S COMMON EQUITY, RELATED STOCKHOLDER MATTERS AND ISSUER PURCHASES OF EQUITY SECURITIES. |
Market Information
Our common stock has been listed on The New York Stock Exchange under the symbol “LOCK” since October 3, 2012. Prior to that time, there was no public market for our common stock. The following table sets forth, for the periods indicated, the high and low sales price of our common stock as quoted on The New York Stock Exchange.
|
|
|
High |
|
|
Low |
|
||
|
Fiscal Year Ended December 31 2013: |
|
|
|
|
|
|
|
|
|
First Quarter |
|
$ |
12.49 |
|
|
$ |
7.94 |
|
|
Second Quarter |
|
$ |
11.88 |
|
|
$ |
8.31 |
|
|
Third Quarter |
|
$ |
15.21 |
|
|
$ |
10.49 |
|
|
Fourth Quarter |
|
$ |
17.79 |
|
|
$ |
13.16 |
|
|
Fiscal Year Ended December 31, 2012: |
|
|
|
|
|
|
|
|
|
Fourth Quarter (beginning October 3, 2012) |
|
$ |
9.04 |
|
|
$ |
6.80 |
|
On February 14, 2014, the closing price per share of our common stock as reported on The New York Stock Exchange was $21.90 per share. As of February 14, 2014, there were 63 holders of record of our common stock.
Dividend Policy
We have never declared or paid, and do not anticipate declaring or paying in the foreseeable future, any cash dividends on our capital stock. Any future determination as to the declaration and payment of dividends, if any, will be at the discretion of our board of directors and will depend on then existing conditions, including our operating results, financial condition, contractual restrictions, capital requirements, business prospects, and other factors our board of directors may deem relevant. Our senior credit facility restricts our ability to pay cash dividends.
Equity Compensation Plan Information
For equity compensation plan information, refer to Item 12 in Part III of this Form 10-K/A.
Performance Graph
This performance graph shall not be deemed “soliciting material” or to be “filed” with the SEC for purposes of Section 18 of the Exchange Act or otherwise subject to the liabilities under that section, and shall not be deemed to be incorporated by reference into any filing of LifeLock, Inc. under the Securities Act or the Exchange Act.
The following graph shows a comparison from October 3, 2012 (the date our common stock commenced trading on The New York Stock Exchange) through December 31, 2013 of the total cumulative return of our common stock with the total cumulative return of the NASDAQ Composite Index, the NASDAQ Computer Index and the Dow Jones US Technology. The comparison assumes that $100.00 was invested in our common stock, the NASDAQ Composite Index, the NASDAQ Computer Index and the Dow Jones US Technology, and assumes reinvestment of dividends, if any. The graph assumes the initial value of our common stock on October 3, 2012 was the closing sale price on that day of $8.36 per share and not the initial offering price to the public of $9.00 per share. The performance shown on the graph below is based on historical results and is not intended to suggest future performance.
32
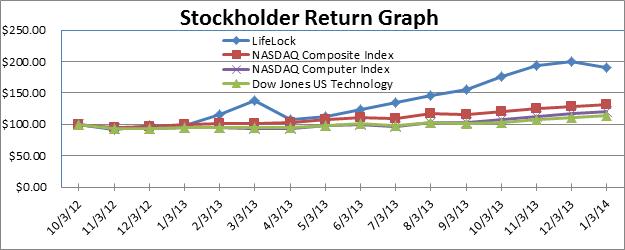
Purchases of Equity Securities by the Issuer and Affiliated Purchasers
On October 3, 2013, we acquired 835 shares of our common stock at $14.94 per share by way of a credit bid in connection with our legal proceedings against Neal Duncan.
33
As discussed in the Explanatory Note to this Form 10-K/A and in Note 2 and Note 19 to the Consolidated Financial Statements included in Part II, Item 8 of this Form 10-K/A, we are restating our audited consolidated financial statements and related disclosures for the year ended December 31, 2013. The following selected financial data should be read together with “Management’s Discussion and Analysis of Financial Condition and Results of Operations” and our consolidated financial statements and related notes included elsewhere in this Form 10-K/A. Our historical results are not necessarily indicative of the results that should be expected in the future and the selected financial data is not intended to replace the consolidated financial statements.
We have derived the consolidated statements of operations data for the years ended December 31, 2013, 2012, and 2011 and the consolidated balance sheet data as of December 31, 2013 and 2012 from our audited consolidated financial statements included elsewhere in this Form 10-K/A. We have derived the consolidated statements of operations data for the years ended December 31, 2010 and 2009 and the consolidated balance sheet data as of December 31, 2011, 2010, and 2009 from our audited consolidated financial statements not included in this Form 10-K/A. Our historical results are not necessarily indicative of the results that should be expected in the future and the selected financial data is not intended to replace the consolidated financial statements and related notes included elsewhere in this Form 10-K/A.
On December 11, 2013, we completed our acquisition of Lemon. On March 14, 2012, we completed our acquisition of ID Analytics. The consolidated statements of operations data for the years ended December 31, 2013 and 2012 only include the results for ID Lemon and ID Analytics since the respective dates of acquisition.
34
|
|
|
Year Ended December 31, |
|
|
|||||||||||||||||
|
|
|
2013 (Restated) |
|
|
2012 |
|
|
2011 |
|
|
2010 |
|
|
2009 |
|
|
|||||
|
Consolidated Statements of Operations Data: |
|
(in thousands, except per share data) |
|
|
|||||||||||||||||
|
Revenue: |
|
|
|
|
|
|
|
|
|
|
|
|
|
|
|
|
|
|
|
|
|
|
Consumer revenue |
|
$ |
340,121 |
|
|
$ |
254,678 |
|
|
$ |
193,949 |
|
|
$ |
162,279 |
|
|
$ |
131,368 |
|
|
|
Enterprise revenue |
|
|
29,537 |
|
|
|
21,750 |
|
|
|
- |
|
|
|
- |
|
|
|
- |
|
|
|
Total revenue |
|
|
369,658 |
|
|
|
276,428 |
|
|
|
193,949 |
|
|
|
162,279 |
|
|
|
131,368 |
|
|
|
Cost of services (1) |
|
|
100,065 |
|
|
|
79,916 |
|
|
|
62,630 |
|
|
|
51,445 |
|
|
|
43,109 |
|
|
|
Gross profit |
|
|
269,593 |
|
|
|
196,512 |
|
|
|
131,319 |
|
|
|
110,834 |
|
|
|
88,259 |
|
|
|
Costs and expenses: |
|
|
|
|
|
|
|
|
|
|
|
|
|
|
|
|
|
|
|
|
|
|
Sales and marketing (1) |
|
|
162,363 |
|
|
|
122,989 |
|
|
|
91,217 |
|
|
|
78,844 |
|
|
|
77,815 |
|
|
|
Technology and development (1) |
|
|
40,015 |
|
|
|
29,543 |
|
|
|
17,749 |
|
|
|
21,338 |
|
|
|
19,925 |
|
|
|
General and administrative (1) |
|
|
42,125 |
|
|
|
24,629 |
|
|
|
17,510 |
|
|
|
23,306 |
|
|
|
45,900 |
|
|
|
Amortization of acquired intangible assets |
|
|
7,909 |
|
|
|
6,258 |
|
|
|
- |
|
|
|
- |
|
|
|
- |
|
|
|
Total costs and expenses |
|
|
252,412 |
|
|
|
183,419 |
|
|
|
126,476 |
|
|
|
123,488 |
|
|
|
143,640 |
|
|
|
|
|
|
|
|
|
|
|
|
|
|
|
|
|
|
|
|
|
|
|
|
|
|
Income (loss) from operations |
|
|
17,181 |
|
|
|
13,093 |
|
|
|
4,843 |
|
|
|
(12,654 |
) |
|
|
(55,381 |
) |
|
|
|
|
|
|
|
|
|
|
|
|
|
|
|
|
|
|
|
|
|
|
|
|
|
Other income (expense): |
|
|
|
|
|
|
|
|
|
|
|
|
|
|
|
|
|
|
|
|
|
|
Interest expense |
|
|
(353 |
) |
|
|
(3,677 |
) |
|
|
(231 |
) |
|
|
(1,368 |
) |
|
|
(1,385 |
) |
|
|
Interest income |
|
|
124 |
|
|
|
30 |
|
|
|
8 |
|
|
|
28 |
|
|
|
110 |
|
|
|
Change in fair value of warrant liabilities |
|
|
- |
|
|
|
3,117 |
|
|
|
(8,658 |
) |
|
|
(1,333 |
) |
|
|
(1,919 |
) |
|
|
Change in fair value of embedded derivative |
|
|
- |
|
|
|
(2,785 |
) |
|
|
- |
|
|
|
- |
|
|
|
- |
|
|
|
Other |
|
|
(21 |
) |
|
|
(5 |
) |
|
|
(5 |
) |
|
|
(41 |
) |
|
|
(49 |
) |
|
|
Total other expense |
|
|
(250 |
) |
|
|
(3,320 |
) |
|
|
(8,886 |
) |
|
|
(2,714 |
) |
|
|
(3,243 |
) |
|
|
Income (loss) before provision for income taxes |
|
|
16,931 |
|
|
|
9,773 |
|
|
|
(4,043 |
) |
|
|
(15,368 |
) |
|
|
(58,624 |
) |
|
|
Income tax expense (benefit) |
|
|
(37,524 |
) |
|
|
(13,730 |
) |
|
|
214 |
|
|
|
8 |
|
|
|
39 |
|
|
|
Net income (loss) |
|
|
54,455 |
|
|
|
23,503 |
|
|
|
(4,257 |
) |
|
|
(15,376 |
) |
|
|
(58,663 |
) |
|
|
Accretion of convertible redeemable preferred stock |
|
|
- |
|
|
|
(9,378 |
) |
|
|
(18,926 |
) |
|
|
(16,145 |
) |
|
|
(10,299 |
) |
|
|
Contingent beneficial conversion feature |
|
|
- |
|
|
|
(2,452 |
) |
|
|
- |
|
|
|
- |
|
|
|
- |
|
|
|
Net income allocable to convertible redeemable preferred stockholders |
|
|
- |
|
|
|
(5,504 |
) |
|
|
- |
|
|
|
- |
|
|
|
- |
|
|
|
Net income available (loss attributable) to common stockholders |
|
$ |
54,455 |
|
|
$ |
6,169 |
|
|
$ |
(23,183 |
) |
|
$ |
(31,521 |
) |
|
$ |
(68,962 |
) |
|
|
|
|
|
|
|
|
|
|
|
|
|
|
|
|
|
|
|
|
|
|
|
|
|
Net income available (loss attributable) per share to common stockholders: |
|
|
|
|
|
|
|
|
|
|
|
|
|
|
|
|
|
|
|
|
|
|
Basic |
|
$ |
0.61 |
|
|
$ |
0.18 |
|
|
$ |
(1.24 |
) |
|
$ |
(1.74 |
) |
|
$ |
(3.86 |
) |
|
|
Diluted |
|
$ |
0.57 |
|
|
$ |
0.09 |
|
|
$ |
(1.24 |
) |
|
$ |
(1.74 |
) |
|
$ |
(3.86 |
) |
|
|
Weighted-average common shares outstanding: |
|
|
|
|
|
|
|
|
|
|
|
|
|
|
|
|
|
|
|
|
|
|
Basic |
|
|
88,636 |
|
|
|
35,082 |
|
|
|
18,725 |
|
|
|
18,068 |
|
|
|
17,843 |
|
|
|
Diluted |
|
|
96,047 |
|
|
|
62,191 |
|
|
|
18,725 |
|
|
|
18,068 |
|
|
|
17,843 |
|
|
|
(1) |
Share-based compensation included in the statement of operations data above was as follows: |
|
|
Year Ended December 31, |
|
|
|||||||||||||||||
|
|
2013 (Restated) |
|
|
2012 |
|
|
2011 |
|
|
2010 |
|
|
2009 |
|
|
|||||
|
|
(in thousands) |
|
|
|||||||||||||||||
|
Cost of services |
$ |
758 |
|
|
$ |
648 |
|
|
$ |
309 |
|
|
$ |
262 |
|
|
$ |
171 |
|
|
|
Sales and marketing |
|
1,340 |
|
|
|
1,053 |
|
|
|
655 |
|
|
|
690 |
|
|
|
543 |
|
|
|
Technology and development |
|
2,825 |
|
|
|
1,711 |
|
|
|
783 |
|
|
|
845 |
|
|
|
394 |
|
|
|
General and administrative |
|
6,188 |
|
|
|
3,346 |
|
|
|
1,538 |
|
|
|
1,454 |
|
|
|
1,033 |
|
|
|
Total share-based compensation |
$ |
11,111 |
|
|
$ |
6,758 |
|
|
$ |
3,285 |
|
|
$ |
3,251 |
|
|
$ |
2,141 |
|
|
35
|
|
As of December 31, |
|
|
|||||||||||||||||
|
|
2013 (Restated) |
|
|
2012 |
|
|
2011 |
|
|
2010 |
|
|
2009 |
|
|
|||||
|
Consolidated Balance Sheet Data: |
(in thousands) |
|
|
|||||||||||||||||
|
Cash and cash equivalents |
$ |
123,911 |
|
|
$ |
134,197 |
|
|
$ |
28,850 |
|
|
$ |
17,581 |
|
|
$ |
5,611 |
|
|
|
Marketable securities |
|
48,688 |
|
|
|
- |
|
|
|
- |
|
|
|
- |
|
|
|
- |
|
|
|
Property and equipment, net |
|
16,504 |
|
|
|
9,701 |
|
|
|
4,049 |
|
|
|
6,534 |
|
|
|
8,624 |
|
|
|
Working capital (deficit), excluding deferred revenue |
|
166,235 |
|
|
|
119,030 |
|
|
|
13,947 |
|
|
|
(10,915 |
) |
|
|
(26,541 |
) |
|
|
Total assets |
|
461,665 |
|
|
|
339,588 |
|
|
|
42,060 |
|
|
|
31,360 |
|
|
|
20,793 |
|
|
|
Deferred revenue |
|
119,106 |
|
|
|
90,877 |
|
|
|
70,020 |
|
|
|
56,580 |
|
|
|
49,433 |
|
|
|
Long-term debt, including current portion |
|
- |
|
|
|
- |
|
|
|
- |
|
|
|
13,010 |
|
|
|
218 |
|
|
|
Convertible redeemable preferred stock |
|
- |
|
|
|
- |
|
|
|
145,207 |
|
|
|
126,281 |
|
|
|
93,069 |
|
|
|
Total stockholders' equity (deficit) |
|
300,571 |
|
|
|
219,966 |
|
|
|
(214,267 |
) |
|
|
(196,121 |
) |
|
|
(168,302 |
) |
|
|
|
Year Ended December 31, |
|
|
|||||||||||||||||
|
|
2013 (Restated) |
|
|
2012 |
|
|
2011 |
|
|
2010 |
|
|
2009 |
|
|
|||||
|
Consolidated Statements of Cash Flows Data: |
(in thousands) |
|
|
|||||||||||||||||
|
Net cash provided by (used in) |
|
|
|
|
|
|
|
|
|
|
|
|
|
|
|
|
|
|
|
|
|
Operating activities |
$ |
77,373 |
|
|
$ |
48,423 |
|
|
$ |
24,344 |
|
|
$ |
(14,510 |
) |
|
$ |
(23,396 |
) |
|
|
Investing activities |
|
(102,208 |
) |
|
|
(163,180 |
) |
|
|
(1,531 |
) |
|
|
(1,484 |
) |
|
|
(5,094 |
) |
|
|
Financing activities |
|
14,549 |
|
|
|
220,104 |
|
|
|
(11,544 |
) |
|
|
27,964 |
|
|
|
22,636 |
|
|
|
|
Year Ended December 31, |
|
|||||||||||||||||
|
|
2013 |
|
|
2012 |
|
|
2011 |
|
|
2010 |
|
|
2009 |
|
|||||
|
Other Financial and Operational Data: |
(in thousands, except percentages and per member data) (Unaudited) |
|
|||||||||||||||||
|
Cumulative ending members (1) |
|
2,999 |
|
|
|
2,480 |
|
|
|
2,075 |
|
|
|
1,748 |
|
|
|
1,621 |
|
|
Gross new members (2) |
|
944 |
|
|
|
762 |
|
|
|
704 |
|
|
|
517 |
|
|
|
618 |
|
|
Member retention rate (3) |
|
87.8 |
% |
|
|
87.1 |
% |
|
|
82.7 |
% |
|
|
79.1 |
% |
|
|
79.3 |
% |
|
Average cost of acquisition per member (restated as to 2013) (4) |
$ |
160 |
|
|
$ |
150 |
|
|
$ |
130 |
|
|
$ |
152 |
|
|
$ |
126 |
|
|
Monthly average revenue per member (5) |
$ |
10.32 |
|
|
$ |
9.28 |
|
|
$ |
8.54 |
|
|
$ |
7.94 |
|
|
$ |
7.30 |
|
|
Enterprise transactions (6) |
|
216,729 |
|
|
|
227,039 |
|
|
|
184,012 |
|
|
|
108,707 |
|
|
|
75,763 |
|
|
Adjusted net income (loss) (7) |
$ |
36,931 |
|
|
$ |
22,720 |
|
|
$ |
8,326 |
|
|
$ |
(10,792 |
) |
|
$ |
(54,603 |
) |
|
Adjusted EBITDA (8) |
$ |
42,156 |
|
|
$ |
30,996 |
|
|
$ |
12,508 |
|
|
$ |
(5,189 |
) |
|
$ |
(49,402 |
) |
|
Free cash flow (9) |
$ |
66,956 |
|
|
$ |
40,925 |
|
|
$ |
22,313 |
|
|
$ |
(15,995 |
) |
|
$ |
(28,488 |
) |
|
(1) |
We calculate cumulative ending members as the total number of members at the end of the relevant period. For more information, see “Management’s Discussion and Analysis of Financial Condition and Results of Operations—Key Metrics—Key Operating Metrics—Cumulative ending members.” |
|
(2) |
We calculate gross new members as the total number of members who enroll in one of our consumer services during the relevant period. For more information, see “Management’s Discussion and Analysis of Financial Condition and Results of Operations—Key Metrics—Key Operating Metrics—Gross new members.” |
|
(3) |
We define member retention rate as the percentage of members on the last day of the prior year who remain members on the last day of the current year, or for quarterly presentations, the percentage of members on the last day of the comparable quarterly period in the prior year who remain members on the last day of the current quarterly period. For more information, see “Management’s Discussion and Analysis of Financial Condition and Results of Operations—Key Metrics—Key Operating Metrics—Member retention rate.” |
|
(4) |
We calculate average cost of acquisition per member as our sales and marketing expense for our consumer segment during the relevant period divided by our gross new members for the period. For more information, see “Management’s Discussion and Analysis of Financial Condition and Results of Operations—Key Metrics—Key Operating Metrics—Average cost of acquisition per member.” |
|
(5) |
We calculate monthly average revenue per member as our consumer revenue during the relevant period divided by the average number of cumulative ending members during the relevant period (determined by taking the average of the cumulative ending members at the beginning of the relevant period and the cumulative ending members at the end of each month in the relevant period), divided by the number of months in the relevant period. For more information, see “Management’s Discussion and Analysis of Financial Condition and Results of Operations—Key Metrics—Key Operating Metrics—Monthly average revenue per member.” |
36
|
(6) |
We calculate enterprise transactions as the total number of transactions processed for either an identity risk or credit risk score during the relevant period. For more information, see “Management’s Discussion and Analysis of Financial Condition and Results of Operations—Key Metrics—Key Operating Metrics—Enterprise transactions.” Our enterprise transactions are processed by ID Analytics, which we acquired on March 14, 2012. Accordingly, the enterprise transactions data includes transactions processed by ID Analytics before the acquisition. |
|
(7) |
Adjusted net income (loss) is a non-GAAP financial measure that we calculate as net income (loss) excluding amortization of acquired intangible assets, change in fair value of warrant liabilities, change in fair value of embedded derivatives, share-based compensation, acquisition related expenses, and income tax benefits and expenses resulting from changes in our deferred tax assets. For more information about adjusted net income (loss) and a reconciliation of adjusted EBITDA to net income (loss), the most directly comparable financial measure calculated and presented in accordance with GAAP, see “Non-GAAP Financial Measures—Adjusted Net Income.” |
|
(8) |
Adjusted EBITDA is a non-GAAP financial measure that we calculate as net income (loss) excluding depreciation and amortization, interest expense, interest income, change in fair value of warrant liabilities, change in fair value of embedded derivatives, other income (expense) (which consists primarily of gains and losses on disposal of fixed assets), provision for income taxes, acquisition related expenses, and share-based compensation. For more information about adjusted EBITDA and a reconciliation of adjusted EBITDA to net income (loss), the most directly comparable financial measure calculated and presented in accordance with GAAP, see “Non-GAAP Financial Measures—Adjusted EBITDA.” |
|
(9) |
Free cash flow is a non-GAAP financial measure that we calculate as net cash provided by (used in) operating activities less net cash used in investing activities for acquisitions of property and equipment. For more information about free cash flow and a reconciliation of free cash flow to net cash provided by (used in) operating activities, the most directly comparable financial measure calculated and presented in accordance with GAAP, see “Non-GAAP Financial Measures—Free Cash Flow.” |
Non-GAAP Financial Measures
Adjusted Net Income (Loss)
Adjusted net income (loss) is a non-GAAP financial measure that we calculate as net income (loss) excluding amortization of acquired intangible assets, change in fair value of warrant liabilities, change in fair value of embedded derivatives, share-based compensation, acquisition related expenses, and income tax benefits and expenses resulting from changes in our deferred tax assets. We have included adjusted net income (loss) in this Form 10-K/A because it is a key measure used by us to understand and evaluate our core operating performance and trends. In particular, the exclusion of certain expenses in calculating adjusted net income (loss) can provide a useful measure for period-to-period comparisons of our core business.
Accordingly, we believe that adjusted net income (loss) provides useful information to investors and others in understanding and evaluating our operating results in the same manner as we do. We believe that it is useful to exclude amortization of acquired intangible assets, change in fair value of warrant liabilities, change in fair value of embedded derivatives, share-based compensation, acquisition related expenses, and income tax benefits and expenses resulting from changes in our deferred tax assets because (i) the amount of such expenses in any specific period may not directly correlate to the underlying operational performance of our business, and/or (ii) such expenses can vary significantly between periods as a result of new acquisitions and full amortization of previously acquired intangible assets.
Our use of adjusted net income (loss) has limitations as an analytical tool, and you should not consider it in isolation or as a substitute for analysis of our operating results as reported under GAAP. Some of these limitations include the following:
|
· |
although amortization of intangible assets is a non-cash charge, additional intangible assets may be acquired in the future and adjusted net income (loss) does not reflect cash capital expenditure requirements for new acquisitions; |
|
· |
adjusted net income (loss) does not reflect the cash requirements for new acquisitions; |
|
· |
adjusted net income (loss) does not reflect changes in, or cash requirements for, our working capital needs; |
|
· |
adjusted net income (loss) does not consider the potentially dilutive impact of share-based compensation; |
|
· |
adjusted net income (loss) does not reflect the deferred income tax benefit from the release of the valuation allowance or income tax expenses which reduce our deferred tax asset for net operating losses or other net changes in deferred tax assets; |
|
· |
adjusted net income (loss) does not reflect the expenses incurred for new acquisitions; and |
|
· |
other companies, including companies in our industry, may calculate adjusted net income (loss) or similarly titled measures differently, limiting their usefulness as a comparative measure. |
37
Because of these limitations, you should consider adjusted net income (loss) alongside other financial performance measures, including various cash flow metrics, net income (loss), and our other GAAP results. The following table presents a reconciliation of adjusted net income (loss) to net income (loss) for each of the periods indicated:
|
|
Year Ended December 31, |
|
|||||||||||||||||
|
|
2013 (Restated) |
|
|
2012 |
|
|
2011 |
|
|
2010 |
|
|
2009 |
|
|||||
|
Reconciliation of Net Income (Loss) to Adjusted Net Income (Loss): |
(in thousands) |
|
|||||||||||||||||
|
Net income (loss) |
$ |
54,455 |
|
|
$ |
23,503 |
|
|
$ |
(4,257 |
) |
|
$ |
(15,376 |
) |
|
$ |
(58,663 |
) |
|
Amortization of acquired intangible assets |
|
7,909 |
|
|
|
6,258 |
|
|
|
- |
|
|
|
- |
|
|
|
- |
|
|
Share-based compensation |
|
11,111 |
|
|
|
6,758 |
|
|
|
3,285 |
|
|
|
3,251 |
|
|
|
2,141 |
|
|
Change in fair value of warrant liabilities |
|
- |
|
|
|
(3,117 |
) |
|
|
8,658 |
|
|
|
1,333 |
|
|
|
1,919 |
|
|
Change in fair value of embedded derivative |
|
- |
|
|
|
2,785 |
|
|
|
- |
|
|
|
- |
|
|
|
- |
|
|
Acquisition expenses |
|
1,068 |
|
|
|
718 |
|
|
|
640 |
|
|
|
- |
|
|
|
- |
|
|
Deferred income tax benefit |
|
(37,612 |
) |
|
|
(14,185 |
) |
|
|
- |
|
|
|
- |
|
|
|
- |
|
|
Adjusted net income (loss) |
$ |
36,931 |
|
|
$ |
22,720 |
|
|
$ |
8,326 |
|
|
$ |
(10,792 |
) |
|
$ |
(54,603 |
) |
In the fourth quarter of 2013, we modified our calculation of adjusted net income to also exclude acquisition related expense. For comparative purposes, we also modified our calculation of adjusted net income for 2012 and 2011 to exclude the acquisition related expenses incurred during our acquisition of ID Analytics.
Adjusted EBITDA
Adjusted EBITDA is a non-GAAP financial measure that we calculate as net income (loss) excluding depreciation and amortization, interest expense, interest income, change in fair value of warrant liabilities, change in fair value of embedded derivatives, other income (expense) (which consists primarily of gains and losses on disposal of fixed assets), income tax (benefit) expense, acquisition related expenses, and share-based compensation. We have included adjusted EBITDA in this Form 10-K/A because it is a key measure used by us to understand and evaluate our core operating performance and trends, to prepare and approve our annual budget, and to develop short- and long-term operational plans. In particular, the exclusion of certain expenses in calculating adjusted EBITDA can provide a useful measure for period-to-period comparisons of our core business. Additionally, adjusted EBITDA is a key financial measure used in determining management’s incentive compensation.
Accordingly, we believe that adjusted EBITDA provides useful information to investors and others in understanding and evaluating our operating results in the same manner as we do. We believe that it is useful to exclude charges for depreciation and amortization, change in fair value of warrant liabilities, change in fair value of embedded derivatives, acquisition related expenses, income taxes, and share-based compensation from net income (loss) because (i) the amount of such non-cash expenses in any specific period may not directly correlate to the underlying operational performance of our business, and/or (ii) such expenses can vary significantly between periods as a result of new acquisitions and full amortization of previously acquired intangible assets.
Our use of adjusted EBITDA has limitations as an analytical tool, and you should not consider it in isolation or as a substitute for analysis of our operating results as reported under GAAP. Some of these limitations include the following:
|
· |
although depreciation and amortization are non-cash charges, the assets being depreciated and amortized may have to be replaced in the future, and adjusted EBITDA does not reflect cash capital expenditure requirements for such replacements or for new capital expenditure requirements; |
|
· |
adjusted EBITDA does not reflect changes in, or cash requirements for, our working capital needs; |
|
· |
adjusted EBITDA does not consider the potentially dilutive impact of share-based compensation; |
|
· |
adjusted EBITDA does not reflect cash interest income or expense; |
|
· |
adjusted EBITDA does not reflect tax payments that may represent a reduction in cash available to us; |
|
· |
adjusted EBITDA does not reflect the expenses incurred for new acquisitions; and |
|
· |
other companies, including companies in our industry, may calculate adjusted EBITDA or similarly titled measures differently, limiting their usefulness as a comparative measure. |
38
Because of these limitations, you should consider adjusted EBITDA alongside other financial performance measures, including various cash flow metrics, net income (loss), and our other GAAP results. The following table presents a reconciliation of adjusted EBITDA to net income (loss) for each of the periods indicated:
|
|
Year Ended December 31, |
|
|||||||||||||||||
|
|
2013 (Restated) |
|
|
2012 |
|
|
2011 |
|
|
2010 |
|
|
2009 |
|
|||||
|
Reconciliation of Net Income (Loss) to Adjusted EBITDA: |
(in thousands) |
|
|||||||||||||||||
|
Net income (loss) |
$ |
54,455 |
|
|
$ |
23,503 |
|
|
$ |
(4,257 |
) |
|
$ |
(15,376 |
) |
|
$ |
(58,663 |
) |
|
Depreciation and amortization |
|
12,796 |
|
|
|
10,427 |
|
|
|
3,740 |
|
|
|
4,214 |
|
|
|
3,838 |
|
|
Share-based compensation |
|
11,111 |
|
|
|
6,758 |
|
|
|
3,285 |
|
|
|
3,251 |
|
|
|
2,141 |
|
|
Interest expense |
|
353 |
|
|
|
3,677 |
|
|
|
231 |
|
|
|
1,368 |
|
|
|
1,385 |
|
|
Interest income |
|
(124 |
) |
|
|
(30 |
) |
|
|
(8 |
) |
|
|
(28 |
) |
|
|
(110 |
) |
|
Change in fair value of warrant liabilities |
|
- |
|
|
|
(3,117 |
) |
|
|
8,658 |
|
|
|
1,333 |
|
|
|
1,919 |
|
|
Change in fair value of embedded derivatives |
|
- |
|
|
|
2,785 |
|
|
|
- |
|
|
|
- |
|
|
|
- |
|
|
Other expense |
|
21 |
|
|
|
5 |
|
|
|
5 |
|
|
|
41 |
|
|
|
49 |
|
|
Acquisition expenses |
|
1,068 |
|
|
|
718 |
|
|
|
640 |
|
|
|
- |
|
|
|
- |
|
|
Income tax (benefit) expense |
|
(37,524 |
) |
|
|
(13,730 |
) |
|
|
214 |
|
|
|
8 |
|
|
|
39 |
|
|
Adjusted EBITDA |
$ |
42,156 |
|
|
$ |
30,996 |
|
|
$ |
12,508 |
|
|
$ |
(5,189 |
) |
|
$ |
(49,402 |
) |
In the fourth quarter of 2013, we modified our calculation of adjusted EBITDA to also exclude acquisition related expense. For comparative purposes, we also modified our calculation of adjusted EBITDA for 2012 and 2011 to exclude the acquisition related expenses incurred during our acquisition of ID Analytics.
Free Cash Flow
We use free cash flow as a measure of our operating performance; for planning purposes, including the preparation of our annual operating budget; to allocate resources to enhance the financial performance of our business; to evaluate the effectiveness of our business strategies; to provide consistency and comparability with past financial performance; to determine capital requirements; to facilitate a comparison of our results with those of other companies; and in communications with our board of directors concerning our financial performance.
We use free cash flow to evaluate our business because, although it is similar to net cash provided by (used in) operating activities, we believe it typically presents a more conservative measure of cash flow as purchases of property and equipment are necessary components of ongoing operations. We believe that this non-GAAP financial measure is useful in evaluating our business because free cash flow reflects the cash surplus available to fund the expansion of our business after payment of capital expenditures relating to the necessary components of ongoing operations. We also believe that the use of free cash flow provides consistency and comparability with our past financial performance, facilitates period-to-period comparisons of operations, and also facilitates comparisons with other companies, many of which use similar non-GAAP financial measures to supplement their GAAP results.
Although free cash flow is frequently used by investors in their evaluations of companies, free cash flow has limitations as an analytical tool, and you should not consider it in isolation or as a substitute for analysis of our operating results as reported under GAAP. Some of these limitations include the following:
|
· |
free cash flow does not reflect our future requirements for contractual commitments to third- party providers; |
|
· |
free cash flow does not reflect the non-cash component of employee compensation or depreciation and amortization of property and equipment; and |
|
· |
other companies, including companies in our industry, may calculate free cash flow or similarly titled measures differently, limiting their usefulness as comparative measures. |
Because of these limitations, you should consider free cash flow alongside other financial performance measures, including net cash provided by (used in) operating activities, net income (loss), and our other GAAP results. The following table presents a reconciliation of free cash flow to net cash provided by (used in) operating activities for each of the periods indicated:
|
|
Year Ended December 31, |
|
|||||||||||||||||
|
|
2013 |
|
|
2012 |
|
|
2011 |
|
|
2010 |
|
|
2009 |
|
|||||
|
Reconciliation of Net Cash Provided By (Used In) Operating Activities to Free Cash Flow: |
(in thousands) |
|
|||||||||||||||||
|
Net cash provided by (used in) operating activities |
$ |
77,373 |
|
|
$ |
48,423 |
|
|
$ |
24,344 |
|
|
$ |
(14,510 |
) |
|
$ |
(23,396 |
) |
|
Acquisitions of property and equipment |
|
(10,417 |
) |
|
|
(7,498 |
) |
|
|
(2,031 |
) |
|
|
(1,485 |
) |
|
|
(5,092 |
) |
|
Free cash flow |
$ |
66,956 |
|
|
$ |
40,925 |
|
|
$ |
22,313 |
|
|
$ |
(15,995 |
) |
|
$ |
(28,488 |
) |
39
The following discussion and analysis of our financial condition and results of operations should be read together with “Selected Financial Data” and our consolidated financial statements and accompanying notes appearing elsewhere in this Form 10-K/A. This discussion contains forward-looking statements, based upon our current expectations and related to future events and our future financial performance, that involve risks and uncertainties. Our actual results may differ materially from those anticipated in these forward-looking statements as a result of various factors, including those set forth under “Risk Factors,” “Forward-Looking Statements,” and elsewhere in this Form 10-K/A.
Restatement
As discussed in the Explanatory Note to this Form 10-K/A and in Note 2 and Note 19 to the Consolidated Financial Statements included in Part II, Item 8 of this Form 10-K/A, we are restating our audited consolidated financial statements and related disclosures for the year ended December 31, 2013. The following discussion and analysis of our financial condition and results of operations incorporates the restated amounts. For this reason, the data set forth in this Item 7 may not be comparable to the discussion and data in our previously filed Annual Report on Form 10-K for the year ended December 31, 2013.
Overview
We are a leading provider of proactive identity theft protection services for consumers and fraud and risk solutions for enterprises. We protect our members by constantly monitoring identity-related events, such as new account openings and credit-related applications. If we detect that a member’s personally identifiable information is being used, we offer notifications and alerts, including proactive, near real-time, actionable alerts that provide our members peace of mind that we are monitoring use of their identity and allow our members to confirm valid or unauthorized identity use. If a member confirms that the use of his or her identity is unauthorized, we can proactively take actions designed to protect the member’s identity. We also provide remediation services to our members in the event that an identity theft actually occurs. We protect our enterprise customers by delivering on-demand identity risk and authentication information about consumers. Our enterprise customers utilize this information in real time to make decisions about opening or modifying accounts and providing products, services, or credit to consumers to reduce financial losses from identity fraud.
The foundation of our differentiated services is the LifeLock ecosystem. This ecosystem combines large data repositories of personally identifiable information and consumer transactions, proprietary predictive analytics, and a highly scalable technology platform. Our members and enterprise customers enhance our ecosystem by continually contributing to the identity and transaction data in our repositories. We apply predictive analytics to the data in our repositories to provide our members and enterprise customers actionable intelligence that helps protect against identity theft and identity fraud. As a result of our combination of scale, reach, and technology, we believe that we have the most proactive and comprehensive identity theft protection services available, as well as the most recognized brand in the identity theft protection services industry.
On December 11, 2013, we acquired mobile wallet innovator Lemon for approximately $42.4 million in cash and launched our new LifeLock Wallet mobile application. The LifeLock Wallet mobile application allows consumers to replicate and store a digital copy of their personal wallet contents on their smart device for records backup, as well as transaction monitoring and mobile use of items such as credit, identification, ATM, insurance, and loyalty cards. The LifeLock Wallet mobile application also offers our members one-touch access to our identity theft protection services.
We derive the substantial majority of our revenue from member subscription fees. We also derive revenue from transaction fees from our enterprise customers.
We offer our consumer identity theft protection services on a monthly or annual subscription basis. As of December 31, 2013, approximately 60% of our members subscribed to our consumer services on an annual basis. We currently offer our consumer services under our basic LifeLock, LifeLock Command Center, LifeLock Junior, and premium LifeLock Ultimate services. Our average revenue per member is lower than our retail list prices due to wholesale or bulk pricing that we offer to strategic partners in our embedded product, employee benefits, and breach distribution channels to drive our membership growth. In our embedded product channel, our strategic partners embed our consumer services into their products and services and pay us on behalf of their customers; in our employee benefit channel, our strategic partners offer our consumer services as a voluntary benefit as part of their employee benefit enrollment process; and in our breach channel, enterprises that have experienced a data breach pay us a fee to provide our services to the victims of the data breach. We also offer special discounts and promotions from time to time to incentivize prospective members to enroll in one of our consumer services. Our members pay us the full subscription fee at the beginning of each subscription period, in most cases by authorizing us to directly charge their credit or debit cards. We initially record the subscription fee as deferred revenue and then recognize it ratably on a daily basis over the subscription period. The prepaid subscription fees enhance our visibility of revenue and allow us to collect cash prior to paying our fulfillment partners.
40
Our enterprise customers pay us based on their monthly volume of transactions with us, with approximately 40% of them committed to monthly transaction minimums. We recognize revenue at the end of each month based on transaction volume for that month and bill our enterprise customers at the conclusion of each month.
We have historically invested significantly in new member acquisition and expect to continue to do so for the foreseeable future. Our largest operating expense is advertising for member acquisition, which we record as a sales and marketing expense. This is comprised of radio, television, and print advertisements; direct mail campaigns; online display advertising; paid search and search-engine optimization; third-party endorsements; and education programs. In 2013, 2012, and 2011, our total advertising expense was $86.2 million, $66.0 million, and $54.6 million, respectively. We also pay internal and external sale commissions, which we record as a sales and marketing expense. In general, increases in revenue and cumulative ending members occur during and after periods of significant and effective direct retail marketing efforts.
Our revenue grew from $276.4 million in 2012 to $369.7 million in 2012, an increase of 34%, including year-over-year growth within our consumer segment of 34%. We generated income from operations of $17.2 million and net income of $54.5 million (restated) in 2013. Our net income in 2013 includes an income tax benefit of $37.6 million (restated) recognized as a result of the release of substantially all of the valuation allowance on our deferred tax assets.
Our Business Model
Following our acquisition of ID Analytics in the first quarter of 2012, we began operating our business and reviewing and assessing our operating performance using two reportable segments: our consumer segment and our enterprise segment. We review and assess our operating performance using segment revenue, income (loss) from operations, and total assets. These performance measures include the allocation of operating expenses to our reportable segments based on management’s specific identification of costs associated to those segments.
Consumer Services
We evaluate the lifetime value of a member relationship over its anticipated lifecycle. While we generally incur member acquisition costs in advance of or at the time of the acquisition of the member, we recognize revenue ratably over the subscription period. As a result, a member relationship is not profitable at the beginning of the subscription period even though it is likely to have value to us over the lifetime of the member relationship.
When a member’s subscription automatically renews in each successive period, the relative value of that member increases because we do not incur significant incremental acquisition costs. We also benefit from decreasing fulfillment and member support costs related to that member, as well as economies of scale in our capital and operating and other support expenditures.
Enterprise Services
In our enterprise business, the majority of our costs relate to personnel primarily responsible for data analytics, data management, software development, sales and operations, and various support functions. We incur minimal third-party data expenses, as our enterprise customers typically provide us with their customer transaction data as part of our service. New customer acquisition is often a lengthy process requiring significant investment in the sales team, including costs related to detailed retrospective data analysis to demonstrate the return on investment to prospective customers had our services been deployed over a specific period of time. Since most of the expenses in our enterprise business are fixed in nature, as we add new enterprise customers, there are typically modest incremental costs resulting in additional economies of scale.
Key Metrics
We regularly review a number of operating and financial metrics to evaluate our business, determine the allocation of our resources, measure the effectiveness of our sales and marketing efforts, make corporate strategy decisions, and assess operational efficiencies.
41
Key Operating Metrics
The following table summarizes our key operating metrics for the years ended December 31, 2013, 2012, and 2011:
|
|
|
Year Ended December 31, |
|
|
|||||||||
|
|
|
2013 |
|
|
2012 |
|
|
2011 |
|
|
|||
|
|
|
(in thousands, except percentages and per member data) |
|
|
|||||||||
|
|
|
(Unaudited) |
|
|
|||||||||
|
|
|
|
|
|
|
|
|
|
|
|
|
|
|
|
Cumulative ending members |
|
|
2,999 |
|
|
|
2,480 |
|
|
|
2,075 |
|
|
|
Gross new members |
|
|
944 |
|
|
|
762 |
|
|
|
704 |
|
|
|
Member retention rate |
|
|
87.8 |
% |
|
|
87.1 |
% |
|
|
82.7 |
% |
|
|
Average cost of acquisition per member (restated as to 2013) |
|
$ |
160 |
|
|
$ |
150 |
|
|
$ |
130 |
|
|
|
Monthly average revenue per member |
|
$ |
10.32 |
|
|
$ |
9.28 |
|
|
$ |
8.54 |
|
|
|
Enterprise transactions |
|
|
216,729 |
|
|
|
227,039 |
|
|
|
184,012 |
|
|
Cumulative ending members. We calculate cumulative ending members as the total number of members at the end of the relevant period. Most of our members are paying subscribers who have enrolled in our consumer services directly with us on a monthly or annual basis. A small percentage of our members receive our consumer services through third-party enterprises that pay us directly, often as a result of a breach within the enterprise or by embedding our service within a broader third- party offering. We monitor cumulative ending members because it provides an indication of the revenue and expenses that we expect to recognize in the future.
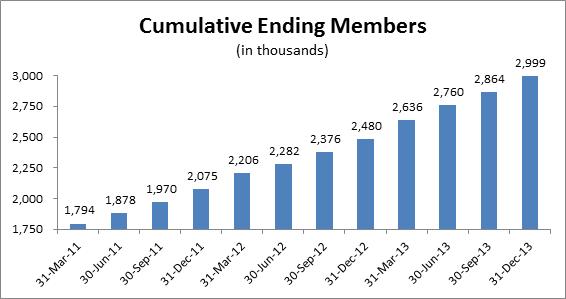
As of December 31, 2013, we had approximately 3.0 million cumulative ending members, an increase of 21% from December 31, 2012. This increase was driven by several factors, including the success of our marketing campaigns, increased awareness of data breaches, media coverage of identity theft, and our continued retention improvements.
Gross new members. We calculate gross new members as the total number of new members who enroll in one of our consumer services during the relevant period. Many factors may affect the volume of gross new members in each period, including the effectiveness of our marketing campaigns, the timing of our marketing programs, the effectiveness of our strategic partnerships, and the general level of identity theft coverage in the media. We monitor gross new members because it provides an indication of the revenue and expenses that we expect to recognize in the future. For the year ended December 31, 2013, we enrolled approximately 944,000 gross new members, up from approximately 762,000 for the year ended December 31, 2012. This increase was driven by the success of our marketing campaigns, the continued success of our LifeLock Ultimate service, which accounted for more than 40% our gross new members during the year ended December 31, 2013, and increased awareness of data breaches and identity theft.
Member retention rate. We define member retention rate as the percentage of members on the last day of the prior year who remain members on the last day of the current year, or for quarterly presentations, the percentage of members on the last day of the comparable quarterly period in the prior year who remain members on the last day of the current quarterly period. A number of factors may increase our member retention rate, including increases in the number of members enrolled on an annual subscription, increases in the number of alerts a member receives, increases in the number of members enrolled in our premium services, and increases in the
42
number of members enrolled through strategic partners with which the member has a strong association. Conversely, factors reducing our member retention rate may include increases in the number of members enrolled on a monthly subscription, increases in the number of members enrolled in our basic LifeLock service, and the end of programs in our embedded product and breach channels. We monitor our member retention rate because it provides a measure of member satisfaction and the revenue that we expect to recognize in the future.
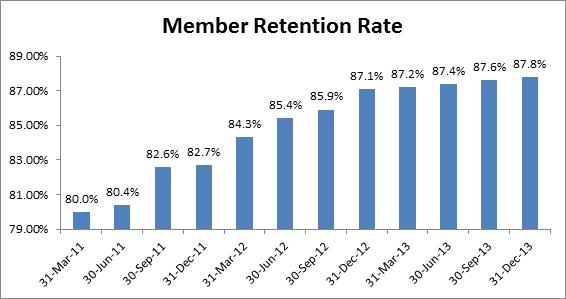
As of December 31, 2013, our member retention rate was 87.8%, an increase of 0.7% points from December 31, 2012. This continued improvement was due to a variety of factors, including consumer awareness and media coverage of identity theft, and our focus on customer service and operational efficiencies.
Average cost of acquisition per member. We calculate average cost of acquisition per member as our sales and marketing expense for our consumer segment during the relevant period divided by our gross new members for the period. A number of factors may influence this metric, including shifts in the mix of our media spend. For example, when we engage in marketing efforts to build our brand, our cost of acquisition per member increases in the short term with the expectation that it will decrease over the long term. In addition, when we introduce new partnerships in our embedded product channel, such as our partnership with AOL in the fourth quarter of 2011, our average cost of acquisition per member decreases due to the volume of members that enroll in our consumer services in a relatively short period of time. We monitor average cost of acquisition per member to evaluate the efficiency of our marketing programs in acquiring new members. For the year ended December 31, 2013, our average cost of acquisition per member was $160, up from $150 for the year ended December 31, 2012. Although our average cost of acquisition per member increased period-over-period, the continued improvements in our member retention rate and the increasing monthly average revenue per member, primarily from the continued penetration of our LifeLock Ultimate service, results in a higher lifetime value of a member relationship which enables us to absorb a higher average cost of acquisition per member.
Monthly average revenue per member. We calculate monthly average revenue per member as our consumer revenue during the relevant period divided by the average number of cumulative ending members during the relevant period (determined by taking the average of the cumulative ending members at the beginning of the relevant period and the cumulative ending members at the end of each month in the relevant period), divided by the number of months in the relevant period. A number of factors may influence this metric, including whether a member enrolls in one of our premium services; whether we offer the member any promotional discounts upon enrollment; the distribution channel through which we acquire the member, as we offer wholesale pricing in our embedded product, employee benefit, and breach channels; and whether a new member subscribes on a monthly or annual basis, as members enrolling on an annual subscription receive a discount for paying for a year in advance. While our retail list prices have historically remained unchanged, our average revenue per member increased by approximately 11% in 2013. This growth was primarily driven by increased adoption of our higher priced premium services by a greater percentage of our members, a trend we expect will continue. We monitor monthly average revenue per member because it is a strong indicator of revenue in our consumer business and of the performance of our premium services. The increase in our monthly average revenue per member resulted primarily from the continued success of our LifeLock Ultimate service, which accounted for more than 40% of our gross new members in 2013.
43
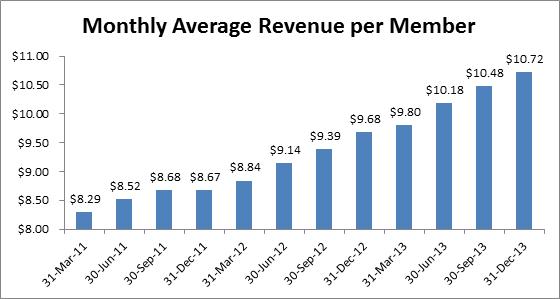
Our monthly average revenue per member for the year ended December 31, 2013 was $10.32, an increase of 11% from the year ended December 31, 2012.
Enterprise transactions. We calculate enterprise transactions as the total number of enterprise transactions processed for either an identity risk or credit risk score during the relevant period. Our enterprise transactions are processed by ID Analytics, which we acquired on March 14, 2012. Accordingly, the enterprise transactions data includes transactions processed by ID Analytics before the acquisition. Enterprise transactions have historically been higher in the fourth quarter as the level of credit applications and general consumer spending increases. We monitor the volume of enterprise transactions because it is a strong indicator of revenue in our enterprise business.
We processed 216.7 million enterprise transactions for the year ended December 31, 2013, a decrease of 5% from the year ended December 31, 2012. The decrease was primarily driven by a large telecommunications customer who had previously obtained scores for all their incoming subscribers through all channels such as wireless, landline, and bundled internet services. After process and technical modifications were made, the customer made the decision to stop obtaining scores for in-home service customers due to the fraud risk associated with these segments being lower than the wireless segment. Going forward, this customer will now only be obtaining scores for customers coming in from the mobile portion of their business where the fraud risk is much higher. Due to the low per transaction price for this customer, this change had an immaterial impact to our enterprise revenue for the year. We do not expect to experience a similar decrease with other existing telecommunication customers. In addition, we have seen a reduction in enterprise transactions as we gave notice of non-renewal to several customers in our consumer segment and we have allowed such contracts to lapse as a result. We expect the transaction volume for these customers to decrease as these enterprise customers churn over time. We do not expect this to have a material impact on our total revenue.
Key Financial Metrics
The following table summarizes our key financial metrics for the years ended December 31, 2013, 2012, and 2011:
|
|
|
Year Ended December 31, |
|
|||||||||
|
|
|
2013 |
|
|
2012 |
|
|
2011 |
|
|||
|
|
|
(in thousands) |
|
|||||||||
|
|
|
|
|
|
|
|
|
|
|
|
|
|
|
Consumer revenue |
|
$ |
340,121 |
|
|
$ |
254,678 |
|
|
$ |
193,949 |
|
|
Enterprise revenue |
|
|
29,537 |
|
|
|
21,750 |
|
|
|
- |
|
|
Total revenue |
|
|
369,658 |
|
|
|
276,428 |
|
|
|
193,949 |
|
|
Adjusted net income |
|
|
36,931 |
|
|
|
22,720 |
|
|
|
8,326 |
|
|
Adjusted EBITDA |
|
|
42,156 |
|
|
|
30,996 |
|
|
|
12,508 |
|
|
Free cash flow |
|
|
66,956 |
|
|
|
40,925 |
|
|
|
22,313 |
|
Adjusted net income, adjusted EBITDA, and free cash flow are non-GAAP financial measures that we believe provide useful information to investors and others in understanding our operating results in the same manner as we do. For a full description of how these non-GAAP financial measures are calculated and reconciliations to the most comparable GAAP measure, refer to Item 6 – Selected Financial Data of this Form 10-K/A.
44
Factors Affecting Our Performance
Customer acquisition costs. We expect to continue to make significant expenditures to grow our member and enterprise customer bases. Our average cost of acquisition per member and the number of new members we generate depends on a number of factors, including the effectiveness of our marketing campaigns, changes in cost of media, the competitive environment in our markets, the prevalence of identity theft issues in the media, publicity about our company, and the level of differentiation of our services. Shifts in the mix of our media spend also influence our member acquisition costs. For example, when we engage in marketing efforts to build our brand, our member acquisition costs increase in the short term with the expectation that they will decrease over the long term. We also continually test new media outlets, marketing campaigns, and call center scripting, each of which impacts our average cost of acquisition per member. In addition, given the success of our LifeLock Ultimate service since its launch in the fourth quarter of 2011, we expect to be able to absorb a higher average cost of acquisition per member and still recognize value over the lifetime of our member relationships.
Mix of members by services, billing cycle, and distribution channel. Our performance is affected by the mix of members subscribing to our various consumer services, by billing cycle (annual versus monthly), and by the distribution channel through which we acquire the member. Our adjusted EBITDA, adjusted net income (loss), free cash flow, and average cost of acquisition per member are all affected by this mix. We have seen a recent shift to more monthly members, in large part due to the increase in the number of members enrolling through our embedded product channel in which our members enroll on a monthly basis. We also have seen an increase in the number of LifeLock Ultimate members as a percentage of our gross new members.
Customer retention. We have continued to improve the retention of our members and, as a result, the anticipated lifetime value of our members. Our member retention rate improved to 87.8% in 2013 from 87.1% in 2012. Our ability to continue to improve our member retention rate may be affected by a number of factors, including the effectiveness of our services, the performance of our member services organization, external media coverage of identity theft, the continued evolution of our service offerings, the competitive environment, the effectiveness of our media spend, and other developments.
Our enterprise business relies on the retention of enterprise customers to maintain the effectiveness of our services because our enterprise customers typically provide us with their customer transaction data as part of our service. Losing a significant number of these customers would reduce the breadth and effectiveness of our services. In addition, we believe approximately 15% of the 2013 revenue of ID Analytics, or approximately 1% of our overall 2013 revenue, was derived from direct competitors to our consumer business. As we have given notice of non-renewal to competitors in our consumer segment, we have allowed such contracts to lapse, and accordingly, this percentage may decline over time.
Investments to grow our business. We will continue to invest to grow our business. Investments in the development and marketing of new services and the continued enhancement of our existing services will increase our operating expenses in the near term and thus may negatively impact our operating results in the short term, although we anticipate that these investments will grow and improve our business over the long term.
Regulatory developments. Our business is subject to regulation by federal, state, local, and foreign authorities. Any changes to the existing applicable laws, regulations, or rules; any determination that other laws, regulations, or rules are applicable to us; or any determination that we have violated any of these laws, regulations, or rules could adversely impact our operating results. We recently began collecting and remitting sales tax in several states related to the sale of our consumer services. Additional states or one or more countries or other jurisdictions may seek to impose sales or other tax collection obligations on us in the future. A successful assertion by any state, country, or other jurisdiction that we should be collecting sales or other taxes on the sale of our services could, among other things, increase the cost of our services, create significant administrative burdens for us, result in substantial tax liabilities for past sales, discourage current members and other consumers from purchasing our services, or otherwise substantially harm our business and operating results.
For a discussion of additional factors and risks facing our business, see “Risk Factors.”
Basis of Presentation and Key Components of Our Results of Operations
Following our acquisition of ID Analytics on March 14, 2012, we began operating our business and reviewing and assessing our operating performance using two reportable segments: our consumer segment and our enterprise segment. We review and assess our operating performance using segment revenue, income (loss) from operations, and total assets. These performance measures include the allocation of operating expenses to our reportable segments based on management’s specific identification of costs associated to those segments.
Revenue
We derive revenue in our consumer segment primarily from fees paid by our members for identity theft protection services offered on a subscription basis. Our members subscribe to our consumer services on a monthly or annual, automatically renewing basis and pay us the full subscription fee at the beginning of each subscription period, in most cases by authorizing us to directly charge their credit or debit cards. In some cases, we offer members a free trial period, which is typically 30 days. Our members may cancel their membership with us at any time without penalty and, when they do, we issue a refund for the unused portion of the
45
canceled membership. We recognize revenue for member subscriptions ratably on a daily basis from the latter of cash receipt, activation of a member’s account, or expiration of free trial periods to the end of the subscription period.
We also provide consumer services for which the primary customer is an enterprise purchasing identity theft protection services on behalf of its employees or customers. In such cases, we defer revenue for each member until the member’s account has been activated. We then recognize revenue ratably on a daily basis over the term of the subscription period.
We derive revenue in our enterprise segment from fees paid by our enterprise customers for fraud and risk solutions, which we provide under multi-year contracts, many of which renew automatically. Our enterprise customers pay us based on their monthly volume of transactions with us, and approximately 40% of them are committed to paying monthly minimum fees. We recognize revenue based on a negotiated fee per transaction. Transaction fees in excess of any of the monthly minimum fees are billed and recorded as revenue in addition to the monthly minimum fees. In some instances, we receive up-front non-refundable payments against which the monthly minimum fees are applied. The up-front non-refundable payments are recorded as deferred revenue and recognized as revenue monthly over the usage period. If an enterprise customer does not meet its monthly minimum fee, we bill the negotiated monthly minimum fee and recognize revenue for that amount. We derive a small portion of our enterprise revenue from special projects in which we are engaged to deliver a report at the end of the analysis, which we record upon delivery and acceptance of the report.
Cost of Services
Cost of services in our consumer segment consists primarily of costs associated with our member services organization and fulfillment partners. Our member support operations include wages and benefits for personnel performing these functions and facility costs directly associated with our sales and service delivery functions. We also pay fees to third-party service providers related to the fulfillment of our consumer services, including the premiums associated with the identity theft insurance that we provide to our members, and merchant credit card fees.
Cost of services in our enterprise segment includes the costs related to data analytics and data management, primarily consisting of wages and benefits of personnel and facility costs directly associated with the data analytics and data management.
We expect our cost of services to increase if we continue to increase the number of our members and enterprise customers. Our cost of services is heavily affected by prevailing salary levels, which affect our internal direct costs and fees paid to third-party service providers. Increases in the market rate for wages would increase our cost of services.
Gross Margin
Gross profit as a percentage of total revenue, or gross margin, has been and will continue to be affected by a variety of factors. Increases in personnel and facility costs directly associated with the provision of our services can negatively affect our gross margin, as can higher fulfillment costs due to enhancements in our services or the introduction of new services, such as the addition of insurance coverage in our consumer services. A significant increase in the number of members we enroll through our strategic partner distribution channels can also negatively affect our gross margin because we offer wholesale pricing to our strategic partners. In prior periods, our gross margin has also been negatively impacted by sales taxes we paid on behalf of our members and settlements with state tax authorities. Conversely, operating efficiencies in our member services organization can improve our gross margin. We expect that our gross margin may fluctuate from period to period depending on all of these factors.
Sales and Marketing
Sales and marketing expenses consist primarily of direct response advertising and online search costs, commissions paid on a per-member basis to our online affiliates and on a percentage of revenue basis to our co-marketing partners, and wages and benefits for sales and marketing personnel. Direct response marketing costs include television, radio, and print advertisements as well as costs to create and produce these advertisements. Online search costs consist primarily of pay-per-click payments to search engines and other online advertising media, such as banner ads. Advertising costs are expensed as incurred and historically have occurred unevenly across periods. Our sales and marketing expenses also include payments related to our sponsorship, and promotional. In order to continue to grow our business and the awareness of our services, we plan to continue to commit substantial resources to our sales and marketing efforts. As a result, we expect our sales and marketing expenses will continue to increase in absolute dollars for the foreseeable future and vary as a percentage of revenue depending on the timing of those expenses.
Technology and Development
Technology and development expenses consist primarily of personnel costs incurred in product development, maintenance and testing of our websites, enhancing our existing services and developing new services, internal information systems and infrastructure, data privacy and security systems, third-party development, and other internal-use software systems. Our development costs are primarily incurred in the United States and directed at enhancing our existing service offerings and developing new service offerings. In order to continue to grow our business and enhance our services, we plan to continue to commit resources to technology and development. In addition, ID Analytics has historically spent a higher portion of its revenue on technology and development. As a result, we expect our technology and development expenses will continue to increase in absolute dollars for the foreseeable future.
46
General and Administrative
General and administrative expenses consist primarily of personnel costs, professional fees, and facility-related expenses associated with our executive, finance, human resources, legal, and governmental affairs organizations. Our professional fees principally consist of outside legal, auditing, accounting, and other consulting fees. Legal costs included within our general and administrative expenses also include costs incurred to litigate and settle various legal matters. We expect our general and administrative expenses will increase in absolute dollars for the foreseeable future as we hire additional personnel to support our overall growth and incur additional costs associated with operating as a public company, including costs associated with SEC reporting and Sarbanes-Oxley Act compliance.
Amortization of Acquired Intangible Assets
Amortization of acquired intangible assets is the amortization expense associated with core technology, customer relationships, and trade names and trademarks resulting from business acquisitions. As of December 31, 2013, we had $47.2 million in intangible assets, net of amortization, as a result of our acquisitions of ID Analytics and Lemon. The intangible assets have useful lives of between one and ten years and we expect to recognize approximately $8.9 million of amortization expense in the year ending December 31, 2014.
Other Income (Expense)
Other income (expense) consists primarily of interest income on our cash and cash equivalents and marketable securities, interest expense on our indebtedness and unused credit facility, changes in the fair value of our warrant liabilities, and changes in the fair value of our embedded derivative. Gains and losses on our warrant liabilities result from the re-measurement of the fair value of warrants to purchase our convertible redeemable preferred stock, which we account for as liabilities. Upon the completion of our IPO in October 2012, the warrants to purchase our convertible redeemable preferred stock were converted to warrants to purchase common stock and, at that time, were reclassified to equity. Accordingly, we are no longer required to re-measure the fair value of our warrants.
We recorded a liability of $7.9 million for an embedded derivative associated with our Series E-1 convertible redeemable preferred stock issued in connection with our acquisition of ID Analytics in March 2012. The embedded derivative liability was adjusted to fair value at each reporting period with any unrealized gain or loss recorded in other income (expense). Based on our anticipated IPO price of $9.00 per share, we increased the liability associated with our embedded derivative to $10.7 million with a corresponding charge of $2.8 million recognized through other income (expense). On October 16, 2012, we paid to the former holders of our Series E-1 convertible redeemable preferred stock $10.7 million in cash as settlement for the embedded derivative and expect no additional income or expense related to the embedded derivative.
Provision for Income Taxes
We are subject to federal income tax as well as state income tax in various states in which we conduct business. Our effective tax rate differed from the statutory rate for the year ended December 31, 2013 primarily as a result of the release of substantially all of our valuation allowance on our deferred tax assets. For the years ended December 31, 2012 and 2011, our effective tax rate differed from the statutory rate primarily as a result of our valuation allowance on our deferred taxes, state taxes, and non-deductible expenses.
For periods subsequent to the date on which we fully reverse our deferred tax asset valuation allowance, we expect our effective tax rate will approximate the U.S. federal statutory tax rate plus the impact of state taxes and the impact of permanent and other temporary differences. As of December 31, 2013, we had U.S. federal and state net operating losses of approximately $199.4 million and $138.0 million (restated), respectively, which will continue to reduce the amount of cash taxes to be paid.
In consideration of all available positive and negative evidence, including our historical operating results, current financial condition, and potential future taxable income, we released substantially all of our valuation allowance on deferred tax assets in the fourth quarter of 2013. As a result, we recorded an income tax benefit of $37.5 million (restated) for the year ended December 31, 2013 compared with income tax benefit of $13.7 million for the year ended December 31, 2012. At December 31, 2013, we retained a valuation allowance related to certain state net operating losses that are expected to expire in 2014 and 2015.
As a result of the acquisition of ID Analytics in the year ended December 31, 2012, we recorded a deferred tax liability related to the book and tax basis difference resulting from our purchase accounting. The recognition of this deferred tax liability offset $8.5 million of the acquired gross deferred tax assets. A valuation allowance was established in the purchase price allocation for the remaining $1.0 million of acquired gross deferred tax assets. This resulted in the recognition of a net deferred tax liability that has been recognized in our purchase price allocation. As a result of the recognition of this net deferred tax liability, we concluded that the deferred tax assets we had recognized prior to the acquisition for which we had previously recorded a valuation allowance were more likely than not of being realized. Accordingly, we reduced our valuation allowance for these deferred tax assets, which is recorded as an income tax benefit of $14.2 million in our consolidated statements of operations for the year ended December 31, 2012.
47
Results of Operations
Comparison of the Years Ended December 31, 2013, 2012, and 2011
Total Revenue
|
|
Year Ended December 31, |
|
|
2012 to 2013 |
|
|
2011 to 2012 |
|
|||||||||||
|
|
2013 |
|
|
2012 |
|
|
2011 |
|
|
% Change |
|
|
% Change |
|
|||||
|
|
(in thousands) |
|
|
|
|
|
|
|
|
|
|||||||||
|
Consumer revenue |
$ |
340,121 |
|
|
$ |
254,678 |
|
|
$ |
193,949 |
|
|
|
33.5 |
% |
|
|
31.3 |
% |
|
Enterprise revenue |
|
29,537 |
|
|
|
21,750 |
|
|
|
- |
|
|
|
35.8 |
% |
|
NM |
|
|
|
Total revenue |
|
$369,658 |
|
|
|
$276,428 |
|
|
|
$193,949 |
|
|
|
|
|
|
|
|
|
Consumer revenue for the year ended December 31, 2013 was $340.1 million, an increase of $85.4 million, or 33.5%, over consumer revenue for the year ended December 31, 2012. The increase in our consumer revenue from 2012 to 2013 related primarily to an increase in the number of our members, which grew from approximately 2.5 million as of December 31, 2012 to approximately 3.0 million as of December 31, 2013, an increase of 21%. In addition, our monthly average revenue per member increased 11% to $10.32 for the year ended December 31, 2013 from $9.28 for the year ended December 31, 2012. The increase in members and monthly average revenue per member resulted from the continued success of our LifeLock Ultimate service offering and our advertising and marketing campaigns designed to increase the overall awareness of our services and identity theft.
Revenue from our consumer segment for the year ended December 31, 2012 was $254.7 million, an increase of $60.7 million, or 31.3%, over revenue of $193.9 million for the year ended December 31, 2011. The increase in our consumer revenue from 2011 to 2012 related primarily to an increase in the number of our members, which grew from 2.1 million as of December 31, 2011 to approximately 2.5 million as of December 31, 2012, an increase of 20%. In addition, our monthly average revenue per member increased 9% to $9.28 for the year ended December 31, 2012 from $8.54 for the year ended December 31, 2011. The increase in members and monthly average revenue per member resulted from the introduction of our LifeLock Ultimate service offering and our advertising and marketing campaigns designed to increase the overall awareness of our services and identity theft.
Enterprise revenue for the year ended December 31, 2013 was $29.5 million, an increase of $7.8 million, or 35.8%, over enterprise revenue for the year ended December 31, 2012. Enterprise revenue increased in 2013 compared to 2012 even though enterprise transactions decreased. The enterprise revenue increased as the lower revenue per transaction volume from a large telecommunication customer was replaced by higher revenue per transactions from other enterprise customers. In addition, we acquired ID Analytics on March 14, 2012 and, accordingly, our enterprise revenue for the year ended December 31, 2012 only includes the revenue contributed by ID Analytics since that date.
Cost of Services and Gross Profit
|
|
Year Ended December 31, |
|
|
2012 to 2013 |
|
|
2011 to 2012 |
|
|||||||||||
|
|
2013 (Restated) |
|
|
2012 |
|
|
2011 |
|
|
% Change (Restated) |
|
|
% Change |
|
|||||
|
|
(in thousands) |
|
|
|
|
|
|
|
|
|
|||||||||
|
Cost of services |
$ |
100,065 |
|
|
$ |
79,916 |
|
|
$ |
62,630 |
|
|
|
25.2 |
% |
|
|
27.6 |
% |
|
Percentage of revenue |
|
27.1 |
% |
|
|
28.9 |
% |
|
|
32.3 |
% |
|
|
|
|
|
|
|
|
|
|
|
|
|
|
|
|
|
|
|
|
|
|
|
|
|
|
|
|
|
|
Gross profit |
|
269,593 |
|
|
|
196,512 |
|
|
|
131,319 |
|
|
|
37.2 |
% |
|
|
49.6 |
% |
|
Percentage of revenue |
|
72.9 |
% |
|
|
71.1 |
% |
|
|
67.7 |
% |
|
|
|
|
|
|
|
|
Gross profit for the year ended December 31, 2013 was $269.6 million, or 72.9% of revenue, an increase of $73.1 million, or 37.2%, over gross profit of $196.5 million, or 71.1% of revenue, for the year ended December 31, 2012. The increase in our gross profit from 2012 to 2013 resulted primarily from increased revenue associated with the growth in the number of our members and increased monthly average revenue per member. The increase in our gross margin resulted primarily from efficiencies in our member services organization and scalability within certain third party fulfillment contracts as our member base continued to grow.
Gross profit for the year ended December 31, 2012 was $196.5 million, or 71.1% of revenue, an increase of $65.2 million, or 49.6%, over gross profit of $131.3 million, or 67.7% of revenue, for the year ended December 31, 2011. The increase in our gross profit from 2011 to 2012 resulted primarily from increased revenue associated with the growth in the number of our members and increased monthly average revenue per member. The increase in our gross margin percentage resulted primarily from efficiencies in our member services organization, partially offset by higher fulfillment expenses due to enhancements to our service offerings. Gross profit also increased for the year ended December 31, 2012 due to our acquisition of ID Analytics on March 14, 2012, which added revenue from the enterprise segment at a higher gross margin percentage than from our traditional consumer segment.
48
Sales and Marketing
|
|
Year Ended December 31, |
|
|
2012 to 2013 |
|
|
2011 to 2012 |
|
|||||||||||
|
|
2013 (Restated) |
|
|
2012 |
|
|
2011 |
|
|
% Change (Restated) |
|
|
% Change |
|
|||||
|
|
(in thousands) |
|
|
|
|
|
|
|
|
|
|||||||||
|
Sales and marketing |
$ |
162,363 |
|
|
$ |
122,989 |
|
|
$ |
91,217 |
|
|
|
32.0 |
% |
|
|
34.8 |
% |
|
Percentage of revenue |
|
43.9 |
% |
|
|
44.5 |
% |
|
|
47.0 |
% |
|
|
|
|
|
|
|
|
Sales and marketing expenses for the year ended December 31, 2013 were $162.4 million, or 43.9% of revenue, compared with $123.0 million, or 44.5% of revenue, for the year ended December 31, 2012. The increase in our sales and marketing expenses from 2012 to 2013 resulted from increases in our advertising expenses, external sales commissions, and sales and marketing expenses from ID Analytics, primarily consisting of personnel costs, since our March 2012 acquisition. The increase in our sales and marketing expenses reflected our investment to drive new membership growth, our continued advertising of our LifeLock Ultimate service, and our efforts to highlight the growing identity theft issue and to educate consumers.
Sales and marketing expenses for the year ended December 31, 2012 were $123.0 million, or 44.5% of revenue, compared with $91.2 million, or 47.0% of revenue, for the year ended December 31, 2011. The increase in our sales and marketing expenses from 2011 to 2012 resulted from increases in our advertising expenses, external sales commissions, and sales and marketing expenses from ID Analytics, primarily consisting of personnel costs, since our March 2012 acquisition. The increase in our sales and marketing expenses reflected our investment to drive new membership growth as well as additional advertising to market our LifeLock Ultimate service, which was released in the fourth quarter of 2011.
Technology and Development
|
|
Year Ended December 31, |
|
|
2012 to 2013 |
|
|
2011 to 2012 |
|
|||||||||||
|
|
2013 (Restated) |
|
|
2012 |
|
|
2011 |
|
|
% Change (Restated) |
|
|
% Change |
|
|||||
|
|
(in thousands) |
|
|
|
|
|
|
|
|
|
|||||||||
|
Technology and development |
$ |
40,015 |
|
|
$ |
29,543 |
|
|
$ |
17,749 |
|
|
|
35.4 |
% |
|
|
66.4 |
% |
|
Percentage of revenue |
|
10.8 |
% |
|
|
10.7 |
% |
|
|
9.2 |
% |
|
|
|
|
|
|
|
|
Technology and development expenses for the year ended December 31, 2013 were $40.0 million, or 10.8% of revenue, compared with $29.5 million, or 10.7% of revenue, for the year ended December 31, 2012. The increase in our technology and development expenses from 2012 to 2013 resulted primarily from increases in our personnel costs, as we continued to expand and enhance our workforce. In addition, technology and development expenses increased due to the inclusion of ID Analytics’ technology and development expense since our March 2012 acquisition. ID Analytics’ technology expenses consist primarily of the personnel and other costs incurred in research and development.
Technology and development expenses for the year ended December 31, 2012 were $29.5 million, or 10.7% of revenue, compared with $17.7 million, or 9.2% of revenue, for the year ended December 31, 2011. The increase in our technology and development expenses from 2011 to 2012 resulted primarily from increases in our personnel costs, as we continued to expand and enhance our workforce. In addition, technology and development expenses increased due to the inclusion of ID Analytics’ technology and development expense since our March 2012 acquisition. ID Analytics’ technology expenses consist primarily of the personnel and other costs incurred in research and development.
General and Administrative
|
|
Year Ended December 31, |
|
|
2012 to 2013 |
|
|
2011 to 2012 |
|
|||||||||||
|
|
2013 (Restated) |
|
|
2012 |
|
|
2011 |
|
|
% Change (Restated) |
|
|
% Change |
|
|||||
|
|
(in thousands) |
|
|
|
|
|
|
|
|
|
|||||||||
|
General and administrative |
$ |
42,125 |
|
|
$ |
24,629 |
|
|
$ |
17,510 |
|
|
|
71.0 |
% |
|
|
40.7 |
% |
|
Percentage of revenue |
|
11.4 |
% |
|
|
8.9 |
% |
|
|
9.0 |
% |
|
|
|
|
|
|
|
|
General and administrative expenses for the year ended December 31, 2013 were $42.1 million, or 11.4% of revenue, compared with $24.6 million, or 8.9% of revenue, for the year ended December 31, 2012. The increase in general and administrative expenses from 2012 to 2013 resulted primarily from additional costs associated with our public company compliance, additional personnel costs, primarily non-cash share-based compensation, and increased general and administrative expenses from ID Analytics. In addition, for the year ended December 31, 2012, we received two favorable legal settlements of $3.6 million related to insurance claims for legal costs that we incurred in 2008 and 2009.
49
General and administrative expenses for the year ended December 31, 2012 were $24.6 million, or 8.9% of revenue, compared with $17.5 million, or 9.0% of revenue, for the year ended December 31, 2011. The increase in general and administrative expenses from 2011 to 2012 resulted primarily from increased personnel costs, the general and administrative expenses of ID Analytics and related acquisition costs, and additional costs associated with the implementation of our public company compliance. These increases were partially offset by two favorable legal settlements for a total of $3.6 million related to insurance claims for legal costs that we incurred in 2008 and 2009.
Amortization of Acquired Intangible Assets
|
|
Year Ended December 31, |
|
|
2012 to 2013 |
|
|
2011 to 2012 |
||||||||||
|
|
2013 |
|
|
2012 |
|
|
2011 |
|
|
% Change |
|
|
% Change |
||||
|
|
(in thousands) |
|
|
|
|
|
|
|
|||||||||
|
Amortization of acquired intangible assets |
$ |
7,909 |
|
|
$ |
6,258 |
|
|
$ |
- |
|
|
|
26.4 |
% |
|
NM |
|
Percentage of revenue |
|
2.1 |
% |
|
|
2.3 |
% |
|
|
0.0 |
% |
|
|
|
|
|
|
Amortization of acquired intangible assets for the year ended December 31, 2013 was $7.9 million, or 2.1% of revenue, compared with $6.3 million, or 2.3% of revenue, for the year ended December 31, 2012. The increase in amortization of acquired intangible assets is due to having a full year of amortization following the acquisition of ID Analytics in March 2012 and amortization of acquired intangible assets following the acquisition of Lemon in December 2013.
Other Income (Expense)
|
|
Year Ended December 31, |
|
|
2012 to 2013 |
|
|
2011 to 2012 |
|
|||||||||||
|
|
2013 |
|
|
2012 |
|
|
2011 |
|
|
% Change |
|
|
% Change |
|
|||||
|
|
(in thousands) |
|
|
|
|
|
|
|
|
|
|||||||||
|
Interest expense |
$ |
(353 |
) |
|
$ |
(3,677 |
) |
|
$ |
(231 |
) |
|
|
-90.4 |
% |
|
|
1491.8 |
% |
|
Interest income |
|
124 |
|
|
|
30 |
|
|
|
8 |
|
|
|
313.3 |
% |
|
|
275.0 |
% |
|
Change in fair value of warrant liabilities |
|
- |
|
|
|
3,117 |
|
|
|
(8,658 |
) |
|
|
-100.0 |
% |
|
|
-136.0 |
% |
|
Change in fair value of embedded derivative |
|
- |
|
|
|
(2,785 |
) |
|
|
- |
|
|
|
-100.0 |
% |
|
NM |
|
|
|
Other |
|
(21 |
) |
|
|
(5 |
) |
|
|
(5 |
) |
|
|
320.0 |
% |
|
|
0.0 |
% |
|
|
$ |
(250 |
) |
|
$ |
(3,320 |
) |
|
$ |
(8,886 |
) |
|
|
-92.5 |
% |
|
|
-62.6 |
% |
Other expense for the year ended December 31, 2013 was $0.3 million compared with other expense of $3.3 million for the year ended December 31, 2012. The decrease in other expense from 2012 to 2013 resulted primarily from an unrealized gain on warrant liabilities of $3.1 million, partially offset by an unrealized loss on the convertible redeemable preferred stock embedded derivative of $2.8 million recognized in 2012. Additionally, interest expense decreased as we carried no debt during the year ended December 31, 2013.
Other expense for the year ended December 31, 2012 was $3.3 million compared with $8.9 million for the year ended December 31, 2011. The decrease in our other expense from 2011 to 2012 resulted primarily from an unrealized gain on warrant liabilities of $3.1 million, compared to an unrealized loss of $8.7 million in 2011, partially offset by an unrealized loss on the convertible redeemable preferred stock embedded derivative of $2.8 million, an increase in interest expense of $2.0 million related to the term loan used to acquire ID Analytics, and the write off of debt issuance costs of $1.4 million when the term loan was paid off with proceeds from our IPO.
Income Tax (Benefit) Expense
|
|
Year Ended December 31, |
|
|
2012 to 2013 |
|
|
2011 to 2012 |
||||||||||
|
|
2013 (Restated) |
|
|
2012 |
|
|
2011 |
|
|
% Change (Restated) |
|
|
% Change |
||||
|
|
(in thousands) |
|
|
|
|
|
|
|
|||||||||
|
Income tax (benefit) expense |
$ |
(37,524 |
) |
|
$ |
(13,730 |
) |
|
$ |
214 |
|
|
|
173.3 |
% |
|
NM |
|
Effective tax rate |
|
-221.6 |
% |
|
|
-140.5 |
% |
|
|
-5.3 |
% |
|
|
|
|
|
|
50
Income tax benefit for the year ended December 31, 2013 was $37.5 million compared with income tax benefit of $13.7 million for the year ended December 31, 2012. In consideration of all available positive and negative evidence, including our historical operating results, current financial condition, and potential future taxable income, we released substantially all of our valuation allowance on deferred tax assets in the fourth quarter of 2013. As a result, we recorded an income tax benefit of $37.5 million for the year ended December 31, 2013 compared with income tax benefit of $13.7 million for the year ended December 31, 2012.
Income tax benefit for the year ended December 31, 2012 was $13.7 million compared with income tax expense of $0.2 million for the year ended December 31, 2011. As a result of our acquisition of ID Analytics, we recorded a deferred tax liability related to the book and tax basis difference resulting from our purchase accounting. The increase in our deferred tax liability resulted in a reduction of our valuation allowance for net deferred tax assets, which is recorded as an income tax benefit of $14.2 million. This benefit was offset by a $0.5 million income tax expense that related to federal alternative minimum tax expenses and gross receipts and minimum state income taxes, which are due regardless of whether we have taxable income.
Liquidity and Capital Resources
As of December 31, 2013, we had $123.9 million in cash and cash equivalents, which consisted of cash, money market funds, and open commercial paper, and $48.7 million in marketable securities, which consisted of corporate bonds, municipal bonds, and certificates of deposit. We classify our marketable securities as short-term regardless of contractual maturity based on our ability to liquidate such investments for use in current operations. Additionally, we have an $85 million revolving line of credit, although we made no draws on the line of credit during the year ended December 31, 2013. As of December 31, 2013, we had not outstanding debt. We believe that our existing cash and cash equivalents and marketable securities together with cash generated from operations will be sufficient to fund our operations for at least the next 12 months.
Operating Activities
For the year ended December 31, 2013, operating activities generated $77.4 million in cash as a result of net income of $54.5 million (restated), adjusted by non-cash items such as depreciation and amortization of $12.8 million, share-based compensation of $11.1 million (restated), and an income tax benefit of $37.6 million (restated) which resulted from the release of the majority of our valuation allowance on deferred tax assets. In addition, an increase in deferred revenue related to the overall growth of our business provided operating cash of $28.1 million and positive net operating cash flows of $7.9 million from other operating assets and liabilities.
For the year ended December 31, 2012, operating activities generated $48.4 million in cash as a result of net income of $23.5 million, adjusted by non-cash items such as depreciation and amortization of $10.4 million, the write off of $1.4 million in debt issuance costs due to the early repayment of our term loan, share-based compensation of $6.8 million, a deferred income tax benefit of $14.2 million, a gain on warrant liabilities of $3.1 million, and a loss of $2.8 million on the convertible redeemable preferred stock embedded derivative. An increase in deferred revenue related to the overall growth of our business provided operating cash of $20.8 million.
For the year ended December 31, 2011, operating activities generated $24.3 million in cash as a result of a net loss of $4.3 million, adjusted by non-cash items such as depreciation and amortization of $3.7 million, share-based compensation of $3.3 million, and a change in fair value of warrant liabilities of $8.7 million. In addition, deferred revenue increased by $13.4 million as a result of the overall growth of our business, partially offset by changes in other operating assets and liabilities of $0.5 million.
Investing Activities
For the year ended December 31, 2013, we used $42.4 million of cash to acquire Lemon and $10.3 million of cash to acquire property and equipment primarily related to investments in our network infrastructure to support our growth. We also invested a net $49.4 million of cash in marketable securities.
For the year ended December 31, 2012, we used $157.4 million of cash to acquire ID Analytics and $7.5 million of cash to acquire property and equipment, primarily related to the establishment of an additional data center for ID Analytics and other investments in our network infrastructure to support our growth. These were offset by a $1.7 million decrease in restricted cash, resulting from a change in our letters of credit, which are no longer required to be fully funded.
For the year ended December 31, 2011, we used $2.0 million of cash for the purchase of business software, telecommunications equipment, and network and other computer hardware, offset by a decrease in restricted cash of $0.5 million.
Financing Activities
For the year ended December 31, 2013, our financing activities generated net cash of $15.0 million as a result of cash received from the exercise of stock options of $15.4 million offset by cash used of $0.4 million related to the payments of debt issuance costs associated with the refinancing of our credit agreement.
For the year ended December 31, 2012, our financing activities generated net cash of $220.1 million. In March 2012, we raised $102.2 million from the issuance of our Series E and E-2 convertible redeemable preferred stock, $4.4 million from the issuance of warrants to acquire Series E and E-2 convertible redeemable preferred stock, and $68.0 million in a term loan, the proceeds of which
51
were used to acquire ID Analytics. In October 2012, we raised $125.7 million in net proceeds from our IPO. We used a portion of the proceeds generated from our IPO to repay the outstanding balance of our term loan of $62.6 million. In addition, we paid $10.7 million to the former holders of our Series E-1 convertible redeemable preferred stock. We incurred $1.7 million in debt issuance costs primarily related to our term loan and generated $0.3 million in cash inflows from stock option and warrant exercises.
For the year ended December 31, 2011, our financing activities generated net cash used of $11.5 million. During 2011, we repaid the $13.0 million outstanding balance under our line of credit, incurred debt issuance costs of $0.1 million related to the extension and expansion of our line of credit, and used $0.2 million related to payments under a capital lease. These were partially offset by $1.8 million in cash inflows from stock option exercises.
Debt Obligations
Senior Credit Facility
On January 9, 2013, we refinanced our existing credit agreement and entered into a new credit agreement, or the Credit Agreement, with Bank of America, N.A. as administrative agent, swing line lender and L/C issuer, Silicon Valley Bank as syndication agent, Merrill Lynch, Pierce, Fenner & Smith Incorporated as sole lead arranger and sole book manager, and the lenders from time to time party thereto. We refer to the Credit Agreement and related documents as the Senior Credit Facility.
The Senior Credit Facility provides for an $85.0 million revolving line of credit, which we can increase to $110.0 million subject to the conditions set forth in the Credit Agreement. The revolving line of credit also includes a letter of credit subfacility of $10.0 million and a swing line loan subfacility of $5.0 million. The Senior Credit Facility has a maturity date of January 9, 2018. As of December 31, 2013, we had no debt outstanding under our Senior Credit Facility. For the year ended December 31, 2013, we paid an unused commitment fee of $0.3 million, which is included in interest expense in the consolidated statements of operations.
Borrowings under the Senior Credit Facility bear interest at a per annum rate equal to, at our option, either (a) a base rate equal to the highest of (i) the Federal Funds Rate plus 0.50%, (ii) the rate of interest in effect for such day as publicly announced from time to time by Bank of America as its “prime rate,” and (iii) the eurodollar rate for base rate loans plus 1.00%, plus an applicable rate ranging from 0.50% to 1.25%, or (b) the eurodollar rate for eurodollar rate loans plus an applicable rate ranging from 1.50% to 2.25%. The initial applicable rate is 0.50% for base rate loans and 1.50% for eurodollar rate loans, subject to adjustment from time to time based upon our achievement of a specified consolidated leverage ratio.
In addition to paying interest on the outstanding principal under the Senior Credit Facility, we are also required to pay a commitment fee to the administrative agent at a rate per annum equal to the product of (a) an applicable rate ranging from 0.25% to 0.50% multiplied by (b) the actual daily amount by which the aggregate revolving commitments exceed the sum of (1) the outstanding amount of revolving borrowings, and (2) the outstanding amount of letter of credit obligations. The initial applicable rate is 0.25%, subject to adjustment from time to time based upon our achievement of a specified consolidated leverage ratio.
We also will pay a letter of credit fee to the administrative agent for the account of each lender in accordance with its applicable percentage of a letter of credit for each letter of credit, which fee will be equal to the applicable rate then in effect, multiplied by the daily maximum amount available to be drawn under the letter of credit. The initial applicable rate for the letter of credit is 1.50%, subject to adjustment from time to time based upon our achievement of a specified consolidated leverage ratio.
We have the right to prepay our borrowings under the Senior Credit Facility from time to time in whole or in part, without premium or penalty, subject to the procedures set forth in the Senior Credit Facility.
All of our obligations under the Senior Credit Facility are unconditionally and jointly and severally guaranteed by each of our existing and future, direct or indirect, domestic subsidiaries, subject to certain exceptions. In addition, all of our obligations under the Senior Credit Facility, and the guarantees of those obligations, are secured, subject to permitted liens and certain other exceptions, by a first-priority lien on our and our subsidiaries’ tangible and intangible personal property, including a pledge of all of the capital stock of our subsidiaries.
The Senior Credit Facility requires us to maintain certain financial covenants. In addition, the Senior Credit Facility requires us to maintain all material proprietary databases and software with a third-party escrow agent in accordance with an escrow agreement that we reaffirmed in connection with the Senior Credit Facility. The Senior Credit Facility also contains certain affirmative and negative covenants limiting, among other things, additional liens and indebtedness, investments and distributions, mergers and acquisitions, liquidations, dissolutions, sales of assets, prepayments and modification of debt instruments, transactions with affiliates, and other matters customarily restricted in such agreements. The Senior Credit Facility also contains customary events of default, including payment defaults, breaches of representations and warranties, covenant defaults, cross defaults to other contractual agreements, events of bankruptcy and insolvency, and a change of control. As of December 31, 2013, we were in compliance with all financial covenants under the Senior Credit Facility.
As of December 31, 2013, we had an outstanding letter of credit issued in connection with the revolving line of credit in our Senior Credit Facility in the total amount of $0.1 million.
52
Prior Senior Credit Facility
On February 7, 2012, we entered into a credit agreement (“prior senior credit facility”), which we amended on March 14, 2012, April 30, 2012, and May 29, 2012. The prior senior credit facility provided for a $68.0 million term loan and a $2.0 million revolving line of credit. The revolving line of credit also included a letter of credit sub-facility, which, together with outstanding revolving borrowings, could not exceed $2.0 million. The prior senior credit facility had a maturity date of February 7, 2016. On October 12, 2012, we repaid the amount owing under our term loan. As of December 31, 2012, there were no amounts outstanding on the revolving line of credit. As described above, on January 9, 2013, we refinanced the prior senior credit facility and entered into a new credit agreement.
Borrowings under the prior senior credit facility carried a per annum interest rate equal to, at our option, either (a) a base rate equal to the highest of (i) the Federal Funds Rate, plus .50%, (ii) the rate of interest in effect for such day as publicly announced from time to time by Bank of America as its “prime rate,” and (iii) the eurodollar rate for base rate loans, plus 1.00%, plus an applicable rate ranging from 2.75% to 3.75%, or (b) the eurodollar rate for eurodollar rate loans, plus an applicable rate ranging from 3.75% to 4.75%. The initial applicable rate was 3.75% for base rate loans and 4.75% for eurodollar rate loans, subject to adjustment from time to time based upon our achievement of a specified consolidated leverage ratio.
In addition to paying interest on the outstanding principal under the prior senior credit facility, we were also required to pay a commitment fee to the administrative agent at a rate per annum equal to the product of (a) 0.50% multiplied by (b) the actual daily amount by which the aggregate revolving commitments exceed the sum of (1) the outstanding amount of revolving borrowings, and (2) the outstanding amount of letter of credit obligations.
We also paid a letter of credit fee to the administrative agent for the account of each lender in accordance with its applicable percentage of a letter of credit for each letter of credit, which fee was equal to the applicable rate then in effect, multiplied by the daily maximum amount available to be drawn under the letter of credit. The initial applicable rate for the letter of credit fee was 4.75%, subject to adjustment from time to time based upon our achievement of a specified consolidated leverage ratio.
We had the right to prepay our borrowings under the prior senior credit facility from time to time in whole or in part, without premium or penalty, subject to the procedures set forth in the prior senior credit facility.
Prior Line of Credit
On September 23, 2008, we entered into a $12.0 million loan and security agreement with Silicon Valley Bank. The agreement consisted of a revolving line of credit, or LOC, in the initial amount of $12.0 million with the right for us to increase the LOC to $17.0 million and $20.0 million. The LOC had an original maturity date of September 23, 2010, which was subsequently extended to March 21, 2011. In conjunction with entering into the LOC in 2008, we issued a warrant to purchase 56,193 shares of Series D convertible redeemable preferred stock with an exercise price of $5.34 per share. The relative fair value of the warrant was recorded as a debt issuance cost and was amortized over the remaining term of the LOC.
On July 24, 2009 and February 8, 2010, we exercised our rights under the LOC, or the LOC Rights, to increase the LOC to $17.0 million and $20.0 million, respectively. In conjunction with our exercise of the LOC Rights, we issued a warrant to purchase 9,365 and 5,619 shares of Series D convertible redeemable preferred stock in 2010 and 2009, respectively, with an exercise price of $5.34 per share. The relative fair value of the warrants was recorded as a debt issuance cost and was amortized over the remaining term of the LOC.
On March 18, 2011, we entered into an amendment to the LOC to increase the LOC to $25.0 million and extend the maturity date to March 21, 2013. On March 14, 2012, the LOC was terminated in connection with our prior senior credit facility.
The average monthly balance of the LOC bore interest at Silicon Valley Bank’s prime rate plus a percentage ranging from 0.0% to 1.0% for the year ended December 31, 2011, depending on our liquidity ratio. The actual interest rates ranged from 3.25% to 4.25% for the year ended December 31, 2011. The rate was 3.25% as of December 31, 2011. A commitment fee payable quarterly at the rate of 0.125% accrued on any unused amount of the LOC.
Letters of Credit
As of December 31, 2012, we had $1.3 million in letters of credit issued against the $2.0 million revolving line of credit provided in our prior senior credit facility. The restrictions on the cash used to fully collateralize the standby letters of credit were released in July 2012.
Contractual Obligations
We lease various office facilities, including our corporate headquarters in Tempe, Arizona, under operating lease agreements that expire between 2014 and 2024. As of December 31, 2013, we did not have any debt or material capital lease obligations, all of our property, equipment, and software had been purchased with cash, and we had no material long-term purchase obligations outstanding with any vendors or third parties.
53
Our future minimum payments under non-cancelable operating leases for office facilities were as follows as of December 31, 2013:
|
|
|
Payment Due By Period |
|
|||||||||||||||||
|
|
|
Total |
|
|
Less Than 1 Year |
|
|
1 -3 Years |
|
|
4 - 5 Years |
|
|
More Than 5 Years |
|
|||||
|
Operating leases |
|
$ |
40,563 |
|
|
$ |
3,276 |
|
|
$ |
10,034 |
|
|
$ |
8,510 |
|
|
$ |
18,743 |
|
The contractual commitment amounts in the table above are associated with agreements that are enforceable and legally binding. Obligations under contracts that we can cancel without a significant penalty are not included in the table above.
Off-Balance Sheet Arrangements
We do not engage in any off-balance sheet financing activities, nor do we have any interest in entities referred to as variable interest entities.
Critical Accounting Policies and Estimates
Our consolidated financial statements are prepared in accordance with accounting principles generally accepted in the United States of America. The preparation of these consolidated financial statements requires us to make estimates and assumptions that affect the reported amounts of assets, liabilities, revenue, costs and expenses, and related disclosures. These estimates form the basis for judgments we make about the carrying values of our assets and liabilities, which are not readily apparent from other sources. We base our estimates and judgments on historical experience and on various other assumptions that we believe are reasonable under the circumstances. On an ongoing basis, we evaluate our estimates and assumptions. Our actual results may differ from these estimates under different assumptions or conditions.
We believe that of our significant accounting policies, which are described in Note 2 of the accompanying notes to our audited consolidated financial statements included in Part II, Item 8 of this Form 10-K/A, the following accounting policies involve a greater degree of judgment and complexity. Accordingly, we believe these are the most critical to fully understanding and evaluating our financial condition and results of operations.
Revenue Recognition
In our consumer segment, we recognize revenue from our identity theft protection services when it is probable that the economic benefits associated with the transactions will flow to us and the amount of revenue can be measured reliably. This is normally demonstrated when (i) persuasive evidence of an arrangement exists, (ii) the fee is fixed or determinable, (iii) performance of service has been delivered, and (iv) collection is reasonably assured.
Our consumer services are primarily offered to consumers on an annual or monthly subscription basis, which may include free trial periods. Fees for these subscriptions are typically billed to the member’s credit or debit card. We recognize revenue for member subscriptions ratably on a daily basis from the latter of cash receipt, activation of a member’s account, or expiration of free trial periods to the end of the subscription period.
We also provide consumer services for which the primary customer is an enterprise purchasing identity theft protection services on behalf of its employees or customers. In such cases, we defer revenue for each member until the member’s account has been activated. We then recognize revenue ratably on a daily basis over the term of the subscription period.
In our enterprise segment, we recognize revenue based on a negotiated fee per transaction. In many cases, we also negotiate a monthly minimum fee. Transaction fees in excess of any of the monthly minimum fees are billed and recorded as revenue in addition to the monthly minimum fees. In some instances, we receive up-front non-refundable payments against which the monthly minimum fees are applied. The up-front non-refundable payments are recorded as deferred revenue and recognized as revenue monthly over the usage period. If an enterprise customer does not meet its monthly minimum fee, we bill the negotiated monthly minimum fee and recognize revenue for that amount. Revenue from projects in which we are engaged to deliver a report at the end of the analysis is recorded upon delivery and acceptance of the report.
We also sell our consumer services through strategic partners, which earn commissions for sales to individual members and entities. Because (i) we are primarily responsible for fulfillment of the service obligation, (ii) we determine service specifications, and (iii) we have latitude in establishing prices for our service agreements, we record all sales made through strategic partners as revenue and the related commissions as a sales and marketing expense.
Share-Based Compensation
We account for share-based compensation in accordance with the authoritative guidance on stock compensation. Under the fair value recognition provisions of this guidance, share-based compensation is measured at the grant date based on the fair value of the award and is recognized as an expense, net of estimated forfeitures, over the requisite service period, which is generally the vesting period of the award.
54
Share-based compensation expense for awards granted to employees is based on the grant date fair value, which we determine using the Black-Scholes option pricing model. The grant date fair value is amortized on a straight-line basis over the requisite service period of the award to the extent such award is probable of being earned. The requisite service period is generally the vesting period of the award.
Expense for share-based awards to non-employees is based on the fair value of the awards as they vest, which we determine using the Black-Scholes option pricing model. The fair value of the unvested portion of the awards is re-measured each reporting period and is recognized over the expected service period to the extent the award is probable of being earned. There is inherent uncertainty in these estimates and if different assumptions were used, the fair value of the equity instruments could have been significantly different.
Prior to our IPO, our board of directors considered a number of objective and subjective factors to determine the fair market value of our common stock at each meeting at which stock options were granted and approved.
Share-based compensation expenses are classified in the statement of operations based on the department to which the related employee reports. Our share-based compensation is comprised principally from expenses from stock options and restricted stock unit awards and our employee stock purchase plan.
As discussed in the Explanatory Note to this Form 10-K/A and in Note 2 and Note 19 to the Consolidated Financial Statements included in Part II, Item 8 of this Form 10-K/A, we are restating our audited consolidated financial statements and related disclosures for the year ended December 31, 2013 due to an error related to our calculation of the volatility assumption within the Black-Scholes option pricing model used to compute our share-based compensation expense.
Goodwill and Other Intangible Assets
Goodwill represents the excess of the purchase price of acquired businesses over the estimated fair value assigned to the individual assets acquired and liabilities assumed. We do not amortize goodwill, but instead we are required to test goodwill for impairment at least annually and, if necessary, we would record any impairment. We will perform an impairment test between scheduled annual tests if facts and circumstances indicate that it is more likely than not that the fair value of a reporting unit that has goodwill is less than its carrying value.
We may first make a qualitative assessment of whether it is more likely than not that a reporting unit’s fair value is less than its carrying value to determine whether it is necessary to perform the two-step goodwill impairment test. The qualitative impairment test includes considering various factors including macroeconomic conditions, industry and market conditions, cost factors, a sustained share price or market capitalization decrease, and any reporting unit specific events. If it is determined through the qualitative assessment that a reporting unit’s fair value is more likely than not greater than its carrying value, the two-step impairment test is not required. If the qualitative assessment indicates it is more likely than not that a reporting unit’s fair value is not greater than its carrying value, we must perform the two-step impairment test. We may also elect to proceed directly to the two-step impairment test without considering such qualitative factors.
The first step in the two-step impairment test is a comparison of the fair value of a reporting unit with its carrying amount, including goodwill. We have two operating segments, a consumer segment and an enterprise segment, which are the same as our two reporting segments. In accordance with the authoritative guidance over fair value measurements, we define the fair value of a reporting unit as the price that would be received to sell the unit as a whole in an orderly transaction between market participants at the measurement date. We will primarily use the income approach methodology of valuation, which includes the discounted cash flow method, and the market approach methodology of valuation, which considers values of comparable businesses to estimate the fair values of our reporting units. We do not believe that a cost approach is relevant to measuring the fair values of our reporting units.
Significant management judgment will be required when estimating the fair value of our reporting units, including the forecasting of future operating results, the discount rates and expected future growth rates that we use in the discounted cash flow method of valuation, and the selection of comparable businesses that we use in the market approach. If the estimated fair value of the reporting unit exceeds the carrying value assigned to that unit, goodwill is not impaired and no further analysis is required.
If the carrying value assigned to a reporting unit exceeds its estimated fair value in the first step, then we will be required to perform the second step of the impairment test. In this step, we will assign the fair value of the reporting unit calculated in the first step to all of the assets and liabilities of that reporting unit, as if a market participant just acquired the reporting unit in a business combination. The excess of the fair value of the reporting unit determined in the first step of the impairment test over the total amount assigned to the assets and liabilities in the second step of the impairment test represents the implied fair value of goodwill. If the carrying value of a reporting unit’s goodwill exceeds the implied fair value of goodwill, we will record an impairment loss equal to the difference. If there is no such excess, then all goodwill for a reporting unit is considered not to be impaired.
Other intangible assets consist of existing technologies, customer relationships, trade names, and trademarks. Purchased intangible assets, other than goodwill, are amortized over their estimated useful lives based upon the estimated economic value derived from the related intangible assets.
55
Operating Segments
We have two operating segments, a consumer segment and an enterprise segment, which are the same as our two reporting segments. These operating segments are components for which separate financial information is available and for which operating results are evaluated on a regular basis by the chief operating decision maker in deciding how to allocate resources and in assessing the performance of the segments.
In our consumer segment, we offer identity theft protection services to consumers on a monthly or annual subscription basis. In our enterprise segment, we offer fraud and risk solutions to enterprise customers who pay us based on their monthly volume of transactions with us.
Stock Warrants
We have granted certain stock warrants that are exercisable for shares of our convertible redeemable preferred and common stock. Warrants to acquire convertible redeemable preferred stock are accounted for as liabilities and recognized at their fair value. The carrying value of such warrants is adjusted to fair value at each balance sheet date, with the change in the fair value being recorded as a component of other income (expense). Upon the completion of our IPO in October 2012, the warrants to purchase our convertible redeemable preferred stock were converted to warrants to purchase common stock and, at that time, were reclassified to equity. Warrants to acquire common stock are recorded in equity on issuance.
Income Taxes
We have deferred tax assets and liabilities that reflect the net tax effects of temporary differences between the carrying amounts of assets and liabilities for financial reporting purposes and the amounts used for income tax purposes. We have recorded a valuation allowance on these net deferred tax assets. In assessing the realizability of deferred tax assets, we consider whether it is more likely than not that some portion or all of the deferred tax assets will be realized. Realization of the deferred tax assets, net of liabilities, is principally dependent upon the achievement of projected future taxable income.
Contingencies
We record contingent liabilities resulting from asserted and unasserted claims against us when it is probable that a liability has been incurred and the amount of the loss is reasonably estimable. We disclose contingent liabilities when there is a reasonable possibility that the ultimate loss will exceed the recorded liability. Estimating probable losses requires analysis of multiple factors, in some cases including judgments about the potential actions of third party claimants and courts. Therefore, actual losses in any future period are inherently uncertain.
Interest Rate Sensitivity
Our cash and cash equivalents and marketable securities include cash, commercial paper, corporate debt securities, municipal securities, and certificates of deposit. Cash and cash equivalents also include credit and debit card receivables due from financial intermediaries. Our cash and cash equivalents and marketable securities are for working capital purposes. We do not enter into investments for trading or speculative purposes. Due to the short-term nature of these investments, we believe that we do not have any material exposure to changes in the fair value of our cash and cash equivalents and marketable securities as a result of changes in interest rates. Declines in interest rates, however, would reduce future investment income.
Exchange Rate Sensitivity
We bill our customers exclusively in U.S. dollars and therefore our revenue is not subject to foreign currency risk. However, certain of our operating expenses are incurred in Argentina and are denominated in Argentine pesos and therefore are subject to fluctuations due to changes in foreign currency exchange rates. Due to the minimal size of our operations in Argentina, we do not believe such changes in foreign currency exchange rates would have a material impact on our results of operations.
Impact of Inflation
We do not believe that inflation has had a material effect on our business, operating results, or financial condition. If our costs were to become subject to significant inflationary pressures, we might not be able to offset these higher costs fully through price increases. Our inability or failure to do so could harm our business, operating results, or financial condition.
56
LifeLock, Inc.
Consolidated Financial Statements
As of December 31, 2013 and 2012 and for the Years Ended December 31, 2013, 2012, and 2011
Table of Contents
|
|
58 |
|
|
|
|
60 |
|
|
|
61 |
|
Consolidated Statements of Comprehensive Income (Loss) (as restated) |
|
62 |
|
|
|
63 |
|
|
|
65 |
|
|
|
67 |
57
Report of Independent Registered Public Accounting Firm
The Board of Directors and Stockholders of LifeLock, Inc.
We have audited the accompanying consolidated balance sheets of LifeLock, Inc. as of December 31, 2013 and 2012, and the related consolidated statements of operations, comprehensive income (loss), convertible redeemable preferred stock and stockholders’ equity (deficit), and cash flows for each of the three years in the period ended December 31, 2013. Our audits also included the financial statement schedule listed in the Index at Item 15(a). These financial statements and schedule are the responsibility of the Company’s management. Our responsibility is to express an opinion on these financial statements and schedule based on our audits.
We conducted our audits in accordance with the standards of the Public Company Accounting Oversight Board (United States). Those standards require that we plan and perform the audit to obtain reasonable assurance about whether the financial statements are free of material misstatement. An audit includes examining, on a test basis, evidence supporting the amounts and disclosures in the financial statements. An audit also includes assessing the accounting principles used and significant estimates made by management, as well as evaluating the overall financial statement presentation. We believe that our audits provide a reasonable basis for our opinion.
In our opinion, the financial statements referred to above present fairly, in all material respects, the consolidated financial position of LifeLock, Inc. at December 31, 2013 and 2012, and the consolidated results of its operations and its cash flows for each of the three years in the period ended December 31, 2013, in conformity with U.S. generally accepted accounting principles. Also, in our opinion, the related financial statement schedule, when considered in relation to the basic financial statements taken as a whole, presents fairly in all material respects the information set forth therein.
As discussed in Note 2 to the consolidated financial statements, the 2013 consolidated financial statements have been restated to correct the accounting for share-based compensation and certain other errors.
We also have audited, in accordance with the standards of the Public Company Accounting Oversight Board (United States), LifeLock, Inc.’s internal control over financial reporting as of December 31, 2013, based on criteria established in Internal Control-Integrated Framework issued by the Committee of Sponsoring Organizations of the Treadway Commission (1992 framework) and our report dated February 19, 2014, except for the effect of the material weakness described in the sixth paragraph of that report, as to which the date is November 10, 2014, expressed an adverse opinion thereon.
/s/ Ernst & Young LLP
Phoenix, Arizona
February 19, 2014 except for the effects of the restatement described in Note 2, as to which the date is November 10, 2014
58
Report of Independent Registered Public Accounting Firm
To Board of Directors and Stockholders of LifeLock, Inc.
We have audited LifeLock, Inc.’s internal control over financial reporting as of December 31, 2013, based on criteria established in Internal Control — Integrated Framework issued by the Committee of Sponsoring Organizations of the Treadway Commission (1992 framework) (the COSO criteria). LifeLock, Inc.’s management is responsible for maintaining effective internal control over financial reporting, and for its assessment of the effectiveness of internal control over financial reporting included in the accompanying Management’s Annual Report on Internal Control Over Financial Reporting. Our responsibility is to express an opinion on the company’s internal control over financial reporting based on our audit.
We conducted our audit in accordance with the standards of the Public Company Accounting Oversight Board (United States). Those standards require that we plan and perform the audit to obtain reasonable assurance about whether effective internal control over financial reporting was maintained in all material respects. Our audit included obtaining an understanding of internal control over financial reporting, assessing the risk that a material weakness exists, testing and evaluating the design and operating effectiveness of internal control based on the assessed risk, and performing such other procedures as we considered necessary in the circumstances. We believe that our audit provides a reasonable basis for our opinion.
A company’s internal control over financial reporting is a process designed to provide reasonable assurance regarding the reliability of financial reporting and the preparation of financial statements for external purposes in accordance with generally accepted accounting principles. A company’s internal control over financial reporting includes those policies and procedures that (1) pertain to the maintenance of records that, in reasonable detail, accurately and fairly reflect the transactions and dispositions of the assets of the company; (2) provide reasonable assurance that transactions are recorded as necessary to permit preparation of financial statements in accordance with generally accepted accounting principles, and that receipts and expenditures of the company are being made only in accordance with authorizations of management and directors of the company; and (3) provide reasonable assurance regarding prevention or timely detection of unauthorized acquisition, use, or disposition of the company’s assets that could have a material effect on the financial statements.
Because of its inherent limitations, internal control over financial reporting may not prevent or detect misstatements. Also, projections of any evaluation of effectiveness to future periods are subject to the risk that controls may become inadequate because of changes in conditions, or that the degree of compliance with the policies or procedures may deteriorate.
In our report dated February 19, 2014, we expressed an unqualified opinion that LifeLock, Inc. maintained, in all material respects, effective internal control over financial reporting as of December 31, 2013, based on the COSO criteria. Management has subsequently determined that a deficiency in the control over the calculation of the volatility assumption within the Black-Scholes option pricing model used to compute share-based compensation expense exists, and has further concluded that such deficiency represented a material weakness as of December 31, 2013. As a result, management has revised its assessment, as presented in the accompanying Management’s Annual Report on Internal Control Over Financial Reporting, to conclude that LifeLock, Inc.’s internal control over financial reporting was not effective as of December 31, 2013. Accordingly, our present opinion on the effectiveness of LifeLock, Inc.’s internal control over financial reporting as of December 31, 2013, as expressed herein, is different from that expressed in our previous report.
A material weakness is a deficiency, or combination of deficiencies, in internal control over financial reporting, such that there is a reasonable possibility that a material misstatement of the company’s annual or interim financial statements will not be prevented or detected on a timely basis. The following material weakness has been identified and included in management’s assessment. Management has identified a material weakness in a control over the calculation of the volatility assumption within the Black-Scholes option pricing model used to compute LifeLock’s share-based compensation expense. This material weakness resulted in the restatement of LifeLock’s consolidated financial statements as of December 31, 2013 and for the year then ended.
We also have audited, in accordance with the standards of the Public Company Accounting Oversight Board (United States), the consolidated balance sheets of LifeLock, Inc. as of December 31, 2013 and 2012, and the related consolidated statements of operations, comprehensive income (loss), convertible redeemable preferred stock and stockholders’ equity (deficit), and cash flows for each of the three years in the period ended December 31, 2013. The material weakness was considered in determining the nature, timing and extent of audit tests applied in our audit of those consolidated financial statements, and this report does not affect our report dated February 19, 2014, except for the effects of the restatement described in Note 2, as to which the date is November 10, 2014, which expressed an unqualified opinion on those financial statements.
In our opinion, because of the effect of the material weakness described above on the achievement of the objectives of the control criteria, LifeLock, Inc. has not maintained effective internal control over financial reporting as of December 31, 2013, based on the COSO criteria.
/s/ Ernst & Young LLP
Phoenix, Arizona
February 19, 2014 except for the effect of the material weakness described in the sixth paragraph above, as to which the date is November 10, 2014
59
LIFELOCK, INC.
(in thousands, except share and per share amounts)
|
|
|
December 31, |
|
|||||
|
|
|
2013 (Restated) |
|
|
2012 |
|
||
|
Assets |
|
|
|
|
|
|
|
|
|
Current assets: |
|
|
|
|
|
|
|
|
|
Cash and cash equivalents |
|
$ |
123,911 |
|
|
$ |
134,197 |
|
|
Marketable securities |
|
|
48,688 |
|
|
|
- |
|
|
Trade and other receivables, net |
|
|
10,906 |
|
|
|
7,560 |
|
|
Deferred tax assets, net |
|
|
13,117 |
|
|
|
- |
|
|
Prepaid expenses and other current assets |
|
|
6,961 |
|
|
|
5,753 |
|
|
Total current assets |
|
|
203,583 |
|
|
|
147,510 |
|
|
Property and equipment, net |
|
|
16,504 |
|
|
|
9,701 |
|
|
Goodwill |
|
|
159,342 |
|
|
|
129,428 |
|
|
Intangible assets, net |
|
|
47,213 |
|
|
|
51,242 |
|
|
Deferred tax assets, net - noncurrent |
|
|
33,211 |
|
|
|
- |
|
|
Other non-current assets |
|
|
1,812 |
|
|
|
1,707 |
|
|
Total assets |
|
$ |
461,665 |
|
|
$ |
339,588 |
|
|
|
|
|
|
|
|
|
|
|
|
Liabilities and stockholders’ equity |
|
|
|
|
|
|
|
|
|
Current liabilities: |
|
|
|
|
|
|
|
|
|
Accounts payable |
|
$ |
2,422 |
|
|
$ |
1,151 |
|
|
Accrued expenses and other liabilities |
|
|
34,926 |
|
|
|
27,329 |
|
|
Deferred revenue |
|
|
119,106 |
|
|
|
90,877 |
|
|
Total current liabilities |
|
|
156,454 |
|
|
|
119,357 |
|
|
Other non-current liabilities |
|
|
4,640 |
|
|
|
265 |
|
|
Total liabilities |
|
|
161,094 |
|
|
|
119,622 |
|
|
Commitments and contingencies |
|
|
|
|
|
|
|
|
|
|
|
|
|
|
|
|
|
|
|
Stockholders’ equity: |
|
|
|
|
|
|
|
|
|
Common stock, $0.001 par value, 300,000,000 authorized at December 31, 2013 and |
|
|
|
|
|
|
|
|
|
December 31, 2012; 91,441,771 and 86,561,320 shares issued and |
|
|
|
|
|
|
|
|
|
outstanding at December 31, 2013 and December 31, 2012, respectively |
|
|
91 |
|
|
|
87 |
|
|
Preferred stock, $0.001 par value, 10,000,000 shares authorized and no shares issued and |
|
|
|
|
|
|
|
|
|
outstanding at December 31, 2013 and December 31, 2012 |
|
|
- |
|
|
|
- |
|
|
Additional paid-in capital |
|
|
466,047 |
|
|
|
439,883 |
|
|
Accumulated other comprehensive loss |
|
|
(18 |
) |
|
|
- |
|
|
Accumulated deficit |
|
|
(165,549 |
) |
|
|
(220,004 |
) |
|
Total stockholders’ equity |
|
|
300,571 |
|
|
|
219,966 |
|
|
Total liabilities and stockholders’ equity |
|
$ |
461,665 |
|
|
$ |
339,588 |
|
See accompanying notes to consolidated financial statements.
60
LIFELOCK, INC.
CONSOLIDATED STATEMENTS OF OPERATIONS
(in thousands, except per share amounts)
|
|
|
Year Ended December 31, |
|
|
|||||||||
|
|
|
2013 (Restated) |
|
|
2012 |
|
|
2011 |
|
|
|||
|
Revenue: |
|
|
|
|
|
|
|
|
|
|
|
|
|
|
Consumer revenue |
|
$ |
340,121 |
|
|
$ |
254,678 |
|
|
$ |
193,949 |
|
|
|
Enterprise revenue |
|
|
29,537 |
|
|
|
21,750 |
|
|
|
- |
|
|
|
|
|
|
|
|
|
|
|
|
|
|
|
|
|
|
Total revenue |
|
|
369,658 |
|
|
|
276,428 |
|
|
|
193,949 |
|
|
|
Cost of services |
|
|
100,065 |
|
|
|
79,916 |
|
|
|
62,630 |
|
|
|
|
|
|
|
|
|
|
|
|
|
|
|
|
|
|
Gross profit |
|
|
269,593 |
|
|
|
196,512 |
|
|
|
131,319 |
|
|
|
Costs and expenses: |
|
|
|
|
|
|
|
|
|
|
|
|
|
|
Sales and marketing |
|
|
162,363 |
|
|
|
122,989 |
|
|
|
91,217 |
|
|
|
Technology and development |
|
|
40,015 |
|
|
|
29,543 |
|
|
|
17,749 |
|
|
|
General and administrative |
|
|
42,125 |
|
|
|
24,629 |
|
|
|
17,510 |
|
|
|
Amortization of acquired intangible assets |
|
|
7,909 |
|
|
|
6,258 |
|
|
|
- |
|
|
|
|
|
|
|
|
|
|
|
|
|
|
|
|
|
|
Total costs and expenses |
|
|
252,412 |
|
|
|
183,419 |
|
|
|
126,476 |
|
|
|
|
|
|
|
|
|
|
|
|
|
|
|
|
|
|
Income from operations |
|
|
17,181 |
|
|
|
13,093 |
|
|
|
4,843 |
|
|
|
|
|
|
|
|
|
|
|
|
|
|
|
|
|
|
Other income (expense): |
|
|
|
|
|
|
|
|
|
|
|
|
|
|
Interest expense |
|
|
(353 |
) |
|
|
(3,677 |
) |
|
|
(231 |
) |
|
|
Interest income |
|
|
124 |
|
|
|
30 |
|
|
|
8 |
|
|
|
Change in fair value of warrant liabilities |
|
|
- |
|
|
|
3,117 |
|
|
|
(8,658 |
) |
|
|
Change in fair value of embedded derivative |
|
|
- |
|
|
|
(2,785 |
) |
|
|
- |
|
|
|
Other |
|
|
(21 |
) |
|
|
(5 |
) |
|
|
(5 |
) |
|
|
|
|
|
|
|
|
|
|
|
|
|
|
|
|
|
Total other expense |
|
|
(250 |
) |
|
|
(3,320 |
) |
|
|
(8,886 |
) |
|
|
|
|
|
|
|
|
|
|
|
|
|
|
|
|
|
Income (loss) before provision for income taxes |
|
|
16,931 |
|
|
|
9,773 |
|
|
|
(4,043 |
) |
|
|
Income tax (benefit) expense |
|
|
(37,524 |
) |
|
|
(13,730 |
) |
|
|
214 |
|
|
|
|
|
|
|
|
|
|
|
|
|
|
|
|
|
|
Net income (loss) |
|
|
54,455 |
|
|
|
23,503 |
|
|
|
(4,257 |
) |
|
|
Accretion of convertible redeemable preferred stock |
|
|
- |
|
|
|
(9,378 |
) |
|
|
(18,926 |
) |
|
|
Beneficial conversion feature on convertible redeemable preferred stock |
|
|
- |
|
|
|
(2,452 |
) |
|
|
- |
|
|
|
Net income allocable to convertible redeemable preferred stockholders |
|
|
- |
|
|
|
(5,504 |
) |
|
|
- |
|
|
|
|
|
|
|
|
|
|
|
|
|
|
|
|
|
|
Net income available (loss attributable) to common stockholders |
|
$ |
54,455 |
|
|
$ |
6,169 |
|
|
$ |
(23,183 |
) |
|
|
|
|
|
|
|
|
|
|
|
|
|
|
|
|
|
Net income available (loss attributable) per share to common stockholders |
|
|
|
|
|
|
|
|
|
|
|
|
|
|
Basic |
|
$ |
0.61 |
|
|
$ |
0.18 |
|
|
$ |
(1.24 |
) |
|
|
Diluted |
|
$ |
0.57 |
|
|
$ |
0.09 |
|
|
$ |
(1.24 |
) |
|
|
Weighted-average common shares outstanding: |
|
|
|
|
|
|
|
|
|
|
|
|
|
|
Basic |
|
|
88,636 |
|
|
|
35,082 |
|
|
|
18,725 |
|
|
|
Diluted |
|
|
96,047 |
|
|
|
62,191 |
|
|
|
18,725 |
|
|
See accompanying notes to consolidated financial statements.
61
LifeLock, Inc.
Consolidated Statements of Comprehensive Income (Loss)
(in thousands)
|
|
|
Year Ended December 31, |
|
|
|||||||||
|
|
|
2013 (Restated) |
|
|
2012 |
|
|
2011 |
|
|
|||
|
Net income (loss) |
|
$ |
54,455 |
|
|
$ |
23,503 |
|
|
$ |
(4,257 |
) |
|
|
Other comprehensive loss, net of tax |
|
|
|
|
|
|
|
|
|
|
|
|
|
|
Unrealized loss on marketable securities |
|
|
(18 |
) |
|
|
- |
|
|
|
- |
|
|
|
Comprehensive income (loss) |
|
$ |
54,437 |
|
|
$ |
23,503 |
|
|
$ |
(4,257 |
) |
|
See accompanying notes to consolidated financial statements.
62
LIFELOCK, INC.
CONSOLIDATED STATEMENTS OF CONVERTIBLE REDEEMABLE PREFERRED STOCK AND STOCKHOLDERS’ EQUITY (DEFICIT)
(in thousands, except share amounts)
|
|
Convertible Redeemable Preferred Stock |
|
|||||||||||||||||||||||||||||||||||||||||||||||||||||
|
|
Series A |
|
|
Series B |
|
|
Series C |
|
|
Series D |
|
|
Series E |
|
|
Series E-1 |
|
|
Series E-2 |
|
|||||||||||||||||||||||||||||||||||
|
|
Shares |
|
|
Amount |
|
|
Shares |
|
|
Amount |
|
|
Shares |
|
|
Amount |
|
|
Shares |
|
|
Amount |
|
|
Shares |
|
|
Amount |
|
|
Shares |
|
|
Amount |
|
|
Shares |
|
|
Amount |
|
||||||||||||||
|
Balance, January 1, 2011 |
|
6,428,571 |
|
|
$ |
6,155 |
|
|
|
6,850,000 |
|
|
$ |
9,661 |
|
|
|
5,677,571 |
|
|
$ |
38,662 |
|
|
|
10,094,389 |
|
|
$ |
71,803 |
|
|
|
– |
|
|
$ |
– |
|
|
|
– |
|
|
$ |
– |
|
|
|
– |
|
|
$ |
– |
|
|
Accretion on convertible redeemable preferred stock |
|
– |
|
|
|
595 |
|
|
|
– |
|
|
|
614 |
|
|
|
– |
|
|
|
3,920 |
|
|
|
– |
|
|
|
13,797 |
|
|
|
– |
|
|
|
– |
|
|
|
– |
|
|
|
– |
|
|
|
– |
|
|
|
– |
|
|
Balance, December 31, 2011 |
|
6,428,571 |
|
|
|
6,750 |
|
|
|
6,850,000 |
|
|
|
10,275 |
|
|
|
5,677,571 |
|
|
|
42,582 |
|
|
|
10,094,389 |
|
|
|
85,600 |
|
|
|
– |
|
|
|
– |
|
|
|
– |
|
|
|
– |
|
|
|
– |
|
|
|
– |
|
|
Issuance of stock, net of offering costs |
|
– |
|
|
|
– |
|
|
|
– |
|
|
|
– |
|
|
|
– |
|
|
|
– |
|
|
|
– |
|
|
|
– |
|
|
|
11,486,999 |
|
|
|
85,215 |
|
|
|
1,586,778 |
|
|
|
11,542 |
|
|
|
2,284,960 |
|
|
|
16,951 |
|
|
Accretion on convertible redeemable preferred stock |
|
– |
|
|
|
– |
|
|
|
– |
|
|
|
– |
|
|
|
– |
|
|
|
– |
|
|
|
– |
|
|
|
– |
|
|
|
– |
|
|
|
6,804 |
|
|
|
– |
|
|
|
1,220 |
|
|
|
– |
|
|
|
1,354 |
|
|
Beneficial conversion feature |
|
– |
|
|
|
– |
|
|
|
– |
|
|
|
– |
|
|
|
– |
|
|
|
– |
|
|
|
– |
|
|
|
– |
|
|
|
– |
|
|
|
(2,045 |
) |
|
|
– |
|
|
|
– |
|
|
|
– |
|
|
|
(407 |
) |
|
Accumulated accretion of beneficial conversion feature |
|
– |
|
|
|
– |
|
|
|
– |
|
|
|
– |
|
|
|
– |
|
|
|
– |
|
|
|
– |
|
|
|
– |
|
|
|
– |
|
|
|
2,045 |
|
|
|
– |
|
|
|
– |
|
|
|
– |
|
|
|
407 |
|
|
Conversion of outstanding convertible redeemable preferred stock to common stock |
|
(6,428,571 |
) |
|
|
(6,750 |
) |
|
|
(6,850,000 |
) |
|
|
(10,275 |
) |
|
|
(5,677,571 |
) |
|
|
(42,582 |
) |
|
|
(10,094,389 |
) |
|
|
(85,600 |
) |
|
|
(11,486,999 |
) |
|
|
(92,019 |
) |
|
|
(1,586,778 |
) |
|
|
(12,762 |
) |
|
|
(2,284,960 |
) |
|
|
(18,305 |
) |
|
Balance, December 31, 2012 |
|
– |
|
|
|
– |
|
|
|
– |
|
|
|
– |
|
|
|
– |
|
|
|
– |
|
|
|
– |
|
|
|
– |
|
|
|
– |
|
|
|
– |
|
|
|
– |
|
|
|
– |
|
|
|
– |
|
|
|
– |
|
|
|
|
|
|
|
|
|
|
|
|
|
|
|
|
|
|
|
|
|
|
|
|
|
|
|
|
|
|
|
|
|
|
|
|
|
|
|
|
|
|
|
|
|
|
|
|
|
|
|
|
|
|
|
|
|
|
|
Balance, December 31, 2013 |
|
– |
|
|
$ |
– |
|
|
|
– |
|
|
$ |
– |
|
|
|
– |
|
|
$ |
– |
|
|
|
– |
|
|
$ |
– |
|
|
|
– |
|
|
$ |
– |
|
|
|
– |
|
|
$ |
– |
|
|
|
– |
|
|
$ |
– |
|
63
|
|
|
Stockholders’ Equity (Deficit) |
|
|||||||||||||||||||
|
|
|
|
|
|
|
|
|
|
Additional |
|
|
Accum. Other |
|
|
|
|
|
|
|
|
||
|
|
|
Common Stock |
|
|
Paid-In |
|
|
Comprehensive |
|
|
Accumulated |
|
|
|
|
|||||||
|
|
|
Shares |
|
Amount |
|
|
Capital |
|
|
Loss |
|
|
Deficit |
|
Total |
|
||||||
|
Balance, January 1, 2011 |
|
|
18,541,294 |
|
$ |
19 |
|
|
$ |
12,354 |
|
|
$ |
– |
|
|
$ |
(208,494 |
) |
$ |
(196,121 |
) |
|
Stock option exercises |
|
|
856,207 |
|
|
– |
|
|
|
1,752 |
|
|
|
– |
|
|
|
– |
|
|
1,752 |
|
|
Share-based compensation |
|
|
– |
|
|
– |
|
|
|
3,285 |
|
|
|
– |
|
|
|
– |
|
|
3,285 |
|
|
Accretion on convertible redeemable |
|
|
|
|
|
|
|
|
|
|
|
|
|
|
|
|
|
|
|
|
|
|
|
preferred stock |
|
|
– |
|
|
– |
|
|
|
– |
|
|
|
– |
|
|
|
(18,926 |
) |
|
(18,926 |
) |
|
Net loss |
|
|
– |
|
|
– |
|
|
|
– |
|
|
|
– |
|
|
|
(4,257 |
) |
|
(4,257 |
) |
|
Balance, December 31, 2011 |
|
|
19,397,501 |
|
|
19 |
|
|
|
17,391 |
|
|
|
– |
|
|
|
(231,677 |
) |
|
(214,267 |
) |
|
Issuance of stock, net of offering costs |
|
|
15,500,000 |
|
|
16 |
|
|
|
125,647 |
|
|
|
– |
|
|
|
– |
|
|
125,663 |
|
|
Stock option and warrant exercises |
|
|
558,607 |
|
|
1 |
|
|
|
298 |
|
|
|
– |
|
|
|
– |
|
|
299 |
|
|
Common shares surrendered on net |
|
|
|
|
|
|
|
|
|
|
|
|
|
|
|
|
|
|
|
|
|
|
|
settlement of option and warrant exercises |
|
|
(215,225 |
) |
|
– |
|
|
|
(356 |
) |
|
|
– |
|
|
|
– |
|
|
(356 |
) |
|
Share-based compensation |
|
|
– |
|
|
– |
|
|
|
6,758 |
|
|
|
– |
|
|
|
– |
|
|
6,758 |
|
|
Accretion on convertible redeemable |
|
|
|
|
|
|
|
|
|
|
|
|
|
|
|
|
|
|
|
|
|
|
|
preferred stock |
|
|
– |
|
|
– |
|
|
|
– |
|
|
|
– |
|
|
|
(9,378 |
) |
|
(9,378 |
) |
|
Beneficial conversion feature |
|
|
– |
|
|
– |
|
|
|
2,452 |
|
|
|
– |
|
|
|
– |
|
|
2,452 |
|
|
Accumulated accretion of beneficial |
|
|
|
|
|
|
|
|
|
|
|
|
|
|
|
|
|
|
|
|
|
|
|
conversion feature |
|
|
– |
|
|
– |
|
|
|
– |
|
|
|
– |
|
|
|
(2,452 |
) |
|
(2,452 |
) |
|
Conversion of outstanding convertible |
|
|
|
|
|
|
|
|
|
|
|
|
|
|
|
|
|
|
|
|
|
|
|
redeemable preferred stock to common stock |
|
|
51,320,437 |
|
|
51 |
|
|
|
268,242 |
|
|
|
– |
|
|
|
– |
|
|
268,293 |
|
|
Conversion of outstanding warrants to |
|
|
|
|
|
|
|
|
|
|
|
|
|
|
|
|
|
|
|
|
|
|
|
purchase convertible redeemable |
|
|
|
|
|
|
|
|
|
|
|
|
|
|
|
|
|
|
|
|
|
|
|
preferred stock to warrants to purchase |
|
|
|
|
|
|
|
|
|
|
|
|
|
|
|
|
|
|
|
|
|
|
|
common stock |
|
|
– |
|
|
– |
|
|
|
19,451 |
|
|
|
– |
|
|
|
– |
|
|
19,451 |
|
|
Net income |
|
|
– |
|
|
– |
|
|
|
– |
|
|
|
– |
|
|
|
23,503 |
|
|
23,503 |
|
|
Balance, December 31, 2012 |
|
|
86,561,320 |
|
|
87 |
|
|
|
439,883 |
|
|
|
– |
|
|
|
(220,004 |
) |
|
219,966 |
|
|
Stock option and warrant exercises |
|
|
4,621,091 |
|
|
4 |
|
|
|
14,670 |
|
|
|
– |
|
|
|
– |
|
|
14,674 |
|
|
Shares purchased under ESPP |
|
|
107,074 |
|
|
– |
|
|
|
819 |
|
|
|
– |
|
|
|
– |
|
|
819 |
|
|
Share-based compensation (restated) |
|
|
– |
|
|
– |
|
|
|
11,111 |
|
|
|
– |
|
|
|
– |
|
|
11,111 |
|
|
Vesting of restricted stock units |
|
|
136,886 |
|
|
– |
|
|
|
– |
|
|
|
– |
|
|
|
– |
|
|
– |
|
|
Restricted stock units surrendered in lieu of withholding taxes |
|
|
(29,374 |
) |
|
– |
|
|
|
(436 |
) |
|
|
– |
|
|
|
– |
|
|
(436 |
) |
|
Restricted stock issued |
|
|
44,774 |
|
|
– |
|
|
|
– |
|
|
|
– |
|
|
|
– |
|
|
– |
|
|
Other comprehensive loss |
|
|
– |
|
|
– |
|
|
|
– |
|
|
|
(18 |
) |
|
|
– |
|
|
(18 |
) |
|
Net income (restated) |
|
|
– |
|
|
– |
|
|
|
– |
|
|
|
– |
|
|
|
54,455 |
|
|
54,455 |
|
|
Balance, December 31, 2013 (restated) |
|
|
91,441,771 |
|
$ |
91 |
|
|
$ |
466,047 |
|
|
$ |
(18 |
) |
|
$ |
(165,549 |
) |
$ |
300,571 |
|
See accompanying notes to consolidated financial statements.
64
LIFELOCK, INC.
CONSOLIDATED STATEMENTS OF CASH FLOWS
(in thousands)
|
|
|
Year Ended December 31, |
|
|||||||||
|
|
|
2013 (Restated) |
|
|
2012 |
|
|
2011 |
|
|||
|
Operating activities |
|
|
|
|
|
|
|
|
|
|
|
|
|
Net income (loss) |
|
$ |
54,455 |
|
|
$ |
23,503 |
|
|
$ |
(4,257 |
) |
|
Adjustment to reconcile net income (loss) to net cash provided by operating activities: |
|
|
|
|
|
|
|
|
|
|
|
|
|
Depreciation and amortization |
|
|
12,796 |
|
|
|
10,427 |
|
|
|
3,740 |
|
|
Write-off of deferred financing costs from early payoff of debt |
|
|
- |
|
|
|
1,443 |
|
|
|
- |
|
|
Share-based compensation |
|
|
11,111 |
|
|
|
6,758 |
|
|
|
3,285 |
|
|
Provision for doubtful accounts |
|
|
231 |
|
|
|
46 |
|
|
|
(28 |
) |
|
Accretion of marketable securities |
|
|
323 |
|
|
|
- |
|
|
|
- |
|
|
Change in fair value of warrant liabilities |
|
|
- |
|
|
|
(3,117 |
) |
|
|
8,658 |
|
|
Change in fair value of embedded derivative |
|
|
- |
|
|
|
2,785 |
|
|
|
- |
|
|
Deferred income tax benefit |
|
|
(37,612 |
) |
|
|
(14,185 |
) |
|
|
- |
|
|
Other |
|
|
21 |
|
|
|
5 |
|
|
|
5 |
|
|
Change in operating assets and liabilities: |
|
|
|
|
|
|
|
|
|
|
|
|
|
Trade and other receivables |
|
|
(3,127 |
) |
|
|
(2,766 |
) |
|
|
(1,067 |
) |
|
Prepaid expenses and other current assets |
|
|
(1,080 |
) |
|
|
1,334 |
|
|
|
(901 |
) |
|
Other non-current assets |
|
|
328 |
|
|
|
(1,305 |
) |
|
|
(287 |
) |
|
Accounts payable |
|
|
518 |
|
|
|
(2,945 |
) |
|
|
1,677 |
|
|
Accrued expenses and other liabilities |
|
|
6,920 |
|
|
|
5,913 |
|
|
|
542 |
|
|
Deferred revenue |
|
|
28,115 |
|
|
|
20,782 |
|
|
|
13,440 |
|
|
Other non-current liabilities |
|
|
4,374 |
|
|
|
(255 |
) |
|
|
(463 |
) |
|
Net cash provided by operating activities |
|
|
77,373 |
|
|
|
48,423 |
|
|
|
24,344 |
|
|
|
|
|
|
|
|
|
|
|
|
|
|
|
|
Investing activities |
|
|
|
|
|
|
|
|
|
|
|
|
|
Acquisition of businesses, net of cash acquired |
|
|
(42,369 |
) |
|
|
(157,430 |
) |
|
|
- |
|
|
Acquisition of property and equipment |
|
|
(10,417 |
) |
|
|
(7,498 |
) |
|
|
(2,031 |
) |
|
Purchase of marketable securities |
|
|
(50,775 |
) |
|
|
- |
|
|
|
- |
|
|
Sale and maturities of marketable securities |
|
|
1,353 |
|
|
|
- |
|
|
|
- |
|
|
Decrease in restricted cash |
|
|
- |
|
|
|
1,748 |
|
|
|
500 |
|
|
Net cash used in investing activities |
|
|
(102,208 |
) |
|
|
(163,180 |
) |
|
|
(1,531 |
) |
|
|
|
|
|
|
|
|
|
|
|
|
|
|
|
Financing activities |
|
|
|
|
|
|
|
|
|
|
|
|
|
Proceeds from: |
|
|
|
|
|
|
|
|
|
|
|
|
|
Term loan |
|
|
- |
|
|
|
68,000 |
|
|
|
- |
|
|
Initial public offering, net of offering costs |
|
|
- |
|
|
|
125,663 |
|
|
|
- |
|
|
Issuance of convertible redeemable preferred stock, net of offering costs |
|
|
- |
|
|
|
102,165 |
|
|
|
- |
|
|
Issuance of warrants |
|
|
- |
|
|
|
4,373 |
|
|
|
- |
|
|
Stock based compensation plans |
|
|
15,425 |
|
|
|
298 |
|
|
|
1,752 |
|
|
Payments for: |
|
|
|
|
|
|
|
|
|
|
|
|
|
Term loan |
|
|
- |
|
|
|
(68,000 |
) |
|
|
|
|
|
Revolving line of credit |
|
|
- |
|
|
|
- |
|
|
|
(13,010 |
) |
|
Obligations under capital lease |
|
|
- |
|
|
|
- |
|
|
|
(154 |
) |
|
Payments to Series E-1 convertible redeemable preferred stockholders |
|
|
- |
|
|
|
(10,719 |
) |
|
|
- |
|
|
Employee tax withholdings related to restricted stock units |
|
|
(436 |
) |
|
|
- |
|
|
|
- |
|
|
Debt issuance costs |
|
|
(440 |
) |
|
|
(1,676 |
) |
|
|
(132 |
) |
|
Net cash provided by (used in) financing activities |
|
|
14,549 |
|
|
|
220,104 |
|
|
|
(11,544 |
) |
|
Net increase (decrease) in cash and cash equivalents |
|
|
(10,286 |
) |
|
|
105,347 |
|
|
|
11,269 |
|
|
Cash and cash equivalents at beginning of year |
|
|
134,197 |
|
|
|
28,850 |
|
|
|
17,581 |
|
|
Cash and cash equivalents at end of year |
|
$ |
123,911 |
|
|
$ |
134,197 |
|
|
$ |
28,850 |
|
|
|
|
|
|
|
|
|
|
|
|
|
|
|
65
|
|
|
Year Ended December 31, |
|
|||||||||
|
|
|
2013 |
|
|
2012 |
|
|
2011 |
|
|||
|
Supplemental cash flow information: |
|
|
|
|
|
|
|
|
|
|
|
|
|
Cash paid during the period for: |
|
|
|
|
|
|
|
|
|
|
|
|
|
Interest |
|
$ |
267 |
|
|
$ |
1,836 |
|
|
$ |
316 |
|
|
Income taxes |
|
|
1,121 |
|
|
|
518 |
|
|
|
94 |
|
|
Supplemental information for non-cash investing activities: |
|
|
|
|
|
|
|
|
|
|
|
|
|
Accrued capital expenditures |
|
|
1,300 |
|
|
|
127 |
|
|
|
- |
|
|
Supplemental information for non-cash financing activities: |
|
|
|
|
|
|
|
|
|
|
|
|
|
Convertible redeemable preferred stock issued as part of purchase price for ID Analytics |
|
|
- |
|
|
|
11,542 |
|
|
|
- |
|
|
Preferred stock embedded derivative issued as part of purchase price for ID Analytics |
|
|
- |
|
|
|
7,934 |
|
|
|
- |
|
See accompanying notes to consolidated financial statements.
66
LIFELOCK, INC.
NOTES TO CONSOLIDATED FINANCIAL STATEMENTS
(in thousands, except share and per share data)
1. Corporation Information
We provide proactive identity theft protection services to our consumer subscribers, whom we refer to as our members, on an annual or monthly subscription basis. We also provide fraud and risk solutions to our enterprise customers.
We were incorporated in Delaware on April 12, 2005 and are headquartered in Tempe, Arizona. On March 14, 2012, we acquired ID Analytics and its wholly owned subsidiary IDA Inc., each of which is incorporated in Delaware.
In October 2012, we completed our IPO in which we issued and sold 15,500,000 shares of common stock at a public offering price of $9.00 per share. We received net proceeds of $125,663 after deducting the underwriting discount of $9,765 and other offering expenses of $4,072. Upon the closing of our IPO, all of our outstanding convertible redeemable preferred stock automatically converted into an aggregate of 51,320,437 shares of common stock. Our common stock is listed on the New York Stock Exchange under the symbol “LOCK.”
On December 11, 2013, we acquired mobile wallet innovator Lemon for approximately $42,369 in cash, net of cash acquired, and introduced our new LifeLock Wallet mobile application. The LifeLock Wallet mobile application allows consumers to replicate and store a digital copy of their personal wallet contents on their smart device for records backup, as well as transaction monitoring and mobile use of items such as credit, identification, ATM, insurance, and loyalty cards. The LifeLock Wallet mobile application also offers our members one-touch access to our identity theft protection services.
2. Summary of Significant Accounting Policies
Restatement of Current Year Financial Statements
In connection with the preparation of our financial statements for the third quarter ended September 30, 2014, we identified an error in our calculation of the volatility assumption within the Black-Scholes option pricing model used to compute our share-based compensation expense since our initial public offering in October 2012. We determined that there was an error in the formula used to calculate the annualized volatility, which resulted in a higher volatility and, accordingly, we materially overstated share-based compensation expense in 2013. To correct this error, we have restated our audited consolidated financial statements for the year ended December 31, 2013 and our unaudited quarterly condensed consolidated financial information for the quarters ended March 31, 2013, June 30, 2013, September 30, 2013, and December 31, 2013. The correction of the error resulted in a decrease in our share-based compensation expense for the year ended December 31, 2013 of $3,589 and, accordingly, our net income for the year ended December 31, 2013 increased by $2,236 (including a reduction of income tax benefit of $1,353 for such period).
As part of the restatement, we also recorded a decrease in income tax benefit and deferred tax assets, net – non-current of $232, to correct an error identified during the finalization of our income tax return for the year ended December 31, 2013.
In a separate matter, unrelated to the error corrections described above, we have also reflected certain purchase price adjustments to our consolidated balance sheet as of December 31, 2013 related to our acquisition of Lemon, Inc., or Lemon, which we previously disclosed in our Form 10-Q for the quarter ended June 30, 2014. Subsequent to the date of the Original Filing, we determined that $7,894 and $7,991 of Lemon’s federal and state net operating loss carry forwards, respectively, would expire as a result of limitations under Section 382 of the Internal Revenue Code. ASC 805-10-25-16 requires that adjustments to provisional amounts of assets and liabilities recognized in a business combination be made as if the accounting for the business combination had been completed at the acquisition date and that the financial statements be revised accordingly. As such, we recorded a decrease in deferred tax assets, net – non-current of $3,222, increasing goodwill by the same amount. This adjustment has been reflected in the December 31, 2013 balances of deferred tax assets, net – non-current and goodwill in the consolidated balance sheet as of December 31, 2013.
In addition to the restatement of our consolidated balance sheet, consolidated statement of operations, consolidated statement of comprehensive income, and consolidated statement of cash flows, we have also restated the following notes to the consolidated financial statement to reflect the correction of the errors and purchase price adjustment.
|
· |
Note 12 – Share-based Compensation |
|
· |
Note 15 – Net Income (Loss) Per Share |
|
· |
Note 16 – Income Taxes |
|
· |
Note 17 – Segment Reporting |
67
|
· |
Note 19 – Selected Quarterly Financial Data (unaudited) |
The following tables present the effect of the correction of the error and other adjustments on our previously reported consolidated financial statements for the year ended December 31, 2013:
|
|
As of December 31, 2013 |
|
|||||||||||||||||
|
|
As Previously Reported |
|
|
Error Corrections |
|
|
Purchase Price Adjustment |
|
|
Total Adjustments |
|
|
As Restated |
|
|||||
|
Consolidated Balance Sheet: |
(in thousands) |
|
|||||||||||||||||
|
Goodwill |
$ |
156,120 |
|
|
$ |
- |
|
|
$ |
3,222 |
|
|
$ |
3,222 |
|
|
$ |
159,342 |
|
|
Deferred tax assets, net - noncurrent |
|
38,018 |
|
|
|
(1,585 |
) |
|
|
(3,222 |
) |
|
|
(4,807 |
) |
|
|
33,211 |
|
|
Total assets |
|
463,250 |
|
|
|
(1,585 |
) |
|
|
- |
|
|
|
(1,585 |
) |
|
|
461,665 |
|
|
Additional paid-in capital |
|
469,636 |
|
|
|
(3,589 |
) |
|
|
- |
|
|
|
(3,589 |
) |
|
|
466,047 |
|
|
Accumulated deficit |
|
(167,553 |
) |
|
|
2,004 |
|
|
|
- |
|
|
|
2,004 |
|
|
|
(165,549 |
) |
|
Total stockholders’ equity |
|
302,156 |
|
|
|
(1,585 |
) |
|
|
- |
|
|
|
(1,585 |
) |
|
|
300,571 |
|
|
|
Year Ended December 31, 2013 |
|
|||||||||
|
|
As Previously Reported |
|
|
Adjustment |
|
|
As Restated |
|
|||
|
Consolidated Statement of Operations: |
(in thousands, except per share data) |
|
|||||||||
|
Cost of services |
$ |
100,249 |
|
|
$ |
(184 |
) |
|
$ |
100,065 |
|
|
Gross profit |
|
269,409 |
|
|
|
184 |
|
|
|
269,593 |
|
|
Sales and marketing |
|
162,891 |
|
|
|
(528 |
) |
|
|
162,363 |
|
|
Technology and development |
|
40,947 |
|
|
|
(932 |
) |
|
|
40,015 |
|
|
General and administrative |
|
44,070 |
|
|
|
(1,945 |
) |
|
|
42,125 |
|
|
Total costs and expenses |
|
255,817 |
|
|
|
(3,405 |
) |
|
|
252,412 |
|
|
Income from operations |
|
13,592 |
|
|
|
3,589 |
|
|
|
17,181 |
|
|
Income before provision for income taxes |
|
13,342 |
|
|
|
3,589 |
|
|
|
16,931 |
|
|
Income tax benefit |
|
(39,109 |
) |
|
|
1,585 |
|
|
|
(37,524 |
) |
|
Net income |
|
52,451 |
|
|
|
2,004 |
|
|
|
54,455 |
|
|
Basic earnings per share |
$ |
0.59 |
|
|
$ |
0.02 |
|
|
$ |
0.61 |
|
|
Diluted earnings per share |
$ |
0.55 |
|
|
$ |
0.02 |
|
|
$ |
0.57 |
|
|
|
Year Ended December 31, 2013 |
|
|||||||||
|
|
As Previously Reported |
|
|
Adjustment |
|
|
As Restated |
|
|||
|
Consolidated Statement of Cash Flows: |
(in thousands) |
|
|||||||||
|
Net income |
$ |
52,451 |
|
|
$ |
2,004 |
|
|
$ |
54,455 |
|
|
Share-based compensation |
|
14,700 |
|
|
|
(3,589 |
) |
|
|
11,111 |
|
|
Deferred income tax benefit |
|
(39,197 |
) |
|
|
1,585 |
|
|
|
(37,612 |
) |
As the adjustments made to correct the errors in share-based compensation expense and income taxes were non-cash transactions, there was no effect to cash flows provided by or used in operating activities, investing activities, or financing activities.
Basis of Presentation
The accompanying consolidated financial statements have been prepared in conformity with accounting principles generally accepted in the United States of America (U.S. GAAP).
Basis of Consolidation
The consolidated financial statements include our accounts and those of our wholly and indirectly owned subsidiaries. We eliminate all intercompany balances and transactions, including intercompany profits, and unrealized gains and losses in consolidation.
Use of Estimates
The preparation of financial statements in conformity with U.S. GAAP requires us to make certain estimates and assumptions that affect the amounts reported in the consolidated financial statements and accompanying notes. We base our estimates on historical experience, current business factors, and various other assumptions that we believe are necessary to consider to form a basis for making judgments about the carrying values of assets and liabilities, the recorded amounts of revenue and expenses, and the disclosure of contingent assets and liabilities.
68
We are subject to uncertainties such as the impact of future events; economic, environmental, and political factors; and changes in our business environment; therefore, actual results could differ from these estimates. Accordingly, the accounting estimates used in the preparation of our consolidated financial statements will change as new events occur, as more experience is acquired, as additional information is obtained, and as our operating environment changes. We make changes in estimates when circumstances warrant. We reflect such changes in estimates and refinements in estimation methodologies in reported results of operations. If material, we disclose the effects of changes in estimates in the notes to the consolidated financial statements. Significant estimates and assumptions affect the following: the allocation of the purchase price associated with acquisitions; the carrying value of long-lived assets; the amortization period of long-lived assets; the carrying value, capitalization, and amortization of software and website development costs; the carrying value of goodwill and other intangible assets; the amortization period of intangible assets; the provision for income taxes and related deferred tax accounts; certain accrued expenses; contingencies, litigation, and related legal accruals; and the value attributed to employee stock options and other stock-based awards.
Operating Segments
We have two operating segments, which are also our reporting units: consumer and enterprise. These operating segments are components for which separate financial information is available and for which operating results are evaluated on a regular basis by the chief operating decision maker in deciding how to allocate resources and in assessing the performance of the segments.
In our consumer segment, we offer proactive identity theft protection services to our members on an annual or monthly subscription basis. In our enterprise segment, we offer fraud and risk solutions to our enterprise customers.
Revenue Recognition—Consumer Segment
We recognize revenue from our services provided in our consumer segment when it is probable that the economic benefits associated with the transactions will flow to us and the amount of revenue can be measured reliably. This is normally demonstrated when persuasive evidence of an arrangement exists, the fee is fixed or determinable, performance of service has been delivered, and collection is reasonably assured.
We offer services to consumers primarily on an annual or monthly subscription basis that may include free trial periods. We typically bill subscription fees to our members’ credit card. We recognize revenue for subscriptions ratably from the last of cash receipt, activation of a member’s account, or expiration of free trial periods through the termination of the subscription period.
We also provide consumer services for which the primary customer is a corporation or other entity that purchases identity theft protection services on behalf of its employees or customers. In such cases, we defer revenue for each member (employees or customers) until the member’s account has been activated. We then recognize revenue ratably over the remaining term of the individual subscription periods.
We use an external sales force, referred to as Certified Referring Partners (“CRP”), that earn commissions for sales to individual members and corporations. Because we are primarily responsible for fulfillment of the service obligation, determine service specifications, and have latitude in establishing prices for our service agreements, we record all sales made by our CRPs as revenue and the related commissions as a sales and marketing expense.
Revenue Recognition—Enterprise Segment
Customer contract terms within our enterprise segment are generally monthly, and revenue is recognized when all of the following criteria are met: persuasive evidence of an arrangement exists, delivery has occurred or services have been rendered, the price is fixed or determined, and collection is reasonably assured.
We recognize revenue from transaction-based services provided under hosted arrangements based on a negotiated fee per transaction. In some cases, we also negotiate a monthly minimum transaction fee, which may increase over the life of the contract. We bill and record transaction fees in excess of any of the monthly minimum fees as revenue in addition to the monthly minimum fees. In some instances, we receive an up-front, nonrefundable payment against which we apply the monthly minimum transaction fees. The up-front, nonrefundable payment is recorded as deferred revenue and recognized as revenue ratably over the usage period as we do not have sufficient evidence to accurately estimate a different pattern of usage. In other instances, the monthly minimum transaction fees are collected monthly, and we recognize revenue based on the negotiated monthly minimum transaction fees billed.
We record revenue from projects where we are engaged to deliver a report at the end of the analysis upon delivery and acceptance of the report.
Business Combinations
We account for business acquisitions using the acquisition method of accounting and record identifiable intangible assets separate from goodwill. We record intangible assets at their fair value based on estimates as of the date of acquisition.
69
We charge acquisition related costs that are not part of the consideration to general and administrative expense as they are incurred. These costs typically include transaction and integration costs, such as legal, accounting, and other professional fees.
Goodwill
Goodwill represents the excess of the purchase price of acquired businesses over the fair value assigned to the individual assets acquired and liabilities assumed. We do not amortize goodwill, but instead test goodwill for impairment at least annually and, if necessary, record any impairment. We evaluate goodwill for impairment in the fourth quarter of our fiscal year and whenever events and changes in circumstances indicate that it is more-likely-than-not that the fair value of a reporting unit that has goodwill is less than its carrying value.
We may first make a qualitative assessment of whether it is more-likely-than-not that a reporting unit’s fair value is less than its carrying value to determine whether it is necessary to perform the two-step goodwill impairment test. The qualitative impairment test includes considering various factors, including macroeconomic conditions, industry and market conditions, cost factors, a sustained share price or market capitalization decrease, and any reporting unit specific events. If it is determined through the qualitative assessment that a reporting unit’s fair value is more-likely-than-not greater than its carrying value, the two-step impairment test is not required. If the qualitative assessment indicates it is more-likely-than-not that a reporting unit’s fair value is not greater than its carrying value, we must perform the two-step impairment test. We may also elect to proceed directly to the two-step impairment test without considering such qualitative factors.
The first step in the two-step impairment test is the comparison of the fair value of a reporting unit with its carrying amount, including goodwill. We have two operating segments, a consumer segment and an enterprise segment, which are the same as our two reporting units. In accordance with the authoritative guidance over fair value measurements, we define the fair value of a reporting unit as the price that would be received to sell the unit as a whole in an orderly transaction between market participants at the measurement date. We primarily use the income approach methodology of valuation, which includes the discounted cash flow method, and the market approach methodology of valuation, which considers values of comparable businesses, to estimate the fair values of our reporting units. We do not believe that a cost approach is relevant to measuring the fair values of our reporting units.
Significant management judgment is required when estimating the fair values of our reporting units, including the forecasting of future operating results, the discount rates and expected future growth rates that we will use in the discounted cash flow method of valuation, and the selection of comparable businesses that we will use in the market approach. If the estimated fair value of the reporting unit exceeds the carrying value assigned to that unit, goodwill is not impaired and no further analysis is required.
If the carrying value assigned to a reporting unit exceeds its estimated fair value in the first step, then we perform the second step of the impairment test. In this step, we assign the fair value of the reporting unit calculated in step one to all of the assets and liabilities of that reporting unit, as if a market participant just acquired the reporting unit in a business combination. The excess of the fair value of the reporting unit determined in the first step of the impairment test over the total amount assigned to the assets and liabilities in the second step of the impairment test represents the implied fair value of goodwill. If the carrying value of a reporting unit’s goodwill exceeds the implied fair value of its goodwill, we would record an impairment loss equal to the difference. If there is no such excess, then all goodwill for that reporting unit is considered not to be impaired. No impairment was recorded to goodwill for the year ended December 31, 2013.
Intangible Assets, Net
In connection with our acquisitions of ID Analytics and Lemon, we recorded certain finite-lived intangible assets. We amortize the acquisition date fair value of these assets over the estimated useful lives of the assets.
Per Share Data
We compute basic earnings per share by dividing net income available (loss attributable) to common stockholders by the weighted-average number of common shares outstanding for the period. We determine net income available (loss attributable) to common stockholders by deducting the accretion on convertible redeemable preferred stock and the net income allocable to convertible redeemable preferred stock, determined under the two class method, from net income (loss). We compute diluted earnings per share giving effect to all potentially dilutive common stock equivalents, including share-based compensation, convertible redeemable preferred stock, warrants to acquire common stock, and warrants to acquire convertible redeemable preferred stock. We make adjustments to the diluted net income available (loss attributable) to common stockholders to reflect the reversal of gains on the change in the value of warrant liabilities and additional accretion on convertible redeemable preferred stock, assuming conversion of warrants to acquire convertible redeemable preferred stock at the beginning of the period. We offset these adjustments by reductions in the net income allocable to convertible redeemable preferred stockholders for those securities that were assumed to convert prior to the conversion in connection with our IPO. Those securities determined to be anti-dilutive as common stock equivalents are excluded from the calculation of diluted earnings per share; however, such securities continue to be included in the application of the two-class method to the extent applicable.
70
Concentrations of Credit Risk
In the normal course of business, we are exposed to credit risk. We believe our concentration of credit risk with respect to trade receivables is limited because of the large number of customers and customer dispersion across many different geographic and economic environments. We maintain an allowance for doubtful trade accounts receivable based upon factors surrounding the credit risk of specific clients, historical trends, and other information.
Cash and Cash Equivalents
Cash includes cash on hand and cash held with banks. Cash equivalents are short-term, highly liquid investments with original maturities of three months or less when acquired. Cash and cash equivalents are deposited in or managed by major financial institutions and at times exceed Federal Deposit Insurance Corporation insurance limits.
Cash and cash equivalents also include credit card and debit card receivables. The majority of payments due from financial intermediaries for credit card and debit card transactions process within 72 hours, except for transactions occurring on a Friday, which are generally processed the following Monday. Amounts due from financial intermediaries for these transactions classified as cash and cash equivalents totaled $1,623 and $2,356 as of December 31, 2013 and 2012, respectively.
Marketable Securities
We hold investments in marketable securities consisting of corporate debt securities, municipal debt securities, and certificates of deposit. We determine the appropriate classification of marketable securities at the time of purchase and reevaluate such determination at each balance sheet date. As of December 31, 2013, we classified all marketable securities as current as such investments are available to fund current operations. Based on our intentions regarding our marketable securities, all marketable securities are classified as available-for-sale and are carried at fair value with unrealized gains and losses recorded as a separate component of other comprehensive income, net of income taxes on the consolidated statements of comprehensive income (loss). Realized gains and losses and declines in fair value determined to be other-than-temporary are determined using the specific-identification method and are reflected as a component of other income (expense) in the consolidated statements of operations. We periodically review our marketable securities for other-than temporary declines in fair value and write down such marketable securities when an other-than-temporary decline has occurred. No such impairments of marketable securities have been recorded to date.
Allowance for Doubtful Accounts
We maintain an allowance for doubtful accounts to provide for uncollectible trade receivables. We base the allowance on historical collections, write-off experience, current economic trends, and changes in customer payment terms and other factors that may affect our ability to collect payments. As of December 31, 2013 and 2012, our allowance for doubtful accounts was $104 and $134, respectively.
Property and Equipment
We state property and equipment at cost, less accumulated depreciation, amortization, and any impairment in value. We assess long-lived assets, including our property and equipment, for impairment whenever events or changes in business circumstances arise that may indicate that the carrying amount of the long-lived assets may not be recoverable.
We compute depreciation and amortization using the straight-line method over the following estimated useful lives of the assets:
|
Leasehold improvements |
|
3 years or the remaining term of the lease, whichever is shorter |
|
Telecommunications, network and computing equipment |
|
3–5 years |
|
Computer software |
|
3 years |
|
Furniture, fixtures and office equipment |
|
3–5 years |
Debt Issuance Costs
We defer and amortize issuance costs, underwriting fees, and related expenses incurred in connection with the issuance of debt instruments using the effective interest rate method over the terms of the instruments. We charge unamortized debt issuance costs to interest expense when the related debt is extinguished.
71
Cost of Services
Cost of services consists primarily of the direct and contract labor costs, fulfillment costs, printing and postage fees, and remediation costs to fulfill our service agreements. Cost of services also includes rent expense, facilities support, quality assurance expenses, and depreciation and amortization of long-lived assets related to the operations of our service fulfillment centers. We also include sales incentives provided to our members in cost of services.
Technology and Development
Technology and development expenses consist primarily of personnel costs incurred in product development, maintenance and testing of our websites, developing solutions for new services, internal information systems and infrastructure, third-party development, and other internal-use software systems. Our development costs are primarily incurred in the United States and primarily devoted to enhancing our consumer and enterprise service offerings.
Share-Based Compensation
We measure share-based compensation cost at fair value, net of estimated forfeitures. We determine fair value at the grant date using the Black-Scholes option pricing model with compensation cost amortized on a straight-line basis over each award’s full vesting period, except for awards with performance conditions, which we recognize using the accelerated method. Because of the lack of sufficient historical data to calculate expected term of equity awards, we use the average of the vesting term and the contractual term to estimate the expected term for service-based options granted to employees. We estimate volatility by utilizing our historical share price and the historical volatility of comparable companies with publicly available share prices. We include share-based compensation expense in cost of services, sales and marketing, technology and development, and general and administrative expenses consistent with the respective employees’ department in the consolidated statement of operations. The fair value of restricted stock units and restricted stock is based on the value of our stock on the grant date. Compensation cost for restricted stock units is amortized on a straight-line basis over each award’s full vesting period. As discussed in the Explanatory Note to this Form 10-K/A and in Note 2 and Note 19, we are restating our audited consolidated financial statements and related disclosures for the year ended December 31, 2013 due to an error related to our calculation of the volatility assumption within the Black-Scholes option pricing model used to compute our share-based compensation expense.
Advertising Costs
We expense advertising costs as incurred, except for direct-response advertising costs. Direct-response advertising costs include telemarketing, web-based marketing, and direct mail costs related directly to membership solicitation. Advertising expense totaled approximately $86,165, $66,049, and $54,567 for the years ended December 31, 2013, 2012, and 2011, respectively.
Warrants for Shares of Convertible Redeemable Preferred Stock
Prior to our IPO, certain warrants could be exercised to purchase shares of our convertible redeemable preferred stock. We accounted for these warrants as liabilities and recognized them at their fair value. We adjusted the carrying value of such warrants to fair value at each balance sheet date, with the change in the fair value being recorded as a component of other income (expense). In connection with our IPO, such warrants were converted into warrants to purchase shares of common stock.
Income Taxes
We account for income taxes using the asset and liability method. We recognize deferred tax assets and liabilities for the future tax benefits and consequences attributable to temporary differences between the financial reporting basis of assets and liabilities and their related tax basis. We measure deferred tax assets and liabilities using the enacted tax rates expected to be in effect in the years in which those temporary differences are expected to be recovered or settled. We report any penalties and interest related to income taxes in income tax expense. We provide a valuation allowance for deferred tax assets when it is more likely than not that the related benefits will not be realized. The determination of recording or releasing tax valuation allowances is made pursuant to an assessment performed by management regarding the likelihood that we will generate future taxable income against which benefits of our deferred tax assets may or may not be realized. This assessment requires management to exercise significant judgment and make estimates with respect to our ability to generate revenues, gross profits, operating income, and taxable income in future periods.
We utilize a two-step approach to recognizing and measuring uncertain tax positions. The first step is to evaluate the tax position for recognition by determining if the weight of available evidence indicates it is more likely than not that the position will be sustained on audit, including resolution of related appeals or litigation processes. The second step is to measure the tax benefit as the largest amount that is more than 50% likely of being realized upon ultimate settlement. We consider many factors when evaluating and estimating our tax positions and tax benefits, which may require periodic adjustments and which may not accurately forecast actual outcomes.
72
Fair Value of Financial Instruments
The carrying values of cash and cash equivalents, restricted cash, trade and other receivables, and current liabilities approximate fair values, because of the short-term nature of these items. Prior to the conversion in connection with our IPO, we carried our convertible redeemable preferred stock warrant liability at fair value.
We determine the fair value of financial instruments using an exit price: the amount that would be received from the sale of an asset or paid to transfer a liability in an orderly transaction between market participants. As such, fair value is a market-based measurement that should be determined based on assumptions that market participants would use in pricing an asset or liability. We use a three-tier value hierarchy, which prioritizes the inputs used in measuring fair value as follows: Level 1 – observable inputs such as quoted prices in active markets; Level 2 – inputs other than the quoted prices in active markets that are observable, either directly or indirectly; and Level 3 – unobservable inputs for which there is little or no market data, which requires us to develop our own assumptions. On a recurring basis, we measure certain financial assets and liabilities at fair value, including our cash equivalents.
Recently Issued Accounting Standards
In February 2013, the Financial Accounting Standards Board (“FASB”) issued Accounting Standards Update (“ASU”) 2013-02, which supersedes and replaces the presentation requirements for reclassifications out of accumulated other comprehensive income in ASUs 2011-05 and 2011-12. The amendment requires that an entity must report the effect of significant reclassifications out of accumulated other comprehensive income on the respective line items in net income if the amount being reclassified is required under U.S. GAAP. For other amounts that are not required under U.S. GAAP to be reclassified in their entirety to net income in the same reporting period, an entity is required to cross-reference other disclosures required under U.S. GAAP that provide additional detail about those amounts. ASU 2013-02 was effective for fiscal years, and interim periods within those years, beginning on or after December 15, 2012. We adopted the amended standards beginning January 1, 2013. As there were no amounts reclassified out of other comprehensive income during the years ended December 31, 2013 or 2012, there was no impact on our financial position, results of operations, or cash flows.
In March 2013, the FASB issued ASU 2013-04, which provides guidance on the recognition, measurement, and disclosure of obligations resulting from joint and several liability arrangements for which the total amount of the obligation is fixed at the reporting date. The update requires an entity to measure obligations resulting from joint and several liability obligations for which the total amount of the obligation within the scope of the update is fixed at the reporting date, as the sum of the amount the reporting entity agreed to pay on the basis of its arrangements among its co-obligors and any additional amount the reporting entity expects to pay on behalf of its co-obligors. The update also requires an entity to disclose the nature and amount of the obligation as well as other information about those obligations. The amendments in ASU 2013-04 are effective for fiscal years, and interim periods within those years, beginning on or after December 15, 2013 and must be applied retrospectively. We do not expect the adoption of ASU 2013-04 in the first quarter of 2014 to have a material impact on our financial position, results of operations, or cash flows.
In July 2013, the FASB issued ASU 2013-11, which requires a reporting entity to present an unrecognized tax benefit as a liability in the financial statements separate from deferred tax assets if a net operating loss carryforward, a similar tax loss, or a tax credit carryforward is not available as of the reporting date to settle taxes that would result from the disallowance of the tax position or if a reporting entity does not intend to use the deferred tax asset for such purpose. The amendments in ASU 2013-11 are effective for fiscal years, and interim periods within those years, beginning on or after December 15, 2013. We do not expect the adoption of ASU 2013-11 to have a material impact on our consolidated financial statements.
3. Business Combinations
Acquisition of ID Analytics
In the first quarter of 2012, we acquired ID Analytics, a provider of fraud and risk solutions and a strategic technology partner of ours since 2009. The aggregate purchase price consisted of approximately $166,474 of cash paid at the closing (cash paid net of cash acquired was $157,430) and 1,586,778 shares of Series E-1 convertible redeemable preferred stock with a fair value of approximately $19,476 as of the acquisition date. We accounted for the acquisition using the acquisition method. Accordingly, we allocated the total purchase price to the tangible and identifiable intangible assets acquired and the net liabilities assumed based on their respective fair values on the acquisition date. As a result of the acquisition, we recorded goodwill in the amount of $129,428, of which $69,891 was assigned to our consumer segment and $59,537 was assigned to our enterprise segment, identifiable definite-lived intangible assets of $57,500, which was comprised of $4,000 related to trade name and trademarks, $33,000 related to technology, and $20,500 related to customer relationships, and net liabilities assumed of $978. The overall weighted-average life of the identifiable definite-lived intangible assets acquired was 7.6 years, which will be amortized over their respective useful lives. Our consolidated financial statements for the year ended December 31, 2012 include the results of operations of ID Analytics from the date of acquisition.
73
Acquisition of Lemon
On December 11, 2013, we acquired Lemon, a mobile wallet innovator. In connection with this acquisition, we launched our new LifeLock mobile application. The aggregate purchase price consisted of approximately $42,369 of cash paid at the closing (net of cash acquired of $3,315).
Our consolidated financial statements for the year ended December 31, 2013 include the results of operations of Lemon from the date of acquisition. The total purchase consideration has been preliminarily allocated to the assets acquired and liabilities assumed at their estimated fair values as of the date of acquisition, as determined by management and, with respect to identifiable intangible assets, by management with the assistance of a valuation provided by a third-party valuation firm. The excess of the purchase price over the amounts allocated to assets acquired and liabilities assumed has been recorded as goodwill in our consumer segment.
We accounted for this acquisition using the acquisition method in accordance with Accounting Standards Codification (“ASC”) 805, Business Combinations. Accordingly, we have allocated the purchase price of the acquired assets and liabilities based on their estimated fair values as of the acquisition date as summarized in the following table:
|
Net assets assumed |
|
$ |
3,184 |
|
|
Deferred tax assets, net - noncurrent |
|
|
8,706 |
|
|
Intangible assets acquired |
|
|
3,880 |
|
|
Goodwill |
|
|
29,914 |
|
|
Total purchase price consideration |
|
$ |
45,684 |
|
The following is a description of the allocation of the purchase price to the net assets acquired:
|
Cash |
|
$ |
3,315 |
|
|
Prepaid expenses and other current assets |
|
|
128 |
|
|
Total tangible assets acquired |
|
|
3,443 |
|
|
Accrued expenses |
|
|
(145 |
) |
|
Deferred revenue |
|
|
(114 |
) |
|
Total liabilities assumed |
|
|
(259 |
) |
|
Net assets assumed |
|
$ |
3,184 |
|
The following were the identified intangible assets acquired at their fair value and the respective estimated periods over which such assets will be amortized:
|
|
|
|
|
|
|
Weighted- |
|
|
|
|
|
|
|
|
|
Average |
|
|
|
|
|
|
|
|
|
Useful Life |
|
|
|
|
|
Amount |
|
|
(in years) |
|
||
|
Trade name and trademarks |
|
$ |
60 |
|
|
|
1.0 |
|
|
Customer relationships |
|
|
530 |
|
|
|
1.0 |
|
|
Technology |
|
|
3,290 |
|
|
|
7.0 |
|
|
|
|
$ |
3,880 |
|
|
|
|
|
The total weighted-average amortization period for the identifiable intangible assets acquired from Lemon is 6.0 years. We expect to recognize amortization expense over the next seven years.
The goodwill resulting from the acquisition of Lemon is not deductible for income tax purposes. The goodwill is primarily attributable to the assembled workforce and expanded market opportunity when integrating Lemon’s mobile application with our existing identity theft protection services.
In determining the purchase price allocation, we considered, among other factors, how a market participant would likely use the acquired assets and the historical and estimated future demand for Lemon’s services. The estimated fair value of intangible assets was based on the income approach. The income approach requires a projection of the cash flow that the asset is expected to generate in the future. The projected cash flow is discounted to its present value using a rate of return, or discount rate, which accounts for the time value of money and the degree of risk inherent in the asset. The expected future cash flow that is projected should include all of the economic benefits attributable to the asset, including the tax savings associated with the amortization of the intangible asset value over the tax life of the asset. The income approach may take the form of a “relief-from-royalty” methodology, a cost savings methodology, a “with and without” methodology, or excess earnings methodology, depending on the specific asset under consideration.
The “relief-from-royalty” method was used to value the trade names and trademarks and technology acquired from Lemon. The “relief-from-royalty” method estimates the cost savings that accrue to the owner of an intangible asset that would otherwise be required to pay royalties or license fees on revenues earned through the use of the asset. The royalty rate used is based on an analysis of empirical, market-derived royalty rates for guideline intangible assets. Typically, revenue is projected over the expected remaining
74
useful life of the intangible asset. The royalty rate is then applied to estimate the royalty savings. The key assumptions used in valuing the existing trade names and trademarks acquired were as follows: royalty rate of 1.5%, discount rate of 18.5%, tax rate of 39.3%, and an economic useful life of one year. The key assumptions used in valuing the technology acquired were as follows: royalty rate of 12.75%, discount rate of 18.5%, tax rate of 39.3%, and an economic life of seven years.
The customer relationships were valued using a form of the income approach utilizing the excess earnings method. Inherent in the excess earnings method is the recognition that, in most cases, all of the assets of the business, both tangible and intangible, contribute to the generation of the cash flow of the business and the net cash flows attributable to the subject asset must recognize the support of the other assets which contribute to the realization of the cash flows. The contributory asset charges are based on the fair value of the contributory assets and either pre-tax or after-tax cash flows are assessed charges representing “returns on” the contributory assets. A contributory asset charge for the use of the technology was assessed on pre-tax cash flows, while contributory asset charges for the use of the working capital, fixed assets, and assembled work force have been deducted from the after-tax cash flow in each year to determine the net future cash flow attributable to the relationships. This future cash flow was then discounted using an estimated required rate of return for the asset to determine the present value of the future cash flows attributable to the asset. The key assumptions used in valuing the customer relationships acquired were as follows: discount rate of 18.5%, tax rate of 39.3%, and estimated weighted-average economic life of one year.
Acquisition related costs recognized for the year ended December 31, 2013 included transaction costs of $1,068, which we have classified primarily in general and administrative expense in our consolidated statements of operations. Transaction costs included expenses such as legal, accounting, valuation, and other professional services.
For the year ended December 31, 2013, Lemon contributed immaterial revenue and net loss to our operating results.
Had the acquisition of Lemon occurred on January 1, 2012, our pro forma consolidated revenue for the year ended December 31, 2013 would have been $370,409 (unaudited), and our pro forma net income for the year ended December 31, 2013 would have been $48,966 (unaudited).
Had the acquisition of Lemon occurred on January 1, 2012, our pro forma consolidated revenue for the year ended December 31, 2012 would have been $276,623 (unaudited), and our pro forma net income for the year ended December 31, 2012 would have been $17,567 (unaudited).
4. Marketable Securities
The following is a summary of marketable securities designated as available-for-sale as of December 31, 2013:
|
|
|
|
|
|
|
Gross |
|
|
Gross |
|
|
|
|
|
||
|
|
|
Amortized |
|
|
Unrealized |
|
|
Unrealized |
|
|
Estimated |
|
||||
|
|
|
Cost |
|
|
Gains |
|
|
Losses |
|
|
Fair Value |
|
||||
|
Corporate bonds |
|
$ |
37,399 |
|
|
$ |
1 |
|
|
$ |
(29 |
) |
|
$ |
37,371 |
|
|
Municipal bonds |
|
|
10,820 |
|
|
|
2 |
|
|
|
(3 |
) |
|
|
10,819 |
|
|
Certificates of deposit |
|
|
498 |
|
|
|
- |
|
|
|
- |
|
|
|
498 |
|
|
Total marketable securities |
|
$ |
48,717 |
|
|
$ |
3 |
|
|
$ |
(32 |
) |
|
$ |
48,688 |
|
All marketable securities are classified as current regardless of contractual maturity dates because we consider such investments to represent cash available for current operations.
As of December 31, 2013, we did not consider any of our marketable securities to be other-than-temporarily impaired. When evaluating our investments for other-than-temporary impairment, we review factors such as the length of time and extent to which fair value has been below its cost basis, the financial condition of the issuer, our ability and intent to hold the security and whether it is more likely than not that we will be required to sell the investment before recovery of its cost basis.
The following is a summary of amortized cost and estimated fair value of marketable securities as of December 31, 2013, by maturity:
|
|
|
|
|
|
|
Gross |
|
|
Gross |
|
|
|
|
|
||
|
|
|
Amortized |
|
|
Unrealized |
|
|
Unrealized |
|
|
Estimated |
|
||||
|
|
|
Cost |
|
|
Gains |
|
|
Losses |
|
|
Fair Value |
|
||||
|
Due in one year or less |
|
$ |
47,398 |
|
|
$ |
3 |
|
|
$ |
(32 |
) |
|
$ |
47,369 |
|
|
Due after one year |
|
|
1,319 |
|
|
|
- |
|
|
|
- |
|
|
|
1,319 |
|
|
Total marketable securities |
|
$ |
48,717 |
|
|
$ |
3 |
|
|
$ |
(32 |
) |
|
$ |
48,688 |
|
We did not hold any marketable securities as of December 31, 2012.
75
5. Trade and Other Receivables
Trade and other receivables consisted of the following as of December 31:
|
|
|
2013 |
|
|
2012 |
|
||
|
|
|
|
|
|
|
|
|
|
|
Trade receivables |
|
$ |
5,796 |
|
|
$ |
6,125 |
|
|
Other receivables |
|
|
5,214 |
|
|
|
1,569 |
|
|
Less allowance for doubtful accounts |
|
|
(104 |
) |
|
|
(134 |
) |
|
|
|
$ |
10,906 |
|
|
$ |
7,560 |
|
6. Property and Equipment, Net
Property and equipment consisted of the following as of December 31:
|
|
|
2013 |
|
|
2012 |
|
||
|
Computer software |
|
$ |
12,318 |
|
|
$ |
9,003 |
|
|
Telecommunications, network and computing equipment |
|
|
12,923 |
|
|
|
8,039 |
|
|
Leasehold improvements |
|
|
4,223 |
|
|
|
4,140 |
|
|
Furniture, fixtures and office equipment |
|
|
2,980 |
|
|
|
2,859 |
|
|
|
|
|
32,444 |
|
|
|
24,041 |
|
|
Less accumulated depreciation and amortization |
|
|
(21,081 |
) |
|
|
(17,514 |
) |
|
|
|
|
11,363 |
|
|
|
6,527 |
|
|
Assets not yet placed in service |
|
|
5,141 |
|
|
|
3,174 |
|
|
|
|
$ |
16,504 |
|
|
$ |
9,701 |
|
Depreciation expense on property and equipment for the years ended December 2013, 2012, and 2011 was $4,887, $4,169, and $3,740, respectively.
7. Other Intangible Assets
Our acquisition-related intangible assets are as follows:
|
|
|
Gross |
|
|
|
|
|
|
Net |
|
||
|
|
|
Carrying |
|
|
Accumulated |
|
|
Carrying |
|
|||
|
|
|
Value |
|
|
Amortization |
|
|
Amount |
|
|||
|
|
|
|
|
|
|
|
|
|
|
|
|
|
|
Trade name and trademarks |
|
$ |
4,060 |
|
|
$ |
(1,439 |
) |
|
$ |
2,621 |
|
|
Technology |
|
|
36,290 |
|
|
|
(8,485 |
) |
|
|
27,805 |
|
|
Customer relationships |
|
|
21,030 |
|
|
|
(4,243 |
) |
|
|
16,787 |
|
|
|
|
$ |
61,380 |
|
|
$ |
(14,167 |
) |
|
$ |
47,213 |
|
Amortization expense for the years ended December 31, 2013, 2012, and 2011 was $7,909 and $6,258, and zero, respectively. Estimated future amortization of acquisition-related intangible asset for future periods is as follows:
|
Years Ending December 31, |
|
|
|
|
|
2014 |
|
$ |
8,899 |
|
|
2015 |
|
|
8,334 |
|
|
2016 |
|
|
8,334 |
|
|
2017 |
|
|
7,698 |
|
|
2018 |
|
|
7,534 |
|
|
Thereafter |
|
|
6,414 |
|
|
|
|
$ |
47,213 |
|
76
8. Accrued Expenses and Other Liabilities
Accrued expenses and other liabilities consisted of the following as of December 31:
|
|
|
2013 |
|
|
2012 |
|
||
|
Marketing, commissions and other services |
|
$ |
9,678 |
|
|
$ |
11,814 |
|
|
Employee salaries, wages, and benefits |
|
|
15,619 |
|
|
|
10,643 |
|
|
Sales, property and income taxes |
|
|
928 |
|
|
|
1,536 |
|
|
Consulting, contract labor and professional fees |
|
|
7,496 |
|
|
|
2,176 |
|
|
Other |
|
|
1,205 |
|
|
|
1,160 |
|
|
|
|
$ |
34,926 |
|
|
$ |
27,329 |
|
9. Financing Arrangements
Credit Agreement
On January 9, 2013, we refinanced our existing credit agreement and entered into a new credit agreement (the “Credit Agreement”) with Bank of America, N.A. as administrative agent, swing line lender and L/C issuer, Silicon Valley Bank as syndication agent, Merrill Lynch, Pierce, Fenner & Smith Incorporated as sole lead arranger and sole book manager, and the lenders from time to time party thereto. We refer to the Credit Agreement and related documents as the “Senior Credit Facility.” The Senior Credit Facility provides for an $85,000 revolving line of credit, which we can increase to $110,000 subject to the conditions set forth in the Credit Agreement. The revolving line of credit also includes a letter of credit subfacility of $10,000 and a swing line loan subfacility of $5,000. The Senior Credit Facility has a maturity date of January 9, 2018. As of December 31, 2013, we had no outstanding debt under our Senior Credit Facility. We paid unused commitment fees of $267 for the year ended December 31, 2013, which is included in interest expense in the consolidated statements of operations.
Borrowings under the Senior Credit Facility bear interest at a per annum rate equal to, at our option, either (a) a base rate equal to the highest of (i) the Federal Funds Rate plus 0.50%, (ii) the rate of interest in effect for such day as publicly announced from time to time by Bank of America as its “prime rate,” and (iii) the eurodollar rate for base rate loans plus 1.00%, plus an applicable rate ranging from 0.50% to 1.25%, or (b) the eurodollar rate for eurodollar rate loans plus an applicable rate ranging from 1.50% to 2.25%. The initial applicable rate is 0.50% for base rate loans and 1.50% for eurodollar rate loans, subject to adjustment from time to time based upon our achievement of a specified consolidated leverage ratio.
In addition to paying interest on the outstanding principal under the Senior Credit Facility, we are also required to pay a commitment fee to the administrative agent at a rate per annum equal to the product of (a) an applicable rate ranging from 0.25% to 0.50% multiplied by (b) the actual daily amount by which the aggregate revolving commitments exceed the sum of (1) the outstanding amount of revolving borrowings, and (2) the outstanding amount of letter of credit obligations. The initial applicable rate is 0.25%, subject to adjustment from time to time based upon our achievement of a specified consolidated leverage ratio.
We also will pay a letter of credit fee to the administrative agent for the account of each lender in accordance with its applicable percentage of a letter of credit for each letter of credit, which fee will be equal to the applicable rate then in effect, multiplied by the daily maximum amount available to be drawn under the letter of credit. The initial applicable rate for the letter of credit is 1.50%, subject to adjustment from time to time based upon our achievement of a specified consolidated leverage ratio.
We have the right to prepay our borrowings under the Senior Credit Facility from time to time in whole or in part, without premium or penalty, subject to the procedures set forth in the Senior Credit Facility.
All of our obligations under the Senior Credit Facility are unconditionally and jointly and severally guaranteed by each of our existing and future, direct or indirect, domestic subsidiaries, subject to certain exceptions. In addition, all of our obligations under the Senior Credit Facility, and the guarantees of those obligations, are secured, subject to permitted liens and certain other exceptions, by a first-priority lien on our and our subsidiaries’ tangible and intangible personal property, including a pledge of all of the capital stock of our subsidiaries.
The Senior Credit Facility requires us to maintain certain financial covenants. In addition, the Senior Credit Facility requires us to maintain all material proprietary databases and software with a third-party escrow agent in accordance with an escrow agreement that we reaffirmed in connection with the Senior Credit Facility. The Senior Credit Facility also contains certain affirmative and negative covenants limiting, among other things, additional liens and indebtedness, investments and distributions, mergers and acquisitions, liquidations, dissolutions, sales of assets, prepayments and modification of debt instruments, transactions with affiliates, and other matters customarily restricted in such agreements. The Senior Credit Facility also contains customary events of default, including payment defaults, breaches of representations and warranties, covenant defaults, cross defaults to other contractual agreements, events of bankruptcy and insolvency, and a change of control. As of December 31, 2013, we were in compliance with all financial covenants under the Senior Credit Facility.
77
Prior Credit Agreement
On February 7, 2012, we entered into a $70,000 credit agreement (“prior credit agreement”), which we amended on March 14, 2012, April 30, 2012, and May 29, 2012. The prior credit agreement consisted of a term loan of $68,000 and a revolving line of credit of $2,000. The prior credit agreement had a maturity date of February 7, 2016.
The outstanding balance under the term loan carried an interest rate ranging from LIBOR plus 3.75% to 4.75% depending on our consolidated leverage ratio. The outstanding balance under the line of credit bore an interest rate ranging from LIBOR to LIBOR plus 0.125% depending on our consolidated leverage ratio.
On October 12, 2012, we repaid the outstanding balance of the term loan with proceeds from our IPO. Amortization of debt issuance costs for the year ended December 31, 2012 totaled $1,760, including $1,443 of debt issuance costs written off at the date of repayment, and is included in interest expense in the accompanying consolidated statements of operations.
The prior credit agreement contained certain covenants. The covenants included, among others, restrictions with respect to payment of cash dividends, mergers or consolidations, changes in nature of business, disposal of assets, and obtaining additional loans. The prior credit agreement also required us to comply with certain financial covenants.
Letters of Credit
During 2012, we cancelled three standby letters of credit and replaced them with $1,300 in letters of credit issued against the $2,000 revolving line of credit provided under the prior credit agreement. The restrictions on the cash used to fully collateralize the standby letters of credit were released in July 2012. In August 2013, a letter of credit in the amount of $1,200 was released by the counterparty in connection with the execution of the amendment to our office lease with respect to our headquarters. As such, we had an outstanding letter of credit in the amount of $100 as of December 31, 2013.
10. Operating Leases
We have a number of lease agreements covering office space and certain equipment that we account for as operating leases. A majority of the lease agreements for office space have rent escalations that increase monthly rent payments over the lease terms and provide for a renewal option under negotiated terms and conditions upon expiration. We record rental expense on a straight-line basis over the base, non-cancelable lease terms. We recognize any difference between the calculated expense and amount actually paid as accrued rent. We reflect accrued rent as a current or non-current liability, depending on its expected date of reversal.
Rent expense incurred under operating leases for the years ended December 31, 2013, 2012, and 2011 was $3,546, $2,758, and $1,764, respectively.
Associated with operating leases, we have received tenant improvement allowances from lessors. We record the value of these improvements as fixed assets when acquired and amortize the assets over the term of the lease. We record an offsetting obligation as deferred rent and amortize it as a reduction to lease expense on a straight-line basis over the lease term.
The following summarizes the future minimum lease payments for outstanding operating lease agreements as of December 31, 2013:
|
2014 |
|
$ |
3,276 |
|
|
2015 |
|
|
4,922 |
|
|
2016 |
|
|
5,112 |
|
|
2017 |
|
|
4,919 |
|
|
2018 |
|
|
3,591 |
|
|
Thereafter |
|
|
18,743 |
|
|
|
|
$ |
40,563 |
|
11. Stockholders’ Equity
Common Stock
We have authorized 300,000,000 shares of common stock, with a par value of $0.001 per share. As of December 31, 2013, we had 91,441,771 shares of common stock outstanding.
Holders of our common stock are entitled to one vote for each share on all matters submitted to a vote of the stockholders, including the election of directors. Stockholders do not have cumulative voting rights in the election of directors. Accordingly, holders of a majority of the voting shares are able to elect all of the directors.
78
We issue stock-based awards to our employees in the form of stock options, restricted stock units, and restricted stock. We also have an employee stock purchase plan.
Convertible Redeemable Preferred Stock
On October 9, 2012, in connection with the closing of our IPO, our Series B, C, D, and E-1 preferred shares automatically converted on a 1 for 1 basis into 24,208,738 shares of common stock; our Series A preferred shares automatically converted on a 1 for 1.03 basis into 6,617,647 shares of common stock; and our Series E and E-2 preferred shares converted on a 1 for 1.49 basis into 20,494,052 shares of our common stock.
On March 14, 2012, we issued the following convertible redeemable preferred stock:
|
|
|
Issue Date |
|
Gross |
|
|
Shares |
|
||
|
Series E Convertible Redeemable Preferred Stock |
|
March 14, 2012 |
|
$ |
86,843 |
|
|
|
11,486,999 |
|
|
Series E-1 Convertible Redeemable Preferred Stock |
|
March 14, 2012 |
|
|
11,542 |
|
|
|
1,586,778 |
(1) |
|
Series E-2 Convertible Redeemable Preferred Stock |
|
March 14, 2012 |
|
|
17,275 |
|
|
|
2,284,960 |
|
|
(1) |
All shares were issued as purchase consideration for ID Analytics. |
In conjunction with the issuance of the Series E, E-1, and E-2 convertible redeemable preferred stock, we amended our Certificate of Incorporation to delay the redemption date of the Series A, B, C, and D convertible redeemable preferred stock from November 15, 2011 to six months after the credit agreement maturity date, or six months after all obligations under the credit agreement have been repaid in full and the agreement terminated. The amendment of the term of the equity instruments was evaluated to determine whether it should be considered a modification or an extinguishment. We evaluated the fair value of the instruments immediately after the amendment, and determined that the fair value was not significantly different than the fair value immediately before the amendment. Additionally, we evaluated the qualitative aspects of the amendment. Based upon these evaluations, we determined the amendment to be a modification.
Prior to the conversion to common stock at the closing of our IPO, the convertible redeemable preferred stock was recorded outside of equity because the redemption feature was not solely within our control. Through November 15, 2011, the original date on which the redemption provision became exercisable by the holders of convertible redeemable preferred stock, the recorded value of the Series A, B, C, and D convertible redeemable preferred stock was accreted to the full redemption amount using the effective interest method. The Series E, E-1, and E-2 convertible redeemable preferred stock were being accreted to the full redemption amount using the effective interest method, until conversion to common stock on the closing of our IPO. This increase was recorded as a preferred stock dividend.
We evaluated each of our series of convertible preferred stock and determined that each should be considered an “equity host” and not a “debt host.” This evaluation was necessary to determine if any embedded features required bifurcation and, therefore, would be required to be accounted for separately as a derivative liability. Our analysis followed the “whole instrument approach,” which compares an individual feature against the entire preferred stock instrument that includes that feature. Our analysis was based on a consideration of the economic characteristics and risks of the preferred stock and, more specifically, evaluated all of the stated and implied substantive terms and features of such stock, including (1) whether the preferred stock included redemption features; (2) how and when any redemption features could be exercised; (3) whether the holders of preferred stock were entitled to dividends; (4) the voting rights of the preferred stock; and (5) the existence and nature of any conversion rights. As a result of our determination that each series of the preferred stock was an “equity host,” we determined that the embedded conversion options did not require bifurcation as derivative liabilities.
We determined the adjustment to the ratio at which the Series E and E-2 convertible redeemable preferred stock would automatically convert into shares of common stock did not require bifurcation as derivative liabilities as it was clearly and closely related to the equity host instrument; however, these features represented a potential contingent beneficial conversion feature, which would be triggered in the event the conversion ratio multiplied by the fair value of the common stock at March 14, 2012 (the issuance date of the Series E and E-2 convertible redeemable preferred stock) exceeds the allocated value per share of the Series E and E-2 convertible redeemable preferred stock. As a result of the IPO price of $9.00 per share, we recognized a beneficial conversion feature related to the Series E and Series E-2 convertible redeemable preferred stock of $2,452, which was treated as a deemed dividend.
We determined the cash settlement term of the Series E-1 convertible redeemable preferred stock required bifurcation and separate accounting as an embedded derivative. The fair value of this embedded feature was determined to be $7,934 at the issuance date of March 14, 2012, which was bifurcated from the issuance value of the Series E-1 convertible redeemable preferred stock and presented in long term liabilities. The embedded derivative was settled for $10,719 in connection with the closing of our IPO. Accordingly, we have recorded a realized loss of $2,785 with respect to the embedded derivative in the statement of operations.
We have authorized 10,000,000 shares of preferred stock, with a par value of $0.001 per share. As of December 31, 2013 and 2012, no shares of preferred stock were issued and outstanding.
79
Stock Warrants
As of December 31, 2013, we had the following warrants to purchase common stock outstanding:
|
Expiration Date |
|
Shares |
|
|
Exercise |
|
||
|
October 3, 2016 |
|
|
2,334,044 |
|
|
|
0.70 |
|
|
December 19, 2014 |
|
|
166,666 |
|
|
|
4.50 |
|
On October 9, 2012, warrants to purchase Series E and E-2 convertible redeemable preferred stock were terminated in connection with the closing of our IPO and we recognized a gain of $4,372 in other income (expense).
12. Share-Based Compensation (Restated)
Stock Plans
In November 2006, we adopted the LifeLock, Inc. 2006 Incentive Compensation Plan (the “2006 Plan”). We reserved 18,426,332 shares of common stock under the 2006 Plan. The 2006 Plan provided for awards in the form of restricted shares, stock units, stock options (which could constitute incentive stock options or non-statutory stock options), and stock appreciation rights. Generally, stock options awarded under the 2006 Plan had a ten-year term and typically vested over a period of four years, with 25% of the grant vesting on the first anniversary of the date of grant and the remainder vesting monthly over the remaining vesting period.
In October 2012, we adopted the LifeLock, Inc. 2012 Incentive Compensation Plan (the “2012 Plan”), which superseded the 2006 Plan. The total remaining shares of 4,902,708 available for issuance under the 2006 Plan were added to the number of shares reserved under the 2012 Plan, and no further awards will be granted under the 2006 Plan. In addition, we reserved an additional 4,200,000 shares of common stock under the 2012 Plan. The 2012 Plan provides for awards in the form of stock options (which may constitute incentive stock options or non-statutory stock options), stock appreciation rights, performance-based stock awards, restricted stock units, and restricted shares. Generally, stock options awarded under the 2012 Plan have a ten-year term and typically vest over a period of four years, with 25% of the grant vesting on the first anniversary of the date of grant and the remainder vesting monthly over the remaining vesting period.
The total amount of compensation cost for stock-based payment arrangements recognized in the consolidated statements of operations related to stock options, restricted stock units, and performance stock units was $11,111 (restated), $6,758, and $3,285 for the years ended December 31, 2013, 2012, and 2011, respectively.
As of December 31, 2013, a total of $38,399 (restated) of unrecognized compensation costs related to unvested stock options and unvested restricted stock units issued are expected to be recognized over the remaining weighted-average period of 3.2 years.
Employee Stock Purchase Plan
In October 2012, we adopted an employee stock purchase plan (the “ESPP”). The ESPP allows substantially all full-time and part-time employees to acquire shares of our common stock through payroll deductions over six month offering periods. The per share purchase price is equal to the lesser of 85% of the fair market value of a share of our common stock on the grant date or 85% of the fair market value of a share of our common stock on the last day of the offering period. Purchases are limited to 15% of an employee’s salary, up to a maximum of $25,000 of stock value per calendar year. We are authorized to grant up to 2,000,000 shares of our common stock under the ESPP. As of December 31, 2013, 107,074 shares of common stock had been issued under the ESPP. We recognized expense with respect to the ESPP of $338 and $76 for the years ended December 31, 2013 and 2012, respectively.
80
Stock Options
The following table summarizes information on the activity of stock options, including performance-based options, under the 2006 and 2012 Plans for the years ended December 31:
|
|
|
2013 |
|
|
2012 |
|
|
2011 |
|
||||||||||||
|
|
|
Shares |
|
Weighted Average Exercise Price Per Share |
|
|
Shares |
|
Weighted Average Exercise Price Per Share |
|
|
Shares |
|
Weighted Average Exercise Price Per Share |
|
||||||
|
Outstanding at beginning of year |
|
|
12,273,815 |
|
$ |
4.24 |
|
|
|
8,660,771 |
|
$ |
3.07 |
|
|
|
9,053,803 |
|
$ |
2.88 |
|
|
Granted |
|
|
5,494,969 |
|
|
11.57 |
|
|
|
5,127,486 |
|
|
6.19 |
|
|
|
1,477,013 |
|
|
4.26 |
|
|
Exercised |
|
|
(4,489,459 |
) |
|
3.27 |
|
|
|
(306,819 |
) |
|
2.39 |
|
|
|
(856,207 |
) |
|
2.05 |
|
|
Expired |
|
|
(33,951 |
) |
|
3.22 |
|
|
|
(357,482 |
) |
|
3.70 |
|
|
|
(466,852 |
) |
|
4.41 |
|
|
Forfeited |
|
|
(1,861,123 |
) |
|
7.40 |
|
|
|
(850,141 |
) |
|
4.91 |
|
|
|
(546,986 |
) |
|
3.61 |
|
|
Outstanding at end of year |
|
|
11,384,251 |
|
$ |
7.62 |
|
|
|
12,273,815 |
|
$ |
4.22 |
|
|
|
8,660,771 |
|
$ |
3.07 |
|
|
Exercisable at end of year |
|
|
4,235,609 |
|
$ |
4.39 |
|
|
|
6,379,166 |
|
$ |
2.98 |
|
|
|
5,113,662 |
|
$ |
2.78 |
|
The following table summarizes additional information about stock options, including performance-based options, outstanding and exercisable as of December 31, 2013:
|
|
|
Options Outstanding |
|
|
Options Exercisable |
|
|||||||||||
|
Range of Exercise Prices |
|
Shares Under Option |
|
Weighted- Average Remaining Contractual Life |
|
Weighted- Average Exercise Price Per Share |
|
|
Shares Under Option |
|
Weighted- Average Exercise Price Per Share |
|
|||||
|
$0.01 - $3.50 |
|
|
2,243,070 |
|
|
4.96 |
|
$ |
2.43 |
|
|
|
2,137,953 |
|
$ |
2.43 |
|
|
$3.51 - $7.00 |
|
|
3,250,734 |
|
|
7.54 |
|
|
4.85 |
|
|
|
1,401,826 |
|
|
4.62 |
|
|
$7.01 - $10.50 |
|
|
2,055,167 |
|
|
8.83 |
|
|
9.21 |
|
|
|
344,271 |
|
|
8.78 |
|
|
$10.51 - $14.00 |
|
|
3,264,580 |
|
|
9.34 |
|
|
11.38 |
|
|
|
351,559 |
|
|
11.08 |
|
|
$14.01 - $17.50 |
|
|
570,700 |
|
|
9.84 |
|
|
15.55 |
|
|
|
- |
|
|
- |
|
|
|
|
|
11,384,251 |
|
|
|
|
|
|
|
|
|
4,235,609 |
|
|
|
|
The weighted-average fair value of our outstanding stock options was $4.09 (restated), $2.57, and $1.29, for the years ended December 31, 2013, 2012, and 2011, respectively. Such amounts were estimated using the Black-Scholes option pricing model with the following weighted-average assumptions at December 31:
|
|
|
2013 (Restated) |
|
2012 |
|
2011 |
|
|||
|
Expected volatility |
|
|
49.1% |
|
|
94.6% |
|
|
60.0% |
|
|
Expected dividend yield |
|
|
0.0% |
|
|
0.0% |
|
|
0.0% |
|
|
Risk-free interest rate |
|
|
1.3% |
|
|
1.2% |
|
|
2.0% |
|
|
Expected term (years) |
|
6.05 |
|
6.15 |
|
6.11 |
|
|||
We derived the risk-free interest rate assumption from the U.S. Treasury’s rates for U.S. Treasury zero-coupon bonds with maturities similar to those of the expected term of the awards being valued. We based the assumed dividend yield on our expectation of not paying dividends in the foreseeable future. We estimated forfeitures at the time of grant and revised this estimate, if necessary, in subsequent periods if actual forfeitures differed from those estimates.
The weighted-average fair value of the options granted in the years ended December 31, 2013, 2012, and 2011 was $5.72 (restated), $4.74, and $2.43, respectively. The total intrinsic value of options exercised in 2013, 2012, and 2011 was $41,793, $1,472, and $2,230, respectively. As of December 31, 2013, the total intrinsic value of outstanding and exercisable stock options was $99,204 and $50,916, respectively.
81
Restricted Stock Units
The following table summarizes unvested restricted stock units activity under the 2012 Plan for the years ended December 31, 2012, and 2013:
|
|
|
Restricted Stock Units |
|
Weighted - Average Grant Date Fair Value (per share) |
|
||
|
Unvested at December 31, 2011 |
|
|
- |
|
$ |
- |
|
|
Granted |
|
|
276,250 |
|
|
9.00 |
|
|
Vested |
|
|
(8,750 |
) |
|
9.00 |
|
|
Forfeited |
|
|
- |
|
|
- |
|
|
Unvested at December 31, 2012 |
|
|
267,500 |
|
$ |
9.00 |
|
|
Granted |
|
|
438,879 |
|
|
13.90 |
|
|
Vested |
|
|
(128,136 |
) |
|
9.34 |
|
|
Forfeited |
|
|
- |
|
|
- |
|
|
Unvested at December 31, 2013 |
|
|
578,243 |
|
$ |
12.65 |
|
There were no restricted stock units granted prior to the year ended December 31, 2012.
13. Employee Benefits
In 2008, we initiated a 401(k) retirement plan, which is a defined contribution retirement plan, for eligible employees. Employees are eligible to participate on the first day of service. Under the terms of the plan, employees are entitled to contribute from 1% to 100% of their total compensation, within limitations established by the Internal Revenue Code. We match 100% of the first 6% of each employee’s contribution and may also contribute additional amounts at our discretion, all subject to immediate vesting. The cost of employer contributions to the plan was $2,488, $1,908, and $1,624, for the years ended December 31, 2013, 2012, and 2011, respectively.
14. Fair Value Measurements
As of December 31, 2013 and December 31, 2012, the fair value of our financial assets was as follows:
|
|
|
Level 1 |
|
|
Level 2 |
|
|
Level 3 |
|
|
Total |
|
||||
|
December 31, 2013 |
|
|
|
|
|
|
|
|
|
|
|
|
|
|
|
|
|
Assets: |
|
|
|
|
|
|
|
|
|
|
|
|
|
|
|
|
|
Commercial paper (1) |
|
$ |
- |
|
|
$ |
45,110 |
|
|
$ |
- |
|
|
$ |
45,110 |
|
|
Money market funds (1) |
|
|
911 |
|
|
|
- |
|
|
|
- |
|
|
|
911 |
|
|
Corporate bonds (2) |
|
|
- |
|
|
|
37,371 |
|
|
|
- |
|
|
|
37,371 |
|
|
Municipal bonds (2) |
|
|
- |
|
|
|
10,819 |
|
|
|
- |
|
|
|
10,819 |
|
|
Certificates of deposit (2) |
|
|
- |
|
|
|
498 |
|
|
|
- |
|
|
|
498 |
|
|
Total assets measured at fair value |
|
$ |
911 |
|
|
$ |
93,798 |
|
|
$ |
- |
|
|
$ |
94,709 |
|
|
|
|
|
|
|
|
|
|
|
|
|
|
|
|
|
|
|
|
December 31, 2012 |
|
|
|
|
|
|
|
|
|
|
|
|
|
|
|
|
|
Assets: |
|
|
|
|
|
|
|
|
|
|
|
|
|
|
|
|
|
Commercial paper (1) |
|
$ |
- |
|
|
$ |
35,023 |
|
|
$ |
- |
|
|
$ |
35,023 |
|
|
Total assets measured at fair value |
|
$ |
- |
|
|
$ |
35,023 |
|
|
$ |
- |
|
|
$ |
35,023 |
|
|
(1) |
Classified in cash and cash equivalents |
|
(2) |
Classified in marketable securities |
82
15. Net Income (Loss) Per Share (Restated)
We compute basic net loss per share by dividing net loss less accretion on convertible redeemable preferred stock by the weighted-average number of common shares outstanding for the period. We compute diluted net loss per share giving effect to all potential dilutive common stock, including employee stock options, convertible redeemable preferred stock, warrants to acquire common stock, and warrants to acquire convertible redeemable preferred stock.
The following table sets forth the computation of basic and diluted net income available (loss attributable) per share attributable to common stockholders for the years ended December 31:
|
|
|
2013 (Restated) |
|
|
2012 |
|
|
2011 |
|
|||
|
Net income (loss) |
|
$ |
54,455 |
|
|
$ |
23,503 |
|
|
$ |
(4,257 |
) |
|
Less: |
|
|
|
|
|
|
|
|
|
|
|
|
|
Accretion of convertible redeemable preferred |
|
|
|
|
|
|
|
|
|
|
|
|
|
stock redemption premium |
|
|
- |
|
|
|
(9,378 |
) |
|
|
(18,926 |
) |
|
Beneficial conversion feature on convertible |
|
|
|
|
|
|
|
|
|
|
|
|
|
redeemable preferred stock |
|
|
- |
|
|
|
(2,452 |
) |
|
|
- |
|
|
Net income allocable to convertible redeemable |
|
|
|
|
|
|
|
|
|
|
|
|
|
preferred stockholders |
|
|
- |
|
|
|
(5,504 |
) |
|
|
- |
|
|
Net income available (loss attributable) to common |
|
|
|
|
|
|
|
|
|
|
|
|
|
stockholders |
|
|
54,455 |
|
|
|
6,169 |
|
|
|
(23,183 |
) |
|
Less: |
|
|
|
|
|
|
|
|
|
|
|
|
|
Change in fair value of warrant liabilities |
|
|
- |
|
|
|
(4,382 |
) |
|
|
- |
|
|
Accretion of convertible redeemable preferred |
|
|
|
|
|
|
|
|
|
|
|
|
|
stock redemption premium for shares assumed |
|
|
|
|
|
|
|
|
|
|
|
|
|
issued in exercise of warrants |
|
|
- |
|
|
|
(898 |
) |
|
|
- |
|
|
Plus: |
|
|
|
|
|
|
|
|
|
|
|
|
|
Net income allocable to convertible redeemable |
|
|
|
|
|
|
|
|
|
|
|
|
|
preferred stockholders |
|
|
- |
|
|
|
4,444 |
|
|
|
- |
|
|
Diluted net income available (loss attributable) |
|
|
|
|
|
|
|
|
|
|
|
|
|
to common stockholders |
|
$ |
54,455 |
|
|
$ |
5,333 |
|
|
$ |
(23,183 |
) |
|
|
|
|
|
|
|
|
|
|
|
|
|
|
|
Denominator (basic): |
|
|
|
|
|
|
|
|
|
|
|
|
|
Weighted average common shares outstanding |
|
|
88,635,832 |
|
|
|
35,081,863 |
|
|
|
18,725,305 |
|
|
Denominator (diluted): |
|
|
|
|
|
|
|
|
|
|
|
|
|
Weighted average common shares outstanding |
|
|
88,635,832 |
|
|
|
35,081,863 |
|
|
|
18,725,305 |
|
|
Dilutive stock options and awards outstanding |
|
|
5,092,490 |
|
|
|
4,088,101 |
|
|
|
- |
|
|
Weighted average common shares from |
|
|
|
|
|
|
|
|
|
|
|
|
|
preferred stock |
|
|
- |
|
|
|
22,528,878 |
|
|
|
- |
|
|
Weighted average common shares from warrants |
|
|
2,318,422 |
|
|
|
491,860 |
|
|
|
- |
|
|
Net weighted average common shares outstanding |
|
|
96,046,744 |
|
|
|
62,190,702 |
|
|
|
18,725,305 |
|
|
|
|
|
|
|
|
|
|
|
|
|
|
|
|
Net income available (loss attributable) per share to |
|
|
|
|
|
|
|
|
|
|
|
|
|
common stockholders: |
|
|
|
|
|
|
|
|
|
|
|
|
|
Basic |
|
$ |
0.61 |
|
|
$ |
0.18 |
|
|
$ |
(1.24 |
) |
|
Diluted |
|
$ |
0.57 |
|
|
$ |
0.09 |
|
|
$ |
(1.24 |
) |
In 2013, 2012, and 2011, potentially dilutive securities were not included in the calculation of diluted loss per share, as their impact would be anti-dilutive.
83
The following weighted-average number of outstanding employee stock options, restricted stock units, warrants to purchase common and convertible redeemable preferred stock, and convertible redeemable preferred stock were excluded from the computation of diluted net loss per share for the years ended December 31:
|
|
|
2013 (Restated) |
|
|
2012 |
|
|
2011 |
|
|||
|
Stock options outstanding |
|
|
4,183,000 |
|
|
|
- |
|
|
|
2,551,074 |
|
|
Restricted stock units |
|
|
45,673 |
|
|
|
- |
|
|
|
- |
|
|
Common equivalent shares from stock warrants |
|
|
- |
|
|
|
3,585,996 |
|
|
|
2,727,702 |
|
|
Common shares from convertible redeemable |
|
|
|
|
|
|
|
|
|
|
|
|
|
preferred stock |
|
|
- |
|
|
|
8,770,427 |
|
|
|
29,239,607 |
|
|
|
|
|
4,228,673 |
|
|
|
12,356,423 |
|
|
|
34,518,383 |
|
16. Income Taxes (Restated)
We have deferred tax assets and liabilities that reflect the net tax effects of temporary differences between the carrying amounts of assets and liabilities for financial reporting purposes and the amounts used for income tax purposes. In assessing the realizability of deferred tax assets, we consider whether it is more likely than not that some portion or all of the deferred tax assets will be realized. For the year ended December 31, 2012, we recorded a valuation allowance on our net deferred tax asset as prior to 2012, we had recorded operating losses. As a result of operating income generated in 2012 and 2013, management has concluded that our deferred tax assets with the exception of certain state net operating losses that are set to expire in 2014 and 2015 will be realized. Realization of our deferred tax assets, net of liabilities, depends upon the achievement of projected future taxable income. As a result of the 2013 operating income and our change in judgment regarding the realization of our deferred tax assets, our valuation allowance decreased approximately $47,917 in the year ended December 31, 2013. During the years ended December 31, 2012 and 2011, our valuation allowance decreased $12,418 and $974, respectively. The decrease in the valuation allowance during 2012 was principally attributable to the generation of operating profits and net deferred tax liabilities established in connection with the acquisition of ID Analytics.
The components of income tax provision were as follows at December 31:
|
|
|
|
2013 (Restated) |
|
|
|
2012 |
|
|
|
2011 |
|
|
Current: |
|
|
|
|
|
|
|
|
|
|
|
|
|
U.S. federal |
|
$ |
30 |
|
|
$ |
388 |
|
|
$ |
36 |
|
|
U.S. state and local taxes |
|
|
58 |
|
|
|
67 |
|
|
|
178 |
|
|
Total current |
|
|
88 |
|
|
|
455 |
|
|
|
214 |
|
|
|
|
|
|
|
|
|
|
|
|
|
|
|
|
Deferred: |
|
|
|
|
|
|
|
|
|
|
|
|
|
U.S. federal |
|
|
(35,672 |
) |
|
|
(11,877 |
) |
|
|
- |
|
|
U.S. state and local taxes |
|
|
(1,877 |
) |
|
|
(2,308 |
) |
|
|
- |
|
|
Foreign |
|
|
(63 |
) |
|
|
|
|
|
|
|
|
|
Total deferred |
|
|
(37,612 |
) |
|
|
(14,185 |
) |
|
|
- |
|
|
Total income tax (benefit) expense |
|
$ |
(37,524 |
) |
|
$ |
(13,730 |
) |
|
$ |
214 |
|
84
A reconciliation of income tax computed at the U.S. statutory rate to the effective income tax rate is as follows at December 31:
|
|
|
|
2013 (Restated) |
|
|
|
2012 |
|
|
|
2011 |
|
|
Statutory federal income tax rate |
|
|
35.0 |
% |
|
|
35.0 |
% |
|
|
34.0 |
% |
|
State tax expense, net of federal benefit |
|
|
3.7 |
% |
|
|
6.1 |
% |
|
|
-4.5 |
% |
|
Nondeductible expense related to stock warrants |
|
|
0.0 |
% |
|
|
-11.2 |
% |
|
|
-72.8 |
% |
|
Nondeductible expense related to embedded derivative |
|
|
0.0 |
% |
|
|
10.0 |
% |
|
|
0.0 |
% |
|
Other nondeductible expenses |
|
|
3.4 |
% |
|
|
2.7 |
% |
|
|
-2.5 |
% |
|
Effect of change in income tax rates |
|
|
-1.9 |
% |
|
|
14.4 |
% |
|
|
5.1 |
% |
|
Impact of state net operating losses |
|
|
5.4 |
% |
|
|
-11.4 |
% |
|
|
15.5 |
% |
|
Stock options |
|
|
0.1 |
% |
|
|
0.7 |
% |
|
|
-4.8 |
% |
|
Other |
|
|
0.0 |
% |
|
|
1.0 |
% |
|
|
0.6 |
% |
|
Expired net operating losses |
|
|
15.7 |
% |
|
|
|
|
|
|
|
|
|
Reduction in valuation allowance due to business |
|
|
|
|
|
|
|
|
|
|
|
|
|
combination |
|
|
0.0 |
% |
|
|
-145.1 |
% |
|
|
0.0 |
% |
|
Change in valuation allowance |
|
|
-283.0 |
% |
|
|
-42.7 |
% |
|
|
24.1 |
% |
|
Total expense |
|
|
-221.6 |
% |
|
|
-140.5 |
% |
|
|
-5.3 |
% |
The following is a summary of the components of our deferred tax assets and liabilities at December 31:
|
|
|
|
2013 (Restated) |
|
|
|
2012 |
|
|
Deferred tax assets: |
|
|
|
|
|
|
|
|
|
Net operating losses and credit carryforwards |
|
$ |
58,798 |
|
|
$ |
62,307 |
|
|
Stock options |
|
|
5,299 |
|
|
|
5,513 |
|
|
Deferred rent |
|
|
1,692 |
|
|
|
196 |
|
|
Deferred revenue |
|
|
13 |
|
|
|
44 |
|
|
Accrued expenses |
|
|
792 |
|
|
|
1,310 |
|
|
Other |
|
|
367 |
|
|
|
- |
|
|
Total deferred tax assets |
|
|
66,961 |
|
|
|
69,370 |
|
|
Valuation allowance |
|
|
(1,229 |
) |
|
|
(49,146 |
) |
|
Net deferred tax assets |
|
$ |
65,732 |
|
|
$ |
20,224 |
|
|
|
|
|
|
|
|
|
|
|
|
Deferred tax liabilities: |
|
|
|
|
|
|
|
|
|
Property and equipment |
|
$ |
(18,777 |
) |
|
$ |
(20,012 |
) |
|
Other |
|
|
(627 |
) |
|
|
(212 |
) |
|
Total deferred tax liabilities |
|
|
(19,404 |
) |
|
|
(20,224 |
) |
|
Net deferred tax assets |
|
$ |
46,328 |
|
|
$ |
- |
|
We estimate that U.S. federal and state net operating losses (“NOLs”) available to be carried forward approximated $199,408 and $138,010 (restated), respectively, as of December 31, 2013. The U.S. federal NOLs expire in the years 2024 through 2033. The majority of the state NOLs will expire between 2014 and 2033. Our ability to utilize our U.S. federal and state NOLs may be limited if we experience an ownership change as defined by Section 382 of the Internal Revenue Code. When a company undergoes such an ownership change, Section 382 limits the future use of NOLs generated before the change in ownership and certain subsequently recognized “built-in” losses and deductions, if any, existing as of the date of the ownership change. A company’s ability to utilize new NOLs arising after the ownership change is not affected. In 2012, we completed an analysis of prior year ownership changes, including whether there were any limitations on the use of NOLs acquired in connection with our acquisition of ID Analytics, we determined that our NOLs as well as the NOLs of ID Analytics were subject to annual limitations under Section 382. However, we determined that none of the NOL carryforwards will expire solely as a result of Section 382 limitations. In 2013, in connection with the acquisition of Lemon, we completed an analysis of Lemon’s prior ownership changes, including the change which arose as a result of our acquisition of Lemon. As a result of the analysis, we determined that due to the ownership changes of certain former shareholders, approximately $7,894 and $7,991 of Lemon’s federal and state net operating loss carryforwards, respectively, will expire solely as a result of the Section 382 limitations.. If adverse information is discovered in the future, we will treat this as new information and reflect the impact in that period. As of December 31, 2013, we had $451 of federal alternative minimum tax credit carryover which does not expire.
As of December 31, 2013 and 2012, we have $14,821 and $1,845, respectively, of unrealized excess tax benefits from stock option exercises which have been removed from our net operating loss deferred tax asset. When realized upon utilization or our net operating losses, the excess tax benefits will result in a credit to additional paid in capital.
85
We are subject to taxation in the U.S. and various states. All of our tax years are still subject to U.S. federal, state, and local tax authorities due to our net operating loss, which started in 2006. As of December 31, 2013 and 2012, our unrecognized tax benefits were $393. We had no unrecognized tax benefits as of December 31, 2011. If recognized, the entire amount of unrecognized tax benefit would impact the effective rate. There are no positions for which it is reasonably possible that the uncertain tax benefit will significantly increase or decrease within twelve months. As of December 31, 2013, there was no accrued interest or penalties recorded in the consolidated financial statements.
On September 13, 2013, U.S. Treasury and the Internal Revenue Service issued final regulations regarding the deduction and capitalization of expenditures related to tangible property. The final regulations under Internal Revenue Code Sections 162, 167 and 263(a) apply to amounts paid to acquire, produce, or improve tangible property as well as dispositions of such property and are generally effective for tax years beginning on or after January 1, 2014. We have evaluated these regulations and determined they will not have a material impact on our consolidated results of operations, cash flows, or financial position.
17. Segment Reporting (Restated)
Following our acquisition of ID Analytics in the first quarter of 2012, we began operating our business and reviewing and assessing our operating performance using two reportable segments: our consumer segment and our enterprise segment. In our consumer segment, we offer proactive identity theft protection services to consumers on an annual or monthly subscription basis. In our enterprise segment, we offer fraud and risk solutions to our enterprise customers.
Financial information about our segments for the year ended December 31, 2013 and as of December 31, 2013 was as follows (Restated):
|
|
|
Consumer |
|
|
Enterprise |
|
|
Eliminations |
|
|
Total |
|
||||
|
Revenue |
|
|
|
|
|
|
|
|
|
|
|
|
|
|
|
|
|
External customers |
|
$ |
340,121 |
|
|
$ |
29,537 |
|
|
$ |
- |
|
|
$ |
369,658 |
|
|
Intersegment revenue |
|
|
- |
|
|
|
5,316 |
|
|
|
(5,316 |
) |
|
|
- |
|
|
Income (loss) from operations |
|
|
27,086 |
|
|
|
(9,905 |
) |
|
|
- |
|
|
|
17,181 |
|
|
Goodwill |
|
|
99,805 |
|
|
|
59,537 |
|
|
|
- |
|
|
|
159,342 |
|
|
Total assets |
|
|
348,000 |
|
|
|
114,146 |
|
|
|
(481 |
) |
|
|
461,665 |
|
Financial information about our segments for the year ended December 31, 2012 and as of December 31, 2012 was as follows:
|
|
|
Consumer |
|
|
Enterprise |
|
|
Eliminations |
|
|
Total |
|
||||
|
Revenue |
|
|
|
|
|
|
|
|
|
|
|
|
|
|
|
|
|
External customers |
|
$ |
254,678 |
|
|
$ |
21,750 |
|
|
$ |
- |
|
|
$ |
276,428 |
|
|
Intersegment revenue |
|
|
- |
|
|
|
3,506 |
|
|
|
(3,506 |
) |
|
|
- |
|
|
Income (loss) from operations |
|
|
18,840 |
|
|
|
(5,747 |
) |
|
|
- |
|
|
|
13,093 |
|
|
Goodwill |
|
|
69,891 |
|
|
|
59,537 |
|
|
|
- |
|
|
|
129,428 |
|
|
Total assets |
|
|
213,564 |
|
|
|
129,245 |
|
|
|
(3,221 |
) |
|
|
339,588 |
|
We allocated goodwill between our segments by estimating the expected synergies to each segment.
We derive all of our revenue from sales in the United States, and substantially all of our long-lived assets are located in the United States.
18. Contingencies
As part of our consumer services, we offer 24x7x365 member service support. If a member’s identity has been compromised, our member service team and remediation specialists will assist the member until the issue has been resolved. This includes our $1 million service guarantee, which is backed by an identity theft insurance policy, under which we will spend up to $1 million to cover certain third-party costs and expenses incurred in connection with the remediation, such as legal and investigatory fees. This insurance also covers certain out-of-pocket expenses, such as loss of income, replacement of fraudulent withdrawals, and costs associated with child and elderly care, travel, and replacement of documents. While we have reimbursed members for claims under this guarantee, the amounts in aggregate for the years ended December 31, 2013, 2012, and 2011 were not material.
In January 2010, Neal Duncan, a former stockholder, filed a breach of contract claim against us in the Superior Court of Maricopa County, Arizona. In his complaint, Mr. Duncan alleged that we breached a purported contract with him and sought an ownership interest in our company equal to 7.5%. In April 2012, the judge granted our motion for summary judgment and dismissed Mr. Duncan's lawsuit. Mr. Duncan has exhausted his avenues of appeal with the Arizona Court of Appeals and the Arizona Supreme Court. As part of our efforts to recover the attorneys’ fees and costs that we were awarded, we acquired 835 shares of our common stock held by Mr. Duncan pursuant to a garnishment proceeding.
In September 2012, Denise Richardson filed a complaint against our company and Todd Davis. Ms. Richardson claims that she was improperly classified as an independent contractor instead of an employee and that we breached the terms of an alleged
86
employment agreement. Ms. Richardson claims she is entitled to equitable relief, compensatory damages, liquidated damages, statutory penalties, punitive damages, interest, costs, and attorneys’ fees. The parties are awaiting the court’s decision with respect to our motion to dismiss.
We are subject to other legal proceedings and claims that have arisen in the ordinary course of business. Although there can be no assurance as to the ultimate disposition of these matters and the proceedings disclosed above, we believe, based upon the information available at this time, that a material adverse outcome related to the matters is neither probable nor estimable.
19. Selected Quarterly Financial Data (unaudited) (Restated)
As discussed in the Explanatory Note to this Form 10-K/A, we are restating the unaudited condensed consolidated financial information for the quarters ended March 31, 2013, June 30, 2013, September 30, 2013, and December 31, 2013.
The following table sets forth certain unaudited quarterly results of operations of the Company for the years ended December 31, 2013 and 2012. In the opinion of management, this information has been prepared on the same basis as the audited consolidated financial statements and all necessary adjustments, consisting only of normal recurring adjustments, have been included in the amounts below for a fair statement of the quarterly information when read in conjunction with the audited consolidated financial statements and related notes included elsewhere in this Form 10-K/A:
|
|
|
Three Months Ended |
|
|||||||||||||||||||||||||||||||
|
|
|
Dec 31, |
|
|
Sep 30, |
|
|
Jun 30, |
|
|
Mar 31, |
|
|
Dec 31, |
|
|
Sep 30, |
|
|
Jun 30, |
|
|
Mar 31, |
|
||||||||||
|
|
|
2013 (Restated) |
|
|
2013 (Restated) |
|
|
2013 (Restated) |
|
|
2013 (Restated) |
|
|
2012 |
|
|
2012 |
|
|
2012 |
|
|
2012 |
|
||||||||||
|
|
|
(in thousands, except per share data) |
|
|||||||||||||||||||||||||||||||
|
Revenue: |
|
|
|
|
|
|
|
|
|
|
|
|
|
|
|
|
|
|
|
|
|
|
|
|
|
|
|
|
|
|
|
|
||
|
Consumer revenue |
|
$ |
94,068 |
|
|
$ |
88,386 |
|
|
$ |
82,574 |
|
|
$ |
75,094 |
|
|
$ |
70,775 |
|
|
$ |
65,579 |
|
|
$ |
61,616 |
|
|
$ |
56,708 |
|
||
|
Enterprise revenue |
|
|
8,237 |
|
|
|
7,353 |
|
|
|
6,946 |
|
|
|
7,001 |
|
|
|
8,041 |
|
|
|
6,538 |
|
|
|
6,267 |
|
|
|
904 |
|
||
|
Total revenue |
|
|
102,305 |
|
|
|
95,739 |
|
|
|
89,520 |
|
|
|
82,095 |
|
|
|
78,816 |
|
|
|
72,117 |
|
|
|
67,883 |
|
|
|
57,612 |
|
||
|
Gross profit |
|
$ |
76,110 |
|
|
|
70,852 |
|
|
|
64,326 |
|
|
|
58,305 |
|
|
|
56,627 |
|
|
|
52,355 |
|
|
|
48,758 |
|
|
|
38,772 |
|
||
|
Income (loss) from operations |
|
$ |
15,293 |
|
|
|
6,736 |
|
|
|
(1,404 |
) |
|
|
(3,444 |
) |
|
|
5,700 |
|
|
|
6,223 |
|
|
|
1,379 |
|
|
|
(209 |
) |
||
|
Net income (loss) |
|
$ |
52,976 |
|
|
$ |
6,466 |
|
|
$ |
(1,445 |
) |
|
$ |
(3,542 |
) |
|
$ |
4,080 |
|
|
$ |
7,868 |
|
|
$ |
(6,898 |
) |
|
$ |
18,453 |
|
||
|
Basic net income (loss) per share |
|
$ |
0.58 |
|
|
$ |
0.07 |
|
|
$ |
(0.02 |
) |
|
$ |
(0.04 |
) |
|
$ |
0.01 |
|
|
$ |
0.06 |
|
|
$ |
(0.56 |
) |
|
$ |
0.34 |
|
||
|
Diluted net income (loss) per share |
|
$ |
0.54 |
|
|
$ |
0.07 |
|
|
$ |
(0.02 |
) |
|
$ |
(0.04 |
) |
|
$ |
0.01 |
|
|
$ |
(0.16 |
) |
|
$ |
(0.59 |
) |
|
$ |
0.22 |
|
||
The following tables present the effect of the correction of the error and other adjustments on our previously reported consolidated financial statements for the quarterly periods ended March 31, 2013, June 30, 2013, September 30, 2013, and December 31, 2013.
|
|
Three Months Ended March 31, 2013 |
|
|
Three Months Ended June 30, 2013 |
|
||||||||||||||||||
|
|
As Previously Reported |
|
|
Adjustment |
|
|
As Restated |
|
|
As Previously Reported |
|
|
Adjustment |
|
|
As Restated |
|
||||||
|
Consolidated Statements of Operations: |
(in thousands, except per share data) |
|
|||||||||||||||||||||
|
Cost of services |
$ |
23,804 |
|
|
$ |
(14 |
) |
|
$ |
23,790 |
|
|
$ |
25,227 |
|
|
$ |
(33 |
) |
|
$ |
25,194 |
|
|
Gross profit |
|
58,291 |
|
|
|
14 |
|
|
|
58,305 |
|
|
|
64,293 |
|
|
|
33 |
|
|
|
64,326 |
|
|
Sales and marketing |
|
41,793 |
|
|
|
(55 |
) |
|
|
41,738 |
|
|
|
43,248 |
|
|
|
(76 |
) |
|
|
43,172 |
|
|
Technology and development |
|
9,024 |
|
|
|
(101 |
) |
|
|
8,923 |
|
|
|
10,370 |
|
|
|
(191 |
) |
|
|
10,179 |
|
|
General and administrative |
|
9,424 |
|
|
|
(302 |
) |
|
|
9,122 |
|
|
|
10,900 |
|
|
|
(487 |
) |
|
|
10,413 |
|
|
Total costs and expenses |
|
62,207 |
|
|
|
(458 |
) |
|
|
61,749 |
|
|
|
66,484 |
|
|
|
(754 |
) |
|
|
65,730 |
|
|
Loss from operations |
|
(3,916 |
) |
|
|
472 |
|
|
|
(3,444 |
) |
|
|
(2,191 |
) |
|
|
787 |
|
|
|
(1,404 |
) |
|
Loss before provision for income taxes |
|
(3,967 |
) |
|
|
472 |
|
|
|
(3,495 |
) |
|
|
(2,244 |
) |
|
|
787 |
|
|
|
(1,457 |
) |
|
Income tax (benefit) expense |
|
150 |
|
|
|
(103 |
) |
|
|
47 |
|
|
|
(179 |
) |
|
|
167 |
|
|
|
(12 |
) |
|
Net loss |
|
(4,117 |
) |
|
|
575 |
|
|
|
(3,542 |
) |
|
|
(2,065 |
) |
|
|
620 |
|
|
|
(1,445 |
) |
|
Basic earnings per share |
$ |
(0.05 |
) |
|
$ |
0.01 |
|
|
$ |
(0.04 |
) |
|
$ |
(0.02 |
) |
|
$ |
- |
|
|
$ |
(0.02 |
) |
|
Diluted earnings per share |
$ |
(0.05 |
) |
|
$ |
0.01 |
|
|
$ |
(0.04 |
) |
|
$ |
(0.02 |
) |
|
$ |
- |
|
|
$ |
(0.02 |
) |
|
|
|
|
|
|
|
|
|
|
|
|
|
|
|
|
|
|
|
|
|
|
|
|
|
|
|
|
|
|
|
|
|
|
|
|
|
|
|
|
|
|
|
|
|
|
|
|
|
|
87
|
|
Three Months Ended September 30, 2013 |
|
|
Three Months Ended December 31, 2013 |
|
||||||||||||||||||
|
|
As Previously Reported |
|
|
Adjustment |
|
|
As Restated |
|
|
As Previously Reported |
|
|
Adjustment |
|
|
As Restated |
|
||||||
|
Consolidated Statements of Operations: |
(in thousands, except per share data) |
|
|||||||||||||||||||||
|
Cost of services |
$ |
24,935 |
|
|
$ |
(48 |
) |
|
$ |
24,887 |
|
|
$ |
26,283 |
|
|
$ |
(89 |
) |
|
$ |
26,194 |
|
|
Gross profit |
|
70,804 |
|
|
|
48 |
|
|
|
70,852 |
|
|
|
76,021 |
|
|
|
89 |
|
|
|
76,110 |
|
|
Sales and marketing |
|
40,609 |
|
|
|
(186 |
) |
|
|
40,423 |
|
|
|
37,241 |
|
|
|
(211 |
) |
|
|
37,030 |
|
|
Technology and development |
|
10,734 |
|
|
|
(272 |
) |
|
|
10,462 |
|
|
|
10,819 |
|
|
|
(368 |
) |
|
|
10,451 |
|
|
General and administrative |
|
11,837 |
|
|
|
(572 |
) |
|
|
11,265 |
|
|
|
11,909 |
|
|
|
(584 |
) |
|
|
11,325 |
|
|
Total costs and expenses |
|
65,146 |
|
|
|
(1,030 |
) |
|
|
64,116 |
|
|
|
61,980 |
|
|
|
(1,163 |
) |
|
|
60,817 |
|
|
Income from operations |
|
5,658 |
|
|
|
1,078 |
|
|
|
6,736 |
|
|
|
14,041 |
|
|
|
1,252 |
|
|
|
15,293 |
|
|
Income before provision for income taxes |
|
5,598 |
|
|
|
1,078 |
|
|
|
6,676 |
|
|
|
13,955 |
|
|
|
1,252 |
|
|
|
15,207 |
|
|
Income tax (benefit) expense |
|
171 |
|
|
|
39 |
|
|
|
210 |
|
|
|
(39,251 |
) |
|
|
1,482 |
|
|
|
(37,769 |
) |
|
Net income |
|
5,427 |
|
|
|
1,039 |
|
|
|
6,466 |
|
|
|
53,206 |
|
|
|
(230 |
) |
|
|
52,976 |
|
|
Basic earnings per share |
$ |
0.06 |
|
|
$ |
0.01 |
|
|
$ |
0.07 |
|
|
$ |
0.58 |
|
|
$ |
- |
|
|
$ |
0.58 |
|
|
Diluted earnings per share |
$ |
0.06 |
|
|
$ |
0.01 |
|
|
$ |
0.07 |
|
|
$ |
0.54 |
|
|
$ |
- |
|
|
$ |
0.54 |
|
88
None.
Evaluation of Disclosure Controls and Procedures
Our management, with the participation of our Chief Executive Officer and Chief Financial Officer, has evaluated the effectiveness of our disclosure controls and procedures (as defined in Rules 13a-15(e) and 15d-15(e) under the Exchange Act) as of December 31, 2013. Based on such evaluation at the time that the Original Filing was filed on February 19, 2014, our Chief Executive Officer and Chief Financial Officer concluded that, as of December 31, 2013, our disclosure controls and procedures were effective.
Subsequent to that evaluation, our management, including our Chief Executive Officer and Chief Financial Officer, concluded that our disclosure controls and procedures were not effective as of December 31, 2013 because of a material weakness in our internal control over financial reporting described below under the heading “Management’s Annual Report on Internal Control Over Financial Reporting.” We have undertaken remediation initiatives as discussed below.
In light of the material weakness referred to above, we performed additional analyses and procedures in order to conclude that our consolidated financial statements in this Form 10-K/A for the year ended December 31, 2013 and for each of the quarterly periods within fiscal 2013 are fairly presented, in all material respects, in accordance with US GAAP.
Management’s Annual Report on Internal Control Over Financial Reporting
Internal control over financial reporting refers to the process designed by, or under the supervision of, our Chief Executive Officer and Chief Financial Officer, and effected by our board of directors, management and other personnel, to provide reasonable assurance regarding the reliability of financial reporting and the preparation of financial statements for external purposes in accordance with U.S. GAAP, and includes those policies and procedures that: (1) pertain to the maintenance of records that in reasonable detail accurately and fairly reflect the transactions and dispositions of our assets; (2) provide reasonable assurance that transactions are recorded as necessary to permit preparation of financial statements in accordance with U.S. GAAP, and that our receipts and expenditures are being made only in accordance with authorizations of our management and directors; and (3) provide reasonable assurance regarding prevention or timely detection of unauthorized acquisition, use or disposition of the company’s assets that could have a material effect on the financial statements
Our management is responsible for establishing and maintaining adequate internal control over financial reporting (as defined by Rule 13a-15(f) of the Exchange Act). In assessing the effectiveness of our internal control over financial reporting as of December 31, 2013, our management used the criteria set forth by the Committee of Sponsoring Organizations of the Treadway Commission (COSO) in Internal Control – Integrated Framework (1992 framework). Based on such assessment, at the time that the Original Filing was filed on February 19, 2014, our management concluded that our internal control over financial reporting was effective as of December 31, 2013.
In connection with the restatement discussed in the Explanatory Note to this Form 10-K/A and Note 2 and Note 19 to the Consolidated Financial Statements included in Part II, Item 8 of this Form 10-K/A, management, including our Chief Executive Officer and Chief Financial Officer, reassessed the effectiveness of our internal control over financial reporting as of December 31, 2013. Based on this reassessment using the COSO criteria, management has concluded that we did not maintain effective internal control over financial reporting as of December 31, 2013 because of a deficiency in the control over the calculation of the volatility assumption within the Black-Scholes option pricing model used to compute our share-based compensation expense that management concluded was a material weakness. This control deficiency resulted in the misstatement of share-based compensation expense and net income available to common stockholders and the related financial disclosures for the year ended December 31, 2013 (and the restatement of the unaudited condensed consolidated financial information for the quarters ended March 31, 2013, June 30, 2013, September 30, 2013, and December 31, 2013), as discussed in the Explanatory Note to this Form 10-K/A and Note 2 and Note 19 to the Consolidated Financial Statements included in Part II, Item 8 of this Form 10-K/A.
The effectiveness of our internal control over financial reporting as of December 31, 2013 has been audited by Ernst & Young LLP, an independent registered public accounting firm, as stated in its report which is included in this Form 10-K/A.
Remediation Plan
We are in the process of remediating this material weakness by, among other things, implementing a process of additional enhanced review of estimates and calculations which impact our share based compensation expense. The actions that we are taking are subject to ongoing senior management review, as well as Audit Committee oversight. Although we plan to complete this
89
remediation process as quickly as possible, we cannot at this time estimate how long it will take, and our initiatives may not prove to be successful in remediating this material weakness.
Management believes the foregoing efforts will effectively remediate the material weakness. As we continue to evaluate and work to improve our internal control over financial reporting, management may execute additional measures to address potential control deficiencies or modify the remediation plan described above. Management will continue to review and make necessary changes to the overall design of our internal controls.
Changes in Internal Control Over Financial Reporting
There were no changes in our internal control over financial reporting identified in management’s evaluation pursuant to Rules 13a-15(d) or 15d-15(d) of the Exchange Act during the most recent fiscal quarter that materially affected, or are reasonably likely to materially affect, our internal control over financial reporting.
Limitations on Effectiveness of Controls and Procedures
Our management, including our Chief Executive Officer and Chief Financial Officer, does not expect that our disclosure controls and procedures or our internal controls over financial reporting will prevent all error and all fraud. A control system, no matter how well conceived and operated, can provide only reasonable, not absolute, assurance that the objectives of the control system are met. Further, the design of a control system must reflect the fact that there are resource constraints, and the benefits of controls must be considered relative to their costs. Because of the inherent limitations in all control systems, no evaluation of controls can provide absolute assurance that all control issues, misstatements, errors, and instances of fraud, if any, within our company have been or will be prevented or detected. These inherent limitations include the realities that judgments in decision-making can be faulty and that breakdowns can occur because of simple error or mistake. Controls also can be circumvented by the individual acts of some persons, by collusion of two or more people, or by management override of the controls. The design of any system of controls is based in part on certain assumptions about the likelihood of future events, and there can be no assurance that any design will succeed in achieving its stated goals under all potential future conditions. Projections of any evaluation of controls effectiveness to future periods are subject to risks that internal controls may become inadequate as a result of changes in conditions, or through the deterioration of the degree of compliance with policies or procedures.
None.
90
The information required by this Item will be contained in our definitive proxy statement to be filed with the SEC in connection with our 2014 annual meeting of stockholders (the “Proxy Statement”), which is expected to be filed not later than 120 days after the end of our fiscal year ended December 31, 2013, and is incorporated in this Form 10-K/A by reference.
We have adopted a Code of Business Conduct and Ethics that applies to all of our directors, officers, and employees, including our principal executive officer and principal financial officer. The Code of Business Conduct and Ethics is posted on our website at http://investor.lifelock.com/phoenix.zhtml?c=234808&p=irol-govhighlights.
We will post any amendments to, or waivers from, a provision of this Code of Business Conduct and Ethics by posting such information on our website, at the address and location specified above.
COMPENSATION DISCUSSION AND ANALYSIS
Named Executive Officers
This Compensation Discussion and Analysis provides an overview of the material components of our executive compensation program for the following executive officers:
|
· |
Todd Davis, our Chairman and Chief Executive Officer; |
|
· |
Hilary A. Schneider, our President; |
|
· |
Chris G. Power, our Chief Financial Officer; |
|
· |
Clarissa Cerda, our Executive Vice President, Chief Legal Officer, and Secretary; |
|
· |
Velislav (Villi) Iltchev, our Executive Vice President, Corporate Development; and |
|
· |
Donald M. Beck, our Senior Vice President, Enterprise Sales & Alliances. |
We refer to these executive officers collectively in this Form 10-K/A as our named executive officers.
Specifically, this Compensation Discussion and Analysis provides an overview of our executive compensation philosophy, the overall objectives of our executive compensation program, and each component of compensation that we provide to our executive officers. In addition, we explain how and why our compensation committee arrived at the specific compensation policies and decisions involving our executive officers, including our named executive officers, during fiscal 2013.
Compensation Philosophy and Objectives
Our philosophy is to pay base salaries to executives at levels that enable us to attract, motivate, and retain highly qualified executives, with base salaries generally set at levels similar to those of our peer companies taking into account the possibility of the receipt by our executives of cash performance-based incentive bonuses. Cash incentive bonuses are designed to motivate and reward individuals for performance based on certain aspects of our company’s financial results as well as the achievement of personal and corporate objectives that contribute to our long-term success in building stockholder value. Grants of stock-based awards may result in limited rewards if the price of our common stock does not appreciate significantly, but may provide substantial rewards to executives as our stockholders in general benefit from stock price appreciation thereby aligning compensation with the price performance of our common stock. Total compensation levels reflect our executives’ corporate positions, responsibilities, and achievement of corporate and individual goals. As a result of our performance-based philosophy regarding compensation, compensation levels may vary significantly from year to year and among our various executive officers. In general, we expect the compensation level of our chief executive officer will be higher than that of our other executive officers assuming relatively equal achievement of performance targets.
Compensation–Setting Practice
Our board of directors has appointed a compensation committee, consisting exclusively of independent directors. The compensation committee’s charter authorizes our compensation committee to review and approve, or to recommend for approval to the full board of directors, the compensation of our chief executive officer and our other executive officers. Our board of directors has authorized our compensation committee to make all decisions with respect to executive compensation.
91
Role of the Compensation Committee
Our compensation committee evaluates the performance of our chief executive officer and approves the compensation for our chief executive officer in light of the goals and objectives of our compensation program for that year. Our compensation committee together with our chief executive officer annually assesses the performance of our other executive officers. Based in part on the recommendations from our chief executive officer, our compensation committee approves the compensation of our other executive officers.
Role of the Chief Executive Officer
At the request of our compensation committee, our chief executive officer generally attends a portion of our compensation committee meetings, including meetings at which our compensation committee’s compensation consultant is present. This enables our compensation committee to review with our chief executive officer the corporate and individual goals that he regards as important to achieve our overall goals. Our compensation committee also requests that our chief executive officer assess the performance of, and our goals and objectives for, our other executive officers, including our other named executive officers. Although the participation of our chief executive officer allows him to provide recommendations as to the goals, performance targets, and objectives, including his own, our compensation committee rather than our chief executive officer makes all final determinations regarding setting corporate goals, targets, objectives, and performance against such goals and targets. Our chief executive officer does not attend any portion of compensation committee meetings at which his compensation is discussed.
Role of Compensation Consultants
From time to time, our compensation committee retains the services of independent compensation consultants to review a wide variety of factors relevant to executive compensation, trends in executive compensation, and the identification of relevant peer companies. Our compensation committee makes all determinations regarding the engagement, fees, and services of the compensation consultants. Our compensation consultants report directly to our compensation committee and do not perform any other services for our company.
During fiscal 2013, our compensation committee engaged Compensia, Inc., an independent nationally recognized compensation consulting firm, to assist it in connection with its review of our fiscal 2013 executive compensation program and its analysis of the competitive market for executive talent. Compensia provided no other services to our company during fiscal 2013.
Our compensation committee has considered the independence of Compensia in light of the listing standards of the New York Stock Exchange on compensation committee independence and the rules of the SEC. Our compensation committee requested and received confirmation from Compensia addressing the independence of the firm and its senior advisors working with our compensation committee. Our compensation committee discussed these considerations and concluded that the work performed by Compensia did not raise any conflict of interest.
Use of Market Data
In determining the compensation of our executive officers, including our named executive officers, we periodically review compensation levels of a peer group of companies and consider broader market trends. We also consider compensation levels in our geographic areas, competitive factors that enable us to attract executives from other companies, and compensation levels that we deem appropriate to retain and motivate our executives. We use peer group and other information as a point of reference, but do not benchmark or target our compensation levels against our peer group or other factors.
Our compensation committee considers data gathered from a self-constructed group of peer companies. After consultation with Compensia, our compensation committee developed and approved a compensation peer group for use in its executive compensation decisions for fiscal 2013 using the following selection criteria:
|
· |
Industry: Companies that compete in the internet related and software industries. |
|
· |
Revenue: Companies with revenue of between approximately $173 million and $692 million, based upon the last four quarters of reported revenue at the time of selection. |
|
· |
Market Capitalization: Companies with a market capitalization of between approximately $1.33 million and $4.0 billion at the time of selection. |
|
· |
High Revenue Growth: Where available, high revenue growth companies that face similar management challenges. |
92
The companies included in the compensation peer group approved by our compensation committee were as follows:
|
|
|
|
|
|
|
Advent Software |
|
Constant Contact |
|
LivePerson |
|
Ancestry.com |
|
Demand Media |
|
LogMeIn |
|
Angie’s List |
|
ExactTarget |
|
OpenTable |
|
Bankrate |
|
HomeAway |
|
QuinStreet |
|
Blucora |
|
j2 Global |
|
Websense |
|
comScore |
|
Liquidity Services |
|
Zipcar |
Compensia provided our compensation committee with an analysis of the companies in the compensation peer group, determined our position relative to the compensation peer group, developed guidelines for the structure of our fiscal 2013 executive compensation program based on the compensation peer group and broader market trends, and reviewed the overall compensation packages.
Compensation Elements
Our compensation program for our executive officers consists primarily of base salaries, cash incentive bonuses, and long-term incentives in the form of stock-based awards, which may include stock options, restricted stock units, or RSUs, restricted stock awards, or a combination thereof. Our executive officers also participate in various other welfare benefit plans that generally are available to all of our employees. We consider each element of compensation collectively with other elements of compensation when establishing the various forms, elements, and levels of compensation.
Base Salary
We seek to pay base salaries at levels that enable us to attract, motivate, and retain highly qualified executives, with base salaries generally set at levels similar to those of our peer companies taking into account the possibility of the receipt by our executives of cash performance-based incentive bonuses. Base salaries for our executives, including our named executive officers, also can reflect his or her position, responsibilities, experience, skills, performance, and ongoing and expected future contributions. In determining base salary, our compensation committee also may take into account competitive salary levels for similar positions at the companies in the compensation peer group and base salary levels relative to other positions within our company.
As has been our practice, for fiscal 2013, we set the base salaries for our executive officers, including our named executive officers, at the beginning of the fiscal year, except in the case of Messrs. Iltchev and Beck who joined our company later in the year. The annual base salaries for our named executive officers during fiscal 2013 were as follows:
|
|
|
|
|
|
|
|
|
|
|
|
|
|
|
Named Executive Officer |
|
Annualized Fiscal 2012 Base Salary (1) |
|
|
Annualized Fiscal 2013 Base Salary (1) |
|
|
Percentage Change |
|
|||
|
Todd Davis |
|
$ |
465,000 |
|
|
$ |
478,950 |
|
|
|
3.0 |
% |
|
Hilary A. Schneider |
|
$ |
400,000 |
|
|
$ |
412,000 |
|
|
|
3.0 |
% |
|
Chris G. Power |
|
$ |
319,000 |
|
|
$ |
323,785 |
|
|
|
1.5 |
% |
|
Clarissa Cerda |
|
$ |
310,000 |
|
|
$ |
319,300 |
|
|
|
3.0 |
% |
|
Velislav (Villi) Iltchev(2) |
|
|
— |
|
|
$ |
300,000 |
|
|
|
— |
|
|
Donald M. Beck(3) |
|
|
— |
|
|
$ |
300,000 |
|
|
|
— |
|
|
(1) |
Base salaries are annualized based on the base salary in effect as of December 31 of the fiscal year. Actual base salaries received by our named executive officers are set forth in the Summary Compensation Table below. |
||
|
(2) |
Mr. Iltchev joined our company in July 2013. |
||
|
(3) |
Mr. Beck joined our company in June 2013. |
||
The base salaries for our named executive officers were increased for fiscal 2013 based on our compensation committee’s performance assessments and to move closer to the 50th percentile for comparable companies. Base salaries for fiscal 2013 were between the 25th and 50th percentile of our compensation peer group.
Annual Cash Incentive Bonuses
Cash incentive bonuses are designed to motivate and reward individuals for performance based on certain aspects of our company’s financial results as well as the achievement of personal objectives that contribute to our long-term success in building stockholder value.
At the beginning of each fiscal year, our compensation committee approves our annual bonus plan, which forms the basis for the corporate performance measures for our annual cash incentive bonuses. Further, our compensation committee reviews and sets the framework for the annual cash incentive bonuses for the year, including determining the threshold, target, and maximum levels for each of the corporate performance measures and target annual cash incentive bonus opportunities for our executives. Our compensation committee, with recommendations from our chief executive officer with respect to our named executive officers other
93
than himself, determines the actual bonus payouts to our named executive officers based on the satisfaction of the corporate performance measures, each named executive officer’s individual performance goals, and each named executive officer’s cash incentive bonus opportunity as well as our compensation committee’s subjective determinations of each named executive officer’s overall performance and contributions during the fiscal year.
Target Bonus Opportunities
Our compensation committee determined that the target annual cash incentive bonus opportunities for each of our named executive officers for fiscal 2013 should be based on a percentage of such named executive officer’s base salary. The target annual cash incentive bonus opportunity established for each named executive officer for fiscal 2013 was as follows:
|
|
|
|
|
|
|
|
|
|
|
|
|
|
|
Named Executive Officer |
|
Annualized Fiscal 2013 Base Salary |
|
|
Target Cash Incentive Bonus Opportunity (as a percentage of base salary) |
|
|
Target Cash Incentive Bonus Opportunity (as a dollar amount) |
|
|||
|
Todd Davis |
|
$ |
478,950 |
|
|
|
100 |
% |
|
$ |
478,950 |
|
|
Hilary A. Schneider |
|
$ |
412,000 |
|
|
|
50 |
% |
|
$ |
206,000 |
|
|
Chris G. Power |
|
$ |
323,785 |
|
|
|
60 |
% |
|
$ |
194,271 |
|
|
Clarissa Cerda |
|
$ |
319,300 |
|
|
|
50 |
% |
|
$ |
159,650 |
|
|
Velislav (Villi) Iltchev |
|
$ |
300,000 |
|
|
|
50 |
% |
|
$ |
150,000 |
(1) |
|
Donald M. Beck |
|
$ |
300,000 |
|
|
|
16.66 |
% |
|
$ |
50,000 |
(2) |
|
(1) |
Mr. Iltchev’s actual target cash incentive bonus opportunity was pro-rated based on his employment start date and, as a result, was $62,500. |
|
(2) |
Mr. Beck’s actual annual target cash incentive bonus opportunity was pro-rated based on his employment start date and, as a result, was $25,000. |
In setting these target annual cash incentive bonus opportunities for our named executive officers, our compensation committee exercised its judgment and considered various factors, including our overall financial and operational results for the prior fiscal year, the prior performance of each individual executive, his or her potential to contribute to our long-term strategic success, his or her role and responsibilities, his or her individual experience and skills, competitive market practices for annual bonuses, and, for our other named executive officers, the recommendations of our chief executive officer.
Corporate Performance Measures
For fiscal 2013, the amount of the cash incentive bonus pool and eligibility to receive cash incentive bonuses depended on the achievement of corporate financial performance objectives tied to our revenue, adjusted EBITDA, and net member growth for fiscal 2013, with the revenue and adjusted EBITDA objectives each representing 37.5% of the cash incentive bonus pool and the net member growth objective representing 25% of the cash incentive bonus pool. Our compensation committee determined the threshold, target, and maximum levels for each of these performance objectives in consultation with management and taking into account our performance in fiscal 2012. For fiscal 2013, our target revenue was $356.5 million; our target adjusted EBITDA was $38.2 million; and our target net member growth was 405,000 new members. Our compensation committee approved certain adjustments to the calculation of the performance objectives during the year for certain events, including our acquisition of Lemon, Inc., or Lemon. Our compensation committee set these target levels to be aggressive, yet achievable, with diligent effort during the fiscal year. We achieved 156.8% payout on our target revenue goal, 186.8% payout on our target adjusted EBITDA goal, and 200.0% payout on our target net member growth goal for fiscal 2013. Based on these achievements, at the end of the year, our compensation committee approved a multiplier of the annual cash incentive bonus opportunity to reflect how we exceeded the targets for the corporate financial performance objectives for the year. Based on exceeding the corporate financial performance objectives of revenue, adjusted EBITDA, and net member growth by a substantial percentage for fiscal 2013, our compensation committee established a multiplier of 1.789, which resulted in significantly higher potential cash incentive bonuses for our executives, including our named executive officers.
Individual Performance Goals
Consistent with our compensation philosophy of rewarding individual performance, our chief executive officer evaluates our executive team based on his determination of how each executive has performed against our corporate values and a set of individual performance objectives, which he determined and deemed to be integral to the achievement of our annual operating plan. Our compensation committee assessed our chief executive officer’s performance against a similar set of corporate values and individual performance goals. Achievement against these goals can result in an increase or decrease to the potential bonus for each executive based on the achievement of the corporate performance measures.
The individual performance goals for each of our named executive officers for fiscal 2013 were as follows:
94
|
· |
Mr. Davis – Leadership, company culture, strategy formulation, strategy execution, financial planning/performance, ethics and compliance, external relationships, talent acquisition and development of senior executives, and succession planning for senior executives. |
|
· |
Ms. Schneider – Create an operating model that will scale with revenue and member growth, develop a best-in-class end-to-end customer experience, develop an “I make a difference” culture, and grow member base and total revenue. |
|
· |
Mr. Power – Create an operating model that will scale with revenue and member growth, develop a best-in-class end-to-end customer experience, develop an “I make a difference” culture, and grow member base and total revenue. |
|
· |
Ms. Cerda – Build LifeLock corporate social responsibility resume, ensure public company compliance, maintain and develop government stakeholder relations, maximize scalability through efficient legal processes and other business contributions, and monitor changing regulatory landscape and compliance with laws. |
|
· |
Mr. Iltchev – Execution of Lemon acquisition, get smart on the competitive and strategic landscape, help define strategy for our company, and provide executive leadership for engagement with external parties and enhance our visibility and standing in the tech community. |
|
· |
Mr. Beck – 2013 MBO goals, including employee engagement score improvement, budget forecast accuracy, protection instances, and reduction of undesirable turnover, and redesign compensation program to drive behavior. |
Fiscal 2013 Bonus Decisions
For fiscal 2013, annual cash incentive bonus payments were determined after the end of the fiscal year by our compensation committee. Our compensation committee’s determination of annual cash incentive bonuses involved a two-step process. First, our compensation committee established the annual target cash incentive bonus pool for the fiscal year based on the aggregate target cash incentive bonus opportunities for all of our employees, including our executive officers. The actual bonus pool was subject to the actual level of achievement of the pre-established revenue, adjusted EBITDA, and net member growth target levels for the fiscal period and was adjusted based on our actual performance relative to the revenue, adjusted EBITDA, and net member growth target levels as approved by our compensation committee at the beginning of the year. Each corporate performance measure has a threshold at which the cash incentive bonus pool begins to be funded, a target which would fund the cash incentive bonus pool up to 100%, and a maximum which would fund the cash incentive bonus pool up to 200%.
As the second step, the cash incentive bonus payment, if any, to be received from the available cash incentive bonus pool by an executive officer was determined based on the executive’s base salary and cash incentive bonus opportunity percentage. Further, our compensation committee exercised discretion in formulating each executive officer’s bonus payment based upon the size of the available cash incentive bonus pool, a subjective assessment of the level of achievement of his or her individual performance objectives, and any other relevant factors.
For fiscal 2013, our annual cash incentive bonus program was broad based with 50.8% of our non-commission-based employees participating. For fiscal 2013 as a whole, we achieved a payout level of 178.9% of the annual target bonus pool as a result of overperforming the target levels for the revenue, adjusted EBITDA, and net member growth performance measures. The portion of the cash incentive bonus pool awarded to our named executive officers represented approximately 27.2% of the available pool.
After the end of the fiscal year, with the exception of Mr. Beck, our chief executive officer evaluated each other executive officer’s progress towards the achievement of his or her individual performance objectives. In the case of Mr. Beck, our president evaluated his progress towards the achievement of his individual performance objectives. In the case of our chief executive officer, our compensation committee evaluated his progress towards the achievement of his individual performance goals.
95
Based on both our financial performance (as measured by our revenue, adjusted EBITDA, and net member growth) for fiscal 2013 and each named executive officer’s individual performance during the year, the following bonus payments were made to our named executive officers for fiscal 2013:
|
|
|
|
|
|
|
|
|
|
|
|
|
|
|
Named Executive Officer |
|
Target Cash Incentive Bonus Opportunity (as a dollar amount) |
|
|
Cash Incentive Bonus Opportunity After Application of Multiplier (as a dollar amount) (1) |
|
|
Actual Total Cash Incentive Bonus Payment (as a dollar amount) (2) |
|
|||
|
Todd Davis |
|
$ |
478,950 |
|
|
$ |
856,842 |
|
|
$ |
860,000 |
|
|
Hilary A. Schneider |
|
$ |
206,000 |
|
|
$ |
368,534 |
|
|
$ |
391,000 |
|
|
Chris G. Power |
|
$ |
194,271 |
|
|
$ |
347,551 |
|
|
$ |
370,000 |
|
|
Clarissa Cerda |
|
$ |
159,650 |
|
|
$ |
285,614 |
|
|
$ |
273,000 |
|
|
Velislav (Villi) Iltchev |
|
$ |
62,500 |
(3) |
|
$ |
111,813 |
(3) |
|
$ |
126,813 |
|
|
Donald M. Beck |
|
$ |
25,000 |
(4) |
|
$ |
44,725 |
(4) |
|
$ |
50,000 |
|
|
(1) |
At the end of the year, our compensation committee established a multiplier of the annual cash incentive bonus opportunity to reflect whether our company exceeded or failed to achieve the targets for the corporate financial performance objectives for that year. Based on exceeding the corporate financial performance objectives of revenue, adjusted EBITDA, and net member growth by a substantial percentage for fiscal 2013, our compensation committee established a multiplier of 1.789, which resulted in significantly higher cash incentive bonus opportunities for our executives, including our named executive officers. |
|
|
(2) |
Reflects individual performance adjustments. |
|
|
(3) |
Mr. Iltchev joined our company in July 2013. Accordingly, this amount represents Mr. Iltchev’s pro-rated cash incentive bonus opportunity. |
|
|
(4) |
Mr. Beck joined our company in June 2013. Accordingly, this amount represents Mr. Beck’s pro-rated cash incentive bonus opportunity. |
|
Long-Term Incentive Compensation
Grants of stock-based awards may result in limited rewards if the price of our common stock does not appreciate significantly, but may provide substantial rewards to executives as our stockholders in general benefit from stock price appreciation. Grants of stock-based awards are also intended to align compensation with the price performance of our common stock. Stock-based awards are also a useful vehicle for attracting and retaining executive talent in a competitive market. Our stock-based awards may consist of time-based or performance-based stock options, RSUs, restricted stock awards, or a combination thereof.
Our compensation committee develops its stock-based award determinations based on its judgment as to whether the total compensation packages provided to our executive officers, including prior stock-based awards and the level of vested and unvested stock-based awards then held by each participating officer, are sufficient to retain, motivate, and adequately reward the executive officers. In addition, our compensation committee considers the potential dilution associated with the stock-based awards.
Historically, we have used two forms of stock-based awards for long-term incentive compensation for our executive officers: stock options (both time-based and performance-based) and RSUs.
Stock Options
We believe that stock options, when granted with exercise prices equal to the fair market value of our common stock on the date of grant, provide an appropriate long-term incentive for our executive officers because they are rewarded only to the extent that, following the grant date of the options, our stock price grows and our stockholders see the value of their investment also grow.
Restricted Stock Units
RSUs represent the right to receive one share of our common stock for each RSU upon the settlement date, which is the date on which certain conditions, such as continued employment with us for a pre-determined length of time, are satisfied. RSU awards reflect both increases and decreases in stock prices from the grant-date market prices and thus tie compensation more closely to changes in stockholder value at all levels compared to stock options, whose intrinsic value changes only when the market price of shares is above the exercise price. RSUs also have retention value even during periods in which our trading price does not appreciate, which supports continuity in the senior management team. In addition, RSUs allow our compensation committee to deliver equivalent value with use of fewer authorized shares.
Equity Award Mix
Our compensation committee may in the future adjust the mix of equity award types or approve different awards as part of the overall long-term incentive award. Awards made in connection with a new, extended, or expanded employment relationship may
96
involve a different mix of time-based and performance-based stock options, RSUs, or other stock-based awards depending on our compensation committee’s assessment of the total compensation package being offered.
2013 Long-Term Incentive Compensation
For fiscal 2013, the long-term incentive compensation for our executive officers, including our named executive officers, took the form of stock option grants, as was the case for the preceding three fiscal years.
In addition, we granted service-vesting RSUs as part of the new hire grant to Mr. Iltchev. The size of stock option grants to each executive officer during fiscal 2013 reflected his or her position with our company, an assessment of the stock-based compensation award practices of the companies in our compensation peer group as well as broader market data of the technology industry, and an assessment of the outstanding stock-based compensation awards then held by the executive officer. In addition, in making its award decisions, our compensation committee exercised its judgment to set the size of each award at a level it considered appropriate to create a meaningful opportunity for reward predicated on the creation of long-term stockholder value. The size of the awards of options and RSUs to Mr. Iltchev and the options to Mr. Beck were the result of negotiations with them as part of their recruitment to join our company.
The stock options were granted with an exercise price equal to the fair market value of our common stock on the date of grant. The stock-based compensation awards granted to our named executive officers were as follows:
|
|
|
|
|
|
|
|
|
|
|
Named Executive Officer |
|
Number of Shares of the Company’s Common Stock Underlying Stock Options |
|
|
Number of Shares of the Company’s Common Stock Underlying Restricted Stock Unit Awards |
|
||
|
Todd Davis |
|
|
350,000 |
|
|
|
— |
|
|
Hilary A. Schneider |
|
|
50,000 |
|
|
|
— |
|
|
Chris G. Power |
|
|
200,000 |
|
|
|
— |
|
|
Clarissa Cerda |
|
|
200,000 |
|
|
|
— |
|
|
Velislav (Villi) Iltchev |
|
|
300,000 |
(1) |
|
|
100,000 |
(1) |
|
Donald M. Beck |
|
|
300,000 |
(1) |
|
|
— |
|
|
(1) |
These stock-based compensation awards were granted to Messrs. Iltchev and Beck in connection with their joining our company. |
Approval Process for Equity Grants
Executives and other employees receive long-term equity awards pursuant to the terms of our 2012 Incentive Compensation Plan, or the 2012 Plan. Our compensation committee administers the 2012 Plan and establishes the rules for all awards granted thereunder, including grant guidelines, vesting schedules, and other provisions. Our compensation committee reviews these rules from time to time and considers, among other things, the interests of our stockholders, market conditions, information provided by our compensation consultant and legal advisor, performance objectives, and recommendations made by our chief executive officer.
Our compensation committee reviews awards for all of our executive officers. Our compensation committee has established a process in which our compensation committee reviews the recommendations of our chief executive officer for executives (other than himself) and approves or modifies the proposed grants in its discretion.
We have no practice of timing grants of stock options or RSUs to coordinate with the release of material non-public information, and we have not timed the release of material non-public information for the purpose of affecting the value of named executive officer compensation.
Severance and Change in Control Benefits
We have severance and change of control benefits for our executive officers that are documented in their respective employment agreements or, in the case of Mr. Beck, in a separate severance agreement. We believe that these benefits were necessary to attract our executives and that the change in control benefits are in the best interests of our company and our stockholders because they help assure us that we will have the continued dedication and objectivity of our executive officers, notwithstanding the possibility or occurrence of a change in control. For further details see “Executive Compensation—Potential Payments Upon Termination or Change in Control” below.
Tax and Accounting Considerations
Deductibility of Executive Compensation
We take into account the tax effects of our compensation on us and our executive officers. Currently, Section 162(m) of the Internal Revenue Code limits the deductibility for federal income tax purposes of remuneration in excess of $1 million paid to each of any publicly held corporation’s chief executive officer and three other most highly compensated executive officers (excluding the
97
chief financial officer) in any taxable year. Thus, we may deduct certain types of remuneration paid to any of these individuals only to the extent that such remuneration during any taxable year does not exceed $1 million. Generally, remuneration in excess of $1 million may only be deducted if it is “performance-based compensation” within the meaning of the Internal Revenue Code. In this regard, the compensation income realized upon the exercise of stock options granted under a stockholder-approved stock option plan generally will be deductible as long as the options are granted by a committee whose members are non-employee directors and certain other conditions are satisfied.
When reasonably practicable, our compensation committee seeks to qualify the variable compensation paid to our executive officers for the “performance-based compensation” exemption from Section 162(m). As such, in approving the amount and form of compensation for our executive officers, our compensation committee considers all elements of the cost to us of providing such compensation, including the potential impact of Section 162(m). In the future, our compensation committee may, in its judgment, authorize compensation payments that do not comply with an exemption from the deductibility limit when it believes that such payments are appropriate to attract and retain executive talent and in our best interests and the best interests of our stockholders.
Taxation of “Parachute” Payments
Sections 280G and 4999 of the Internal Revenue Code provide that executive officers and directors who hold significant equity interests and certain other service providers may be subject to significant additional taxes if they receive payments or benefits in connection with a change in control of a company that exceeds certain prescribed limits, and that the company (or a successor) may forfeit a deduction on the amounts subject to this additional tax. We did not provide any executive officer, including any named executive officer, with a “gross-up” or other reimbursement payment for any tax liability that he or she might owe as a result of the application of Sections 280G and 4999 during fiscal 2013, and we have not agreed and are not otherwise obligated to provide any executive officer with such a “gross-up” or other reimbursement.
Accounting for Stock-Based Compensation
We account for stock-based employee compensation arrangements in accordance with the provisions of Financial Accounting Standards Board Accounting Standards Codification Topic 718 “Compensation – Stock Compensation,” (“ASC Topic 718”). ASC Topic 718 requires companies to measure the compensation expense for all stock-based payment awards made to employees and directors, including stock options and RSUs, based on the grant date “fair value” of these awards. This calculation is performed for accounting purposes and reported in the compensation tables below, even though our named executive officers may never realize any value from their awards. ASC Topic 718 also requires companies to recognize the compensation cost of their stock-based compensation awards in their income statements over the period that an employee or director is required to render service in exchange for the option or other award. In determining stock-based compensation, our compensation committee considers the potential expense of these awards under ASC Topic 718 and the impact on us.
Compensation Committee Interlocks and Insider Participation
Messrs. Briggs, Cowan, and Pimentel served as the members of our compensation committee during 2013.
Mr. Cowan has a relationship with us that requires disclosure under Item 404 of Regulation S-K under the Exchange Act. See “Certain Relationships and Related Party Transactions – Investors’ Rights Agreement” and “– Indemnification of Officers and Directors” in the Proxy Statement, each of which are incorporated by reference into this section of this Form 10-K/A.
None of Messrs. Briggs, Cowan, or Pimentel have been at any time one of our officers or employees. Other than Todd Davis, who currently serves, and served during the last year, on the board of directors and compensation committee of Vimo, Inc., of which Srinivasan (Chini) Krishnan is the Chief Executive Officer, none of our executive officers currently serves, or has served during the last year, as a member of the board of directors or compensation committee of any entity that has one or more of its executive officers serving on our board of directors or our compensation committee.
Our compensation committee has reviewed and discussed with management the Compensation Discussion and Analysis included in this Form 10-K/A. Based on such review and discussion, our compensation committee recommended to our board of directors that the Compensation Discussion and Analysis be included in this Form 10-K/A.
Respectfully submitted,
Albert A. (Rocky) Pimentel, Chairman
Gary S. Briggs
David Cowan
98
2013 Summary Compensation Table
The following table provides, for the fiscal years ended December 31, 2013, 2012, and 2011, information regarding the compensation of our principal executive officer, our principal financial officer, and each of our four other most highly compensated executive officers who were serving as executive officers on December 31, 2013, the end of our last completed fiscal year. We refer to these executive officers in this Form 10-K/A as our named executive officers.
|
|
|
|
|
|
|
|
|
|
|
|
|
|
|
|
|
|
|
|
|
|
|
|
|
|
|
|
|
|
|
||||
|
Name and Principal Position |
|
Year |
|
|
Salary |
|
|
Stock Awards (1) |
|
|
Option Awards (2) |
|
|
Non-Equity Incentive Plan Compensation (3) |
|
|
All Other Compensation |
|
|
Total |
|
|
|||||||||||
|
|
|
|
|
|
|
|
|
|
|||||||||||||||||||||||||
|
Todd Davis |
|
|
2013 |
|
|
$ |
477,340 |
|
|
|
— |
|
|
$ |
1,826,467 |
|
|
$ |
860,000 |
|
|
$ |
17,552 |
(4) |
|
$ |
3,151,359 |
|
|
||||
|
Chairman and Chief |
|
|
2012 |
|
|
$ |
450,038 |
|
|
|
— |
|
|
$ |
815,312 |
|
|
$ |
671,460 |
|
|
$ |
21,259 |
|
|
$ |
1,958,069 |
|
|
||||
|
Executive Officer |
|
|
2011 |
|
|
$ |
408,462 |
|
|
|
— |
|
|
|
— |
|
|
$ |
212,790 |
|
|
$ |
20,567 |
|
|
$ |
641,819 |
|
|
||||
|
|
|
|
|
|
|
|
|
|
|||||||||||||||||||||||||
|
Hilary A. Schneider(5) |
|
|
2013 |
|
|
$ |
410,615 |
|
|
|
— |
|
|
$ |
260,924 |
|
|
$ |
391,000 |
|
|
$ |
50,714 |
(6) |
|
$ |
1,113,253 |
|
|
||||
|
President |
|
|
2012 |
|
|
$ |
115,385 |
|
|
$ |
2,250,000 |
|
|
$ |
2,349,674 |
|
|
$ |
50,000 |
|
|
$ |
15,994 |
|
|
$ |
4,781,053 |
|
|
||||
|
|
|
|
2011 |
|
|
|
— |
|
|
|
— |
|
|
|
— |
|
|
|
— |
|
|
|
— |
|
|
|
— |
|
|
|
|||
|
|
|
|
|
|
|
|
|
|
|
||||||||||||||||||||||||
|
Chris G. Power(7) |
|
|
2013 |
|
|
$ |
323,233 |
|
|
|
— |
|
|
$ |
1,043,695 |
|
|
$ |
370,000 |
|
|
$ |
52,321 |
(8) |
|
$ |
1,789,299 |
|
|
|
|||
|
Chief Financial Officer |
|
|
2012 |
|
|
$ |
299,115 |
|
|
|
— |
|
|
$ |
653,806 |
|
|
$ |
306,240 |
|
|
$ |
63,918 |
|
|
$ |
1,323,079 |
|
|
|
|||
|
|
|
|
2011 |
|
|
$ |
269,231 |
|
|
|
— |
|
|
$ |
987,152 |
|
|
$ |
152,600 |
|
|
$ |
65,423 |
|
|
$ |
1,474,406 |
|
|
|
|||
|
|
|
|
|
|
|
|
|
|
|
||||||||||||||||||||||||
|
Clarissa Cerda |
|
|
2013 |
|
|
$ |
318,227 |
|
|
|
— |
|
|
$ |
1,043,695 |
|
|
$ |
273,000 |
|
|
$ |
17,604 |
(9) |
|
$ |
1,652,526 |
|
|
|
|||
|
Executive Vice |
|
|
2012 |
|
|
$ |
285,589 |
|
|
|
— |
|
|
$ |
505,768 |
|
|
$ |
248,000 |
|
|
$ |
22,980 |
|
|
$ |
1,062,337 |
|
|
|
|||
|
President, Chief Legal |
|
|
2011 |
|
|
$ |
257,536 |
|
|
|
— |
|
|
|
— |
|
|
$ |
133,130 |
|
|
$ |
20,440 |
|
|
$ |
411,106 |
|
|
|
|||
|
Officer, and Secretary |
|
|
|
|
|
|
|
|
|
|
|
|
|
|
|
|
|
|
|
|
|
|
|
|
|
|
|
|
|
|
|||
|
|
|
|
|
|
|
|
|
|
|
||||||||||||||||||||||||
|
Velislav (Villi) Iltchev(10) |
|
|
2013 |
|
|
$ |
121,154 |
|
|
$ |
1,249,000 |
|
|
$ |
1,629,966 |
|
|
$ |
126,813 |
|
|
$ |
1,488 |
(11) |
|
$ |
3,128,421 |
|
|
|
|||
|
Executive Vice |
|
|
2012 |
|
|
|
— |
|
|
|
— |
|
|
|
— |
|
|
|
— |
|
|
|
— |
|
|
|
— |
|
|
|
|||
|
President, Corporate |
|
|
2011 |
|
|
|
— |
|
|
|
— |
|
|
|
— |
|
|
|
— |
|
|
|
— |
|
|
|
— |
|
|
|
|||
|
Development |
|
|
|
|
|
|
|
|
|
|
|
|
|
|
|
|
|
|
|
|
|
|
|
|
|
|
|
|
|
|
|||
|
|
|
|
|
|
|
|
|
|
|
||||||||||||||||||||||||
|
Donald M. Beck(12) |
|
|
2013 |
|
|
$ |
155,769 |
|
|
|
— |
|
|
$ |
1,895,510 |
|
|
$ |
132,248 |
(13) |
|
$ |
12,473 |
(14) |
|
$ |
2,196,000 |
|
|
|
|||
|
Senior Vice President, |
|
|
2012 |
|
|
|
— |
|
|
|
— |
|
|
|
— |
|
|
|
— |
|
|
|
— |
|
|
|
— |
|
|
|
|||
|
Enterprise Sales & |
|
|
2011 |
|
|
|
— |
|
|
|
— |
|
|
|
— |
|
|
|
— |
|
|
|
— |
|
|
|
— |
|
|
|
|||
|
Alliances |
|
|
|
|
|
|
|
|
|
|
|
|
|
|
|
|
|
|
|
|
|
|
|
|
|
|
|
|
|
|
|||
|
(1) |
The amounts in this column reflect the aggregate grant date fair value of stock awards granted to our named executive officers during the fiscal year, computed in accordance with FASB ASC Topic 718. The valuation assumptions used in determining such amounts are described in Note 12 to our audited consolidated financial statements included in this Form 10-K/A. The amounts reported in this column reflect our accounting expense for these awards and do not correspond to the actual economic value that may be received by our named executive officers from their stock awards. |
||||
|
(2) |
The amounts in this column reflect the aggregate grant date fair value of option awards granted to our named executive officers during the fiscal year, computed in accordance with FASB ASC Topic 718. The valuation assumptions used in determining such amounts are described in Note 12 to our audited consolidated financial statements included in this Form 10-K/A. The amounts reported in this column reflect our accounting expense for these awards and do not correspond to the actual economic value that may be received by our named executive officers from their option awards. |
||||
|
(3) |
The amounts in this column for fiscal 2013 represent the amounts earned and payable under our 2013 Bonus Plan, which were paid on February 21, 2014, and, in the case of Mr. Beck, amounts earned and payable under our 2013 Sales Commission Plan. The amounts in this column for fiscal 2012 represent the amounts earned and payable under our 2012 Bonus Plan, which were paid on February 22, 2013. The amounts in this column for fiscal 2011 represent the amounts earned and payable under our 2011 Bonus Plan, which were paid on February 24, 2012. See “Compensation Discussion and Analysis—Compensation Elements—Annual Cash Incentive Bonuses” for more information. |
||||
|
(4) |
Consists of (i) matching contributions under our 401(k) plan in the amount of $15,300, (ii) group term life insurance premiums in the amount of $192, (iii) executive parking in the amount of $480, (iv) annual membership to car service in the amount of $528, (v) meals for Mr. Davis’ spouse in connection with her attendance at several business meetings in the amount of $288, (vi) meals and incidentals for Mr. Davis’ family at certain company events in the amount of $265, and (vii) tax gross up related to commemorative gift for our one year anniversary as a public company in the amount of $499. |
||||
|
(5) |
Ms. Schneider became our President on September 14, 2012. |
||||
|
(6) |
Consists of (i) matching contributions under our 401(k) plan in the amount of $14,083, (ii) group term life insurance premiums in the amount of $192, (iii) executive parking in the amount of $480, (vi) annual membership to car service in the amount of $528, (v) temporary accommodations and personal travel expenses in the amount of $31,508, (vi) payment of taxes related to relocation expenses paid in 2012 in the amount of $3,416, and (vii) tax gross up related to commemorative gift for our one year anniversary as a public company in the amount of $507. |
||||
|
(7) |
Mr. Power became our Chief Financial Officer on January 10, 2011. |
||||
99
|
(8) |
Consists of (i) matching contributions under our 401(k) plan in the amount of $15,300 (ii) group term life insurance premiums in the amount of $192, (iii) executive parking in the amount of $480, (iv) temporary accommodations and personal travel expenses in the amount of $34,354, (v) travel expenses for Mr. Powers’ family to attend certain company events in the amount of $1,478, and (vi) tax gross up related to commemorative gift for our one year anniversary as a public company in the amount of $517. |
||||
|
(9) |
Consists of (i) matching contributions under our 401(k) plan in the amount of $15,300, (ii) group term life insurance premiums in the amount of $192, (iii) executive parking in the amount of $480, (iv) annual membership to car service in the amount of $528, (v) travel expenses for Ms. Cerda’s spouse to attend certain company events in the amount of $587, and (vi) tax gross up related to commemorative gift for our one year anniversary as a public company in the amount of $517. |
||||
|
(10) |
Mr. Iltchev became our Executive Vice President, Corporate Development on July 29, 2013. |
||||
|
(11) |
Consists of (i) matching contributions under our 401(k) plan in the amount of $923, (ii) group term life insurance premiums in the amount of $80, and (iii) tax gross up related to commemorative gift for our one year anniversary as a public company in the amount of $485. |
||||
|
(12) |
Mr. Beck became our Senior Vice President, Enterprise Sales & Alliances on June 17, 2013. |
||||
|
(13) |
Consists of (i) a bonus payment under our 2013 Bonus Plan in the amount of $50,000, which was paid on February 21, 2014, (ii) commission payments under our 2013 Sales Commission Plan in the aggregate amount of $47,852, which were paid during fiscal 2013, and (iii) a commission payment under our 2013 Sales Commission Plan in the amount of $34,396, which was paid on January 24, 2014. |
||||
|
(14) |
Consists of (i) matching contributions under our 401(k) plan in the amount of $11,145, (ii) group term life insurance premiums in the amount of $96, (iii) annual membership to designated driver service in the amount of $528, (iv) travel expenses for Mr. Beck’s spouse to attend certain company events in the amount of $195, and (v) tax gross up related to commemorative gift for our one year anniversary as a public company in the amount of $509. |
||||
2013 Grants of Plan-Based Awards
The following table sets forth certain information with respect to grants of plan-based awards to our named executive officers during the fiscal year ended December 31, 2013.
|
|
|
|
|
|
|
|
|
|
|
|
|
|
|
|
|
|
|
|
|
|
|
|
|
|
|
|
|
|
|
|
|
|
|
|
|
|
|
|
|
|
|
|
|
|
|
||||||
|
|
|
Grant Date |
|
|
Estimated Future Payouts Under Non-Equity Incentive Plan Awards (1) |
|
|
Estimated Future Payouts Under Equity Incentive Plan Awards |
|
|
All Other Option Awards: Number of Shares of Stocks or Units (#) |
|
|
All Other Option Awards: Number of Securities Underlying Options (#) |
|
|
Exercise or Base Price of Option Awards ($/Sh) |
|
|
Grant Date Fair Value of Stock and Option Awards (2) |
|
|
|||||||||||||||||||||||||||||
|
Name |
|
|
|
|
Threshold ($) |
|
|
Target ($) |
|
|
Maximum ($) |
|
|
Threshold (#) |
|
|
Target (#) |
|
|
Maximum (#) |
|
|
|
|
|
|
|
|
|
|
|
|
|
|
|
|
|||||||||||||||
|
|
|
|
|
|
|
|
|
|
|
|
|
|
|
|
|||||||||||||||||||||||||||||||||||||
|
Todd Davis |
|
|
|
|
|
|
— |
|
|
$ |
478,950 |
|
|
|
— |
|
|
|
— |
|
|
|
— |
|
|
|
— |
|
|
|
— |
|
|
|
— |
|
|
|
— |
|
|
|
— |
|
|
|
|
||||
|
|
|
|
02/22/2013 |
|
|
|
— |
|
|
|
— |
|
|
|
— |
|
|
|
— |
|
|
|
— |
|
|
|
— |
|
|
|
— |
|
|
|
350,000 |
(3) |
|
$ |
11.05 |
|
|
$ |
1,826,467 |
|
|
|
|
||||
|
|
|
|
|
|
|
|
|
|
|
|
|
|
|
|
|||||||||||||||||||||||||||||||||||||
|
Hilary A. Schneider |
|
|
|
|
|
|
— |
|
|
$ |
206,000 |
|
|
|
— |
|
|
|
— |
|
|
|
— |
|
|
|
— |
|
|
|
— |
|
|
|
— |
|
|
|
— |
|
|
|
— |
|
|
|
|
||||
|
|
|
|
02/22/2013 |
|
|
|
— |
|
|
|
— |
|
|
|
— |
|
|
|
— |
|
|
|
— |
|
|
|
— |
|
|
|
— |
|
|
|
50,000 |
(4) |
|
$ |
11.05 |
|
|
$ |
260,924 |
|
|
|
|
||||
|
|
|
|
|
|
|
|
|
|
|
|
|
|
|
|
|||||||||||||||||||||||||||||||||||||
|
Chris G. Power |
|
|
|
|
|
|
— |
|
|
$ |
194,271 |
|
|
|
— |
|
|
|
— |
|
|
|
— |
|
|
|
— |
|
|
|
— |
|
|
|
— |
|
|
|
— |
|
|
|
— |
|
|
|
|
||||
|
|
|
|
02/22/2013 |
|
|
|
— |
|
|
|
— |
|
|
|
— |
|
|
|
— |
|
|
|
— |
|
|
|
— |
|
|
|
— |
|
|
|
200,000 |
(3) |
|
$ |
11.05 |
|
|
$ |
1,043,695 |
|
|
|
|
||||
|
|
|
|
|
|
|
|
|
|
|
|
|
|
|
|
|||||||||||||||||||||||||||||||||||||
|
Clarissa Cerda |
|
|
|
|
|
|
— |
|
|
$ |
159,650 |
|
|
|
— |
|
|
|
— |
|
|
|
— |
|
|
|
— |
|
|
|
— |
|
|
|
— |
|
|
|
— |
|
|
|
— |
|
|
|
|
||||
|
|
|
|
02/22/2013 |
|
|
|
— |
|
|
|
— |
|
|
|
— |
|
|
|
— |
|
|
|
— |
|
|
|
— |
|
|
|
— |
|
|
|
200,000 |
(3) |
|
$ |
11.05 |
|
|
$ |
1,043,695 |
|
|
|
|
||||
|
|
|
|
|
|
|
|
|
|
|
|
|
|
|
|
|||||||||||||||||||||||||||||||||||||
|
Velislav (Villi) Iltchev |
|
|
|
|
|
|
— |
|
|
$ |
62,500 |
|
|
|
— |
|
|
|
— |
|
|
|
— |
|
|
|
— |
|
|
|
— |
|
|
|
— |
|
|
|
— |
|
|
|
— |
|
|
|
|
||||
|
|
|
|
07/29/2013 |
|
|
|
— |
|
|
|
— |
|
|
|
— |
|
|
|
— |
|
|
|
— |
|
|
|
— |
|
|
|
— |
|
|
|
300,000 |
(5) |
|
$ |
11.02 |
|
|
$ |
1,629,966 |
|
|
|
|
||||
|
|
|
|
08/22/2013 |
|
|
|
— |
|
|
|
— |
|
|
|
— |
|
|
|
— |
|
|
|
— |
|
|
|
— |
|
|
|
100,000 |
(6) |
|
|
— |
|
|
|
— |
|
|
$ |
1,249,000 |
|
|
|
|
||||
|
|
|
|
|
|
|
|
|
|
|
|
|
|
|
|
|||||||||||||||||||||||||||||||||||||
|
Donald M. Beck |
|
|
|
|
|
|
— |
|
|
$ |
25,000 |
|
|
|
— |
|
|
|
— |
|
|
|
— |
|
|
|
— |
|
|
|
— |
|
|
|
— |
|
|
|
— |
|
|
|
— |
|
|
|
|
||||
|
|
|
|
|
|
|
|
— |
|
|
$ |
37,500 |
|
|
|
— |
|
|
|
— |
|
|
|
— |
|
|
|
— |
|
|
|
— |
|
|
|
— |
|
|
|
— |
|
|
|
— |
|
|
|
|
||||
|
|
|
|
07/01/2013 |
|
|
|
— |
|
|
|
— |
|
|
|
— |
|
|
|
— |
|
|
|
— |
|
|
|
— |
|
|
|
— |
|
|
|
225,000 |
(7) |
|
$ |
11.50 |
|
|
$ |
1,279,236 |
|
|
|
|
||||
|
|
|
|
07/01/2013 |
|
|
|
— |
|
|
|
— |
|
|
|
— |
|
|
|
— |
|
|
|
75,000 |
(8) |
|
|
75,000 |
(8) |
|
|
— |
|
|
|
— |
|
|
$ |
11.50 |
|
|
$ |
616,274 |
|
|
|
|
||||
|
(1) |
Our 2013 Bonus Plan and our 2013 Sales Commission Plan had no individual threshold or maximums. Except for the $37,500 target for Mr. Beck, the amounts represent the applicable target incentive compensation opportunity for our named executive officers under our 2013 Bonus Plan. Messrs. Iltchev’s and Beck’s annual performance-based cash bonus targets of $150,000 and $50,000, respectively, have been pro-rated from their respective hire dates. All such awards have been paid, and the actual amounts paid are set forth in the 2013 Summary Compensation Table above. For a description of our 2013 Bonus Plan and amounts earned thereunder, see “Compensation Discussion and Analysis – Compensation Elements – Annual Cash Incentive Bonuses.” The $37,500 target for Mr. Beck represents the applicable fourth quarter target sales commission opportunity for Mr. Beck under our 2013 Sales Commission Plan. Mr. Beck’s commissions for prior quarters were paid earlier in the year. Mr. Beck’s award has been paid and the actual amount paid is set forth in the 2013 Summary Compensation Table above. |
||
100
|
(2) |
The amounts in this column reflect the aggregate grant date fair value of stock and option awards granted to our named executive officers during the fiscal year, computed in accordance with FASB ASC Topic 718. The valuation assumptions used in determining such amounts are described in Note 12 to our audited consolidated financial statements included in this Form 10-K/A. The amounts reported in this column reflect our accounting expense for these awards and do not correspond to the actual economic value that may be received by our named executive officers from their stock awards. |
||
|
(3) |
1/48th of the total number of shares underlying this option vest on each monthly anniversary of the date of grant for a period of 48 months. |
||
|
(4) |
25% of the total number of shares underlying this option vested on February 22, 2014. The remaining 75% of the total number of shares underlying this option vest in equal monthly installments for a period of 36 months thereafter. |
||
|
(5) |
25% of the total number of shares underlying this option vest on July 29, 2014. The remaining 75% of the total number of shares underlying this option will vest in equal monthly installments for a period of 36 months thereafter. |
||
|
(6) |
These RSUs vest and are delivered quarterly over a four-year period. |
||
|
(7) |
25% of the total number of shares underlying this option vest on July 1, 2014. The remaining 75% of the total number of shares underlying this option vest in equal monthly installments for a period of 36 months thereafter. |
||
|
(8) |
If we have gross new members from the partner channel, bookings for ID Analytics, Inc., lifetime value of new members from the partner channel, and gross conversion rate for internal and external phone sales for the fiscal year ending December 31, 2014 of at least 95% of the 2014 gross new members from the partner channel, bookings for ID Analytics, Inc., lifetime value of new members from the partner channel, and gross conversion rate for internal and external phone sales targets to be approved by our board of directors, (a) 41.667% of the total number of shares underlying this option vest on March 31, 2015, (b) 2.083% of the total number of shares underlying this option vest on April 1, 2015, and (c) 2.083% of the total number of shares underlying this option vest on each monthly anniversary thereafter for a period of 27 months. |
||
Outstanding Equity Awards as of December 31, 2013
The following table provides information regarding outstanding equity awards held by our named executive officers as of December 31, 2013.
|
|
|
|
|
|
|
|
|
|
|
|
|
|
|
|
|
|
|
|
|
|
|
|
|
|
|
|
|
|
|
|
|
|
|
|||||||||||
|
|
|
|
|
|
Option Awards |
|
|
Stock Awards |
|
|
||||||||||||||||||||||||||||||||||
|
Name |
|
Grant Date |
|
|
Number of Securities Underlying Unexercised Options (1) |
|
|
Equity Incentive Plan Awards: Number of Securities Underlying Unexercised Unearned Options (1) |
|
|
Option Exercise Price |
|
|
Option Expiration Date |
|
|
Number of Shares or Units of Stock that Have Not Vested (1) |
|
|
Market Value of Shares or Units of Stock that Have Not Vested (2) |
|
|
||||||||||||||||||||||
|
|
|
|
|
|
Exercisable |
|
|
Unexercisable |
|
|
|
|
|
|
|
|
|
|
|
|
|
|
|
|
|
|
|
|
||||||||||||||||
|
|
|
|
|
|
|
|
|
|
|
|
|
|
||||||||||||||||||||||||||||||||
|
Todd Davis |
|
|
12/5/2007 |
|
|
|
1,000 |
(3) |
|
|
— |
|
|
|
— |
|
|
$ |
4.50 |
|
|
|
12/5/2017 |
|
|
|
— |
|
|
|
— |
|
|
|
|
|
||||||||
|
|
|
|
8/7/2009 |
|
|
|
636,000 |
(4) |
|
|
— |
|
|
|
— |
|
|
$ |
2.71 |
|
|
|
8/7/2019 |
|
|
|
— |
|
|
|
— |
|
|
|
|
|
||||||||
|
|
|
|
8/7/2009 |
|
|
|
14,000 |
(4) |
|
|
— |
|
|
|
— |
|
|
$ |
2.71 |
|
|
|
8/7/2019 |
|
|
|
— |
|
|
|
— |
|
|
|
|
|
||||||||
|
|
|
|
3/29/2012 |
|
|
|
20,001 |
(5) |
|
|
179,999 |
(5) |
|
|
— |
|
|
$ |
5.20 |
|
|
|
3/29/2022 |
|
|
|
— |
|
|
|
— |
|
|
|
|
|
||||||||
|
|
|
|
2/22/2013 |
|
|
|
72,916 |
(6) |
|
|
277,084 |
(6) |
|
|
— |
|
|
$ |
11.05 |
|
|
|
2/22/2023 |
|
|
|
— |
|
|
|
— |
|
|
|
|
|
||||||||
|
|
|
|
|
|
|
|
|
|
|
|
|
|
||||||||||||||||||||||||||||||||
|
Hilary Schneider |
|
|
10/2/2012 |
|
|
|
125,000 |
(7) |
|
|
275,000 |
(7) |
|
|
— |
|
|
$ |
9.00 |
|
|
|
10/2/2022 |
|
|
|
— |
|
|
|
— |
|
|
|
|
|
||||||||
|
|
|
|
10/2/2012 |
|
|
|
— |
|
|
|
150,000 |
(8) |
|
|
— |
|
|
$ |
9.00 |
|
|
|
10/2/2022 |
|
|
|
— |
|
|
|
— |
|
|
|
|
|
||||||||
|
|
|
|
10/2/2012 |
|
|
|
— |
|
|
|
— |
|
|
|
— |
|
|
|
— |
|
|
|
— |
|
|
|
171,864 |
(9) |
|
$ |
2,820,288 |
|
|
|
|
|
||||||||
|
|
|
|
2/22/2013 |
|
|
|
— |
|
|
|
50,000 |
(10) |
|
|
— |
|
|
$ |
11.05 |
|
|
|
2/22/2023 |
|
|
|
— |
|
|
|
— |
|
|
|
|
|
||||||||
|
|
|
|
|
|
|
|
|
|
|
|
|
|
||||||||||||||||||||||||||||||||
|
Chris G. Power |
|
|
2/10/2011 |
|
|
|
240,209 |
(11) |
|
|
94,791 |
(11) |
|
|
— |
|
|
$ |
3.79 |
|
|
|
2/10/2021 |
|
|
|
— |
|
|
|
— |
|
|
|
|
|
||||||||
|
|
|
|
2/10/2011 |
|
|
|
21,000 |
(12) |
|
|
— |
|
|
|
— |
|
|
$ |
3.79 |
|
|
|
2/10/2021 |
|
|
|
— |
|
|
|
— |
|
|
|
|
|
||||||||
|
|
|
|
3/29/2012 |
|
|
|
28,539 |
(13) |
|
|
131,461 |
(13) |
|
|
— |
|
|
$ |
5.20 |
|
|
|
3/29/2022 |
|
|
|
— |
|
|
|
— |
|
|
|
|
|
||||||||
|
|
|
|
2/22/2013 |
|
|
|
41,666 |
(6) |
|
|
158,334 |
(6) |
|
|
— |
|
|
$ |
11.05 |
|
|
|
2/22/2023 |
|
|
|
— |
|
|
|
— |
|
|
|
|
|
||||||||
|
|
|
|
|
|
|
|
|
|
|
|
|
|
||||||||||||||||||||||||||||||||
101
|
Clarissa Cerda |
|
|
5/15/2009 |
|
|
|
306,000 |
(14) |
|
|
— |
|
|
|
— |
|
|
$ |
3.00 |
|
|
|
5/15/2019 |
|
|
|
— |
|
|
|
— |
|
|
|
|
|
||||||||
|
|
|
|
3/29/2012 |
|
|
|
33,790 |
(15) |
|
|
91,210 |
(15) |
|
|
— |
|
|
$ |
5.20 |
|
|
|
3/29/2022 |
|
|
|
— |
|
|
|
— |
|
|
|
|
|
||||||||
|
|
|
|
2/22/2013 |
|
|
|
41,666 |
(6) |
|
|
158,334 |
(6) |
|
|
— |
|
|
$ |
11.05 |
|
|
|
2/22/2023 |
|
|
|
— |
|
|
|
— |
|
|
|
|
|
||||||||
|
|
|
|
|
|
|
|
|
|
|
|
|
|
||||||||||||||||||||||||||||||||
|
Velislav (Villi) Iltchev |
|
|
7/29/2013 |
|
|
|
— |
|
|
|
300,000 |
(16) |
|
|
— |
|
|
$ |
11.02 |
|
|
|
7/29/2023 |
|
|
|
— |
|
|
|
— |
|
|
|
|
|
||||||||
|
|
|
|
8/22/2013 |
|
|
|
— |
|
|
|
— |
|
|
|
— |
|
|
|
— |
|
|
|
— |
|
|
|
93,750 |
(17) |
|
$ |
1,538,438 |
|
|
|
|
|
||||||||
|
|
|
|
|
|
|
|
|
|
|
|
|
|
||||||||||||||||||||||||||||||||
|
Donald M. Beck |
|
|
7/1/2013 |
|
|
|
— |
|
|
|
225,000 |
(18) |
|
|
— |
|
|
$ |
11.50 |
|
|
|
7/1/2023 |
|
|
|
— |
|
|
|
— |
|
|
|
|
|
||||||||
|
|
|
|
7/1/2013 |
|
|
|
— |
|
|
|
— |
|
|
|
75,000 |
(19) |
|
$ |
11.50 |
|
|
|
7/1/2023 |
|
|
|
— |
|
|
|
— |
|
|
|
|
|
||||||||
|
(1) |
All of the options and stock awards granted to our named executive officers are granted under and subject to the terms of our 2006 Plan or 2012 Plan, as further described below under “Employee Benefit and Stock Plans.” |
|
(2) |
The market value of unvested shares is calculated by multiplying the number of unvested shares held by the applicable named executive officer by the closing market price of our common stock on the New York Stock Exchange on December 31, 2013, which was $16.41 per share. |
|
(3) |
25% of the total number of shares underlying this option vested on December 5, 2008. The remaining shares underlying this option vested at a rate of 1/48th of the total number of shares underlying this option on the last day of each month thereafter for a period of 36 months. |
|
(4) |
25% of the total number of shares underlying this option vested on August 7, 2010. The remaining shares underlying this option vested at a rate of 1/48th of the total number of shares underlying this option on the seventh day of each month thereafter for a period of 36 months. |
|||||
|
(5) |
1/30th of the total number of shares underlying this option vest on the twenty-ninth day of each month, beginning on October 29, 2013, for a period of 30 months. |
|||||
|
(6) |
1/48th of the total number of shares underlying this option vest on each monthly anniversary of the date of grant for a period of 48 months. |
|||||
|
(7) |
25% of the total number of shares underlying this option vested on September 14, 2013. The remaining shares underlying this option vest at a rate of 1/48th of the total number of shares underlying this option on the fourteenth day of each month thereafter for a period of 36 months. |
|||||
|
(8) |
If we have revenue, EBITDA, and net new members for the fiscal year ending December 31, 2013 of at least 95% of the 2013 revenue, EBITDA, and net new member targets approved by our board of directors, then 39.583% of the total number of shares underlying this option vest on March 31, 2014. The remaining shares underlying this option vest at a rate of 1/48th of the total number of shares underlying this option on the fourteenth day of each month thereafter for a period of 30 months. |
|||||
|
(9) |
25% of the RSUs vested on September 14, 2013. The remaining RSUs vest in equal monthly installments over three years thereafter. |
|||||
|
(10) |
25% of the total number of shares underlying this option vest on February 22, 2014. The remaining 75% of the total number of shares underlying this option vest in equal monthly installments for a period of 36 months thereafter. |
|||||
|
(11) |
25% of the total number of shares underlying this option vested on January 10, 2012. The remaining shares underlying this option vest at a rate of 1/48th of the total number of shares underlying this option on the tenth day of each month thereafter for a period of 36 months. |
|||||
|
(12) |
100% of the total number of shares underlying this option vested upon the closing of our initial public offering. |
|||||
|
(13) |
1,359 shares vest on the twenty-ninth day of each month, beginning on April 29, 2012, for a period of 35 months; 8,649 shares vest on the twenty-ninth day of each month, beginning on March 29, 2015, for a period of 12 months; and 8,647 shares vest on March 29, 2016. |
|||||
|
(14) |
25% of the total number of shares underlying this option vested on January 12, 2010. The remaining shares underlying this option vested at a rate of 1/48th of the total number of shares underlying this option on the 12th day of each month thereafter for a period of 36 months. |
|||||
|
(15) |
3,379 shares vest on the 29th day of each month, beginning on March 29, 2013, for a period of 14 months; and 3,378 shares vest on the 29th day of each month, beginning on May 29, 2014, for a period of 23 months. |
|||||
|
(16) |
25% of the total number of shares underlying this option vest on July 29, 2014. The remaining 75% of the total number of shares underlying this option vest in equal monthly installments for a period of 36 months thereafter. |
|||||
|
(17) |
The RSUs vest quarterly over a four-year period. |
|||||
|
(18) |
25% of the total number of shares underlying this option vest on July 1, 2014. The remaining 75% of the total number of shares underlying this option vest in equal monthly installments for a period of 36 months thereafter. |
|||||
|
(19) |
If the we have gross new members from the partner channel, bookings for ID Analytics, Inc., lifetime value of new members from the partner channel, and gross conversion rate for internal and external phone sales for the fiscal year ending December 31, 2014 of at least 95% of the 2014 gross new members from the partner channel, bookings for ID Analytics, Inc., lifetime value of new members from the partner channel, and gross conversion rate for internal and external phone sales targets to be approved by the our board of directors, (a) 41.667% of the total number of shares underlying this option vest on March 31, 2015, (b) 2.083% of the total number of shares underlying this option vest on April 1, 2015, and (c) 2.083% of the total number of shares underlying this option vest on each monthly anniversary thereafter for a period of 27 months. |
|||||
102
Option Exercises and Stock Vested in Fiscal 2013
The following table describes, for the named executive officers, the number of shares acquired on the exercise of options and vesting of stock awards and the value realized on exercise of options and vesting of stock awards during the fiscal year ended December 31, 2013.
|
|
|
|
|
|
|
|
|
|
|
|
|
|
|
|
|
|
|
||
|
Name |
|
Option Awards |
|
|
Stock Awards |
|
|
||||||||||||
|
|
|
Number of Shares Acquired on Exercise |
|
|
Value Realized on Exercise (1) |
|
|
Number of Shares Acquired on Vesting |
|
|
Value Realized on Vesting (2) |
|
|
||||||
|
Todd Davis |
|
|
114,000 |
|
|
$ |
1,205,400 |
|
|
|
— |
|
|
|
— |
|
|
||
|
Hilary A. Schneider |
|
|
— |
|
|
|
— |
|
|
|
78,136 |
|
|
$ |
1,131,560 |
|
|
||
|
Chris G. Power |
|
|
94,000 |
|
|
$ |
972,803 |
|
|
|
— |
|
|
|
— |
|
|
||
|
Clarissa Cerda |
|
|
134,000 |
|
|
$ |
1,450,954 |
|
|
|
— |
|
|
|
— |
|
|
||
|
Velislav (Villi) Iltchev |
|
|
— |
|
|
|
— |
|
|
|
6,250 |
|
|
$ |
108,625 |
|
|
||
|
Donald M. Beck |
|
|
— |
|
|
|
— |
|
|
|
— |
|
|
|
— |
|
|
||
|
(1) |
For option awards, the value realized is computed as the difference between the market price on the date of exercise and the exercise price, multiplied by the number of options exercised. |
|
(2) |
For stock awards, the value realized is computed as the market price on the later of the date the restrictions lapse or the delivery date multiplied by the number of shares vested. |
Employment and Other Agreements
Todd Davis
We entered into an amended and restated employment agreement with Todd Davis, our Chairman and Chief Executive Officer, on September 14, 2012. The employment agreement has no specific term and constitutes at-will employment, and provides for an annual base salary, which our compensation committee increased to $500,000 effective February 2, 2014. Under the terms of the employment agreement, Mr. Davis is eligible to earn bonus compensation under our bonus plan and is entitled to participate in and receive all benefits under our welfare benefit plans, practices, policies, and programs. The employment agreement provides that, in the event Mr. Davis’ employment is terminated by us without “cause” or Mr. Davis terminates his employment due to a “constructive termination” (as each are defined in the employment agreement and described generally below), he is entitled to receive continued payment of his base salary for the 18-month period following the date of such termination plus an amount equal to the COBRA premiums necessary to permit Mr. Davis to continue group insurance coverage under our plans for the 18-month period following the date of such termination. Mr. Davis must execute a general release of all claims against us in order to receive any severance benefits.
In addition, we have from time to time granted Mr. Davis stock options under our incentive compensation plans. The stock option agreements relating to these grants, as amended by the employment agreement, provide for 100% acceleration of the then-unvested shares subject to these options in the event that we terminate Mr. Davis’ employment without “cause” or Mr. Davis terminates his employment due to a “constructive termination” (as each are defined in the option agreements and described generally below) during the period beginning two months prior to and ending 12 months following a “change in control” (as defined in our incentive compensation plans and described generally below). In addition, the employment agreement provides that any future stock options or other equity awards granted to Mr. Davis will contain similar vesting acceleration provisions.
Hilary Schneider
We entered into an employment agreement with Hilary Schneider, our President, on September 14, 2012. The employment agreement has no specific term and constitutes at-will employment, and provides for an annual base salary, which our compensation committee increased to $425,000 effective February 2, 2014. Under the terms of the employment agreement, Ms. Schneider is eligible to earn bonus compensation under our bonus plan and is entitled to participate in and receive all benefits under our welfare benefit plans, practices, policies, and programs. The employment agreement also provides for the reimbursement of certain travel and temporary living expenses for Ms. Schneider through September 14, 2015. The employment agreement provides that, in the event Ms. Schneider’s employment is terminated by us without “cause” or Ms. Schneider terminates her employment due to a “constructive termination” (as each are defined in the employment agreement and described generally below), she is entitled to receive continued payment of her base salary for the 12-month period following the date of such termination plus an amount equal to the COBRA premiums necessary to permit Ms. Schneider to continue group insurance coverage under our plans for the 12-month period following the date of such termination. Ms. Schneider must execute a general release of all claims against us in order to receive any severance benefits.
In addition, we have from time to time granted Ms. Schneider stock options and RSUs under our incentive compensation plans. The stock option and RSU agreements relating to these grants provide for 100% acceleration of the then-unvested shares subject to these options or RSUs in the event that we terminate Ms. Schneider’s employment without “cause” or Ms. Schneider terminates her employment due to a “constructive termination” (as each are defined in the option and RSU agreements and described generally below)
103
during the period beginning two months prior to and ending 12 months following a “change in control” (as defined in our incentive compensation plans and described generally below). In addition, the employment agreement provides that any future stock options or other equity awards granted to Ms. Schneider will contain similar vesting acceleration provisions.
Chris G. Power
We entered into an amended and restated employment agreement with Chris G. Power, our Chief Financial Officer, on September 14, 2012, which was subsequently amended on February 15, 2013. The employment agreement has no specific term and constitutes at-will employment, and provides for an annual base salary, which our compensation committee increased to $350,000 effective February 2, 2014. Under the terms of the employment agreement, Mr. Power is eligible to earn bonus compensation under our bonus plan and is entitled to participate in and receive all benefits under our welfare benefit plans, practices, policies, and programs. The employment agreement also provided for the reimbursement of certain travel and temporary living expenses for Mr. Power through the end of 2013, and provided for a 2.5% increase to Mr. Power’s base salary upon Mr. Power’s permanent relocation to Phoenix, Arizona during 2013. Mr. Power did not permanently relocate to Phoenix, Arizona during 2013. As a result, our compensation commitee has approved the reimbursement of certain going-forward travel and temporary living expenses for Mr. Power. The employment agreement provides that, in the event Mr. Power’s employment is terminated by us without “cause” or Mr. Power terminates his employment due to a “constructive termination” (as each are defined in the employment agreement and described generally below), he is entitled to receive continued payment of his base salary for the 12-month period following the date of such termination plus an amount equal to the COBRA premiums necessary to permit Mr. Power to continue group insurance coverage under our plans for the 12-month period following the date of such termination. Mr. Power must execute a general release of all claims against us in order to receive any severance benefits.
In addition, we have from time to time granted Mr. Power stock options under our incentive compensation plans. Except for the February 2011 stock option agreement referenced below, the stock option agreements relating to these grants, as amended by the employment agreement, provide for 100% acceleration of the then-unvested shares subject to these options in the event that we terminate Mr. Power’s employment without “cause” or Mr. Power terminates his employment due to a “constructive termination” (as each are defined in the option agreements and described generally below) during the period beginning two months prior to and ending 12 months following a “change in control” (as defined in our incentive compensation plans and described generally below). In February 2011, we also entered into a stock option agreement with Mr. Power, relating to the grant of an option to purchase 100,000 shares of our common stock, which became fully vested upon the closing of our IPO. In addition, the employment agreement provides that any future stock options or other equity awards granted to Mr. Power will contain similar vesting acceleration provisions.
Clarissa Cerda
We entered into an amended and restated employment agreement with Clarissa Cerda, our Executive Vice President, Chief Legal Officer, and Secretary, on September 14, 2012. The employment agreement has no specific term and constitutes at-will employment, and provides for an annual base salary, which our compensation committee increased to $335,000 effective February 2, 2014. Under the terms of the employment agreement, Ms. Cerda is eligible to earn bonus compensation under our bonus plan and is entitled to participate in and receive all benefits under our welfare benefit plans, practices, policies, and programs. The employment agreement provides that, in the event Ms. Cerda’s employment is terminated by us without “cause” or Ms. Cerda terminates her employment due to a “constructive termination” (as each are defined in the employment agreement and described generally below), she is entitled to receive continued payment of her base salary for the 12-month period following the date of such termination plus an amount equal to the COBRA premiums necessary to permit Ms. Cerda to continue group insurance coverage under our plans for the 12-month period following the date of such termination. Ms. Cerda must execute a general release of all claims against us in order to receive any severance benefits.
In addition, we have from time to time granted Ms. Cerda stock options under our incentive compensation plans. The stock option agreements relating to these grants, as amended by the employment agreement, provide for 100% acceleration of the then-unvested shares subject to these options in the event that we terminate Ms. Cerda’s employment without “cause” or Ms. Cerda terminates her employment due to a “constructive termination” (as each are defined in the option agreements and described generally below) during the period beginning two months prior to and ending 12 months following a “change in control” (as defined in our incentive compensation plans and described generally below). In addition, the employment agreement provides that any future stock options or other equity awards granted to Ms. Cerda will contain similar vesting acceleration provisions.
Velislav (Villi) Iltchev
We entered into an employment agreement with Velislav (Villi) Iltchev, our Executive Vice President, Corporate Development, on July 29, 2013. The employment agreement has no specific term and constitutes at-will employment, and provides for an annual base salary, which our compensation committee increased to $323,500 effective February 2, 2014. Under the terms of the employment agreement, Mr. Iltchev is eligible to earn bonus compensation under our bonus plan and is entitled to participate in and receive all benefits under our welfare benefit plans, practices, policies, and programs. The employment agreement provides that, in the event Mr. Iltchev’s employment is terminated by us without “cause” or Mr. Iltchev terminates his employment due to a “constructive termination” (as each are defined in the employment agreement and described generally below), he is entitled to receive continued
104
payment of his base salary for the 12-month period following the date of such termination plus an amount equal to the COBRA premiums necessary to permit Mr. Iltchev to continue group insurance coverage under our plans for the 12-month period following the date of such termination. Mr. Iltchev must execute a general release of all claims against us in order to receive any severance benefits.
In addition, we have from time to time granted Mr. Iltchev stock options and RSUs under our incentive compensation plans. The stock option and RSU agreements relating to these grants provide for 100% acceleration of the then-unvested shares subject to these options or RSUs in the event that we terminate Mr. Iltchev’s employment without “cause” or Mr. Iltchev terminates his employment due to a “constructive termination” (as each are defined in the option and RSU agreements and described generally below) during the period beginning two months prior to and ending 12 months following a “change in control” (as defined in our incentive compensation plans and described generally below).
Donald M. Beck
On June 10, 2013, we extended an employment offer letter to Mr. Beck in connection with his appointment as our Senior Vice President, Enterprise Sales & Alliances. The employment offer letter has no specific term and constitutes at-will employment, and provides for an annual base salary, which was increased to $309,000 effective February 2, 2014. Under the terms of the employment offer letter, Mr. Beck is eligible to earn bonus compensation under our bonus plan, is eligible to earn commissions under our sales commission plan and pursuant to his individual commission plan agreements, and is entitled to participate in and receive all benefits under our welfare benefit plans, practices, policies, and programs. Mr. Beck’s severance agreement provides that, in the event Mr. Beck’s employment is terminated by us without “cause” (as defined in the severance agreement and described generally below), he is entitled to receive continued payment of his base salary for the 6-month period following the date of such termination. Mr. Beck must execute a general release of all claims against us in order to receive any severance benefits.
In addition, we have from time to time granted Mr. Beck stock options under our incentive compensation plans. The stock option agreements relating to these grants, provide for 100% acceleration of the then-unvested shares subject to these options in the event that we terminate Mr. Beck’s employment without “cause” or Mr. Beck terminates his employment due to a “constructive termination” (as each are defined in the option agreements and described generally below) during the period beginning on the date of such “change in control” and ending 12 months following such “change in control” (as defined in our incentive compensation plans and described generally below).
Under the terms of each named executive officer’s stock option or RSU agreements, the named executive officer’s unvested options or RSUs terminate and become null and void or are forfeited upon the named executive officer’s termination of employment. The named executive officer’s vested options generally terminate and become null and void three months after termination of employment. However, if the named executive officer is terminated for “cause” (as defined in the option agreements and described generally below), the vested options terminate immediately upon termination of employment. If the named executive officer’s termination of employment is due to death or disability, the vested options generally terminate 12 months after termination of employment.
For purposes of the employment and other agreements described above, (i) “cause” generally means (A) an act or acts of dishonesty, fraud, or embezzlement by the named executive officer; (B) violation by the named executive officer of his or her obligations under his or her employment agreement or our company’s proprietary rights agreement, if not timely cured; (C) the willful or deliberate refusal to follow the requests or instructions of our board of directors or, as applicable, our chief executive officer, if not timely cured; or (D) the conviction of any criminal act that is a felony or crime involving dishonesty causing material harm to the standing and reputation of our company; (ii) “change in control” generally means (A) a sale of all or substantially all of the assets of our company; (B) a merger, reorganization, or other transaction in which 50% of the outstanding voting power of our company is transferred (other than a merger effected to change our company’s domicile, an equity financing in which our company is the surviving corporation, or a transaction in which our stockholders immediately prior to the transaction own 50% or more of the voting stock of the surviving corporation following the transaction); or (C) an exclusive, irrevocable licensing of all of our intellectual property to a third party (other than a wholly owned subsidiary of our company); and (iii) “constructive termination” generally means (A) our material breach of the named executive officer’s employment agreement; (B) a material diminution in the named executive officer’s title, duties, or responsibilities by our board of directors or, as applicable, our chief executive officer, to a level below the named executive officer’s titles, duties, or responsibilities in effect immediately prior to such change (provided that if following an acquisition of our company and conversion of our company into a subsidiary, division, or unit of the acquirer, whether or not such subsidiary, division, or unit is itself publicly traded, the named executive officer is in the same position of the subsidiary, division, or unit of the acquirer, then the consummation of such acquisition and conversion will not by itself be deemed a material diminution in the named executive officer’s title, duties, or responsibilities); and (C) a relocation of the named executive officer’s principal worksite to a location more than 50 miles from his or her current work location.
Potential Payments Upon Termination or Change in Control
The following tables set forth certain information regarding potential payments and other benefits that would be payable to our named executive officers upon termination of employment or a change in control of our company. The table below assumes that the termination or change in control event took place on December 31, 2013.
105
Todd Davis
|
|
|
|
|
|
|
|
|
|
|
Executive Benefits |
|
Termination Without Cause or Upon Constructive Termination (Not in Connection with a Qualifying Change of Control) |
|
|
Termination Without Cause or Upon Constructive Termination Following a Qualifying Change of Control |
|
||
|
Cash-based Severance |
|
$ |
718,425 |
|
|
$ |
718,425 |
|
|
Health and Welfare Benefits |
|
$ |
23,758 |
|
|
$ |
23,758 |
|
|
Equity Treatment |
|
|
— |
|
|
$ |
3,502,959 |
(1) |
|
(1) |
The amounts shown represent the market value of unvested stock options that would become fully vested upon termination without “cause” or upon “constructive termination” following a qualifying “change in control.” |
Hilary A. Schneider
|
|
|
|
|
|
|
|
|
|
|
Executive Benefits |
|
Termination Without Cause or Upon Constructive Termination (Not in Connection with a Qualifying Change of Control) |
|
|
Termination Without Cause or Upon Constructive Termination Following a Qualifying Change of Control |
|
||
|
Cash-based Severance |
|
$ |
412,000 |
|
|
$ |
412,000 |
|
|
Health and Welfare Benefits |
|
$ |
15,839 |
|
|
$ |
15,839 |
|
|
Equity Treatment |
|
|
— |
|
|
$ |
6,237,538 |
(1) |
|
(1) |
The amounts shown represent the market value of unvested stock options and RSUs that would become fully vested upon termination without “cause” or upon “constructive termination” following a qualifying “change in control.” |
Chris G. Power
|
|
|
|
|
|
|
|
|
|
|
Executive Benefits |
|
Termination Without Cause or Upon Constructive Termination (Not in Connection with a Qualifying Change of Control) |
|
|
Termination Without Cause or Upon Constructive Termination Following a Qualifying Change of Control |
|
||
|
Cash-based Severance |
|
$ |
323,785 |
|
|
$ |
323,785 |
|
|
Health and Welfare Benefits |
|
$ |
15,839 |
|
|
$ |
15,839 |
|
|
Equity Treatment |
|
|
— |
|
|
$ |
3,518,610 |
(1) |
|
(1) |
The amounts shown represent the market value of unvested stock options that would become fully vested upon termination without “cause” or upon “constructive termination” following a qualifying “change in control.” |
106
Clarissa Cerda
|
|
|
|
|
|
|
|
|
|
|
Executive Benefits |
|
Termination Without Cause or Upon Constructive Termination (Not in Connection with a Qualifying Change of Control) |
|
|
Termination Without Cause or Upon Constructive Termination Following a Qualifying Change of Control |
|
||
|
Cash-based Severance |
|
$ |
319,300 |
|
|
$ |
319,300 |
|
|
Health and Welfare Benefits |
|
$ |
11,994 |
|
|
$ |
11,994 |
|
|
Equity Treatment |
|
|
— |
|
|
$ |
1,871,134 |
(1) |
|
(1) |
The amounts shown represent the market value of unvested stock options that would become fully vested upon termination without “cause” or upon “constructive termination” following a qualifying “change in control.” |
Velislav (Villi) Iltchev
|
|
|
|
|
|
|
|
|
|
|
Executive Benefits |
|
Termination Without Cause or Upon Constructive Termination (Not in Connection with a Qualifying Change of Control) |
|
|
Termination Without Cause or Upon Constructive Termination Following a Qualifying Change of Control |
|
||
|
Cash-based Severance |
|
$ |
300,000 |
|
|
$ |
300,000 |
|
|
Health and Welfare Benefits |
|
$ |
16,580 |
|
|
$ |
16,580 |
|
|
Equity Treatment |
|
|
— |
|
|
$ |
3,155,438 |
(1) |
|
(1) |
The amounts shown represent the market value of unvested stock options and RSUs that would become fully vested upon termination without “cause” or upon “constructive termination” following a qualifying “change in control. |
Donald M. Beck
|
|
|
|
|
|
|
|
|
|
|
Executive Benefits |
|
Termination Without Cause or Upon Constructive Termination (Not in Connection with a Qualifying Change of Control) |
|
|
Termination Without Cause or Upon Constructive Termination Following a Qualifying Change of Control |
|
||
|
Cash-based Severance |
|
$ |
150,000 |
|
|
$ |
150,000 |
|
|
Health and Welfare Benefits |
|
|
— |
|
|
|
— |
|
|
Equity Treatment |
|
|
— |
|
|
$ |
1,473,000 |
(1) |
|
(1) |
The amounts shown represent the market value of unvested stock options that would become fully vested upon termination without “cause” or upon “constructive termination” following a qualifying “change in control.” |
Employee Benefit and Stock Plans
2012 Incentive Compensation Plan
The 2012 Plan was approved by our board of directors on September 17, 2012 and by our stockholders on September 17, 2012, and became effective in connection with our IPO. Since the effective date of the 2012 Plan, no further awards have been granted under the 2006 Plan described below. The purpose of the 2012 Plan is to assist us and our “related entities” in attracting, motivating, retaining, and rewarding high-quality executives and other employees, officers, directors, consultants, and other persons who provide services to us or our related entities, by enabling such persons to acquire or increase a proprietary interest in our company in order to strengthen the mutuality of interests between such persons and our stockholders, and providing such persons with performance incentives to expend their maximum efforts in the creation of stockholder value. As of December 31, 2013, there were outstanding issued but unexercised options under the 2012 Plan to acquire 5,811,536 shares of our common stock at a weighted average exercise
107
price of $10.94 per share. There were also 578,243 undelivered RSUs issued and outstanding under the 2012 Plan as of December 31, 2013. As of December 31, 2013, 7,979,073 shares remained available for future grant under the 2012 Plan. The material features of the 2012 Plan are outlined below.
Administration. The 2012 Plan is administered by our compensation committee or such other committee as may be designated by our board of directors, provided that except as otherwise expressly provided in the 2012 Plan, our board of directors may exercise any power or authority granted to the committee under the 2012 Plan. The committee administering the 2012 Plan is referred to as the “committee.” Subject to the terms of the 2012 Plan, the committee is authorized to select eligible persons to receive awards; determine the type, number, and other terms and conditions of, and all other matters relating to, awards; prescribe award agreements and the rules and regulations for the administration of the 2012 Plan; construe and interpret the 2012 Plan and award agreements; correct defects, supply omissions, or reconcile inconsistencies in the 2012 Plan and award agreements; and make all other decisions and determinations as the committee may deem necessary or advisable for the administration of the 2012 Plan.
Eligibility. The persons eligible to receive awards under the 2012 Plan are the officers, directors, employees, consultants, and other persons who provide services to our company or any related entity. An employee on leave of absence may be considered as still in the employ of our company or a related entity for purposes of eligibility for participation in the 2012 Plan.
Types of Awards. The 2012 Plan provides for the issuance of stock options, stock appreciation rights, or SARs, restricted stock, RSUs, dividend equivalents, stock granted as a bonus or in lieu of another award, other stock-based awards, and performance awards. Performance awards may be based on the achievement of certain business or personal criteria or other goals, as determined by the committee.
Shares Available for Awards; Annual Per-Person Limitations. The total number of shares of common stock that may be subject to the granting of awards under the 2012 Plan at any time during the term of the 2012 Plan is equal to the sum of (i) 4,200,000, plus (ii) any shares that remained available for delivery under the 2006 Plan on the effective date of the 2012 Plan, plus (iii) any shares subject to stock options or similar awards granted under the 2006 Plan that, after the effective date of the 2012 Plan, expire or otherwise terminate without having been exercised in full and shares issued pursuant to awards granted under the 2006 Plan that, after the effective date of the 2012 Plan, are forfeited to or repurchased by us, plus (iv) an automatic increase on the first day of each of our fiscal years beginning in 2013 and ending in 2022 equal to the lesser of (A) 8,000,000 shares, (B) 4.5% of all shares of our common stock outstanding on the last day of the immediately preceding fiscal year, or (C) a lesser amount determined by our board. In addition, the maximum number of shares of common stock that may be issued under the 2012 Plan as a result of incentive stock options is 1,000,000 shares.
The foregoing limit shall be increased by the number of shares with respect to which awards previously granted under the 2012 Plan are forfeited, expire, or otherwise terminate without issuance of shares, or that could have been settled with shares but are settled for cash or otherwise do not result in the issuance of shares, and the number of shares that are tendered (either actually or by attestation) or withheld upon exercise of an award to pay the exercise price or any tax withholding requirements. Awards issued in substitution for awards previously granted by a company acquired by our company or a related entity, or with which our company or any related entity combines, do not reduce the limit on grants of awards under the 2012 Plan.
Grant Limits. The 2012 Plan imposes individual limitations on the amount of certain awards. Under these limitations, during any fiscal year of our company during any part of which the 2012 Plan is in effect, the number of shares underlying options or SARs granted to any one participant under the 2012 Plan may not exceed 1,600,000, and the number of shares relating to restricted stock, RSUs, performance shares, and/or other stock-based awards granted to any one participant under the 2012 Plan may not exceed 1,000,000, subject to adjustment in certain circumstances. The maximum amount that may be paid out as performance units to any one participant under the 2012 Plan in any 12-month period is $2,500,000 multiplied by the number of full years in the performance period.
Stock Options and Stock Appreciation Rights. Our committee is authorized to grant stock options, including incentive stock options, and SARs entitling the participant to receive the amount by which the fair market value of a share of our common stock on the date of exercise exceeds the grant price of the SAR. The exercise price per share subject to an option and the grant price of a SAR are determined by our committee, but must not be less than the fair market value of a share of our common stock on the date of grant. The maximum term of each option or SAR, the times at which each option or SAR will be exercisable, and provisions requiring forfeiture of unexercised options or SARs at or following termination of employment generally are fixed by our committee, except that no stock option or SAR may have a term exceeding ten years. Methods of exercise and settlement and other terms of the SARs are determined by our committee. Our committee, thus, may permit the exercise price of options awarded under the 2012 Plan to be paid in cash, shares (including without limitation the withholding of shares otherwise deliverable pursuant to the award), other awards, or other property (including loans to participants to make payment on a deferred basis provided that such deferred payments are not in violation of the Sarbanes-Oxley Act of 2002, as amended, or any rule or regulation adopted thereunder or any other applicable law).
Restricted Stock and Restricted Stock Units. Our committee is authorized to grant restricted stock and RSUs. Restricted stock is a grant of shares of our common stock which may be forfeited in the event of certain terminations of employment, prior to the end of a restricted period specified by our committee. A participant granted restricted stock generally has all of the rights of a stockholder of
108
our company, unless otherwise determined by our committee. An award of RSUs confers upon a participant the right to receive shares of our common stock or cash equal to the fair market value of the number of shares to which the RSUs relate at the end of a specified deferral period, subject to possible forfeiture of the award in the event of certain terminations of employment prior to the end of a specified restricted period. Prior to settlement, an award of RSUs carries no voting or dividend rights or other rights associated with share ownership, although dividend equivalents may be granted, as discussed below.
Dividend Equivalents. Our committee is authorized to grant dividend equivalents conferring on participants the right to receive, currently or on a deferred basis, cash, shares of our common stock, other awards, or other property equal in value to dividends paid on a specific number of shares of our common stock or other periodic payments. Dividend equivalents may be granted alone or in connection with another award, may be paid currently or on a deferred basis and, if deferred, may be deemed to have been reinvested in additional shares of our common stock, awards, or otherwise as specified by our committee.
Bonus Stock and Awards in Lieu of Cash Obligations. Our committee is authorized to grant shares of our common stock as a bonus free of restrictions, or to grant shares of our common stock or other awards in lieu of our obligations to pay cash or deliver other property under the 2012 Plan or other plans or compensatory arrangements, subject to such terms as our committee may specify.
Other Stock-Based Awards. Our committee is authorized to grant awards that are denominated or payable in, valued by reference to, or otherwise based on or related to shares of our common stock. Our committee determines the terms and conditions of such awards.
Performance Awards. Our committee is authorized to grant performance awards to participants on terms and conditions established by our committee. The performance criteria to be achieved during any performance period and the length of the performance period are determined by our committee upon the grant of the performance award. Performance awards may be valued by reference to a designated number of shares (in which case they are referred to as performance shares) or by reference to a designated amount of property including cash (in which case they are referred to as performance units). Performance awards may be settled by delivery of cash, shares, or other awards under the 2012 Plan, or any combination thereof, as determined by our committee. Performance awards granted to persons whom our committee expects will, for the year in which a deduction arises, be “covered employees” (as defined below) will, if and to the extent intended by our committee, be subject to provisions that should qualify such awards as “performance-based compensation” not subject to the limitation on tax deductibility by our company under Section 162(m) of the Internal Revenue Code. For purposes of Section 162(m), the term “covered employee” means our chief executive officer and each other person whose compensation is required to be disclosed in our filings with the SEC by reason of that person being among our three highest compensated officers as of the end of a taxable year. If and to the extent required under Section 162(m) of the Internal Revenue Code, any power or authority relating to a performance award intended to qualify under Section 162(m) of the Internal Revenue Code is to be exercised by our committee and not our board of directors. We believe that awards under the 2012 Plan should not be subject to the Section 162(m) deduction limitations until the end of a transition period that will end on the earlier of the date on which the 2012 Plan is materially modified (as defined in applicable regulations under Section 162(m) of the Internal Revenue Code) and our 2016 annual meeting of our stockholders. The 2012 Plan provides that no person will be considered a “covered employee” during the abovementioned transition period.
If and to the extent that our committee determines that the provisions of the 2012 Plan relating to covered employees are to be applicable to any award, one or more of the following business criteria for our company, on a consolidated basis, and/or for any of our related entities, or for business or geographical units of our company and/or any of our related entities (except with respect to the total stockholder return and earnings per share criteria), shall be used by our committee in establishing performance goals for awards under the 2012 Plan: (1) earnings per share; (2) revenues or margins; (3) cash flow; (4) operating margin; (5) return on net assets, investment, capital, or equity; (6) economic value added; (7) direct contribution; (8) net income; pretax earnings; earnings before interest and taxes; earnings before interest, taxes, depreciation and amortization; earnings after interest expense and before extraordinary or special items; operating income; income before interest income or expense, unusual items and income taxes, local, state or federal and excluding budgeted and actual bonuses which might be paid under any ongoing bonus plans of our company; (9) working capital; (10) management of fixed costs or variable costs; (11) identification or consummation of investment opportunities or completion of specified projects in accordance with corporate business plans, including strategic mergers, acquisitions or divestitures; (12) total stockholder return; (13) debt reduction; (14) market share; (15) entry into new markets, either geographically or by business unit; (16) net new members of the Company; (17) member retention and satisfaction; (18) strategic plan development and implementation, including turnaround plans; and/or (19) the fair market value of a share of our common stock. Any of the above goals may be determined on a relative or absolute basis or as compared to the performance of a published or special index that the committee determines applicable.
Our committee may, in its discretion, determine that the amount payable as a performance award will be reduced from the amount of any potential award.
Other Terms of Awards. Awards may be settled in the form of cash, shares of our common stock, other awards, or other property, in the discretion of our committee. Our committee may require or permit participants to defer the settlement of all or part of an award in accordance with such terms and conditions as our committee may establish. Our committee is authorized to place cash, shares of
109
our common stock, or other property in trusts or make other arrangements to provide for payment of our company’s obligations under the 2012 Plan. Our committee may condition any payment relating to an award on the withholding of taxes and may provide that a portion of any shares of our common stock or other property to be distributed will be withheld (or previously acquired shares of our common stock or other property be surrendered by the participant) to satisfy withholding and other tax obligations. Awards granted under the 2012 Plan generally may not be pledged or otherwise encumbered and are not transferable except by will or by the laws of descent and distribution, or to a designated beneficiary upon the participant’s death, or to a “family member” (as defined in Rule 701(c)(3) under the Securities Act of 1933, as amended, or the Securities Act) through gifts or domestic relations orders if permitted by our committee.
Awards under the 2012 Plan are generally granted without a requirement that the participant pay consideration in the form of cash or property for the grant (as distinguished from the exercise), except to the extent required by law. Our committee may, however, grant awards in exchange for other awards under the 2012 Plan, awards under other plans, or other rights to payment from us, and may grant awards in addition to and in tandem with such other awards, rights or other awards.
Acceleration of Vesting; Change in Control. Our committee may, in its discretion, accelerate the exercisability, the lapsing of restrictions, or the expiration of deferral or vesting periods of any award, if so provided in the award agreement in the case of a “change in control” of our company, as defined in the 2012 Plan.
Upon any merger, consolidation, or other reorganization in which we do not survive, or in the event of any “change in control,” outstanding awards will be dealt with in accordance with the agreement effectuating the transaction or, to the extent not so determined under such agreement, the committee may provide for any of the following actions with respect to outstanding awards: (i) our continuation of such awards (if we are the surviving entity in the transaction); (ii) the assumption or substitution of such awards by the surviving entity or its parent or subsidiary; (iii) full exercisability or vesting and accelerated expiration of such awards; or (iv) settlement of the value of such awards in cash, cash equivalents, or other property followed by cancellation of such awards.
Amendment and Termination. Our board of directors may amend, alter, suspend, discontinue, or terminate the 2012 Plan or our committee’s authority to grant awards without further stockholder approval, except stockholder approval must be obtained for any amendment or alteration if such approval is required by law or regulation or under the rules of any stock exchange or quotation system on which shares of common stock are then listed or quoted and our board of directors may otherwise, in its discretion, determine to submit other such changes to the 2012 Plan to stockholders for approval; provided, that, without the consent of an affected participant, no such board action may materially and adversely affect the rights of such participant under any previously granted and outstanding award. Thus, stockholder approval may not necessarily be required for every amendment to the 2012 Plan which might increase the cost of the 2012 Plan or alter the eligibility of persons to receive awards.
The 2012 Plan will terminate at the earliest of (a) such time as no shares of our common stock remain available for issuance under the 2012 Plan, (b) termination of the 2012 Plan by our board of directors, or (c) the tenth anniversary of the effective date of the 2012 Plan. Awards outstanding upon expiration of the 2012 Plan shall remain in effect until they have been exercised or terminated, or have expired.
Amended and Restated 2006 Incentive Compensation Plan
Our 2006 Incentive Compensation Plan was adopted by our board of directors in November 2006 and approved by our stockholders in April 2007. Our board of directors adopted, and our stockholders approved, the Amended and Restated 2006 Incentive Compensation Plan in March 2010. We refer to this plan throughout this Form 10-K/A as the “2006 Plan.” The 2006 Plan was designed to attract, motivate, retain, and reward our executives, employees, officers, directors, consultants, and other persons who provide services to us or our subsidiaries by providing such persons with incentives to expend their maximum efforts in the creation of stockholder value. The terms of the 2006 Plan provided for the grant of stock options, stock appreciation rights, restricted stock awards, deferred stock awards, stock granted as a bonus or in lieu of another award under the 2006 Plan, dividend equivalents, performance awards, and other stock-based awards. As of December 31, 2013, there were outstanding issued but unexercised options under the 2006 Plan to acquire 5,572,715 shares of our common stock at a weighted average exercise price of $4.05 per share. Since the effective date of the 2012 Plan described above, no further awards have been granted under the 2006 Plan.
Lemon 2008 Equity Incentive Plan
In December 2013, in connection with our acquisition of Lemon, we assumed the Lemon 2008 Equity Incentive Plan with respect to the unvested stock options of Lemon that were outstanding immediately prior to the effective time of the merger and held by continuing employees of Lemon. We refer to this plan throughout this Form 10-K/A as the “Lemon Plan.” The Lemon Plan was designed to attract, retain, and motivate Lemon’s employees, officers, directors, and consultants whose contributions were important to the success of Lemon by offering such persons an opportunity to participate in Lemon’s future performance. The terms of the Lemon Plan provided for the grant of stock options and restricted stock. The assumed stock options of Lemon are exercisable for shares of our common stock based on a formula set forth in the merger agreement. As of December 31, 2013, there were outstanding issued but unexercised options under the Lemon Plan to acquire 104,516 shares of our common stock at a weighted average exercise price of $2.06 per share. Since the closing of the acquisition of Lemon, no further awards have been granted under the Lemon Plan.
110
2012 Employee Stock Purchase Plan
The 2012 Employee Stock Purchase Plan, or the 2012 ESPP, was approved by our board of directors on September 17, 2012 and our stockholders on September 17, 2012, and became effective in connection with our IPO. The purpose of the 2012 ESPP is to provide an incentive for our employees (and employees of our subsidiaries designated by our board) to purchase our common stock and acquire a proprietary interest in our company.
Administration. Our compensation committee administers the 2012 ESPP. The 2012 ESPP vests the committee with the authority to interpret the 2012 ESPP, to prescribe, amend, and rescind rules and regulations relating to the 2012 ESPP, and to make all other determinations necessary or advisable for the administration of the 2012 ESPP, though our board of directors may exercise any such authority in lieu of the committee. In all cases, the 2012 ESPP is required to be administered in such a manner so as to comply with applicable requirements of Rule 16b-3 of the Exchange Act and Section 423 of the Internal Revenue Code.
Eligibility and Participation. Each person whose customary employment with us or one of our designated subsidiaries is at least 20 hours per week and more than five months per calendar year, other than any highly compensated employee who is subject to the disclosure requirements of Section 16(a) of the Exchange Act, are eligible to participate in the 2012 ESPP. An individual will not be eligible if his or her participation in the 2012 ESPP is prohibited by the law of any country that has jurisdiction over him or her or if compliance with the laws of the foreign jurisdiction would cause the 2012 ESPP or offering under the 2012 ESPP to violate the requirements of Section 423 of the Internal Revenue Code. In addition, no employee will be eligible for the grant of any purchase rights under the 2012 ESPP if immediately after such rights are granted, the employee has voting power over five percent or more of our outstanding capital stock measured by vote or value pursuant to Section 424(d) of the Internal Revenue Code.
Options to Purchase/Purchase of Shares. Each participant will be granted an option to purchase shares of our common stock at the beginning of each “offering period” under the 2012 ESPP. Each offering period will begin on the first July 1 or January 1 immediately following the end of the previous offering period and end on the date that is six months thereafter. Exercise dates will occur on the last trading day of each offering period. Participants will purchase the shares of our common stock through after-tax payroll deductions, not to exceed 15% of the participant’s compensation during the offering period. No participant may purchase more than 2,000 shares of our common stock on any one exercise date, or more than $25,000 worth of our common stock (valued on the first day of the applicable period) in any one calendar year. The purchase price for each share will generally be the lower of 85% of the fair market value of a share on the first day of the offering period, or 85% of the fair market value on the exercise date. If a participant’s employment with us or one of our designated subsidiaries terminates, any outstanding option of that participant also will terminate. The committee may shorten or terminate an ongoing offering period under certain circumstances.
Share Reserve. 2,000,000 shares of our common stock are reserved for issuance over the term of the 2012 ESPP. That amount will be increased each year beginning in 2013 and ending in 2022 by the lowest of 1,500,000 shares, 1% of all shares outstanding at the end of the previous year, or a lower amount determined by our board of directors. If any option to purchase reserved shares is not exercised by a participant for any reason, or if the option terminates, the shares that were not purchased will again become available under the 2012 ESPP. The number of shares available under the 2012 ESPP also will be subject to periodic adjustment for changes in the outstanding common stock occasioned by stock splits, stock dividends, recapitalizations, or other similar changes affecting our outstanding common stock. As of December 31, 2013, 2,681,177 shares remained available for issuance under the 2012 ESPP.
Changes to Capital Structure. In the event a change in our capital structure occurs as a result of one or more reorganizations, restructurings, recapitalizations, reclassifications, stock splits, reverse stock splits, stock dividends, or the like, then the committee will, in such manner as it may deem equitable, substitute, exchange, or adjust any or all of the number and/or kind of shares, and the per-share option price thereof, that may be issued in the aggregate and to any participant upon exercise of options granted under the 2012 ESPP.
Corporate Transactions. In the event of a proposed sale of all or substantially all of our assets, or a merger of our company with or into another corporation, each option under the 2012 ESPP will be assumed or an equivalent option will be substituted by such successor corporation or a parent or subsidiary of such successor corporation, unless the committee determines, in the exercise of its sole discretion and in lieu of such assumption or substitution, to shorten the offering period then in progress by setting a new exercise date.
Amendment and Termination. Our board of directors or the committee generally will have the power and authority to amend the 2012 ESPP from time to time in any respect without the approval of our stockholders. However, no amendment will become effective without the prior approval of our stockholders if stockholder approval would be required by applicable law or regulation, including Rule 16b-3 under the Exchange Act, Section 423 of the Internal Revenue Code, or any listing requirement of the principal stock exchange on which our common stock is then listed. Additionally, no amendment may make any change to an option already granted that adversely affects the rights of any participant. The 2012 ESPP will terminate at the earliest of the last exercise date immediately preceding the tenth anniversary of its effective date, the time when there are no remaining reserved shares available for purchase under the 2012 ESPP, or an earlier time that our board may determine.
Performance Bonus Plan
111
The Performance Bonus Plan was approved by our board of directors on September 17, 2012 and our stockholders on September 17, 2012, and became effective in connection with our IPO. The purpose of the Performance Bonus Plan is to benefit and advance our interests, by rewarding selected employees of ours and our subsidiaries for their contributions to our financial success and thereby motivate them to continue to make such contributions in the future by granting performance-based awards that are intended to be fully tax deductible to us.
Background. Once applicable, Section 162(m) of the Internal Revenue Code disallows a deduction to us for any compensation paid to certain named executive officers in excess of $1,000,000 per year, subject to certain exceptions. Among other exceptions, the deduction limit does not apply to compensation that meets the specified requirements for “performance-based compensation.” In general, those requirements include the establishment of objective performance goals for the payment of such compensation by a committee of the board composed solely of two or more outside directors, stockholder approval of the material terms of such compensation prior to payment, and certification by the committee that the performance goals for the payment of such compensation have been achieved.
Our board of directors believes that it is in our best interests and those of our stockholders to enhance our ability to attract and retain qualified personnel through performance-based incentive.
Administration. Subject to the other provisions of the Performance Bonus Plan, our compensation committee has the authority to administer, interpret, and apply the Performance Bonus Plan, including the authority to select the employees (including employees who are directors) to participate in the Performance Bonus Plan; to establish the performance goals; to determine the amount of incentive compensation bonus payable to any participant; to determine the terms and conditions of any such incentive opportunity; to make all determinations and take all other actions necessary or appropriate for proper administration and operation of the Performance Bonus Plan; and to establish and amend rules and regulations relating to the Performance Bonus Plan.
Our compensation committee may also delegate to one or more of our executive officers the authority to administer the Performance Bonus Plan with respect to any participants who are not “covered employees” (as defined below).
Eligibility. Our named executive officers and all of our other employees are eligible to participate in the Performance Bonus Plan. The maximum amount of the incentive compensation bonuses payable to any participant under the Performance Bonus Plan in, or in respect of, any single fiscal year shall not exceed $2.5 million. All incentive compensation bonuses paid pursuant to the Performance Bonus Plan will be paid in cash.
Bonus Opportunity and Performance Goals. Bonuses may be payable to a participant as a result of the satisfaction of performance goals in respect of any performance period determined by the compensation committee; provided that, to the extent a participant would be a “covered employee” (as defined below) prior to the beginning of each performance period or any later date described in the regulations under Section 162(m) of the Internal Revenue Code, our compensation committee will adopt the following with respect to each participant who is a “covered employee”: one or more of targets, which will be equal to a desired level or levels for any performance period of specified levels of or increases in (i) earnings per share; (ii) revenues or margins; (iii) cash flow; (iv) operating margin; (v) return on net assets, investment, capital, or equity; (vi) economic value added; (vii) direct contribution; (viii) net income; pretax earnings; earnings before interest and taxes; earnings before interest, taxes, depreciation and amortization; earnings after interest expense and before extraordinary or special items; operating income; income before interest income or expense, unusual items and income taxes, local, state or federal and excluding budgeted and actual bonuses which might be paid under any ongoing bonus plans of our company; (ix) working capital; (x) management of fixed costs or variable costs; (xi) identification or consummation of investment opportunities or completion of specified projects in accordance with corporate business plans, including strategic mergers, acquisitions or divestitures; (xii) total stockholder return; (xiii) debt reduction; (xiv) market share; (xv) entry into new markets, either geographically or by business unit; (xvi) net new members of our company; (xvii) member retention and satisfaction; (xviii) strategic plan development and implementation, including turnaround plans; and/or (xix) the fair market value of a share of our common stock.
For purposes of the Performance Bonus Plan, the term “covered employee” means our chief executive officer and each other person whose compensation is required to be disclosed in our filings with the SEC by reason of that person being among our three highest compensated officers as of the end of a taxable year; provided, however, that a person will be considered a “covered employee” for purposes of the Performance Bonus Plan only if such employee’s remuneration for the relevant fiscal year is expected to exceed $1,000,000.
We believe that awards under the Performance Bonus Plan should not be subject to the Section 162(m) deduction limitations until the end of a transition period that will end on the earlier of the date on which the Performance Bonus Plan is materially modified (as defined in applicable regulations under Section 162(m) of the Internal Revenue Code) and our 2016 annual meeting of our stockholders. The Performance Bonus Plan provides that no person will be considered a “covered employee” during the abovementioned transition period.
112
Performance goals, which may vary among and between participants, may include objectives stated with respect to us or our subsidiaries. For all participants, including a participant that would be a “covered employee”, our compensation committee may provide a threshold level of performance below which no incentive compensation bonus will be paid, a maximum level of performance above which no additional incentive compensation bonus will be paid, and it also may provide for the payment of differing amounts for different levels of performance, determined with regard either to a fixed monetary amount or a percentage of the participant’s base salary; provided, however, with respect to each participant who is a “covered employee” our compensation committee will adopt each of the foregoing prior to the beginning of each performance period or any later date described in the regulations under Section 162(m) of the Internal Revenue Code. Our compensation committee will make such adjustments, to the extent it deems appropriate, to established performance goals and performance thresholds to compensate for, or to reflect, any material changes which may have occurred due to an Extraordinary Event (as defined below); provided, however, that if and to the extent that the deduction limitations under Section 162(m) of the Internal Revenue Code apply, no such adjustment may be made unless such adjustment would be permissible under Section 162(m) of the Internal Revenue Code. An “Extraordinary Event” under the Performance Bonus Plan is defined as follows:
|
· |
material changes in accounting practices, tax laws, other laws or regulations; |
|
· |
material changes in our financial structure; |
|
· |
an acquisition or disposition of one of our subsidiaries; or |
|
· |
unusual and non-recurring charges, |
in each case, which, in the sole judgment of our compensation committee, alters or affects (i) the computation of such established performance goals and performance thresholds, (ii) our performance, or (iii) the performance of a relevant subsidiary.
As soon as practicable after the end of each performance period, but before any incentive compensation bonuses are paid to the participants under the Performance Bonus Plan, our compensation committee will certify in writing (i) whether the performance goal(s) were attained and (ii) the amount of the incentive compensation bonus payable to each participant based upon the attainment of such specified performance goals. Our compensation committee also may reduce, eliminate, or, with respect only to participants who are not “covered employees” under Section 162(m) of the Internal Revenue Code (once the deduction limitations under Section 162(m) of the Internal Revenue Code apply), increase the amount of any incentive compensation bonus of any participant at any time prior to payment thereof, based on such criteria as our compensation committee will determine, including but not limited to individual merit and attainment of, or the failure to attain, specified personal goals established by our compensation committee. Under no circumstances, however, may the compensation committee, with respect solely to a participant who is a “covered employee” under Section 162(m) of the Internal Revenue Code (once the deduction limitations under Section 162(m) of the Internal Revenue Code apply), (a) increase the amount of the incentive compensation otherwise payable to such participant beyond the amount originally established by the compensation committee, (b) waive the attainment of the performance goals established and applicable to such participant’s incentive compensation, or (c) otherwise exercise its discretion so as to cause any incentive compensation bonus payable to such participant to not qualify as “performance-based compensation” under Section 162(m) of the Internal Revenue Code.
All amounts due under the Performance Bonus Plan are required to be paid within 2 1/2 months of the end of the year in which such incentive compensation is no longer subject to a risk of forfeiture.
Amendment and Termination. Our compensation committee may amend or terminate the Performance Bonus Plan at any time without the consent of any participant. However, no amendment that would require the consent of the stockholders pursuant to Section 162(m) of the Internal Revenue Code will be effective without such consent.
401(k) Plan
We have established a tax-qualified 401(k) retirement plan for all eligible employees of our company. Employees are eligible to participate on their first day of service. Under our 401(k) plan, employees may elect to defer and contribute to the 401(k) plan their eligible compensation up to the statutorily prescribed annual limit.
We currently match contributions made by our employees at a rate of 100% for every 1% of eligible compensation an employee contributes up to 6% of eligible compensation, including executives. We intend for the 401(k) plan to qualify under Section 401(a) of the Internal Revenue Code so that pre-tax contributions by employees and matching contributions by us to the 401(k) plan, and income earned on plan contributions, are not taxable to employees until withdrawn from the 401(k) plan.
Pension Benefits
We do not offer any defined benefit pension plan to any of our executive officers.
Nonqualified Deferred Compensation Plans
We do not provide any nonqualified deferred compensation plans for any of our executive officers.
113
Equity Compensation Plan Information
The following table provides information as of December 31, 2013 with respect to the shares of our common stock that may be issued under our incentive compensation plans.
|
|
|
|
|
|
|
|
|
|
|
|
|
|
|
Plan Category |
|
(a) Number of Securities to be Issued Upon Exercise of Outstanding Options, Warrants, and Rights (2) |
|
|
(b) Weighted Average Exercise Price of Outstanding Options, Warrants, and Rights (3) |
|
|
(c) Number of Securities Remaining Available for Future Issuance Under Equity Compensation Plans (Excluding Securities Reflected in Column (a)) (4) |
|
|||
|
Equity Compensation Plans Approved by Stockholders(1) |
|
|
11,962,494 |
|
|
$ |
7.57 |
|
|
|
10,660,251 |
|
|
Equity Compensation Plans Not Approved by Stockholders |
|
|
— |
|
|
|
— |
|
|
|
— |
|
|
|
|
|
|
|
|
|
|
|
|
|
|
|
|
Total |
|
|
11,962,494 |
|
|
$ |
7.57 |
|
|
|
10,660,251 |
|
|
|
|
|
|
|
|
|
|
|
|
|
|
|
|
(1) |
Includes our 2012 Plan, 2006 Plan, and 2012 ESPP. |
|
(2) |
Includes 578,243 shares issuable upon the delivery of RSUs granted under our 2012 Plan. The remaining balance consists of shares issuable upon the exercise of outstanding stock options granted under our 2012 Plan and 2006 Plan. |
|
(3) |
The weighted average exercise price does not take into account the shares issuable upon the vesting and delivery of outstanding RSUs. |
|
(4) |
Each fiscal year (beginning with the fiscal year that commenced January 1, 2013 and ending with the fiscal year commencing January 1, 2022), the number of shares in the reserve under our 2012 Plan may be increased by the lesser of (i) 8,000,000 shares, (ii) 4.5% of all shares of our common stock outstanding on the last day of the immediately preceding fiscal year, or (iii) a lesser amount determined by our board of directors. |
Our 2012 ESPP reserves 2,000,000 shares of our common stock for issuance under the 2012 ESPP. Each fiscal year (beginning with the fiscal year that commenced January 1, 2013 and ending with the fiscal year commencing January 1, 2022), the number of shares in the reserve under our 2012 ESPP may be increased by the lesser of (i) 1,500,000 shares, (ii) 1% of all shares outstanding at the end of the previous year, or (iii) a lower amount determined by our board of directors.
We compensate our non-employee directors with a combination of cash and equity. Each such director receives an annual base cash retainer of $30,000 for such service, to be paid quarterly. In addition, we compensate the members of our board of directors for service on our committees and for service as our lead independent director, if any, as follows:
|
· |
The chairperson of our audit committee receives an annual cash retainer of $20,000 for such service, paid quarterly, and each of the other members of the audit committee receives an annual cash retainer of $8,000, paid quarterly. |
|
· |
The chairperson of our compensation committee receives an annual cash retainer of $10,000 for such service, paid quarterly, and each of the other members of the compensation committee receives an annual cash retainer of $5,000, paid quarterly. |
|
· |
The chairperson of our nominating/corporate governance committee receives an annual cash retainer of $6,000 for such service, paid quarterly, and each of the other members of the nominating/corporate governance committee receives an annual cash retainer of $3,000, paid quarterly. |
|
· |
Our lead independent director, if any, receives an annual cash retainer of $6,000 for such service, paid quarterly. |
Each year at the time of our annual meeting of stockholders, we will grant each non-employee director 10,500 RSUs, which RSUs will vest quarterly over one year from the date of grant. If a new non-employee director joins our board of directors in the future, such director will receive an initial stock option grant to purchase 47,000 shares of our common stock, which stock option will vest monthly over three years.
114
The following table sets forth information regarding compensation earned by our non-employee directors during the fiscal year ended December 31, 2013.
|
|
|
|
|
|
|
|
|
|
|
|
|
|
|
|
|
|
|
Name |
|
Fees Earned or Paid in Cash |
|
|
Stock Awards (1) |
|
|
Options Awards (2) |
|
|
Total |
|
||||
|
Gary S. Briggs(3) |
|
$ |
14,608 |
|
|
$ |
— |
|
|
$ |
265,154 |
|
|
$ |
279,762 |
|
|
David Cowan |
|
$ |
35,000 |
(4) |
|
$ |
103,425 |
|
|
$ |
— |
|
|
$ |
138,425 |
|
|
Roy A. Guthrie |
|
$ |
53,000 |
(5) |
|
$ |
103,425 |
|
|
$ |
— |
|
|
$ |
156,425 |
|
|
Srinivasan (Chini) Krishnan |
|
$ |
30,000 |
(6) |
|
$ |
103,425 |
|
|
$ |
— |
|
|
$ |
133,425 |
|
|
Albert A. (Rocky) Pimentel |
|
$ |
48,000 |
(7) |
|
$ |
103,425 |
|
|
$ |
— |
|
|
$ |
151,425 |
|
|
Thomas J. Ridge |
|
$ |
44,000 |
(8) |
|
$ |
103,425 |
|
|
$ |
— |
|
|
$ |
147,425 |
|
|
(1) |
The amounts in this column reflect the aggregate grant date fair value of stock awards granted to our non-employee directors during fiscal 2013, computed in accordance with FASB ASC Topic 718. The valuation assumptions used in determining such amounts are described in Note 12 to our audited consolidated financial statements included in this Form 10-K/A. The amounts reported in this column reflect our accounting expense for these awards and do not correspond to the actual economic value that may be received by our non-employee directors from their stock awards. The table below provides information with respect to the outstanding stock awards held by each of our non-employee directors as of December 31, 2013. |
|
|
(2) |
The amounts in this column reflect the aggregate grant date fair value of option awards granted to our non-employee directors during fiscal 2013, computed in accordance with FASB ASC Topic 718. The valuation assumptions used in determining such amounts are described in Note 12 to our audited consolidated financial statements included in this Form 10-K/A. The amounts reported in this column reflect our accounting expense for these awards and do not correspond to the actual economic value that may be received by our non-employee directors from their option awards. The table below provides information with respect to the outstanding option awards held by each of our non-employee directors as of December 31, 2013. |
|
|
(3) |
Mr. Briggs joined our board of directors on August 9, 2013. |
|
|
(4) |
Does not include $8,750 of director fees earned in fiscal 2012, which were paid in fiscal 2013 and included in the director compensation table in the proxy statement filed with the SEC in connection with our 2013 annual meeting of stockholders (the “2013 Proxy Statement”). |
|
|
(5) |
Does not include $13,250 of director fees earned in fiscal 2012, which were paid in fiscal 2013 and included in the director compensation table in the 2013 Proxy Statement. |
|
|
(6) |
Does not include $7,500 of director fees earned in fiscal 2012, which were paid in fiscal 2013 and included in the director compensation table in the 2013 Proxy Statement. |
|
|
(7) |
Does not include $12,000 of director fees earned in fiscal 2012, which were paid in fiscal 2013 and included in the director compensation table in the 2013 Proxy Statement. |
|
|
(8) |
Does not include $11,000 of director fees earned in fiscal 2012, which were paid in fiscal 2013 and included in the director compensation table in the 2013 Proxy Statement. |
|
The following table lists all outstanding equity awards held by our non-employee directors as of December 31, 2013:
|
|
|
|
|
|
|
|
|
|
|
Name |
|
Option Awards |
|
|
Stock Awards |
|
||
|
Gary S. Briggs |
|
|
47,000 |
|
|
|
— |
|
|
David Cowan |
|
|
47,000 |
|
|
|
5,250 |
|
|
Roy A. Guthrie |
|
|
47,000 |
|
|
|
5,250 |
|
|
Srinivasan (Chini) Krishnan |
|
|
151,251 |
|
|
|
5,250 |
|
|
Albert A. (Rocky) Pimentel |
|
|
100,000 |
|
|
|
5,250 |
|
|
Thomas J. Ridge |
|
|
133,111 |
|
|
|
5,250 |
|
The information required by this Item will be set forth in the Proxy Statement and is incorporated herein by reference.
The information required by this Item will be set forth in the Proxy Statement and is incorporated herein by reference.
The information required by this Item will be set forth in the Proxy Statement and is incorporated herein by reference.
115
|
(a) |
Documents filed as a part of this report: |
|
1. |
Financial Statements: The information concerning our financial statements and Report of Independent Registered Public Accounting Firm required by this Item is incorporated by reference herein to the section of this Form 10-K/A in Item 8, titled “Financial Statements and Supplementary Data.” |
|
2. |
Financial Statement Schedule: Schedule II—Valuation and Qualifying Accounts is filed as part of this Form 10-K/A and should be read in conjunction with the consolidated financial statements or notes thereto. |
SCHEDULE II – VALUATION AND QUALIFYING ACCOUNTS
|
Year ended December 31, |
|
Beginning |
|
|
Additions (recoveries) – |
|
|
Deductions |
|
|
Ending |
|
||||
|
Allowance for doubtful accounts (1) |
|
|
|
|
|
|
|
|
|
|
|
|
|
|
|
|
|
2013 |
|
$ |
134 |
|
|
$ |
114 |
|
|
$ |
(144 |
) |
|
$ |
104 |
|
|
2012 |
|
|
88 |
|
|
|
79 |
|
|
|
(33 |
) |
|
|
134 |
|
|
2011 |
|
|
115 |
|
|
|
(27 |
) |
|
|
— |
|
|
|
88 |
|
|
Deferred tax asset valuation allowance(2) |
|
|
|
|
|
|
|
|
|
|
|
|
|
|
|
|
|
2013 |
|
$ |
49,146 |
|
|
|
(47,917 |
) |
|
|
— |
|
|
$ |
1,229 |
|
|
2012 |
|
|
61,564 |
|
|
|
(12,418 |
) |
|
|
— |
|
|
|
49,146 |
|
|
2011 |
|
|
62,538 |
|
|
|
(974 |
) |
|
|
— |
|
|
|
61,564 |
|
|
(1) |
We record additions to the allowance for doubtful accounts based on historical collections, write-off experience, current economic trends, and changes in customer payment terms and other factors that may affect our ability to collect payments. Deductions principally reflect amounts charged off as uncollectible, less amounts recovered. |
|
(2) |
Deferred tax assets are reduced by a valuation allowance when, in our opinion, it is more likely than not that the related benefit will not be realized. |
All other schedules have been omitted because the required information is included in the consolidated financial statements or the notes thereto, or is not applicable or required.
|
3. |
Exhibits: See Item 15(b) below. We have filed, or incorporated into this Form 10-K/A by reference, the exhibits listed on the accompanying Index to Exhibits immediately following the signature page of this Form 10-K/A. |
|
(b) |
Exhibits: The exhibit list in the Index to Exhibits immediately following the signature page of this Form 10-K/A is incorporated herein by reference as the list of exhibits required by this Item 15(b). |
|
(c) |
Financial Statement Schedules: See Item 15(a) above. |
116
SIGNATURES
Pursuant to the requirements of Section 13 or 15(d) of the Securities Exchange Act of 1934, the registrant has duly caused this report to be signed on its behalf by the undersigned, thereunto duly authorized.
|
|
|
LIFELOCK, INC. |
||
|
Dated: November 10, 2014 |
|
By: |
|
/s/ Todd Davis |
|
|
|
|
|
Todd Davis |
|
|
|
|
|
Chairman and Chief Executive Officer |
|
|
|
LIFELOCK, INC. |
||
|
Dated: November 10, 2014 |
|
By: |
|
/s/ Chris Power |
|
|
|
|
|
Chris Power |
|
|
|
|
|
Chief Financial Officer |
Pursuant to the requirements of the Securities Exchange Act of 1934, this report has been signed below by the following persons on behalf of the registrant and in the capacities and on the dates indicated.
|
Signature |
|
Title |
|
Date |
|
|
|
|
|
|
|
/s/ Todd Davis |
|
Chairman of the Board and Chief Executive Officer |
|
November 10, 2014 |
|
Todd Davis |
|
(Principal Executive Officer) |
|
|
|
|
|
|
|
|
|
/s/ Chris Power |
|
Chief Financial Officer |
|
November 10, 2014 |
|
Chris Power |
|
(Principal Financial and Accounting Officer) |
|
|
|
|
|
|
|
|
|
/s/ David Cowan |
|
Director |
|
November 10, 2014 |
|
David Cowan |
|
|
|
|
|
|
|
|
|
|
|
/s/ Chini Krishnan |
|
Director |
|
November 10, 2014 |
|
Srinivasan (Chini) Krishnan |
|
|
|
|
|
|
|
|
|
|
|
/s/ Roy A. Guthrie |
|
Director |
|
November 10, 2014 |
|
Roy A. Guthrie |
|
|
|
|
|
|
|
|
|
|
|
/s/ Albert A. Pimentel |
|
Director |
|
November 10, 2014 |
|
Albert A. (Rocky) Pimentel |
|
|
|
|
|
|
|
|
|
|
|
/s/ Thomas J. Ridge |
|
Director |
|
November 10, 2014 |
|
Thomas J. Ridge |
|
|
|
|
|
|
|
|
|
|
|
/s/ Gary Briggs |
|
Director |
|
November 10, 2014 |
|
Gary Briggs |
|
|
|
|
117
EXHIBIT INDEX
|
Exhibit No.
|
Description of Exhibit
|
|
|
|
|
2.1 |
Agreement and Plan of Merger, dated as of December 11, 2013, by and among LifeLock, Inc., Lavender Acquisition Corporation, Lemon, Inc., and Shareholder Representative Services LLC, as the Securityholder Representative (1) |
|
|
|
|
3.1 |
Seventh Amended and Restated Certificate of Incorporation of LifeLock, Inc. (2) |
|
|
|
|
3.2 |
Amended and Restated Bylaws of LifeLock, Inc. (3) |
|
|
|
|
4.1 |
Form of Common Stock Certificate (4) |
|
|
|
|
4.2 |
Fourth Amended and Restated Investors’ Rights Agreement, dated as of March 14, 2012, by and among LifeLock, Inc. and the investors named therein (5) |
|
|
|
|
10.1† |
Form of Indemnification Agreement by and between LifeLock, Inc. and each of its directors and executive officers (6) |
|
|
|
|
10.2† |
Second Amended and Restated Employment Agreement, dated as of September 14, 2012, between LifeLock, Inc. and Todd Davis (7) |
|
|
|
|
10.3† |
Second Amended and Restated Employment Agreement, dated as of September 14, 2012, between LifeLock, Inc. and Chris Power (8) |
|
|
|
|
10.3A† |
First Amendment to Second Amended and Restated Employment Agreement, dated as of February 15, 2013, between LifeLock, Inc. and Chris Power (9) |
|
|
|
|
10.4† |
Second Amended and Restated Employment Agreement, dated as of September 14, 2012, between LifeLock, Inc. and Clarissa Cerda (10) |
|
|
|
|
10.7 |
Credit Agreement, dated as of January 9, 2013, among LifeLock, Inc., the Guarantors named therein, Bank of America, N.A., as Administrative Agent, Swing Line Lender and L/C Issuer, Silicon Valley Bank, as Syndication Agent, the other Lenders named therein, and Merrill Lynch, Pierce, Fenner & Smith Incorporated as Sole Lead Arranger and Sole Book Manager (11) |
|
|
|
|
10.8 |
Office Lease, dated as of May 18, 2007, between LifeLock, Inc. and Hayden Ferry Lakeside, LLC (12) |
|
|
|
|
10.8A |
First Amendment to Office Lease, dated as of March 7, 2008, between LifeLock, Inc. and Hayden Ferry Lakeside, LLC (13) |
|
10.8B |
Second Amendment to Office Lease, dated as of May 17, 2013, between LifeLock, Inc. and PKY Fund II Phoenix II, LLC (14) |
|
10.8C |
Third Amendment to Office Lease, dated effective as of September 13, 2013, between LifeLock, Inc. and PKY Fund II Phoenix II, LLC (15) |
|
10.8D |
Fourth Amendment to Office Lease, dated effective as of December 5, 2013, between LifeLock, Inc. and PKY Fund II Phoenix II, LLC (16) |
|
|
|
|
10.9 |
Lease Agreement, dated as of March 1, 2008, by and between LifeLock, Inc. and BoMin2035M LLC (17) |
|
|
|
|
10.9A |
First Amendment to Lease Agreement, dated as of March 17, 2008, by and between LifeLock, Inc. and BoMin2035M LLC (18) |
|
|
|
|
10.9B |
Second Amendment to Lease Agreement, dated as of May 14, 2010, by and between LifeLock, Inc. and BoMin2035M LLC (19) |
|
|
|
|
10.10* |
Identity Protection Service Provider Agreement, dated as of July 29, 2011, by and between LifeLock, Inc. and Early Warning Services, LLC (20) |
|
|
|
|
10.11* |
Amended and Restated Reseller Agreement, dated November 12, 2008, between the Company and CSIdentity Corporation, as amended (21) |
|
|
|
|
10.12† |
Amended and Restated 2006 Incentive Compensation Plan (22) |
|
|
|
|
10.13† |
Form of Stock Option Agreement under Amended and Restated 2006 Incentive Compensation Plan (23) |
|
|
|
|
10.15† |
Employment Agreement, dated as of September 14, 2012, between LifeLock, Inc. and Hilary A. Schneider (24) |
|
|
|
|
10.16† |
2012 Incentive Compensation Plan (25) |
118
|
Exhibit No.
|
Description of Exhibit
|
|
|
|
|
10.17† |
Form of Stock Option Agreement and Restricted Stock Unit Agreement under 2012 Incentive Compensation Plan (26) |
|
|
|
|
10.18† |
2012 Employee Stock Purchase Plan (27) |
|
|
|
|
10.19† |
2012 Performance Bonus Plan (28)
|
|
10.20† |
Employment Agreement, dated July 29, 2013, between LifeLock, Inc. and Velislav Iltchev (29) |
|
|
|
|
21.1 |
List of Subsidiaries (30) |
|
|
|
|
23.1 |
Consent of Ernst & Young LLP, independent registered public accounting firm** |
|
|
|
|
24.1 |
Power of Attorney (included on the signature page of this Annual Report on Form 10-K) (31) |
|
|
|
|
31.1 |
Certification of Principal Executive Officer required by Rule 13a-14(a) or Rule 15d-14(a) of the Securities Exchange Act of 1934, as adopted pursuant to Section 302 of the Sarbanes-Oxley Act of 2002** |
|
|
|
|
31.2 |
Certification of Principal Financial Officer required by Rule 13a-14(a) or Rule 15d-14(a) of the Securities Exchange Act of 1934, as adopted pursuant to Section 302 of the Sarbanes-Oxley Act of 2002** |
|
|
|
|
32.1 |
Certification of Chief Executive Officer pursuant to 18 U.S.C. Section 1350, as adopted pursuant to Section 906 of the Sarbanes-Oxley Act of 2002** |
|
|
|
|
32.2 |
Certification of Chief Financial Officer pursuant to 18 U.S.C. Section 1350, as adopted pursuant to Section 906 of the Sarbanes-Oxley Act of 2002** |
|
|
|
|
101.INS |
XBRL Instance Document |
|
|
|
|
101.SCH |
XBRL Taxonomy Extension Schema Document |
|
|
|
|
101.CAL |
XBRL Taxonomy Extension Calculation Linkbase Document |
|
|
|
|
101.DEF |
XBRL Taxonomy Extension Definition Linkbase Document |
|
|
|
|
101.LAB |
XBRL Taxonomy Extension Label Linkbase Document |
|
|
|
|
101.PRE |
XBRL Taxonomy Extension Presentation Linkbase Document |
|
(1) |
Filed as Exhibit 2.1 to the Registrant’s Current Report on Form 8-K filed with the Securities and Exchange Commission on December 12, 2013, and incorporated herein by reference. |
|
(2) |
Filed as Exhibit 3.1 to the Registrant’s Current Report on Form 8-K filed with the Securities and Exchange Commission on October 9, 2012, and incorporated herein by reference. |
|
(3) |
Filed as Exhibit 3.2 to the Registrant’s Current Report on Form 8-K filed with the Securities and Exchange Commission on October 9, 2012, and incorporated herein by reference. |
|
(4) |
Filed as Exhibit 4.1 to Amendment No. 2 to the Registrant’s Registration Statement on Form S-1 filed with the Securities and Exchange Commission on September 19, 2012, and incorporated herein by reference. |
|
(5) |
Filed as Exhibit 4.2 to the Registrant’s Registration Statement on Form S-1 filed with the Securities and Exchange Commission on August 28, 2012, and incorporated herein by reference. |
|
(6) |
Filed as Exhibit 10.1 to Amendment No. 2 to the Registrant’s Registration Statement on Form S-1 filed with the Securities and Exchange Commission on September 19, 2012, and incorporated herein by reference. |
|
(7) |
Filed as Exhibit 10.2 to Amendment No. 1 to the Registrant’s Registration Statement on Form S-1 filed with the Securities and Exchange Commission on September 14, 2012, and incorporated herein by reference. |
|
(8) |
Filed as Exhibit 10.3 to Amendment No. 1 to the Registrant’s Registration Statement on Form S-1 filed with the Securities and Exchange Commission on September 14, 2012, and incorporated herein by reference. |
|
(9) |
Filed as Exhibit 10.3A to the Registrant’s Current Report on Form 8-K filed within the Securities and Exchange Commission on February 22, 2013, and incorporated herein by reference. |
|
(10) |
Filed as Exhibit 10.4 to Amendment No. 1 to the Registrant’s Registration Statement on Form S-1 filed with the Securities and Exchange Commission on September 14, 2012, and incorporated herein by reference. |
119
|
(11) |
Filed as Exhibit 10.7 to the Registrant’s Current Report on Form 8-K filed with the Securities and Exchange Commission on January 15, 2013, and incorporated herein by reference. |
|
(12) |
Filed as Exhibit 10.8 to the Registrant’s Registration Statement on Form S-1 filed with the Securities and Exchange Commission on August 28, 2012, and incorporated herein by reference. |
|
(13) |
Filed as Exhibit 10.8A to the Registrant’s Registration Statement on Form S-1 filed with the Securities and Exchange Commission on August 28, 2012, and incorporated herein by reference. |
|
(14) |
Filed as Exhibit 10.8B to the Registrant’s Current Report on Form 8-K filed with the Securities and Exchange Commission on May 21, 2013, and incorporated herein by reference. |
|
(15) |
Filed as Exhibit 10.8C to the Registrant’s Current Report on Form 8-K filed with the Securities and Exchange Commission on September 16, 2013, and incorporated herein by reference. |
|
(16) |
Filed as Exhibit 10.8D to the Registrant’s Current Report on Form 8-K filed with the Securities and Exchange Commission on December 10, 2013, and incorporated herein by reference. |
|
(17) |
Filed as Exhibit 10.9 to the Registrant’s Registration Statement on Form S-1 filed with the Securities and Exchange Commission on August 28, 2012, and incorporated herein by reference. |
|
(18) |
Filed as Exhibit 10.9A to the Registrant’s Registration Statement on Form S-1 filed with the Securities and Exchange Commission on August 28, 2012, and incorporated herein by reference. |
|
(19) |
Filed as Exhibit 10.9B to the Registrant’s Registration Statement on Form S-1 filed with the Securities and Exchange Commission on August 28, 2012, and incorporated herein by reference. |
|
(20) |
Filed as Exhibit 10.10 to Amendment No. 3 the Registrant’s Registration Statement on Form S-1 filed with the Securities and Exchange Commission on September 27, 2012, and incorporated herein by reference. |
|
(21) |
Filed as Exhibit 10.11 to Amendment No. 3 the Registrant’s Registration Statement on Form S-1 filed with the Securities and Exchange Commission on September 27, 2012, and incorporated herein by reference. |
|
(22) |
Filed as Exhibit 10.12 to the Registrant’s Registration Statement on Form S-1 filed with the Securities and Exchange Commission on August 28, 2012, and incorporated herein by reference. |
|
(23) |
Filed as Exhibit 10.13 to the Registrant’s Registration Statement on Form S-1 filed with the Securities and Exchange Commission on August 28, 2012, and incorporated herein by reference. |
|
(24) |
Filed as Exhibit 10.15 to Amendment No. 1 to the Registrant’s Registration Statement on Form S-1 filed with the Securities and Exchange Commission on September 14, 2012, and incorporated herein by reference. |
|
(25) |
Filed as Exhibit 10.16 to Amendment No. 1 to the Registrant’s Registration Statement on Form S-1 filed with the Securities and Exchange Commission on September 14, 2012, and incorporated herein by reference. |
|
(26) |
Filed as Exhibit 10.17 to Amendment No. 1 to the Registrant’s Registration Statement on Form S-1 filed with the Securities and Exchange Commission on September 14, 2012, and incorporated herein by reference. |
|
(27) |
Filed as Exhibit 10.18 to Amendment No. 1 to the Registrant’s Registration Statement on Form S-1 filed with the Securities and Exchange Commission on September 14, 2012, and incorporated herein by reference. |
|
(28) |
Filed as Exhibit 10.19 to Amendment No. 1 to the Registrant’s Registration Statement on Form S-1 filed with the Securities and Exchange Commission on September 14, 2012, and incorporated herein by reference. |
|
(29) |
Filed as Exhibit 10.20 to the Registrant’s Quarterly Report on Form 10-Q filed with the Securities and Exchange Commission on October 31, 2013, and incorporated herein by reference. |
|
(30) |
Filed as Exhibit 21.1 to the Registrant’s Annual Report on Form 10-K filed with the Securities and Exchange Commission on February 19, 2014, and incorporated herein by reference. |
|
(31) |
Filed as Exhibit 24.1 to the Registrant’s Annual Report on Form 10-K filed with the Securities and Exchange Commission on February 19, 2014, and incorporated herein by reference. |
|
† |
Indicates management contract or compensatory plan or arrangement. |
|
* |
Confidential treatment has been granted by the SEC for portions of this exhibit. |
|
** |
Filed herewith. |
120