Attached files
| file | filename |
|---|---|
| 8-K - FORM 8-K - KEYCORP /NEW/ | d819104d8k.htm |
| KeyCorp
Bank of America Merrill Lynch 2014 Banking and
Financial Services Conference
Chris Gorman
President, Key Corporate Bank
Don Kimble
Chief Financial Officer
Exhibit 99.1 |
| 2
FORWARD-LOOKING STATEMENTS AND ADDITIONAL
INFORMATION DISCLOSURE
“expect,” “anticipate,” “assume,” “intend,”
“project,” “believe,” or “estimate.” Forward-looking statements represent management’s current
expectations and forecasts regarding future events. If underlying assumptions prove to be inaccurate
or unknown risks or uncertainties arise, actual results could vary materially from these
projections or expectations. Risks and uncertainties include but are not limited to: (1) deterioration of commercial real estate
market fundamentals; (2) declining asset prices; (3) adverse changes in credit quality trends;
(4) changes in local, regional and international business, economic or political conditions; (5) the
extensive and increasing regulation of the U.S. financial services industry; (6) increasing capital
and liquidity standards under applicable regulatory rules; (7) unanticipated changes in our
liquidity position, including but not limited to, changes in the cost of liquidity, our ability to enter the financial
markets and to secure alternative funding sources; (8) our ability to receive dividends from our
subsidiary, KeyBank; (9) downgrades in our credit ratings or those of KeyBank; (10) operational
or risk management failures by us or critical third-parties; (11) breaches of security or failures of our
technology systems due to technological or other factors and cybersecurity threats; (12) adverse
judicial proceedings; (13) the occurrence of natural or man-made disasters or conflicts or
terrorist attacks; (14) a reversal of the U.S. economic recovery due to economic, political or other
shocks; (15) our ability to anticipate interest rate changes and manage interest rate risk; (16)
deterioration of economic conditions in the geographic regions where we operate; (17) the
soundness of other financial institutions; (18) our ability to attract and retain talented executives
and employees, to effectively sell additional products or services to new or existing customers, and
to manage our reputational risks; (19) our ability to timely and effectively implement our
strategic initiatives; (20) increased competitive pressure due to industry consolidation; (21)
unanticipated adverse effects of acquisitions and dispositions of assets or businesses; and (22) our
ability to develop and effectively use the quantitative models we rely upon in our business
planning. We provide greater detail regarding these factors in our 2013 Form 10-K and subsequent filings,
which are available online at www.key.com/ir and www.sec.gov. Forward-looking statements
speak only as of the date they are made and Key does not undertake any obligation to update the
forward-looking statements to reflect new information or future events.
This presentation also includes certain Non-GAAP financial measures related to “tangible
common equity,” “Tier 1 common equity,” “pre-provision net
revenue,” and “cash efficiency ratio.” Management believes these ratios may assist investors, analysts and regulators in analyzing Key’s
financials. Although Key has procedures in place to ensure that these measures are calculated using
the appropriate GAAP or regulatory components, they have limitations as analytical tools and
should not be considered in isolation, or as a substitute for analysis of results under GAAP.
For more information on these calculations and to view the reconciliations to the most comparable GAAP measures, please refer to the
Appendix to this presentation and to page 99 of our 2013 Form 10-K.
This presentation contains forward-looking statements, including statements about our financial
condition, results of operations, asset quality trends, capital levels and profitability.
Forward-looking statements can often be identified by words such as “outlook,” “goal,” “objective,” “plan,”
|
 Key
is relationship-focused with distinctive capabilities Key –
Diverse Franchise
Ranking based on asset size
Data as of 3Q14: balances reflect quarterly averages; market capitalization as of
September 30, 2014 •
Top 20 U.S. bank-based financial services company
•
Business diversity across the franchise, with two
primary lines of business:
-
Key Community Bank
-
Key Corporate Bank
Key Corporate Bank
Key Community Bank
Other
3
Loans
Revenue (TE)
Deposits
Noninterest
Income
56%
40%
4%
54%
41%
5%
48%
44%
8%
74%
25%
1%
-
Assets: $91 B
-
Deposits: $68 B
-
Market capitalization: $12 B
-
Strong footprint with approximately
1,000 branches and 1,300 ATMs
-
Approximately 2 million customers
-
Over 13,900 employees |
 Business Model: Aligned and Targeted
Traditional Bank Products
Capital Markets Capabilities
Deposits & payments
Loans
Wealth management
&
private banking
Equipment
finance
Derivatives & foreign
exchange
Equity capital markets
Equity research
M&A /
financial sponsors /
leveraged finance
Investment grade &
high-yield debt
Loan syndications
Public finance
$3
$50
$1,500
$2,000
Commercial client revenue size ($ MM)
$25
$100
$250
$500
Community Bank
Corporate Bank
Consumer
Energy Healthcare Industrial
Public Sector Real
Estate Technology Targeted
industries 4
Local delivery of broad product set and industry expertise
Differentiated platform with depth and maturity
Competitive advantage
5% Y-o-Y average loan
growth
$39 B in AUM
$68 B deposits at 16 bps
#7 largest bank-owned
equipment finance co.
(a)
#3 commercial mortgage
servicer
(master/primary)
(b)
Over 100 M&A deals
completed since 2011
100 transactions YTD,
raising $71 B
Rates, commodity &
currency solutions
166 transactions YTD,
raising $47 B
44 transactions YTD,
raising $17 B
797 companies under
coverage
88 transactions YTD,
raising $26 B
Note: Data as of 3Q14 unless otherwise noted; YTD statistics through 3Q14 (a)
Source: Monitor 100; ranking based on net assets as of FY13 (b)
Source: Mortgage Bankers Association FY13 rankings Commercial mortgage
banking
Cross-business collaboration provides additional opportunities across the
franchise |
 Key
Corporate Bank 5
Our middle market focus, industry-driven operating model and broad corporate &
investment banking capability set are unique…and drive results
Regional Banks
Universal Banks
Capability / Model
Middle Market Focus
Industry-driven Model
Investment Banking
Focused Franchise
Deep Industry Knowledge
Results (FY14)
Case Study: Industrial (Specialty Chemicals Practice)
•
Five dedicated chemicals coverage
bankers with aligned M&A, syndications
and capital markets professionals
•
Leading M&A advisory practice
•
Strong presence across industry events
•
Top-rated equity research franchise (two
analysts covering 36 companies)
•
$1B in capital committed to sector
•
> 50 clients and 200 prospects
Commercial Banking
Boutiques
Sell-Side Advisor
has been acquired by
Sell-Side Advisor
has been acquired by
a portfolio company of
$392,000,000
has been acquired by
Sell-Side Advisor
has been acquired by
Sell-Side Advisor
a portfolio company of
$325,000,000
Joint Lead Arranger,
Joint Bookrunner and
Co-Syndication Agent
Senior Secured
Credit Facilities
Joint Lead Arranger,
Joint Bookrunner &
Co-Syndication Agent
$855,000,000
has acquired
Senior Secured
Credit Facilities
Note: Operating model and capabilities comparison data are illustrative and represent a typical
firm within each category; some exceptions will apply |
 Leveraging Our Platform to Drive Relationships
Our specialty chemicals practice is able to acquire and expand client relationships by
delivering the full breadth of Key’s advisory and execution
capabilities Client Example
•
Producer of fine and
specialty chemicals for
pharmaceutical and
aerospace and
defense applications
•
~$60MM EBITDA
Initial
Status
The Model in Action
Key’s Role Today
•
Pure prospect
(FY11)
–
Equity research
–
Industry conferences
–
Non-deal roadshows /
investor field trips
•
Non-agent
participant in
credit facility
(FY11)
•
Provider of flavor and
fragrance chemicals
and color systems
•
~$270MM EBITDA
•
Middle market, specialty
chemical focused
financial sponsor
•
~$1.7B committed
capital under
management
•
Pure prospect
(FY12)
6
2014
$450,000,000
Senior Unsecured
Credit Facilities
2014
Joint Lead Arranger,
Joint Bookrunner
Sell-Side Advisor
has been acquired by
$392,000,000
Transaction Value
$85,000,000
Senior Credit Facility
Joint Lead Arranger,
Sole Bookrunner
& Administrative Agent
2012
Foreign Exchange
&
Line of Credit
2014
$547,000,000
Senior Secured
Credit Facilities
Joint Lead Arranger,
Co-Syndication Agent &
Co-Documentation Agent
a portfolio company of
2014
2013
has acquired
Senior Secured
Credit Facilities
Joint Lead Arranger,
Sole Bookrunner &
Administrative Agent
was acquired by
•
Regular strategic /
financial advisory
dialogue
•
Proprietary deal flow
•
Strategic capital support
across markets
•
Equity capital markets
support & sponsorship
•
Market updates
•
Core banking
capabilities
–
Payments
–
Foreign Exchange
–
Derivatives |
 Delivering the Distinctive Platform
7
Our ability to lead transactions across markets allows us to match client needs with
market conditions, and deliver best execution
•
Key Corporate Bank completed >850 transactions raising ~$50B in capital for
our clients, ~20% of which went to our balance sheet (LTM 3Q14)
Healthcare
Energy
Consumer
Industrial
Public Sector
Real Estate
Key’s Balance
Sheet
Equity Capital
Markets
Syndicated Loans
Real Estate Capital
Markets
Debt Capital Markets
(IG/HY/Public Fin.)
Private Capital
Industry Verticals
Capital Placement ($B)
Key’s Capital Solutions
Credit facility (bank or institutional)
Bridge loan
Direct placement (debt or equity)
Equity offerings (IPOs / FOs / converts)
Commercial mortgage
Investment grade & high-yield debt
Mezzanine capital placement
Tax-exempt securities
$11
$28
$4
$5
$0
$2
Additional value is created as Key delivers non-capital solutions (e.g.,
payments, derivatives, foreign exchange, financial advisory) to
clients Technology
Note: Capital placement $ are LTM 3Q14 and include: in transactions where Key served as
bookrunner (or equivalent) -- 100% of capital raised; in transactions where Key served
as co-manager -- the proportion of capital corresponding to Key’s transaction economics (e.g., $20MM if Key were a 10% co-manager on a $200MM equity
offering). Balance sheet figures represent loan commitments. Data exclude equipment
finance and syndicated loan participations. |
 Consistent Progress
8
Solid progress in growing both loans and investment banking & debt placement
fees --
demonstrating the power of our model
•
Since 1Q09, investment banking and debt placement fees have increased
substantially as we focused on a more targeted client base
•
Loan balances up $7B (+44%) vs. 2Q11 trough
Corporate Bank loan balances
Corporate Bank LTM investment banking & debt placement fees
Loan Balances ($B) & LTM Investment Banking & Debt Placement Fees
($MM) Note:
Chart
depicts
period-end
loan
balances
and
investment
banking
and
debt
placement
fees
for
Key
Corporate
Bank
only.
LTM
denotes
the
twelve-month
period ended 3Q14.
$28.8
$23.0
$177
$348
1Q09
2Q09
3Q09
4Q09
1Q10
2Q10
3Q10
4Q10
1Q11
2Q11
3Q11
4Q11
1Q12
2Q12
3Q12
4Q12
1Q13
2Q13
3Q13
4Q13
1Q14
2Q14
3Q14 |
 Strong
Relative Performance 9
Results
compare
favorably
to
external
benchmarks
we
are
gaining
loan
share
with higher asset productivity
Commercial and Industrial Loan Growth
Asset Productivity
Since our portfolio troughed in 2Q11, Key Corporate Bank has taken
C&I loan share…
…while our broad product capabilities generate peer-leading asset
productivity
Revenue / Assets
(LTM 3Q14)
Peers
Key Corporate Bank
U.S. commercial banks
Commercial and Industrial Loans % change vs. 2Q11:
Source: Federal Reserve H8 report dated Oct. 3, 2014, Key Corporate Bank
excludes International Lease Portfolio; peer SEC filings and earnings releases. Peer data are
for Corporate Bank equivalent segments of peer financial institutions (e.g., PNC
Corporate & Institutional Banking segment). Peer banks include BAC, CMA, JPM, PNC,
STI,
USB,
WFC.
Revenue
/
assets
calculation
is
calculated
based
on
LTM
revenue
as
of
3Q14
divided
by
3Q14
average
assets
for
Key
Corporate
Bank
and
peers.
Commercial and Industrial
Loan Growth
37%
58%
3Q11 4Q11 1Q12 2Q12
3Q12 4Q12 1Q13 2Q13 3Q13 4Q13 1Q14 2Q14 3Q14
6.0%
5.0%
4.4%
4.3%
4.2%
3.9%
3.6%
3.5% |
 By
Industry and Size Proprietary Industry Knowledge and Research
10
The depth and breadth of Key’s equity research coverage is a tangible indicator
of the industry expertise we deliver to our clients and target prospects
•
Fully
aligned
with
Key’s
franchise
--
middle
market
focused
in
specific
industry
verticals
Equity Research Coverage
Illustrative Content
Total
< $5 B
%
144
100
69%
84
49
58%
32
21
66%
242
180
74%
72
53
74%
223
127
57%
Awards and Accolades
797
530
66%
Highly Rated for Distinctive Research (Small/Mid Cap)
–
#1 Basic Materials, #2 Industrials, #4 Restaurants
–
5 Top-5 Ratings in Technology Sub-Sectors
#1 Technology Equity Sales Coverage (Small/Mid Cap)
#3 Best Stock Recommendations (All US Institutions)
#4 Most Trusted (All US Institutions)
#1 Stock Picking Analyst (Commercial Services & Supplies)
5 Top-5 Earnings Estimators in respective industries
Notes: Awards and accolades include recognition of both KeyBanc Capital Markets
and Pacific Crest Securities Denotes number of companies in Key’s
research coverage with a market capitalization of < $5 billion #
|
 New
Client Impact 11
Key Corporate Bank has acquired >200 new client relationships through the first
three quarters of 2014, driving significant franchise value
•
75% of our new clients use non-credit products, indicating the power of our
model and targeted prospecting approach
New Client Profile: Product
New Client Profile: Revenue
>200 clients
Of clients acquired in 2014, only 25% are credit only…
…and fee income represents 70% of new client revenue
>$80MM
Note:
Revenue figures are total realized revenue in YTD 2014
Credit Clients
Credit Revenue
Credit + fee
Fee only
Credit only
Fee
Credit
30%
70%
25%
38%
37% |
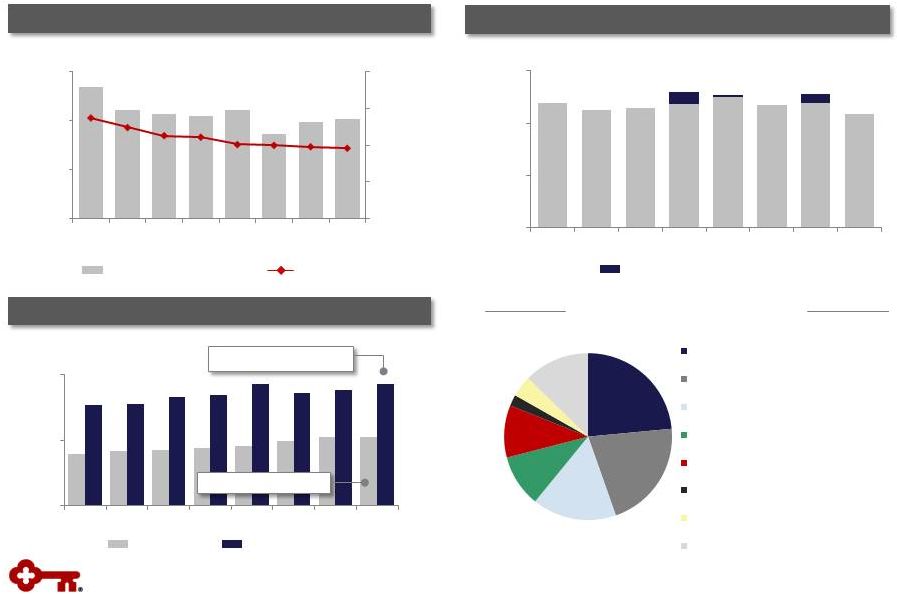
 Growing Deposit Franchise
12
We
have
significantly
strengthened
our
balance
sheet
post
crisis
via
increased
core
deposit funding
•
Recent investments in commercial payments and commercial real estate loan servicing
will continue to enhance Key’s deposit franchise
Key Corporate Bank Average Loan & Deposit Balances
Loan to
Deposit
Ratio
2.4x
2.1x
1.7x
1.6x
1.5x
1.3x
1.3x
Corporate average deposits
Average loans
Commercial real estate
loan servicing deposits
$11.9
$29.1
$17.3
$22.7
Note:
Chart depicts balances for Key Corporate Bank only
$ in billions
2008
2009
2010
2011
2012
2013
3Q14 |
 13
Financial Review |
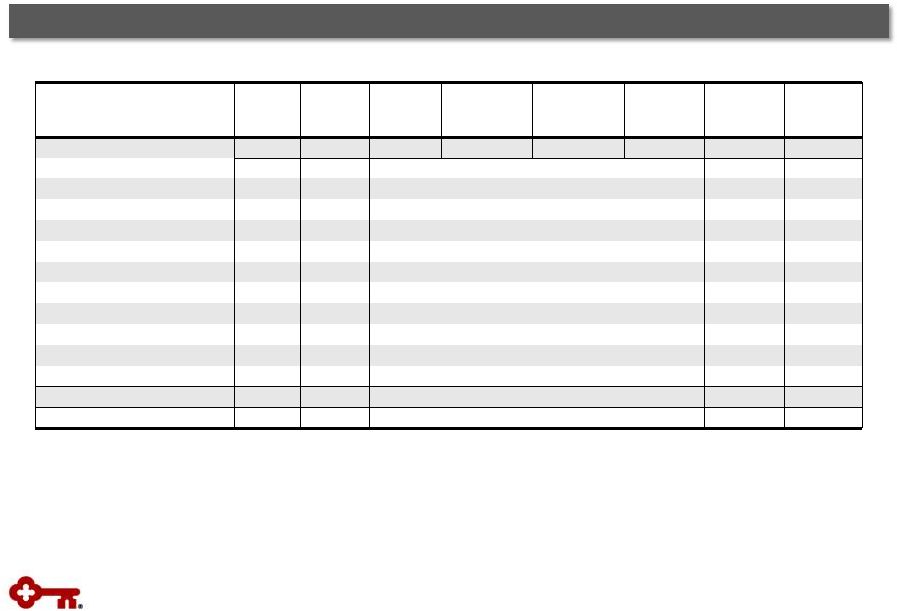
 Progress on Financial Goals
14
Balance Sheet
Efficiency
Moderate Risk
Profile
High Quality,
Diverse
Revenue Streams
Positive
Operating
Leverage
Execution of
Strategy
Metrics
(a)
3Q13 YTD
Targets
Loan
to
deposit
ratio
(b)
NCOs to average loans
Provision to average loans
Net interest margin
Noninterest income to total revenue
Cash efficiency ratio
(c)
Return on average assets
84%
.33%
67.5%
1.02%
.28%
3.16%
43%
90% -100%
40 -
60 bps
LT: >3.50%
LT: <60%
1.00% -1.25%
>40%
3Q14 YTD
87%
.20%
66.7%
1.06%
.09%
2.98%
43%
(a)
Continuing operations, unless otherwise noted
(b)
Represents period-end consolidated total loans and loans held for sale (excluding education loans
in the securitization trusts for periods prior to third quarter of 2014) divided by
period-end consolidated total deposits (excluding deposits in foreign office)
(c)
Excludes intangible asset amortization; non-GAAP measure: see Appendix for reconciliation
|
 15
High Quality and Diverse Revenue
TE = Taxable equivalent
Net Interest Income & Net Interest Margin Trend (TE)
Net interest income (TE)
NIM (TE)
$ in millions; continuing operations
Noninterest Income
$ in millions; continuing operations
Leveraged lease termination gains
$417
$459
(b)
(a)
Excludes deposits in foreign office
(b)
Other includes corporate-owned life insurance, principal investing, etc.
Noninterest income contributes >40% of total revenue
Average Total Loan and Deposit Growth
Deposits up 4% Y-o-Y
Loans up 5% Y-o-Y
$ in millions
Total loans
Total deposits
(a)
3Q14 Noninterest Income Diversity
$584
$581
3.11%
2.96%
2.00%
2.50%
3.00%
3.50%
4.00%
$500
$540
$580
$620
4Q12
1Q13
2Q13
3Q13
4Q13
1Q14
2Q14
3Q14
$200
$300
$400
$500
4Q12
1Q13
2Q13
3Q13
4Q13
1Q14
2Q14
3Q14
Trust & investment services
Investment banking & debt placement
Deposit service charges
Cards & payments
Corporate services
Mortgage fees
Operating lease income
Other
$40.0
$55.0
$70.0
4Q12
1Q13
2Q13
3Q13
4Q13
1Q14
2Q14
3Q14
24%
21%
16%
10%
10%
2%
4%
13% |
 Continued cost savings enable investments and offset
normal expense growth
Y-o-Y: low to mid-
single digit % decline
16
Expenses: Culture of Continuous Improvement
Reducing expenses while investing in our businesses for growth
$ in millions
FY13
FY14
outlook
Noninterest Expense
Outlook
Continuous Improvement
Note: Noninterest expense outlook graph not to scale
$2.8 B
Redefining end-to-end credit processes to
reduce duplication and identify cost savings
Pension
settlement
Efficiency charges
All remaining
expense
Pacific Crest
$704
$716
$689
Plans to remove ~15%
more by 2016
675
665
663
16
24
15
25
20
6
$520
$570
$620
$670
$720
3Q13
2Q14
3Q14
: Lean Six Sigma practices implemented throughout organization
: Corporate square footage >10% over the last
four years •
Reducing
occupancy
costs
•
Right-sizing
•
Improving
operational
effectiveness
: Rationalized fixed income trading platform to align with opportunity:
headcount Community Bank FTE 16% from
year-end 2012, while client-facing FTE are |
 17
Efficiency Ratio: Driving to 60% and Below
Business plans and macroeconomic environment provide path to an
efficiency ratio below 60%
Cash Efficiency Ratio
(a)
Outlook
(a)
Non-GAAP measure: see Appendix for reconciliation
(b)
Assumes implied forward curve
2-3 year outlook: 60%
Long-term, committed to moving below 60%
(b)
Long-term target: <60%
50%
55%
60%
65%
70%
3Q14 YTD
Business
growth,
net of investments
Expense savings
Rising rate benefit |
 18
Moderate Risk Profile
Enterprise-wide risk management approach drives quality
Targeted, Relationship-based Approach
Strong Asset Quality
•
Target specific segments and sectors where we
have expertise
•
Execute rigorous and disciplined sales approach
•
Clearly defined and well understood risk appetite
and tolerances
•
Risk management principles applied actively
Key
Peer median
(a)
(a)
Source:
SNL;
Peers
include
BBT,
CMA,
FITB,
FHN,
HBAN,
MTB,
PBCT,
PNC,
RF,
STI,
USB
and
ZION
Over the past 16 quarters,
Key has been lower than
peer median
Key NPAs
NPAs down 43%
from 4Q12
Peer Median
(a)
NPAs, % of period-end assets
Key NPAs, % of period-end assets
$ in millions
Nonperforming Assets
Net Charge-offs to Average Loans
$735
$531
$418
0.00%
0.50%
1.00%
1.50%
$0
$200
$400
$600
$800
4Q12
4Q13
3Q14
0.0%
1.0%
2.0%
3.0%
4.0% |
 19
Disciplined Capital Management
Strong Capital Position
Peer-leading Return
Capital
Priorities
Organic
Growth
Dividends
Share
Repurchases
Opportunistic
Growth
Disciplined in how we manage, invest, deploy and return our strong capital
position (a)
Non-GAAP measure: see Appendix for reconciliations
(b)
Includes peer banks participating in the 2013 CCAR or CapPR process with the
Federal Reserve: BBT, CMA, FITB, HBAN, MTB, PNC, RF, STI, USB and ZION 10.8%
under Basel III Regulatory Capital Rules •
Increased quarterly common share dividend by 18% to
$.065
•
Repurchased $368 MM shares YTD through 3Q14
2014 payout estimated to be >80%, among the highest in
our peer group for the second consecutive year
Peers
2014 Capital Actions
Tier 1 Common Equity
(a)
Book Value per Share
2013 Total Shareholder Payout
(b)
Up 9%
from
4Q12
11.36%
11.22%
11.26%
4Q12
4Q13
3Q14
$10.78
$11.25
$11.74
4Q12
4Q13
3Q14
76%
0%
20%
40%
60%
80% |
 2014
Outlook and Expectations Average Loans
•
LQA: mid-single digit growth, driven by
commercial loans
•
Mid-single digit growth vs. FY 2013
Net Interest Income
•
Relatively stable with 3Q14
•
Relatively stable from 2013, with slight
downward pressure from competitive
environment
Noninterest Income
•
Low double-digit percentage growth
from 3Q14, supported by stronger
market-related revenue and a full
quarter of Pacific Crest
•
Low single-digit growth compared to
prior year
Expense
•
Relatively stable with 3Q14 reported,
including Pacific Crest, pension,
seasonality and efficiency charges
•
Low to mid-single digit percentage
decline from 2013
Efficiency / Productivity
•
Positive operating leverage
•
Positive operating leverage
Asset Quality
•
Continued strong credit quality trends,
consistent with 3Q14 levels
•
Net charge-offs to average loans below
targeted
range
of
40
–
60
bps
Capital
•
Continued execution of capital plan
•
Disciplined execution of 2014 capital
plan, including dividends and share
repurchases
20
Guidance
ranges:
relatively
stable:
+/-
2%;
low
single-digit:
<5%;
mid-single
digit:
4%
-
6%;
low
double-digit:
10%
-
13%
4Q14
FY 2014 |
 21
Appendix |
 •
Supporting businesses with
technology development
•
Driving talent management to
improve productivity
Focused on Driving Positive Operating Leverage
Revenue Growth
Expense Savings
Community
Bank
Corporate
Bank
•
Improving sales productivity
•
Strengthening product offering:
Hassle-Free
•
Enhancing online and mobile
channels
•
Optimizing branch channel
•
Driving greater efficiencies through
back and middle-office processes
Enterprise
•
Adding senior bankers:
existing
industry expertise and relationships
•
Strengthening commercial payment
product capabilities
•
Added
technology
vertical:
completed
Pacific Crest acquisition
•
Exiting international leasing
originations and reducing related cost
structure
•
Variablizing
cost:
utilization
of
third-
party partners
•
Rationalization of fixed income trading
platform
•
Improving operational effectiveness:
Lean Six Sigma, variablizing costs
•
Reducing occupancy costs
•
Right-sizing support activities
22
Executing action plans across our organization
Driving consumer sales
per
FTE
per
day:
up
>30% from prior year
Reducing occupancy:
plans to remove ~15% of
corporate square footage
by 2016
Aggressive campaign to
add
bankers:
relationship
managers up ~15% from
prior year
(a)
Data as of 3Q14 unless otherwise noted
(a)
Includes impact of the acquisition of Pacific Crest Securities |
 23
Financial Highlights
TE = Taxable equivalent, EOP = End of Period
(a)
From continuing operations
(b)
Year-over-year average balance growth
(c)
From consolidated operations
(d)
Non-GAAP measure: see Appendix for reconciliation
EPS –
assuming dilution
$ .23
$ .27
$ .26
$ .26
$ .25
Cash efficiency ratio
(d)
69.5
%
65.8
%
64.9
%
67.4
%
67.5
%
excl. efficiency and pension charges
66.0
63.4
63.9
65.1
63.6
Net interest margin (TE)
2.96
2.98
3.00
3.01
3.11
Return on average total assets
.92
1.14
1.13
1.08
1.12
Total loans and leases
5
%
6
%
4
%
3
%
5
%
CF&A loans
11
13
9
8
11
Deposits (excl. foreign deposits)
4
2
4
8
5
Tier 1 common equity
(d)
11.3
%
11.3
%
11.3
%
11.2
%
11.2
%
Tier 1 risk-based capital
12.0
12.0
12.0
12.0
11.9
Tangible common equity to tangible assets
(d)
10.3
10.2
10.1
9.8
9.9
NCOs to average loans
.22
%
.22
%
.15
%
.27
%
.28
%
NPLs to EOP portfolio loans
.71
.71
.81
.93
1.01
Allowance for loan losses to EOP loans
1.43
1.46
1.50
1.56
1.62
Balance
Sheet
Growth
(a),
(b)
Capital
(c)
Asset
Quality
(a)
Financial
Performance
(a)
Metrics
3Q14
2Q14
1Q14
4Q13
3Q13 |
 Interest Rate Risk Management
Naturally Asset Sensitive Balance Sheet
Actively Managing Rate Risk
•
High quality
•
Fixed rate agency MBS and CMOs
•
Average maturity: 3.6 years
•
GNMAs total 35% of total portfolio
•
Reinvesting cash flows into GNMAs
$9
$15
$5
$5
Size of swap
portfolio
Modeled asset
sensitivity
~3%
0%
7%
$5
Variable:
69%
Fixed:
31%
Flexibility to adjust rate sensitivity for changes in balance
sheet growth/mix as well as interest rate outlook
Debt
hedges
A/LM
hedges
Noninterest-
bearing: 37%
Interest-
bearing, non-
time: 54%
CDs:
9%
•
Maintaining moderate asset sensitive position of ~3%
-
Assumes 200 basis point increase in short-term rates over a
12-month period
•
Utilize swaps for debt hedging and asset liability management
-
Fairly even pace of A/LM swap maturities
3Q14
Swaps
($ in B)
9/30/14
Notional Amt.
Wtd. Avg.
Maturity (Yrs.)
Receive
Rate
Pay
Rate
A/L Management
$ 9.3
1.8
.8%
.2%
Debt
4.5
4.0
2.5
.2
$ 13.8
1.3%
.2%
3Q14
$17 B
AFS: $12 B
HTM: $5 B
Balance sheet has relatively short duration and is
more impacted by the short-end of the curve
$14 B
24
Actively managing a naturally asset sensitive balance sheet
Flexibility to Adjust Rate
Sensitivity with Swaps
Investment Portfolio
Loans
Deposits |
 Focused Expense Management
$2.82 B
$117 MM
$2.70 B
Low to mid-
single digit
decline year-
over-year
Continued cost savings enable investments and offset normal expense growth
(4) % –
(6) %
1 % –
2.5 %
1 % -
2%
(a)
(a)
Operating cost increase includes inflationary adjustments, annual merit increases,
etc. 2 % –
2.5 %
25
Note: Percentage ranges based upon 2014 expense plans and calculated from 2013
reported NIE 2013 reported
NIE
2013 efficiency
and pension
charges
2013 NIE excl.
charges
Expense savings
Operating cost
increase
Investments
2014 NIE outlook
excl. charges
2014 efficiency
charges
2014 NIE outlook |
 26
Average Total Investment Securities
Highlights
Average AFS securities
$ in billions
High Quality Investment Portfolio
•
Portfolio composed primarily of GNMA and GSE-
backed MBS and CMOs
–
No private label MBS or financial paper
•
Currently reinvesting cash flows into GNMA
securities in preparation for upcoming
regulatory liquidity requirements
–
35% of total portfolio was GNMA at 9/30/14
•
Securities cash flows of $.9 billion in both 3Q14
and 2Q14
•
Average portfolio life at 9/30/14 of 3.6 years,
unchanged from 6/30/14
Securities to Total Assets
(b)
(a) Yield is calculated on the basis of amortized cost
(b) Includes end of period held-to-maturity and
available-for-sale securities Average yield
(a)
Average HTM securities
$17.7
2.23%
$17.0
2.15%
.00%
1.00%
2.00%
3.00%
4.00%
5.00%
$0.0
$5.0
$10.0
$15.0
$20.0
4Q12
1Q13
2Q13
3Q13
4Q13
1Q14
2Q14
3Q14
19%
19%
10%
14%
18%
22%
4Q12
1Q13
2Q13
3Q13
4Q13
1Q14
2Q14
3Q14 |
 27
Nonperforming Assets
Net Charge-offs & Provision for Loan and Lease Losses
NPLs
NPLs to period-end loans
NCOs
Provision for loan and
lease losses
NCOs to average loans
$ in millions
$ in millions
NPLs held for sale,
OREO & other NPAs
Continued Improvement in Asset Quality
Highlights
•
Net loan charge-offs decreased 16% from 3Q13 to
$31 MM, or 22 bps of average loans
•
Total gross charge-offs down 37% from 3Q13 and
down 13% from 2Q14
•
Nonperforming assets down 28% from prior year
•
Net charge-offs expected to continue below the
targeted range for the remainder of the year
Allowance for Loan and Lease Losses
Allowance for loan and
lease losses to NPLs
Allowance for loan
and lease losses
$ in millions
$579
$418
$37
$31
$28
$21
.28%
.22%
.00%
.20%
.40%
.60%
$0
$20
$40
$60
4Q12
1Q13
2Q13
3Q13
4Q13
1Q14
2Q14
3Q14
1.01%
.71%
0.40%
0.80%
1.20%
1.60%
$0
$200
$400
$600
$800
4Q12
1Q13
2Q13
3Q13
4Q13
1Q14
2Q14
3Q14
$868
$804
160%
201%
110%
135%
160%
185%
210%
$600
$700
$800
$900
$1,000
4Q12
1Q13
2Q13
3Q13
4Q13
1Q14
2Q14
3Q14 |
 28
Asset Quality Trends
Quarterly Change in Criticized Outstandings
(a)
Delinquencies to Period-end Total Loans
(a)
Loan and lease outstandings
(b)
From continuing operations
30 –
89 days delinquent
90+ days delinquent
Metric
(b)
3Q14
2Q14
1Q14
4Q13
3Q13
Delinquencies to EOP total loans: 30-89 days
.61
%
.49
%
.48
%
.58
%
.54
%
Delinquencies to EOP total loans: 90+ days
.13
.15
.16
.13
.17
NPLs to EOP portfolio loans
.71
.71
.81
.93
1.01
NPAs to EOP portfolio loans + OREO + Other NPAs
.74
.74
.85
.97
1.08
Allowance for loan losses to period-end loans
1.43
1.46
1.50
1.56
1.62
Allowance for loan losses to NPLs
200.5
205.6
185.7
166.9
160.4
Continuing operations
Continuing operations
.54%
.61%
.17%
.13%
.00%
.25%
.50%
.75%
1.00%
4Q12
1Q13
2Q13
3Q13
4Q13
1Q14
2Q14
3Q14
(7)%
(2)%
(12)%
(10)%
(8)%
(6)%
(4)%
(2)%
0%
4Q12
1Q13
2Q13
3Q13
4Q13
1Q14
2Q14
3Q14 |
 Period-
end loans
Average
loans
Net loan
charge-offs
Net loan
charge-offs
(b)
/
average loans
(%)
Nonperforming
loans
(c)
Ending
allowance
Allowance /
period-end
loans
(%)
Allowance /
NPLs
(%)
9/30/14
3Q14
3Q14
3Q14
9/30/14
9/30/14
9/30/14
9/30/14
Commercial,
financial
and
agricultural
(a)
$ 26,683
$ 26,456
$
6
.09
$
47
$
386
1.45
821.28
Commercial real estate:
Commercial Mortgage
8,276
8,142
(2)
(.10)
41
159
1.92
387.80
Construction
1,036
1,030
1
.39
14
28
2.70
200.00
Commercial lease financing
4,135
4,145
(1)
(.10)
14
55
1.33
392.86
Real
estate
–
residential
mortgage
2,213
2,204
2
.36
81
22
.99
27.16
Home equity
10,663
10,658
7
.26
184
77
.72
41.85
Credit cards
724
716
9
4.99
1
32
4.42
N/M
Consumer
other
–
Key
Community
Bank
1,546
1,534
6
1.55
2
24
1.55
N/M
Consumer
other
–
Exit
Portfolio
879
911
3
1.31
17
21
2.39
123.53
Continuing
total
(d)
$ 56,155
$ 55,796
$
31
.22
$
401
$
804
1.43
200.50
Discontinued operations
2,375
4,080
7
1.15
9
31
1.31
344.44
Consolidated total
$ 58,530
$ 59,876
$
38
.26
$
410
$
835
1.43
203.66
Credit Quality by Portfolio
Credit Quality
$ in millions
29
N/M = Not meaningful
(a)
9-30-14 ending loan balances include $90 million of commercial credit card balances;
9-30-14 average loan balances include $92 million of assets from commercial credit
cards (b)
Net loan charge-off amounts are annualized in calculation (c)
9-30-14 NPL amount excludes $14 million of purchased credit impaired loans (d)
9-30-14 ending loan balances include purchased loans of $143 million, of which $14 million
were purchased credit impaired |
 Vintage (% of Loans)
Loan
Balances
Average
Loan Size ($)
Average
FICO
Average
LTV
(a)
% of
Loans
LTV>90%
2012 and
later
2011
2010
2009
2008 and
prior
Loans and lines
First lien
$
6,180
$
65,817
772
67
%
.6
%
50
%
5%
3%
3%
39
%
Second lien
4,200
54,759
766
76
3.7
33
5
3
4
55
Community Bank
$ 10,380
60,443
770
70
1.8
43
5
3
4
45
Exit portfolio
283
17,253
729
80
31.6
1
-
-
-
99
Total home equity portfolio
$ 10,663
Nonaccrual loans and lines
First lien
$
94 $
61,645
720
73
%
1.0%
5
%
4%
3%
5%
83
%
Second lien
81
48,222
711
80
2.1
2
2
2
4
90
Community Bank
$
175 54,590
716
77
1.5
4
3
2
5
86
Exit portfolio
10
23,844
700
77
29.2
-
-
-
-
100
Total home equity nonaccruals
$
185 Third quarter net charge-offs (NCOs)
Community Bank
$
6 3
%
2%
4%
2%
89
%
% of average loans
.23
%
Exit Portfolio
$
1 -
-
-
-
100
% of average loans
1.37
%
(a) Average LTVs are at origination. Current average LTVs for Community Bank total
home equity loans and lines is approximately 71%, which compares to 71% at
the end of the second quarter of 2014. Home Equity Portfolio –
9/30/14
$ in millions, except average loan size
Home Equity Portfolio
Highlights
•
High quality portfolio
•
Community bank loans and lines: 97% of total portfolio; branch-
originated
–
60% first lien position
–
Average FICO score of 770
–
Average LTV at origination: 70%
•
$4.0 billion of the total portfolio are fixed rate loans that require
principal and interest payments; $6.7 billion are lines
•
$1.5 billion in lines outstanding (14% of the total portfolio)
come to end of draw period in the next four years
–
Proactive communication and client outreach initiated
near end of draw period
30 |
 Balance Outstanding
Change
Net Loan Charge-offs
Balance on
Nonperforming Status
9-30-14
6-30-14
9-30-14
vs.
6-30-14
3Q14
(c)
2Q14
(c)
9-30-14
6-30-14
Residential
properties
–
homebuilder
$ 11
$ 19
$ (8)
$ 1
-
$
10 Marine and RV
floor plan 7
23
(16)
-
-
5
6
Commercial lease financing
(a)
1,046
1,154
(108)
(1)
$ (5)
1
3
Total commercial loans
1,064
1,196
(132)
-
(5)
16
16
Home
equity
–
Other
283
300
(17)
1
1
10
11
Marine
828
888
(60)
2
5
16
15
RV and other consumer
57
61
(4)
1
(1)
1
1
Total consumer loans
1,168
1,249
(81)
4
$ 5
27
27
Total exit loans in loan portfolio
$ 2,232
$ 2,445
$ (213)
$ 4
-
$ 43
$ 43
Discontinued
operations
–
education
lending
business (not included in exit loans above)
(b)
$ 2,375
$ 4,162
$ (1,787)
$ 7
$ 7
$ 9
$ 19
$ in millions; average balances
(a)
Includes (1) the business aviation, commercial vehicle, office products,
construction and industrial leases; (2) Canadian lease financing portfolios; (3) European
lease financing portfolios; and (4) all remaining balances related to lease in,
lease out; sale in, lease out; service contract leases; and qualified technological
equipment leases.
(b)
June 30, 2014 balance includes loans in Key’s consolidated education loan
securitization trusts (c)
Credit amounts indicate recoveries exceeded charge-offs
$ in millions
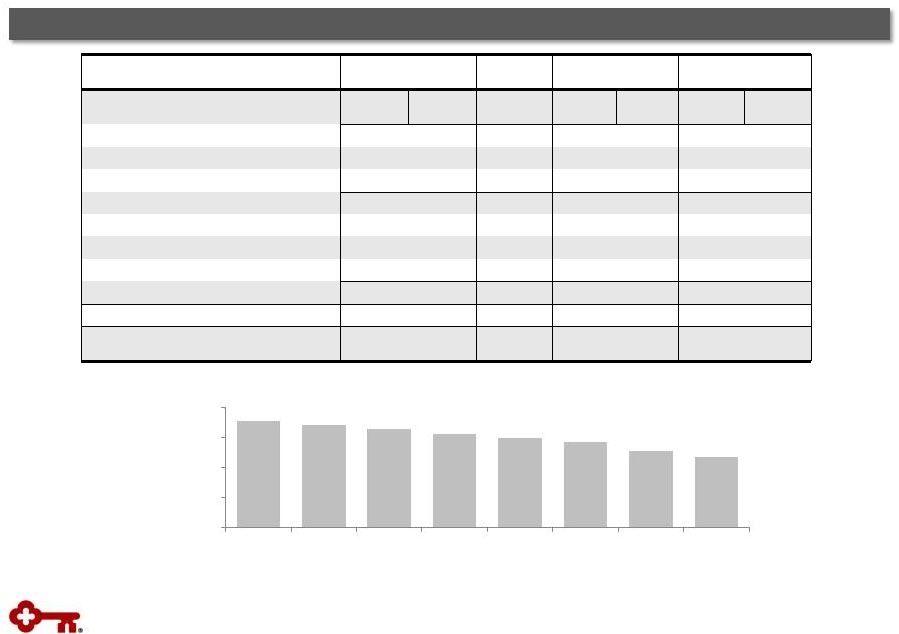
Exit Loan Portfolio
Exit Loan Portfolio
31
$3,120
$2,347
$0
$1,000
$2,000
$3,000
$4,000
4Q12
1Q13
2Q13
3Q13
4Q13
1Q14
2Q14
3Q14
$ 7
|
 GAAP
to Non-GAAP Reconciliation $ in millions
32
a)
Three months ended September 30, 2014, June 30, 2014, March 31, 2014, December 31,
2013, and September 30, 2013 exclude $72 million, $79 million, $84 million,
$92 million, and $99 million of period-end purchased credit card receivable intangible assets, respectively
b)
Net of capital surplus
c)
Includes net unrealized gains or losses on securities available for sale (except
for net unrealized losses on marketable equity securities), net gains or losses on cash
flow hedges, and amounts resulting from the application of the applicable
accounting guidance for defined benefit and other postretirement plans
d)
Other assets deducted from Tier 1 capital and net risk-weighted assets consist
of disallowed intangible assets (excluding goodwill) and deductible portions of
nonfinancial equity investments. There were no disallowed deferred tax
assets at September 30, 2014, June 30, 2014, March 31, 2014, December 31, 2013, and
September 30, 2013
Three months ended
9-30-14
6-30-14
3-31-14
12-31-13
9-30-13
Tangible common equity to tangible assets at period end
Key shareholders’
equity (GAAP)
$
10,486
$
10,504
$
10,403
$
10,303
$
10,206
Less:
Intangible assets
(a)
1,105
1,008
1,012
1,014
1,017
Preferred Stock, Series A
(b)
282
282
282
282
282
Tangible common equity (non
-GAAP)
$
9,099
$
9,214
$
9,109
$
9,007
$
8,907
Total assets (GAAP)
$
89,784
$
91,798
$
90,802
$
92,934
$
90,708
Less:
Intangible assets
(a)
1,105
1,008
1,012
1,014
1,017
Tangible assets (non-GAAP)
$
88,679
$
90,790
$
89,790
$
91,920
$
89,691
Tangible common equity to tangible assets ratio (non-GAAP)
10.26
%
10.15
%
10.14
%
9.80
%
9.93
%
Tier 1 common equity at period end
Key shareholders’
equity (GAAP)
$
10,486
$
10,504
$
10,403
$
10,303
$
10,206
Qualifying capital securities
340
339
339
339
340
Less:
Goodwill
1,051
979
979
979
979
Accumulated other comprehensive income (loss)
(c)
(366)
(328)
(367)
(394)
(409)
Other assets
(d)
110
86
84
89
96
Total Tier 1 capital (regulatory)
10,031
10,106
10,046
9,968
9,880
Less:
Qualifying capital securities
340
339
339
339
340
Preferred Stock, Series A
(b)
282
282
282
282
282
Total Tier 1 common equity (non-GAAP)
$
9,409
$
9,485
$
9,425
$
9,347
$
9,258
Net risk
-weighted assets (regulatory)
$
83,547
$
84,287
$
83,637
$
83,328
$
82,913
11.26
%
11.25
%
11.27
%
11.22
%
11.17
%
Pre-provision net revenue
Net interest income (GAAP)
$
575
$
573
$
563
$
583
$
578
Plus:
Taxable-equivalent adjustment
6
6
6
6
6
Noninterest income (GAAP)
417
455
435
453
459
Less:
Noninterest expense (GAAP)
704
689
662
712
716
Pre-provision net revenue from continuing operations (non-GAAP)
$
294
$
345
$
342
$
330
$
327
Tier 1 common equity ratio (non-GAAP) |
 Three months ended
9-30-14
6-30-14
3-31-14
12-31-13
9-30-13
Average tangible common equity
Average Key shareholders’
equity (GAAP)
$
10,473
$
10,459
$
10,371
$
10,272
$
10,237
Less:
Intangible
assets
(average)
(a)
1,037
1,010
1,013
1,016
1,019
Preferred Stock, Series A (average)
291
291
291
291
291
Average tangible common equity (non-GAAP)
$
9,145
$
9,158
$
9,067
$
8,965
$
8,927
Return on average tangible common equity from continuing operations
Net
income
(loss)
from
continuing
operations
attributable
to
Key
common
shareholders (GAAP)
$
197
$
242
$
232
$
229
$
229
Average tangible common equity (non-GAAP)
9,145
9,158
9,067
8,965
8,927
Return on average tangible common equity from continuing operations
(non-GAAP) 8.55
%
10.60
%
10.38
%
10.13
%
10.18
%
Return on average tangible common equity consolidated
Net income (loss) attributable to Key common shareholders (GAAP)
$
180
$
214
$
236
$
224
$
266
Average tangible common equity (non-GAAP)
9,145
9,158
9,067
8,965
8,927
Return on average tangible common equity consolidated (non-GAAP)
7.81
%
9.37
%
10.56
%
9.91
%
11.82
%
Cash efficiency ratio
Noninterest expense (GAAP)
$
704
$
689
$
662
$
712
$
716
Less:
Intangible asset amortization (GAAP)
10
9
10
10
12
Adjusted noninterest expense (non-GAAP)
$
694
$
680
$
652
$
702
$
704
Net interest income (GAAP)
$
575
$
573
$
563
$
583
$
578
Plus:
Taxable-equivalent adjustment
6
6
6
6
6
Noninterest income (GAAP)
417
455
435
453
459
Total taxable-equivalent revenue (non-GAAP)
$
998
$
1,034
$
1,004
$
1,042
$
1,043
Cash efficiency ratio (non-GAAP)
69.5
%
65.8
%
64.9
%
67.4
%
67.5
%
GAAP to Non-GAAP Reconciliation
(continued)
$ in millions
33
(a)
Three months ended September 30, 2014, June 30, 2014, March 31, 2014, December 31, 2013, and
September 30, 2013 exclude $76 million, $82 million, $89 million, $96 million, and $103
million of average purchased credit card receivable intangible assets, respectively
|
 KeyCorp & Subsidiaries
$ in billions
Quarter ended
September 30, 2014
Tier 1 common equity under current regulatory rules
Adjustments from current regulatory rules to the Regulatory Capital Rules:
Deferred
tax
assets
and
PCCRs
(b)
Common
equity
Tier
1
anticipated
under
the
Regulatory
Capital
Rules
(c)
Total risk-weighted assets under current regulatory rules
Adjustments from current regulatory rules to the Regulatory Capital Rules:
Loan commitments <1 year
Past Due Loans
Mortgage
servicing
assets
(d)
Deferred
tax
assets
(d)
Other
Total risk-weighted assets anticipated under the Regulatory Capital
Rules Common Equity Tier 1 ratio under the Regulatory Capital Rules
%
34
Common Equity Tier 1 Under the Regulatory Capital
Rules (estimated)
(a)
Table may not foot due to rounding
(a)
Common equity Tier 1 capital is a non-generally accepted accounting principle (GAAP) financial
measure that is used by investors, analysts and bank regulatory agencies to assess the capital
position of financial services companies. Management reviews Common Equity Tier 1 along with other measures of capital as part of
its financial analyses
(b)
Includes the deferred tax asset subject to future taxable income for realization, primarily tax
credit carryforwards, as well as the deductible portion of purchased credit card receivables (c)
The anticipated amount of regulatory capital and risk-weighted assets is based upon the federal
banking agencies’ Regulatory Capital Rules (as fully phased-in on January 1, 2019);
Key is subject to the Regulatory Capital Rules under the “standardized approach”
(d)
Item is included in the 10%/15% exceptions bucket calculation and is risk-weighted at 250% $
$
$
$
9.4
(.1)
9.3
83.5
1.0
.1
.5
.2
86.5
10.8
1.2 |