Attached files
| file | filename |
|---|---|
| 8-K - 8-K - CF Industries Holdings, Inc. | a14-24099_18k.htm |
Exhibit 99.1
|
|
CF Industries Holdings, Inc. Investor Materials November, 2014 |
|
|
Forward Looking Statements All statements in this communication, other than those relating to historical facts, are “forward-looking statements.” These forward-looking statements are not guarantees of future performance and are subject to a number of assumptions, risks and uncertainties, many of which are beyond our control, which could cause actual results to differ materially from such statements. These statements include, but are not limited to, statements about future strategic plans; and statements about future financial and operating results. Important factors that could cause actual results to differ materially from our expectations include, among others: the volatility of natural gas prices in North America; the cyclical nature of our business and the agricultural sector; the global commodity nature of our fertilizer products, the impact of global supply and demand on our selling prices, and the intense global competition from other fertilizer producers; conditions in the U.S. agricultural industry; reliance on third party providers of transportation services and equipment; risks associated with cyber security; weather conditions; our ability to complete our production capacity expansion projects on schedule as planned and on budget or at all; risks associated with other expansions of our business, including unanticipated adverse consequences and the significant resources that could be required; potential liabilities and expenditures related to environmental and health and safety laws and regulations; future regulatory restrictions and requirements related to greenhouse gas emissions; the seasonality of the fertilizer business; the impact of changing market conditions on our forward sales programs; risks involving derivatives and the effectiveness of our risk measurement and hedging activities; the significant risks and hazards involved in producing and handling our products against which we may not be fully insured; our reliance on a limited number of key facilities; risks associated with joint ventures; acts of terrorism and regulations to combat terrorism; difficulties in securing the supply and delivery of raw materials, increases in their costs or delays or interruptions in their delivery; risks associated with international operations; losses on our investments in securities; deterioration of global market and economic conditions; our ability to manage our indebtedness; and loss of key members of management and professional staff. More detailed information about factors that may affect our performance may be found in our filings with the Securities and Exchange Commission, including our most recent periodic reports filed on Form 10-K and Form 10-Q, which are available in the Investor Relations section of the CF Industries website. Forward-looking statements are given only as of the date of this communication and we disclaim any obligation to update or revise the forward-looking statements, whether as a result of new information, future events or otherwise, except as required by law. 2 |
|
|
3 Dennis Kelleher SVP and Chief Financial Officer Tony Will President and Chief Executive Officer Bert Frost SVP – Sales and Market Development |
|
|
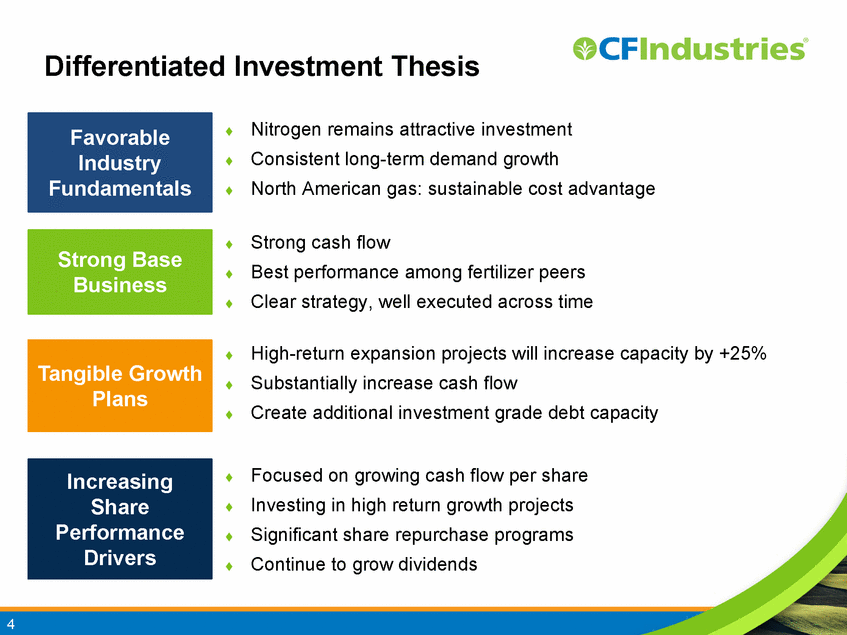
Differentiated Investment Thesis . Nitrogen remains attractive investment . Consistent long-term demand growth . North American gas: sustainable cost advantage . Focused on growing cash flow per share . Investing in high return growth projects . Significant share repurchase programs . Continue to grow dividends Favorable Industry Fundamentals Tangible Growth Plans Increasing Share Performance Drivers . High-return expansion projects will increase capacity by +25% . Substantially increase cash flow . Create additional investment grade debt capacity 4 Strong Base Business . Strong cash flow . Best performance among fertilizer peers . Clear strategy, well executed across time |
|
|
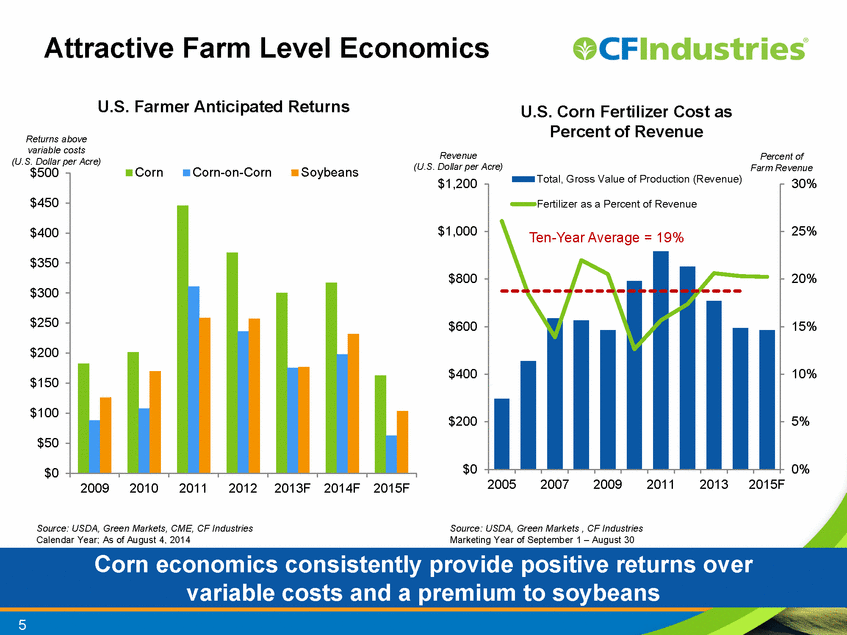
0% 5% 10% 15% 20% 25% 30% $0 $200 $400 $600 $800 $1,000 $1,200 2005 2007 2009 2011 2013 2015F Total, Gross Value of Production (Revenue) Fertilizer as a Percent of Revenue 5 Corn economics consistently provide positive returns over variable costs and a premium to soybeans Attractive Farm Level Economics U.S. Farmer Anticipated Returns Source: USDA, Green Markets, CME, CF Industries Calendar Year; As of August 4, 2014 Source: USDA, Green Markets , CF Industries Marketing Year of September 1 – August 30 Revenue (U.S. Dollar per Acre) Ten-Year Average = 19% U.S. Corn Fertilizer Cost as Percent of Revenue Percent of Farm Revenue $0 $50 $100 $150 $200 $250 $300 $350 $400 $450 $500 2009 2010 2011 2012 2013F 2014F 2015F Corn Corn-on-Corn Soybeans Returns above variable costs (U.S. Dollar per Acre) |
|
|
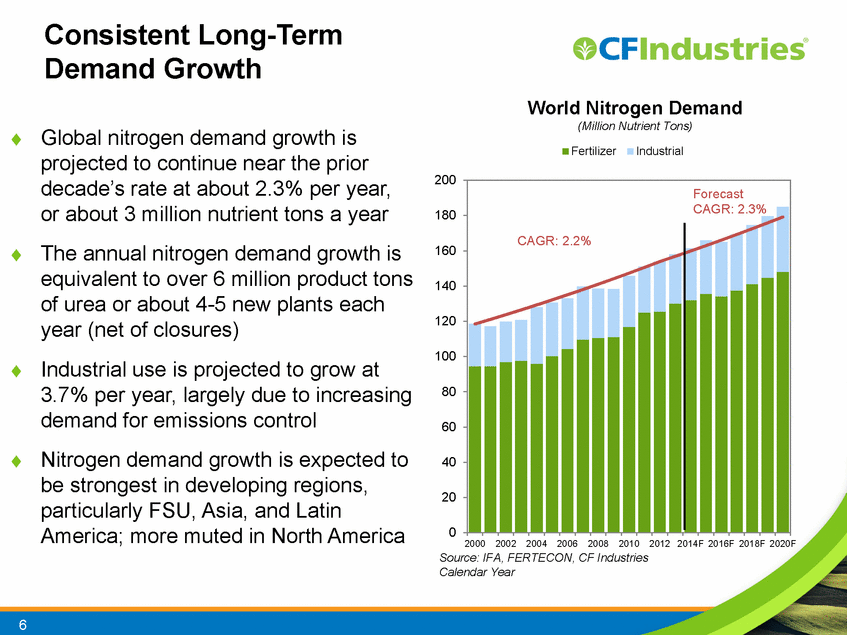
6 . Global nitrogen demand growth is projected to continue near the prior decade’s rate at about 2.3% per year, or about 3 million nutrient tons a year . The annual nitrogen demand growth is equivalent to over 6 million product tons of urea or about 4-5 new plants each year (net of closures) . Industrial use is projected to grow at 3.7% per year, largely due to increasing demand for emissions control . Nitrogen demand growth is expected to be strongest in developing regions, particularly FSU, Asia, and Latin America; more muted in North America Source: IFA, FERTECON, CF Industries Calendar Year 0 20 40 60 80 100 120 140 160 180 200 2000 2002 2004 2006 2008 2010 2012 2014F 2016F 2018F 2020F Fertilizer Industrial CAGR: 2.2% Forecast CAGR: 2.3% World Nitrogen Demand (Million Nutrient Tons) Consistent Long-Term Demand Growth |
|
|
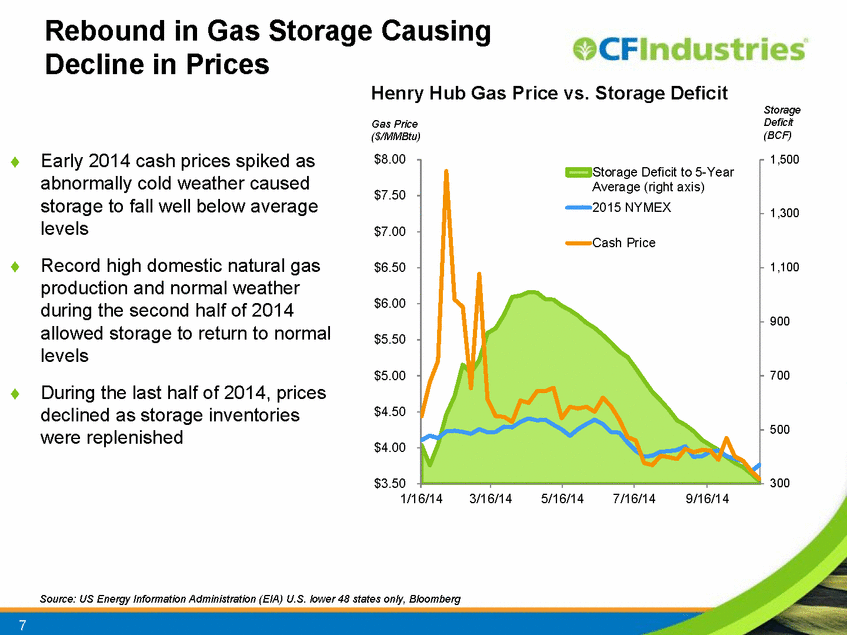
7 Rebound in Gas Storage Causing Decline in Prices Source: US Energy Information Administration (EIA) U.S. lower 48 states only, Bloomberg 300 500 700 900 1,100 1,300 1,500 $3.50 $4.00 $4.50 $5.00 $5.50 $6.00 $6.50 $7.00 $7.50 $8.00 1/16/14 3/16/14 5/16/14 7/16/14 9/16/14 Storage Deficit to 5-Year Average (right axis) 2015 NYMEX Cash Price Henry Hub Gas Price vs. Storage Deficit . Early 2014 cash prices spiked as abnormally cold weather caused storage to fall well below average levels . Record high domestic natural gas production and normal weather during the second half of 2014 allowed storage to return to normal levels . During the last half of 2014, prices declined as storage inventories were replenished Storage Deficit (BCF) Gas Price ($/MMBtu) |
|
|
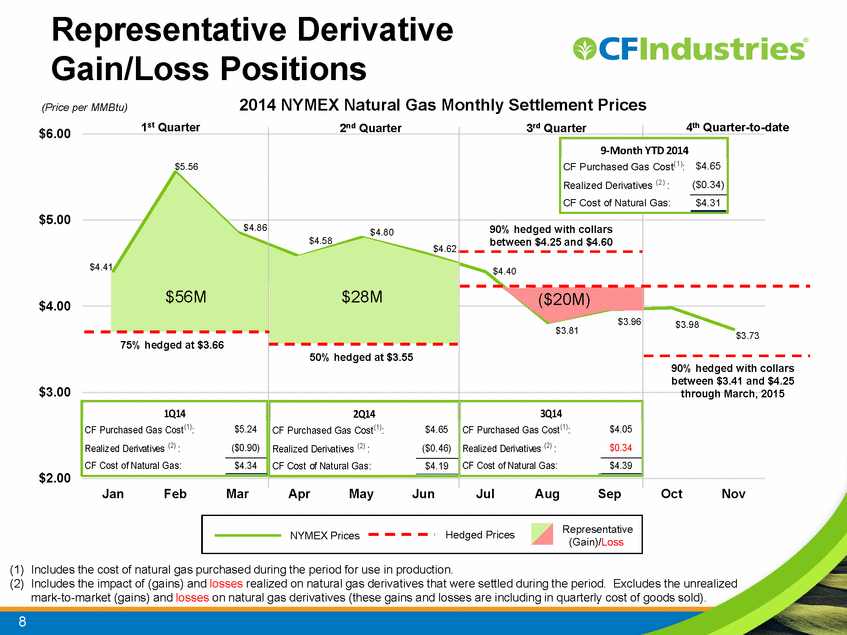
$2.00 $3.00 $4.00 $5.00 $6.00 Jan Feb Mar Apr May Jun Jul Aug Sep Oct Nov 2014 NYMEX Natural Gas Monthly Settlement Prices CF Purchased Gas Cost(1): $5.24 Realized Derivatives (2) : ($0.90) CF Cost of Natural Gas: $4.34 1Q14 CF Purchased Gas Cost(1): $4.65 Realized Derivatives (2) : ($0.46) CF Cost of Natural Gas: $4.19 2Q14 CF Purchased Gas Cost(1): $4.05 Realized Derivatives (2) : $0.34 CF Cost of Natural Gas: $4.39 3Q14 (Price per MMBtu) 1st Quarter 2nd Quarter 3rd Quarter $4.41 $5.56 $4.86 $4.58 $4.80 $4.62 $4.40 $3.81 $3.96 $3.98 75% hedged at $3.66 50% hedged at $3.55 90% hedged with collars between $4.25 and $4.60 4th Quarter-to-date $3.73 Representative Derivative Gain/Loss Positions 8 NYMEX Prices Hedged Prices Representative (Gain)/Loss (1) Includes the cost of natural gas purchased during the period for use in production. (2) Includes the impact of (gains) and losses realized on natural gas derivatives that were settled during the period. Excludes the unrealized mark-to-market (gains) and losses on natural gas derivatives (these gains and losses are including in quarterly cost of goods sold). $56M $28M ($20M) CF Purchased Gas Cost(1): $4.65 Realized Derivatives (2) : ($0.34) CF Cost of Natural Gas: $4.31 9-Month YTD 2014 90% hedged with collars between $3.41 and $4.25 through March, 2015 |
|
|
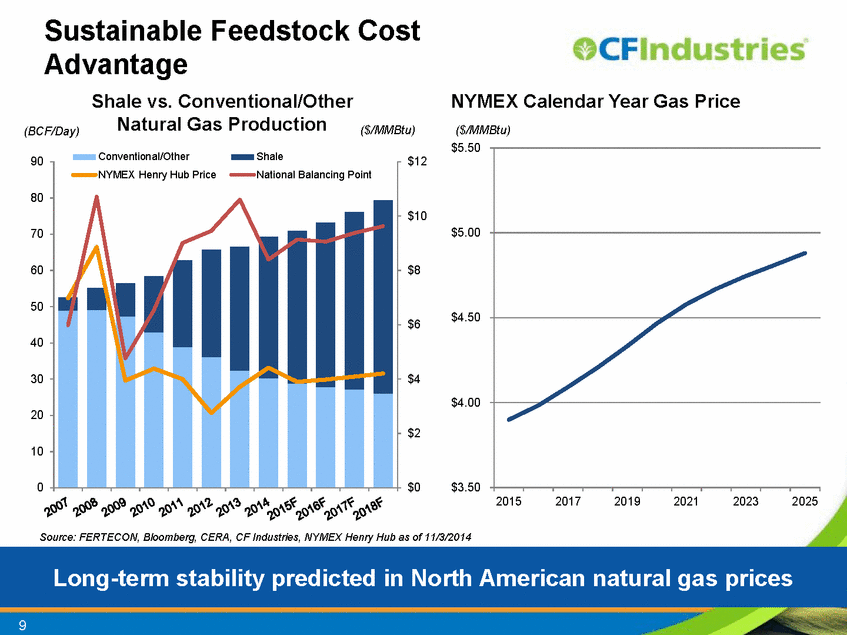
9 Sustainable Feedstock Cost Advantage Long-term stability predicted in North American natural gas prices Source: FERTECON, Bloomberg, CERA, CF Industries, NYMEX Henry Hub as of 11/3/2014 Shale vs. Conventional/Other Natural Gas Production ($/MMBtu) (BCF/Day) NYMEX Calendar Year Gas Price $3.50 $4.00 $4.50 $5.00 $5.50 2015 2017 2019 2021 2023 2025 $0 $2 $4 $6 $8 $10 $12 0 10 20 30 40 50 60 70 80 90 Conventional/Other Shale NYMEX Henry Hub Price National Balancing Point ($/MMBtu) |
|
|
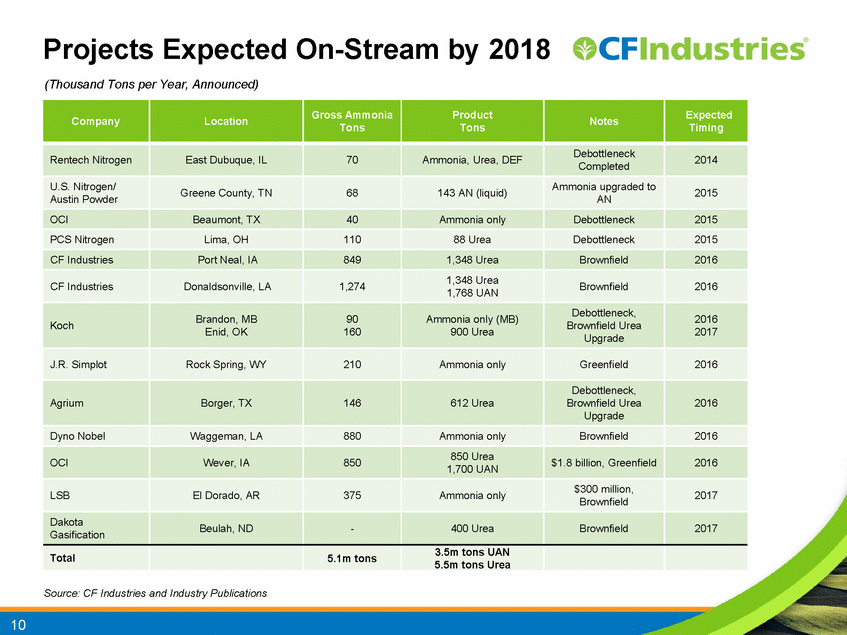
Projects Expected On-Stream by 2018 (Thousand Tons per Year, Announced) Company Location Gross Ammonia Tons Product Tons Notes Expected Timing Rentech Nitrogen East Dubuque, IL 70 Ammonia, Urea, DEF Debottleneck Completed 2014 U.S. Nitrogen/ Austin Powder Greene County, TN 68 143 AN (liquid) Ammonia upgraded to AN 2015 OCI Beaumont, TX 40 Ammonia only Debottleneck 2015 PCS Nitrogen Lima, OH 110 88 Urea Debottleneck 2015 CF Industries Port Neal, IA 849 1,348 Urea Brownfield 2016 CF Industries Donaldsonville, LA 1,274 1,348 Urea 1,768 UAN Brownfield 2016 Koch Brandon, MB Enid, OK 90 160 Ammonia only (MB) 900 Urea Debottleneck, Brownfield Urea Upgrade 2016 2017 J.R. Simplot Rock Spring, WY 210 Ammonia only Greenfield 2016 Agrium Borger, TX 146 612 Urea Debottleneck, Brownfield Urea Upgrade 2016 Dyno Nobel Waggeman, LA 880 Ammonia only Brownfield 2016 OCI Wever, IA 850 850 Urea 1,700 UAN $1.8 billion, Greenfield 2016 LSB El Dorado, AR 375 Ammonia only $300 million, Brownfield 2017 Dakota Gasification Beulah, ND - 400 Urea Brownfield 2017 Total 5.1m tons 3.5m tons UAN 5.5m tons Urea Source: CF Industries and Industry Publications 10 |
|
|
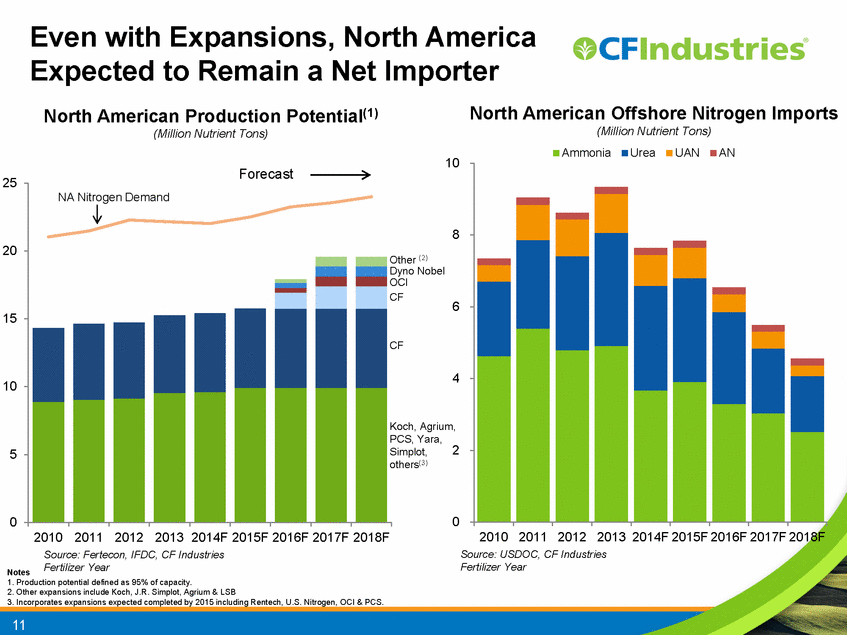
0 5 10 15 20 25 2010 2011 2012 2013 2014F 2015F 2016F 2017F 2018F 11 0 2 4 6 8 10 2010 2011 2012 2013 2014F 2015F 2016F 2017F 2018F Ammonia Urea UAN AN North American Offshore Nitrogen Imports (Million Nutrient Tons) Even with Expansions, North America Expected to Remain a Net Importer Source: USDOC, CF Industries Fertilizer Year NA Nitrogen Demand CF OCI Koch, Agrium, PCS, Yara, Simplot, others(3) CF Dyno Nobel Other (2) Forecast Source: Fertecon, IFDC, CF Industries Fertilizer Year North American Production Potential(1) (Million Nutrient Tons) Notes 1. Production potential defined as 95% of capacity. 2. Other expansions include Koch, J.R. Simplot, Agrium & LSB 3. Incorporates expansions expected completed by 2015 including Rentech, U.S. Nitrogen, OCI & PCS. |
|
|
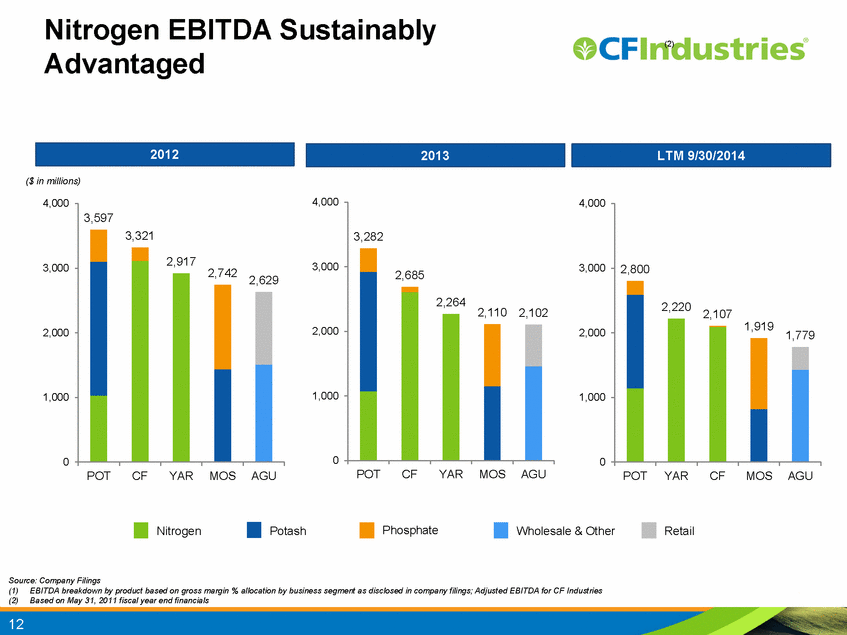
Nitrogen EBITDA Sustainably Advantaged Source: Company Filings (1) EBITDA breakdown by product based on gross margin % allocation by business segment as disclosed in company filings; Adjusted EBITDA for CF Industries (2) Based on May 31, 2011 fiscal year end financials 12 2,800 2,220 2,107 1,919 1,779 0 1,000 2,000 3,000 4,000 POT YAR CF MOS AGU 3,597 3,321 2,917 2,742 2,629 0 1,000 2,000 3,000 4,000 POT CF YAR MOS AGU 3,282 2,685 2,264 2,110 2,102 0 1,000 2,000 3,000 4,000 POT CF YAR MOS AGU (2) 2012 2013 LTM 9/30/2014 ($ in millions) Nitrogen Potash Phosphate Wholesale & Other Retail |
|
|
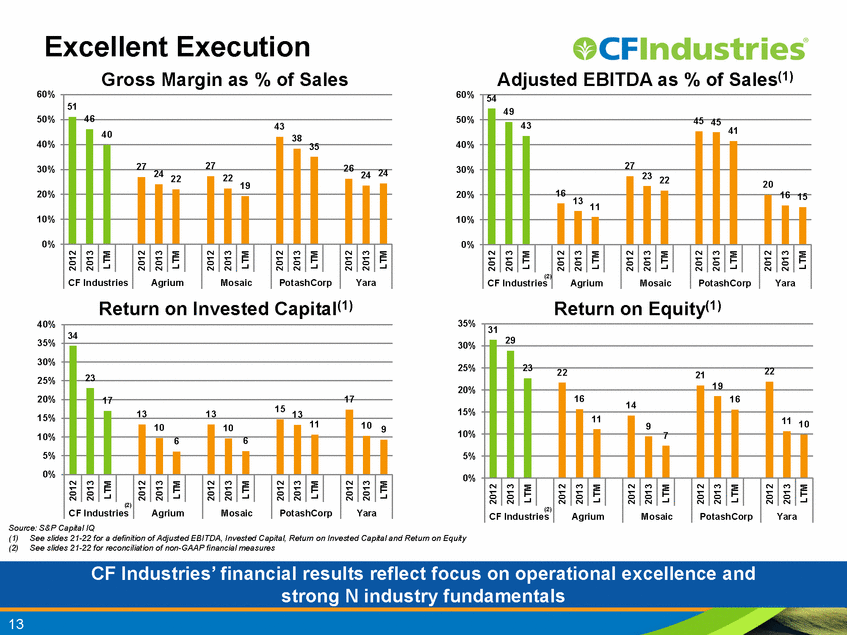
Excellent Execution Gross Margin as % of Sales Return on Equity(1) Return on Invested Capital(1) 51 46 40 27 24 22 27 22 19 43 38 35 26 24 24 0% 10% 20% 30% 40% 50% 60% 2012 2013 LTM 2012 2013 LTM 2012 2013 LTM 2012 2013 LTM 2012 2013 LTM CF Industries Agrium Mosaic PotashCorp Yara 54 49 43 16 13 11 27 23 22 45 45 41 20 16 15 0% 10% 20% 30% 40% 50% 60% 2012 2013 LTM 2012 2013 LTM 2012 2013 LTM 2012 2013 LTM 2012 2013 LTM CF Industries Agrium Mosaic PotashCorp Yara 34 23 17 13 10 6 13 10 6 15 13 11 17 10 9 0% 5% 10% 15% 20% 25% 30% 35% 40% 2012 2013 LTM 2012 2013 LTM 2012 2013 LTM 2012 2013 LTM 2012 2013 LTM CF Industries Agrium Mosaic PotashCorp Yara 31 29 23 22 16 11 14 9 7 21 19 16 22 11 10 0% 5% 10% 15% 20% 25% 30% 35% 2012 2013 LTM 2012 2013 LTM 2012 2013 LTM 2012 2013 LTM 2012 2013 LTM CF Industries Agrium Mosaic PotashCorp Yara Source: S&P Capital IQ (1) See slides 21-22 for a definition of Adjusted EBITDA, Invested Capital, Return on Invested Capital and Return on Equity (2) See slides 21-22 for reconciliation of non-GAAP financial measures CF Industries’ financial results reflect focus on operational excellence and strong N industry fundamentals Adjusted EBITDA as % of Sales(1) 13 (2) (2) (2) |
|
|
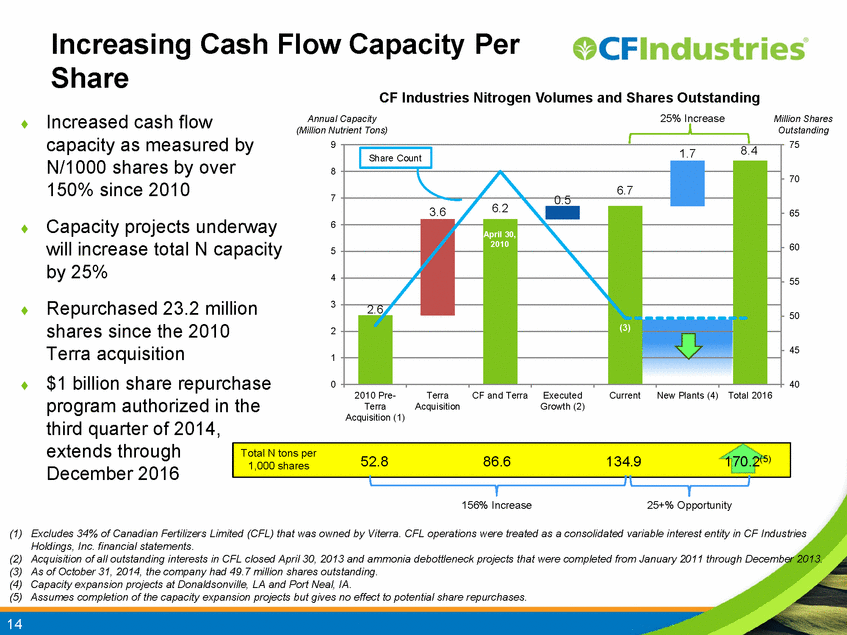
Increasing Cash Flow Capacity Per Share 14 2.6 3.6 6.2 0.5 6.7 1.7 8.4 40 45 50 55 60 65 70 75 0 1 2 3 4 5 6 7 8 9 2010 Pre- Terra Acquisition (1) Terra Acquisition CF and Terra Executed Growth (2) Current New Plants (4) Total 2016 CF Industries Nitrogen Volumes and Shares Outstanding Annual Capacity (Million Nutrient Tons) Million Shares Outstanding Share Count April 30, 2010 (3) Total N tons per 1,000 shares . Increased cash flow capacity as measured by N/1000 shares by over 150% since 2010 . Capacity projects underway will increase total N capacity by 25% . Repurchased 23.2 million shares since the 2010 Terra acquisition . $1 billion share repurchase program authorized in the third quarter of 2014, extends through December 2016 (1) Excludes 34% of Canadian Fertilizers Limited (CFL) that was owned by Viterra. CFL operations were treated as a consolidated variable interest entity in CF Industries Holdings, Inc. financial statements. (2) Acquisition of all outstanding interests in CFL closed April 30, 2013 and ammonia debottleneck projects that were completed from January 2011 through December 2013. (3) As of October 31, 2014, the company had 49.7 million shares outstanding. (4) Capacity expansion projects at Donaldsonville, LA and Port Neal, IA. (5) Assumes completion of the capacity expansion projects but gives no effect to potential share repurchases. 52.8 86.6 134.9 170.2(5) 25% Increase 25+% Opportunity 156% Increase |
|
|
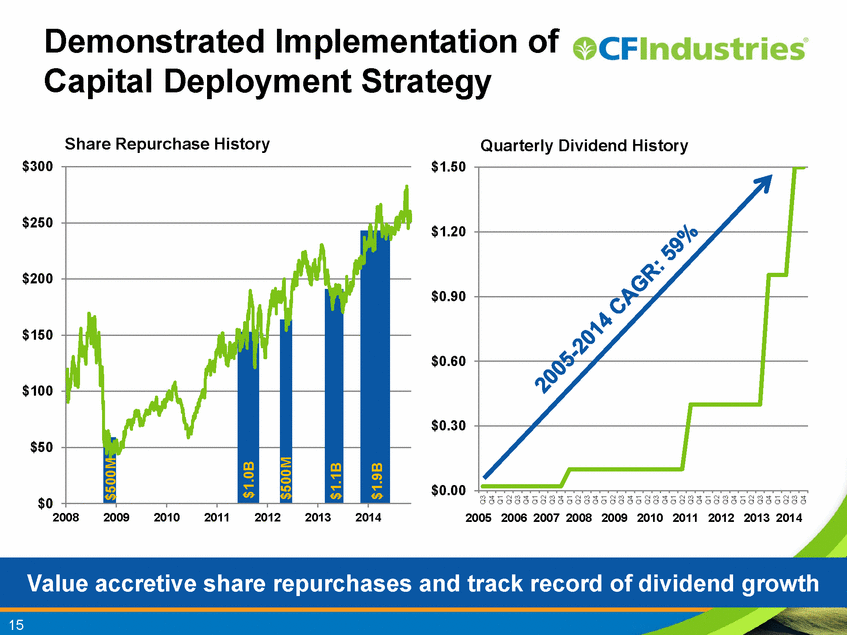
Rest of World North America 15 Value accretive share repurchases and track record of dividend growth $0.00 $0.30 $0.60 $0.90 $1.20 $1.50 Q3 Q4 Q1 Q2 Q3 Q4 Q1 Q2 Q3 Q4 Q1 Q2 Q3 Q4 Q1 Q2 Q3 Q4 Q1 Q2 Q3 Q4 Q1 Q2 Q3 Q4 Q1 Q2 Q3 Q4 Q1 Q2 Q3 Q4 Q1 Q2 Q3 Q4 Quarterly Dividend History 2005 2006 2007 2008 2009 2010 2011 2012 2013 2014 Demonstrated Implementation of Capital Deployment Strategy $0 $50 $100 $150 $200 $250 $300 2008 2009 2010 2011 2012 2013 2014 Share Repurchase History $500M $1.9B $1.1B $500M $1.0B |
|
|
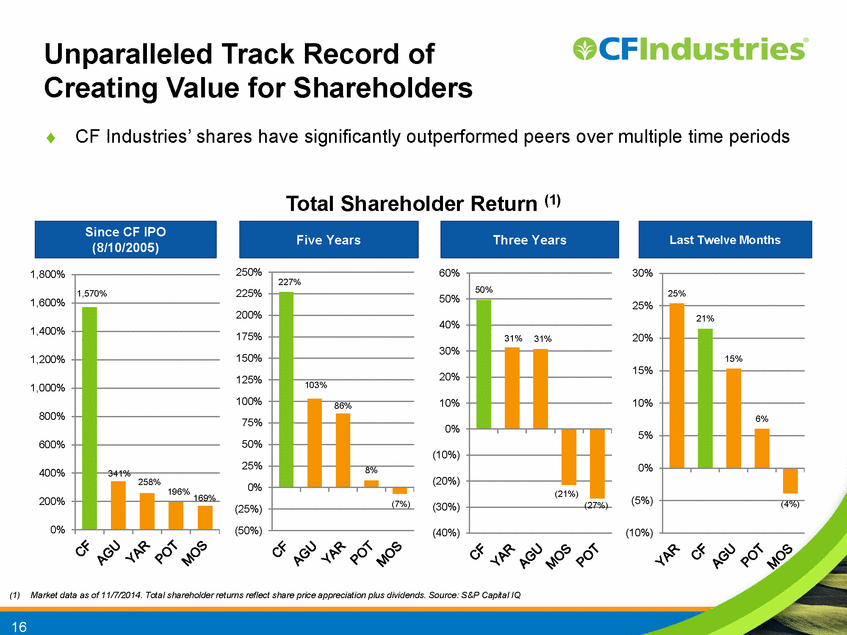
Unparalleled Track Record of Creating Value for Shareholders . CF Industries’ shares have significantly outperformed peers over multiple time periods 227% 103% 86% 8% (7%) (50%) (25%) 0% 25% 50% 75% 100% 125% 150% 175% 200% 225% 250% 50% 31% 31% (21%) (27%) (40%) (30%) (20%) (10%) 0% 10% 20% 30% 40% 50% 60% 25% 21% 15% 6% (4%) (10%) (5%) 0% 5% 10% 15% 20% 25% 30% (1) Market data as of 11/7/2014. Total shareholder returns reflect share price appreciation plus dividends. Source: S&P Capital IQ Five Years Last Twelve Months Total Shareholder Return (1) 1,570% 341% 258% 196% 169% 0% 200% 400% 600% 800% 1,000% 1,200% 1,400% 1,600% 1,800% Since CF IPO (8/10/2005) Three Years 16 |
|
|
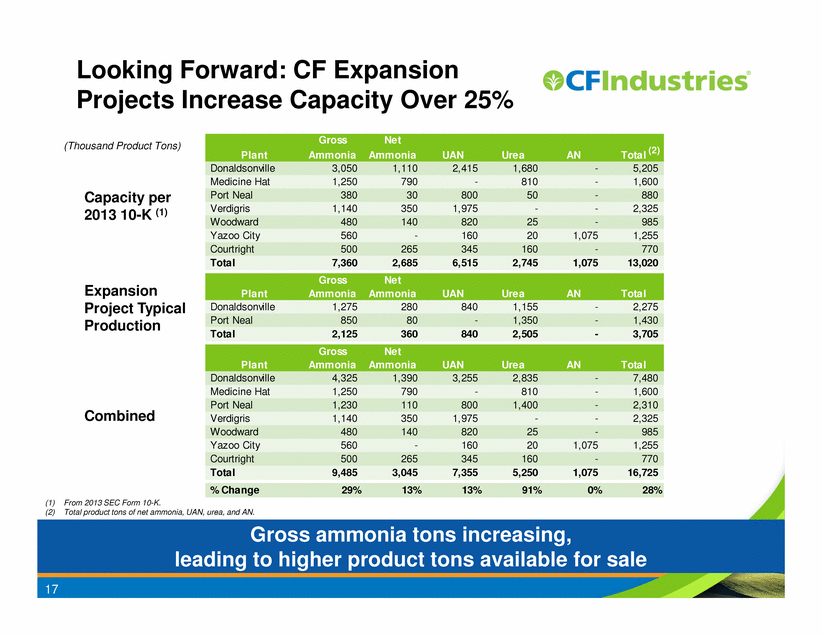
Capacity per 2013 10-K (1) (1) From 2013 SEC Form 10-K. (2) Total product tons of net ammonia, UAN, urea, and AN. 17 Looking Forward: CF Expansion Projects Increase Capacity Over 25% Gross ammonia tons increasing, leading to higher product tons available for sale Expansion Project Typical Production Combined (2) (Thousand Product Tons) Gross Net Plant Ammonia Ammonia UAN Urea AN Total Donaldsonville 3,050 1,110 2,415 1,680 - 5,205 Medicine Hat 1,250 790 - 810 - 1,600 Port Neal 380 30 800 50 - 880 Verdigris 1,140 350 1,975 - - 2,325 Woodward 480 140 820 25 - 985 Yazoo City 560 - 160 20 1,075 1,255 Courtright 500 265 345 160 - 770 Total 7,360 2,685 6,515 2,745 1,075 13,020 Gross Net Plant Ammonia Ammonia UAN Urea AN Total Donaldsonville 1,275 280 840 1,155 - 2,275 Port Neal 850 80 - 1,350 - 1,430 Total 2,125 360 840 2,505 - 3,705 Gross Net Plant Ammonia Ammonia UAN Urea AN Total Donaldsonville 4,325 1,390 3,255 2,835 - 7,480 Medicine Hat 1,250 790 - 810 - 1,600 Port Neal 1,230 110 800 1,400 - 2,310 Verdigris 1,140 350 1,975 - - 2,325 Woodward 480 140 820 25 - 985 Yazoo City 560 - 160 20 1,075 1,255 Courtright 500 265 345 160 - 770 Total 9,485 3,045 7,355 5,250 1,075 16,725 % Change 29% 13% 13% 91% 0% 28% (2) |
|
|
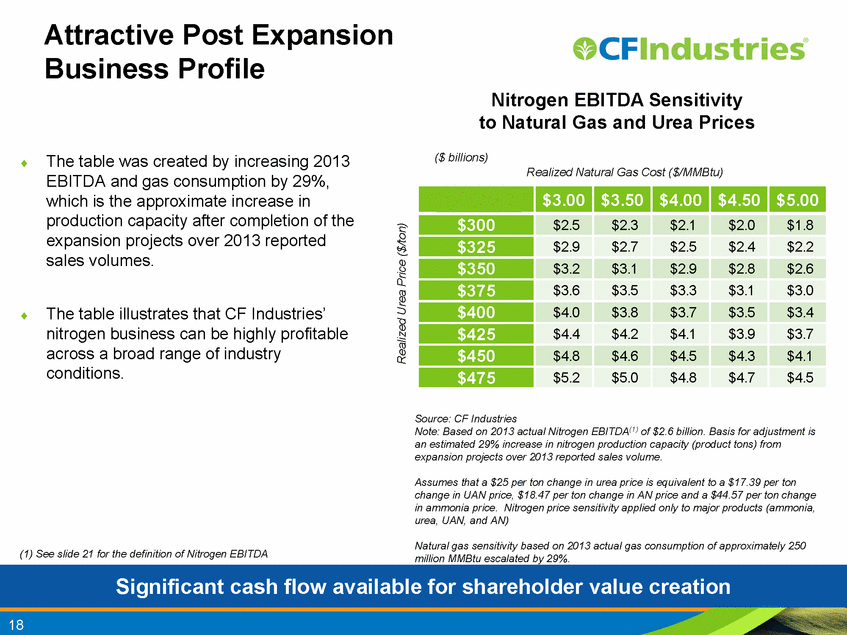
18 Attractive Post Expansion Business Profile Significant cash flow available for shareholder value creation Nitrogen EBITDA Sensitivity to Natural Gas and Urea Prices Source: CF Industries Note: Based on 2013 actual Nitrogen EBITDA(1) of $2.6 billion. Basis for adjustment is an estimated 29% increase in nitrogen production capacity (product tons) from expansion projects over 2013 reported sales volume. Assumes that a $25 per ton change in urea price is equivalent to a $17.39 per ton change in UAN price, $18.47 per ton change in AN price and a $44.57 per ton change in ammonia price. Nitrogen price sensitivity applied only to major products (ammonia, urea, UAN, and AN) Natural gas sensitivity based on 2013 actual gas consumption of approximately 250 million MMBtu escalated by 29%. Realized Natural Gas Cost ($/MMBtu) Realized Urea Price ($/ton) . The table was created by increasing 2013 EBITDA and gas consumption by 29%, which is the approximate increase in production capacity after completion of the expansion projects over 2013 reported sales volumes. . The table illustrates that CF Industries’ nitrogen business can be highly profitable across a broad range of industry conditions. ($ billions) (1) See slide 21 for the definition of Nitrogen EBITDA 3.0 $3.00 $3.50 $4.00 $4.50 $5.00 $300 $2.5 $2.3 $2.1 $2.0 $1.8 $325 $2.9 $2.7 $2.5 $2.4 $2.2 $350 $3.2 $3.1 $2.9 $2.8 $2.6 $375 $3.6 $3.5 $3.3 $3.1 $3.0 $400 $4.0 $3.8 $3.7 $3.5 $3.4 $425 $4.4 $4.2 $4.1 $3.9 $3.7 $450 $4.8 $4.6 $4.5 $4.3 $4.1 $475 $5.2 $5.0 $4.8 $4.7 $4.5 |
|
|
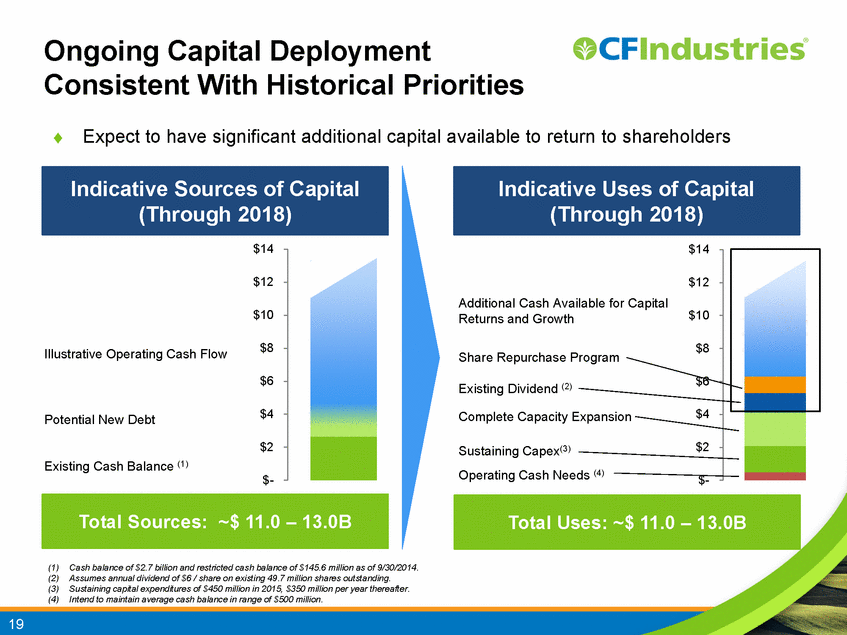
$- $2 $4 $6 $8 $10 $12 $14 $- $2 $4 $6 $8 $10 $12 $14 Additional Cash Available for Capital Returns and Growth Share Repurchase Program Existing Dividend (2) Complete Capacity Expansion Sustaining Capex(3) Operating Cash Needs (4) Ongoing Capital Deployment Consistent With Historical Priorities Total Sources: ~$ 11.0 – 13.0B (1) Cash balance of $2.7 billion and restricted cash balance of $145.6 million as of 9/30/2014. (2) Assumes annual dividend of $6 / share on existing 49.7 million shares outstanding. (3) Sustaining capital expenditures of $450 million in 2015, $350 million per year thereafter. (4) Intend to maintain average cash balance in range of $500 million. . Expect to have significant additional capital available to return to shareholders Total Uses: ~$ 11.0 – 13.0B Illustrative Operating Cash Flow Potential New Debt Existing Cash Balance (1) 19 Indicative Sources of Capital (Through 2018) Indicative Uses of Capital (Through 2018) |
|
|
For more information, please visit www.cfindustries.com |
|
|
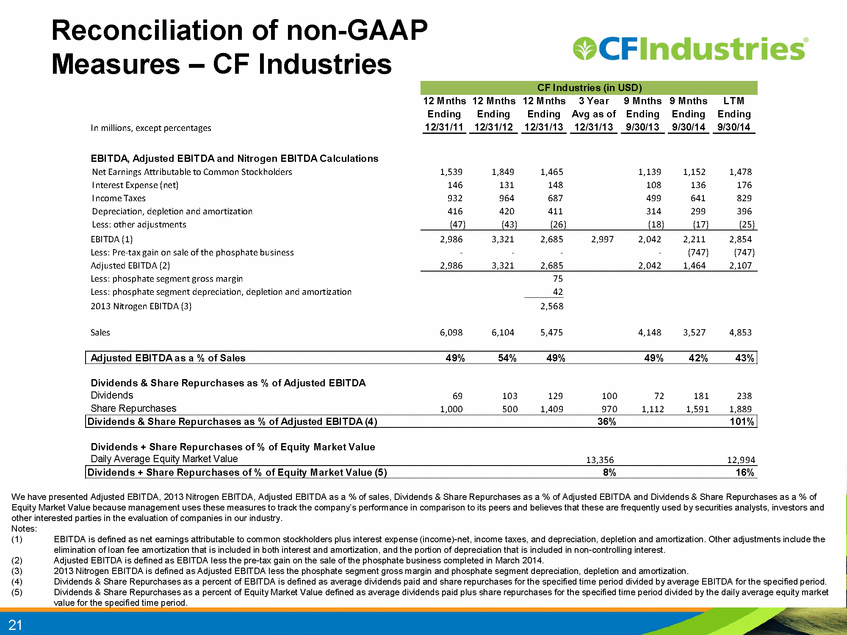
Reconciliation of non-GAAP Measures – CF Industries 21 We have presented Adjusted EBITDA, 2013 Nitrogen EBITDA, Adjusted EBITDA as a % of sales, Dividends & Share Repurchases as a % of Adjusted EBITDA and Dividends & Share Repurchases as a % of Equity Market Value because management uses these measures to track the company’s performance in comparison to its peers and believes that these are frequently used by securities analysts, investors and other interested parties in the evaluation of companies in our industry. Notes: (1) EBITDA is defined as net earnings attributable to common stockholders plus interest expense (income)-net, income taxes, and depreciation, depletion and amortization. Other adjustments include the elimination of loan fee amortization that is included in both interest and amortization, and the portion of depreciation that is included in non-controlling interest. (2) Adjusted EBITDA is defined as EBITDA less the pre-tax gain on the sale of the phosphate business completed in March 2014. (3) 2013 Nitrogen EBITDA is defined as Adjusted EBITDA less the phosphate segment gross margin and phosphate segment depreciation, depletion and amortization. (4) Dividends & Share Repurchases as a percent of EBITDA is defined as average dividends paid and share repurchases for the specified time period divided by average EBITDA for the specified period. (5) Dividends & Share Repurchases as a percent of Equity Market Value defined as average dividends paid plus share repurchases for the specified time period divided by the daily average equity market value for the specified time period. 12 Mnths 12 Mnths 12 Mnths 3 Year 9 Mnths 9 Mnths LTM Ending Ending Ending Avg as of Ending Ending Ending In millions, except percentages 12/31/11 12/31/12 12/31/13 12/31/13 9/30/13 9/30/14 9/30/14 EBITDA, Adjusted EBITDA and Nitrogen EBITDA Calculations Net Earnings Attributable to Common Stockholders 1,539 1,849 1,465 1,139 1,152 1,478 Interest Expense (net) 146 131 148 108 136 176 Income Taxes 932 964 687 499 641 829 Depreciation, depletion and amortization 416 420 411 314 299 396 Less: other adjustments (47) (43) (26) (18) (17) (25) EBITDA (1) 2,986 3,321 2,685 2,997 2,042 2,211 2,854 Less: Pre-tax gain on sale of the phosphate business - - - - (747) (747) Adjusted EBITDA (2) 2,986 3,321 2,685 2,042 1,464 2,107 Less: phosphate segment gross margin 75 Less: phosphate segment depreciation, depletion and amortization 42 2013 Nitrogen EBITDA (3) 2,568 Sales 6,098 6,104 5,475 4,148 3,527 4,853 Adjusted EBITDA as a % of Sales 49% 54% 49% 49% 42% 43% Dividends & Share Repurchases as % of Adjusted EBITDA Dividends 69 103 129 100 72 181 238 Share Repurchases 1,000 500 1,409 970 1,112 1,591 1,889 Dividends & Share Repurchases as % of Adjusted EBITDA (4) 36% 101% Dividends + Share Repurchases of % of Equity Market Value Daily Average Equity Market Value 13,356 12,994 Dividends + Share Repurchases of % of Equity Market Value (5) 8% 16% CF Industries (in USD) |
|
|
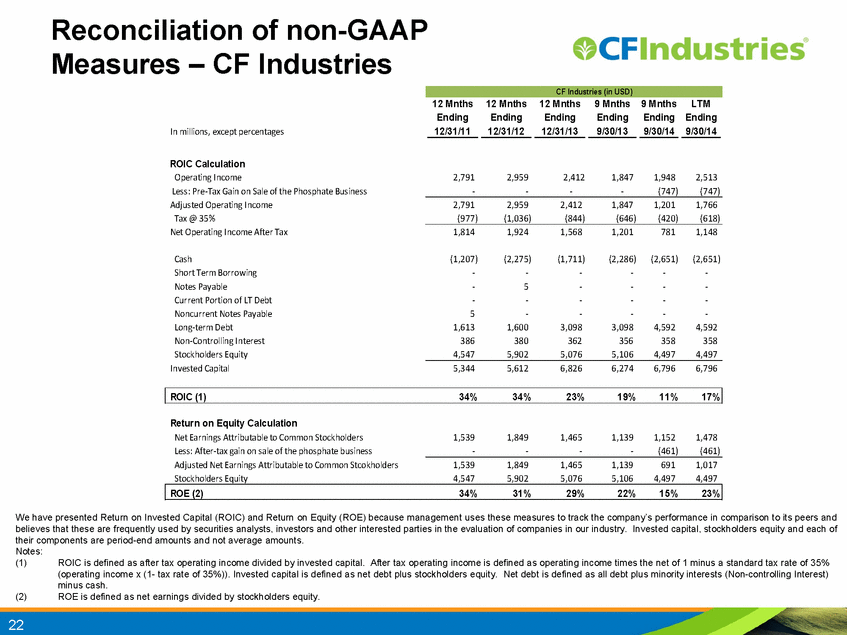
Reconciliation of non-GAAP Measures – CF Industries 22 We have presented Return on Invested Capital (ROIC) and Return on Equity (ROE) because management uses these measures to track the company’s performance in comparison to its peers and believes that these are frequently used by securities analysts, investors and other interested parties in the evaluation of companies in our industry. Invested capital, stockholders equity and each of their components are period-end amounts and not average amounts. Notes: (1) ROIC is defined as after tax operating income divided by invested capital. After tax operating income is defined as operating income times the net of 1 minus a standard tax rate of 35% (operating income x (1- tax rate of 35%)). Invested capital is defined as net debt plus stockholders equity. Net debt is defined as all debt plus minority interests (Non-controlling Interest) minus cash. (2) ROE is defined as net earnings divided by stockholders equity. 12 Mnths 12 Mnths 12 Mnths 9 Mnths 9 Mnths LTM Ending Ending Ending Ending Ending Ending In millions, except percentages 12/31/11 12/31/12 12/31/13 9/30/13 9/30/14 9/30/14 ROIC Calculation Operating Income 2,791 2,959 2,412 1,847 1,948 2,513 Less: Pre-Tax Gain on Sale of the Phosphate Business - - - - (747) (747) Adjusted Operating Income 2,791 2,959 2,412 1,847 1,201 1,766 Tax @ 35% (977) (1,036) (844) (646) (420) (618) Net Operating Income After Tax 1,814 1,924 1,568 1,201 781 1,148 Cash (1,207) (2,275) (1,711) (2,286) (2,651) (2,651) Short Term Borrowing - - - - - - Notes Payable - 5 - - - - Current Portion of LT Debt - - - - - - Noncurrent Notes Payable 5 - - - - - Long-term Debt 1,613 1,600 3,098 3,098 4,592 4,592 Non-Controlling Interest 386 380 362 356 358 358 Stockholders Equity 4,547 5,902 5,076 5,106 4,497 4,497 Invested Capital 5,344 5,612 6,826 6,274 6,796 6,796 ROIC (1) 34% 34% 23% 19% 11% 17% Return on Equity Calculation Net Earnings Attributable to Common Stockholders 1,539 1,849 1,465 1,139 1,152 1,478 Less: After-tax gain on sale of the phosphate business - - - - (461) (461) Adjusted Net Earnings Attributable to Common Stcokholders 1,539 1,849 1,465 1,139 691 1,017 Stockholders Equity 4,547 5,902 5,076 5,106 4,497 4,497 ROE (2) 34% 31% 29% 22% 15% 23% CF Industries (in USD) |
|
|
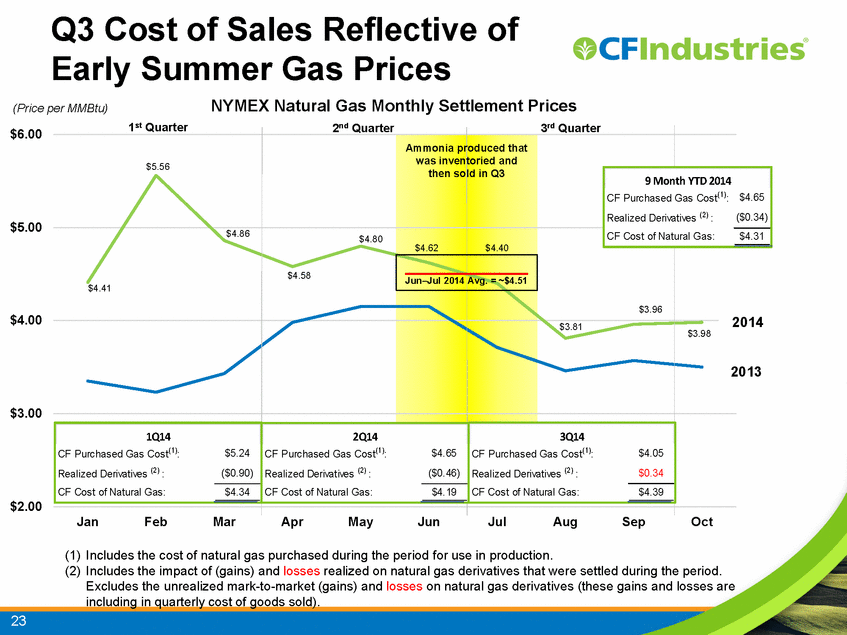
$2.00 $3.00 $4.00 $5.00 $6.00 Jan Feb Mar Apr May Jun Jul Aug Sep Oct NYMEX Natural Gas Monthly Settlement Prices Q3 Cost of Sales Reflective of Early Summer Gas Prices 23 _________________ Jun–Jul 2014 Avg. = ~$4.51 Ammonia produced that was inventoried and then sold in Q3 (1) Includes the cost of natural gas purchased during the period for use in production. (2) Includes the impact of (gains) and losses realized on natural gas derivatives that were settled during the period. Excludes the unrealized mark-to-market (gains) and losses on natural gas derivatives (these gains and losses are including in quarterly cost of goods sold). (Price per MMBtu) 1st Quarter 2nd Quarter 3rd Quarter CF Purchased Gas Cost(1): $5.24 Realized Derivatives (2) : ($0.90) CF Cost of Natural Gas: $4.34 1Q14 CF Purchased Gas Cost(1): $4.65 Realized Derivatives (2) : ($0.46) CF Cost of Natural Gas: $4.19 2Q14 CF Purchased Gas Cost(1): $4.05 Realized Derivatives (2) : $0.34 CF Cost of Natural Gas: $4.39 3Q14 2014 2013 $4.41 $5.56 $4.86 $4.58 $4.80 $4.62 $4.40 $3.81 $3.96 $3.98 CF Purchased Gas Cost(1): $4.65 Realized Derivatives (2) : ($0.34) CF Cost of Natural Gas: $4.31 9 Month YTD 2014 |
|
|
CF: Unmatched Asset Base 24 . 7 nitrogen production complexes with 6 million nutrient tons production capacity . Access to ammonia pipelines from US Gulf and Oklahoma provides lowest-cost option for transporting ammonia to distribution points . 82 distribution locations with over 1.3 million tons of ammonia and 1.2 million tons of UAN storage capacity . Access to 32 barges and over 5,000 railcars provide inland transportation flexibility 0 1,400 Source: AAPFCO, CF Industries, Statscan Nitrogen Demand and Asset Base Legend (Thousand Nutrient Tons) Production Distribution Pipeline |
|
|
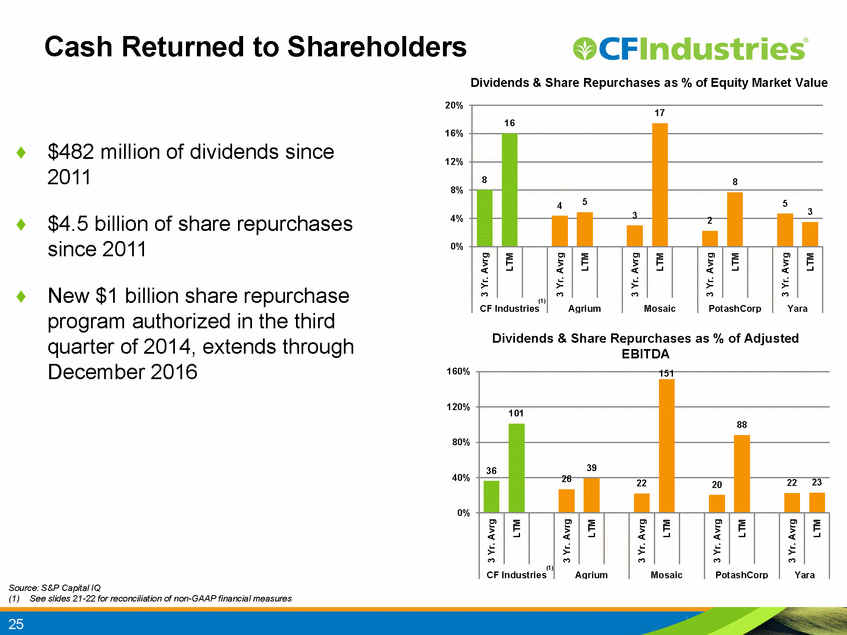
Cash Returned to Shareholders Dividends & Share Repurchases as % of Adjusted EBITDA Dividends & Share Repurchases as % of Equity Market Value . $482 million of dividends since 2011 . $4.5 billion of share repurchases since 2011 . New $1 billion share repurchase program authorized in the third quarter of 2014, extends through December 2016 8 16 4 5 3 17 2 8 5 3 0% 4% 8% 12% 16% 20% 3 Yr. Avrg LTM 3 Yr. Avrg LTM 3 Yr. Avrg LTM 3 Yr. Avrg LTM 3 Yr. Avrg LTM CF Industries Agrium Mosaic PotashCorp Yara 36 101 26 39 22 151 20 88 22 23 0% 40% 80% 120% 160% 3 Yr. Avrg LTM 3 Yr. Avrg LTM 3 Yr. Avrg LTM 3 Yr. Avrg LTM 3 Yr. Avrg LTM CF Industries Agrium Mosaic PotashCorp Yara Source: S&P Capital IQ (1) See slides 21-22 for reconciliation of non-GAAP financial measures 25 (1) (1) |
|
|
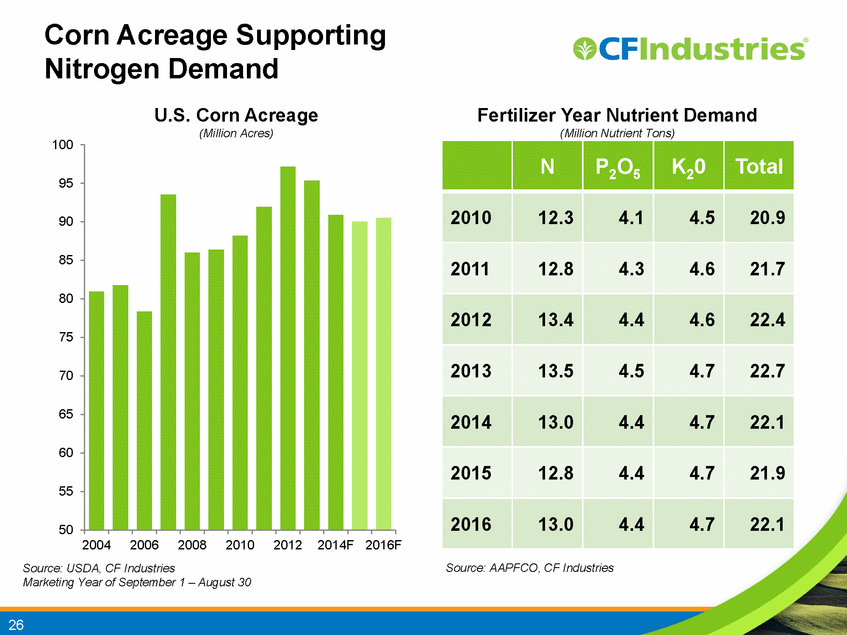
26 Source: AAPFCO, CF Industries Fertilizer Year Nutrient Demand (Million Nutrient Tons) Corn Acreage Supporting Nitrogen Demand N P2O5 K20 Total 2010 12.3 4.1 4.5 20.9 2011 12.8 4.3 4.6 21.7 2012 13.4 4.4 4.6 22.4 2013 13.5 4.5 4.7 22.7 2014 13.0 4.4 4.7 22.1 2015 12.8 4.4 4.7 21.9 2016 13.0 4.4 4.7 22.1 50 55 60 65 70 75 80 85 90 95 100 2004 2006 2008 2010 2012 2014F 2016F Source: USDA, CF Industries Marketing Year of September 1 – August 30 U.S. Corn Acreage (Million Acres) |
|
|
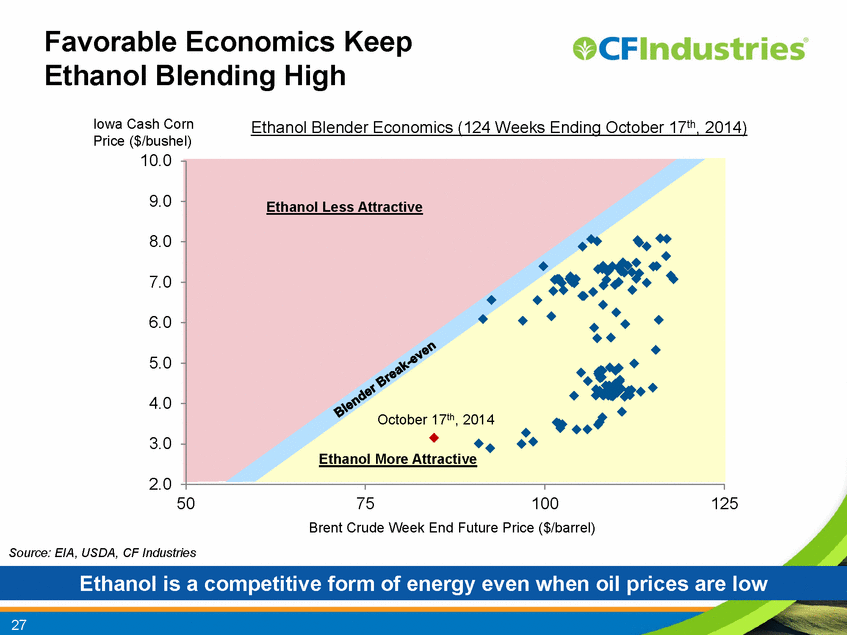
Favorable Economics Keep Ethanol Blending High 27 Ethanol is a competitive form of energy even when oil prices are low Brent Crude Week End Future Price ($/barrel) Source: EIA, USDA, CF Industries 2.0 3.0 4.0 5.0 6.0 7.0 8.0 9.0 10.0 50 75 100 125 Iowa Cash Corn Price ($/bushel) Ethanol Blender Economics (124 Weeks Ending October 17th, 2014) Ethanol More Attractive Ethanol Less Attractive October 17th, 2014 |
|
|
0 1,000 2,000 3,000 4,000 5,000 6,000 7,000 (000’s Product Tonnes) Reported Ammonia Outages Global Production Outages Higher Than Usual 0 1,000 2,000 3,000 4,000 5,000 6,000 7,000 (000’s Product Tonnes) Announced Urea Outages(1) (1) Excludes China Source: Fertecon, Industry Publications, CF Industries 28 |
|
|
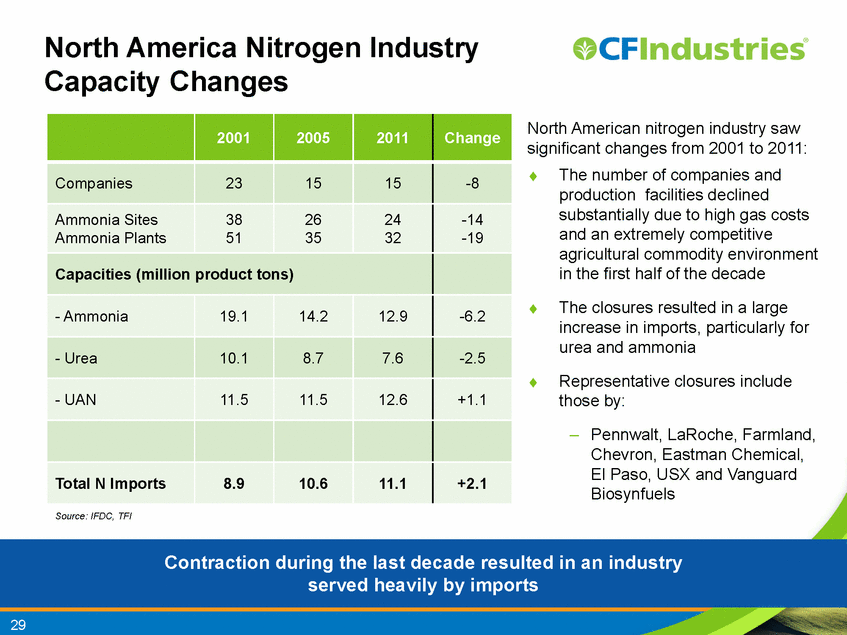
29 North America Nitrogen Industry Capacity Changes Source: IFDC, TFI North American nitrogen industry saw significant changes from 2001 to 2011: . The number of companies and production facilities declined substantially due to high gas costs and an extremely competitive agricultural commodity environment in the first half of the decade . The closures resulted in a large increase in imports, particularly for urea and ammonia . Representative closures include those by: – Pennwalt, LaRoche, Farmland, Chevron, Eastman Chemical, El Paso, USX and Vanguard Biosynfuels 2001 2005 2011 Change Companies 23 15 15 -8 Ammonia Sites Ammonia Plants 38 51 26 35 24 32 -14 -19 Capacities (million product tons) - Ammonia 19.1 14.2 12.9 -6.2 - Urea 10.1 8.7 7.6 -2.5 - UAN 11.5 11.5 12.6 +1.1 Total N Imports 8.9 10.6 11.1 +2.1 Contraction during the last decade resulted in an industry served heavily by imports |
|
|
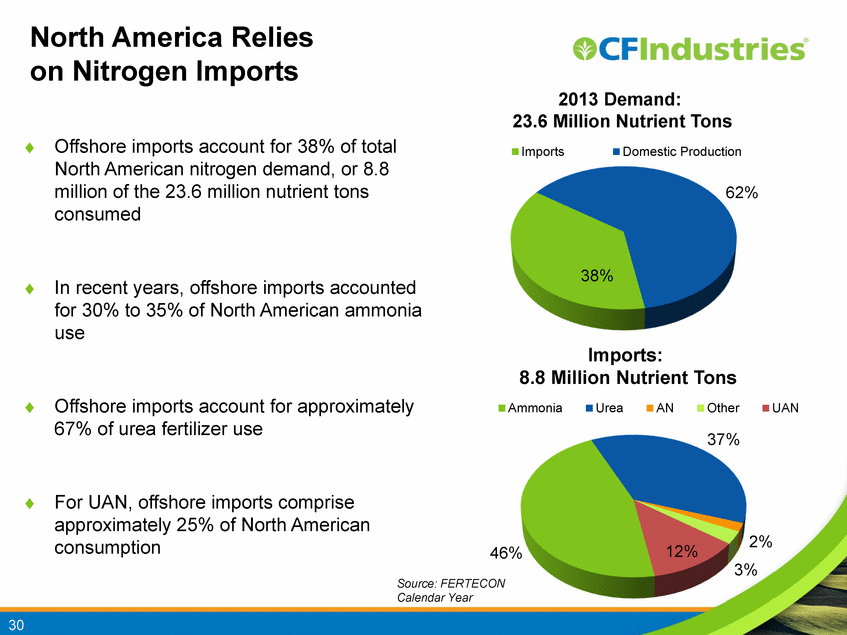
46% 37% 2% 3% 12% Ammonia Urea AN Other UAN 30 38% 62% Imports Domestic Production . Offshore imports account for 38% of total North American nitrogen demand, or 8.8 million of the 23.6 million nutrient tons consumed . In recent years, offshore imports accounted for 30% to 35% of North American ammonia use . Offshore imports account for approximately 67% of urea fertilizer use . For UAN, offshore imports comprise approximately 25% of North American consumption North America Relies on Nitrogen Imports Source: FERTECON Calendar Year 2013 Demand: 23.6 Million Nutrient Tons Imports: 8.8 Million Nutrient Tons |
|
|
. The global nitrogen cost curve is driven by differences in feedstock costs . The monthly shipment range is calculated using major markets that represent two-thirds of global demand . The cost curve suggests urea floor prices in the range of $280 to $350 per tonne, fob port. Recent pricing supports this range as seasonal price floors . Chinese (anthracite coal based) and Eastern European producers are the marginal exporters and their costs determine the price floor North American Production Costs Well Below Urea Floor Price 0 100 200 300 400 China - Natural Gas MENA N. America Trinidad China - Advanced Inland Low Russia China - Advanced Coastal South Asia China - Advanced Inland High Ukraine Western Europe China - Anthracite Low Eastern Europe China - Anthracite High Energy (Coal) Energy (N.G.) Other Cash Freight/Load Shipments: 14.4 MMT Avg 5 15 Appx. Monthly Range 10 Appx. Price Range Capacity represents full stated operating capacity discounted to 95% maximum effective capacity 16.8 Source: FERTECON, CRU, Integer, CF Industries Monthly Production Capacity (Million Tonnes) Urea Price US Dollars Per Tonne Global Monthly Urea FOB Port Cost Curve, 2014 31 |
|
|
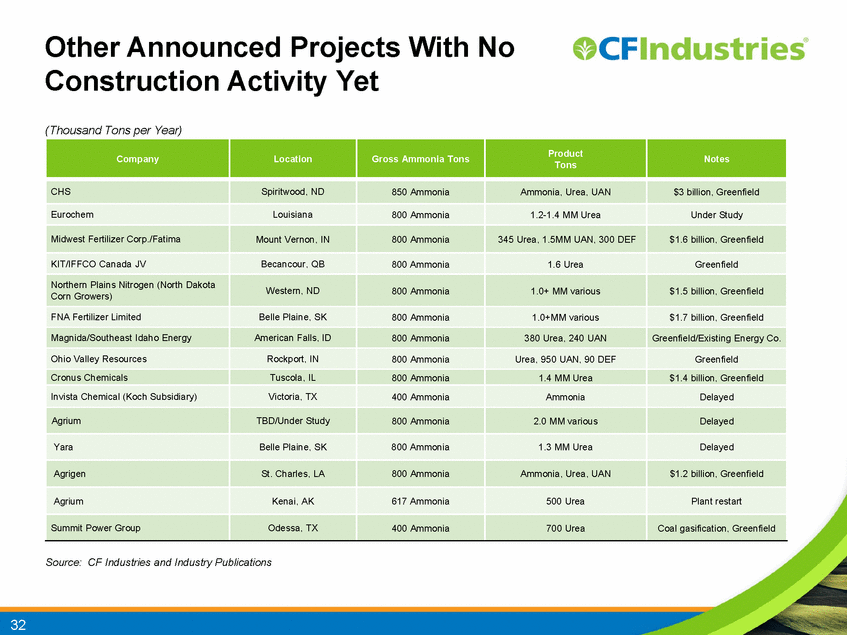
Other Announced Projects With No Construction Activity Yet Company Location Gross Ammonia Tons Product Tons Notes CHS Spiritwood, ND 850 Ammonia Ammonia, Urea, UAN $3 billion, Greenfield Eurochem Louisiana 800 Ammonia 1.2-1.4 MM Urea Under Study Midwest Fertilizer Corp./Fatima Mount Vernon, IN 800 Ammonia 345 Urea, 1.5MM UAN, 300 DEF $1.6 billion, Greenfield KIT/IFFCO Canada JV Becancour, QB 800 Ammonia 1.6 Urea Greenfield Northern Plains Nitrogen (North Dakota Corn Growers) Western, ND 800 Ammonia 1.0+ MM various $1.5 billion, Greenfield FNA Fertilizer Limited Belle Plaine, SK 800 Ammonia 1.0+MM various $1.7 billion, Greenfield Magnida/Southeast Idaho Energy American Falls, ID 800 Ammonia 380 Urea, 240 UAN Greenfield/Existing Energy Co. Ohio Valley Resources Rockport, IN 800 Ammonia Urea, 950 UAN, 90 DEF Greenfield Cronus Chemicals Tuscola, IL 800 Ammonia 1.4 MM Urea $1.4 billion, Greenfield Invista Chemical (Koch Subsidiary) Victoria, TX 400 Ammonia Ammonia Delayed Agrium TBD/Under Study 800 Ammonia 2.0 MM various Delayed Yara Belle Plaine, SK 800 Ammonia 1.3 MM Urea Delayed Agrigen St. Charles, LA 800 Ammonia Ammonia, Urea, UAN $1.2 billion, Greenfield Agrium Kenai, AK 617 Ammonia 500 Urea Plant restart Summit Power Group Odessa, TX 400 Ammonia 700 Urea Coal gasification, Greenfield Source: CF Industries and Industry Publications (Thousand Tons per Year) 32 |
|
|
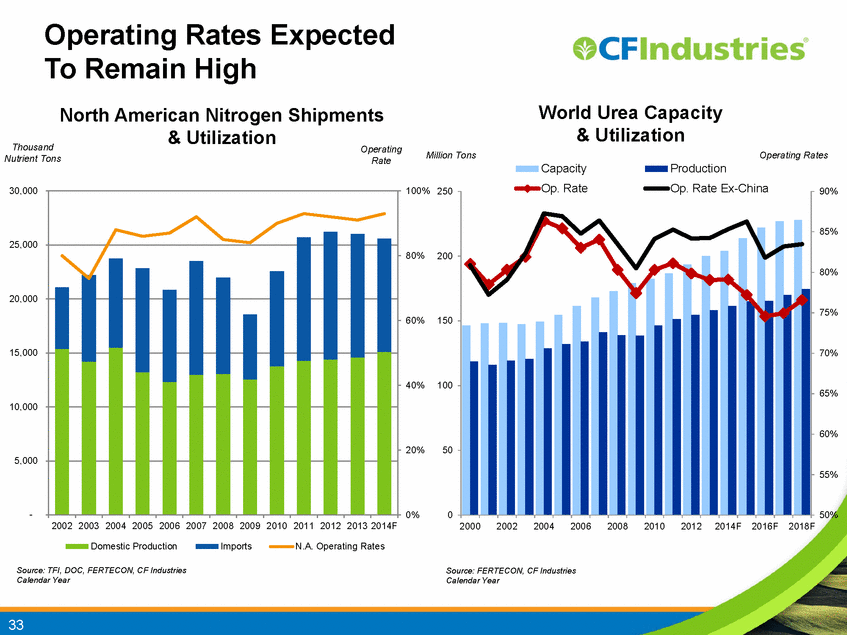
33 Source: FERTECON, CF Industries Calendar Year 50% 55% 60% 65% 70% 75% 80% 85% 90% 0 50 100 150 200 250 2000 2002 2004 2006 2008 2010 2012 2014F 2016F 2018F Capacity Production Op. Rate Op. Rate Ex-China World Urea Capacity & Utilization Operating Rates Expected To Remain High Million Tons Operating Rates North American Nitrogen Shipments & Utilization Source: TFI, DOC, FERTECON, CF Industries Calendar Year 0% 20% 40% 60% 80% 100% - 5,000 10,000 15,000 20,000 25,000 30,000 2002 2003 2004 2005 2006 2007 2008 2009 2010 2011 2012 2013 2014F Domestic Production Imports N.A. Operating Rates Thousand Nutrient Tons Operating Rate |
|
|
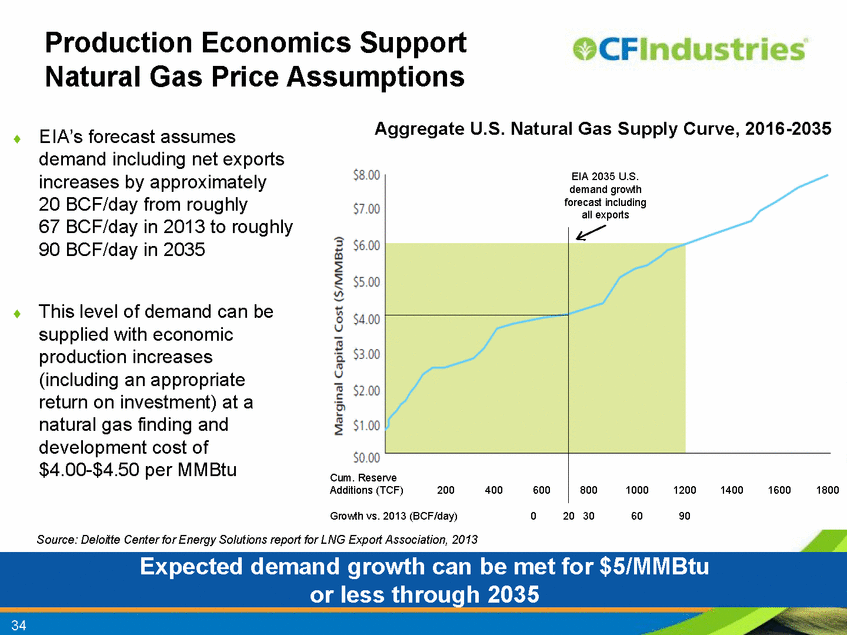
Koch 34 Production Economics Support Natural Gas Price Assumptions Expected demand growth can be met for $5/MMBtu or less through 2035 Source: Deloitte Center for Energy Solutions report for LNG Export Association, 2013 Aggregate U.S. Natural Gas Supply Curve, 2016-2035 . EIA’s forecast assumes demand including net exports increases by approximately 20 BCF/day from roughly 67 BCF/day in 2013 to roughly 90 BCF/day in 2035 . This level of demand can be supplied with economic production increases (including an appropriate return on investment) at a natural gas finding and development cost of $4.00-$4.50 per MMBtu Cum. Reserve Additions (TCF) 200 400 600 800 1000 1200 1400 1600 1800 Growth vs. 2013 (BCF/day) 0 20 30 60 90 EIA 2035 U.S. demand growth forecast including all exports |
|
|
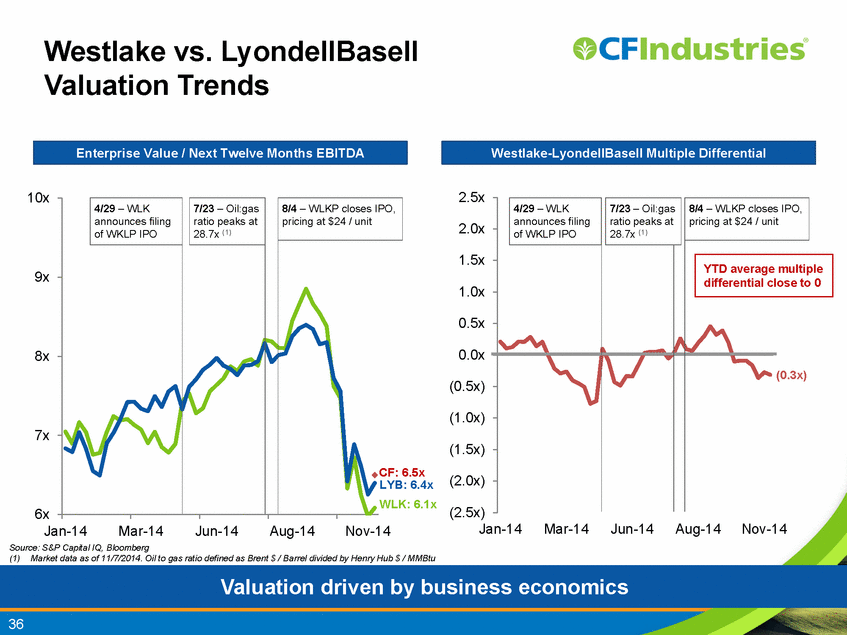
MLP Market Observations 35 . MLP financing has a higher cost of capital than investment grade debt . Alerian MLP Index (1) yields at 5.60% . BBB Index (1) yields at 3.52% . Annual distributions to Westlake Chemical Partners LP public holders of $14.2 million imply a 5.0% interest rate on proceeds, without consideration for distribution growth expectations baked into the offering price . MLP market has limited liquidity, with an average MLP IPO offering size of $405MM this year (1) . There have been no chemical or basic material-related MLP IPOs during 2014 other than Westlake Chemical Partners LP (net IPO proceeds of $286MM (2)) . No issuer, from any sector, has replicated the structure selected by Westlake for its recent transaction . Westlake’s C-Corp valuation multiple has continued to track its closest peer and does not exhibit any lasting beneficial impact from the MLP transaction . CF Industries has access to the highly liquid, low-cost investment grade debt market . Previously raised $3Bn of low-cost debt spread across attractive long-dated maturities (including 20- and 30-year debt) . CF intends to maintain its previously disclosed range of 2.0x – 2.5x leverage over the cycle . Any cash flow sold into an MLP would constrain debt capacity (1) Market data as of 11/7/2014. Source: Bloomberg, Alerian (2) ~$55M of which is set aside to establish a turnaround reserve. |
|
|
36 6x 7x 8x 9x 10x Jan-14 Mar-14 Jun-14 Aug-14 Nov-14 WLK: 6.1x LYB: 6.4x 8/4 – WLKP closes IPO, pricing at $24 / unit 4/29 – WLK announces filing of WKLP IPO 7/23 – Oil:gas ratio peaks at 28.7x (1) (2.5x) (2.0x) (1.5x) (1.0x) (0.5x) 0.0x 0.5x 1.0x 1.5x 2.0x 2.5x Jan-14 Mar-14 Jun-14 Aug-14 Nov-14 (0.3x) Source: S&P Capital IQ, Bloomberg (1) Market data as of 11/7/2014. Oil to gas ratio defined as Brent $ / Barrel divided by Henry Hub $ / MMBtu 8/4 – WLKP closes IPO, pricing at $24 / unit 4/29 – WLK announces filing of WKLP IPO 7/23 – Oil:gas ratio peaks at 28.7x (1) YTD average multiple differential close to 0 CF: 6.5x Westlake vs. LyondellBasell Valuation Trends Enterprise Value / Next Twelve Months EBITDA Westlake-LyondellBasell Multiple Differential Valuation driven by business economics |
|
|
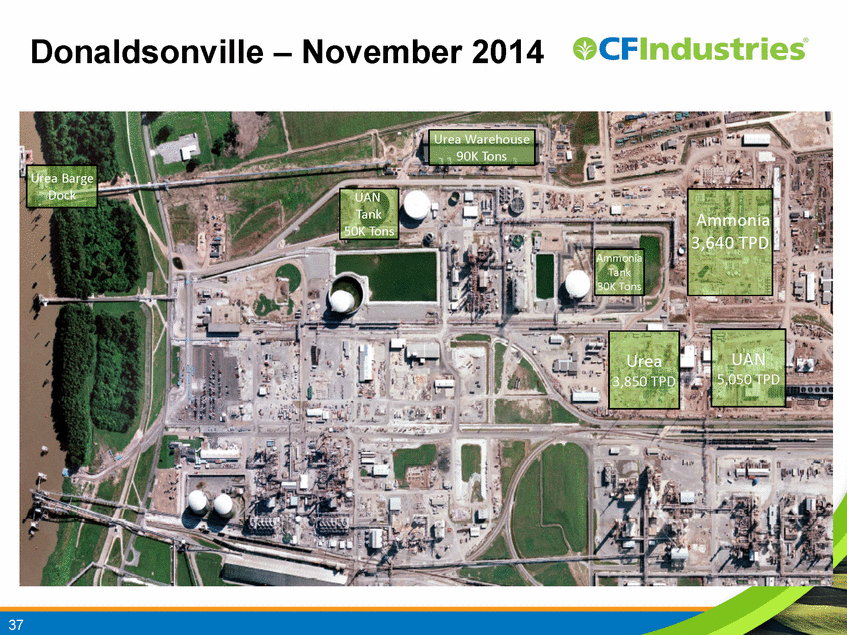
Donaldsonville – November 2014 37 Ammonia 3,640 TPD Urea 3,850 TPD UAN 5,050 TPD Urea Warehouse 90K Tons Ammonia Tank 30K Tons UAN Tank 50K Tons Urea Barge Dock |
|
|
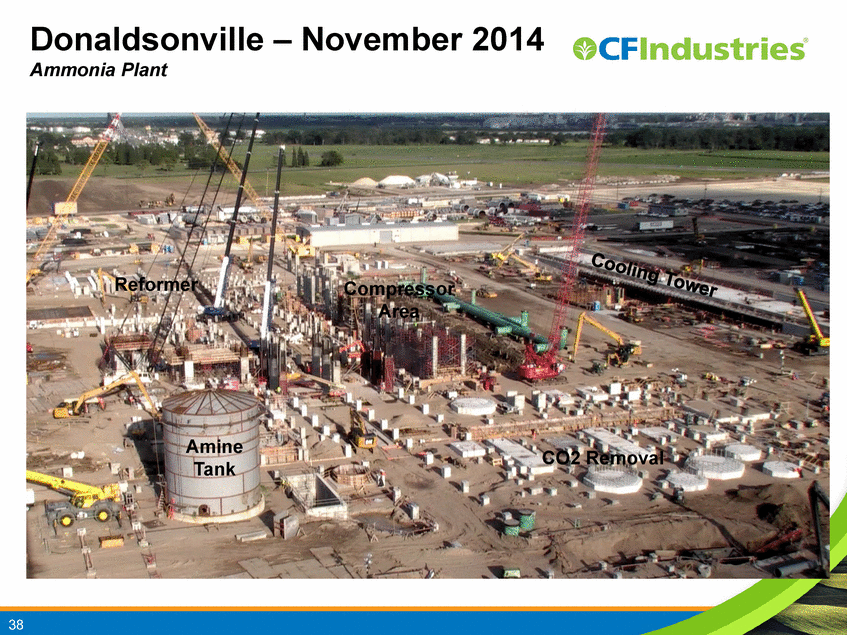
Donaldsonville – November 2014 Ammonia Plant 38 Reformer Compressor Area Amine Tank CO2 Removal |
|
|
Donaldsonville – November 2014 Urea Melt Status 39 |
|
|
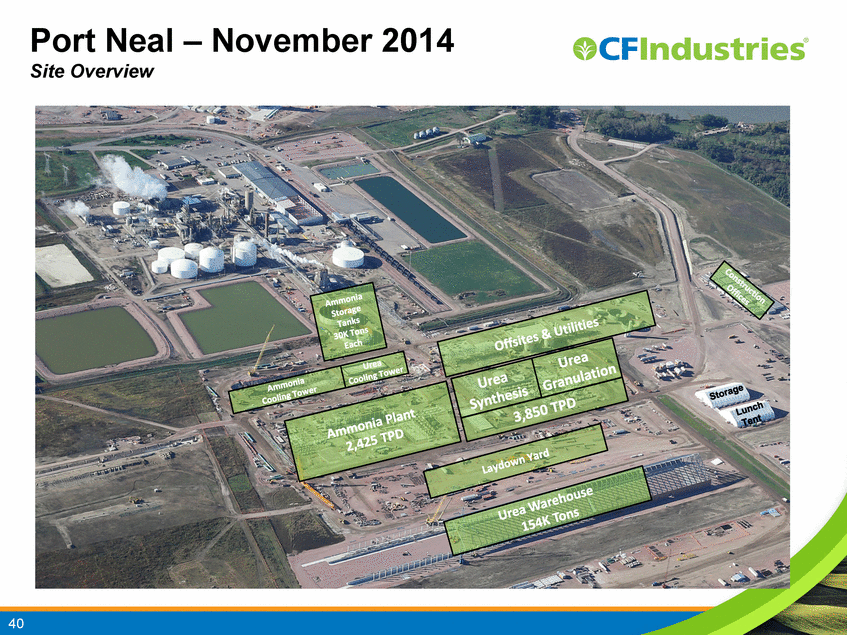
Port Neal – November 2014 Site Overview 40 |
|
|
Port Neal – November 2014 Offsites and Utilities 41 Air Receivers Demin Building Utility Control Room Storage Tent Lunch Tent Lime Silos Utility Pipe Rack Clarifier |
|
|
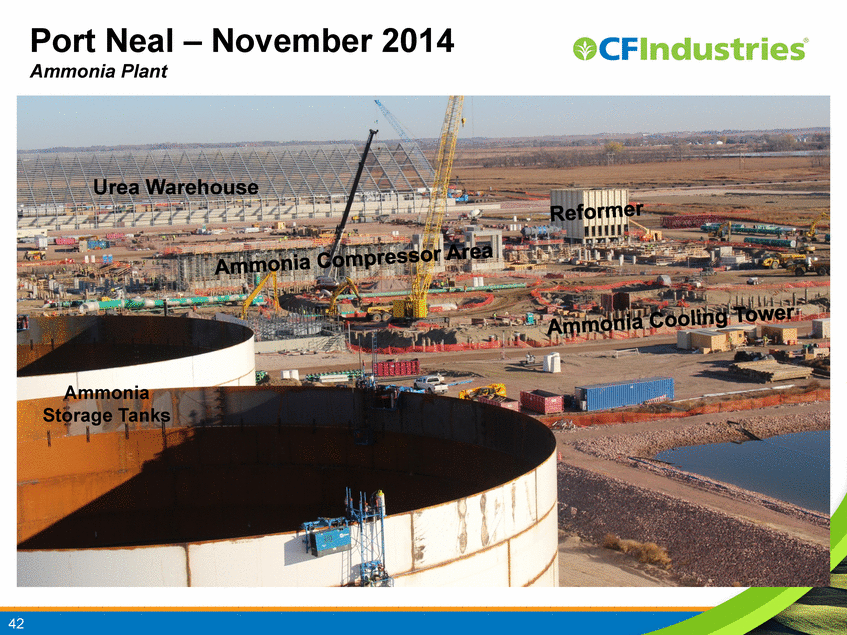
Port Neal – November 2014 Ammonia Plant 42 Urea Warehouse Ammonia Storage Tanks |

