Attached files
| file | filename |
|---|---|
| 8-K - 8-K - Wendy's Co | d817910d8k.htm |
 Third-Quarter 2014
Conference Call
November 6, 2014
Exhibit 99.1
©
2013 Oldemark LLC |
 DAVID
POPLAR Vice President
Investor Relations
2
©
2013 Oldemark LLC |
 Today’s Agenda
CEO Overview
Emil Brolick
Financial Update
Todd Penegor
Q&A
3 |
 4
Forward-Looking Statements and Non-GAAP Financial Measures
This presentation, and certain information that management may discuss in connection with
this presentation, contains certain statements that are not historical
facts, including information concerning possible or assumed future results of our
operations. Those statements constitute “forward-looking statements”
within the meaning of the Private Securities Litigation Reform Act of 1995 (The “Reform Act”). For
all forward-looking statements, we claim the protection of the safe harbor for
forward-looking statements contained in the Reform Act. Many important
factors could affect our future results and could cause those results to differ materially from
those expressed in or implied by our forward-looking statements. Such factors, all of
which are difficult or impossible to predict accurately, and many of which are
beyond our control, include but are not limited to those identified under the
caption “Forward-Looking Statements” in our news release issued on November 6,
2014 and in the “Special Note Regarding Forward-Looking Statements and
Projections” and “Risk Factors” sections of our most recent Form
10-K / Form 10-Qs.
In addition, this presentation and certain information management may discuss in
connection with this presentation reference non-GAAP financial measures, such
as adjusted earnings before interest, taxes, depreciation and amortization, or
adjusted EBITDA, and adjusted earnings per share. Adjusted EBITDA and adjusted
earnings per share exclude certain expenses, net of certain benefits. Reconciliations of non-GAAP
financial measures to the most directly comparable GAAP financial measures are provided
in the Appendix to this presentation, and are included in our news release issued
on November 6, 2014 and posted on www.aboutwendys.com. |
 EMIL
BROLICK 5
©
2013 Oldemark LLC
President & CEO |
 HOW WE
GROW BRAND RELEVANCE + ECONOMIC RELEVANCE = GROWTH
Shareholder
Value-Enhancing
Initiatives
Core Organic
Growth
Strategies
6
System
Optimization
Financial Management
Global Growth
Restaurant Utilization &
Brand Access
New Restaurant Growth
Image / Experience Activation
North America Same-Restaurant Sales Growth |
 OPENED
600
IMAGE
ACTIVATION
RESTAURANT DURING OCTOBER
INCREASED DIVIDEND RATE 10% TO
$0.055 PER SHARE
7
REALIGNING RESOURCES TO FOCUS ON
GROWTH AND TECHNOLOGY INITIATIVES
REAFFIRMING 2014 ADJ. EPS OUTLOOK;
EXPECT ADJ. EBITDA OF ~ $390 MILLION
STRONG TWO-YEAR COMPANY-
OPERATED SRS OF 5.2 PERCENT
TH
©
2013 Oldemark LLC |
 Five
Consecutive Quarters of SRS Growth 3.9%
8
Q3 2013
Q4 2013
Q1 2014
Q2 2014
Q3 2014
3.2%
3.1%
3.9%
2.0%
1.3%
First Half of Quarter: (1.3)%;
Second Half of Quarter: +4.4% |
 9
Five Consecutive Quarters of Solid Two-Year SRS Growth
5.9%
2.9%
2.3%
4.3%
5.2%
Q3 2013
Q4 2013
Q1 2014
Q2 2014
Q3 2014 |
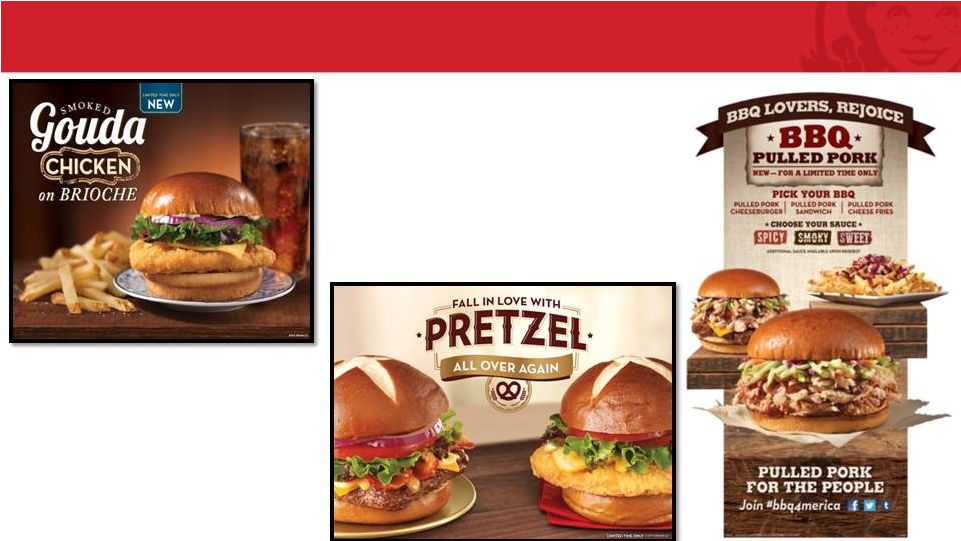 Leadership Through Product Innovation
10 |
 •
Ongoing evolution
Reducing Cost Structure & Driving Operational Efficiencies
11
•
Reduce G&A to ~$250 MM in 2015
•
Consumer-facing restaurant technology
•
Accelerated restaurant development
•
Beef-price inflation
•
Affordable Care Act
•
Expect cost headwinds to continue into 2015
•
U.S. system optimization
•
Canadian growth initiative
•
Realign and reinvest resources in:
•
Wage inflation – Minimum wage (state and local)
|
 Investing
in Technology 12 |
 ©
2013 Oldemark LLC
TODD PENEGOR
Chief Financial Officer
13 |
 14
*See reconciliation of Adjusted EBITDA in the appendix.
Q3 2014 Highlights
SALES
$409.1
$558.0
-26.7
FRANCHISE REVENUES
103.4
82.8
24.9
TOTAL REVENUES
$512.5
$640.8
-20.0
ADJUSTED EBITDA*
$94.1
$98.7
-4.7
Q3
2014
Q3
2013
%
Change
(Unaudited)
$ in millions |
 Q3 2014
Highlights G&A
$65.8
$76.5
-14.0
N.A. CO. REST. MARGIN
15.5%
15.6%
(10) bps
OPERATING PROFIT
46.9
26.8
+75.0
ADJUSTED EPS*
0.08
0.08
--
REPORTED EPS
0.06
0.00
N/A
Q3
2014
Q3
2013
%
Change
(Unaudited)
$ in millions, except per-share amounts
15
* See reconciliation of Adjusted EPS in the appendix. |
 Q3 2013
vs. Q3 2014: Adjusted EBITDA 16
(Unaudited)
$ in millions
* See reconciliation in appendix.
$98.7
$94.1
($18.5)
($3.9)
($4.2)
$22.4
$2.0
2013 Q3
Adj. EBITDA*
Lost EBITDA From
Restaurants Sold
Image
Activation
Gain/Loss on
Sale of Assets
Rental Income (net),
Royalties, &
G&A Savings
Restaurant
Income
& Other
2014 Q3
Adj. EBITDA* |
 17
Q3 2013 vs. Q3 2014: G&A
(Unaudited)
$ in millions
(Unaudited)
$ in millions
* Amounts are net of Sys Ops savings which are included in “Sys Ops Savings &
G&A Management” $76.5
$65.8
($6.6)
$2.6
$7.1
$7.6
2013 Q3
G&A
Stock Comp *
Franchise
Incentives
Sys. Ops. Savings &
G&A Management
Incentive Comp *
2014 Q3
G&A |
 18
Cash Flow Highlights
Cash Flow from Operations
$182.6
Capital Expenditures
197.9
Beginning Cash Balance
$580.2
Change In Cash
(237.8)
Ending Cash Balance
$342.4
YTD 2014
(Unaudited)
$ in millions
Returned nearly $350 million to shareholders in dividends and share repurchases in 2014
YTD |
 Ended
2014 Q3 with
$342M
of Cash
CASH PRIORITIES
19
•
Image Activation Reimages, including
Increasing Scrape & Rebuilds
Invest in our
Business
•
Announced divided rate increase of
10 percent
Dividend
Growth
•
Offset ongoing equity award dilution
beyond 2014
Share
Repurchase |
 2014
Outlook 20
•
Full-year Company-operated SRS growth of ~ 2.5%
•
Reduction in interest expense of approximately $15 million
•
Capital expenditures of $280 to $290 million, including approximately $215
million for Company-operated Image Activation restaurants
•
Company-operated restaurant margin outlook of 15.5 to 15.7 percent
•
Reflects significantly higher beef costs
•
Reported effective tax rate of 38 to 40%
Adjusted EBITDA of ~$390 million
Adjusted EPS of $0.34 to $0.36 |
 2015
2016
2017
SRS
3%+
3%+
3%+
Adjusted EBITDA
Mid to High
Single digits
High Single
Digits
Low Double
Digits
Adjusted EPS
Mid-Teens
Mid -
Teens
Mid -
Teens
Outlook: 2015 to 2017
21 |
 Image
Activation Franchise Adoption Accelerating 2011A
2012A
2013A
2014E
22
TOTAL SYSTEM ANNUAL
REIMAGES AND NEW BUILDS
TOTAL SYSTEM CUMULATIVE
REIMAGES AND NEW BUILDS
236
59
10
435-460
200 Company reimages
15 Company new
175-200 Franchise reimages
45 Franchise new
10
69
305
740-765
2011A
2012A
2013A
2014E |
 •
Market planning
•
Joint capital planning
•
Multi-Year Investment Plan
•
Construction support
•
Turnkey services
•
Incentives
•
Canadian Build-to-Suit program
Facilitating Franchisee Commitments for Reimages and New Builds
23 |
 24
2013 Actual to 2015 Forecast: G&A
~ $30 Million of
Cost
Savings
(Unaudited)
$ in millions
$294
$267
$265
$250
$2
($7)
($5)
$20
$8
$4
($5)
2013 Actual
G&A
2014 G&A
Pre
-
G&A
Initiative
G&A Cost
Initiative
2014 Current
Forecast G&A
Merit,
53rd wk
& Other
Incentive
Comp
to 100%
G&A Cost
Initiative
Sale of
Canadian
Restaurants
Franchise
Incentives
Investment
Initiatives
(Primarily IT &
Development)
2015 G&A
Target |
 25
Restaurant Ownership Optimization
Selective Buying and
Selling of Restaurants
Declining Company ownership over time
Canadian Growth Initiative
Focused on Building a Stronger Wendy’s
Commitment to Growth
Image Activation and new restaurant development
Improved Economic Models for Company and Franchisees
Strengthening of Franchise Base |
 ©
2013 Oldemark LLC
DAVID POPLAR
Vice President
Investor Relations
26 |
 Year-End Investor Relations Calendar
FEBRUARY 24, 2015
Issue Final 2014 Earnings Release
10-K Filing
27
FEBRUARY 3, 2015
Preliminary 2014 Earnings Release and Investor Day
Dublin, Ohio |
 Q&A
28 |
 Appendix
29 |
 Reconciliation of Adjusted EBITDA to Net Income
30
2014
2013
2014
2013
Adjusted EBITDA
94,125
$
98,737
$
285,691
$
278,122
$
(Less) plus:
Depreciation and amortization
(36,274)
(44,325)
(117,790)
(134,841)
Facilities action charges (income), net
(7,520)
(22,275)
35,630
(31,690)
Impairment of long-lived assets
(3,408)
(5,327)
(3,740)
(5,327)
Operating profit
46,923
26,810
199,791
106,264
Interest expense
(13,204)
(15,620)
(39,328)
(55,548)
Loss on early extinguishment of debt
-
-
-
(21,019)
Other income, net
373
2,273
1,753
50
Income before income taxes and noncontrolling interests
34,092
13,463
162,216
29,747
Provision for income taxes
(11,262)
(15,625)
(64,076)
(17,774)
Net income (loss)
22,830
(2,162)
98,140
11,973
Net loss attributable to noncontrolling interests
-
223
-
445
Net income (loss) attributable to The Wendy's Company
22,830
$
(1,939)
$
98,140
$
12,418
$
Three Months
Nine Months
Reconciliation of Adjusted EBITDA to Net Income (Loss)
Attributable to The Wendy's Company
(In Thousands)
(Unaudited) |
 31
Reconciliation of Adjusted Income and Adjusted Earnings Per Share
to Net Income and Earnings Per Share
Per share
Per share
(a)
Per share
Per share
Adjusted income and adjusted earnings per share
29,617
$
0.08
$
30,254
$
0.08
$
90,083
$
0.24
$
75,132
$
0.19
$
(Less) plus:
Facilities action charges (income), net
(4,077)
(0.01)
(24,990)
(0.06)
20,238
0.05
(30,875)
(0.08)
Depreciation of assets that will be replaced as part of the Image Activation
initiative (728)
(0.00)
(3,591)
(0.01)
(9,994)
(0.03)
(15,312)
(0.04)
Impairment of long-lived assets
(2,103)
(0.01)
(3,332)
(0.01)
(2,308)
(0.00)
(3,332)
(0.01)
Gain (loss) on sale of investment, net
121
0.00
(503)
(0.00)
121
0.00
(503)
(0.00)
Loss on early extinguishment of debt
-
-
-
-
-
-
(13,137)
(0.03)
Total adjustments
(6,787)
(0.02)
(32,416)
(0.08)
8,057
0.02
(63,159)
(0.16)
Net income (loss)
22,830
0.06
(2,162)
(0.00)
98,140
0.26
11,973
0.03
Net loss attributable to noncontrolling interests
-
-
223
0.00
-
-
445
0.00
Net income (loss) and earnings per share attributable to The Wendy's Company
22,830
$
0.06
$
(1,939)
$
(0.00)
$
98,140
$
0.26
$
12,418
$
0.03
$
Reported number of shares used to calculate diluted income (loss) per share
372,152
392,579
377,892
398,101
Plus: Dilutive effect of stock options and restricted shares
-
8,145
-
-
Adjusted number of shares used to calculate adjusted earnings per share
372,152
400,724
377,892
398,101
(a)
Adjusted earnings per share amounts for the three months ended September 29, 2013
include the dilutive effect of stock options and restricted shares, which were excluded from the reported number of shares used to calculate
basic and diluted loss per share, as the impact would have been
anti-dilutive. Included above is a reconciliation of the number of shares used to calculate adjusted earning per share amounts.
Reconciliation of Adjusted Income and Adjusted Earnings Per Share to Net Income
(Loss) and Earnings Per Share Attributable to The Wendy's Company
(In Thousands Except Per Share Amounts)
(Unaudited)
2014
2013
Three Months
Nine Months
2014
2013 |
 32 |