Attached files
| file | filename |
|---|---|
| EX-99.1 - EX-99.1 - DITECH HOLDING Corp | d815204dex991.htm |
| 8-K - FORM 8-K - DITECH HOLDING Corp | d815204d8k.htm |
Exhibit 99.2
Exhibit 99.2
Third Quarter 2014 Earnings Presentation
November 6, 2014
|
|
Forward-Looking Statements
Certain statements in this presentation constitute “forward-looking statements” within the meaning of Section 27A of the Securities Act and Section 21E of the Exchange Act.
Statements that are not historical fact are forward-looking statements. Certain of these forward-looking statements can be identified by the use of words such as “believes,” “anticipates,” “expects,” “intends,” “plans,” “projects,” “estimates,” “assumes,” “may,” “should,” “will,” “outlook,” “guidance” or other similar expressions. Such forward-looking statements involve known and unknown risks, uncertainties and other important factors, and our actual results, performance or achievements could differ materially from future results, performance or achievements expressed in these forward-looking statements. These forward-looking statements are based on our current beliefs, intentions and expectations. These statements are not guarantees or indicative of future performance. Important assumptions and other important factors that could cause actual results to differ materially from those forward-looking statements include, but are not limited to, those factors, risks and uncertainties described below and in more detail in our Annual Report on Form 10-K for the year ended December 31, 2013 under the caption “Risk Factors,” in Part II, Item 1A., “Risk Factors” of our Quarterly Reports on Form 10-Q for the quarterly periods ended March 31, 2014, June 30, 2014, and September 30, 2014 and in our other filings with the SEC.
In particular (but not by way of limitation), the following important factors, risks and uncertainties could affect our future results, performance and achievements and could cause actual results, performance and achievements to differ materially from those expressed in the forward-looking statements: • increased scrutiny and potential enforcement actions by federal and state agencies, including a pending investigation by the CFPB and the FTC, the investigation by the Department of Justice and HUD, and the investigations by the state attorneys general working group and the Office of the United States Trustee; • uncertainties related to our ability to meet increasing performance and compliance standards, such as those of the National Mortgage Settlement, and reporting obligations and increases to the cost of doing business as a result thereof; • uncertainties related to inquiries from government agencies into collection, foreclosure, loss mitigation, bankruptcy, loan servicing transfers and lender-placed insurance practices; • uncertainties relating to interest curtailment obligations and any related financial and litigation exposure (including exposure relating to false claims); • unexpected losses resulting from pending, threatened or unforeseen litigation, arbitration or other third-party claims against the Company; • changes in, and/or more stringent enforcement of, federal, state and local policies, laws and regulations affecting our business, including mortgage and reverse mortgage originations and servicing and lender-placed insurance; • loss of our loan servicing, loan origination, insurance agency, and collection agency licenses, or changes to our licensing requirements; • our ability to remain qualified as a GSE approved seller, servicer or component servicer, including the ability to continue to comply with the GSEs’ respective loan and selling and servicing guides; • the substantial resources (including senior management time and attention) we devote to, and the significant compliance costs we incur in connection with, regulatory compliance and regulatory examinations and inquiries, and any fines, penalties or similar payments we make in connection with resolving such matters; • our ability to earn anticipated levels of performance and incentive fees on serviced business; • the ability of our customers, under certain circumstances, to terminate our servicing and sub-servicing agreements, including agreements relating to our management and disposition of real estate owned properties for GSEs and investors; • a downgrade in our servicer ratings by one or more of the rating agencies that rate us as a residential loan servicer; • our ability to satisfy various GSE and other capital requirements applicable to our business; • uncertainties relating to the status and future role of GSEs, and the effects of any changes to the servicing compensation structure for mortgage servicers pursuant to programs of GSEs or various regulatory authorities; • changes to HAMP, HARP, the HECM program or other similar government programs; • uncertainty as to the volume of originations activity we will benefit from following the expiration of HARP, which is scheduled to occur on December 31, 2015; • uncertainties related to the processes for judicial and non-judicial foreclosure proceedings, including potential additional costs, delays or moratoria in the future or claims pertaining to past practices;
2
|
|
Forward-Looking Statements
our ability to implement strategic initiatives, particularly as they relate to our ability to raise capital and develop new business, including acquisitions of mortgage servicing rights, the development of our originations business and the implementation of delinquency flow loan servicing programs, all of which are subject to customer demand and various third-party approvals; risks related to our acquisitions, including our ability to successfully integrate large volumes of assets and servicing rights, as well as businesses and platforms, that we have acquired or may acquire in the future into our business, any delay or failure to realize the anticipated benefits we expect to realize from such acquisitions, and our ability to obtain approvals required to acquire and retain servicing rights and other assets in the future; risks related to the financing incurred in connection with past or future acquisitions and operations, including our ability to achieve cash flows sufficient to carry our debt and otherwise comply with the covenants of our debt; risks related to the high amount of leverage we utilize in the operation of our business; our dependence upon third-party funding in order to finance certain of our businesses; the effects of competition on our existing and potential future business, including the impact of competitors with greater financial resources and broader scopes of operation; our ability to successfully develop our loan originations platforms; the occurrence of anticipated growth of the specialty servicing sector and the reverse mortgage sector; local, regional, national and global economic trends and developments in general, and local, regional and national real estate and residential mortgage market trends in particular; continued uncertainty in the United States home sales market, including both the volume and pricing of sales, due to adverse economic conditions or otherwise; fluctuations in interest rates and levels of mortgage originations and prepayments; changes in regards to the rights and obligations of property owners, mortgagors and tenants; changes in public, client or investor opinion on mortgage origination, loan servicing and debt collection practices; risks related to cyber-attacks against us or our vendors, including any related interruptions to our operations, remediation costs and reputational damage; the effect of our risk management strategies, including the management and protection of the personal and private information of our customers and mortgage holders and the protection of our information systems from third-party interference (cybersecurity); changes in accounting rules and standards, which are highly complex and continuing to evolve in the forward and reverse servicing and originations sectors; the satisfactory maintenance of effective internal control over financial reporting and disclosure controls and procedures; our continued listing on the New York Stock Exchange; and the ability or willingness of Walter Energy, our prior parent, and other counterparties to satisfy material obligations under agreements with us.
All of the above factors, risks and uncertainties are difficult to predict, contain uncertainties that may materially affect actual results and may be beyond our control. New factors, risks and uncertainties emerge from time to time, and it is not possible for our management to predict all such factors, risks and uncertainties.
Although we believe that the assumptions underlying the forward-looking statements (including those relating to our outlook) contained herein are reasonable, any of the assumptions could be inaccurate, and therefore any of these statements included herein may prove to be inaccurate. In light of the significant uncertainties inherent in the forward-looking statements included herein, the inclusion of such information should not be regarded as a representation by us or any other person that the results or conditions described in such statements or our objectives and plans will be achieved. We make no commitment to revise or update any forward-looking statements in order to reflect events or circumstances after the date any such statement is made, except as otherwise required under the federal securities laws. If w e were in any particular instance to update or correct a forward-looking statement, investors and others should not conclude that we would make additional updates or corrections thereafter except as otherwise required under the federal securities laws.
3
|
|
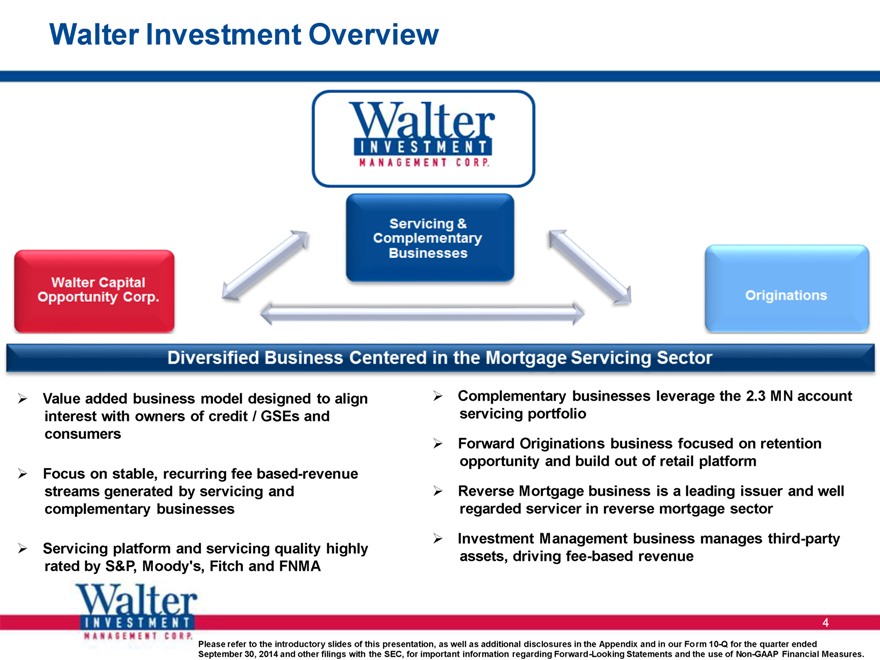
Walter Investment Overview
Value added business model designed to align Complementary businesses leverage the 2.3 MN account interest with owners of credit / GSEs and servicing portfolio consumers Forward Originations business focused on retention Focus on stable, recurring fee based-revenue opportunity and build out of retail platform streams generated by servicing and Reverse Mortgage business is a leading issuer and well complementary businesses regarded servicer in reverse mortgage sector Investment Management business manages third-party Servicing platform and servicing quality highly assets, driving fee-based revenue rated by S&P, Moody’s, Fitch and FNMA
Please refer to the introductory slides of this presentation, as well as additional disclosures in the Appendix and in our Form 10-Q for the quarter ended
September 30, 2014 and other filings with the SEC, for important information regarding Forward-Looking Statements and the use of Non-GAAP Financial Measures.
4
|
|
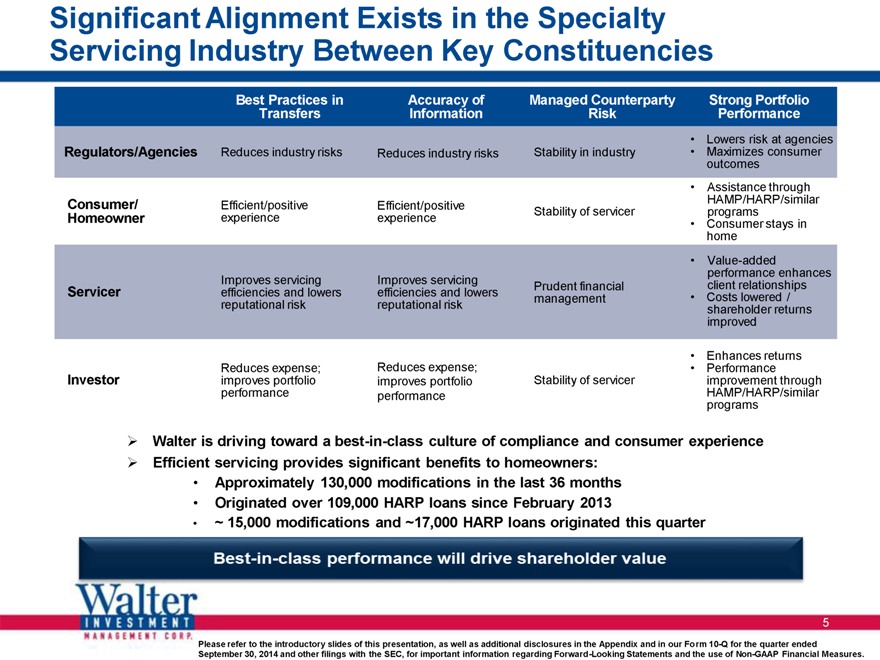
Significant Alignment Exists in the Specialty Servicing Industry Between Key Constituencies
Best Practices in Accuracy of Managed Counterparty Strong Portfolio Transfers Information Risk Performance
Lowers risk at agencies Regulators/Agencies Reduces industry risks Reduces industry risks Stability in industry Maximizes consumer outcomes
Assistance through Consumer/ HAMP/HARP/similar Efficient/positive Efficient/positive Stability of servicer programs Homeowner experience experience
Consumer stays in home
Value-added performance enhances Improves servicing Improves servicing Prudent financial client relationships Servicer efficiencies and lowers efficiencies and lowers Costs lowered / management reputational risk reputational risk shareholder returns improved
Reduces expense; Enhances returns Reduces expense; Performance Investor improves portfolio improves portfolio Stability of servicer improvement through performance performance HAMP/HARP/similar programs
Walter is driving toward a best-in-class culture of compliance and consumer experience Efficient servicing provides significant benefits to homeowners:
Approximately 130,000 modifications in the last 36 months
Originated over 109,000 HARP loans since February 2013
~ 15,000 modifications and ~17,000 HARP loans originated this quarter
Please refer to the introductory slides of this presentation, as well as additional disclosures in the Appendix and in our Form 10-Q for the quarter ended
September 30, 2014 and other filings with the SEC, for important information regarding Forward-Looking Statements and the use of Non-GAAP Financial Measures.
5
|
|
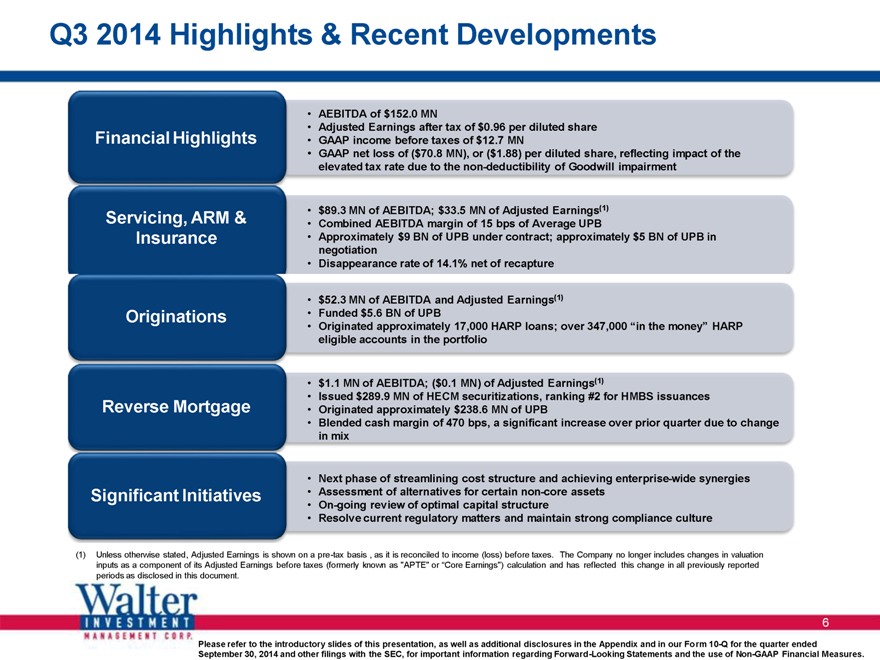
Q3 2014 Highlights & Recent Developments
• AEBITDA of $152.0 MN
• Adjusted Earnings after tax of $0.96 per diluted share
Financial Highlights • GAAP income before taxes of $12.7 MN
• GAAP net loss of ($70.8 MN), or ($1.88) per diluted share, reflecting impact of the
elevated tax rate due to the non-deductibility of Goodwill impairment
Servicing, ARM & • $89.3 MN of AEBITDA; $33.5 MN of Adjusted Earnings(1)
• Combined AEBITDA margin of 15 bps of Average UPB
Insurance • Approximately $9 BN of UPB under contract; approximately $5 BN of UPB in
negotiation
• Disappearance rate of 14.1% net of recapture
• $52.3 MN of AEBITDA and Adjusted Earnings(1)
Originations • Funded $5.6 BN of UPB
• Originated approximately 17,000 HARP loans; over 347,000 “in the money” HARP
eligible accounts in the portfolio
• $1.1 MN of AEBITDA; ($0.1 MN) of Adjusted Earnings(1)
• Issued $289.9 MN of HECM securitizations, ranking #2 for HMBS issuances
Reverse Mortgage • Originated approximately $238.6 MN of UPB
• Blended cash margin of 470 bps, a significant increase over prior quarter due to change
in mix
• Next phase of streamlining cost structure and achieving enterprise-wide synergies
Significant Initiatives • Assessment of alternatives for certain non-core assets
• On-going review of optimal capital structure
• Resolve current regulatory matters and maintain strong compliance culture
(1) Unless otherwise stated, Adjusted Earnings is shown on a pre-tax basis , as it is reconciled to income (loss) before taxes. The Company no longer includes changes in valuation inputs as a component of its Adjusted Earnings before taxes (formerly known as “APTE” or “Core Earnings”) calculation and has reflected this change in all previously reported periods as disclosed in this document.
Please refer to the introductory slides of this presentation, as well as additional disclosures in the Appendix and in our Form 10-Q for the quarter ended
September 30, 2014 and other filings with the SEC, for important information regarding Forward -Looking Statements and the use of Non-GAAP Financial Measures.
6
|
|
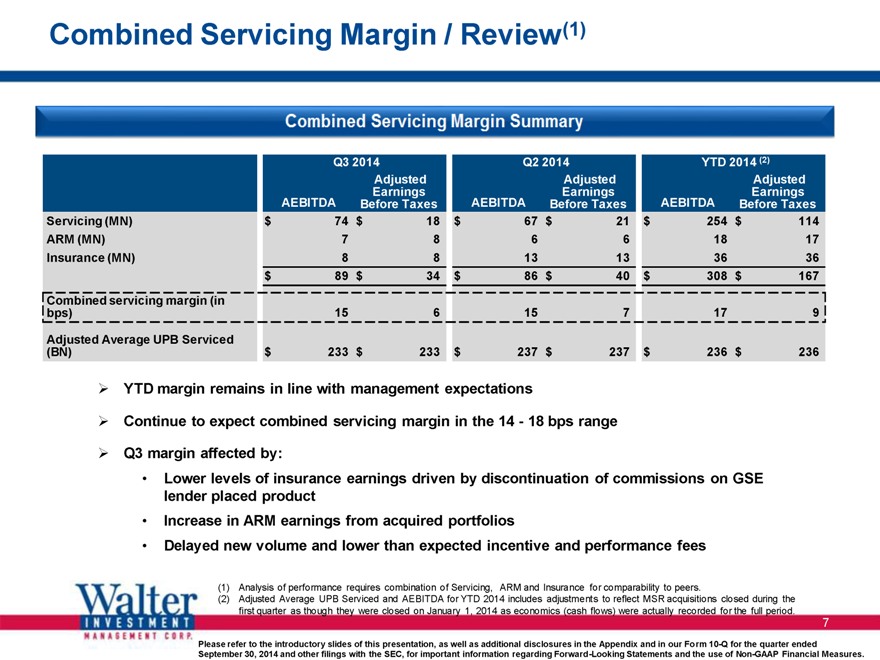
Combined Servicing Margin / Review(1)
Q3 2014 Q2 2014 YTD 2014 (2) Adjusted Adjusted Adjusted AEBITDA Earnings AEBITDA Earnings AEBITDA Earnings Before Taxes Before Taxes Before Taxes Servicing (MN) $ 74 $ 18 $ 67 $ 21 $ 254 $ 114 ARM (MN) 7 8 6 6 18 17 Insurance (MN) 8 8 13 13 36 36
$ 89 $ 34 $ 86 $ 40 $ 308 $ 167
Combined servicing margin (in bps) 15 6 15 7 17 9
Adjusted Average UPB Serviced
(BN) $ 233 $ 233 $ 237 $ 237 $ 236 $ 236
YTD margin remains in line with management expectations
Continue to expect combined servicing margin in the 14—18 bps range
Q3 margin affected by:
Lower levels of insurance earnings driven by discontinuation of commissions on GSE lender placed product
Increase in ARM earnings from acquired portfolios
Delayed new volume and lower than expected incentive and performance fees
(1) Analysis of performance requires combination of Servicing, ARM and Insurance for comparability to peers.
(2) Adjusted Average UPB Serviced and AEBITDA for YTD 2014 includes adjustments to reflect MSR acquisitions closed during the first quarter as though they were closed on January 1, 2014 as economics (cash flows) were actually recorded for the full period.
Please refer to the introductory slides of this presentation, as well as additional disclosures in the Appendix and in our Form 10-Q for the quarter ended
September 30, 2014 and other filings with the SEC, for important information regarding Forward-Looking Statements and the use of Non-GAAP Financial Measures.
7
|
|
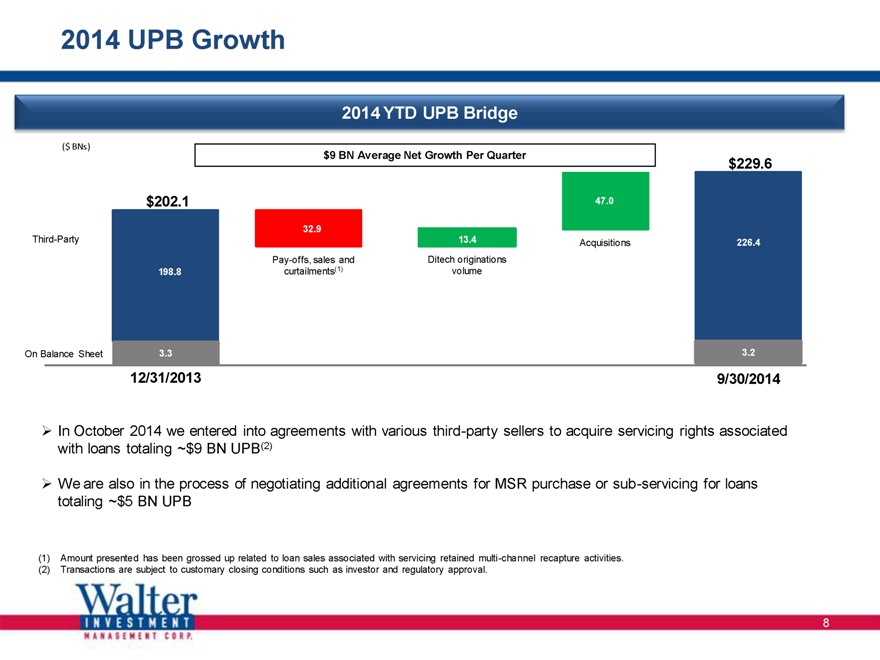
2014 UPB Growth
2014 YTD UPB Bridge
($ BNs)
$9 BN Average Net Growth Per Quarter $229.6
$202.1 47.0
32.9
Third-Party 13.4 Acquisitions 226.4
Pay-offs, sales and Ditech originations
198.8 curtailments(1) volume
On Balance Sheet 3.3 3.2
12/31/2013 9/30/2014
In October 2014 we entered into agreements with various third-party sellers to acquire servicing rights associated with loans totaling ~$9 BN UPB(2)
We are also in the process of negotiating additional agreements for MSR purchase or sub-servicing for loans totaling ~$5 BN UPB
(1) Amount presented has been grossed up related to loan sales associated with servicing retained multi-channel recapture activities.
(2) Transactions are subject to customary closing conditions such as investor and regulatory approval.
8
|
|
Capital and Liquidity Requirements
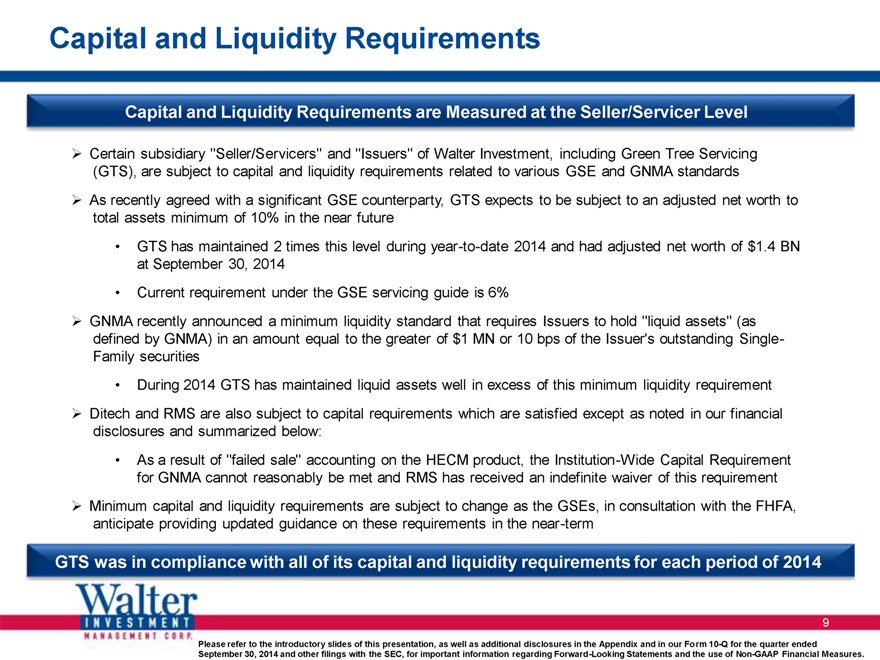
Capital and Liquidity Requirements are Measured at the Seller/Servicer Level
Certain subsidiary “Seller/Servicers” and “Issuers” of Walter Investment, including Green Tree Servicing (GTS), are subject to capital and liquidity requirements related to various GSE and GNMA standards As recently agreed with a significant GSE counterparty, GTS expects to be subject to an adjusted net worth to total assets minimum of 10% in the near future
GTS has maintained 2 times this level during year-to-date 2014 and had adjusted net worth of $1.4 BN at September 30, 2014
Current requirement under the GSE servicing guide is 6%
GNMA recently announced a minimum liquidity standard that requires Issuers to hold “liquid assets” (as defined by GNMA) in an amount equal to the greater of $1 MN or 10 bps of the Issuer’s outstanding Single-Family securities
During 2014 GTS has maintained liquid assets well in excess of this minimum liquidity requirement Ditech and RMS are also subject to capital requirements which are satisfied except as noted in our financial disclosures and summarized below:
As a result of “failed sale” accounting on the HECM product, the Institution-Wide Capital Requirement for GNMA cannot reasonably be met and RMS has received an indefinite waiver of this requirement
Minimum capital and liquidity requirements are subject to change as the GSEs, in consultation with the FHFA, anticipate providing updated guidance on these requirements in the near-term
GTS was in compliance with all of its capital and liquidity requirements for each period of 2014
Please refer to the introductory slides of this presentation, as well as additional disclosures in the Appendix and in our Form 10-Q for the quarter ended
September 30, 2014 and other filings with the SEC, for important information regarding Forward-Looking Statements and the use of Non-GAAP Financial Measures.
9
|
|
Business Trends
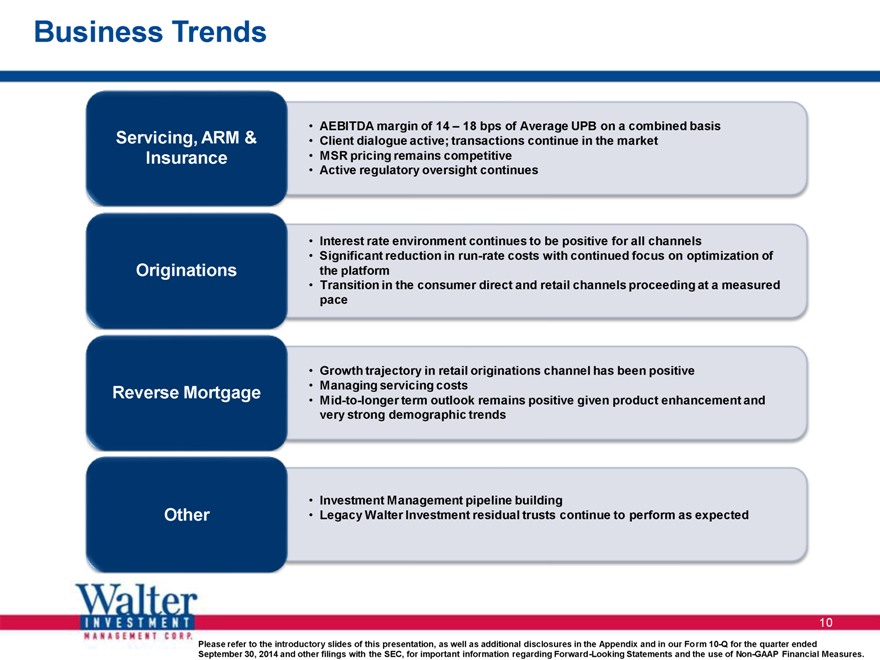
• AEBITDA margin of 14 – 18 bps of Average UPB on a combined basis
Servicing, ARM & • Client dialogue active; transactions continue in the market
Insurance • MSR pricing remains competitive
• Active regulatory oversight continues
• Interest rate environment continues to be positive for all channels
• Significant reduction in run-rate costs with continued focus on optimization of
Originations the platform
• Transition in the consumer direct and retail channels proceeding at a measured
pace
• Growth trajectory in retail originations channel has been positive
Reverse Mortgage • Managing servicing costs
• Mid-to-longer term outlook remains positive given product enhancement and
very strong demographic trends
• Investment Management pipeline building
Other • Legacy Walter Investment residual trusts continue to perform as expected
Please refer to the introductory slides of this presentation, as well as additional disclosures in the Appendix and in our Form 10-Q for the quarter ended
September 30, 2014 and other filings with the SEC, for important information regarding Forward-Looking Statements and the use of Non-GAAP Financial Measures.
10
|
|
Updated 2014 Outlook
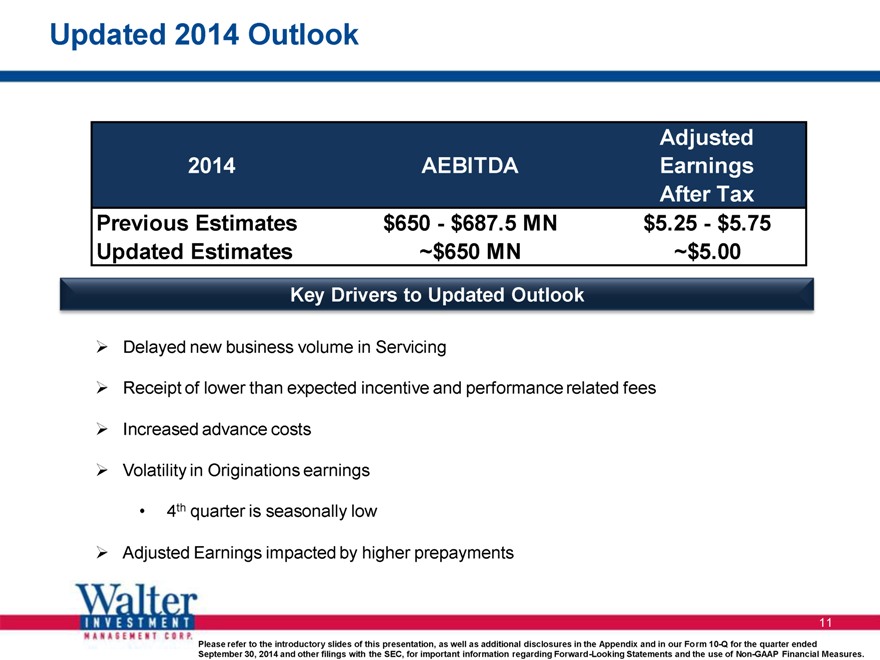
Adjusted
2014 AEBITDA Earnings
After Tax
Previous Estimates $650-$687.5 MN $5.25-$5.75
Updated Estimates ~$650 MN ~$5.00
Key Drivers to Updated Outlook
Delayed new business volume in Servicing
Receipt of lower than expected incentive and performance related fees Increased advance costs Volatility in Originations earnings
4th quarter is seasonally low
Adjusted Earnings impacted by higher prepayments
Please refer to the introductory slides of this presentation, as well as additional disclosures in the Appendix and in our Form 10-Q for the quarter ended
September 30, 2014 and other filings with the SEC, for important information regarding Forward -Looking Statements and the use of Non-GAAP Financial Measures.
11
|
|
Action Steps to Maximize Value
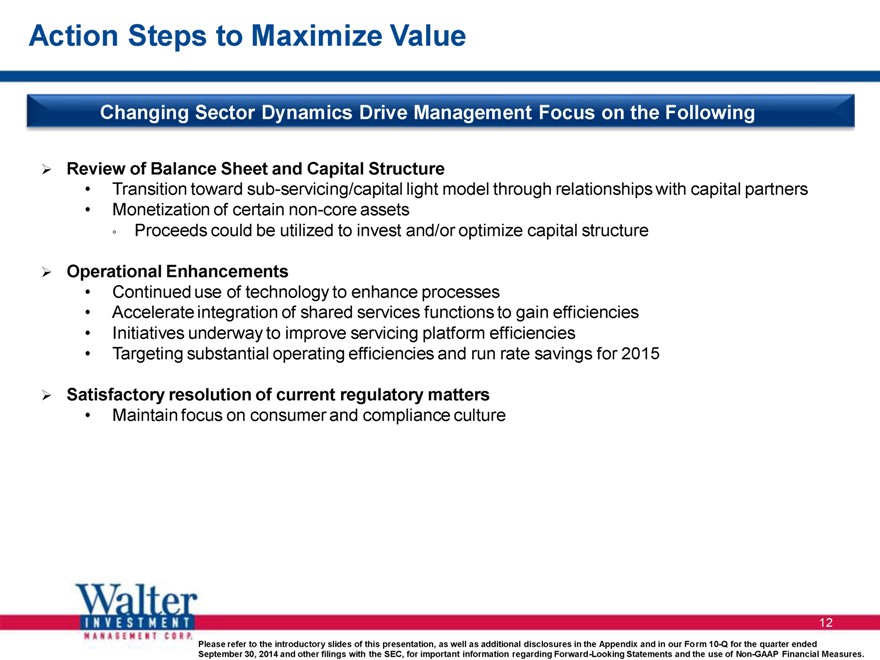
Changing Sector Dynamics Drive Management Focus on the Following
Review of Balance Sheet and Capital Structure
Transition toward sub-servicing/capital light model through relationships with capital partners
Monetization of certain non-core assets
Proceeds could be utilized to invest and/or optimize capital structure
Operational Enhancements
Continued use of technology to enhance processes
Accelerate integration of shared services functions to gain efficiencies
Initiatives underway to improve servicing platform efficiencies
Targeting substantial operating efficiencies and run rate savings for 2015
Satisfactory resolution of current regulatory matters
Maintain focus on consumer and compliance culture
Please refer to the introductory slides of this presentation, as well as additional disclosures in the Appendix and in our Form 10-Q for the quarter ended
September 30, 2014 and other filings with the SEC, for important information regarding Forward-Looking Statements and the use of Non-GAAP Financial Measures.
12
|
|
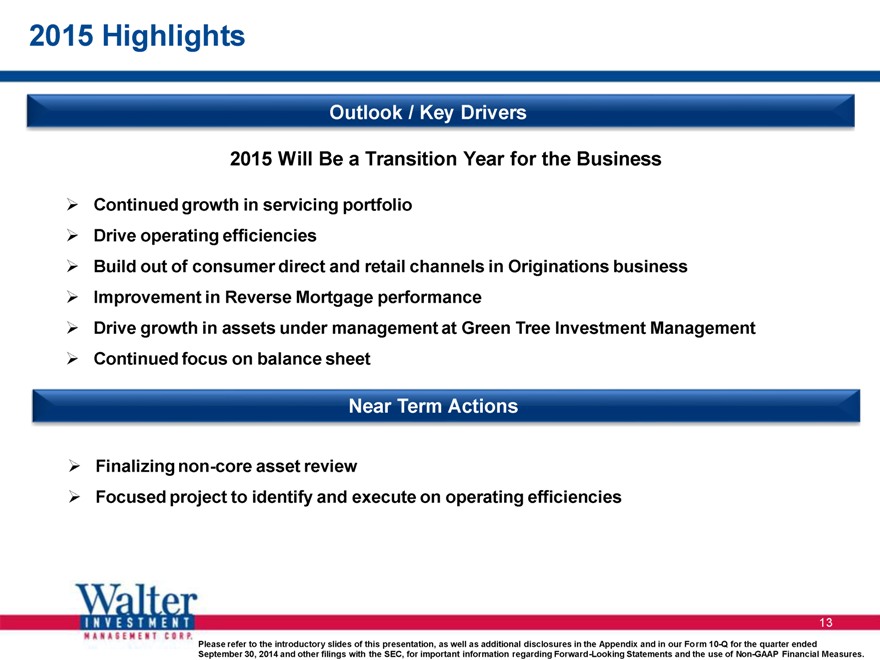
2015 Highlights
Outlook / Key Drivers
2015 Will Be a Transition Year for the Business
Continued growth in servicing portfolio Drive operating efficiencies
Build out of consumer direct and retail channels in Originations business Improvement in Reverse Mortgage performance
Drive growth in assets under management at Green Tree Investment Management Continued focus on balance sheet
Near Term Actions
Finalizing non-core asset review
Focused project to identify and execute on operating efficiencies
Please refer to the introductory slides of this presentation, as well as additional disclosures in the Appendix and in our Form 10-Q for the quarter ended
September 30, 2014 and other filings with the SEC, for important information regarding Forward-Looking Statements and the use of Non-GAAP Financial Measures.
13
|
|
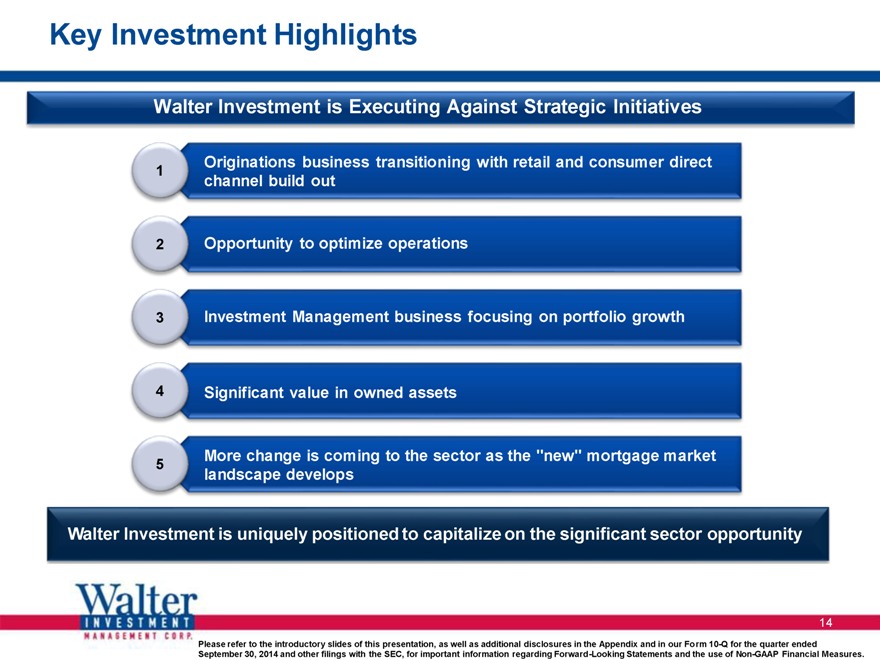
Key Investment Highlights
Walter Investment is Executing Against Strategic Initiatives
Originations business transitioning with retail and consumer direct
1 channel build out
2 Opportunity to optimize operations
3 Investment Management business focusing on portfolio growth
4 Significant value in owned assets
More change is coming to the sector as the “new” mortgage market
5 landscape develops
Walter Investment is uniquely positioned to capitalize on the significant sector opportunity
Please refer to the introductory slides of this presentation, as well as additional disclosures in the Appendix and in our Form 10-Q for the quarter ended
September 30, 2014 and other filings with the SEC, for important information regarding Forward-Looking Statements and the use of Non-GAAP Financial Measures.
14
|
|

Supplemental Information & Reconciliations
|
|
Use of Non-GAAP Measures and Definitions
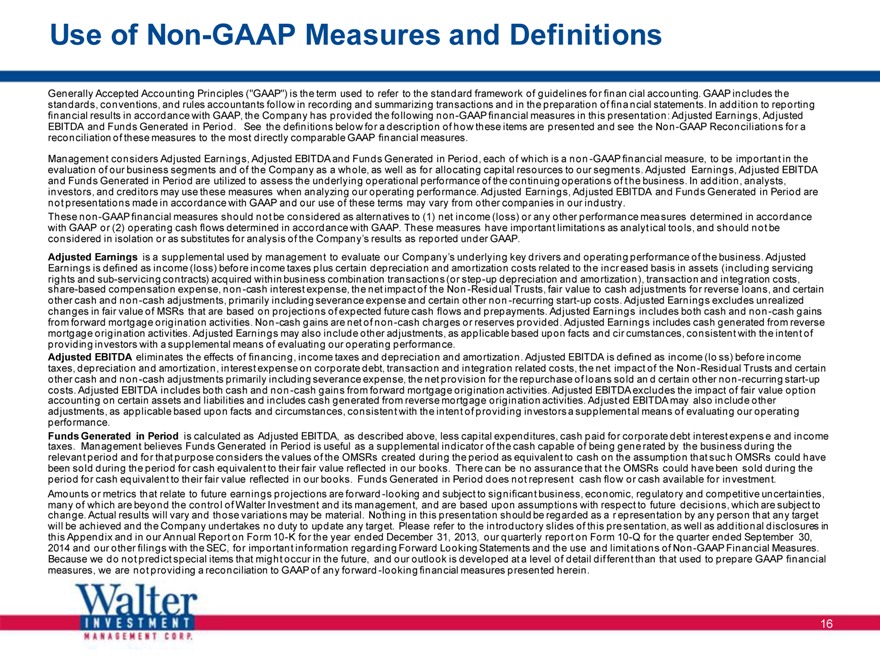
Generally Accepted Accounting Principles (“GAAP”) is the term used to refer to the standard framework of guidelines for finan cial accounting. GAAP includes the
standards, conventions, and rules accountants follow in recording and summarizing transactions and in the preparation of fina ncial statements. In addition to reporting
financial results in accordance with GAAP, the Company has provided the following non-GAAP financial measures in this presentation: Adjusted Earnings, Adjusted
EBITDA and Funds Generated in Period . See the definitions below for a description of how these items are presented and see the Non-GAAP Reconciliations for a
reconciliation of these measures to the most directly comparable GAAP financial measures.
Management considers Adjusted Earnings, Adjusted EBITDA and Funds Generated in Period, each of which is a non -GAAP financial measure, to be important in the
evaluation of our business segments and of the Company as a whole, as well as
for allocating capital resources to our segment s. Adjusted Earnings, Adjusted EBITDA
and Funds Generated in Period are utilized to assess the underlying operational performance of the continuing operations of t he business. In addition, analysts,
investors, and creditors may use these measures when analyzing our operating performance. Adjusted Earnings, Adjusted EBITDA and Funds Generated
in Period are
not presentations made in accordance with GAAP and our use of these terms may vary from other companies in our industry.
These non-GAAP financial measures should not be considered as alternatives to (1) net income (loss) or any other performance measures determined in accordance
with GAAP or (2) operating cash flows determined in accordance with GAAP. These measures have important limitations as analyt ical tools, and should not be
considered in isolation or as substitutes for analysis of the Company’s results as
reported under GAAP.
Adjusted Earnings is a supplemental used by management to evaluate our Company’s underlying key drivers and operating performance of the business. Adjusted
Earnings is defined as income (loss) before income taxes plus certain depreciation and amortization costs related to the incr eased basis in assets (including servicing
rights and sub-servicing contracts) acquired within business combination transactions (or step -up depreciation and amortization), transaction and integration costs,
share-based compensation expense, non-cash interest expense, the net impact of the Non -Residual Trusts, fair value to cash adjustments for reverse loans, and certain
other cash and non-cash adjustments, primarily including severance expense and certain other non -recurring start-up costs. Adjusted Earnings excludes unrealized
changes in fair value of MSRs that are based on projections of expected future cash flows and prepayments. Adjusted Earnings includes both cash and non-cash gains
from forward mortgage origination activities. Non-cash gains are net of non-cash charges or reserves provided . Adjusted Earnings includes cash generated from reverse
mortgage origination activities. Adjusted Earnings may also include other adjustments, as applicable based upon facts and cir cumstances, consistent with the intent of
providing investors with a supplemental means of evaluating our operating performance.
Adjusted EBITDA eliminates the effects of financing, income taxes and depreciation and amortization . Adjusted EBITDA is defined as income (loss) before income
taxes, depreciation and amortization, interest expense on corporate debt, transaction and integration related costs, the net impact of the Non -Residual Trusts and certain
other cash and non -cash adjustments primarily including severance expense, the net provision for the repurchase of loans sold an d certain other non -recurring start-up
costs. Adjusted EBITDA includes both cash and non -cash gains from forward mortgage origination activities. Adjusted EBITDA excludes the impact of fair value option
accounting on certain assets and liabilities and includes cash generated from reverse mortgage origination activities. Adjust ed EBITDA may also include other
adjustments, as applicable based upon facts and circumstances, consistent with the intent of providing investors a supplement al means of evaluating our operating
performance.
Funds Generated in Period is calculated as Adjusted EBITDA, as
described above, less capital expenditures, cash paid for corporate debt interest expens e and income
taxes. Management believes Funds Generated in Period is useful
as a supplemental indicator of the cash capable of being gene rated by the business during the
relevant period and for that purpose considers the values of the OMSRs created
during the period as equivalent to cash on the assumption that suc h OMSRs could have
been sold during the period for cash equivalent to their fair value reflected in our
books.
There can be no assurance that t he OMSRs could have been sold during the
period for cash equivalent to their fair value reflected in our books. Funds Generated in Period does not represent cash flow or cash available for investment.
Amounts or metrics that relate to future earnings projections are forward -looking and subject to significant business, economic, regulatory and competitive uncertainties,
many of which are beyond the control of Walter Investment and its management, and are based upon assumptions with respect to future decisions, which are subject to
change. Actual results will vary and those variations may be material. Nothing in this presentation should be regarded as a r epresentation by any person that any target
will be achieved and the Company undertakes no duty to update any target. Please refer
to the introductory slides of this pre sentation, as well as additional disclosures in
this Appendix and in our Annual Report on Form 10-K for the year ended December
31,
2013, our quarterly report on Form 10-Q for the quarter ended September 30,
2014 and our other filings with the SEC, for important information regarding Forward Looking Statements and the use and limit ations of Non -GAAP Financial Measures.
Because we do not predict special items that might occur in the future, and our outlook is developed at a level of detail dif ferent than that used to prepare GAAP financial
measures, we are not providing a reconciliation to GAAP of any forward -looking financial measures presented herein .
16
|
|
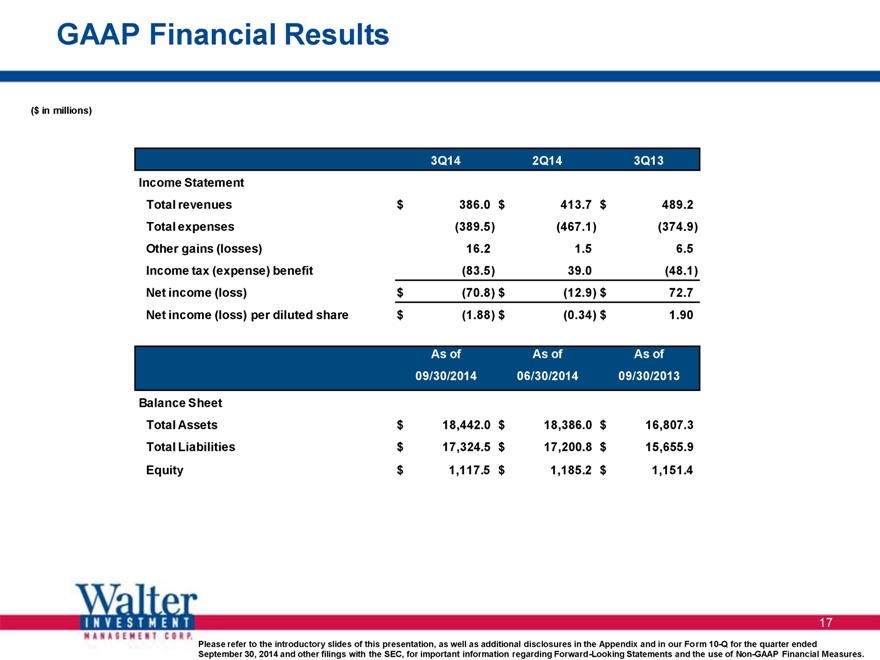
GAAP Financial Results
($ in millions)
3Q14 2Q14 3Q13 Income Statement Total revenues $ 386.0 $ 413.7 $ 489.2 Total expenses (389.5) (467.1) (374.9) Other gains (losses) 16.2 1.5 6.5 Income tax (expense) benefit (83.5) 39.0 (48.1) Net income (loss) $ (70.8) $ (12.9) $ 72.7 Net income (loss) per diluted share $ (1.88) $ (0.34) $ 1.90
As of As of As of 09/30/2014 06/30/2014 09/30/2013
Balance Sheet
Total Assets $ 18,442.0 $ 18,386.0 $ 16,807.3 Total Liabilities $ 17,324.5 $ 17,200.8 $ 15,655.9 Equity $ 1,117.5 $ 1,185.2 $ 1,151.4
Please refer to the introductory slides of this presentation, as well as additional disclosures in the Appendix and in our Form 10-Q for the quarter ended
September 30, 2014 and other filings with the SEC, for important information regarding Forward-Looking Statements and the use of Non-GAAP Financial Measures.
17
|
|
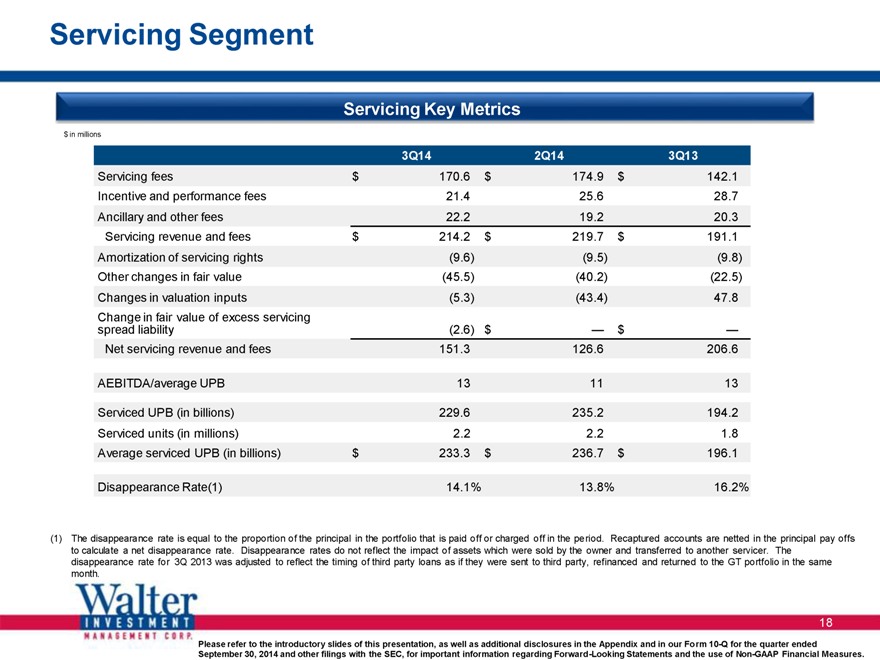
Servicing Segment
Servicing Key Metrics
$ in millions
3Q14 2Q14 3Q13
Servicing fees $ 170.6 $ 174.9 $ 142.1
Incentive and performance fees 21.4 25.6 28.7
Ancillary and other fees 22.2 19.2 20.3
Servicing revenue and fees $ 214.2 $ 219.7 $ 191.1
Amortization of servicing rights (9.6) (9.5) (9.8)
Other changes in fair value (45.5) (40.2) (22.5)
Changes in valuation inputs (5.3) (43.4) 47.8
Change in fair value of excess servicing
spread liability (2.6) $ — $ —
Net servicing revenue and fees 151.3 126.6 206.6
AEBITDA/average UPB 13 11 13
Serviced UPB (in billions) 229.6 235.2 194.2
Serviced units (in millions) 2.2 2.2 1.8
Average serviced UPB (in billions) $ 233.3 $ 236.7 $ 196.1
Disappearance Rate(1) 14.1% 13.8% 16.2%
(1) The disappearance rate is equal to the proportion of the principal in the portfolio that is paid off or charged off in the period. Recaptured accounts are netted in the principal pay offs to calculate a net disappearance rate. Disappearance rates do not reflect the impact of assets which were sold by the owner and transferred to another servicer. The disappearance rate for 3Q 2013 was adjusted to reflect the timing of third party loans as if they were sent to third party, refinanced and returned to the GT portfolio in the same month.
Please refer to the introductory slides of this presentation, as well as additional disclosures in the Appendix and in our Form 10-Q for the quarter ended
September 30, 2014 and other filings with the SEC, for important information regarding Forward-Looking Statements and the use of Non-GAAP Financial Measures.
18
|
|
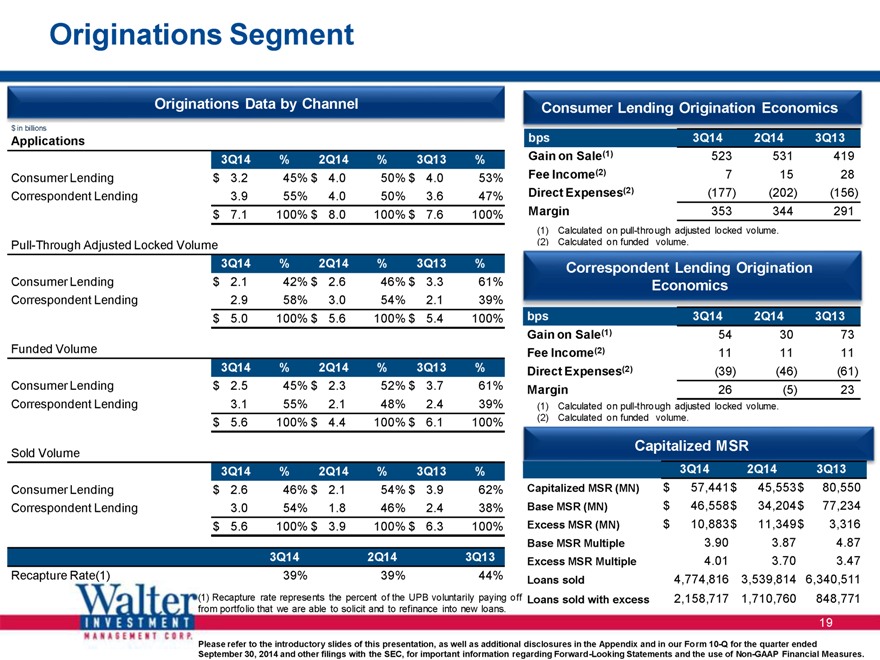
Originations Segment
Originations Data by Channel Consumer Lending Origination Economics
$ in billions
Applications bps 3Q14 2Q14 3Q13
3Q14 % 2Q14 % 3Q13 % Gain on Sale(1) 523 531 419
Consumer Lending $ 3.2 45% $ 4.0 50% $ 4.0 53% Fee Income(2) 7 15 28
Correspondent Lending 3.9 55% 4.0 50% 3.6 47% Direct Expenses(2) (177) (202) (156)
$ 7.1 100% $ 8.0 100% $ 7.6 100% Margin 353 344 291
(1) Calculated on pull-through adjusted locked volume.
Pull-Through Adjusted Locked Volume (2) Calculated on funded volume.
3Q14 % 2Q14 % 3Q13 % Correspondent Lending Origination
Consumer Lending $ 2.1 42% $ 2.6 46% $ 3.3 61% Economics
Correspondent Lending 2.9 58% 3.0 54% 2.1 39%
$ 5.0 100% $ 5.6 100% $ 5.4 100% bps 3Q14 2Q14 3Q13
Gain on Sale(1) 54 30 73
Funded Volume Fee Income(2) 11 11 11
3Q14 % 2Q14 % 3Q13 % Direct Expenses(2) (39) (46) (61)
Consumer Lending $ 2.5 45% $ 2.3 52% $ 3.7 61% Margin 26 (5) 23
Correspondent Lending 3.1 55% 2.1 48% 2.4 39% (1) Calculated on pull-through adjusted locked volume.
$ 5.6 100% $ 4.4 100% $ 6.1 100% (2) Calculated on funded volume.
Sold Volume Capitalized MSR
3Q14 % 2Q14 % 3Q13 % 3Q14 2Q14 3Q13
Consumer Lending $ 2.6 46% $ 2.1 54% $ 3.9 62% Capitalized MSR (MN) $ 57,441 $ 45,553$ 80,550
$ in thousands
Correspondent Lending 3.0 54% 1.8 46% 2.4 38% Base MSR (MN) $ 46,558 $ 34,204$ 77,234
$ 5.6 100% $ 3.9 100% $ 6.3 100% Excess MSR (MN) $ 10,883 $ 11,349$ 3,316
Base MSR Multiple 3.90 3.87 4.87
3Q14 2Q14 3Q13 Excess MSR Multiple 4.01 3.70 3.47
Recapture Rate(1) 39% 39% 44% Loans sold 4,774,816 3,539,814 6,340,511
(1) Recapture rate represents the percent of the UPB voluntarily paying off Loans sold with excess 2,158,717 1,710,760 848,771
from portfolio that we are able to solicit and to refinance into new loans.
Please refer to the introductory slides of this presentation, as well as additional disclosures in the Appendix and in our Form 10-Q for the quarter ended
September 30, 2014 and other filings with the SEC, for important information regarding Forward-Looking Statements and the use of Non-GAAP Financial Measures.
19
|
|
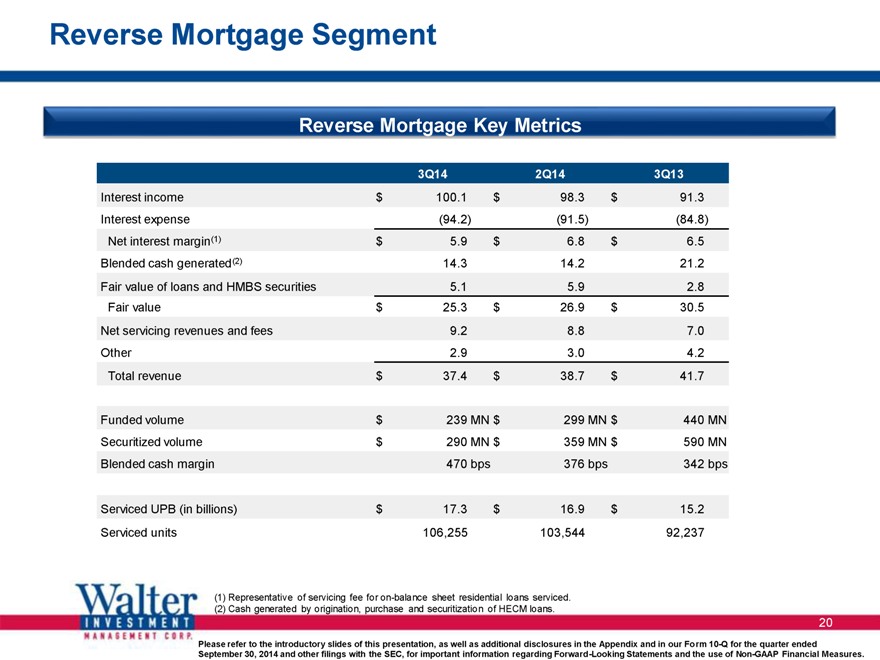
Reverse Mortgage Segment
Reverse Mortgage Key Metrics
3Q14 2Q14 3Q13
Interest income $ 100.1 $ 98.3 $ 91.3 Interest expense (94.2) (91.5) (84.8) Net interest margin(1) $ 5.9 $ 6.8 $ 6.5 Blended cash generated(2) 14.3 14.2 21.2 Fair value of loans and HMBS securities 5.1 5.9 2.8 Fair value $ 25.3 $ 26.9 $ 30.5 Net servicing revenues and fees 9.2 8.8 7.0 Other 2.9 3.0 4.2 Total revenue $ 37.4 $ 38.7 $ 41.7
Funded volume $ 239 MN $ 299 MN $ 440 MN Securitized volume $ 290 MN $ 359 MN $ 590 MN Blended cash margin 470 bps 376 bps 342 bps
Serviced UPB (in billions) $ 17.3 $ 16.9 $ 15.2 Serviced units 106,255 103,544 92,237
(1) Representative of servicing fee for on-balance sheet residential loans serviced.
(2) Cash generated by origination, purchase and securitization of HECM loans.
Please refer to the introductory slides of this presentation, as well as additional disclosures in the Appendix and in our Form 10-Q for the quarter ended
September 30, 2014 and other filings with the SEC, for important information regarding Forward-Looking Statements and the use of Non-GAAP Financial Measures.
20
|
|
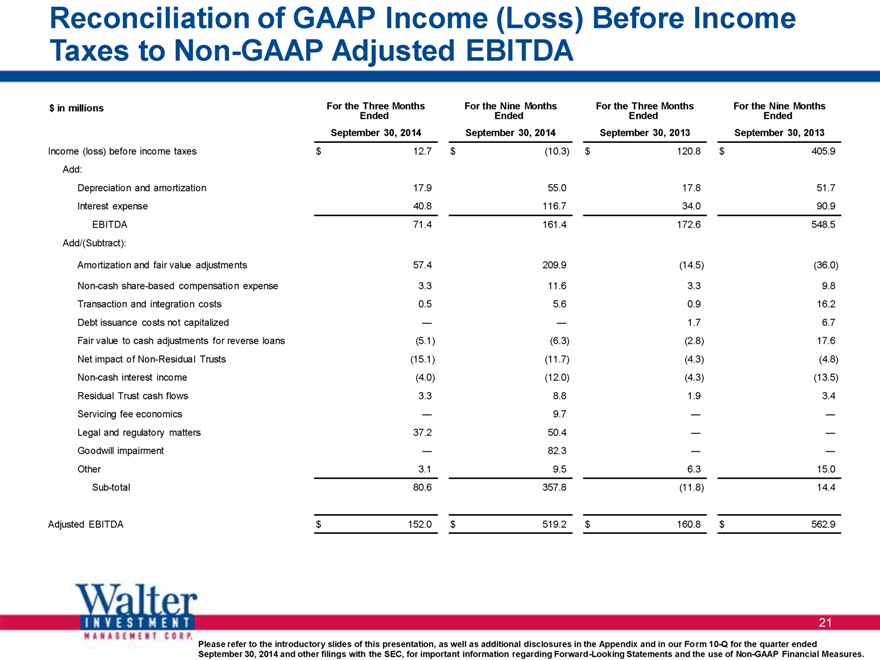
Reconciliation of GAAP Income (Loss) Before Income Taxes to Non-GAAP Adjusted EBITDA
$ in millions For the Three Months For the Nine Months For the Three Months For the Nine Months
Ended Ended Ended Ended
September 30, 2014 September 30, 2014 September 30, 2013 September 30, 2013
Income (loss) before income taxes $ 12.7 $ (10.3) $ 120.8 $ 405.9
Add:
Depreciation and amortization 17.9 55.0 17.8 51.7
Interest expense 40.8 116.7 34.0 90.9
EBITDA 71.4 161.4 172.6 548.5
Add/(Subtract):
Amortization and fair value adjustments 57.4 209.9 (14.5) (36.0)
Non-cash share-based compensation expense 3.3 11.6 3.3 9.8
Transaction and integration costs 0.5 5.6 0.9 16.2
Debt issuance costs not capitalized — — 1.7 6.7
Fair value to cash adjustments for reverse loans (5.1) (6.3) (2.8) 17.6
Net impact of Non-Residual Trusts (15.1) (11.7) (4.3) (4.8)
Non-cash interest income (4.0) (12.0) (4.3) (13.5)
Residual Trust cash flows 3.3 8.8 1.9 3.4
Servicing fee economics — 9.7 — —
Legal and regulatory matters 37.2 50.4 — —
Goodwill impairment — 82.3 — —
Other 3.1 9.5 6.3 15.0
Sub-total 80.6 357.8 (11.8) 14.4
Adjusted EBITDA $ 152.0 $ 519.2 $ 160.8 $ 562.9
Please refer to the introductory slides of this presentation, as well as additional disclosures in the Appendix and in our Form 10-Q for the quarter ended
September 30, 2014 and other filings with the SEC, for important information regarding Forward-Looking Statements and the use of Non-GAAP Financial Measures.
21
|
|
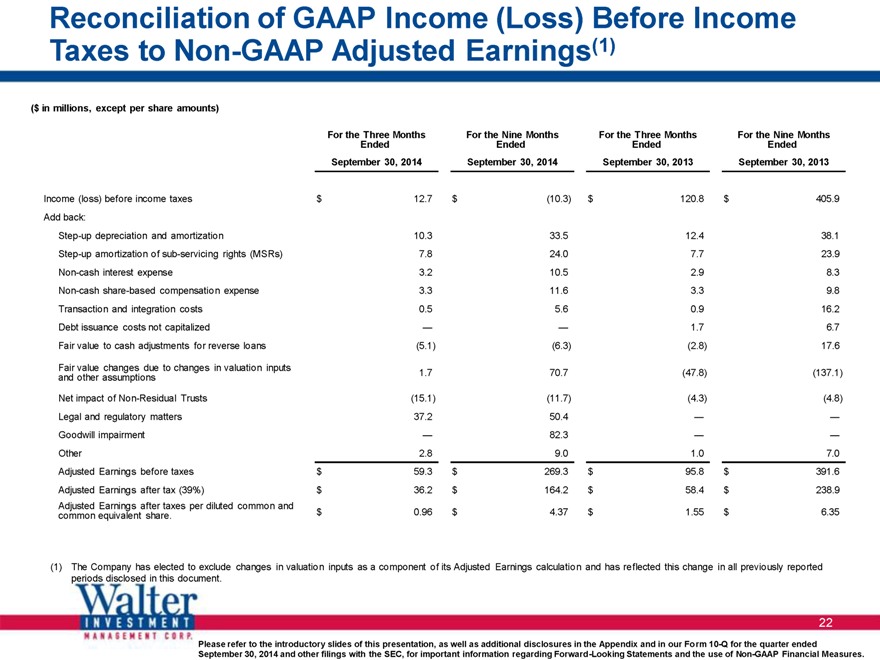
Reconciliation of GAAP Income (Loss) Before Income Taxes to Non-GAAP Adjusted Earnings(1)
($ in millions, except per share amounts)
For the Three Months For the Nine Months For the Three Months For the Nine Months
Ended Ended Ended Ended
September 30, 2014 September 30, 2014 September 30, 2013 September 30, 2013
Income (loss) before income taxes $ 12.7 $ (10.3) $ 120.8 $ 405.9
Add back:
Step-up depreciation and amortization 10.3 33.5 12.4 38.1
Step-up amortization of sub-servicing rights (MSRs) 7.8 24.0 7.7 23.9
Non-cash interest expense 3.2 10.5 2.9 8.3
Non-cash share-based compensation expense 3.3 11.6 3.3 9.8
Transaction and integration costs 0.5 5.6 0.9 16.2
Debt issuance costs not capitalized — — 1.7 6.7
Fair value to cash adjustments for reverse loans (5.1) (6.3) (2.8) 17.6
Fair value changes due to changes in valuation inputs 1.7 70.7 (47.8) (137.1)
and other assumptions
Net impact of Non-Residual Trusts (15.1) (11.7) (4.3) (4.8)
Legal and regulatory matters 37.2 50.4 — —
Goodwill impairment — 82.3 — —
Other 2.8 9.0 1.0 7.0
Adjusted Earnings before taxes $ 59.3 $ 269.3 $ 95.8 $ 391.6
Adjusted Earnings after tax (39%) $ 36.2 $ 164.2 $ 58.4 $ 238.9
Adjusted Earnings after taxes per diluted common and
common equivalent share. $ 0.96 $ 4.37 $ 1.55 $ 6.35
(1) The Company has elected to exclude changes in valuation inputs as a component of its Adjusted Earnings calculation and has reflected this change in all previously reported periods disclosed in this document.
Please refer to the introductory slides of this presentation, as well as additional disclosures in the Appendix and in our Form 10-Q for the quarter ended
September 30, 2014 and other filings with the SEC, for important information regarding Forward-Looking Statements and the use of Non-GAAP Financial Measures.
22
|
|
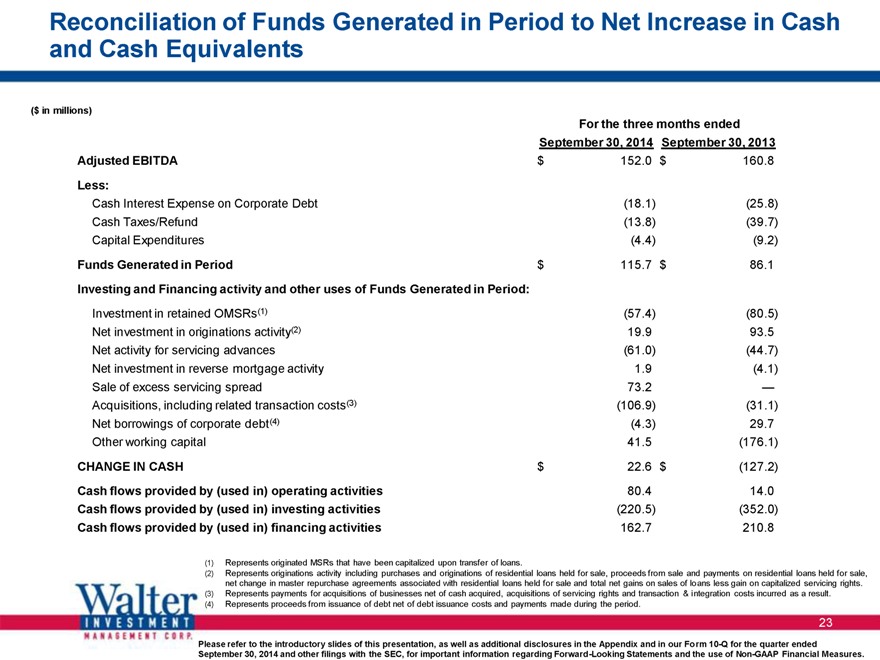
Reconciliation of Funds Generated in Period to Net Increase in Cash and Cash Equivalents
($ in millions)
For the three months ended
September 30, 2014 September 30, 2013
Adjusted EBITDA $ 152.0 $ 160.8
Less:
Cash Interest Expense on Corporate Debt (18.1) (25.8)
Cash Taxes/Refund (13.8) (39.7)
Capital Expenditures (4.4) (9.2)
Funds Generated in Period $ 115.7 $ 86.1
Investing and Financing activity and other uses of Funds Generated in Period:
Investment in retained OMSRs (1) (57.4) (80.5)
Net investment in originations activity (2) 19.9 93.5
Net activity for servicing advances (61.0) (44.7)
Net investment in reverse mortgage activity 1.9 (4.1)
Sale of excess servicing spread 73.2 —
Acquisitions, including related transaction costs (3) (106.9) (31.1)
Net borrowings of corporate debt(4) (4.3) 29.7
Other working capital 41.5 (176.1)
CHANGE IN CASH $ 22.6 $ (127.2)
Cash flows provided by (used in) operating activities 80.4 14.0
Cash flows provided by (used in) investing activities (220.5) (352.0)
Cash flows provided by (used in) financing activities 162.7 210.8
(1) Represents originated MSRs that have been capitalized upon transfer of loans.
(2) Represents originations activity including purchases and originations of residential loans held for sale, proceeds from sale and payments on residential loans held for sale, net change in master repurchase agreements associated with residential loans held for sale and total net gains on sales of loans less gain on capitalized servicing rights.
(3) Represents payments for acquisitions of businesses net of cash acquired, acquisitions of servicing rights and transaction & integration costs incurred as a result.
(4) Represents proceeds from issuance of debt net of debt issuance costs and payments made during the period.
Please refer to the introductory slides of this presentation, as well as additional disclosures in the Appendix and in our Form 10-Q for the quarter ended
September 30, 2014 and other filings with the SEC, for important information regarding Forward-Looking Statements and the use of Non-GAAP Financial Measures.
23
|
|
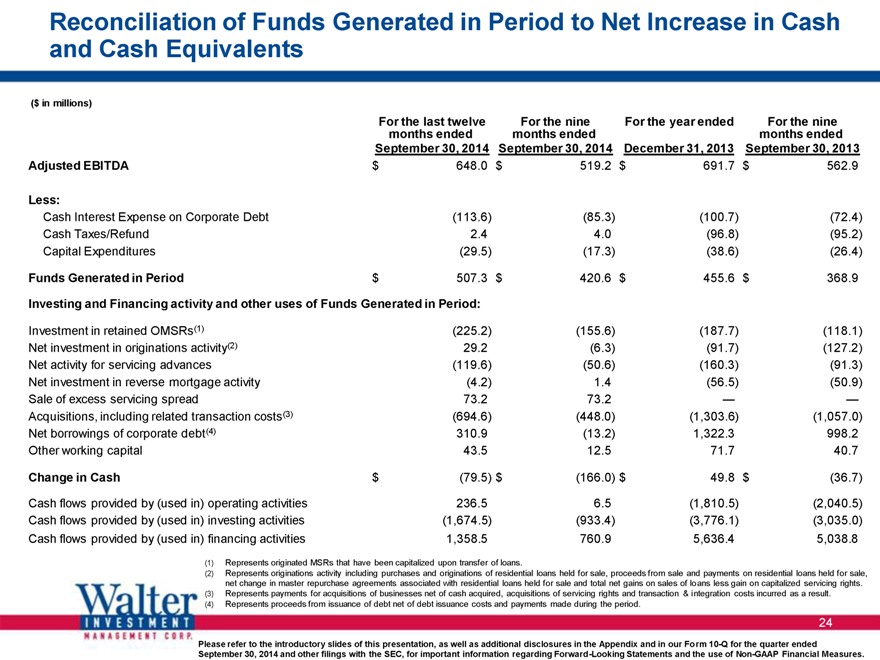
Reconciliation of Funds Generated in Period to Net Increase in Cash and Cash Equivalents
($ in millions)
For the last twelve For the nine For the year ended For the nine
months ended months ended months ended
September 30, 2014 September 30, 2014 December 31, 2013 September 30, 2013
Adjusted EBITDA $ 648.0 $ 519.2 $ 691.7 $ 562.9
Less:
Cash Interest Expense on Corporate Debt (113.6) (85.3) (100.7) (72.4)
Cash Taxes/Refund 2.4 4.0 (96.8) (95.2)
Capital Expenditures (29.5) (17.3) (38.6) (26.4)
Funds Generated in Period $ 507.3 $ 420.6 $ 455.6 $ 368.9
Investing and Financing activity and other uses of Funds Generated in Period:
Investment in retained OMSRs (1) (225.2) (155.6) (187.7) (118.1)
Net investment in originations activity (2) 29.2 (6.3) (91.7) (127.2)
Net activity for servicing advances (119.6) (50.6) (160.3) (91.3)
Net investment in reverse mortgage activity (4.2) 1.4 (56.5) (50.9)
Sale of excess servicing spread 73.2 73.2 — —
Acquisitions, including related transaction costs (3) (694.6) (448.0) (1,303.6) (1,057.0)
Net borrowings of corporate debt (4) 310.9 (13.2) 1,322.3 998.2
Other working capital 43.5 12.5 71.7 40.7
Change in Cash $ (79.5) $ (166.0) $ 49.8 $ (36.7)
Cash flows provided by (used in) operating activities 236.5 6.5 (1,810.5) (2,040.5)
Cash flows provided by (used in) investing activities (1,674.5) (933.4) (3,776.1) (3,035.0)
Cash flows provided by (used in) financing activities 1,358.5 760.9 5,636.4 5,038.8
(1) Represents originated MSRs that have been capitalized upon transfer of loans.
(2) Represents originations activity including purchases and originations of residential loans held for sale, proceeds from sale and payments on residential loans held for sale, net change in master repurchase agreements associated with residential loans held for sale and total net gains on sales of loans less gain on capitalized servicing rights.
(3) Represents payments for acquisitions of businesses net of cash acquired, acquisitions of servicing rights and transaction & integration costs incurred as a result.
(4) Represents proceeds from issuance of debt net of debt issuance costs and payments made during the period.
Please refer to the introductory slides of this presentation, as well as additional disclosures in the Appendix and in our Fo rm 10-Q for the quarter ended
September 30, 2014 and other filings with the SEC, for important information regarding Forward -Looking Statements and the use of Non-GAAP Financial Measures.
24