Attached files
| file | filename |
|---|---|
| 8-K - 8-K - VALIDUS HOLDINGS LTD | a8-kcoverpagex20140930inve.htm |
| EX-99.1 - CONSOLIDATED VALIDUS INVESTOR PRESENTATION - VALIDUS HOLDINGS LTD | q32014investorpresentati.htm |
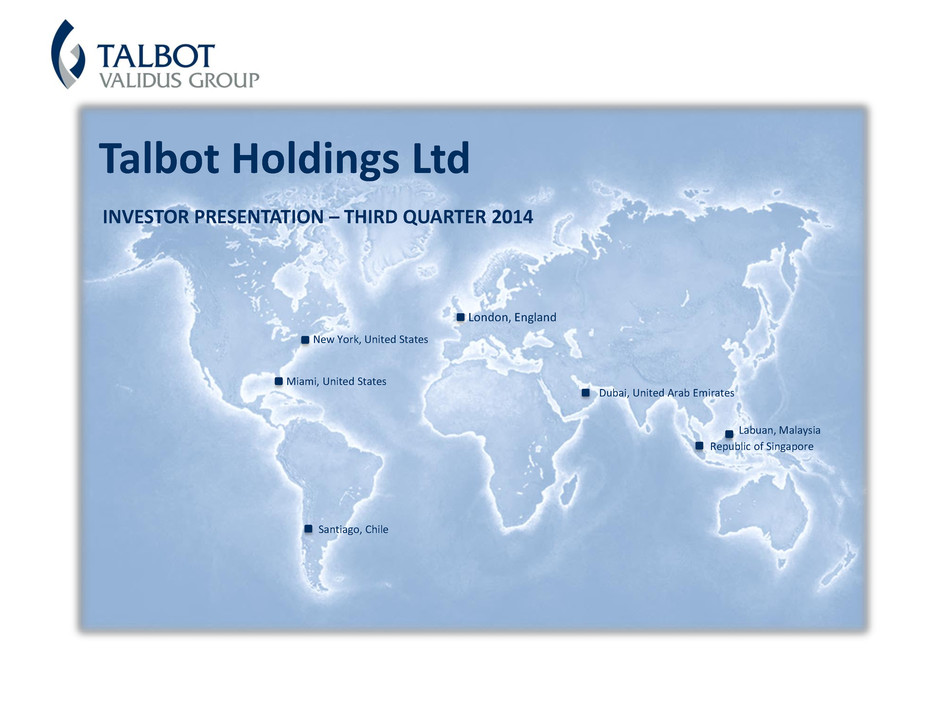
New York, United States Miami, United States Santiago, Chile London, England Dubai, United Arab Emirates Republic of Singapore Labuan, Malaysia INVESTOR PRESENTATION – THIRD QUARTER 2014 Talbot Holdings Ltd
This presentation may include forward-looking statements, both with respect to us and our industry, that reflect our current views with respect to future events and financial performance. Statements that include the words “expect,” “intend,” “plan,” “believe,” “project,” “anticipate,” “will,” “may” and similar statements of a future or forward-looking nature identify forward-looking statements. All forward-looking statements address matters that involve risks and uncertainties. Accordingly, there are or will be important factors that could cause actual results to differ materially from those indicated in such statements and, therefore, you should not place undue reliance on any such statements. We believe that these factors include, but are not limited to, the following: 1) unpredictability and severity of catastrophic events; 2) rating agency actions; 3) adequacy of our risk management and loss limitation methods; 4) cyclicality of demand and pricing in the insurance and reinsurance markets; 5) statutory or regulatory developments including tax policy, reinsurance and other regulatory matters; 6) our ability to implement its business strategy during “soft” as well as “hard” markets; 7) adequacy of our loss reserves; 8) continued availability of capital and financing; 9) retention of key personnel; 10) competition; 11) potential loss of business from one or more major insurance or reinsurance brokers; 12) our ability to implement, successfully and on a timely basis, complex infrastructure, distribution capabilities, systems, procedures and internal controls, and to develop accurate actuarial data to support the business and regulatory and reporting requirements; 13) general economic and market conditions (including inflation, volatility in the credit and capital markets, interest rates and foreign currency exchange rates); 14) the integration of businesses we may acquire or new business ventures we may start; 15) the effect on our investment portfolios of changing financial market conditions including inflation, interest rates, liquidity and other factors; 16) acts of terrorism or outbreak of war; and 17) availability of reinsurance and retrocessional coverage, as well as management’s response to any of the aforementioned factors. The foregoing review of important factors should not be construed as exhaustive and should be read in conjunction with the other cautionary statements that are included herein and elsewhere, including the Risk Factors included in Validus Holdings, Ltd.'s most recent reports on Form 10-K and Form 10-Q and other documents on file with the Securities and Exchange Commission. Any forward-looking statements made in this presentation are qualified by these cautionary statements, and there can be no assurance that the actual results or developments anticipated by us will be realized or, even if substantially realized, that they will have the expected consequences to, or effects on, us or our business or operations. We undertake no obligation to update publicly or revise any forward-looking statement, whether as a result of new information, future developments or otherwise. Cautionary Note Regarding Forward-looking Statements 2
Talbot Underwriting Ltd • One of the core operating businesses of Validus Holdings, Ltd. – Founded in 2002 – Acquired by Validus in 2007 • Significant competitive position - The 11th largest Syndicate at Lloyd’s • Outstanding management team led by CEO Rupert Atkin – 30 years of experience in Lloyd’s – Chairman of the Lloyd’s Market Association, Member of Council of Lloyd’s – Deputy Chairman of Lloyd’s since February 2014 • Meaningful financial contribution and other benefits to Validus – Talbot has provided 24% of Validus net income from 2007-2013 – Lloyd’s platform allows for significant capital leverage – Lloyd’s provides global licensing for Validus expansion – London is a significant location for (re)insurance talent 1) Lloyd’s Syndicate size is measured by gross premium written, as taken from Lloyd’s 2013 Annual Report. 2) 24% of net income is calculated based on the proportion of Talbot Segment net income over total Group net income as disclosed in the respective Investor Financial Supplements. 3
Talbot Underwriting Ltd – Underwriting Philosophy • Focus is on short tail business with significant market position in targeted classes – The ability to lead business is important • Talbot is a Lloyd’s market leader in the War and Terror, Energy and Marine classes of business • Maintain a balanced and diversified portfolio within targeted classes • Underwriting portfolio protected by a comprehensive reinsurance program • By design, Talbot is underweight the following classes: – Casualty – Casualty Treaty – Property Treaty • Strategically placed offices in international hubs – New York, Miami, Santiago, Dubai, Labuan and Singapore 4
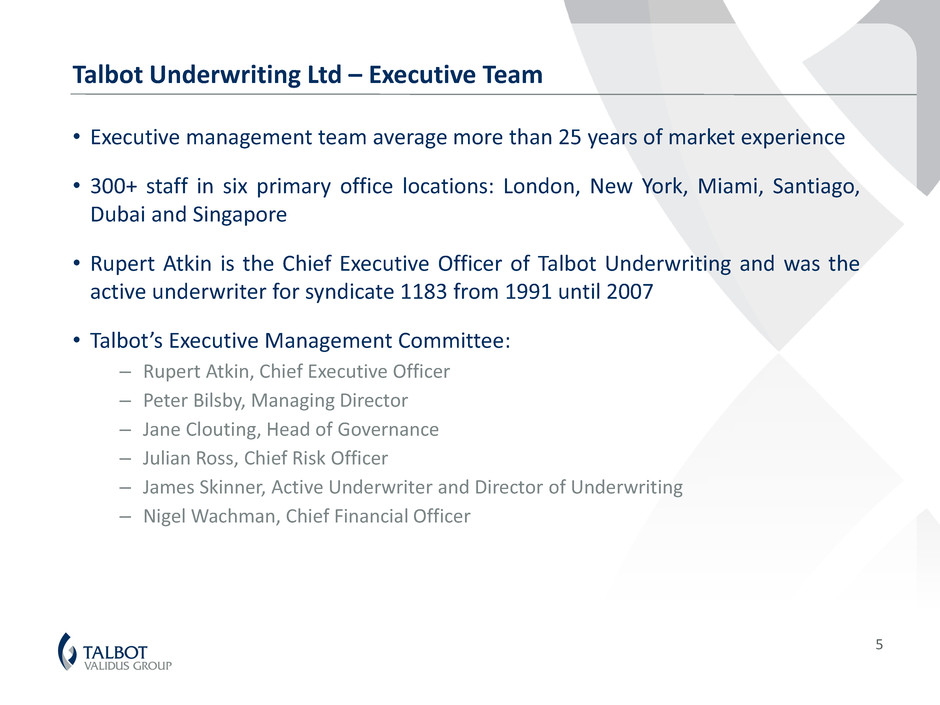
Talbot Underwriting Ltd – Executive Team • Executive management team average more than 25 years of market experience • 300+ staff in six primary office locations: London, New York, Miami, Santiago, Dubai and Singapore • Rupert Atkin is the Chief Executive Officer of Talbot Underwriting and was the active underwriter for syndicate 1183 from 1991 until 2007 • Talbot’s Executive Management Committee: – Rupert Atkin, Chief Executive Officer – Peter Bilsby, Managing Director – Jane Clouting, Head of Governance – Julian Ross, Chief Risk Officer – James Skinner, Active Underwriter and Director of Underwriting – Nigel Wachman, Chief Financial Officer 5
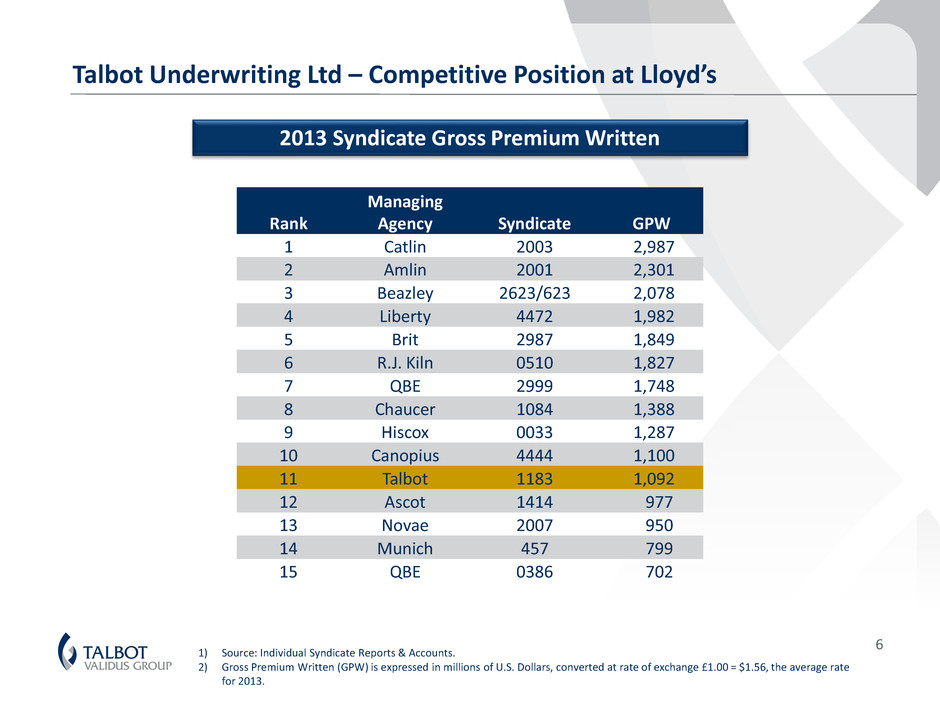
Talbot Underwriting Ltd – Competitive Position at Lloyd’s 6 1) Source: Individual Syndicate Reports & Accounts. 2) Gross Premium Written (GPW) is expressed in millions of U.S. Dollars, converted at rate of exchange £1.00 = $1.56, the average rate for 2013. 2013 Syndicate Gross Premium Written Rank Managing Agency Syndicate GPW 1 Catlin 2003 2,987 2 Amlin 2001 2,301 3 Beazley 2623/623 2,078 4 Liberty 4472 1,982 5 Brit 2987 1,849 6 R.J. Kiln 0510 1,827 7 QBE 2999 1,748 8 Chaucer 1084 1,388 9 Hiscox 0033 1,287 10 Canopius 4444 1,100 11 Talbot 1183 1,092 12 Ascot 1414 977 13 Novae 2007 950 14 Munich 457 799 15 QBE 0386 702
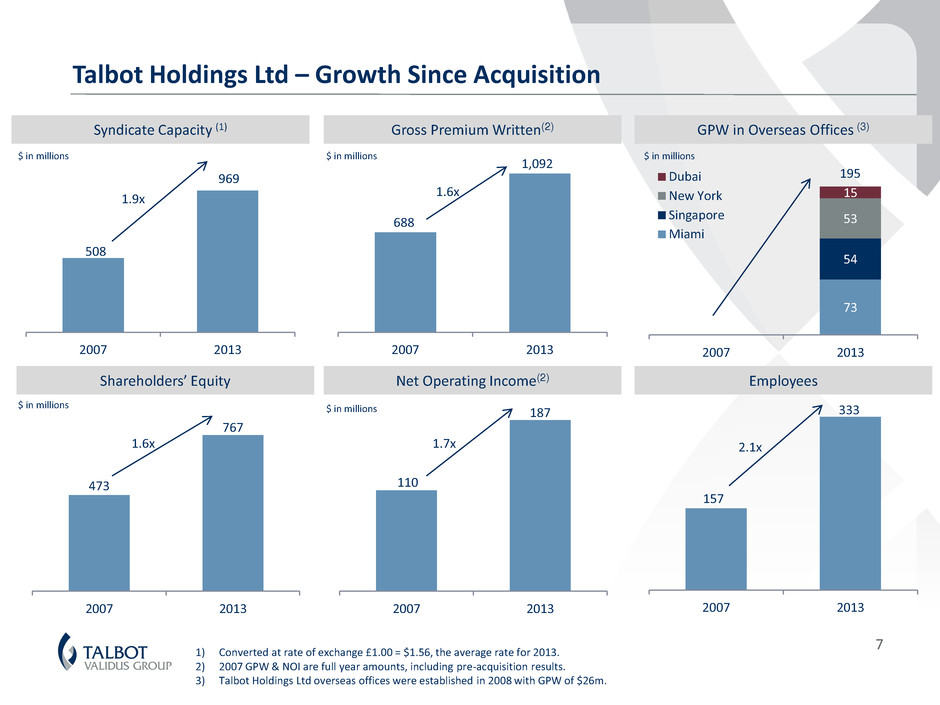
73 54 53 15 2007 2013 Dubai New York Singapore Miami 110 187 2007 2013 688 1,092 2007 2013 157 333 2007 2013 473 767 2007 2013 508 969 2007 2013 Talbot Holdings Ltd – Growth Since Acquisition 7 Employees 2.1x Shareholders’ Equity $ in millions 1.6x Net Operating Income(2) $ in millions 1.7x Gross Premium Written(2) $ in millions 1.6x Syndicate Capacity (1) 1.9x $ in millions GPW in Overseas Offices (3) $ in millions 1) Converted at rate of exchange £1.00 = $1.56, the average rate for 2013. 2) 2007 GPW & NOI are full year amounts, including pre-acquisition results. 3) Talbot Holdings Ltd overseas offices were established in 2008 with GPW of $26m. 195
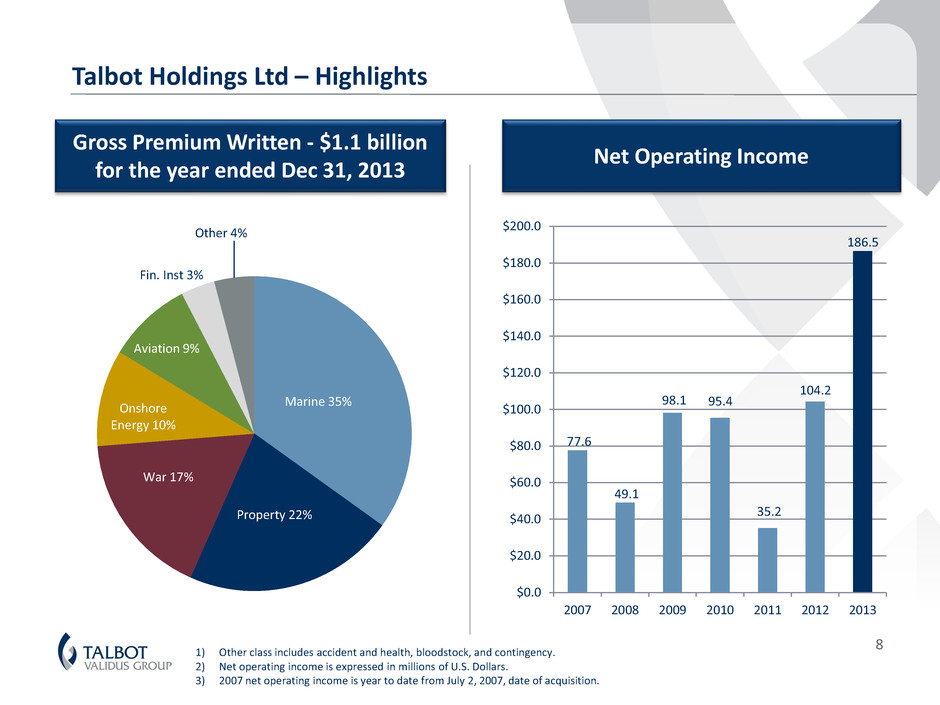
Gross Premium Written - $1.1 billion for the year ended Dec 31, 2013 Net Operating Income 1) Other class includes accident and health, bloodstock, and contingency. 2) Net operating income is expressed in millions of U.S. Dollars. 3) 2007 net operating income is year to date from July 2, 2007, date of acquisition. Marine 35% Property 22% War 17% Onshore Energy 10% Aviation 9% Fin. Inst 3% Other 4% 77.6 49.1 98.1 95.4 35.2 104.2 186.5 $0.0 $20.0 $40.0 $60.0 $80.0 $100.0 $120.0 $140.0 $160.0 $180.0 $200.0 2007 2008 2009 2010 2011 2012 2013 Talbot Holdings Ltd – Highlights 8
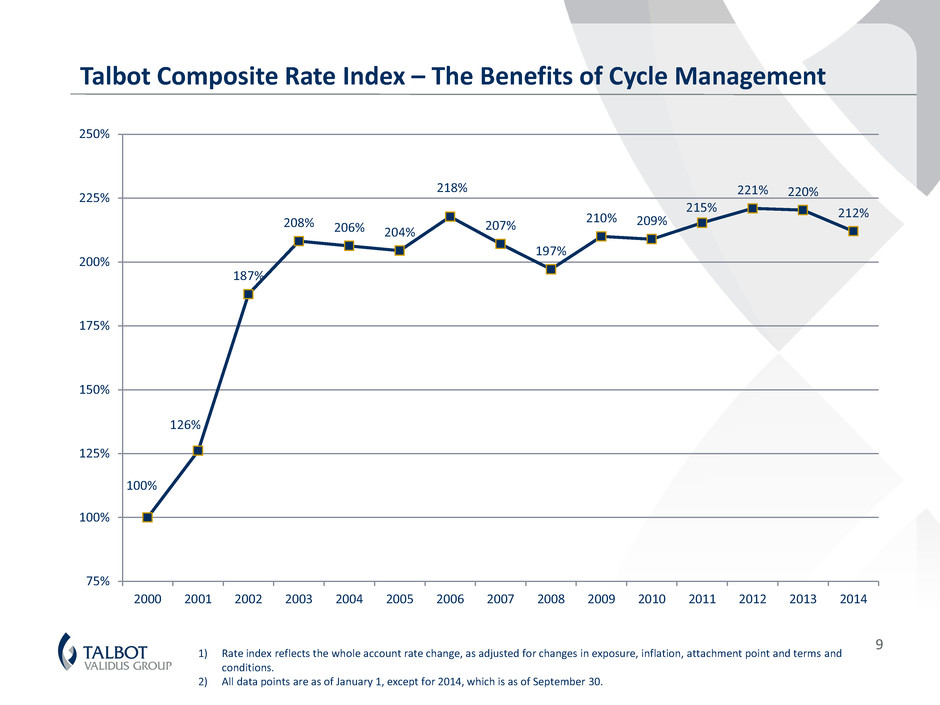
9 Talbot Composite Rate Index – The Benefits of Cycle Management 1) Rate index reflects the whole account rate change, as adjusted for changes in exposure, inflation, attachment point and terms and conditions. 2) All data points are as of January 1, except for 2014, which is as of September 30. 100% 126% 187% 208% 206% 204% 218% 207% 197% 210% 209% 215% 221% 220% 212% 75% 100% 125% 150% 175% 200% 225% 250% 2000 2001 2002 2003 2004 2005 2006 2007 2008 2009 2010 2011 2012 2013 2014
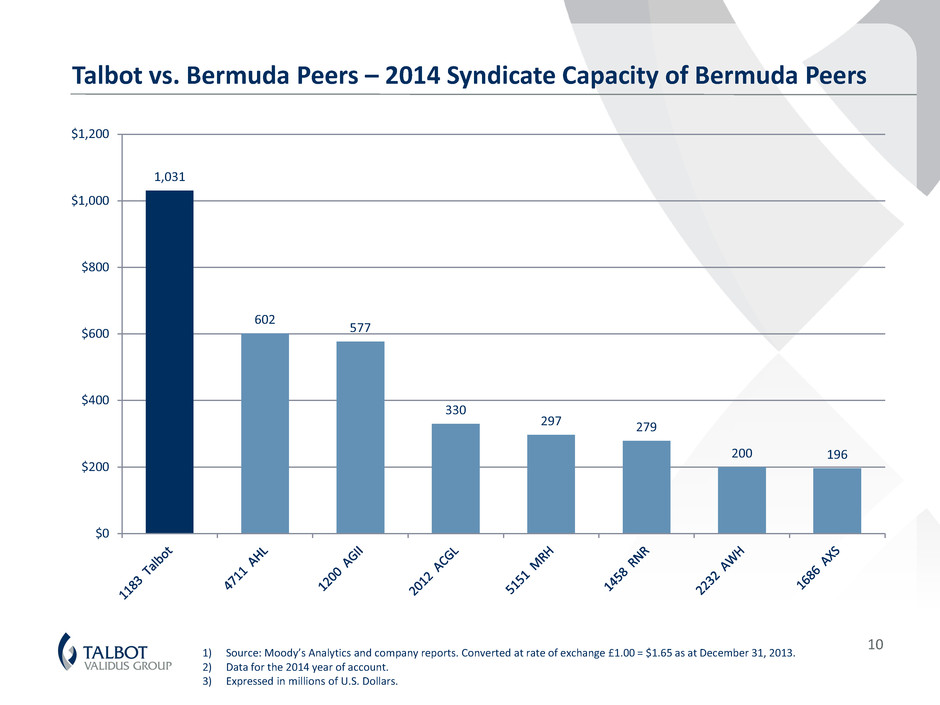
10 Talbot vs. Bermuda Peers – 2014 Syndicate Capacity of Bermuda Peers 1,031 602 577 330 297 279 200 196 $0 $200 $400 $600 $800 $1,000 $1,200 1) Source: Moody’s Analytics and company reports. Converted at rate of exchange £1.00 = $1.65 as at December 31, 2013. 2) Data for the 2014 year of account. 3) Expressed in millions of U.S. Dollars.
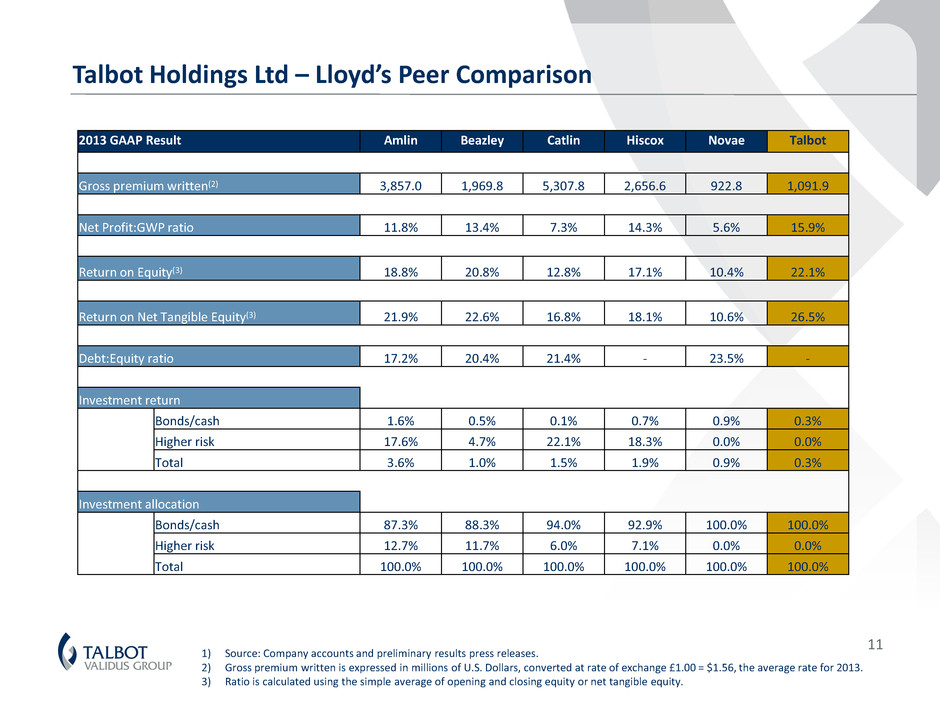
Talbot Holdings Ltd – Lloyd’s Peer Comparison 11 1) Source: Company accounts and preliminary results press releases. 2) Gross premium written is expressed in millions of U.S. Dollars, converted at rate of exchange £1.00 = $1.56, the average rate for 2013. 3) Ratio is calculated using the simple average of opening and closing equity or net tangible equity. 2013 GAAP Result Amlin Beazley Catlin Hiscox Novae Talbot Gross premium written(2) 3,857.0 1,969.8 5,307.8 2,656.6 922.8 1,091.9 Net Profit:GWP ratio 11.8% 13.4% 7.3% 14.3% 5.6% 15.9% Return on Equity(3) 18.8% 20.8% 12.8% 17.1% 10.4% 22.1% Return on Net Tangible Equity(3) 21.9% 22.6% 16.8% 18.1% 10.6% 26.5% Debt:Equity ratio 17.2% 20.4% 21.4% - 23.5% - Investment return Bonds/cash 1.6% 0.5% 0.1% 0.7% 0.9% 0.3% Higher risk 17.6% 4.7% 22.1% 18.3% 0.0% 0.0% Total 3.6% 1.0% 1.5% 1.9% 0.9% 0.3% Investment allocation Bonds/cash 87.3% 88.3% 94.0% 92.9% 100.0% 100.0% Higher risk 12.7% 11.7% 6.0% 7.1% 0.0% 0.0% Total 100.0% 100.0% 100.0% 100.0% 100.0% 100.0%
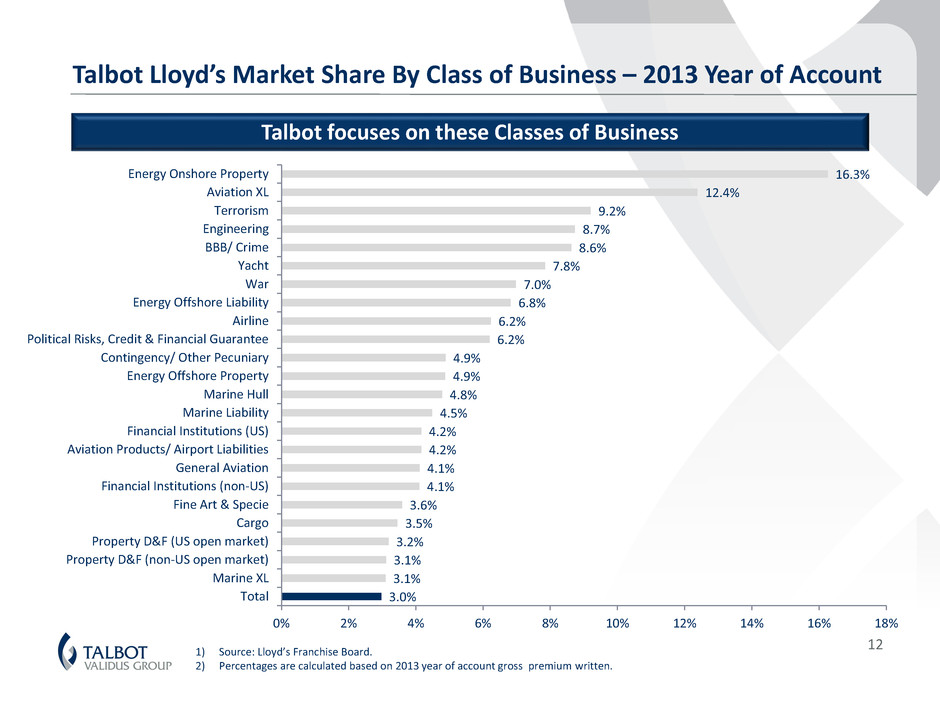
Talbot Lloyd’s Market Share By Class of Business – 2013 Year of Account 12 1) Source: Lloyd’s Franchise Board. 2) Percentages are calculated based on 2013 year of account gross premium written. Talbot focuses on these Classes of Business 3.0% 3.1% 3.1% 3.2% 3.5% 3.6% 4.1% 4.1% 4.2% 4.2% 4.5% 4.8% 4.9% 4.9% 6.2% 6.2% 6.8% 7.0% 7.8% 8.6% 8.7% 9.2% 12.4% 16.3% 0% 2% 4% 6% 8% 10% 12% 14% 16% 18% Total Marine XL Property D&F (non-US open market) Property D&F (US open market) Cargo Fine Art & Specie Financial Institutions (non-US) General Aviation Aviation Products/ Airport Liabilities Financial Institutions (US) Marine Liability Marine Hull Energy Offshore Property Contingency/ Other Pecuniary Political Risks, Credit & Financial Guarantee Airline Energy Offshore Liability War Yacht BBB/ Crime Engineering Terrorism Aviation XL Energy Onshore Property
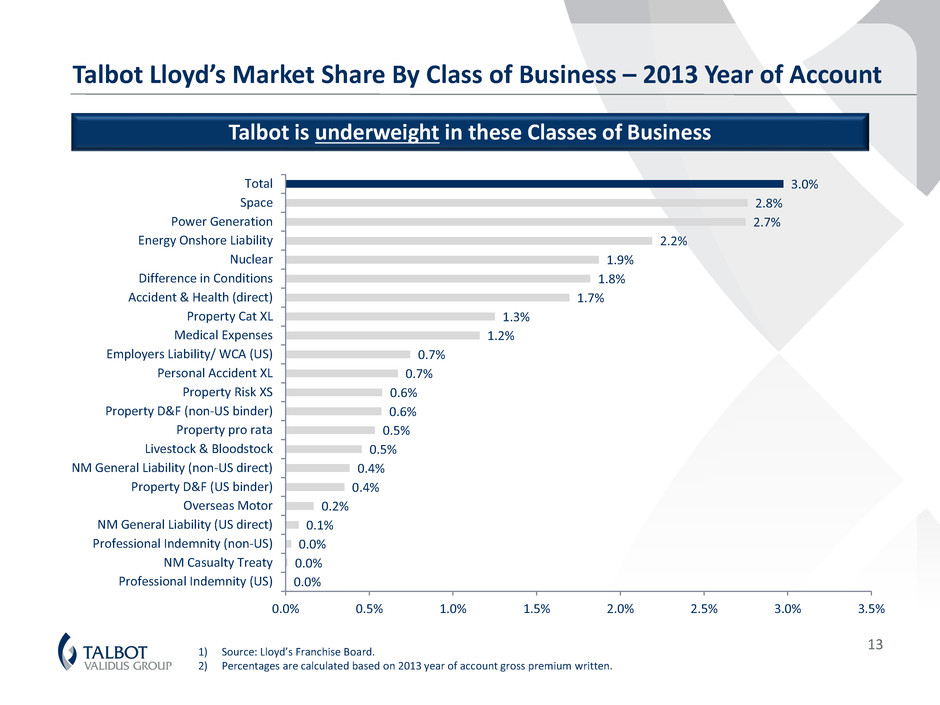
Talbot Lloyd’s Market Share By Class of Business – 2013 Year of Account 13 Talbot is underweight in these Classes of Business 0.0% 0.0% 0.0% 0.1% 0.2% 0.4% 0.4% 0.5% 0.5% 0.6% 0.6% 0.7% 0.7% 1.2% 1.3% 1.7% 1.8% 1.9% 2.2% 2.7% 2.8% 3.0% 0.0% 0.5% 1.0% 1.5% 2.0% 2.5% 3.0% 3.5% Professional Indemnity (US) NM Casualty Treaty Professional Indemnity (non-US) NM General Liability (US direct) Overseas Motor Property D&F (US binder) NM General Liability (non-US direct) Livestock & Bloodstock Property pro rata Property D&F (non-US binder) Property Risk XS Personal Accident XL Employers Liability/ WCA (US) Medical Expenses Property Cat XL Accident & Health (direct) Difference in Conditions Nuclear Energy Onshore Liability Power Generation Space Total 1) Source: Lloyd’s Franchise Board. 2) Percentages are calculated based on 2013 year of account gross premium written.
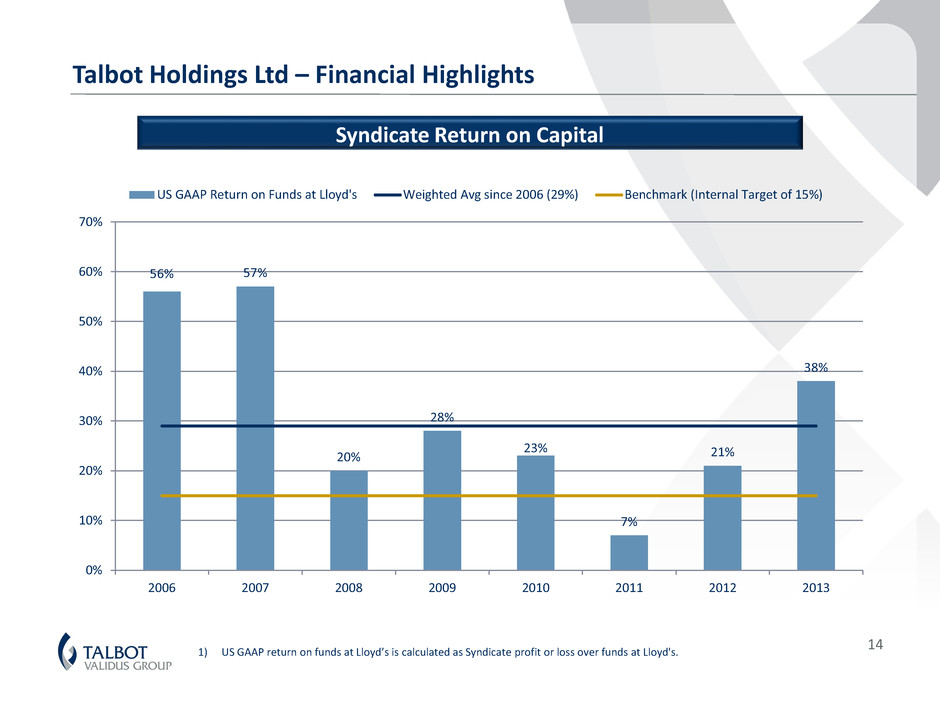
Talbot Holdings Ltd – Financial Highlights Syndicate Return on Capital 14 56% 57% 20% 28% 23% 7% 21% 38% 0% 10% 20% 30% 40% 50% 60% 70% 2006 2007 2008 2009 2010 2011 2012 2013 US GAAP Return on Funds at Lloyd's Weighted Avg since 2006 (29%) Benchmark (Internal Target of 15%) 1) US GAAP return on funds at Lloyd’s is calculated as Syndicate profit or loss over funds at Lloyd's.
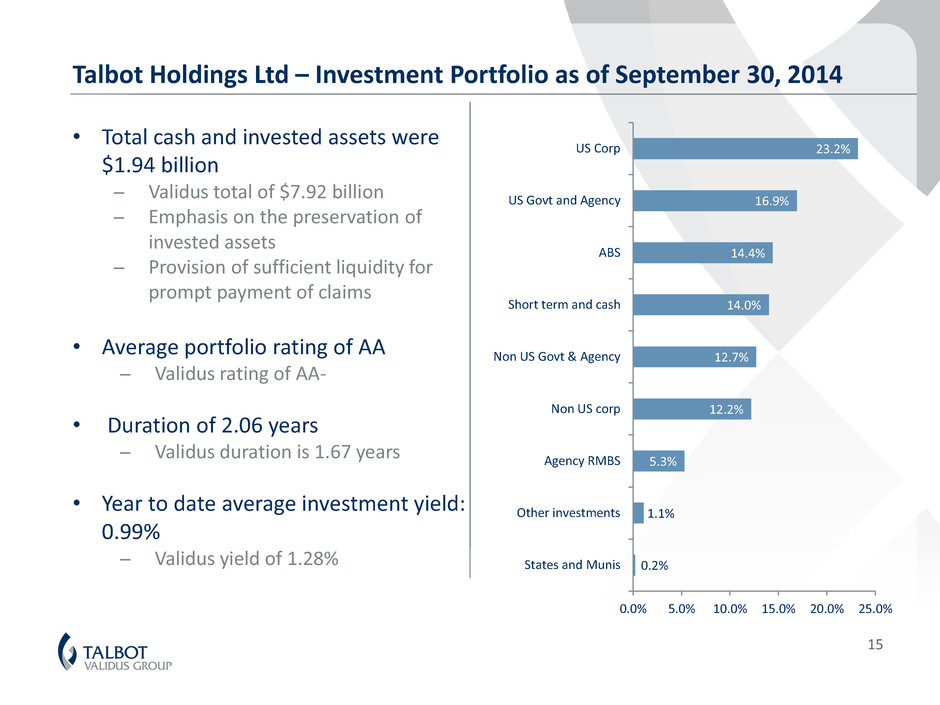
Talbot Holdings Ltd – Investment Portfolio as of September 30, 2014 • Total cash and invested assets were $1.94 billion ̶ Validus total of $7.92 billion ̶ Emphasis on the preservation of invested assets ̶ Provision of sufficient liquidity for prompt payment of claims • Average portfolio rating of AA ̶ Validus rating of AA- • Duration of 2.06 years ̶ Validus duration is 1.67 years • Year to date average investment yield: 0.99% ̶ Validus yield of 1.28% 15 0.2% 1.1% 5.3% 12.2% 12.7% 14.0% 14.4% 16.9% 23.2% 0.0% 5.0% 10.0% 15.0% 20.0% 25.0% States and Munis Other investments Agency RMBS Non US corp Non US Govt & Agency Short term and cash ABS US Govt and Agency US Corp
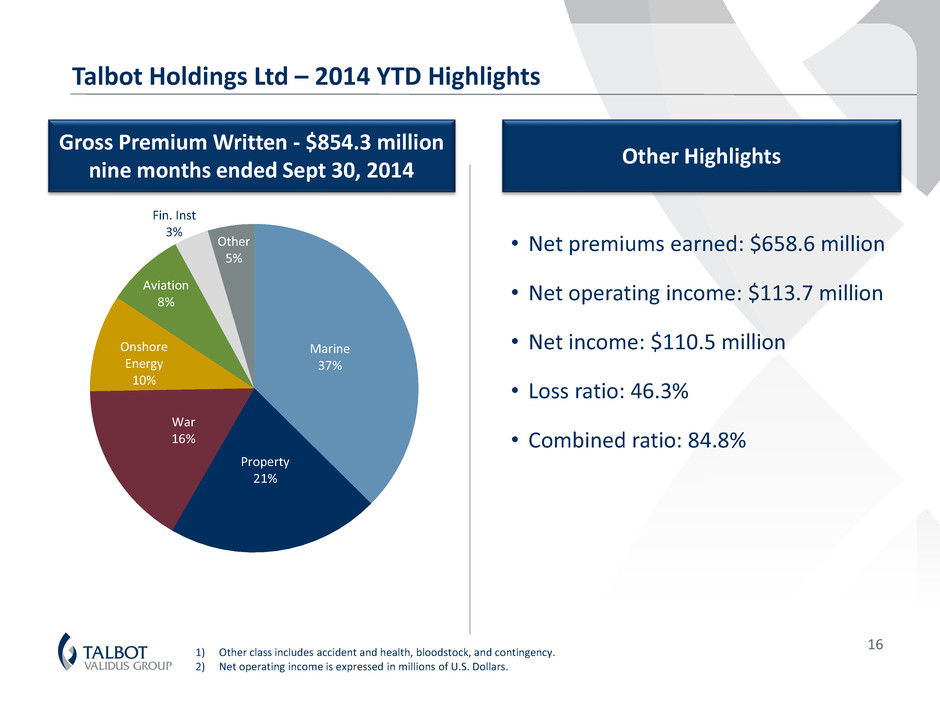
Talbot Holdings Ltd – 2014 YTD Highlights Gross Premium Written - $854.3 million nine months ended Sept 30, 2014 Other Highlights • Net premiums earned: $658.6 million • Net operating income: $113.7 million • Net income: $110.5 million • Loss ratio: 46.3% • Combined ratio: 84.8% 16 1) Other class includes accident and health, bloodstock, and contingency. 2) Net operating income is expressed in millions of U.S. Dollars. Marine 37% Property 21% War 16% Onshore Energy 10% Aviation 8% Fin. Inst 3% Other 5%
Talbot Holdings Ltd – Significant Contribution To Validus • Meaningful financial contribution – Talbot has provided $642 million of Validus net income from 2007-2013 • Provides diversification between reinsurance and insurance with a shared focus on short tail classes of business • Global licensing for Validus expansion efforts – insurance and reinsurance • Increased profile for Validus within the London and international insurance market • London is a significant location for insurance industry talent 1) Net income is calculated based on the proportion of total net income of Validus Reinsurance, Ltd. and Talbot Holdings Ltd and does not include any intercompany eliminations. 17
• A leading Lloyd’s business with a track record of success • Experienced senior management team and strong supporting staff • Diversified short-tail business mix atypical for Lloyd’s • Prudent management of insurance and operational risks, capital and loss reserves • Well managed line sizes and an extensive reinsurance program • Mutually beneficial relationship with parent company, Validus Holdings, Ltd. 18 Talbot Underwriting Ltd – Well Positioned for 2014 and Beyond
In presenting the Company’s results herein, management has included and discussed certain schedules containing underwriting income (loss), net operating income (loss) available (attributable) to Validus, managed gross premiums written, annualized return on average equity and diluted book value per common share that are not calculated under standards or rules that comprise U.S. GAAP. Such measures are referred to as non-GAAP. Non-GAAP measures may be defined or calculated differently by other companies. We believe that these measures are important to investors and other interested parties. These measures should not be viewed as a substitute for those determined in accordance with U.S. GAAP. The underwriting results of an insurance or reinsurance company are often measured by reference to its underwriting income because underwriting income indicates the performance of the company’s core underwriting function. Underwriting income is reconciled to net income by the addition or subtraction of net investment income, finance expenses, transaction expenses, net realized gains (losses) on investments, net unrealized gains (losses) on investments, income (loss) from investment affiliates and foreign exchange gains (losses). Net operating income (loss) available (attributable) to Validus is calculated based on net income (loss) available (attributable) to Validus excluding net realized gains (losses), net unrealized gains (losses) on investments, income (loss) from investment affiliates, gains (losses) arising from translation of non-US$ denominated balances and non-recurring items. Net income is the most directly comparable GAAP measure. Net operating income focuses on the underlying fundamentals of our operations without the influence of realized gains (losses) from the sale of investments, net unrealized gains (losses) on investments, translation of non-US$ currencies and non-recurring items. Realized gains (losses) from the sale of investments are driven by the timing of the disposition of investments, not by our operating performance. Gains (losses) arising from translation of non-US$ denominated balances are unrelated to our underlying business. Investors should not rely on the information set forth in this presentation when considering an investment in the Company. The information contained in this presentation has not been audited nor has it been subject to independent verification. The estimates set forth herein speak only as of the date of this presentation and the Company undertakes no obligation to update or revise such information to reflect the occurrence of future events. The events presented reflect a specific set of prescribed calculations and do not necessarily reflect all events that may impact the Company. 19 Notes on Non-GAAP and Other Financial and Exposure Measures

Address: 60 Threadneedle Street London EC2R 8HP England Telephone: 020 7550 3500 Email: investor.relations@validusholdings.com For more information on our company, products and management team please visit our website at: www.validusholdings.com
