Attached files
| file | filename |
|---|---|
| 8-K - FORM 8-K - US BANCORP \DE\ | d817996d8k.htm |
| Exhibit 99.1
|
Exhibit 99.1
BancAnalysts Association of Boston Conference
EXTENDING THE ADVANTAGE
Andrew Cecere
Vice Chairman, Chief Financial Officer
November 6, 2014
| 1 |
|
|
|
EXTENDING THE ADVANTAGE
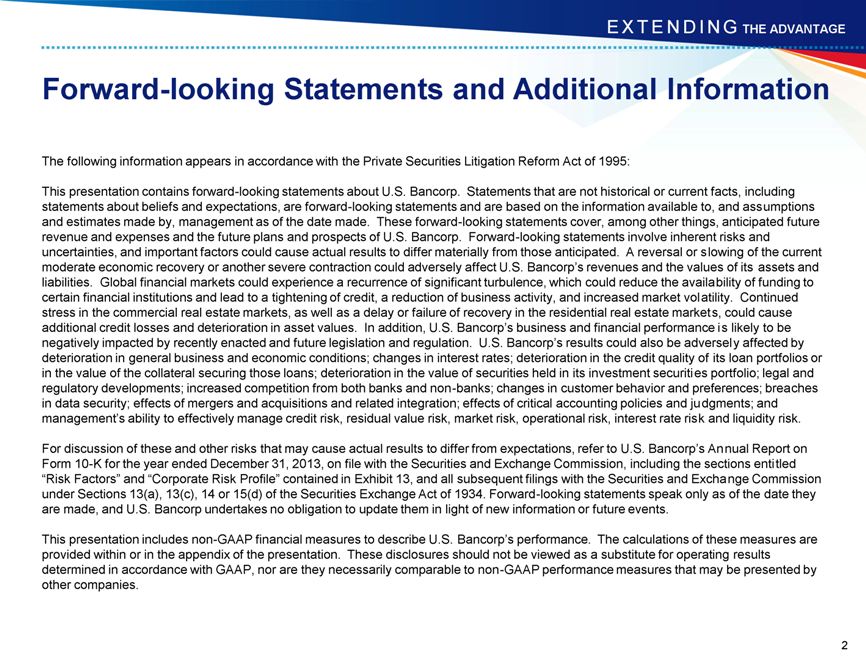
Forward-looking Statements and Additional Information
The following information appears in accordance with the Private Securities Litigation Reform Act of 1995:
This presentation contains forward-looking statements about U.S. Bancorp. Statements that are not historical or current facts, including statements about beliefs and expectations, are forward-looking statements and are based on the information available to, and assumptions and estimates made by, management as of the date made. These forward-looking statements cover, among other things, anticipated future revenue and expenses and the future plans and prospects of U.S. Bancorp. Forward-looking statements involve inherent risks and uncertainties, and important factors could cause actual results to differ materially from those anticipated. A reversal or slowing of the current moderate economic recovery or another severe contraction could adversely affect U.S. Bancorp’s revenues and the values of its assets and liabilities. Global financial markets could experience a recurrence of significant turbulence, which could reduce the availability of funding to certain financial institutions and lead to a tightening of credit, a reduction of business activity, and increased market volatility. Continued stress in the commercial real estate markets, as well as a delay or failure of recovery in the residential real estate markets, could cause additional credit losses and deterioration in asset values. In addition, U.S. Bancorp’s business and financial performance is likely to be negatively impacted by recently enacted and future legislation and regulation. U.S. Bancorp’s results could also be adversely affected by deterioration in general business and economic conditions; changes in interest rates; deterioration in the credit quality of its loan portfolios or in the value of the collateral securing those loans; deterioration in the value of securities held in its investment securities portfolio; legal and regulatory developments; increased competition from both banks and non-banks; changes in customer behavior and preferences; breaches in data security; effects of mergers and acquisitions and related integration; effects of critical accounting policies and judgments; and management’s ability to effectively manage credit risk, residual value risk, market risk, operational risk, interest rate risk and liquidity risk.
For discussion of these and other risks that may cause actual results to differ from expectations, refer to U.S. Bancorp’s Annual Report on
Form 10-K for the year ended December 31, 2013, on file with the Securities and Exchange Commission, including the sections entitled
“Risk Factors” and “Corporate Risk Profile” contained in Exhibit 13, and all subsequent filings with the Securities and Exchange Commission under Sections 13(a), 13(c), 14 or 15(d) of the Securities Exchange Act of 1934. Forward-looking statements speak only as of the date they are made, and U.S. Bancorp undertakes no obligation to update them in light of new information or future events.
This presentation includes non-GAAP financial measures to describe U.S. Bancorp’s performance. The calculations of these measures are provided within or in the appendix of the presentation. These disclosures should not be viewed as a substitute for operating results determined in accordance with GAAP, nor are they necessarily comparable to non-GAAP performance measures that may be presented by other companies.
| 2 |
|
|
|
EXTENDING THE ADVANTAGE
Agenda
Overview
Financial Management
Capital Management
Deposit Growth
4Q14 Update
Long-term Goals
| 3 |
|
|
|
EXTENDING THE ADVANTAGE
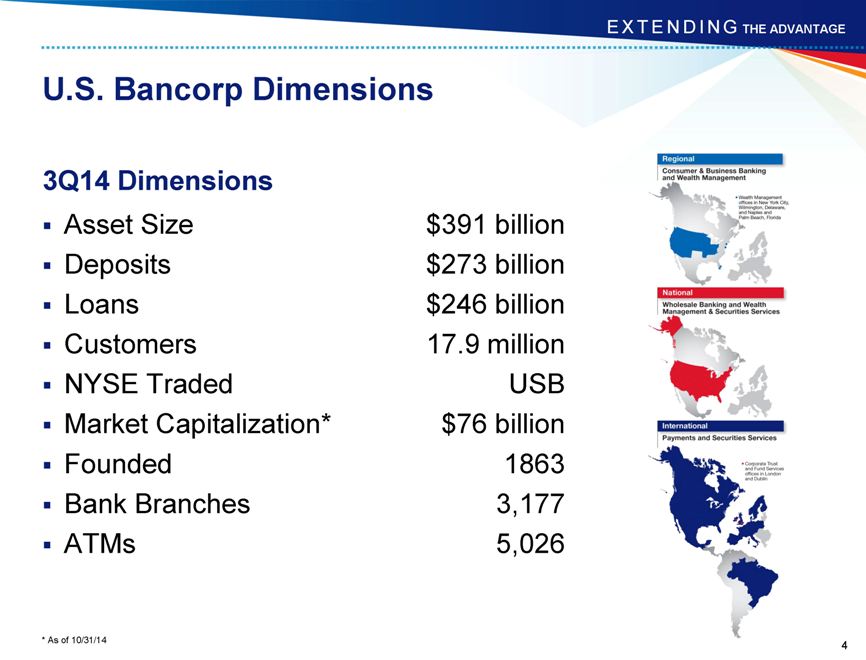
U.S. Bancorp Dimensions
3Q14 Dimensions
Asset Size $391 billion
Deposits $273 billion
Loans $246 billion
Customers 17.9 million
NYSE Traded USB
Market Capitalization* $76 billion
Founded 1863
Bank Branches 3,177
ATMs 5,026
| * |
|
As of 10/31/14 |
| 4 |
|
|
|
EXTENDING THE ADVANTAGE
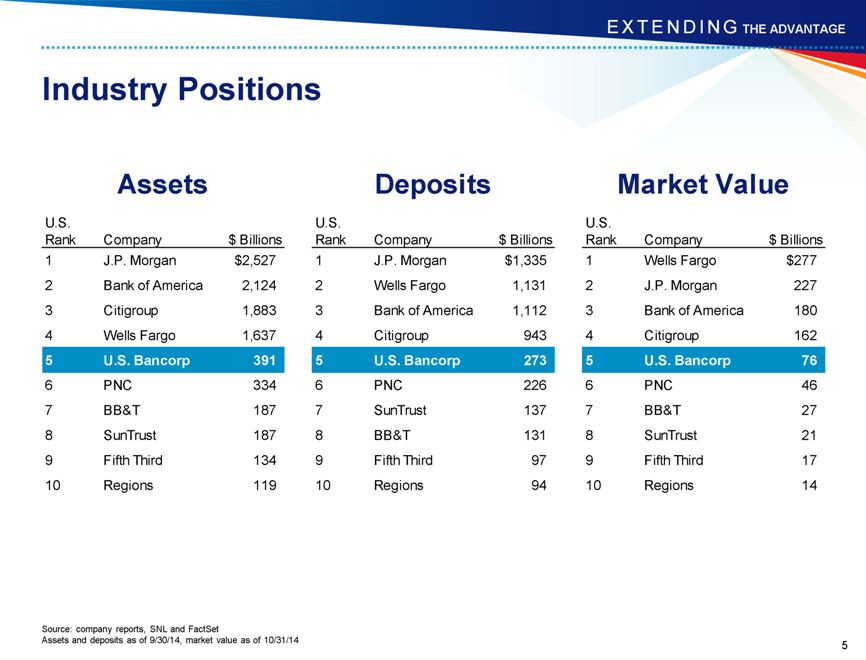
Industry Positions
Assets Deposits Market Value
U.S. U.S. U.S.
Rank Company $ Billions Rank Company $ Billions Rank Company $ Billions
| 1 |
|
J.P. Morgan $2,527 1 J.P. Morgan $1,335 1 Wells Fargo $277 |
| 2 |
|
Bank of America 2,124 2 Wells Fargo 1,131 2 J.P. Morgan 227 |
| 3 |
|
Citigroup 1,883 3 Bank of America 1,112 3 Bank of America 180 |
| 4 |
|
Wells Fargo 1,637 4 Citigroup 943 4 Citigroup 162 |
| 5 |
|
U.S. Bancorp 391 5 U.S. Bancorp 273 5 U.S. Bancorp 76 |
| 6 |
|
PNC 334 6 PNC 226 6 PNC 46 |
| 7 |
|
BB&T 187 7 SunTrust 137 7 BB&T 27 |
| 8 |
|
SunTrust 187 8 BB&T 131 8 SunTrust 21 |
9 Fifth Third 134 9 Fifth Third 97 9 Fifth Third 17
10 Regions 119 10 Regions 94 10 Regions 14
Source: company reports, SNL and FactSet
Assets and deposits as of 9/30/14, market value as of 10/31/14
| 5 |
|
|
|
EXTENDING THE ADVANTAGE
Agenda
Overview
Financial Management
Capital Management
Deposit Growth
4Q14 Update
Long-term Goals
| 6 |
|
|
|
EXTENDING THE ADVANTAGE
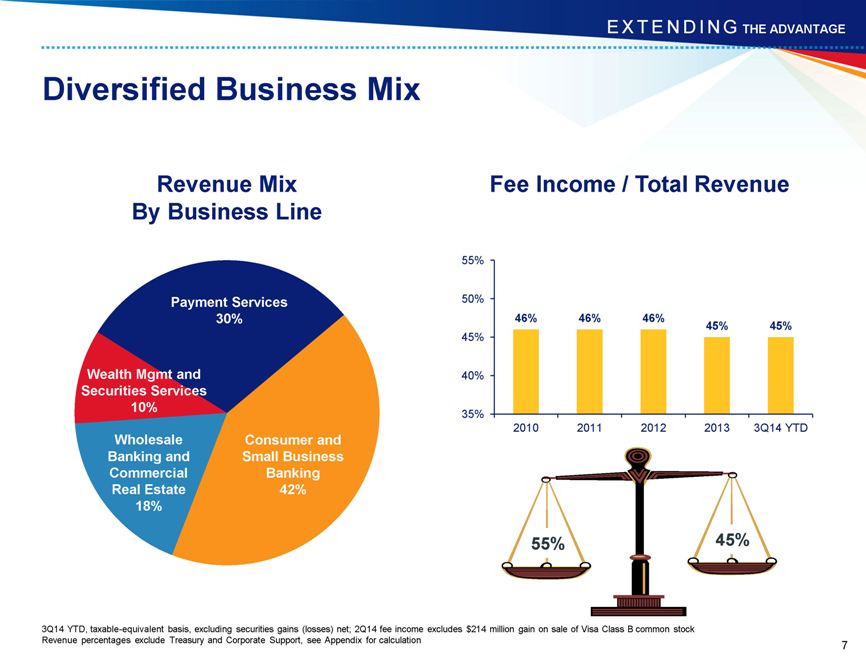
Diversified Business Mix
Revenue Mix
By Business Line
Payment Services
30%
Wealth Mgmt and
Securities Services
10%
Wholesale Consumer and
Banking and Small Business
Commercial Banking
Real Estate 42%
18%
Fee Income / Total Revenue
55%
50%
46% 46% 46%
45% 45%
45%
40%
35%
2010 2011 2012 2013 3Q14 YTD
55% 45%
3Q14 YTD, taxable-equivalent basis, excluding securities gains (losses) net; 2Q14 fee income excludes $214 million gain on sale of Visa Class B common stock Revenue percentages exclude Treasury and Corporate Support, see Appendix for calculation
| 7 |
|
|
|
EXTENDING THE ADVANTAGE
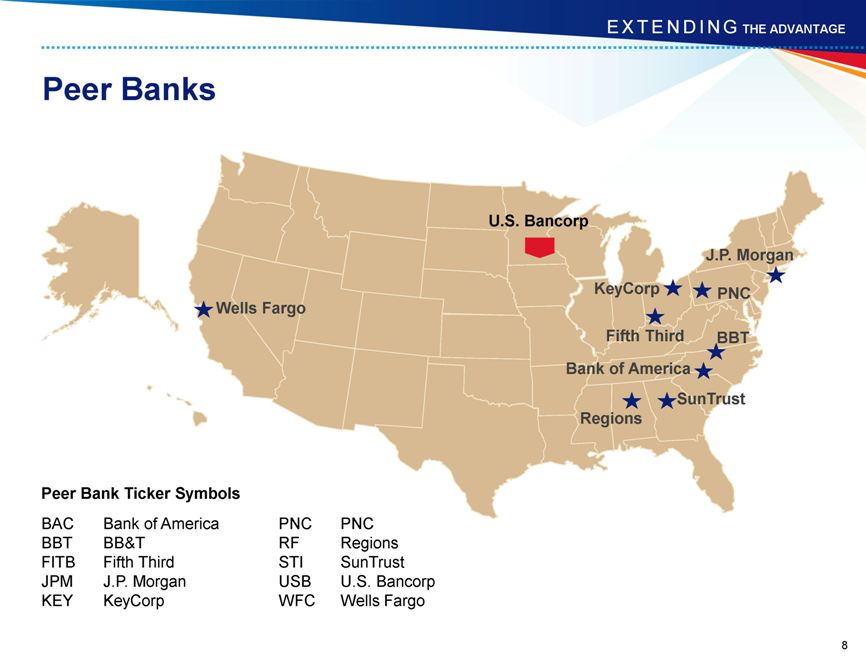
Peer Banks
U.S. Bancorp
J.P. Morgan
KeyCorp PNC
Wells Fargo
Fifth Third BBT
Bank of America
SunTrust
Regions
Peer Bank Ticker Symbols
BAC Bank of America PNC PNC
BBT BB&T RF Regions
FITB Fifth Third STI SunTrust
JPM J.P. Morgan USB U.S. Bancorp
KEY KeyCorp WFC Wells Fargo
| 8 |
|
|
|
EXTENDING THE ADVANTAGE
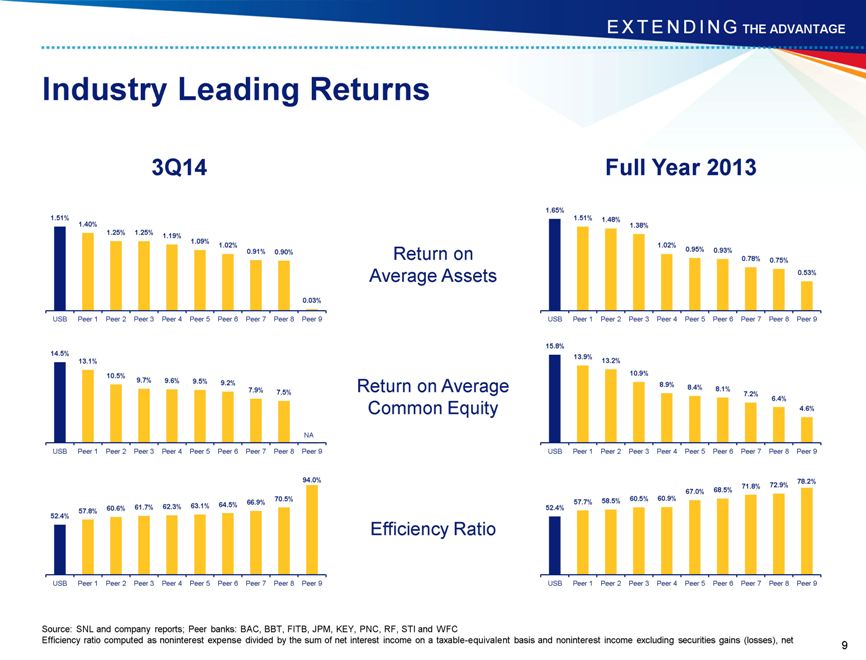
Industry Leading Returns
3Q14
1.51%
1.40%
1.25% 1.25% 1.19%
1.09% 1.02%
0.91% 0.90%
0.03%
USB Peer 1 Peer 2 Peer 3 Peer 4 Peer 5 Peer 6 Peer 7 Peer 8 Peer 9
14.5%
13.1%
10.5%
9.7% 9.6% 9.5% 9.2%
7.9% 7.5%
NA
USB Peer 1 Peer 2 Peer 3 Peer 4 Peer 5 Peer 6 Peer 7 Peer 8 Peer 9
94.0%
70.5%
57.8% 60.6% 61.7% 62.3% 63.1% 64.5% 66.9%
52.4%
USB Peer 1 Peer 2 Peer 3 Peer 4 Peer 5 Peer 6 Peer 7 Peer 8 Peer 9
Return on Average Assets
Return on Average Common Equity
Efficiency Ratio
Full Year 2013
1.65%
1.51% 1.48%
1.38%
1.02% 0.95% 0.93%
0.78% 0.75%
0.53%
USB Peer 1 Peer 2 Peer 3 Peer 4 Peer 5 Peer 6 Peer 7 Peer 8 Peer 9
15.8%
13.9% 13.2%
10.9%
8.9% 8.4% 8.1%
7.2% 6.4%
4.6%
USB Peer 1 Peer 2 Peer 3 Peer 4 Peer 5 Peer 6 Peer 7 Peer 8 Peer 9
78.2%
67.0% 68.5% 71.8% 72.9%
57.7% 58.5% 60.5% 60.9%
52.4%
USB Peer 1 Peer 2 Peer 3 Peer 4 Peer 5 Peer 6 Peer 7 Peer 8 Peer 9
Source: SNL and company reports; Peer banks: BAC, BBT, FITB, JPM, KEY, PNC, RF, STI and WFC
Efficiency ratio computed as noninterest expense divided by the sum of net interest income on a taxable-equivalent basis and noninterest income excluding securities gains (losses), net
9
|
|
EXTENDING THE ADVANTAGE
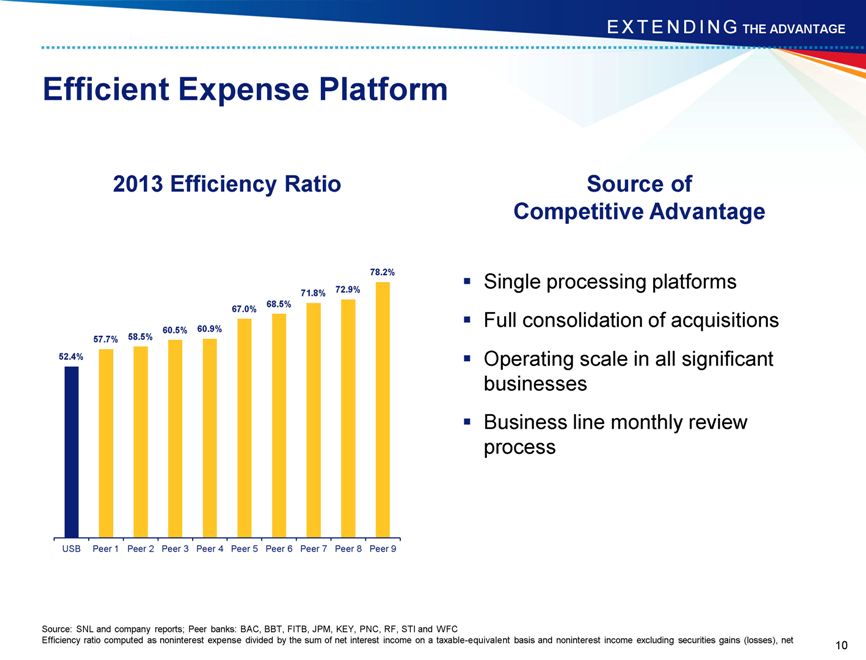
Efficient Expense Platform
2013 Efficiency Ratio
78.2%
71.8% 72.9%
67.0% 68.5%
60.5% 60.9%
57.7% 58.5%
52.4%
USB Peer 1 Peer 2 Peer 3 Peer 4 Peer 5 Peer 6 Peer 7 Peer 8 Peer 9
Source of Competitive Advantage
Single processing platforms
Full consolidation of acquisitions
Operating scale in all significant businesses Business line monthly review process
Source: SNL and company reports; Peer banks: BAC, BBT, FITB, JPM, KEY, PNC, RF, STI and WFC
Efficiency ratio computed as noninterest expense divided by the sum of net interest income on a taxable-equivalent basis and noninterest income excluding securities gains (losses), net
10
|
|
EXTENDING THE ADVANTAGE
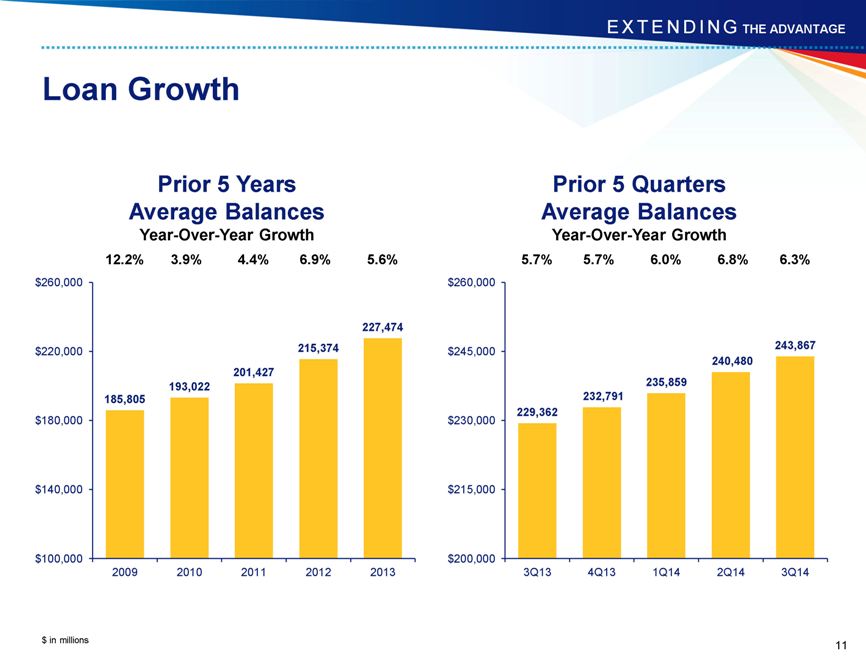
Loan Growth
Prior 5 Years
Average Balances
Year-Over-Year Growth
12.2% 3.9% 4.4% 6.9% 5.6%
$260,000
227,474
$220,000 215,374
201,427
193,022
185,805
$180,000
$140,000
$100,000
2009 2010 2011 2012 2013
Prior 5 Quarters
Average Balances
Year-Over-Year Growth
5.7% 5.7% 6.0% 6.8% 6.3%
$260,000
$245,000 243,867
240,480
235,859
232,791
229,362
$230,000
$215,000
$200,000
3Q13 4Q13 1Q14 2Q14 3Q14
$ in millions
11
|
|
EXTENDING THE ADVANTAGE
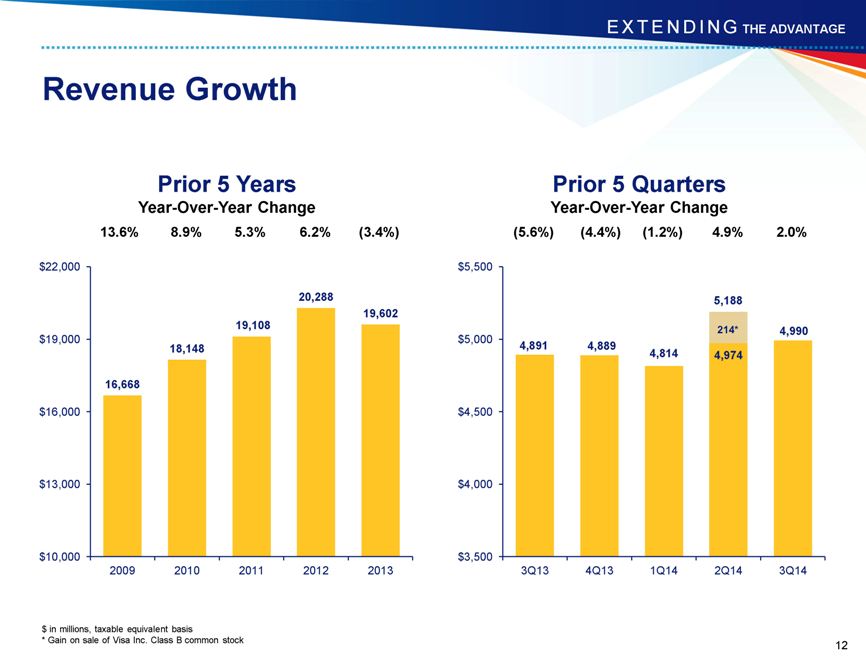
Revenue Growth
Prior 5 Years
Year-Over-Year Change
13.6% 8.9% 5.3% 6.2% (3.4%)
$22,000
20,288
19,602
19,108
$19,000
18,148
16,668
$16,000
$13,000
$10,000
2009 2010 2011 2012 2013
Prior 5 Quarters
Year-Over-Year Change
(5.6%) (4.4%) (1.2%) 4.9% 2.0%
$5,500
5,188
214* 4,990
$5,000 4,891 4,889
4,814 4,974
$4,500
$4,000
$3,500
3Q13 4Q13 1Q14 2Q14 3Q14
$ in millions, taxable equivalent basis
| * |
|
Gain on sale of Visa Inc. Class B common stock |
12
|
|
EXTENDING THE ADVANTAGE
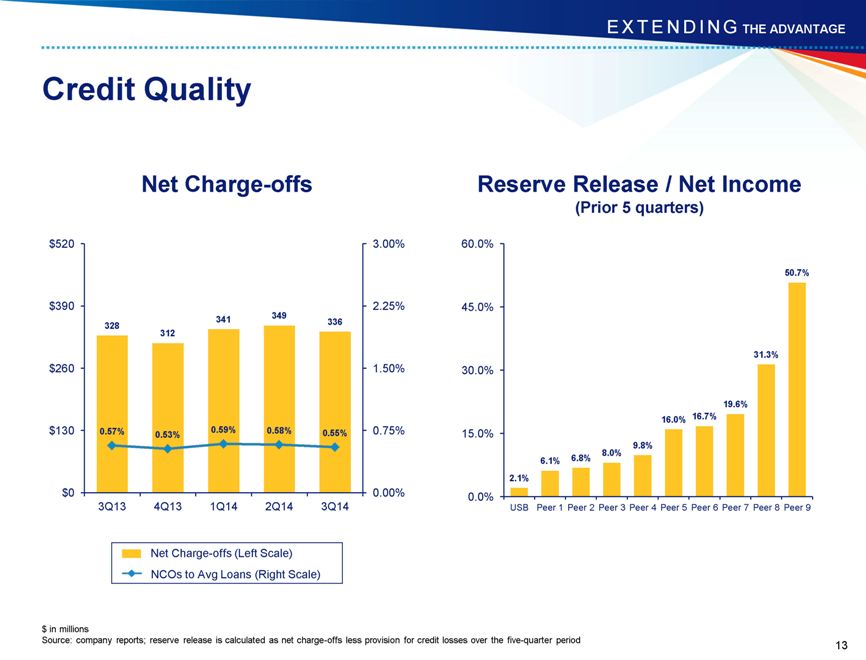
Credit Quality
Net Charge-offs
$520 3.00%
$390 2.25%
341 349 336
328
312
$260 1.50%
$130 0.57% 0.53% 0.59% 0.58% 0.55% 0.75%
$0 0.00%
3Q13 4Q13 1Q14 2Q14 3Q14
Net Charge-offs (Left Scale) NCOs to Avg Loans (Right Scale)
Reserve Release / Net Income
(Prior 5 quarters)
60.0%
50.7%
45.0%
31.3%
30.0%
19.6%
16.0% 16.7%
15.0%
9.8%
8.0%
6.1% 6.8%
2.1%
0.0%
USB Peer 1 Peer 2 Peer 3 Peer 4 Peer 5 Peer 6 Peer 7 Peer 8 Peer 9
$ in millions
Source: company reports; reserve release is calculated as net charge-offs less provision for credit losses over the five-quarter period
13
|
|
EXTENDING THE ADVANTAGE
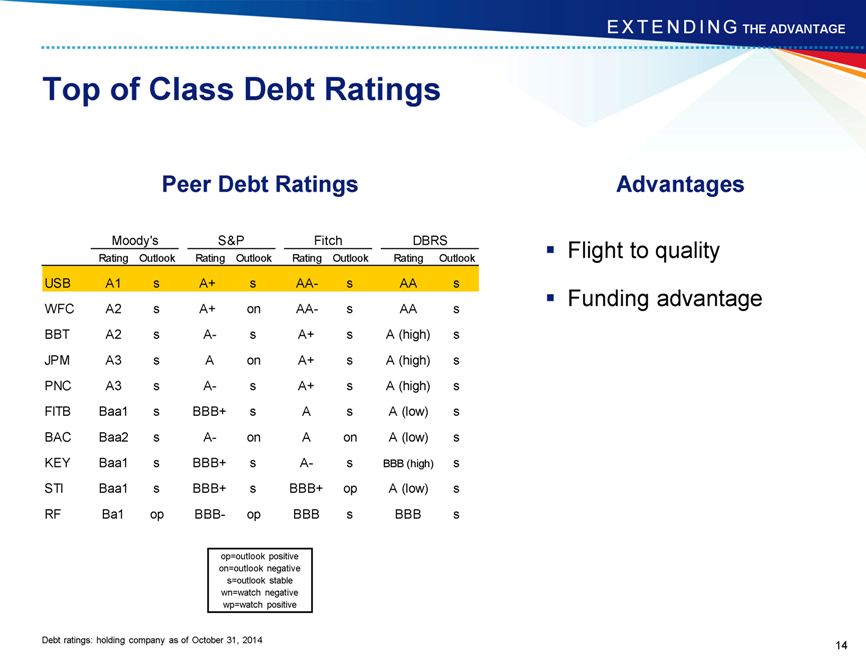
Top of Class Debt Ratings
Peer Debt Ratings
Moody’s S&P Fitch DBRS
Rating Outlook Rating Outlook Rating Outlook Rating Outlook
USB A1 s A+ s AA- s AA s
WFC A2 s A+ on AA- s AA s
BBT A2 s A- s A+ s A (high) s
JPM A3 s A on A+ s A (high) s
PNC A3 s A- s A+ s A (high) s
FITB Baa1 s BBB+ s A s A (low) s
BAC Baa2 s A- on A on A (low) s
KEY Baa1 s BBB+ s A- s BBB (high) s
STI Baa1 s BBB+ s BBB+ op A (low) s
RF Ba1 op BBB- op BBB s BBB s
op=outlook positive
on=outlook negative
s=outlook stable
wn=watch negative
wp=watch positive
Debt ratings: holding company as of October 31, 2014
Advantages
Flight to quality
Funding advantage
14
|
|
EXTENDING THE ADVANTAGE
Agenda
Overview
Financial Management
Capital Management
Deposit Growth
4Q14 Update
Long-term Goals
15
|
|
EXTENDING THE ADVANTAGE
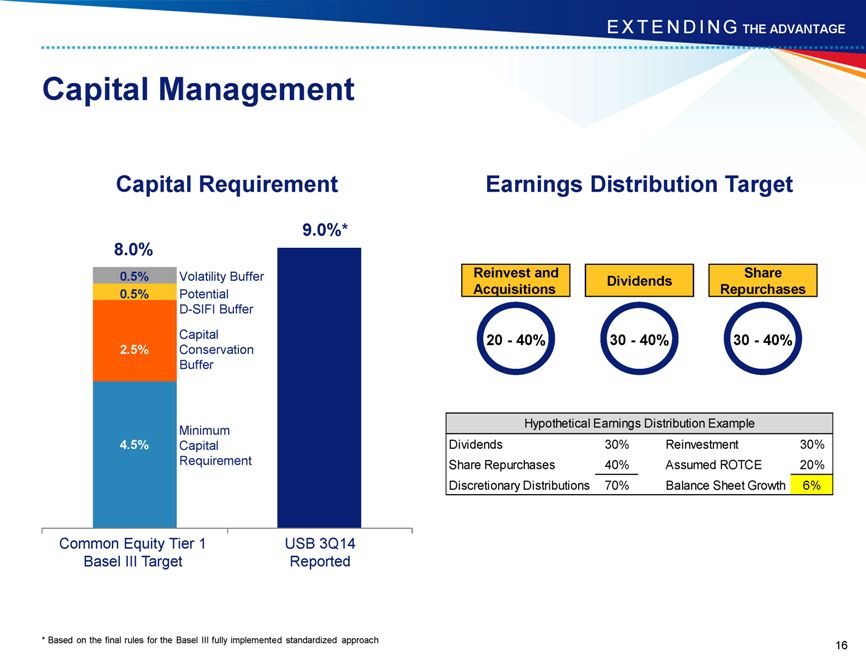
Capital Management
Capital Requirement
9.0%*
8.0%
0.5% Volatility Buffer
0.5% Potential
D-SIFI Buffer
Capital
2.5% Conservation
Buffer
Minimum
4.5% Capital
Requirement
Common Equity Tier 1 USB 3Q14
Basel III Target Reported
Earnings Distribution Target
Reinvest and Share
Dividends
Acquisitions Repurchases
20—40% 30—40% 30—40%
Hypothetical Earnings Distribution Example
Dividends 30% Reinvestment 30%
Share Repurchases 40% Assumed ROTCE 20%
Discretionary Distributions 70% Balance Sheet Growth 6%
| * |
|
Based on the final rules for the Basel III fully implemented standardized approach |
16
|
|
EXTENDING THE ADVANTAGE
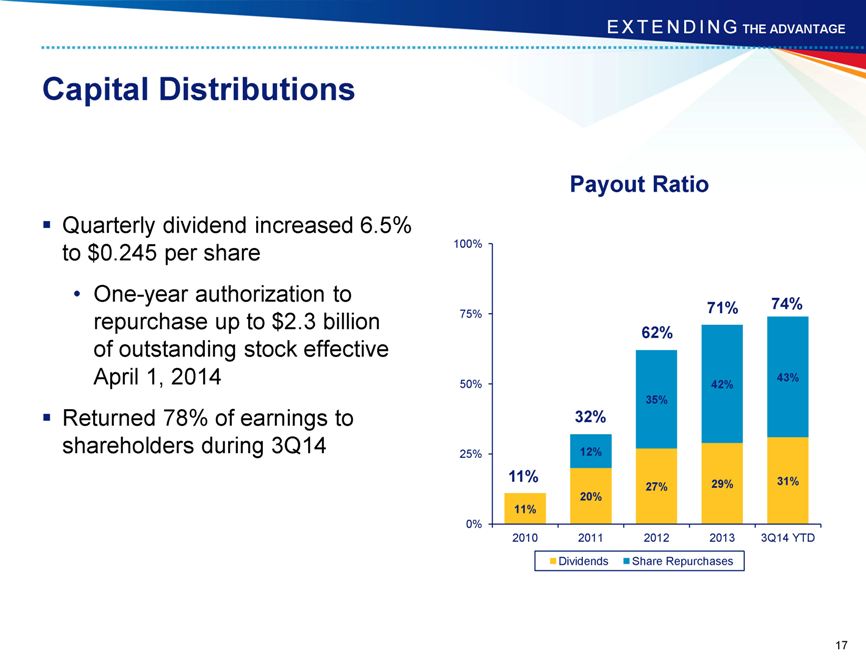
Capital Distributions
Quarterly dividend increased 6.5% to $0.245 per share
One-year authorization to repurchase up to $2.3 billion of outstanding stock effective April 1, 2014 Returned 78% of earnings to shareholders during 3Q14
Payout Ratio
100%
75% 71% 74%
62%
50% 42% 43%
35%
32%
25% 12%
11% 27% 29% 31%
20%
11%
0%
2010 2011 2012 2013 3Q14 YTD
Dividends Share Repurchases
17
|
|
EXTENDING THE ADVANTAGE
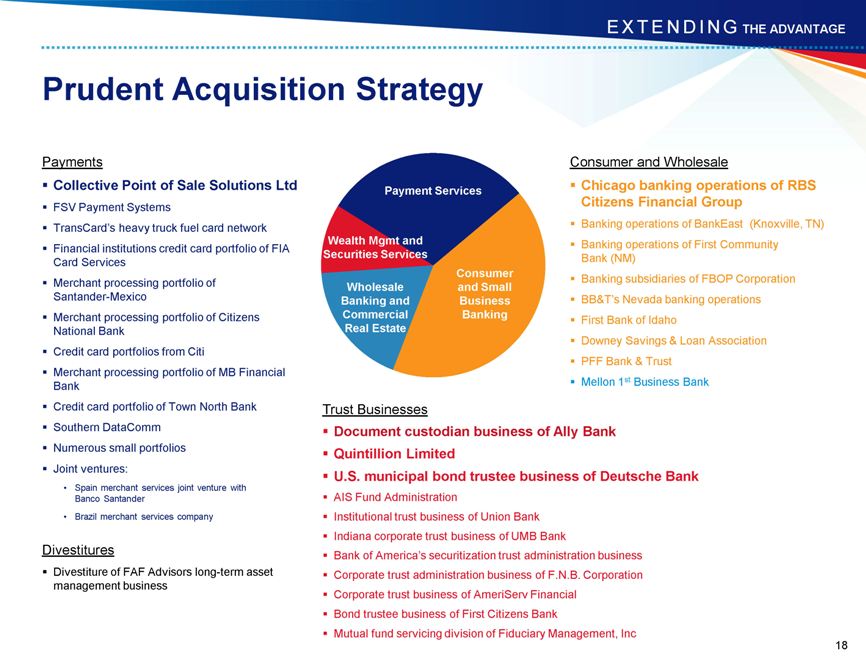
Prudent Acquisition Strategy
Payments
Collective Point of Sale Solutions Ltd
FSV Payment Systems
TransCard’s heavy truck fuel card network
Financial institutions credit card portfolio of FIA
Card Services
Merchant processing portfolio of Santander-Mexico
Merchant processing portfolio of Citizens
National Bank
Credit card portfolios from Citi
Merchant processing portfolio of MB Financial Bank Credit card portfolio of Town North Bank Southern DataComm Numerous small portfolios
Joint ventures:
Spain merchant services joint venture with Banco Santander
Brazil merchant services company
Divestitures
Divestiture of FAF Advisors long-term asset management business
Payment Services
Wealth Mgmt and
Securities Services
Consumer
Wholesale and Small
Banking and Business
Commercial Banking
Real Estate
Consumer and Wholesale
Chicago banking operations of RBS Citizens Financial Group
Banking operations of BankEast (Knoxville, TN) Banking operations of First Community
Bank (NM)
Banking subsidiaries of FBOP Corporation
BB&T’s Nevada banking operations
First Bank of Idaho
Downey Savings & Loan Association PFF Bank & Trust Mellon 1st Business Bank
Trust Businesses
Document custodian business of Ally Bank Quintillion Limited
U.S. municipal bond trustee business of Deutsche Bank
AIS Fund Administration
Institutional trust business of Union Bank
Indiana corporate trust business of UMB Bank
Bank of America’s securitization trust administration business
Corporate trust administration business of F.N.B. Corporation Corporate trust business of AmeriServ Financial Bond trustee business of First Citizens Bank
Mutual fund servicing division of Fiduciary Management, Inc
18
|
|
EXTENDING THE ADVANTAGE
Agenda
Overview
Financial Management
Capital Management Deposit Growth
4Q14 Update
Long-term Goals
19
|
|
EXTENDING THE ADVANTAGE
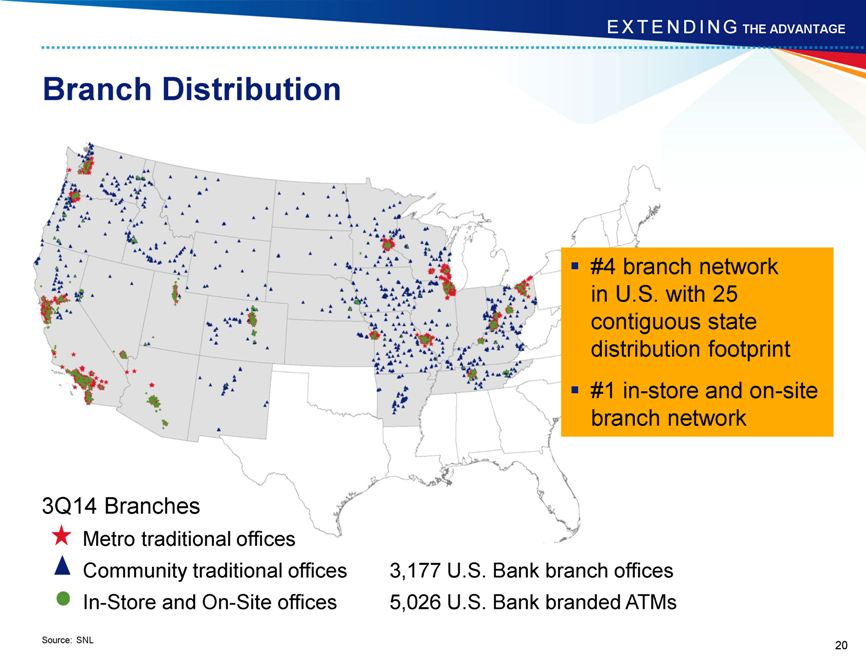
Branch Distribution
#4 branch network in U.S. with 25 contiguous state distribution footprint
#1 in-store and on-site branch network
3Q14 Branches
Metro traditional offices
Community traditional offices
In-Store and On-Site offices
3,177 U.S. Bank branch offices
5,026 U.S. Bank branded ATMs
Source: SNL
20
|
|
EXTENDING THE ADVANTAGE
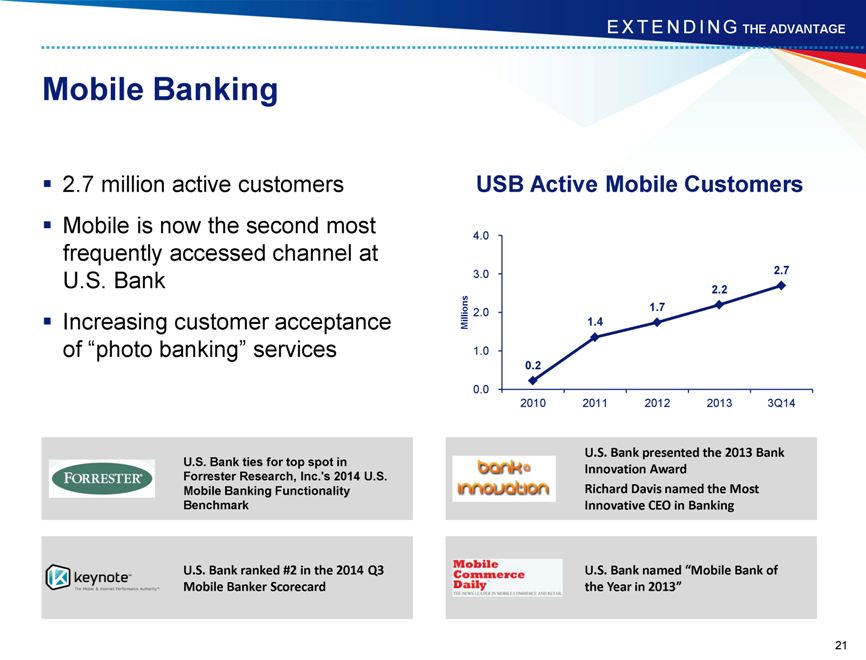
Mobile Banking
2.7 million active customers
Mobile is now the second most frequently accessed channel at U.S. Bank
Increasing customer acceptance of “photo banking” services
USB Active Mobile Customers
4.0
3.0 2.7
2.2
2.0 1.7
Millions 1.4
1.0
0.2
0.0
2010 2011 2012 2013 3Q14
U.S. Bank ties for top spot in Forrester Research, Inc.‘s 2014 U.S. Mobile Banking Functionality Benchmark
U.S. Bank ranked #2 in the 2014 Q3
Mobile Banker Scorecard
U.S. Bank presented the 2013 Bank
Innovation Award
Richard Davis named the Most Innovative CEO in Banking
U.S. Bank named “Mobile Bank of the Year in 2013”
21
|
|
EXTENDING THE ADVANTAGE
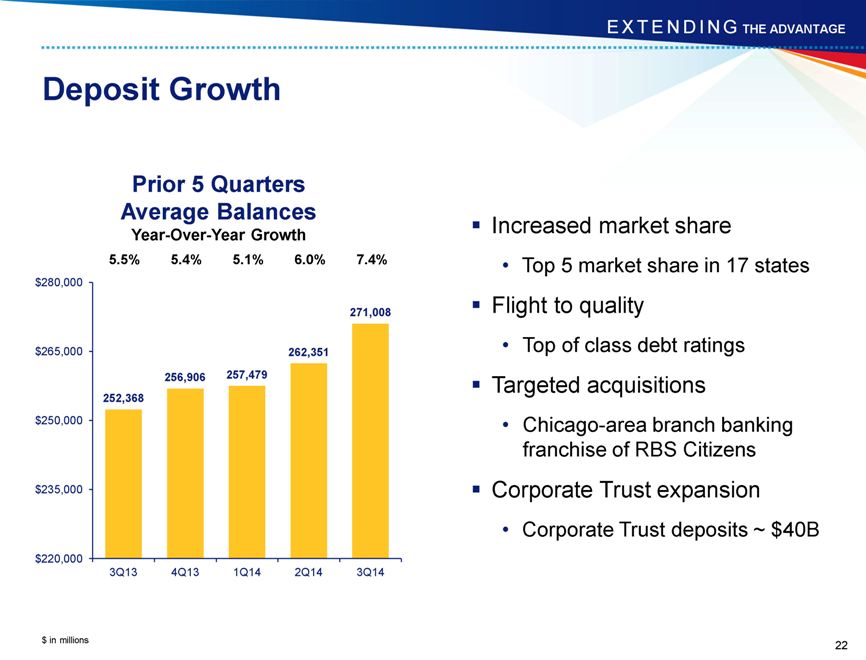
Deposit Growth
Prior 5 Quarters
Average Balances
Year-Over-Year Growth
5.5% 5.4% 5.1% 6.0% 7.4%
$280,000
271,008
$265,000 262,351
256,906 257,479
252,368
$250,000
$235,000
$220,000
3Q13 4Q13 1Q14 2Q14 3Q14
$ in millions
Increased market share
Top 5 market share in 17 states
Flight to quality
Top of class debt ratings
Targeted acquisitions
Chicago-area branch banking franchise of RBS Citizens
Corporate Trust expansion
Corporate Trust deposits ~ $40B
22
|
|
EXTENDING THE ADVANTAGE
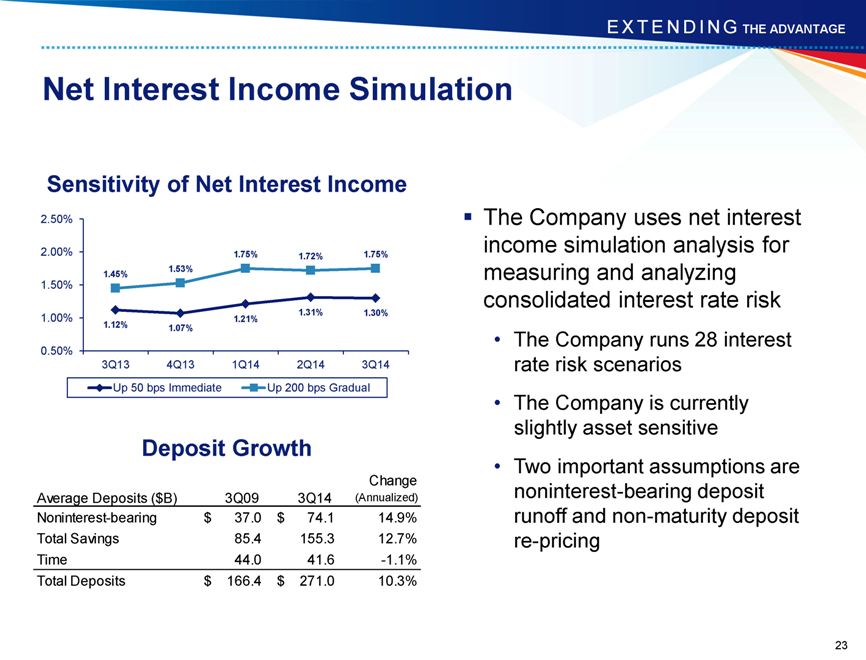
Net Interest Income Simulation
Sensitivity of Net Interest Income
2.50%
2.00% 1.75% 1.72% 1.75%
1.45% 1.53%
1.50%
1.00% 1.21% 1.31% 1.30%
1.12% 1.07%
0.50%
3Q13 4Q13 1Q14 2Q14 3Q14
Up 50 bps Immediate Up 200 bps Gradual
Deposit Growth
Change
Average Deposits ($ B) 3Q09 3Q14 (Annualized)
Noninterest-bearing $ 37.0 $ 74.1 14.9%
Total Savings 85.4 155.3 12.7%
Time 44.0 41.6 -1.1%
Total Deposits $ 166.4 $ 271.0 10.3%
The Company uses net interest income simulation analysis for measuring and analyzing consolidated interest rate risk
The Company runs 28 interest rate risk scenarios
The Company is currently slightly asset sensitive
Two important assumptions are noninterest-bearing deposit runoff and non-maturity deposit re-pricing
23
|
|
EXTENDING THE ADVANTAGE
Agenda
Overview
Financial Management
Capital Management
Deposit Growth
4Q14 Update
Long-term Goals
24
|
|
EXTENDING THE ADVANTAGE
4Q14 Update
Business Climate
Loan Growth Net
Interest Margin
Credit Quality
Noninterest Income / Expense
25
|
|
EXTENDING THE ADVANTAGE
Agenda
Overview
Financial Management
Capital Management
Deposit Growth
4Q14 Update
Long-term Goals
26
|
|
EXTENDING THE ADVANTAGE
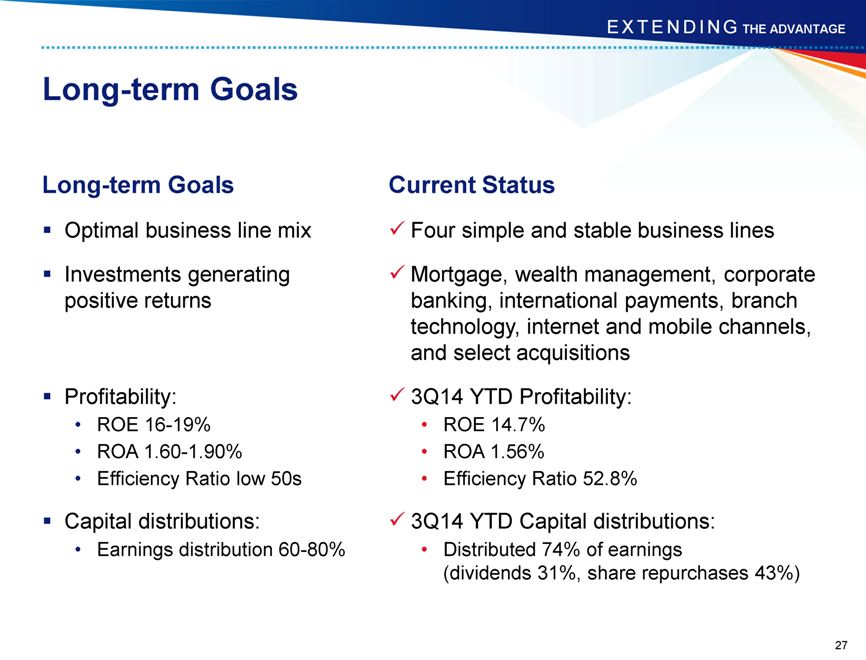
Long-term Goals
Long-term Goals
Optimal business line mix
Investments generating positive returns
Profitability:
ROE 16-19%
ROA 1.60-1.90%
Efficiency Ratio low 50s
Capital distributions:
Earnings distribution 60-80%
Current Status
Four simple and stable business lines
Mortgage, wealth management, corporate banking, international payments, branch technology, internet and mobile channels, and select acquisitions
3Q14 YTD Profitability:
ROE 14.7%
ROA 1.56%
Efficiency Ratio 52.8%
3Q14 YTD Capital distributions:
Distributed 74% of earnings
(dividends 31%, share repurchases 43%)
27
|
|
EXTENDING THE ADVANTAGE
Appendix
28
|
|
EXTENDING THE ADVANTAGE
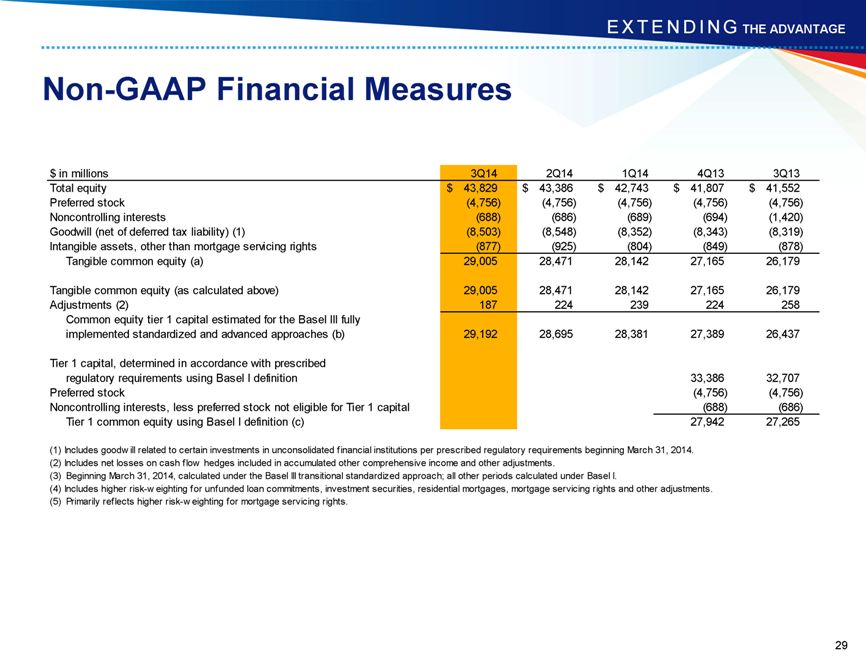
Non-GAAP Financial Measures
$ in millions 3Q14 2Q14 1Q14 4Q13 3Q13
Total equity $ 43,829 $ 43,386 $ 42,743 $ 41,807 $ 41,552
Preferred stock (4,756) (4,756) (4,756) (4,756) (4,756)
Noncontrolling interests (688) (686) (689) (694) (1,420)
Goodwill (net of deferred tax liability) (1) (8,503) (8,548) (8,352) (8,343) (8,319)
Intangible assets, other than mortgage servicing rights (877) (925) (804) (849) (878)
Tangible common equity (a) 29,005 28,471 28,142 27,165 26,179
Tangible common equity (as calculated above) 29,005 28,471 28,142 27,165 26,179
Adjustments (2) 187 224 239 224 258
Common equity tier 1 capital estimated for the Basel III fully
implemented standardized and advanced approaches (b) 29,192 28,695 28,381 27,389 26,437
Tier 1 capital, determined in accordance with prescribed
regulatory requirements using Basel I definition 33,386 32,707
Preferred stock (4,756) (4,756)
Noncontrolling interests, less preferred stock not eligible for Tier 1 capital (688) (686)
Tier 1 common equity using Basel I definition (c) 27,942 27,265
(1) Includes goodw ill related to certain investments in unconsolidated financial institutions per prescribed regulatory requirements beginning March 31, 2014.
| (2) |
|
Includes net losses on cash flow hedges included in accumulated other comprehensive income and other adjustments. |
(3) Beginning March 31, 2014, calculated under the Basel III transitional standardized approach; all other periods calculated under Basel I.
(4) Includes higher risk-w eighting for unfunded loan commitments, investment securities, residential mortgages, mortgage servicing rights and other adjustments.
| (5) |
|
Primarily reflects higher risk-w eighting for mortgage servicing rights. |
29
|
|
EXTENDING THE ADVANTAGE
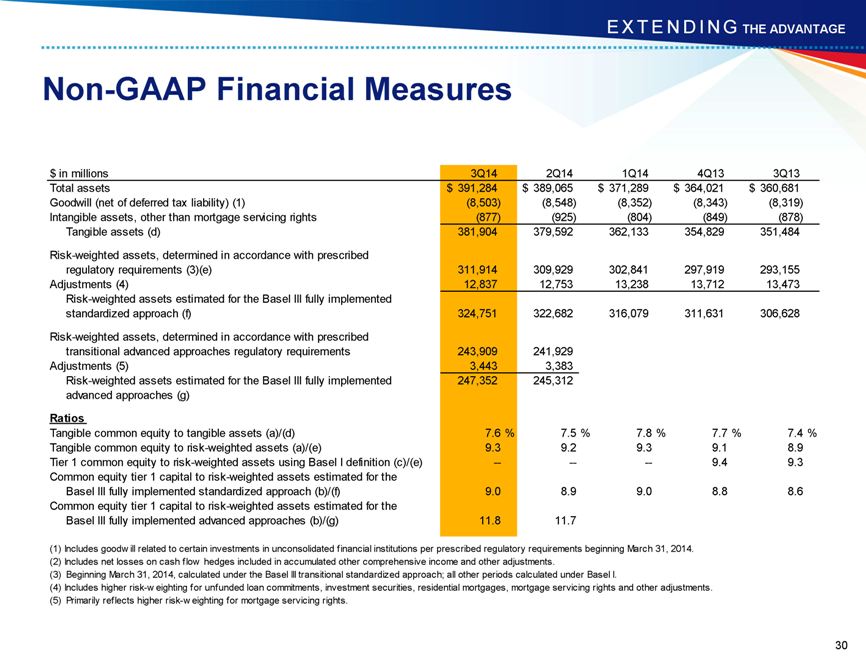
Non-GAAP Financial Measures
$ in millions 3Q14 2Q14 1Q14 4Q13 3Q13
Total assets $ 391,284 $ 389,065 $ 371,289 $ 364,021 $ 360,681
Goodwill (net of deferred tax liability) (1) (8,503) (8,548) (8,352) (8,343) (8,319)
Intangible assets, other than mortgage servicing rights (877) (925) (804) (849) (878)
Tangible assets (d) 381,904 379,592 362,133 354,829 351,484
Risk-weighted assets, determined in accordance with prescribed
regulatory requirements (3)(e) 311,914 309,929 302,841 297,919 293,155
Adjustments (4) 12,837 12,753 13,238 13,712 13,473
Risk-weighted assets estimated for the Basel III fully implemented
standardized approach (f) 324,751 322,682 316,079 311,631 306,628
Risk-weighted assets, determined in accordance with prescribed
transitional advanced approaches regulatory requirements 243,909 241,929
Adjustments (5) 3,443 3,383
Risk-weighted assets estimated for the Basel III fully implemented 247,352 245,312
advanced approaches (g)
Ratios
Tangible common equity to tangible assets (a)/(d) 7.6 % 7.5 % 7.8 % 7.7 % 7.4 %
Tangible common equity to risk-weighted assets (a)/(e) 9.3 9.2 9.3 9.1 8.9
Tier 1 common equity to risk-weighted assets using Basel I definition (c)/(e) — — — 9.4 9.3
Common equity tier 1 capital to risk-weighted assets estimated for the
Basel III fully implemented standardized approach (b)/(f) 9.0 8.9 9.0 8.8 8.6
Common equity tier 1 capital to risk-weighted assets estimated for the
Basel III fully implemented advanced approaches (b)/(g) 11.8 11.7
(1) Includes goodw ill related to certain investments in unconsolidated financial institutions per prescribed regulatory requirements beginning March 31, 2014. (2) Includes net losses on cash flow hedges included in accumulated other comprehensive income and other adjustments.
(3) Beginning March 31, 2014, calculated under the Basel III transitional standardized approach; all other periods calculated under Basel I.
(4) Includes higher risk-w eighting for unfunded loan commitments, investment securities, residential mortgages, mortgage servicing rights and other adjustments. (5) Primarily reflects higher risk-w eighting for mortgage servicing rights.
30
|
|
EXTENDING THE ADVANTAGE
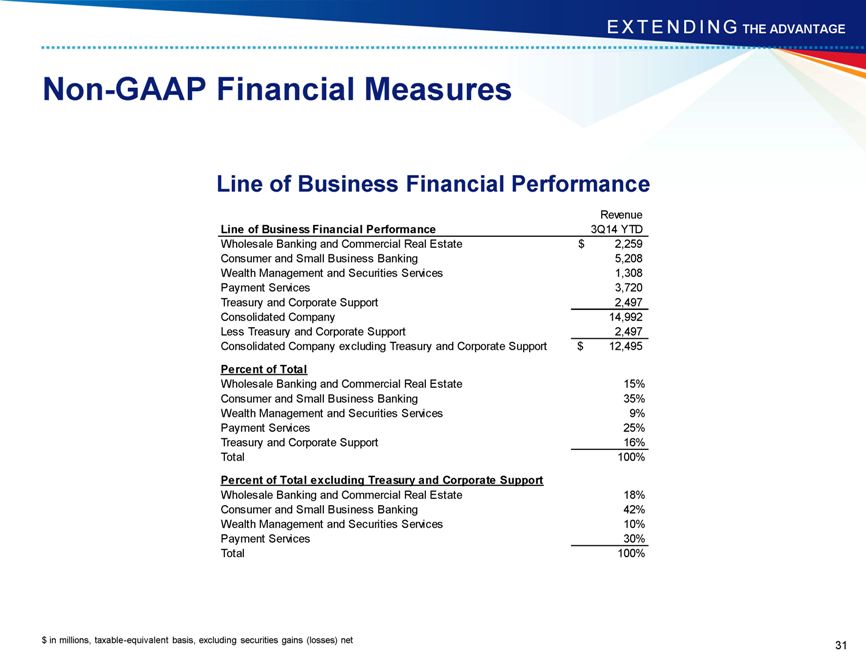
Non-GAAP Financial Measures
Line of Business Financial Performance
Revenue
Line of Business Financial Performance 3Q14 YTD
Wholesale Banking and Commercial Real Estate $ 2,259
Consumer and Small Business Banking 5,208
Wealth Management and Securities Services 1,308
Payment Services 3,720
Treasury and Corporate Support 2,497
Consolidated Company 14,992
Less Treasury and Corporate Support 2,497
Consolidated Company excluding Treasury and Corporate Support $ 12,495
Percent of Total
Wholesale Banking and Commercial Real Estate 15%
Consumer and Small Business Banking 35%
Wealth Management and Securities Services 9%
Payment Services 25%
Treasury and Corporate Support 16%
Total 100%
Percent of Total excluding Treasury and Corporate Support
Wholesale Banking and Commercial Real Estate 18%
Consumer and Small Business Banking 42%
Wealth Management and Securities Services 10%
Payment Services 30%
Total 100%
$ in millions, taxable-equivalent basis, excluding securities gains (losses) net
31
|
|
BancAnalysts Association of Boston Conference
EXTENDING THE ADVANTAGE
November 6, 2014
32